michigan schools accountability · pdf filean easy way to see a school’s or...
TRANSCRIPT
2014Michigan SchoolsAccountability
Scorecards
Michigan Schools Accountability Scorecard
2
Table of ContentsOverview . . . . . . . . . . . . . . . . . . . . . . . . . . . . . . . . . . . . . . . . . . . . . . . . . . . . . . . . . . . . . . . . . . . . . . . 3What’s New/Important Deadlines . . . . . . . . . . . . . . . . . . . . . . . . . . . . . . . . . . . . . . . . . . . . . . . . . . 3Scorecard Colors and Points System . . . . . . . . . . . . . . . . . . . . . . . . . . . . . . . . . . . . . . . . . . . . . . . . 4Audit Checks . . . . . . . . . . . . . . . . . . . . . . . . . . . . . . . . . . . . . . . . . . . . . . . . . . . . . . . . . . . . . . . . . . . 6Scorecard Subgroups . . . . . . . . . . . . . . . . . . . . . . . . . . . . . . . . . . . . . . . . . . . . . . . . . . . . . . . . . . . . 8Scorecard Components . . . . . . . . . . . . . . . . . . . . . . . . . . . . . . . . . . . . . . . . . . . . . . . . . . . . . . . . . . 9Participation . . . . . . . . . . . . . . . . . . . . . . . . . . . . . . . . . . . . . . . . . . . . . . . . . . . . . . . . . . . . . . . . . . . . 9Expulsions/Suspensions . . . . . . . . . . . . . . . . . . . . . . . . . . . . . . . . . . . . . . . . . . . . . . . . . . . . . . . . . . 10Prohibited Behavior . . . . . . . . . . . . . . . . . . . . . . . . . . . . . . . . . . . . . . . . . . . . . . . . . . . . . . . . . . . . . 10Nonstandard Accommodations . . . . . . . . . . . . . . . . . . . . . . . . . . . . . . . . . . . . . . . . . . . . . . . . . . 11Assessments for Ungraded Students . . . . . . . . . . . . . . . . . . . . . . . . . . . . . . . . . . . . . . . . . . . . . . . 11Participation Colors . . . . . . . . . . . . . . . . . . . . . . . . . . . . . . . . . . . . . . . . . . . . . . . . . . . . . . . . . . . . . 12Participation in Small Schools . . . . . . . . . . . . . . . . . . . . . . . . . . . . . . . . . . . . . . . . . . . . . . . . . . . . . 12Multi-year Participation Averages . . . . . . . . . . . . . . . . . . . . . . . . . . . . . . . . . . . . . . . . . . . . . . . . . 12Participation Rounding . . . . . . . . . . . . . . . . . . . . . . . . . . . . . . . . . . . . . . . . . . . . . . . . . . . . . . . . . . 12Proficiency . . . . . . . . . . . . . . . . . . . . . . . . . . . . . . . . . . . . . . . . . . . . . . . . . . . . . . . . . . . . . . . . . . . . 12Full Academic Year . . . . . . . . . . . . . . . . . . . . . . . . . . . . . . . . . . . . . . . . . . . . . . . . . . . . . . . . . . . . . 13Differentiated Targets . . . . . . . . . . . . . . . . . . . . . . . . . . . . . . . . . . . . . . . . . . . . . . . . . . . . . . . . . . . 13Provisional Proficient . . . . . . . . . . . . . . . . . . . . . . . . . . . . . . . . . . . . . . . . . . . . . . . . . . . . . . . . . . . . 14Growth Proficient . . . . . . . . . . . . . . . . . . . . . . . . . . . . . . . . . . . . . . . . . . . . . . . . . . . . . . . . . . . . . . . 15Multiple-year Averaging . . . . . . . . . . . . . . . . . . . . . . . . . . . . . . . . . . . . . . . . . . . . . . . . . . . . . . . . . 19Safe Harbor . . . . . . . . . . . . . . . . . . . . . . . . . . . . . . . . . . . . . . . . . . . . . . . . . . . . . . . . . . . . . . . . . . . . 19MI-Access Proficiency Cap . . . . . . . . . . . . . . . . . . . . . . . . . . . . . . . . . . . . . . . . . . . . . . . . . . . . . . . 20MEAP-Access Proficiency Cap . . . . . . . . . . . . . . . . . . . . . . . . . . . . . . . . . . . . . . . . . . . . . . . . . . . . 21Small Schools . . . . . . . . . . . . . . . . . . . . . . . . . . . . . . . . . . . . . . . . . . . . . . . . . . . . . . . . . . . . . . . . . . 22Proficiency Colors and Points . . . . . . . . . . . . . . . . . . . . . . . . . . . . . . . . . . . . . . . . . . . . . . . . . . . . . 23Attendance . . . . . . . . . . . . . . . . . . . . . . . . . . . . . . . . . . . . . . . . . . . . . . . . . . . . . . . . . . . . . . . . . . . 23Attendance Colors and Points . . . . . . . . . . . . . . . . . . . . . . . . . . . . . . . . . . . . . . . . . . . . . . . . . . . . 24Graduation . . . . . . . . . . . . . . . . . . . . . . . . . . . . . . . . . . . . . . . . . . . . . . . . . . . . . . . . . . . . . . . . . . . . 24Graduation Colors and Points . . . . . . . . . . . . . . . . . . . . . . . . . . . . . . . . . . . . . . . . . . . . . . . . . . . . 25Educator Evaluations . . . . . . . . . . . . . . . . . . . . . . . . . . . . . . . . . . . . . . . . . . . . . . . . . . . . . . . . . . . . 25Educator Evaluations Colors and Points . . . . . . . . . . . . . . . . . . . . . . . . . . . . . . . . . . . . . . . . . . . . 25Compliance Factors . . . . . . . . . . . . . . . . . . . . . . . . . . . . . . . . . . . . . . . . . . . . . . . . . . . . . . . . . . . . 26Compliance Factors Colors and Points . . . . . . . . . . . . . . . . . . . . . . . . . . . . . . . . . . . . . . . . . . . . . 26Appeals . . . . . . . . . . . . . . . . . . . . . . . . . . . . . . . . . . . . . . . . . . . . . . . . . . . . . . . . . . . . . . . . . . . . . . . 26Scorecard Access . . . . . . . . . . . . . . . . . . . . . . . . . . . . . . . . . . . . . . . . . . . . . . . . . . . . . . . . . . . . . . 28Contact Us . . . . . . . . . . . . . . . . . . . . . . . . . . . . . . . . . . . . . . . . . . . . . . . . . . . . . . . . . . . . . . . . . . . . 32
Michigan Schools Accountability Scorecard
3
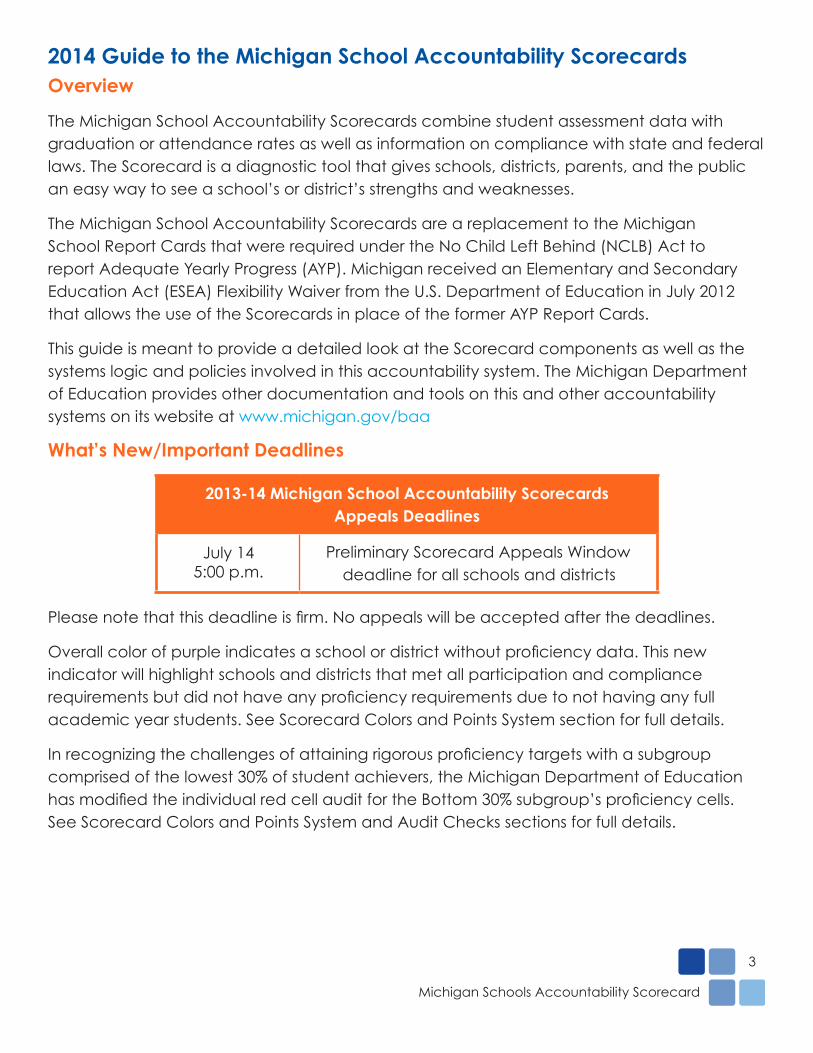
2014 Guide to the Michigan School Accountability ScorecardsOverview
The Michigan School Accountability Scorecards combine student assessment data with graduation or attendance rates as well as information on compliance with state and federal laws. The Scorecard is a diagnostic tool that gives schools, districts, parents, and the public an easy way to see a school’s or district’s strengths and weaknesses.
The Michigan School Accountability Scorecards are a replacement to the Michigan School Report Cards that were required under the No Child Left Behind (NCLB) Act to report Adequate Yearly Progress (AYP). Michigan received an Elementary and Secondary Education Act (ESEA) Flexibility Waiver from the U.S. Department of Education in July 2012 that allows the use of the Scorecards in place of the former AYP Report Cards.
This guide is meant to provide a detailed look at the Scorecard components as well as the systems logic and policies involved in this accountability system. The Michigan Department of Education provides other documentation and tools on this and other accountability systems on its website at www.michigan.gov/baa
What’s New/Important Deadlines
2013-14 Michigan School Accountability Scorecards Appeals Deadlines
July 145:00 p.m.
Preliminary Scorecard Appeals Windowdeadline for all schools and districts
Overall color of purple indicates a school or district without prindicator will highlight schools and districts that met all participation and compliance
academic year students. See Scorecard Colors and Points System section for full details.
comprised of the lowest 30% of student achievers, the Michigan Department of Education
See Scorecard Colors and Points System and Audit Checks sections for full details.
Michigan Schools Accountability Scorecard
4
Scorecard Colors and Points System
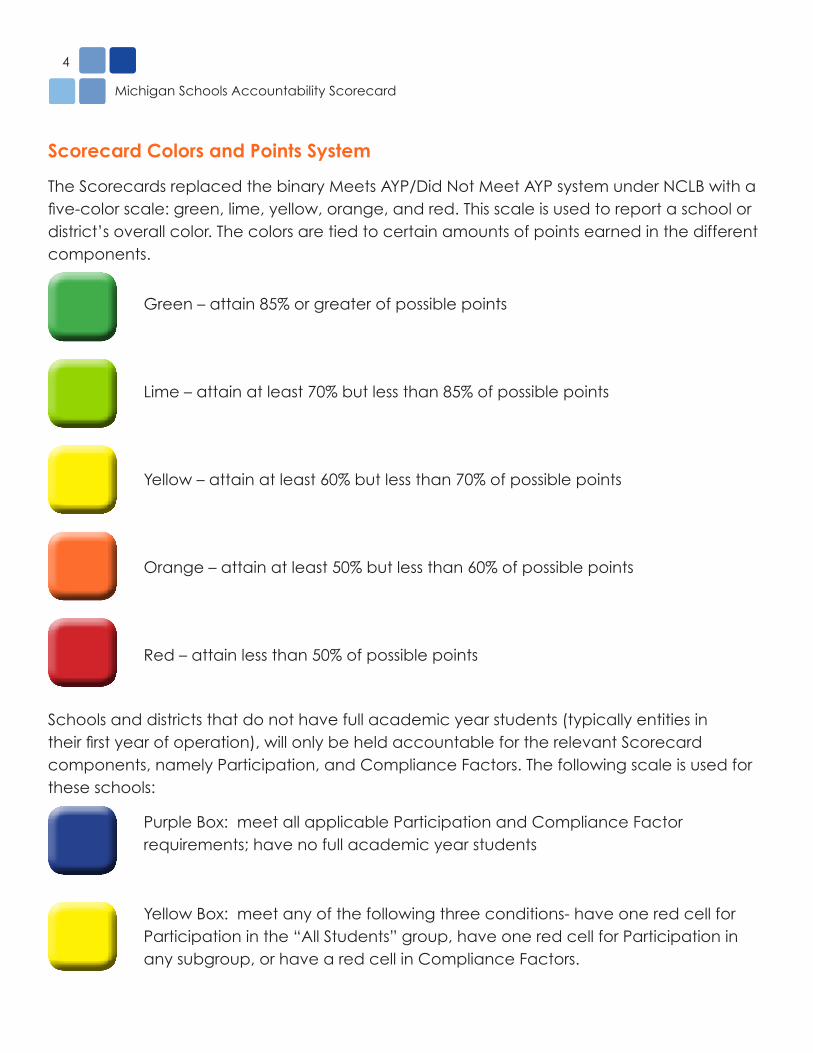
The Scorecards replaced the binary Meets AYP/Did Not Meet AYP system under NCLB with a five-color scale: green, lime, yellow, orange, and red. This scale is used to report a school or district’s overall color . The colors are tied to certain amounts of points earned in the different components .
Green – attain 85% or greater of possible points
Lime – attain at least 70% but less than 85% of possible points
Yellow – attain at least 60% but less than 70% of possible points
Orange – attain at least 50% but less than 60% of possible points
Red – attain less than 50% of possible points
Schools and districts that do not have full academic year students (typically entities in their first year of operation), will only be held accountable for the relevant Scorecard components, namely Participation, and Compliance Factors . The following scale is used for these schools:
Purple Box: meet all applicable Participation and Compliance Factor requirements; have no full academic year students
Yellow Box: meet any of the following three conditions- have one red cell for Participation in the “All Students” group, have one red cell for Participation in any subgroup, or have a red cell in Compliance Factors .
Michigan Schools Accountability Scorecard
Michigan Schools Accountability Scorecard
5
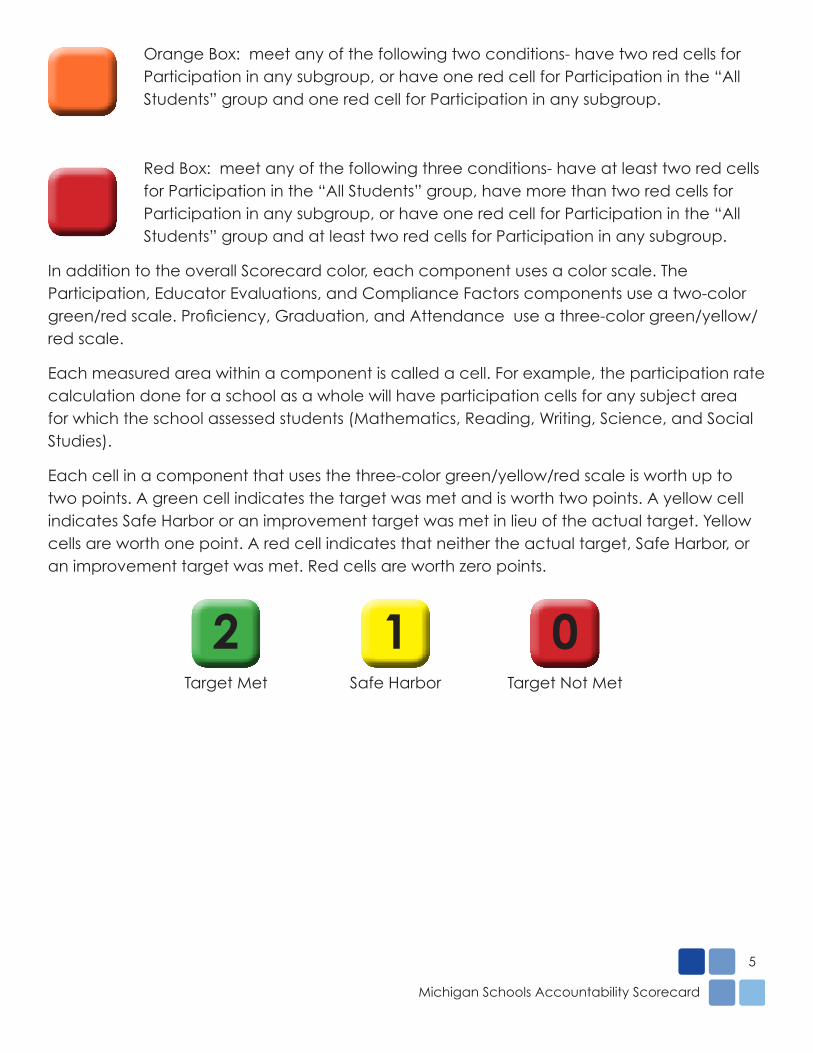
Orange Box: meet any of the following two conditions- have two red cells for Participation in any subgroup, or have one red cell for Participation in the “All Students” group and one red cell for Participation in any subgroup .
Red Box: meet any of the following three conditions- have at least two red cells for Participation in the “All Students” group, have more than two red cells for Participation in any subgroup, or have one red cell for Participation in the “All Students” group and at least two red cells for Participation in any subgroup .
In addition to the overall Scorecard color, each component uses a color scale . The Participation, Educator Evaluations, and Compliance Factors components use a two-color green/red scale. Proficiency, Graduation, and Attendance use a three-color green/yellow/red scale .
Each measured area within a component is called a cell . For example, the participation rate calculation done for a school as a whole will have participation cells for any subject area for which the school assessed students (Mathematics, Reading, Writing, Science, and Social Studies) .
Each cell in a component that uses the three-color green/yellow/red scale is worth up to two points . A green cell indicates the target was met and is worth two points . A yellow cell indicates Safe Harbor or an improvement target was met in lieu of the actual target . Yellow cells are worth one point . A red cell indicates that neither the actual target, Safe Harbor, or an improvement target was met . Red cells are worth zero points .
2 1 0Target Met Safe Harbor Target Not Met
Michigan Schools Accountability Scorecard
6
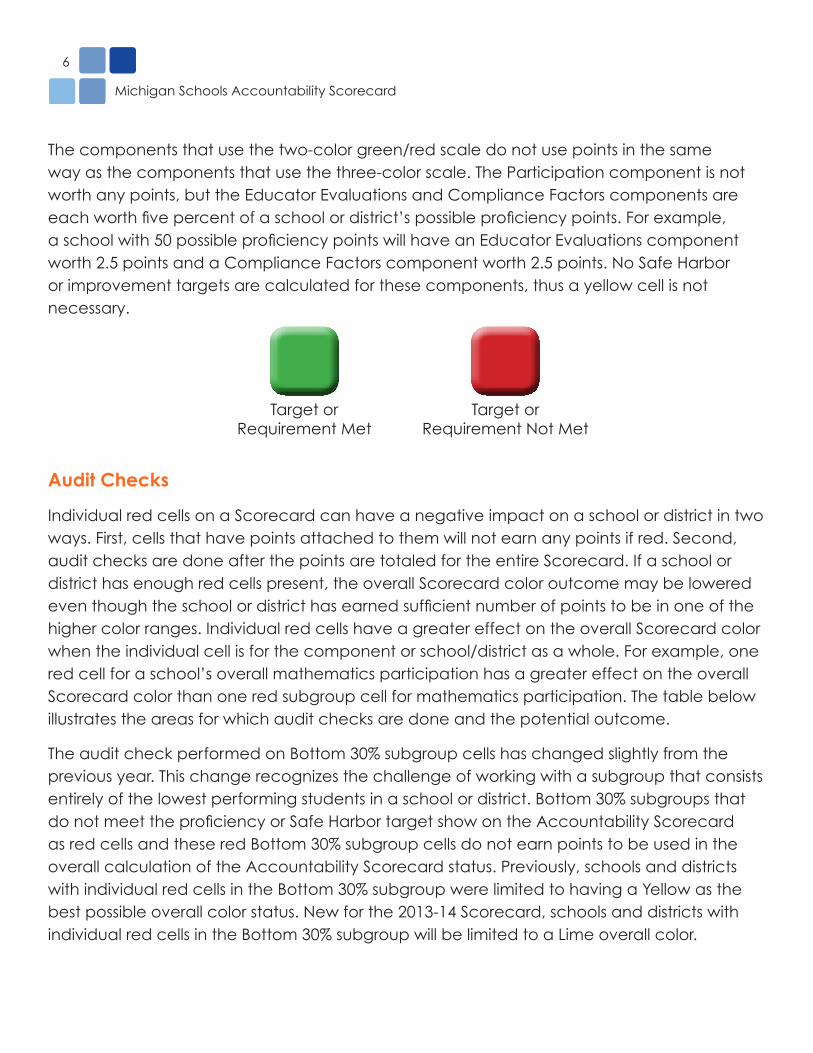
The components that use the two-color green/red scale do not use points in the same way as the components that use the three-color scale . The Participation component is not worth any points, but the Educator Evaluations and Compliance Factors components are each worth five percent of a school or district’s possible proficiency points. For example, a school with 50 possible proficiency points will have an Educator Evaluations component worth 2 .5 points and a Compliance Factors component worth 2 .5 points . No Safe Harbor or improvement targets are calculated for these components, thus a yellow cell is not necessary .
Audit Checks
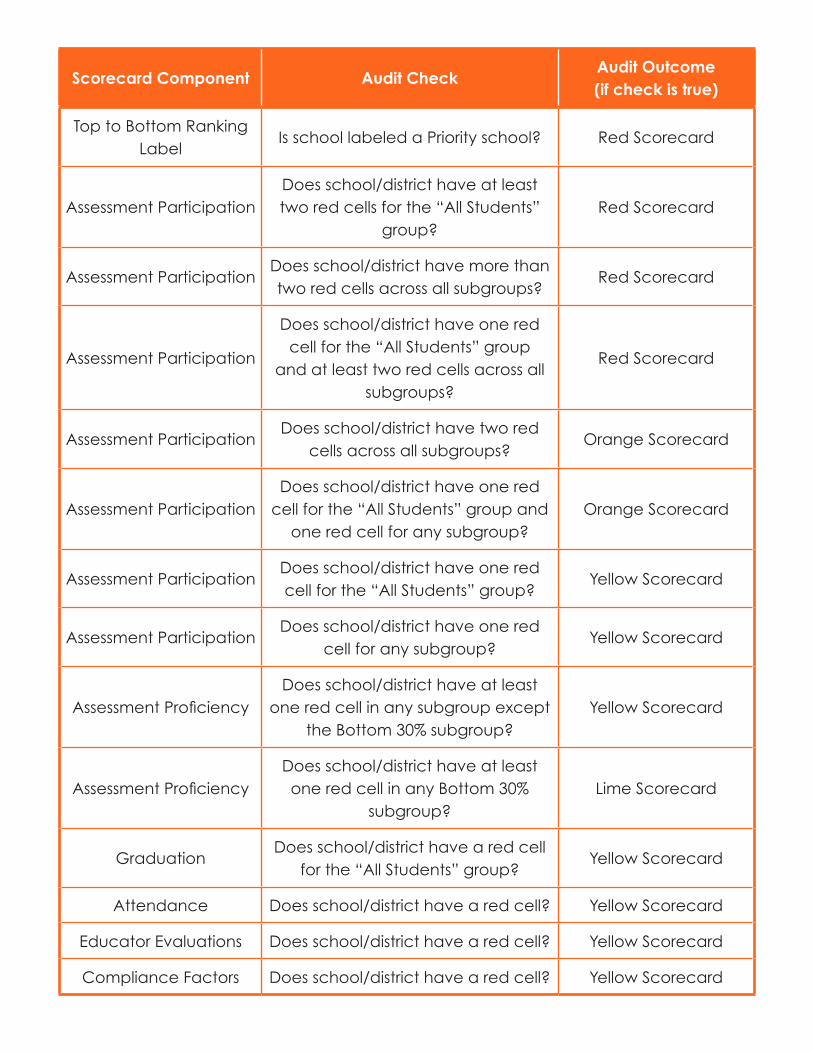
Individual red cells on a Scorecard can have a negative impact on a school or district in two ways . First, cells that have points attached to them will not earn any points if red . Second, audit checks are done after the points are totaled for the entire Scorecard . If a school or district has enough red cells present, the overall Scorecard color outcome may be lowered even though the school or district has earned sufficient number of points to be in one of the higher color ranges . Individual red cells have a greater effect on the overall Scorecard color when the individual cell is for the component or school/district as a whole . For example, one red cell for a school’s overall mathematics participation has a greater effect on the overall Scorecard color than one red subgroup cell for mathematics participation . The table below illustrates the areas for which audit checks are done and the potential outcome .
The audit check performed on Bottom 30% subgroup cells has changed slightly from the previous year . This change recognizes the challenge of working with a subgroup that consists entirely of the lowest performing students in a school or district . Bottom 30% subgroups that do not meet the proficiency or Safe Harbor target show on the Accountability Scorecard as red cells and these red Bottom 30% subgroup cells do not earn points to be used in the overall calculation of the Accountability Scorecard status . Previously, schools and districts with individual red cells in the Bottom 30% subgroup were limited to having a Yellow as the best possible overall color status . New for the 2013-14 Scorecard, schools and districts with individual red cells in the Bottom 30% subgroup will be limited to a Lime overall color .
Target or Requirement Met
Target or Requirement Not Met
Michigan Schools Accountability Scorecard
Michigan Schools Accountability Scorecard
7
Scorecard Component Audit CheckAudit Outcome (if check is true)
Top to Bottom Ranking Label
Is school labeled a Priority school? Red Scorecard
Assessment ParticipationDoes school/district have at least two red cells for the “All Students”
group?Red Scorecard
Assessment ParticipationDoes school/district have more than two red cells across all subgroups?
Red Scorecard
Assessment Participation
Does school/district have one red cell for the “All Students” group
and at least two red cells across all subgroups?
Red Scorecard
Assessment ParticipationDoes school/district have two red
cells across all subgroups?Orange Scorecard
Assessment ParticipationDoes school/district have one red
cell for the “All Students” group and one red cell for any subgroup?
Orange Scorecard
Assessment ParticipationDoes school/district have one red cell for the “All Students” group?
Yellow Scorecard
Assessment ParticipationDoes school/district have one red
cell for any subgroup?Yellow Scorecard
Assessment ProficiencyDoes school/district have at least
one red cell in any subgroup except the Bottom 30% subgroup?
Yellow Scorecard
Assessment ProficiencyDoes school/district have at least one red cell in any Bottom 30%
subgroup?Lime Scorecard
GraduationDoes school/district have a red cell
for the “All Students” group?Yellow Scorecard
Attendance Does school/district have a red cell? Yellow Scorecard
Educator Evaluations Does school/district have a red cell? Yellow Scorecard
Compliance Factors Does school/district have a red cell? Yellow Scorecard
Michigan Schools Accountability Scorecard
8
Scorecard Subgroups
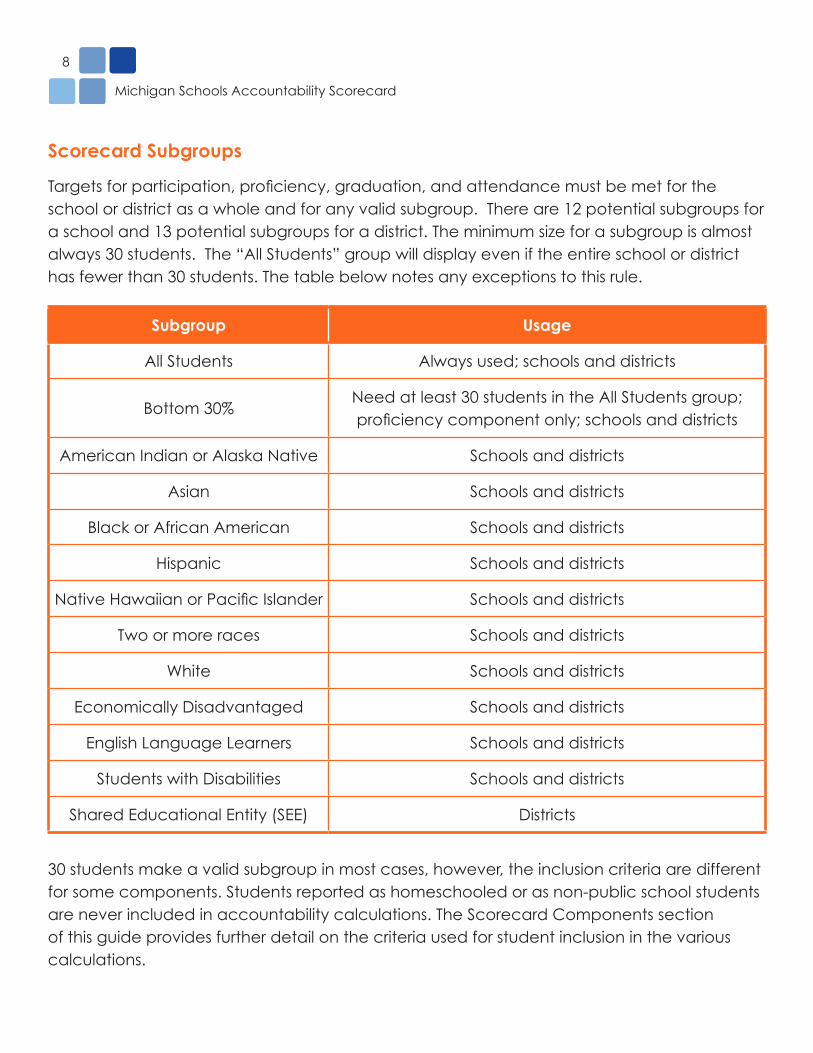
Targets for participation, proficiency, graduation, and attendance must be met for the school or district as a whole and for any valid subgroup . There are 12 potential subgroups for a school and 13 potential subgroups for a district . The minimum size for a subgroup is almost always 30 students . The “All Students” group will display even if the entire school or district has fewer than 30 students . The table below notes any exceptions to this rule .
Subgroup Usage
All Students Always used; schools and districts
Bottom 30%Need at least 30 students in the All Students group; proficiency component only; schools and districts
American Indian or Alaska Native Schools and districts
Asian Schools and districts
Black or African American Schools and districts
Hispanic Schools and districts
Native Hawaiian or Pacific Islander Schools and districts
Two or more races Schools and districts
White Schools and districts
Economically Disadvantaged Schools and districts
English Language Learners Schools and districts
Students with Disabilities Schools and districts
Shared Educational Entity (SEE) Districts
30 students make a valid subgroup in most cases, however, the inclusion criteria are different for some components . Students reported as homeschooled or as non-public school students are never included in accountability calculations . The Scorecard Components section of this guide provides further detail on the criteria used for student inclusion in the various calculations .
Michigan Schools Accountability Scorecard
Michigan Schools Accountability Scorecard
9
Subgroup size works differently in very large schools and districts . A school or district that enrolls more than 3000 students will have a minimum subgroup size based on 1% of its enrollment, up to a maximum subgroup size of 200 students . For example, a district with 10,000 students must have at least 100 students in a particular subgroup for the subgroup to be considered valid . Likewise, a district with 30,000 students must have the maximum subgroup size of 200 students for the subgroup to be considered valid .
Scorecard ComponentsParticipation
It is the policy of the Michigan State Board of Education that all students participate in the state assessment program . The target participation rate is 95% for any district, school, or subgroup with at least 40 students . For districts, schools, or subgroups with 30-39 students, no more than two students may be counted as non-tested. The Participation rate calculation is:
Number of students tested / Number of students enrolled
Any student enrolled in an assessed grade (3-9, 11) during the appropriate test window is counted in Participation calculations . The number of students to be tested is determined from the Michigan Student Data System (MSDS), collected by the Center for Educational Performance and Information (CEPI) . This is taken from the fall (October) collection for grades 3-9 and from the spring (February) collection for high schools . Schools had additional time to submit MSDS maintenance records to correct student demographics and report student exits after the official count days.
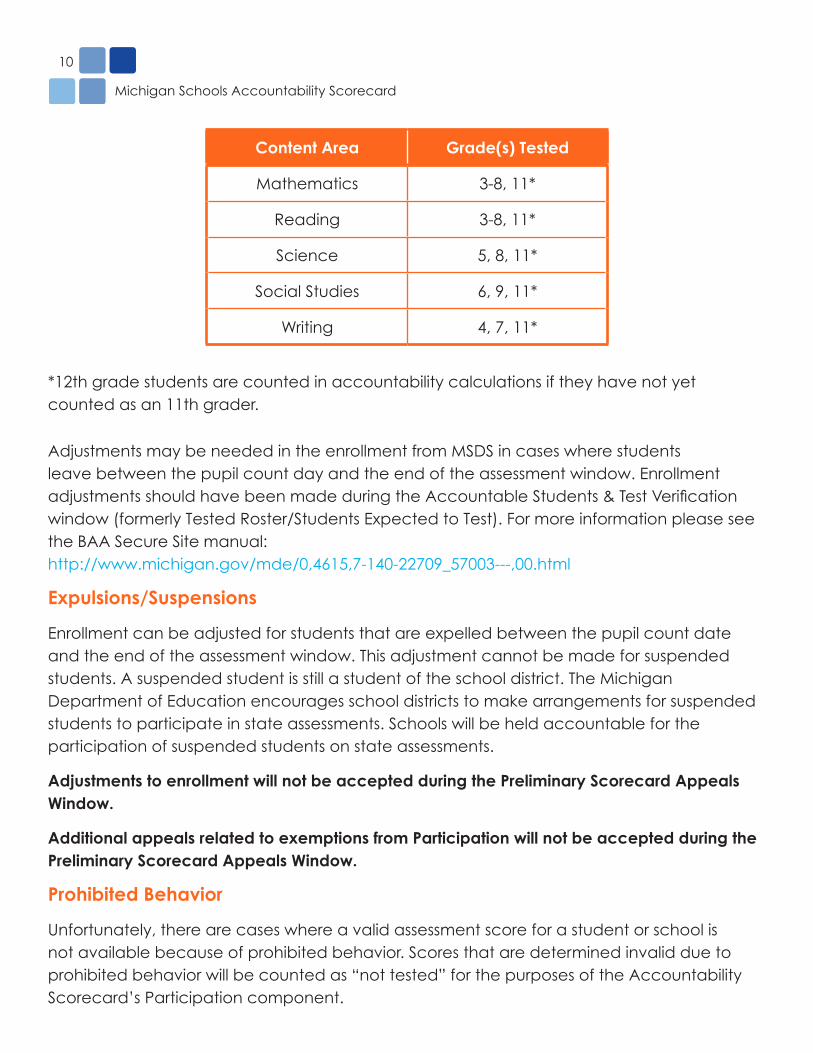
The number of students to be tested is the count of students reported as enrolled (MSDS exit code 19 – “Expected to Continue”) in the grades for which reading, writing, mathematics, science, and social studies are assessed under the Michigan Educational Assessment Program (MEAP), MEAP-Access Program, MI-Access Program (grades 3-9), and Michigan Merit Examination (MME) (grade 11) . In addition, any students reported as ungraded are included if they are of the age that should be tested . Students for whom the MSDS residency code indicates that the student attends a nonpublic school or homeschool are excluded . Students are expected to be tested at their primary education providing entity (PEPE) . The PEPE will be held accountable for testing the student . These students count in the denominator of the participation rate calculation .
Michigan Schools Accountability Scorecard
10
Content Area Grade(s) Tested
Mathematics 3-8, 11*
Reading 3-8, 11*
Science 5, 8, 11*
Social Studies 6, 9, 11*
Writing 4, 7, 11*
*12th grade students are counted in accountability calculations if they have not yetcounted as an 11th grader .
Adjustments may be needed in the enrollment from MSDS in cases where students leave between the pupil count day and the end of the assessment window . Enrollment adjustments should have been made during the Accountable Students & Test Verification window (formerly Tested Roster/Students Expected to Test) . For more information please see the BAA Secure Site manual: http://www.michigan.gov/mde/0,4615,7-140-22709_57003---,00.html
Expulsions/Suspensions
Enrollment can be adjusted for students that are expelled between the pupil count date and the end of the assessment window . This adjustment cannot be made for suspended students . A suspended student is still a student of the school district . The Michigan Department of Education encourages school districts to make arrangements for suspended students to participate in state assessments . Schools will be held accountable for the participation of suspended students on state assessments .
Adjustments to enrollment will not be accepted during the Preliminary Scorecard Appeals Window.
Additional appeals related to exemptions from Participation will not be accepted during the Preliminary Scorecard Appeals Window.
Prohibited Behavior
Unfortunately, there are cases where a valid assessment score for a student or school is not available because of prohibited behavior . Scores that are determined invalid due to prohibited behavior will be counted as “not tested” for the purposes of the Accountability Scorecard’s Participation component .
Michigan Schools Accountability Scorecard
Michigan Schools Accountability Scorecard
11
Nonstandard Accommodations
Students tested using nonstandard assessment accommodations will be counted as “Not Tested” in accountability calculations . A student must have a valid score to be counted as participating in the assessment . This is required by federal policy .
Assessments for Ungraded Students
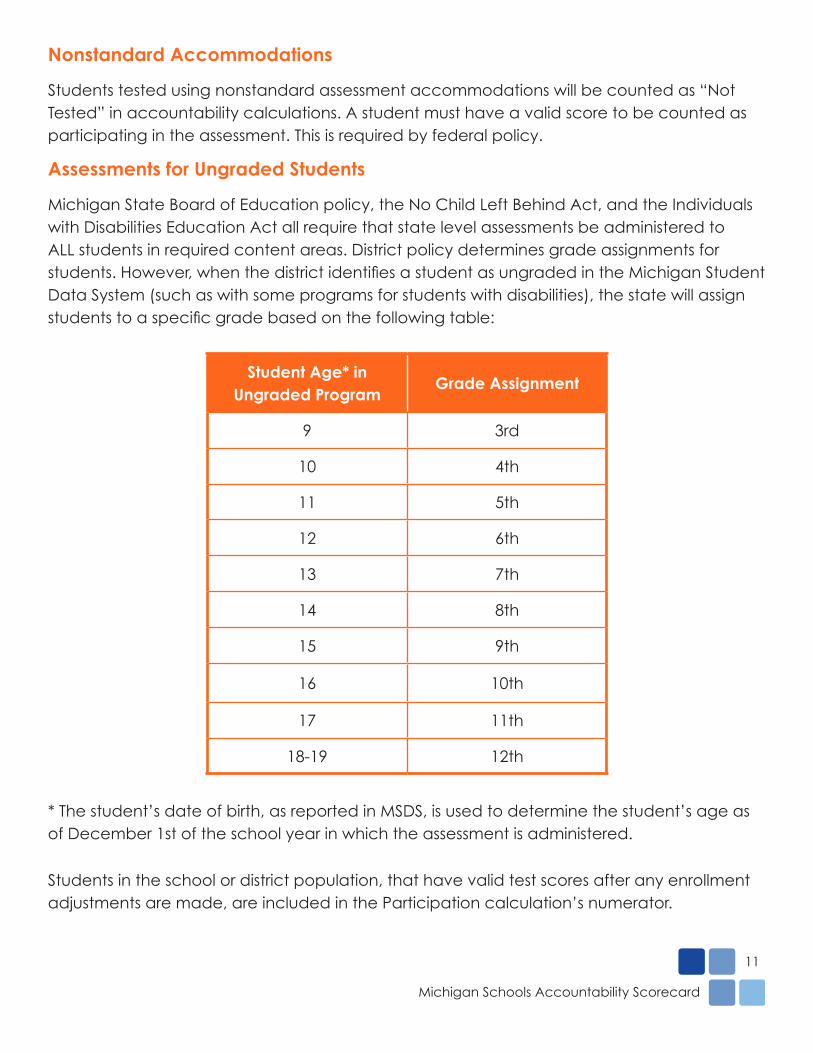
Michigan State Board of Education policy, the No Child Left Behind Act, and the Individuals with Disabilities Education Act all require that state level assessments be administered to ALL students in required content areas . District policy determines grade assignments for students. However, when the district identifies a student as ungraded in the Michigan Student Data System (such as with some programs for students with disabilities), the state will assign students to a specific grade based on the following table:
Student Age* in Ungraded Program
Grade Assignment
9 3rd
10 4th
11 5th
12 6th
13 7th
14 8th
15 9th
16 10th
17 11th
18-19 12th
* The student’s date of birth, as reported in MSDS, is used to determine the student’s age as of December 1st of the school year in which the assessment is administered .
Students in the school or district population, that have valid test scores after any enrollment adjustments are made, are included in the Participation calculation’s numerator .
Michigan Schools Accountability Scorecard
12
Participation Colors
The Participation component on the Scorecard uses a green/red coloring system . A green cell indicates the school/district/group met the 95% participation target . A red cell indicates that the target was missed for the specific school/district/group. There are no points associated with any of the Participation cells . The Participation component is checked for the presence of red cells, and if there are a sufficient number of red cells, the overall Scorecard color may be lowered . See the Audit Checks section for more detail .
Participation in Small Schools
Schools and districts will usually have an “All Students” group displayed for Participation in each content area . Those schools and districts with less than 30 students enrolled in the assessed grades will have Participation data combined for up to three of the most recent years in order to reach 30 students . If a school or district still has fewer than 30 students enrolled over the most recent three years, no Participation calculation will be made . Note that this is only done for the “All Students” group . Subgroup rates are only calculated when there are at least 30 students in the subgroup in the current year .
Multi-year Participation Averages
For 2014, multi-year averaging is used in cases where a school, district, or subgroup does not meet its 95% participation target using the current year’s participation data . In cases where the target is not met with a single-year rate, two- or three-year averages are calculated . For Science, Social Studies, and Writing, use up to two-year averages .
Participation Rounding
Participation rates are rounded to the nearest hundredth percent . This means a school/district/subgroup must reach 95% participation to earn a green cell .
Proficiency
Proficiency calculations only include students that have had full academic year (FAY) status at a school or district . This provision holds schools and districts accountable for their students, for whom they have provided instruction for a full year .
Michigan Schools Accountability Scorecard
Michigan Schools Accountability Scorecard
13
Full Academic Year
The MSDS is used to apply the definition of full academic year (FAY) in calculating accountability . Data on the 2014 School Accountability Scorecard have been derived using MSDS data and exclude the scores of students that have not been enrolled in the school for a full academic year when calculating the percent proficient used for determining accountability . Documentation of full academic year is provided by enrollment status in the school or district on the pupil count date in MSDS . The MSDS is used to look up prior enrollment to determine if a student is considered “full academic year .”
• Elementary and Middle Schools: Fall 2012, Spring 2013, and End of Year 2013 at the feeder school, which is the school that the student attended during the 2012-13 school year;
• High Schools: Spring 2013, End of Year 2013, Fall 2013, and Spring 2014.
Students who have been in a district for a full academic year and have changed schools within the district are only counted in the district’s accountability calculation, not the school’s .
Differentiated Targets
Proficiency targets are unique to each school and district. Targets are set at the school and district level in each content area . This means that any subgroup present in the school or district must meet the school or district’s proficiency target. All schools and districts are expected to reach 85% proficiency in all content areas by the end of the 2021-22 school year .
Proficiency targets are based on the school or district’s full academic year percent proficient in 2011-12 . Schools or districts that lacked full academic year students in 2011-12 have targets based on the 2012-13 full academic year percent proficient. Proficient students are those who attain a Performance Level 1 or 2 on the MEAP, MME, MEAP-Access, or MI-Access . This initial proficiency rate is called the base year percent proficient. The targets for each successive year are incremented equally over ten years by taking the difference between 85% and the base year percent proficient. Targets are calculated for each subject assessed in a school or district .
Example: Jefferson School has 65% reading proficiency in the 2011-12 school year. The school must be 85% proficient by the 2021-22 school year.
Michigan Schools Accountability Scorecard
14
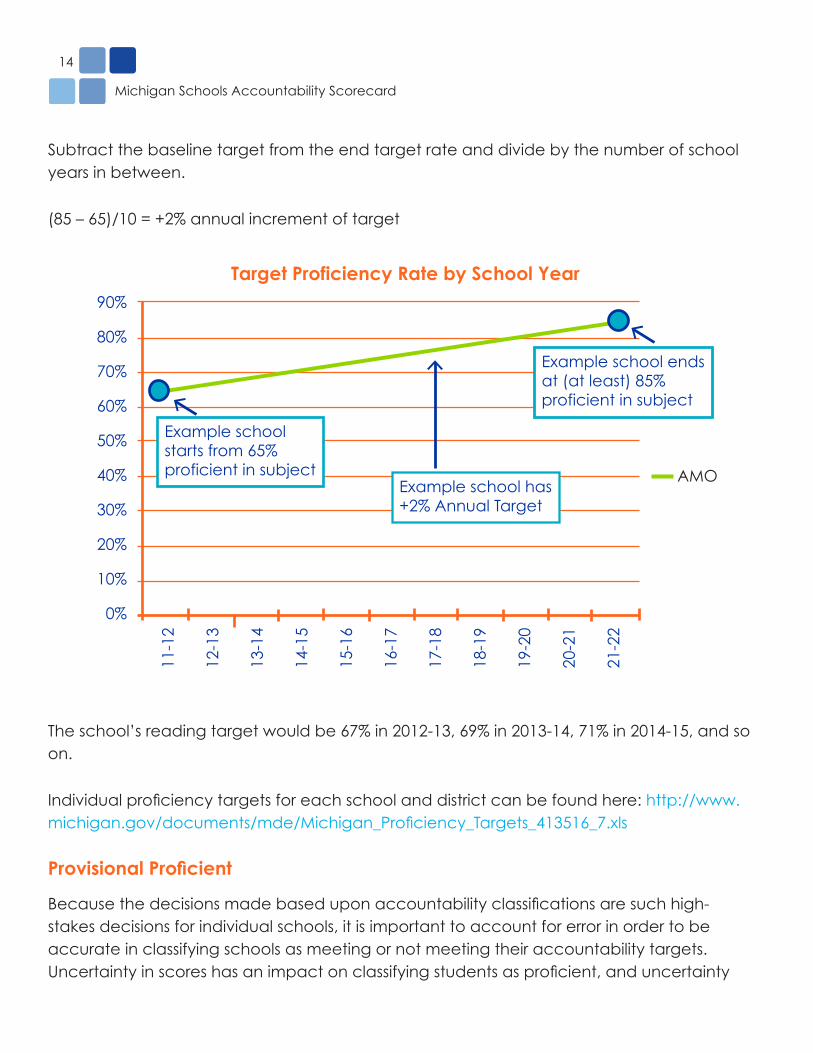
Subtract the baseline target from the end target rate and divide by the number of school years in between .
(85 – 65)/10 = +2% annual increment of target
The school’s reading target would be 67% in 2012-13, 69% in 2013-14, 71% in 2014-15, and so on .
Individual proficiency targets for each school and district can be found here: http://www.michigan.gov/documents/mde/Michigan_Proficiency_Targets_413516_7.xls
Provisional Proficient
Because the decisions made based upon accountability classifications are such high-stakes decisions for individual schools, it is important to account for error in order to be accurate in classifying schools as meeting or not meeting their accountability targets . Uncertainty in scores has an impact on classifying students as proficient, and uncertainty
Target Proficiency Rate by School Year90%
80%
70%
60%
50%
40%
30%
20%
10%
0%
11-1
2
12-1
3
13-1
4
14-1
5
15-1
6
16-1
7
17-1
8
18-1
9
19-2
0
20-2
1
21-2
2
AMO
Example schoolstarts from 65%proficient in subject
Example school has+2% Annual Target
Example school endsat (at least) 85%proficient in subject
Michigan Schools Accountability Scorecard
Michigan Schools Accountability Scorecard
15
in classifying students as proficient has an impact on calculating accountability. For this reason, measurement error needs to be taken into account in calculating accountability . Measurement error can cause two types of errors in calculating accountability: false positives (mistakenly identifying schools as meeting targets) and false negatives (mistakenly identifying schools as not meeting targets) .
Students with scale scores within two conditional standard errors of measurement of the proficient cut score are considered provisionally proficient for accountability.
Example:
Student A takes the 4th grade reading assessment . The scale score at which the student is deemed proficient (cut score) is 419. Student A achieves a scale score of 415. The student is not considered proficient as they are below the proficient cut score of 419. However, the standard error calculated for the student’s score is 3 . The student is within two conditional standard errors of measurement of the proficient cut score: (3 x 2) + 415 = 421
Growth Proficient
Michigan participates in a growth model pilot approved by the United States Department of Education (USED) . The growth model has been included in accountability determinations for 2013-14 in the Accountability Scorecards for elementary and middle schools .
Two key features of the growth model are as follows:
• Uses performance level change (first reported for fall 2007 MEAP) to track student performance from year to year;
• Measures whether students who are not yet proficient are demonstrating an “Improvement” or “Significant Improvement” year-over-year growth rate.
If students are demonstrating an “Improvement” or “Significant Improvement” year-over-year growth rate, those students will count as proficient for accountability purposes even if they are not yet proficient. This will result in a modest number of schools that did not meet proficiency targets using only those students scoring in Performance Levels 1 and 2 as ultimately meeting the proficiency targets with the inclusion of “growth proficient” students. No schools will be affected negatively by considering student progress toward proficiency.
Michigan Schools Accountability Scorecard
16
There are several important details of how the growth model will be implemented:
1. The growth model will only apply to students who had matching unique identifier codes (UICs) from fall 2012 to fall 2013 MEAP, MEAP-Access, or MI-Access Functional Independence . UICs provide the essential links that allow students’ performance to be tracked from year to year .
2 . A student must take the same assessment (MEAP, MEAP-Access, or MI-Access Functional Independence) at adjacent grade levels each year .
3 . The same population of students as used for regular accountability calculations will be used for the growth model pilot, meaning that only students who have attended a school for at least a full academic year (FAY) will count toward individual school accountability designations .
4. Identifying students who are demonstrating an “Improvement” or “Significant Improvement” year-over-year growth rate applies only to reading and mathematics scores in grades 4-8, as there is adjacent grade testing only in grades 3-8. Third graders are not identified as being on track since it is the first time these students’ achievement is measured .
5 . A student’s transition between performance levels will be counted as being growth proficient only the first time that the student progresses from any specific performance level to the next .
Michigan Schools Accountability Scorecard
Michigan Schools Accountability Scorecard
17
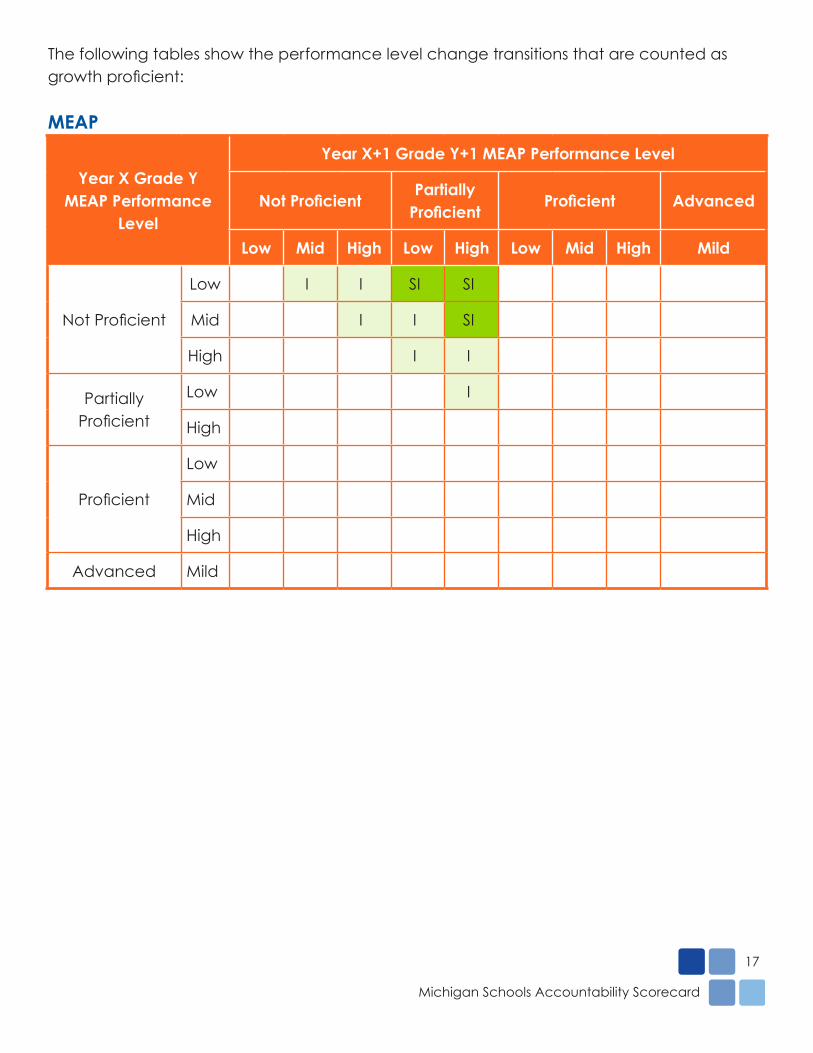
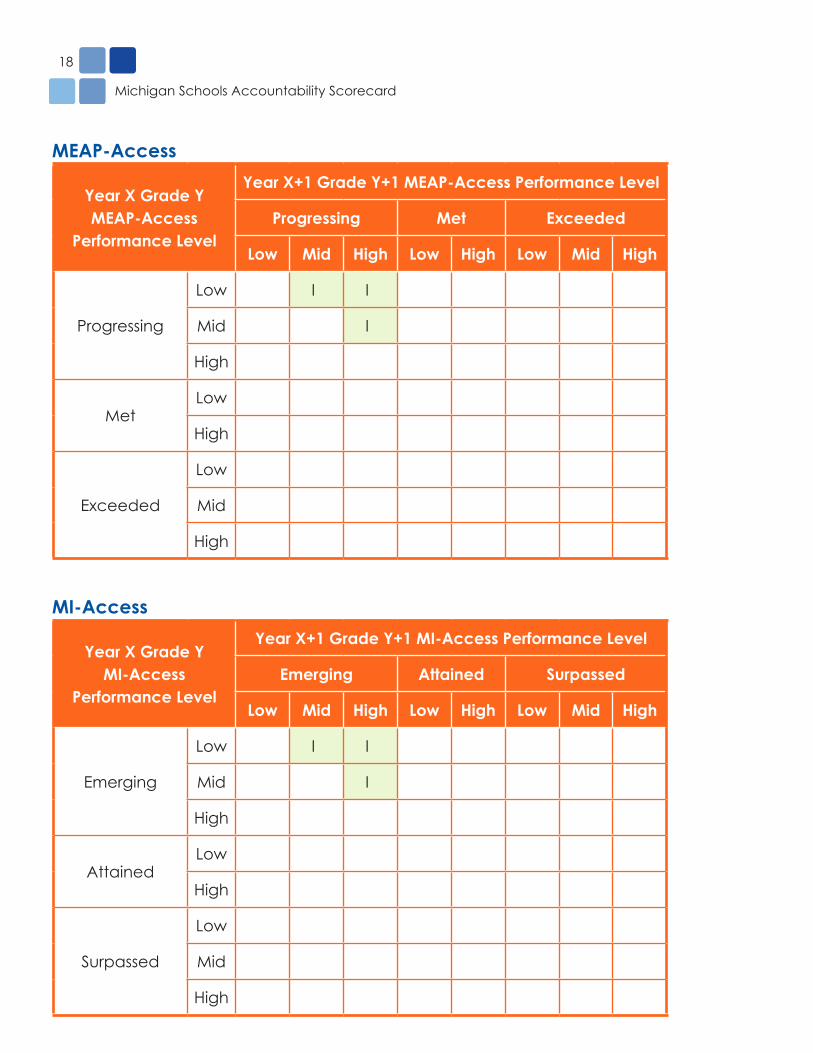
The following tables show the performance level change transitions that are counted as growth proficient:
MEAP
Year X Grade Y MEAP Performance
Level
Year X+1 Grade Y+1 MEAP Performance Level
Not ProficientPartially
ProficientProficient Advanced
Low Mid High Low High Low Mid High Mild
Not Proficient
Low I I SI SI
Mid I I SI
High I I
Partially Proficient
Low I
High
Proficient
Low
Mid
High
Advanced Mild
Michigan Schools Accountability Scorecard
18
MEAP-Access
Year X Grade Y MEAP-Access
Performance Level
Year X+1 Grade Y+1 MEAP-Access Performance Level
Progressing Met Exceeded
Low Mid High Low High Low Mid High
Progressing
Low I I
Mid I
High
MetLow
High
Exceeded
Low
Mid
High
MI-Access
Year X Grade Y MI-Access
Performance Level
Year X+1 Grade Y+1 MI-Access Performance Level
Emerging Attained Surpassed
Low Mid High Low High Low Mid High
Emerging
Low I I
Mid I
High
AttainedLow
High
Surpassed
Low
Mid
High
Michigan Schools Accountability Scorecard
Michigan Schools Accountability Scorecard
19
Multiple-year Averaging
Multiple-year averaging is used in cases where a school, district, or subgroup does not meet its proficiency target using one year of assessment data. In these cases, up to the three most recent consecutive years of assessment data are used . Multiple-year averaging uses weighting based on the number of FAY students in the school/district/subgroup for each year used in the multiple-year average .
Example:
Coolidge Elementary School attains an accountability proficiency rate in reading of 68% in 2013-14. Their target is 69%. The school had a reading proficiency rate of 70.5% in 2012-13. FAY students with valid reading scores in 2013-14 equal 290 . There were 300 FAY students with valid reading scores in 2012-13. The two-year weighted proficiency average is calculated like this:
2013-14 weighting = 290/590 = .4915
2012-13 weighting = 300/590 = .5085
Weighted Average = ( .5085* .705) + ( .4915* .68)
= .3585 + .3342
= 69 .27%
The school would meet the proficiency target using the two-year average.
Safe Harbor
In cases where the proficiency target is not met using a one-, two-, or three-year average, the Safe Harbor calculation is applied . The whole school or district, as well as each of the subgroups, can make Safe Harbor if they demonstrate a high rate of improvement .
To identify how much improvement is sufficient to make Safe Harbor, the Michigan Department of Education needs to identify a rate that has been demonstrated by schools, but that is still ambitious and rigorous . To do this, we look at the distribution of improvement rates for schools in each grade level (elementary, middle, and/or high school) over the previous four years (using a four-year improvement slope) . We found the improvement rate of a school at the 80th percentile . This means that 20% of schools/districts have a greater improvement rate; but 80% of schools/districts are improving at a slower rate .
Where four years of data do not exist, a three-year improvement slope is utilized . Local three-year improvement rates are compared to statewide three-year improvement rates, and local four-year rates are compared to the statewide four-year improvement rates . Rates are calculated for each content area and at three grade spans: elementary (3-5), middle (6-8), and high (11) .
Michigan Schools Accountability Scorecard
20
Schools/districts/subgroups with only two years of data will not use the improvement slope methodology for Safe Harbor . Groups with two years of data will need to show a reduction in the percentage of non-proficient students by 10 percent of the previous year’s percentage.
MI-Access Proficiency Cap
Federal regulations allow states to count the proficient scores of students with the most significant cognitive impairments, who take alternate assessments based on alternate achievement standards (MI-Access), as long as the number of those proficient scores does not exceed 1 .0 percent of all students in the grades assessed at the district and state levels . The 1 .0 percent cap is based on the current incidence rates of students with the most significant cognitive disabilities, allowing for reasonable local variation in prevalence.
The 1 .0 percent cap does not apply at the school level . Some districts may deliver special services for students with the most significant cognitive disabilities in one or a few schools. Additionally, the enrollment patterns of students across LEAs might not result in an even distribution of students with the most significant cognitive disabilities among schools, even if there are no special centers for these students . In these cases, a 1 .0 percent cap on the number of students who may be counted as scoring proficient or advanced on alternate assessments based on alternate achievement standards would prove unworkable at a school level and not be in the best interests of those students .
The 1.0 percent cap is a cap on proficient scores, not on student participation. Schools and districts may give the MI-Access assessment to as many students they deem appropriate based on IEP team determinations .
The 1.0 percent proficiency cap is determined by taking no more than one percent of the district enrollment (fall 2013 for grades 3-8 and spring 2014 for grade 11) at the grade levels in which students are assessed in each content area by the state assessment system . This means the calculation of the number of student scores that are proficient (in each local school district) is not rounded upward . The federal rules require that school districts apply for state approval of exceptions in cases where the district wishes to exceed the 1 .0 percent cap at the district level .
Proficient scores are counted towards a district’s cap space starting with the lowest proficient score (Participation and Supported Independence first, then Functional Independence) and “counting up” until the 1 .0 percent cap is reached .
Michigan Schools Accountability Scorecard
Michigan Schools Accountability Scorecard
21
Districts with an approved 1.0 percent cap waiver will still need to file an appeal (if necessary) during the preliminary Scorecard window in order to exceed the 1 .0 percent cap . This list shows districts that are allowed to submit appeals to go over the 1 .0 percent cap: http://www.michigan.gov/documents/mde/Current_Approved_1_Percent_Applications_388554_7 .pdf
Districts without an approved 1 .0 percent cap waiver will not be able to exceed the 1 .0 percent cap .
MEAP-Access Proficiency Cap
Federal regulations provide the inclusion of proficient and advanced scores of students who take alternate assessments based on modified academic achievement standards in accountability calculations--so long as the number of those proficient and advanced scores does not exceed 2 .0 percent of all students in the grades assessed (about 20 percent of students with disabilities) at the district and state levels . In Michigan, the MEAP-Access qualifies as an alternate assessment based on modified achievement standards. The 2.0 percent cap is necessary to ensure that modified academic achievement standards are used appropriately . The 2 .0 percent cap is based on the number of students enrolled in the tested grades .
The 2.0 percent cap is a hard limit on the number of proficient and advanced scores that can be counted as proficient for accountability purposes, and not a limit on the number of students with disabilities who may take MEAP-Access. If the number of proficient and advanced scores from the MEAP-Access exceeds 2 .0 percent of all the students tested, the additional scores would be counted as non-proficient in accountability calculations, which would be to the detriment of both the school and the district .
Under specific limited conditions, districts may exceed the 2.0 percent cap. The 2.0 percent cap may be exceeded only if a district is below the 1 .0 percent cap for students with the most significant cognitive disabilities who take alternate assessments based on alternate academic achievement standards. For example, if the number of proficient and advanced scores on the alternate assessment based on alternate academic achievement standards is 0.8 percent, the district could include 2.2 percent of the proficient and advanced scores on alternate assessments based on modified academic achievement standards in accountability calculations .
Unlike the 1 .0 percent cap, there are no waivers to the 2 .0 percent cap other than the condition described in the previous paragraph . Michigan automatically applies the remainder of the 1 .0 percent cap to a district’s 2 .0 percent cap – there is no need to appeal this cap during the preliminary Scorecard window .
Michigan Schools Accountability Scorecard
22
Small Schools
The federal No Child Left Behind Act (NCLB) requires each state to determine an accountability status for all public schools in the state . As such, even schools and districts with only one FAY student must have an accountability determination calculated . Subgroup determinations are not calculated if the subgroup has fewer than 30 students . In cases where an entire school or district has fewer than 30 students, a sliding confidence interval is used to compare the school or district’s proficiency against a statewide target.
Statewide proficiency targets for small schools are developed using a similar methodology to the differentiated proficiency targets for larger schools. Proficiency data from school year 2011-12 were used to establish base targets . Like the larger schools, small schools are required to attain 85% proficiency in all content areas by the end of the 2021-22 school year . This means small schools, like larger schools, also have 10 equal increments in their proficiency targets.
Schools that used the sliding confidence interval in 2012-13 and that have grown to have at least 30 FAY students use the statewide proficiency targets for small schools shown below.
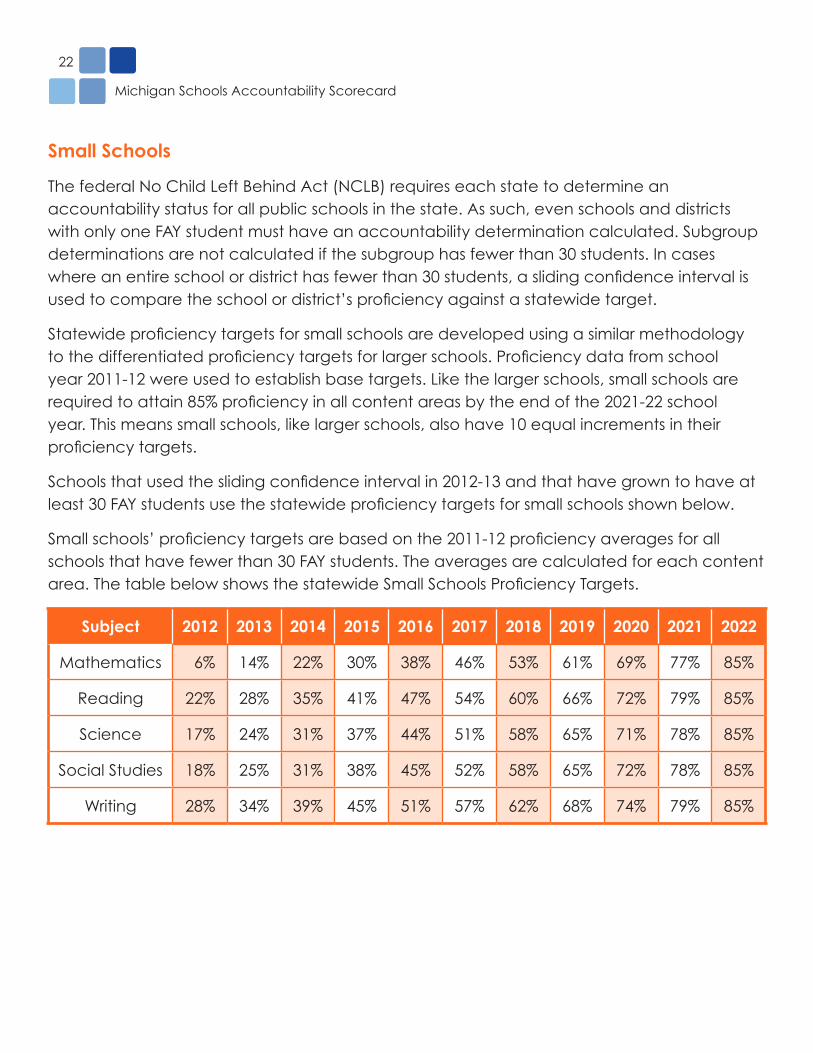
Small schools’ proficiency targets are based on the 2011-12 proficiency averages for all schools that have fewer than 30 FAY students . The averages are calculated for each content area. The table below shows the statewide Small Schools Proficiency Targets.
Subject 2012 2013 2014 2015 2016 2017 2018 2019 2020 2021 2022
Mathematics 6% 14% 22% 30% 38% 46% 53% 61% 69% 77% 85%
Reading 22% 28% 35% 41% 47% 54% 60% 66% 72% 79% 85%
Science 17% 24% 31% 37% 44% 51% 58% 65% 71% 78% 85%
Social Studies 18% 25% 31% 38% 45% 52% 58% 65% 72% 78% 85%
Writing 28% 34% 39% 45% 51% 57% 62% 68% 74% 79% 85%
Michigan Schools Accountability Scorecard
Michigan Schools Accountability Scorecard
23
Proficiency Colors and Points
Individual proficiency cells can be green, yellow, or red, and worth up to two points. A green cell indicates the proficiency target is met using a one-, two-, or three-year average and is worth two points. A yellow cell indicates the proficiency target is met using Safe Harbor and is worth one point . A red cell indicates the school/district/subgroup misses the target using any of the multiple year averages and does not meet the Safe Harbor target . Red cells are not worth any points . The one exception to this is the Bottom 30% subgroup . If this subgroup meets its Safe Harbor target it will receive a green cell and two points . This is to recognize both the strong achievement of the subgroup and that it deserves to be rewarded with a green cell instead of a yellow cell . This group does not have any “high performers” in it to pull up the average of the subgroup in the manner of other subgroups .
Schools and districts will always have an “All Students” subgroup . Other subgroups will only display on the Scorecard when there are at least 30 FAY students in the particular subgroup . The Bottom 30% subgroup will only display on the Scorecard if a school or district has at least 30 FAY students that have tested .
Attendance
Attendance is used as an “other academic indicator” for accountability purposes . Any schools or districts that do not receive graduation rates will have an attendance rate displayed . The attendance rate target is 90% .
An attendance rate is only calculated at an entity-level; that is, only at a school or district-level . Subgroup attendance rates are no longer required under ESEA Flexibility .
Attendance data is pulled from the MSDS . Each student enrolled in a school and district will have values reported for the MSDS fields of “Days Attended” and “Total Possible Attendance”. These values are summed for each school and/or district:
sum(Days Attended) / sum(Total Possible Attendance) = entity attendance rate
A school or district with a rate of at least 90% is meeting the attendance rate target . Schools and districts that do not meet the target have an improvement target calculation . The improvement target is a 10% improvement over the previous year’s rate:
(Previous Year’s Attendance x 0.1) + Previous Year’s Attendance = Improvement Target
Michigan Schools Accountability Scorecard
24
Attendance Colors and Points
The attendance component is worth two points . Schools and districts that meet the 90% attendance target will receive two points and a green attendance cell . Schools and districts that miss the 90% attendance target but meet the improvement target will receive one point and a yellow attendance cell . Schools and districts that do not meet the 90% target or their calculated improvement target will receive no points and a red attendance cell .
Graduation
Graduation rate is used as an “other academic indicator” for accountability purposes . Graduation rates are displayed for any school or district that has a graduation rate calculated for it by the Center for Educational Performance and Information (CEPI) . Michigan uses the federally required four-year adjusted cohort methodology for calculating graduation and dropout rates . The graduation rate target is 80% .
The US Department of Education allows Michigan to include extended cohort graduation rates (five- and six-year graduation rates) in accountability calculations. A graduation improvement calculation has also been approved . High school graduation rate calculations will first look at the four-, five-, and six-year graduation rates to determine if the target has been met . If none of the rates are at or above the 80% target, the following graduation improvement calculation will be used:
1. Calculate Gap:
a . 80 – Previous 4-year Graduation Rate = Gap
2. Calculate Improvement Target:
a . (Gap * 0 .25) + Previous 4-year Graduation Rate = Improvement Target
3. Compare Improvement Target with Current 4-year Graduation Rate:
a . Improvement Target <= Current 4-year Graduation Rate
If the school or district meets any of the above, the graduation rate requirement is satisfied.
CEPI calculates graduation rates and conducts a cleanup period for graduation rates through the Graduation/Dropout Review and Comment Application (GAD) . The graduation rate provided through this process will be used for the Scorecards . No additional appeal will be available for the high school graduation rate .
Michigan Schools Accountability Scorecard
Michigan Schools Accountability Scorecard
25
Graduation Colors and Points
Graduation rate is treated much like another subject (math, reading, etc .) on the Scorecard . Graduation rates are calculated for the school or district as a whole and for any valid subgroup in the entity . Each of the subgroups as well as the school/district has a graduation cell worth up to two points . Meeting the graduation target will yield a green cell and two points . Meeting the graduation improvement target will yield a yellow cell and one point, and not meeting the 80% graduation target or the graduation improvement target yields zero points and a red cell .
Educator Evaluations
Educator Evaluations are based on State law . The component is comprised of two sections that are related to data reporting requirements for schools and districts: Effectiveness Labels and Teacher Student Data Link (TSDL) completion . All of Michigan’s public educators will be evaluated using measures of student growth and the results of these evaluations will be reported into CEPI’s data systems .
Effectiveness Labels are reported to CEPI by schools and districts through the Registry of Educational Personnel (REP) . State law requires that all educators have a reported effectiveness label; therefore, the Scorecard target for the reporting of Effectiveness Labels is 100% .
In order to tie student growth on state assessments to specific educators, students must be linked to courses and teachers through the TSDL . The TSDL is a data collection submitted to CEPI by schools and districts on an annual basis . The TSDL completion rate target is 95% . This means that at least 95% of a school or district’s enrolled students are included in the TSDL collection .
Educator Evaluations Colors and Points
The Educator Evaluations component is worth an additional 5% of the school or district’s possible proficiency points. For example, McKinley Middle School has a Scorecard with 50 possible proficiency points. The Educator Evaluations component for the school is worth 2.5 points (5% x 50) . Schools and districts must meet both requirements in order to get full points and a green cell for the component . Meeting one of the requirements but not the other will result in a red cell and no points being awarded for the component . Meeting neither requirement also results in a red cell and no points being awarded .
Michigan Schools Accountability Scorecard
26
Compliance Factors
The Compliance Factors component is made up of two reports required under state law . Schools must complete an annual School Improvement Plan (SIP) and a School Performance Indicators report (SPR40, SPR90, ASSIST SA, Interim SA) . Both of these required reports are completed in the AdvancED system: http://www.advanc-ed.org/mde/
Compliance Factors Colors and Points
The Compliance Factors component is worth an additional 5% of the school or district’s possible proficiency points. For example, Roosevelt Elementary School has a Scorecard with 100 possible proficiency points. The Compliance Factors component for the school is worth 5 points (5% x 100) . The school must complete both reports in order to get a green cell and full points for the component . Completing only one or none of the reports yields a red cell and no points .
Districts do not have their own reports to file for use on the Scorecard, however they will still receive a Compliance Factors section with associated points and colors . A district will receive a green cell and full points for the Compliance Factors if all schools within the district receive green cells for their Compliance Factors sections . A district will receive a red cell and no points if any of its schools also receives a red cell for the Compliance Factors . The points awarded are worth an additional 5% of the district’s possible proficiency points.
Appeals
Schools and districts have opportunities throughout the school year to correct or appeal certain data that relate to student assessments and accountability . Appeals concerning issues and data that have prior, separate appeals windows will NOT be accepted during the Scorecard appeals window .
Prior appeals/update windows are held for the following:
• Student demographics including enrollment, economic disadvantaged status, limited English proficient status, student with disability status, racial/ethnic status, and Primary Education Providing Entity (PEPE) status (Verification of Student Demographics)
• Missing tests/non-standard accommodations/prohibited behavior (Verification of Student Answer Documents)
• Student participation (Verification of Students Not Tested)
• Graduation rates (GAD Window)
Michigan Schools Accountability Scorecard
Michigan Schools Accountability Scorecard
27
A school district has the opportunity to appeal any data that do not have separate appeals windows (see above) that affect the Scorecard status of its schools if it has evidence that the data may be inaccurate . The Michigan Department of Education will process appeals submitted within the appropriate appeals window . The purpose of the appeals window is to address substantive issues regarding the preliminary School Accountability Scorecards . The school district must cite specific data being challenged in the appeal.
Schools and districts can submit a Scorecard appeal by clicking on the Appeal button on any page within a school or district’s Scorecard . Follow these steps to successfully submit an appeal:
• Click the Appeal button on any page within a school or district Scorecard
• Select an Appeal Type
• Enter text in the Request Message box
• Attach any supporting documentation if necessary
• Click the Submit button
After clicking the Submit button, you will see a message box stating that the appeal has been saved . Michigan Department of Education staff will then process the appeal .
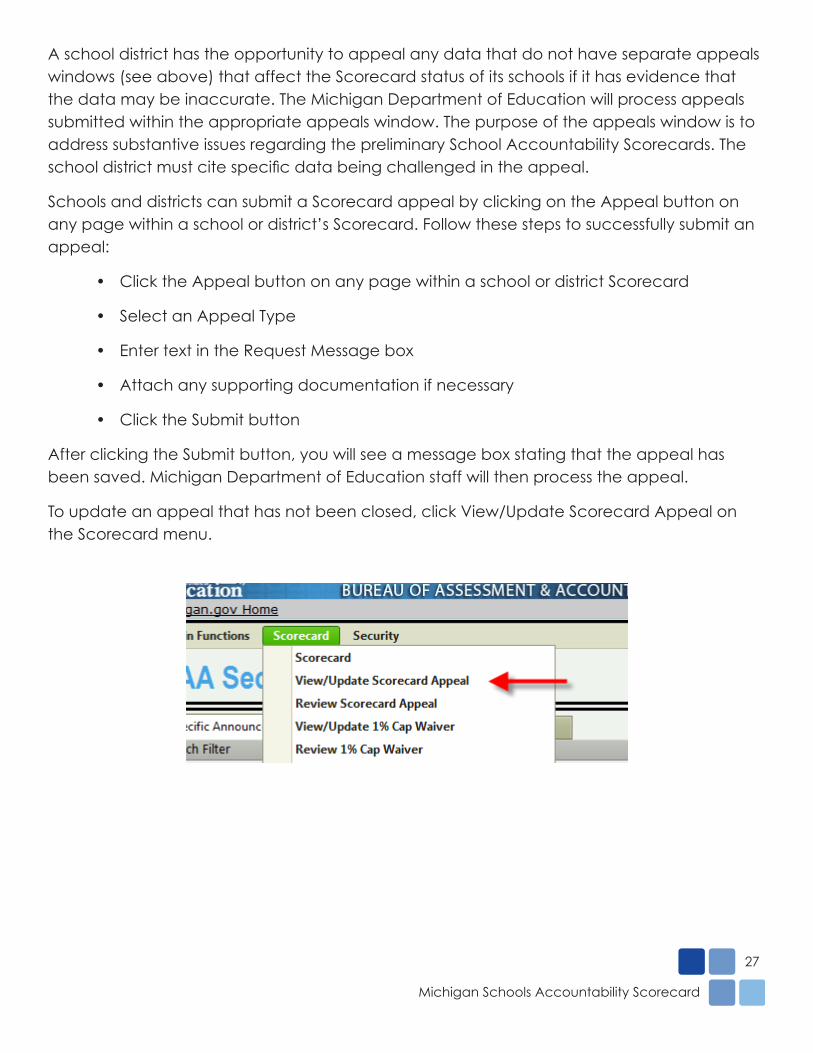
To update an appeal that has not been closed, click View/Update Scorecard Appeal on the Scorecard menu .
Michigan Schools Accountability Scorecard
28
On the View/Update Scorecard Appeal page, you will see all appeals submitted for the particular school or district as well as the appeal status . Appeals that have not been closed will have an Update Appeal link displayed . Appeals that have been closed will have a View Appeal link displayed. The Update Appeal link can only be modified by a school or district. The Appeal Type, Request Message, and attached documents can be updated by a school or district only if the Update Appeal link is displayed next to an existing appeal . If changes are made to the appeal, the school or district must click the Submit button again . The school or district can also retract the appeal by clicking the Retract button .
Scorecard Access
The preliminary Scorecards are available to schools and districts prior to public release . These preliminary Scorecards are located on the BAA Secure Site . In order to access the Secure Site, users must have a Michigan Education Information System (MEIS) account .
To create a new MEIS account or to reset the password to an existing account, use the MEIS User Management page: https://cepi.state.mi.us/meis/login.aspx/
Users with active MEIS accounts can login to the BAA Secure Site once they have been granted access . To request access, enter your MEIS ID and password into the BAA Secure Site login page . Click login .
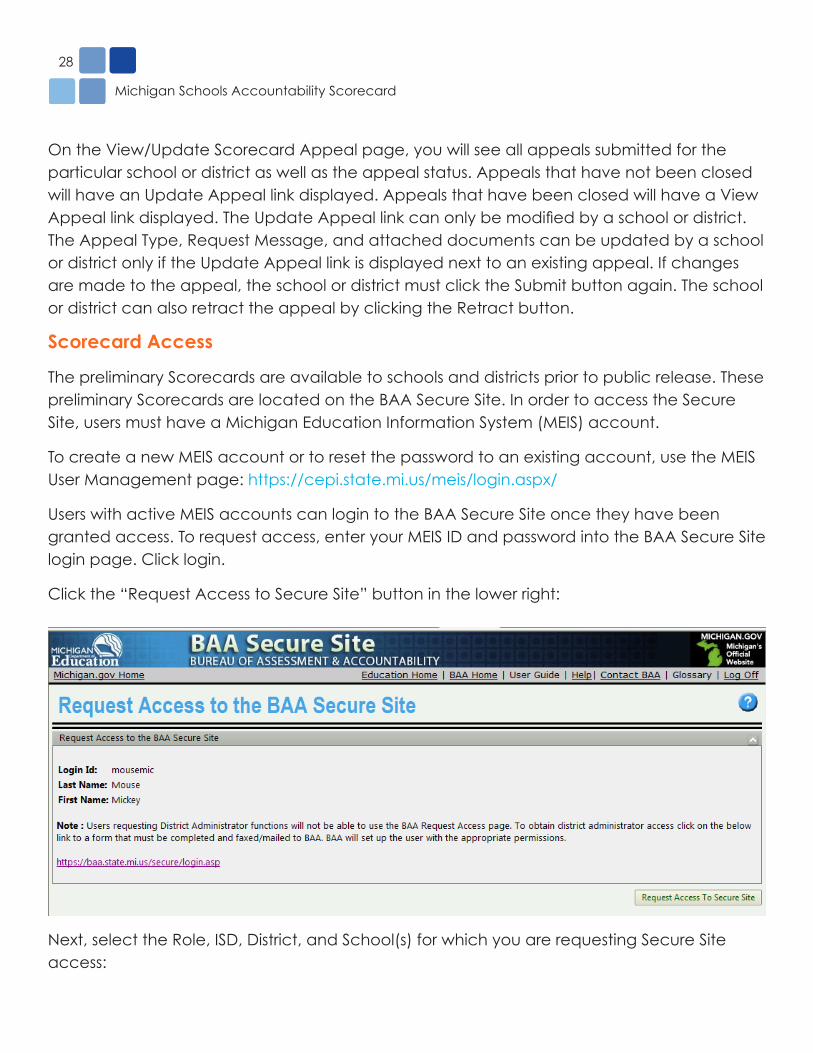
Click the “Request Access to Secure Site” button in the lower right:
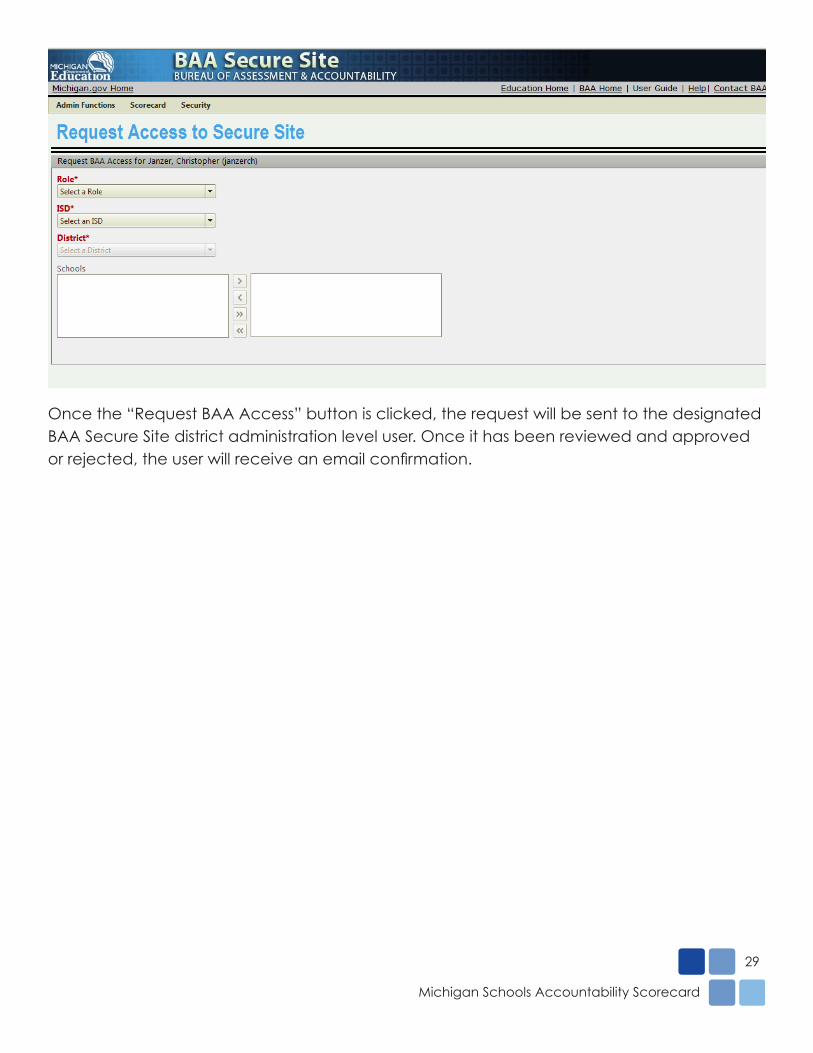
Next, select the Role, ISD, District, and School(s) for which you are requesting Secure Site access:
Michigan Schools Accountability Scorecard
Michigan Schools Accountability Scorecard
29
Once the “Request BAA Access” button is clicked, the request will be sent to the designated BAA Secure Site district administration level user . Once it has been reviewed and approved or rejected, the user will receive an email confirmation.
Michigan Schools Accountability Scorecard
30
Notes

Michigan Schools Accountability Scorecard
Michigan Schools Accountability Scorecard
31
Notes

Contact Us
The Office of Evaluation, Strategic Research, and Accountability is responsible for producing the Scorecards. We are happy to answer any questions or concerns you may have.
Phone: 877-560-8378Email: [email protected]