michigan renewable resource assessment · projected performance characteristics for selected...
TRANSCRIPT
Page 0
Michigan Renewable Resource Assessment Final Report
April 8, 2015
Prepared for
MICHIGAN PUBLIC SERVICE COMMISSION
under agreement with
CLEAN ENERGY STATES ALLIANCE
Prepared by VERMONT ENERGY INVESTMENT CORPORATION

Table of Contents
Executive Summary .........................................................................................................................1 I. Introduction ...........................................................................................................................5 II. Cost and Performance Profiles ..............................................................................................5
Onshore Wind ....................................................................................................................... 5 Onshore Wind Costs ......................................................................................................... 5 Onshore Wind Performance ............................................................................................. 6
Solar Photovoltaics ............................................................................................................... 7 Solar Photovoltaic Cost Profiles ..................................................................................... 7 Photovoltaic Performance ............................................................................................... 7
Central Station Biomass Power ............................................................................................ 8 Biomass Power Cost Profiles........................................................................................... 8 Biomass Power Performance Profiles ............................................................................. 8
III. Bounded Technical Potential .................................................................................................8 Onshore Wind Bounded Technical Potential ....................................................................... 9 Solar Bounded Technical Potential .................................................................................... 11 Biomass Power Bounded Technical Potential .................................................................... 12
IV. Bounded Technical Potential Results ..................................................................................13 V. Limitations, Caveats, and Further Research ........................................................................16
Appendix A: Cost and Performance Profiles Workbook ...............................................................17 Appendix B: References ................................................................................................................18 Appendix C: Additional Material ..................................................................................................19
Onshore Wind Capacity Factors ......................................................................................... 19
About the Vermont Energy Investment Corporation (VEIC): VEIC reduces the economic and environmental costs of energy use. It was founded in 1986, and has an annual budget of $84 million. It is internationally recognized for advancing renewable energy and energy efficiency. Its client base is in 35 states, 6 Canadian provinces, and 6 countries outside North America. www.veic.org About the Clean Energy States Alliance (CESA): CESA is a national, nonprofit coalition of public agencies and organizations working together to advance clean energy. CESA members—mostly state agencies—include many of the most innovative, successful, and influential public funders of clean energy initiatives in the country. www.cesa.org

Page 1
Executive Summary In accordance with Public Act 295 (PA 295), which was enacted in 2008, electric providers in Michigan have taken steps to meet a renewable portfolio standard of 10 percent, based on retail sales, by 2015. Starting in 2011, the Michigan Public Service Commission (PSC) has reported annually to the Legislature on PA 295 implementation. As of the start of 2015, the Commission concluded from a review of the providers’ renewable energy plans that all are expected to be able to meet the 10 percent standard in 2015.1,2 After that year, Act 295 requires electric providers to maintain the same amount of credits needed to meet the standard in 2015.
The Vermont Energy Investment Corporation, under contract to the Clean Energy States Alliance (CESA), has prepared this report for Commission staff, to help determine whether a higher standard is feasible. The analysis and research provide cost and performance profiles for a set of renewable energy technologies that represent the most significant and cost-effective resources for Michigan through 2030. The technologies selected are:
o Utility scale onshore wind o Photovoltaics, both customer sited and utility scale o Central station biomass power
For each of these technologies, the report estimates a bounded technical potential, as well as projections for the cost and performance profiles expected over the coming fifteen years.3 The scope of this study did not include estimating cost effectiveness, nor does it include detailed estimation of the levelized cost for the selected technologies.
The research and analysis can be used by Commission staff or others as a basis for further analysis. Therefore, this study is not by itself a complete renewable potential study.
The following findings are supported and detailed in the following narrative and in the accompanying spreadsheet workbook.
1 Michigan Public Service Commission, Report on the Implementation of the P.A. 295 Renewable Energy Standards and the Cost-Effectiveness of the Energy Standards, 2015, http://www.michigan.gov/documents/mpsc/PA_295_Renewable_Energy_481423_7.pdf 2 Detroit Public Lighting (DPL) was not expected to meet the 10 percent renewable energy standard in 2015. However, all of DPL’s customers became DTE Energy customers effective July 1, 2014, and a 5- to 7-year system conversion is in process that will transition former DPL customers to the DTE Electric distribution system. In the interim, the PSC has suspended all of DPL’s renewable energy filings. DTE Electric is expected to meet the 10 percent renewable energy standard in 2015. 3 Because of scope and timing limitations, this study does not address all possible renewable resources and technologies that currently, and in the future, can contribute to meeting Michigan’s energy requirements. Whereas offshore wind, hydropower, landfill gas, and anaerobic digestion are all eligible to help meet future needs, they are expected to have a lesser impact on Michigan’s renewable electric generation in the time period leading up to 2030 than the technologies and resources that are included in this report. Resource and economic factors account for this expected lesser impact.

Michigan Renewable Resource Assessment
Page 2
KEY FINDINGS
1. Renewable resources are sufficient for Michigan to meet increasingly greater shares of its electricity supply needs through 2030.
2. The bounded technical potential for the resources assessed is sufficient to meet more than 40 percent of projected electric needs by 2030.
3. The bounded technical potential for the resources assessed is sufficient to meet an expanded renewable portfolio standard (RPS) that starts at 10 percent of retail sales in 2015 and increases by 1 percent per year to reach 25 percent of expected retail sales in 2030.
4. Onshore wind is likely to make the largest contribution to future renewable energy generation in Michigan.
5. Cost and performance profiles for the renewable technologies are generally expected to continue improving during the study period, although the pace of cost reductions is likely to slow in comparison to recent years.
6. The cost and performance profiles suggest that meeting future renewable targets can continue to be cost competitive. Key uncertainties are the future costs for non-renewable resources and the potential costs associated with carbon emissions.
7. Regional infrastructure investment and development are required to enable Michigan and other states to meet increasingly high shares of electric supply needs from wind and solar intermittent renewable resources. The transmission and integration costs for up to 30 percent wind saturation are included in this assessment. Although these costs would not significantly increase the overall costs for wind generation, they do require regional and national investment, integration, and coordination on transmission and grid operations that are beyond what has been accomplished to date.
The bounded technical potential presented in this report estimates the amount of renewable generation available, by time period. It also considers limitations on annual growth rates, renewable resource base, land use, and siting restrictions.
Table ES-1 presents the estimated bounded technical potential by resource, technology and year.
Table ES-1. Bounded technical potential estimated generation
Annual Generation (GWh) 2015 2020 2025 2030
Onshore wind 4,882 14,897 34,971 36,000
Rooftop PV - residential 5 25 137 736
Rooftop PV - commercial 15 81 435 2,339
Utility PV 16 87 466 2,509
Central biomass power 1,814 3,198 5,635 9,931
Total 6,732 18,288 41,645 51,514
In the following narrative sections, this report presents details on the factors used to estimate the bounded technical potential for each resource. For example, siting restrictions for onshore wind

Michigan Renewable Resource Assessment
Page 3
eliminated from consideration approximately 40 percent of the land where wind resources are favorable. In addition, a 30 percent saturation factor4 was applied as a binding factor for onshore wind, based on detailed analyses of the ability to integrate wind into the Eastern Interconnection territory.5 For photovoltaics, this assessment applied year-on-year average annual growth rates of 40 percent to estimate the bounded technical potential. The biomass bounded technical potential is informed by county-level estimates of biomass resources that could be or become available for electric generation.
The projected cost and performance profiles in this analysis are based on national-level data sets and trends, as opposed to being tied directly to Michigan-specific projects.6 The rationale for this is that as renewable markets continue to evolve and grow, there will be less differentiation between markets that are more or less developed. In several instances, we also provide recent data on costs for Michigan-based projects to provide a reference point and comparison for the future projections. Figure ES-1 summarizes the projected installed cost per kW through 2030. Further information on variable and fixed operations and maintenance costs are contained in the appropriate sections of the narrative.
Figure ES-1. Renewable technology projected installed costs through 2030, in dollars per kilowatt.
Although Figure ES-1 indicates that installed capacity costs for onshore wind and biomass are expected to increase, technology and operational improvements are expected to increase the performance and annual output of the technologies per unit of installed capacity. For example,
4 Saturation factor is based on percent of total electric energy requirements. 5 NREL, Eastern Wind Integration and Transmission Study, 2011, http://www.nrel.gov/docs/fy11osti/47078.pdf 6 The primary source of cost projections is the Transparent Cost Database, Open Energy Information (en), Future Projections. http://en.openei.org/apps/TCDB/.

Michigan Renewable Resource Assessment
Page 4
average annual capacity factors for wind turbines are expected to improve as a result of higher hub heights, increased availability, and more efficient gear boxes and transmissions. The narrative contains details on projected performance improvements by technology.

Michigan Renewable Resource Assessment
Page 5
I. Introduction In the fall of 2014, the Michigan Public Service Commission (PSC) staff and the Clean Energy States Alliance (CESA) requested that the Vermont Energy Investment Corporation (VEIC) conduct an assessment of renewable energy bounded technical potential, projected costs, and projected performance characteristics for selected renewable energy resources and technologies. This report, along with an accompanying spreadsheet workbook, presents VEIC’s findings and analysis. The objective was to provide information about the potential for installing renewable energy generation facilities in Michigan, including information about what the cost of doing so might be through the year 2030.
The selected resources and technologies, which were reviewed and agreed upon by PSC staff, CESA, and VEIC, are onshore wind, photovoltaics, and central station biomass power. They do not include the full range of Michigan’s renewable resources or technologies that are available to meet future energy needs. Nevertheless, they are the resources and technologies most likely to make significant contributions through 2030.
The information in this report can be referenced or used to conduct further detailed analysis on the economic potential for renewable energy in Michigan, an assessment of future possible levels for new renewable portfolio standard targets, or for other policy and economic assessments.
This report is based on secondary research and data. The structure, approach to this study, and the data sources for it are informed by work that VEIC has conducted for several state-level renewable and energy efficiency potential studies. VEIC also has broad experience with the development and implementation of policies, initiatives, and programs designed to accelerate and advance market development for total energy solutions that reduce the economic and environmental impacts of energy use.
II. Cost and Performance Profiles
Onshore Wind
Onshore Wind Costs
Onshore wind is a well-established technology with installed costs that are relatively stable as shown in Table 1. Over the next 15 years, costs are expected to rise slightly.7
7 DTE Energy reported installed costs of $2,225 to $2,438 per kW for the Echo Wind Park contract. Echo Wind Park is a 70-turbine, 112 MW project located in Huron County. It began commercial operation in September 2014. Report on the Implementation of P.A. 295 Renewable Energy Standard, Michigan Public Service Commission, February 13, 2015, Appendix I.

Michigan Renewable Resource Assessment
Page 6
Table 1. Onshore wind cost profile
2015 2020 2025 2030
Installed cost ($ / kW)8 2,306 2,391 2,416 2,330
Onshore Wind Performance
Increased rotor size and other improvements to rotors, controls, and gearboxes, are leading to higher capacity factors for new wind turbines.9
Table 2. Onshore wind performance profile
2015 2020 2025 2030
Capacity Factor (%)10 33% 33% 34% 35%
Measure life: 20 years11 Operations and maintenance (O&M) costs: $34.5 / kW fixed, $12 / MWh variable12
Transmission and integration costs for new wind generation are estimated at 18 percent and 4 percent of capital cost, respectively13 (note these factors are in addition to the costs presented in Table 1).
Output from wind generators varies according to seasonal and daily wind speed patterns. The analysis for this study allocated annual wind generation into four periods (summer peak, summer off-peak, winter peak, and winter off-peak).14 The National Renewable Energy Laboratory’s
8 Current cost is based on the median from historical reports for installations, 2010-2014, in OpenEI Transparent Cost Database http://en.openei.org/apps/TCDB/. Future costs use the median from projections in the OpenEI database. 9 Note Table 2 represents fleet average capacity factors. Individual projects might have higher performance from better operations, technology, and site characteristics. For example, in Michigan, 2013 wind production data from a selection of wind farms with publicly available annual generation includes capacity factors ranging from 29 percent to 42 percent. The generation weighted average of these capacity factors is 32 percent, which is consistent with estimates in Table 2. Using higher average capacity factors than those listed in Table 2 would increase the bound technical potential for onshore wind—and the resource available to meet an expanded RPS. 10 2012, Black and Veatch, Cost and Performance Data for Power Generation Technologies, Table 29, http://bv.com/docs/reports-studies/nrel-cost-report.pdf. 11 NREL, Cost and Performance Assumptions for Modeling Electricity Generation Technologies, (2010) Table 11, NREL-SEAC, http://www.nrel.gov/docs/fy11osti/48595.pdf. Measure life it the expected economic life of the plant (with standard maintenance) over which it will have annual average output at the capacity factor. The plant or site life could be extended with further capital investments. 12 Ibid. 13 Estimated Incremental Cost over Reference Scenario as a percentage of Wind Capital Cost in Figure 9-8, NREL, Eastern Wind Integration and Transmission Study, 2011, http://www.nrel.gov/docs/fy11osti/47078.pdf. 14 Summer is June to September, Winter is October to May, Peak is 11:00 a.m. to 7:00 p.m. and Off-Peak is 7:00 p.m. to 11:00 a.m.
Michigan Renewable Resource Assessment
Page 7
(NREL’s) Eastern Wind Integration and Transmission Study (EWITS) dataset15 contains modeled 10-minute data for three years for 57 sites in Michigan. The modeled power output from this study was summed for each hour across the 57 plants, and then averaged across the years, giving the total wind output per hour for an average year.
Solar Photovoltaics
Solar Photovoltaic Cost Profiles
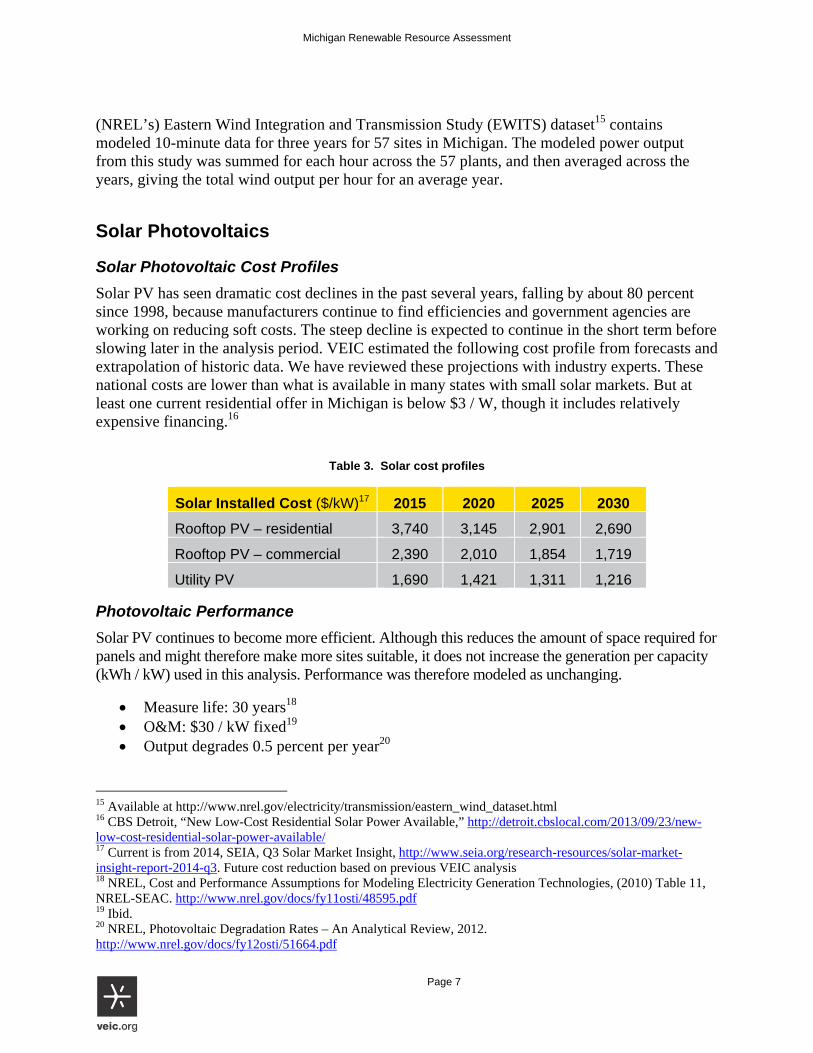
Solar PV has seen dramatic cost declines in the past several years, falling by about 80 percent since 1998, because manufacturers continue to find efficiencies and government agencies are working on reducing soft costs. The steep decline is expected to continue in the short term before slowing later in the analysis period. VEIC estimated the following cost profile from forecasts and extrapolation of historic data. We have reviewed these projections with industry experts. These national costs are lower than what is available in many states with small solar markets. But at least one current residential offer in Michigan is below $3 / W, though it includes relatively expensive financing.16
Table 3. Solar cost profiles
Solar Installed Cost ($/kW)17 2015 2020 2025 2030
Rooftop PV – residential 3,740 3,145 2,901 2,690
Rooftop PV – commercial 2,390 2,010 1,854 1,719
Utility PV 1,690 1,421 1,311 1,216
Photovoltaic Performance
Solar PV continues to become more efficient. Although this reduces the amount of space required for panels and might therefore make more sites suitable, it does not increase the generation per capacity (kWh / kW) used in this analysis. Performance was therefore modeled as unchanging.
Measure life: 30 years18 O&M: $30 / kW fixed19 Output degrades 0.5 percent per year20
15 Available at http://www.nrel.gov/electricity/transmission/eastern_wind_dataset.html 16 CBS Detroit, “New Low-Cost Residential Solar Power Available,” http://detroit.cbslocal.com/2013/09/23/new-low-cost-residential-solar-power-available/ 17 Current is from 2014, SEIA, Q3 Solar Market Insight, http://www.seia.org/research-resources/solar-market-insight-report-2014-q3. Future cost reduction based on previous VEIC analysis 18 NREL, Cost and Performance Assumptions for Modeling Electricity Generation Technologies, (2010) Table 11, NREL-SEAC. http://www.nrel.gov/docs/fy11osti/48595.pdf 19 Ibid. 20 NREL, Photovoltaic Degradation Rates – An Analytical Review, 2012. http://www.nrel.gov/docs/fy12osti/51664.pdf

Michigan Renewable Resource Assessment
Page 8
We used NREL’s System Advisor Model (SAM) to model hourly output for three prototype systems located in Detroit, and to allocate output to each costing period.
Central Station Biomass Power
Biomass Power Cost Profiles
Biomass power is an established technology. Projections show that costs will be relatively stable, with some changes, primarily tied to general costs of industrial construction.
Table 4. Biomass power cost profile
2015 2020 2025 2030
Installed cost ($ / kW)21 3,150 3,250 3,340 3,090 Biomass Power Performance Profiles
Overall efficiency of biomass power plants can be improved through cogeneration and advanced combustion techniques. This efficiency is represented by an improving heat rate. We held measure life and operations and maintenance (O&M) costs constant, given the maturity of basic wood-to-electricity system technologies.
Measure life: 45 years22 O&M: $86 / kW fixed, $3.75 / MWh variable23 Heat rate improves from 14.5 to 13.5 MMBtu / MWh over 20 years24
Since biomass power is a dispatchable resource, we based the allocation of generation into costing periods simply on the portion of hours that fall in each period.
III. Bounded Technical Potential Using existing technologies, renewable resources can in Michigan, as in most other states, meet or exceed total electric generation requirements. An “unbounded” technical potential, based 21 Current cost based on the median from historical reports for installations 2010-2014 in OpenEI Transparent Cost Database http://en.openei.org/apps/TCDB/. Future costs use the median from projections in the OpenEI database. Wisconsin Energy reports an investment of $314 million for a 50 MW plant, equivalent to $6,280 per kW. http://efile.mpsc.state.mi.us/efile/docs/17562/0015.pdf page 6 of 57. http://www.wisconsinenergy.com/csr/cr2012/cr_2012.pdf. The median national data suggest biomass power plant costs can be significantly lower than the Wisconsin value. 22 NREL, Cost and Performance Assumptions for Modeling Electricity Generation Technologies, (2010) Table 11, NREL-SEAC. http://www.nrel.gov/docs/fy11osti/48595.pdf 23 Ibid. 24 NREL, Renewable Electricity Futures Study, Vol. 1, 2012, Figures 6-14.

Michigan Renewable Resource Assessment
Page 9
strictly on the available primary renewable resource and conversion technologies—without regard for cost, social, or engineering constraints—can underscore the abundance of renewable resources. But it offers little guidance to policy makers since it does not present a practical assessment of the development potential.
In contrast, a bounded technical potential applies several constraints: saturation limits for intermittent resources, growth rates for the existing manufacturing and installation base, developable land resource, and other siting / social constraints that might limit development. Bounded technical potential estimates do not consider economics or cost constraints, although they are often used as a basis for the development of economic and achievable potential estimates. Figure 1 summarizes elements that are often considered in developing a bounded technical potential estimate.
Figure 1. Bounded technical potential, showing the relationship constraints and conversion technologies.
Onshore Wind Bounded Technical Potential
In consultation with Commission staff and CESA, the analysis of wind potential addressed onshore resources. Although offshore wind development in both Lake Michigan and Lake Huron might be possible across the next 15 years, the onshore resource is very large. The vast majority of wind development is therefore likely to be on land.
Wind Resource. The “windy-land” resource in Michigan is significant. NREL and AWS Truewind performed an analysis of available land area where wind turbines could be installed with a gross capacity factor equal to or greater than 30 percent at an 80-meter hub height.25 The analysis then excluded roughly 40 percent of the windy land, based on filters that removed areas such as parks, urban areas, and steep slopes that are not likely to be developed.
25 NREL, AWS Truewind, 80m, 30% CF Wind Potential, 2014. http://apps2.eere.energy.gov/wind/windexchange/docs/wind_potential.xls

Michigan Renewable Resource Assessment
Page 10
Table 5 summarizes the exclusions. After removing exclusions, the study estimates that using roughly 7.8 percent of the state’s land area, the wind resource could support 59 GW of wind capacity. If fully built, this capacity would be expected to generate 169 TWh of electricity annually, an amount that exceeds Michigan’s total projected electricity needs of 120 TWh for 2030.26
Table 5. Wind resource exclusions
Criteria for defining available windy land (numbered in the order in which they are applied)
Environmental Criteria Data / Comments
2) 100 percent exclusion of National Park Service and Fish and Wildlife Service managed lands
USGS Federal Lands shapefile, Dec 2005
3) 100 percent exclusion of federal lands designated as park, wilderness, wilderness study area, national monument, national battlefield, recreation area, national conservation area, wildlife refuge, wildlife area, wild and scenic river or inventoried roadless area.
USGS Federal Lands shapefile, Dec 2005; Inventoried Roadless Areas, 2004; BLM Areas of Critical Environmental Concern (2008)
4) 100 percent exclusion of state and private lands equivalent to criteria 2 and 3, where GIS data is available.
State/GAP land stewardship data management status 1, from Conservation Biology Institute Protected Lands database, 2004
7) 50 percent exclusion of remaining USDA Forest Service (FS) lands (incl. National Grasslands) except ridge-crests
USGS Federal Lands shapefile, Dec 2005
8) 50 percent exclusion of remaining Dept. of Defense lands except ridge-crests
Military Lands boundary files, internal dataset (2007)
9) 50 percent exclusion of state forest land, where GIS data is available
State/GAP land stewardship data management status 2, from Conservation Biology Institute Protected Lands database, 2004
Land Use Criteria 5) 100 percent exclusion of airfields, urban, wetland and water areas.
USGS North America Land Use Land Cover (LULC), version 2.0, 1993; ESRI airports and airfields (2006); U.S. Census Urbanized Areas (2000 and 2003)
10) 50 percent exclusion of non-ridge-crest forest Ridge-crest areas defined using a terrain definition script, overlaid with USGS LULC data screened for the forest categories.
Other Criteria
1) Exclude areas of slope > 20% Derived from 90 m national elevation dataset.
6) 100 percent exclude 3 km surrounding criteria 2-5 (except water)
Merged datasets and buffer 3 km
Note on Table 5: 50 percent exclusions are not cumulative. If an area is non-ridge-crest forest on U.S. Forest Service land, it is just excluded at the 50 percent level one time.
Permitting and Industry Growth. Wind projects face permitting and siting challenges, and the human, manufacturing, and investment infrastructure available to increase onshore wind capacity in Michigan might not be available to “instantaneously” develop the available resource. For these
26 The estimate of 120 TWh of retail electric sales in Michigan by 2030 is consistent with the Energy Information Administration’s reference case estimate from the 2014 Annual Energy Outlook of average annual electric requirements growth of 0.9 percent through 2040. http://www.eia.gov/forecasts/aeo/MT_electric.cfm.
Michigan Renewable Resource Assessment
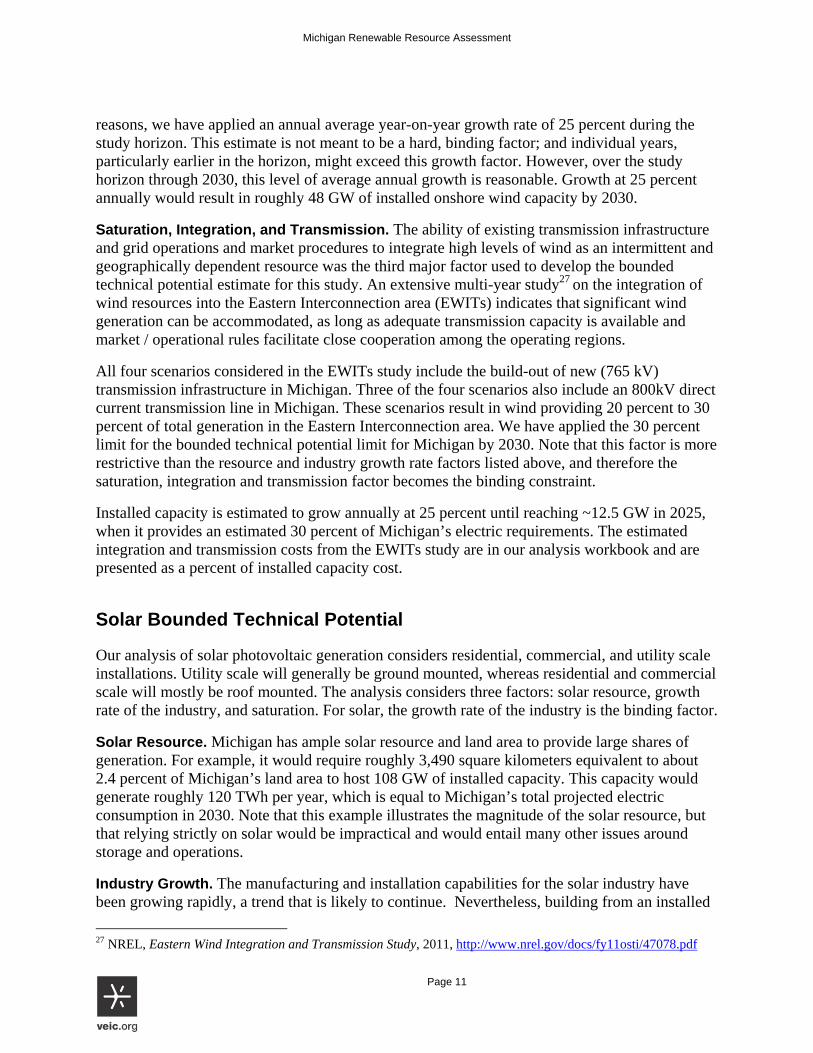
Page 11
reasons, we have applied an annual average year-on-year growth rate of 25 percent during the study horizon. This estimate is not meant to be a hard, binding factor; and individual years, particularly earlier in the horizon, might exceed this growth factor. However, over the study horizon through 2030, this level of average annual growth is reasonable. Growth at 25 percent annually would result in roughly 48 GW of installed onshore wind capacity by 2030.
Saturation, Integration, and Transmission. The ability of existing transmission infrastructure and grid operations and market procedures to integrate high levels of wind as an intermittent and geographically dependent resource was the third major factor used to develop the bounded technical potential estimate for this study. An extensive multi-year study27 on the integration of wind resources into the Eastern Interconnection area (EWITs) indicates that significant wind generation can be accommodated, as long as adequate transmission capacity is available and market / operational rules facilitate close cooperation among the operating regions.
All four scenarios considered in the EWITs study include the build-out of new (765 kV) transmission infrastructure in Michigan. Three of the four scenarios also include an 800kV direct current transmission line in Michigan. These scenarios result in wind providing 20 percent to 30 percent of total generation in the Eastern Interconnection area. We have applied the 30 percent limit for the bounded technical potential limit for Michigan by 2030. Note that this factor is more restrictive than the resource and industry growth rate factors listed above, and therefore the saturation, integration and transmission factor becomes the binding constraint.
Installed capacity is estimated to grow annually at 25 percent until reaching ~12.5 GW in 2025, when it provides an estimated 30 percent of Michigan’s electric requirements. The estimated integration and transmission costs from the EWITs study are in our analysis workbook and are presented as a percent of installed capacity cost.
Solar Bounded Technical Potential
Our analysis of solar photovoltaic generation considers residential, commercial, and utility scale installations. Utility scale will generally be ground mounted, whereas residential and commercial scale will mostly be roof mounted. The analysis considers three factors: solar resource, growth rate of the industry, and saturation. For solar, the growth rate of the industry is the binding factor.
Solar Resource. Michigan has ample solar resource and land area to provide large shares of generation. For example, it would require roughly 3,490 square kilometers equivalent to about 2.4 percent of Michigan’s land area to host 108 GW of installed capacity. This capacity would generate roughly 120 TWh per year, which is equal to Michigan’s total projected electric consumption in 2030. Note that this example illustrates the magnitude of the solar resource, but that relying strictly on solar would be impractical and would entail many other issues around storage and operations.
Industry Growth. The manufacturing and installation capabilities for the solar industry have been growing rapidly, a trend that is likely to continue. Nevertheless, building from an installed
27 NREL, Eastern Wind Integration and Transmission Study, 2011, http://www.nrel.gov/docs/fy11osti/47078.pdf

Michigan Renewable Resource Assessment
Page 12
solar capacity of a bit more than 20 MW in 2014, our analysis applied an average annual year-on-year growth rate of 40 percent for the study horizon. At this rate, installed capacity would increase to 5,009 MW by 2030, a total growth factor of more than 217 times in the coming fifteen years. Although the growth rate in individual years, particularly early in the horizon, might far exceed the average annual 40 percent rate, the estimate is reasonable for the study horizon.
Saturation and Integration. The ability to integrate high levels of solar as an intermittent and widely distributed resource was the third major factor considered in the bounded technical potential estimate. Given the industry growth limit discussed above, high saturation of solar is not expected to be a constraint during the study horizon.
The 5 GW of installed solar capacity resulting from a 40 percent average annual industry growth rate, would be expected to generate roughly 5.6 TWh annually. This represents less than 5 percent of the total expected electric requirements of 120 TWh.
An integration study conducted by NREL investigated a solar saturation of 27 percent of total annual energy consumption, and indicated that electricity supply could be balanced for every hour of the year in every region.28 Although saturations in some areas and on some distribution lines can be expected to be higher than the average, the overall requirements for integrating solar resources in Michigan is not projected to be a binding constraint.
Biomass Power Bounded Technical Potential
Our analysis considered central station generation of electricity with a direct-fired wood chip fueled boiler. In consultation with Commission staff and CESA, we determined this to be the biomass resource and technology of greatest interest for the current study. There are additional biomass resources such as wastewater, municipal solid waste, landfill gas and anaerobic digestion that also contribute to Michigan’s renewable energy potential.
Unlike wind and solar estimates discussed above, the biomass power bounded technical potential was limited by the estimated available biomass resource. The biomass estimates are derived from an NREL report29 that used county-level resource data and applied average heating values and conversion factors.
Once limits on the biomass resource are considered, the required average annual industry growth rate for installed biomass capacity is 12 percent. Therefore, the ability for the industry to grow is not a binding constraint. Since biomass plants can be operated as dispatchable resources, the concerns and limits on integration and saturation associated with intermittent wind and solar resources do not apply.
28 NREL, 2012. Grid Modeling for the Sun Shot Vision Study. www.nrel.gov/docs/53310.pdf. February, 2012. 29 Lopez, A., B. Roberts, D. Heimiller, N. Blair, and G. Porro. 2012. U.S. renewable energy technical potentials: A GIS-based analysis. Golden, CO: National Renewable Energy Laboratory. http://www.nrel.gov/docs/fy12osti/51946.pdf
Michigan Renewable Resource Assessment
Page 13
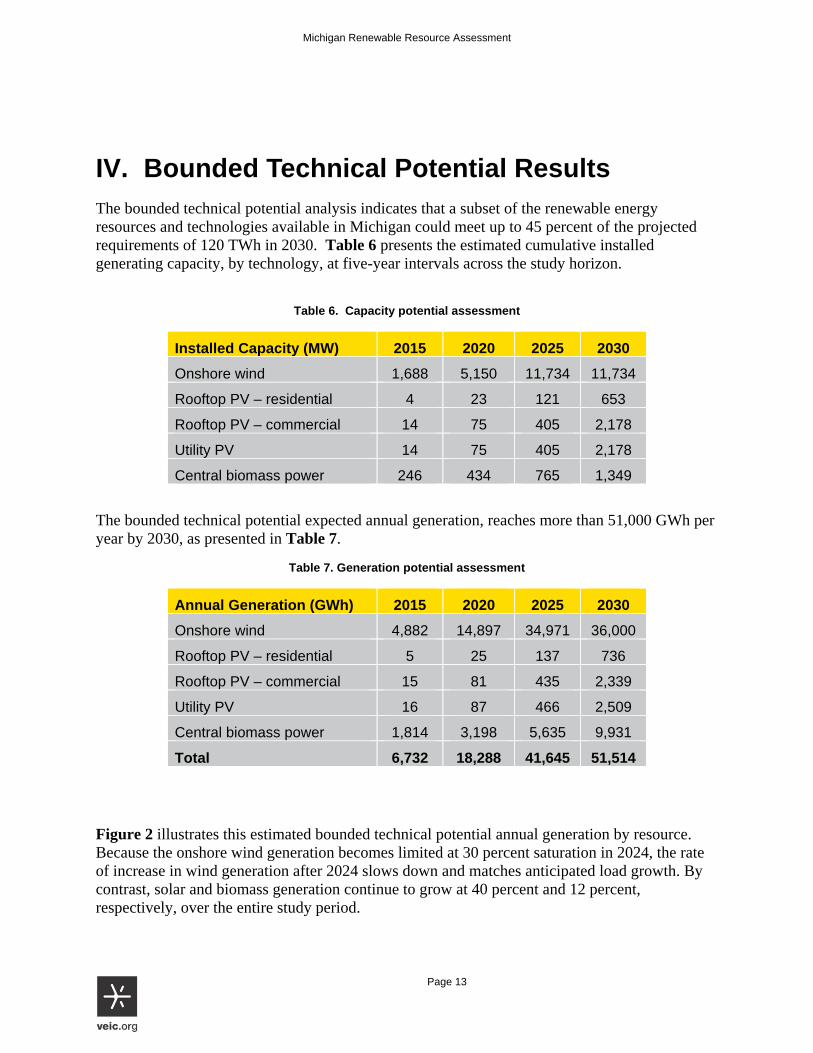
IV. Bounded Technical Potential Results The bounded technical potential analysis indicates that a subset of the renewable energy resources and technologies available in Michigan could meet up to 45 percent of the projected requirements of 120 TWh in 2030. Table 6 presents the estimated cumulative installed generating capacity, by technology, at five-year intervals across the study horizon.
Table 6. Capacity potential assessment
Installed Capacity (MW) 2015 2020 2025 2030
Onshore wind 1,688 5,150 11,734 11,734
Rooftop PV – residential 4 23 121 653
Rooftop PV – commercial 14 75 405 2,178
Utility PV 14 75 405 2,178
Central biomass power 246 434 765 1,349
The bounded technical potential expected annual generation, reaches more than 51,000 GWh per year by 2030, as presented in Table 7.
Table 7. Generation potential assessment
Annual Generation (GWh) 2015 2020 2025 2030
Onshore wind 4,882 14,897 34,971 36,000
Rooftop PV – residential 5 25 137 736
Rooftop PV – commercial 15 81 435 2,339
Utility PV 16 87 466 2,509
Central biomass power 1,814 3,198 5,635 9,931
Total 6,732 18,288 41,645 51,514
Figure 2 illustrates this estimated bounded technical potential annual generation by resource. Because the onshore wind generation becomes limited at 30 percent saturation in 2024, the rate of increase in wind generation after 2024 slows down and matches anticipated load growth. By contrast, solar and biomass generation continue to grow at 40 percent and 12 percent, respectively, over the entire study period.

Michigan Renewable Resource Assessment
Page 14
Figure 2. Bounded technical potential annual generation, in gigawatt-hours.

Michigan Renewable Resource Assessment
Page 15
Figure 3 illustrates how the bounded technical potential generation estimate for the wind, solar and biomass resources can help meet the requirements of an expanded renewable portfolio standard. The expanded standard increases 1 percent per year, based on retail sales, starting at 10 percent in 2015 and reaching 25 percent in 2030.30
Figure 3. Comparison of expanded RPS to bound technical potential for selected resources, by year, in terms of annual gigawatt-hours.
Comparing the bounded potential generation estimate to the requirements for an expanded RPS indicates that the available onshore wind, solar, and biomass power resources are sufficient to meet a significant portion of an expanded requirement in the near term. Other existing eligible resources (hydropower, landfill gas, anaerobic digesters, and municipal solid waste) can also be used to meet an expanded RPS requirement. In later years, from 2020 forward, the onshore wind, solar, and central biomass power resources alone are sufficient to meet the expanded RPS requirements.
30 Note that other eligible resources (hydropower, landfill gas, and municipal solid waste) are available to meet the total RPS requirement. If Michigan includes these resources, the state has sufficient renewable resources to exceed and expanded RPS in all years.

Michigan Renewable Resource Assessment
Page 16
V. Limitations, Caveats, and Further Research The scope of this study was defined not to assess or address all possible renewable resources, nor does it address all possible conversion technologies. It is by necessity a high-level assessment, and it is not a full potential study.
Although we consider individual saturation limits for onshore wind and solar, we do not make a detailed analysis on how much solar and wind can be integrated in grid operations. We also do not assess possible impacts from: curtailment, the need for storage, and/or further investments in transmission, distribution, and control systems.
The cost and performance profiles in this report, however, can be used to inform further analysis of the economic potential for renewable resources in Michigan. The results of such an analysis will be influenced by the profiles of renewable energy resources presented here, and on assumptions concerning non-renewable fuel costs, conversion technologies, and any costs assigned to carbon and other externalities.

Michigan Renewable Resource Assessment
Page 17
Appendix A: Cost and Performance Profiles Workbook Please see the attached spreadsheet: MI Renewable Assessment Workbook.xlsx.
http://michigan.gov/documents/mpsc/MI_Renewable_Assessment_Workbook_487861_7.xlsx
Michigan Renewable Resource Assessment
Page 18
Appendix B: References AWS 2014 Q3 Market Report. http://awea.files.cms-plus.com/FileDownloads/pdfs/3Q2014%20AWEA%20Market%20Report%20Public%20Version.pdf Black & Veatch, Cost and Performance Data for Power Generation Technologies, 2012. http://bv.com/docs/reports-studies/nrel-cost-report.pdf GlobalData, Wind Power, Update 2014 - Global Market Size, Average Price, Competitive Landscape, and Key Country Analysis to 2020. http://www.windpowermonthly.com/article/1207731/wind-power-growth-2006-2012 Lopez, A., B. Roberts, D. Heimiller, N. Blair, and G. Porro. 2012. U.S. renewable energy technical potentials: A GIS-based analysis. Golden, CO: National Renewable Energy Laboratory. http://www.nrel.gov/docs/fy12osti/51946.pdf Michigan Biomass, An Overview of Biomass Power in Michigan, Table 1, 2013. http://michiganbiomass.com/docs/BiomassWhitepaper2013.pdf MI PSC, Implementation of the P.A. 295 Renewable Energy Standards and the Cost-Effectiveness of the Energy Standards, 2014, http://www.michigan.gov/documents/mpsc/pa295report_447680_7.pdf MI PSC, Net Metering and Solar Pilot Program Report, Table 3, 2014. http://www.michigan.gov/documents/mpsc/netmetering_report_2013_464591_7.pdf NREL, AWS Truewind, 80m, 30% CF Wind Potential, 2014. http://apps2.eere.energy.gov/wind/windexchange/docs/wind_potential.xls NREL, Cost and Performance Assumptions for Modeling Electricity Generation Technologies, (2010) Table 11, NREL-SEAC, http://www.nrel.gov/docs/fy11osti/48595.pdf NREL, Eastern Wind Integration and Transmission Study, 2011, http://www.nrel.gov/docs/fy11osti/47078.pdf NREL, Photovoltaic Degradation Rates – An Analytical Review, 2012, http://www.nrel.gov/docs/fy12osti/51664.pdf NREL, PVWatts. http://rredc.nrel.gov/solar/calculators/pvwatts/version1/US/Michigan/Detroit.html NREL, Renewable Electricity Futures Study Vol. 1, 2012 SEIA, Q3 Solar Market Insight, 2014. http://www.seia.org/research-resources/solar-market-insight-report-2014-q3 Transparent Cost Database, Open Energy Information (en), Historical reports for installations 2010-2014. http://en.openei.org/apps/TCDB/ Transparent Cost Database, Open Energy Information (en), Future Projections. http://en.openei.org/apps/TCDB/ Union of Concerned Scientists, Charting Michigan's Renewable Energy Future, 2014. http://www.ucsusa.org/assets/documents/clean_energy/Charting-Michigan-s-Renewable-Energy-Future.pdf

Michigan Renewable Resource Assessment
Page 19
Appendix C: Additional Material
Onshore Wind Capacity Factors
Table 2 estimates fleet average annual capacity factors for onshore wind generation. At the most favorable sites, new generation might exceed these values, and in Michigan capacity factors for onshore wind that exceed 40 percent have been reported. Figure C1 from the Eastern Wind Integration study illustrates a distribution of expected capacity factors.

Michigan Renewable Resource Assessment
Page 20
Figure C1. Eastern Wind Integration study illustrates a distribution of expected capacity factors.