michigan public school employees...valuation report issued march 6, 2018. this presentation should...
TRANSCRIPT

Copyright © 2018 GRS – All rights reserved.
Michigan Public School Employees
Retiree Health Actuarial Valuation Results as of September 30, 2017
Retiree Health BenefitsThe Funding Issue
• Unlike pensions, health benefits have not been pre-funded for a long period of time
– Most plan sponsors nationwide have not pre-funded health benefits either
– Currently very little investment income to help pay benefits
• Costs rise as more members retire, and health inflation outpaces general inflation
• Pre-funding contributions have been calculated since 1999 – but pre-funding started only recently
2

Full Funding Employer Contribution
• Reported that full funding for MPSERS began in fiscal year (FY) 2013
• September 30, 2017 valuation establishes the required employer contribution for FY 2020
• Reflects 3% of payroll active member contributions required to participate in the defined benefit retiree health program
• Reflects plan changes resulting from Public Act 300 of 2012
• Reflects investment return assumption that was lowered from 7.50% to 7.15% in accordance with the recently adopted Dedicated Gains Policy
3
Governmental Accounting Standards Board
• Beginning with the 2007 CAFR, GASB Statements No. 43 and No. 45 specified how retiree health benefit liabilities and expenses were reported in financial statements– One annual valuation report for accounting and funding
purposes
• GASB Statement No. 74 became effective for the plan for the fiscal year ending September 30, 2017– Results are based upon:
� the September 30, 2016 actuarial valuation results “rolled-forward” to the September 30, 2017 measurement date
� the investment return assumption prior to the change resulting from the Dedicated Gains Policy (i.e., 7.50%)
– A separate report was issued December 21, 2017 containing the September 30, 2017 annual valuation for accounting purposes
4
Retiree Health Valuation ResultsFull Actuarial Funding
• FY 2017 expenditures for employer paid retiree health care benefits (i.e., excludes retiree paid premiums):– $ 702.2 million
� Also, $553.8 million in refunds of employee contributions collected prior to PA 300 paid out in FY 2018 but reflected in the FY 2017 financials
• FY 2017 contributions for retiree health care benefits:– $ 794.7 million – Employer contributions (includes
other governmental contributions)
– $ 214.2 million – Employee contributions
5
Above reported amounts from the MPSERS 2017 Comprehensive Annual Financial Report.

Actuarially Computed Employer ContributionFY 2020 ($ in Millions)
6
• Actuarially computed employer contribution for FYE
September 30, 2020:
• Once fully funded, the annual employer contribution
requirement decreases to the normal cost
Employer Normal Cost $ 34.2
Amortization of UAAL1
604.2
Actuarially Computed
Employer Contribution $ 638.4
FY 2020
1 Unfunded Actuarial Accrued Liabilities (UAAL) were amortized over 19 years from October 1, 2019.

Actuarial Gain/(Loss) ($ in Millions)
7
1. Premiums. Gains and losses resulting from
actual premiums in valuation year versus
that assumed from prior valuation. $ 1,434.4
2. Investment Income. If there is greater
investment income than assumed, there is a
gain. If less income, a loss. 259.5
3. Demographic and Other. Gains and losses
resulting from demographic experience,
data adjustments, timing of financial
transactions, etc. 67.1
4. Composite Gain/(Loss) During Year. $ 1,761.0
Gain/(Loss)

Circumstances That Would Increase Projected Costs
• Medicare funding reductions or cost shifting
• Unexpected new benefit recipients (from health benefit cutbacks of
other employers)
• Medical inflation worse than assumed; the actual future
contributions will depend on future per capita health cost increases
(health inflation)*
• Active member population decline (contribution rates as a
percentage of payroll would increase)
• Lower than expected investment returns; bigger impact as plan
assets grow
• This is not a complete list
8
* Per capita costs are projected to increase 7.5% the first year, graded down to 3.5% in the twelfth and
later years.
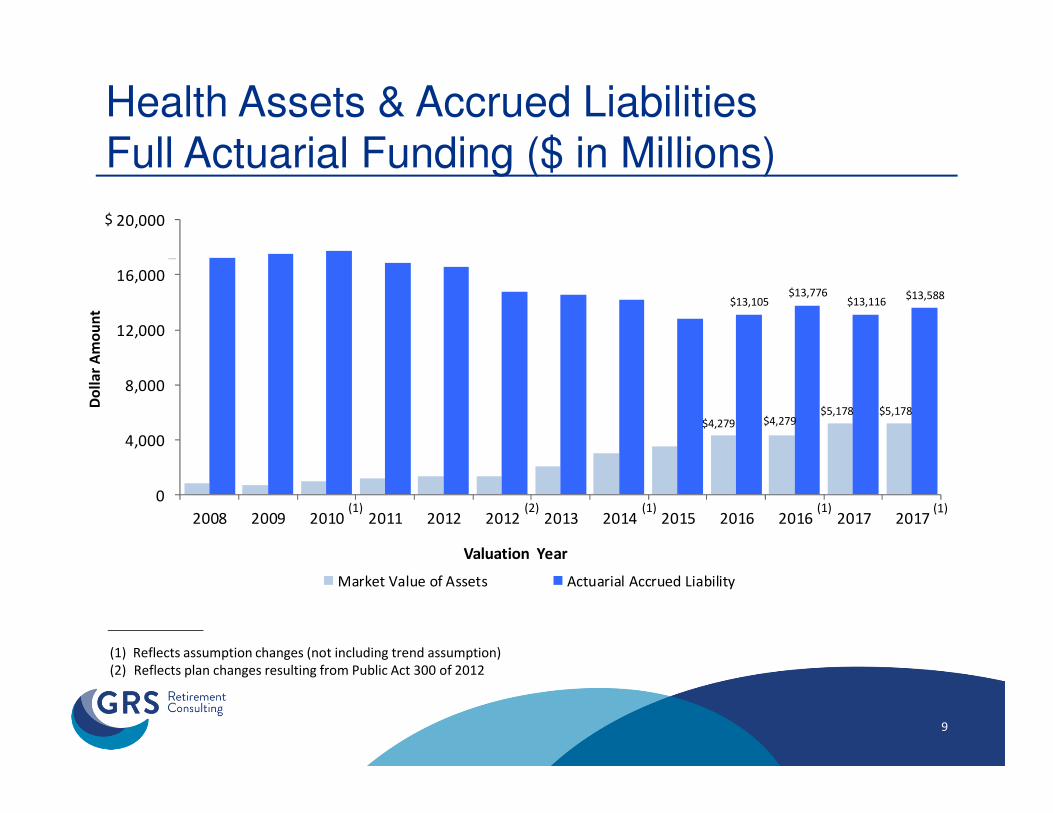
Health Assets & Accrued Liabilities Full Actuarial Funding ($ in Millions)
9
$4,279 $4,279$5,178 $5,178
$13,105$13,776
$13,116$13,588
0
4,000
8,000
12,000
16,000
20,000
2008 2009 2010 2011 2012 2012 2013 2014 2015 2016 2016 2017 2017
Valuation Year
Market Value of Assets Actuarial Accrued Liability
Do
lla
r A
mo
un
t
(1) Reflects assumption changes (not including trend assumption)
(2) Reflects plan changes resulting from Public Act 300 of 2012
(1)
$
(1) (2) (1) (1)
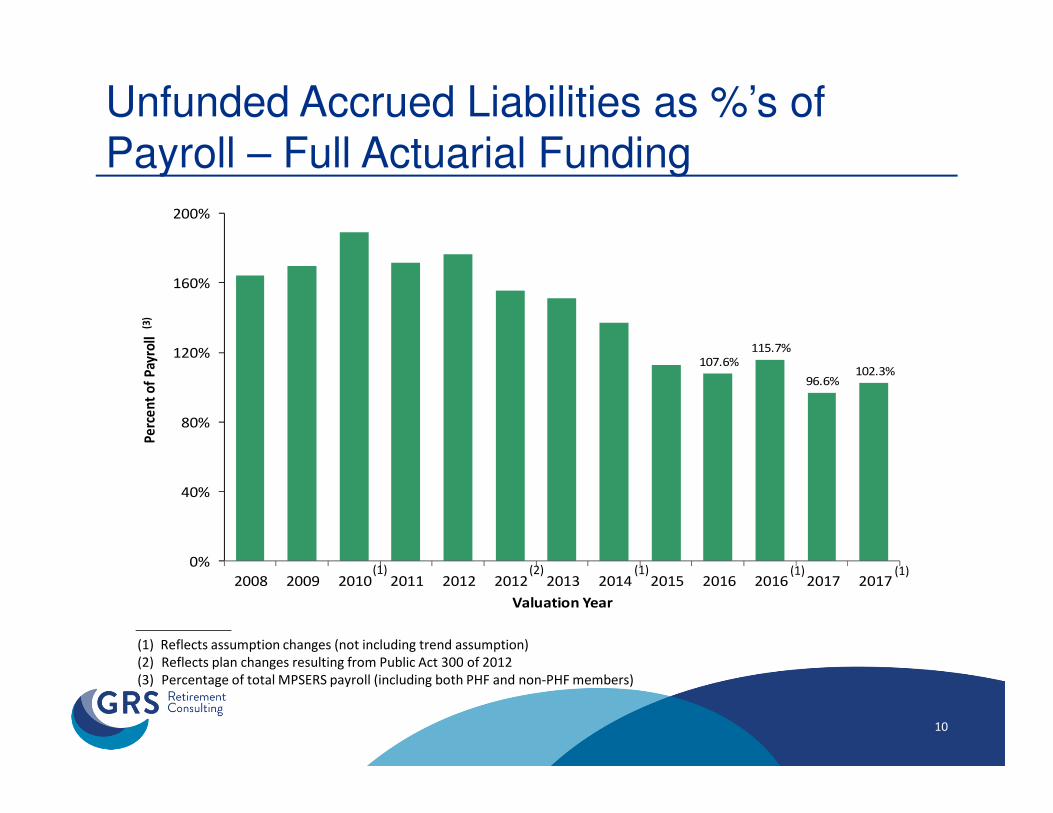
Unfunded Accrued Liabilities as %’s of Payroll – Full Actuarial Funding
107.6%115.7%
96.6%102.3%
0%
40%
80%
120%
160%
200%
2008 2009 2010 2011 2012 2012 2013 2014 2015 2016 2016 2017 2017
Pe
rce
nt
of
Pay
roll
(3)
Valuation Year
10
(1) Reflects assumption changes (not including trend assumption)
(2) Reflects plan changes resulting from Public Act 300 of 2012
(3) Percentage of total MPSERS payroll (including both PHF and non-PHF members)
(1)(1) (2) (1) (1)

Required Employer Contributions as Percents of Payroll (Full Actuarial Funding)
11
0.36% 0.31%0.52%0.07%
7.31%7.57%
6.43% 6.65%
0%
5%
10%
15%
20%
2008 2009 2010 2011 2012 2013 2014 2015 2016 2016 2017 2017
Empl
oyer
Con
trib
utio
n %
(3)
Valuation Year
Amortization Payments Normal Cost
(1) Reflects assumption changes (not including trend assumption)
(2) Reflects plan changes resulting from Public Act 300 of 2012
(3) Starting with the 2012 valuation year, (a) the normal cost is expressed as a percentage of non-PHF active member payroll, (b) the
Amortization Payment is expressed as a percentage of total MPSERS active member payroll (including PHF and non-PHF), and (c) the
required employer contribution is for the fiscal year beginning two years after the valuation date
(1) (1)(1) (2) (1)

Funded Percent
12
32.7%31.1%
39.5% 38.1%
0%
10%
20%
30%
40%
50%
2012 2013 2014 2015 2016 2016 2017 2017
Fun
ded
%
Valuation Year
(1) Reflects assumption changes (not including trend assumption)
(1) (1) (1)
Disclaimers
• This presentation is intended to be used in conjunction with the September 30, 2017 retiree health actuarial valuation report issued March 6, 2018. This presentation should not be relied on for any purpose other than the purpose described in the valuation report.
• This presentation shall not be construed to provide tax advice, legal advice or investment advice.
• The actuaries submitting this presentation (Mita Drazilov and Louise Gates) are Members of the American Academy of Actuaries and meet the Qualification Standards of the American Academy of Actuaries to render the actuarial opinions contained herein.
13