michigan department of treasury · local unit summary county local unit name prosperity region...
TRANSCRIPT

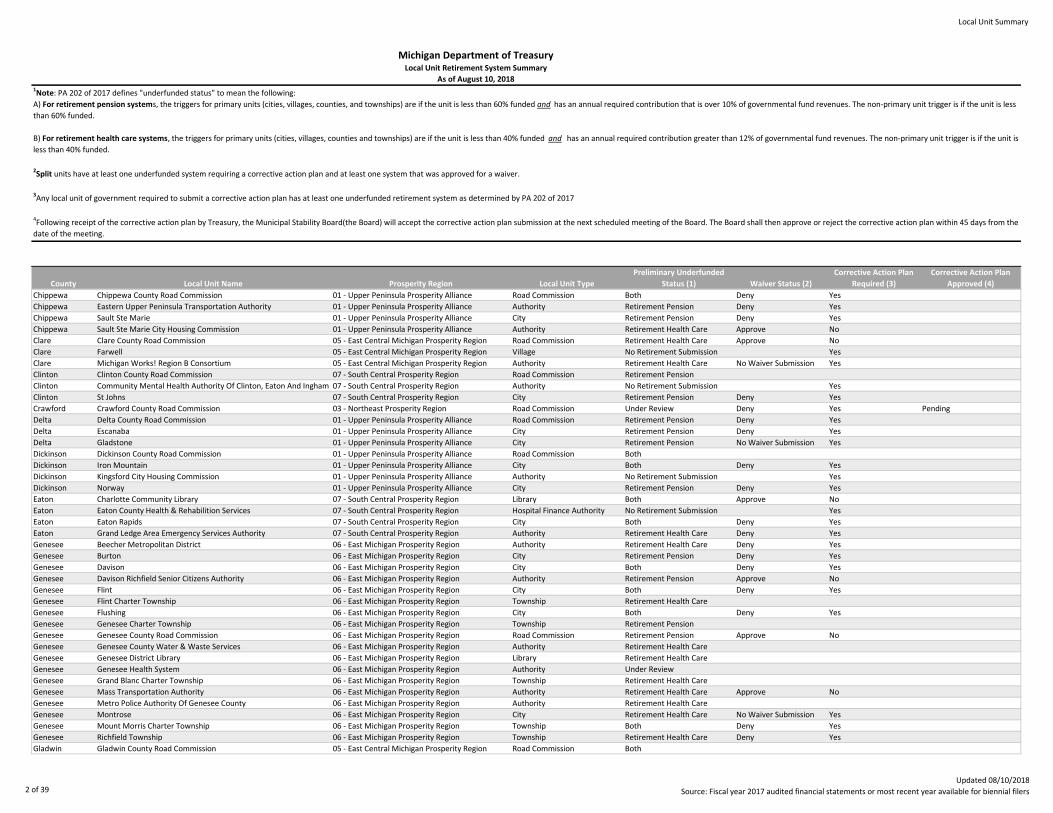
Local Unit Summary
County Local Unit Name Prosperity Region Local Unit Type
Preliminary Underfunded
Status (1) Waiver Status (2)
Corrective Action Plan
Required (3)
Corrective Action Plan
Approved (4)
Alger Alger County Road Commission 01 - Upper Peninsula Prosperity Alliance Road Commission Retirement Health Care
Allegan Allegan County Road Commission 04 - West Michigan Prosperity Alliance Road Commission Retirement Pension
Allegan Kalamazoo Lake Sewer And Water Authority 04 - West Michigan Prosperity Alliance Authority No Retirement Submission Yes
Alpena Alpena City Housing Commission 03 - Northeast Prosperity Region Authority Under Review
Alpena Alpena County Road Commission 03 - Northeast Prosperity Region Road Commission Retirement Health Care Under Review Pending Review
Alpena District Health Department No. 4 03 - Northeast Prosperity Region Authority Under Review
Antrim Antrim County Road Commission 02 - Northwest Prosperity Region Road Commission Both
Arenac Arenac County Road Commission 05 - East Central Michigan Prosperity Region Road Commission Retirement Pension
Baraga Baraga 01 - Upper Peninsula Prosperity Alliance Village Retirement Pension Deny Yes
Baraga Baraga County Memorial Hospital 01 - Upper Peninsula Prosperity Alliance Authority Under Review
Baraga Baraga County Road Commission 01 - Upper Peninsula Prosperity Alliance Road Commission Both Approve No
Baraga Copper Country Community Mental Health Services Board 01 - Upper Peninsula Prosperity Alliance Authority Retirement Health Care No Waiver Submission Yes
Baraga L'anse 01 - Upper Peninsula Prosperity Alliance Village Retirement Pension Deny Yes
Barry Barry County Road Commission 04 - West Michigan Prosperity Alliance Road Commission Retirement Health Care
Barry Barry County Transit 04 - West Michigan Prosperity Alliance Authority No Retirement Submission Yes
Barry Hastings 04 - West Michigan Prosperity Alliance City Retirement Health Care Deny Yes
Bay Bay City 05 - East Central Michigan Prosperity Region City Retirement Health Care Deny Yes
Bay Bay City Housing Commission 05 - East Central Michigan Prosperity Region Authority No Retirement Submission Yes
Bay Bay County 05 - East Central Michigan Prosperity Region County Under Review
Bay Bay County Department Of Water & Sewer 05 - East Central Michigan Prosperity Region Authority Retirement Health Care
Bay Bay County Library System 05 - East Central Michigan Prosperity Region Library Under Review
Bay Bay County Road Commission 05 - East Central Michigan Prosperity Region Road Commission Retirement Health Care
Bay Bay Metropolitan Transportation Authority 05 - East Central Michigan Prosperity Region Authority Both No Waiver Submission Yes
Bay Essexville 05 - East Central Michigan Prosperity Region City Retirement Health Care Deny Yes
Bay Hampton Township 05 - East Central Michigan Prosperity Region Township Retirement Health Care
Benzie Benzie County 02 - Northwest Prosperity Region County No Retirement Submission Yes
Benzie Benzie County Road Commission 02 - Northwest Prosperity Region Road Commission Retirement Pension Deny Yes
Berrien Benton Harbor 08 - Southwest Prosperity Region City Retirement Pension Deny Yes
Branch Branch County Road Commission 08 - Southwest Prosperity Region Road Commission Retirement Health Care
Branch Maple Lawn Medical Care Facility 08 - Southwest Prosperity Region Authority Under Review
Branch Union City 08 - Southwest Prosperity Region Village Retirement Health Care No Waiver Submission Yes
Calhoun Battle Creek 08 - Southwest Prosperity Region City Retirement Pension Deny Yes
Calhoun Battle Creek City Housing Commission 08 - Southwest Prosperity Region Authority No Retirement Submission Yes
Calhoun Marshall 08 - Southwest Prosperity Region City Retirement Health Care Deny Yes
Calhoun Marshall District Library 08 - Southwest Prosperity Region Library Both Approve No
Cass Cass County Road Commission 08 - Southwest Prosperity Region Road Commission Retirement Health Care Deny Yes
Cass Dowagiac 08 - Southwest Prosperity Region City Retirement Pension Deny Yes
Charlevoix Boyne City Housing Commission 02 - Northwest Prosperity Region Authority Retirement Pension Approve No
Charlevoix Jordan Valley Emergency Medical Services Authority 02 - Northwest Prosperity Region Authority No Retirement Submission Yes
Cheboygan Cheboygan County Road Commission 03 - Northeast Prosperity Region Road Commission Both Under Review Pending Review
Chippewa Chippewa County Health Department 01 - Upper Peninsula Prosperity Alliance Authority Retirement Health Care
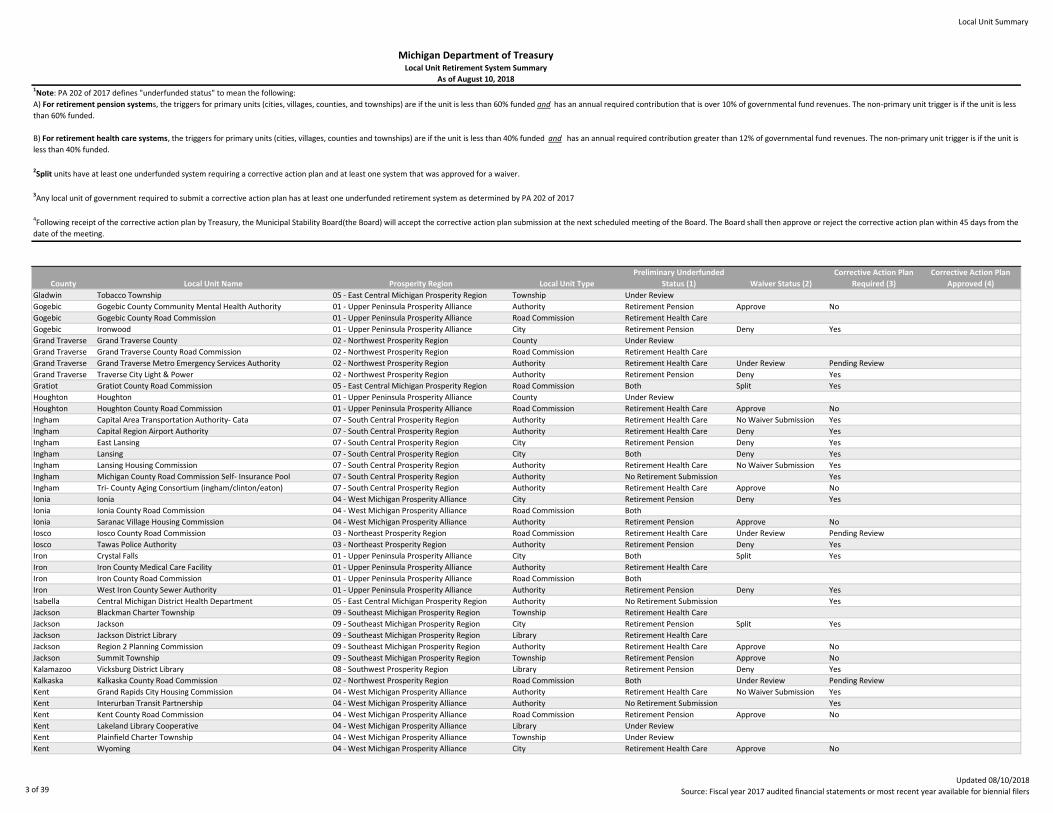
Michigan Department of TreasuryLocal Unit Retirement System Summary
As of August 10, 20181Note: PA 202 of 2017 defines "underfunded status" to mean the following:
A) For retirement pension systems, the triggers for primary units (cities, villages, counties, and townships) are if the unit is less than 60% funded and has an annual required contribution that is over 10% of governmental fund revenues. The non-primary unit trigger is if the unit is less
than 60% funded.
B) For retirement health care systems, the triggers for primary units (cities, villages, counties and townships) are if the unit is less than 40% funded and has an annual required contribution greater than 12% of governmental fund revenues. The non-primary unit trigger is if the unit is
less than 40% funded.
2Split units have at least one underfunded system requiring a corrective action plan and at least one system that was approved for a waiver.
3Any local unit of government required to submit a corrective action plan has at least one underfunded retirement system as determined by PA 202 of 2017
4Following receipt of the corrective action plan by Treasury, the Municipal Stability Board(the Board) will accept the corrective action plan submission at the next scheduled meeting of the Board. The Board shall then approve or reject the corrective action plan within 45 days from the
date of the meeting.
1 of 39Updated 08/10/2018
Source: Fiscal year 2017 audited financial statements or most recent year available for biennial filers
Local Unit Summary
County Local Unit Name Prosperity Region Local Unit Type
Preliminary Underfunded
Status (1) Waiver Status (2)
Corrective Action Plan
Required (3)
Corrective Action Plan
Approved (4)
Michigan Department of TreasuryLocal Unit Retirement System Summary
As of August 10, 20181Note: PA 202 of 2017 defines "underfunded status" to mean the following:
A) For retirement pension systems, the triggers for primary units (cities, villages, counties, and townships) are if the unit is less than 60% funded and has an annual required contribution that is over 10% of governmental fund revenues. The non-primary unit trigger is if the unit is less
than 60% funded.
B) For retirement health care systems, the triggers for primary units (cities, villages, counties and townships) are if the unit is less than 40% funded and has an annual required contribution greater than 12% of governmental fund revenues. The non-primary unit trigger is if the unit is
less than 40% funded.
2Split units have at least one underfunded system requiring a corrective action plan and at least one system that was approved for a waiver.
3Any local unit of government required to submit a corrective action plan has at least one underfunded retirement system as determined by PA 202 of 2017
4Following receipt of the corrective action plan by Treasury, the Municipal Stability Board(the Board) will accept the corrective action plan submission at the next scheduled meeting of the Board. The Board shall then approve or reject the corrective action plan within 45 days from the
date of the meeting.
Chippewa Chippewa County Road Commission 01 - Upper Peninsula Prosperity Alliance Road Commission Both Deny Yes
Chippewa Eastern Upper Peninsula Transportation Authority 01 - Upper Peninsula Prosperity Alliance Authority Retirement Pension Deny Yes
Chippewa Sault Ste Marie 01 - Upper Peninsula Prosperity Alliance City Retirement Pension Deny Yes
Chippewa Sault Ste Marie City Housing Commission 01 - Upper Peninsula Prosperity Alliance Authority Retirement Health Care Approve No
Clare Clare County Road Commission 05 - East Central Michigan Prosperity Region Road Commission Retirement Health Care Approve No
Clare Farwell 05 - East Central Michigan Prosperity Region Village No Retirement Submission Yes
Clare Michigan Works! Region B Consortium 05 - East Central Michigan Prosperity Region Authority Retirement Health Care No Waiver Submission Yes
Clinton Clinton County Road Commission 07 - South Central Prosperity Region Road Commission Retirement Pension
Clinton Community Mental Health Authority Of Clinton, Eaton And Ingham Counties07 - South Central Prosperity Region Authority No Retirement Submission Yes
Clinton St Johns 07 - South Central Prosperity Region City Retirement Pension Deny Yes
Crawford Crawford County Road Commission 03 - Northeast Prosperity Region Road Commission Under Review Deny Yes Pending
Delta Delta County Road Commission 01 - Upper Peninsula Prosperity Alliance Road Commission Retirement Pension Deny Yes
Delta Escanaba 01 - Upper Peninsula Prosperity Alliance City Retirement Pension Deny Yes
Delta Gladstone 01 - Upper Peninsula Prosperity Alliance City Retirement Pension No Waiver Submission Yes
Dickinson Dickinson County Road Commission 01 - Upper Peninsula Prosperity Alliance Road Commission Both
Dickinson Iron Mountain 01 - Upper Peninsula Prosperity Alliance City Both Deny Yes
Dickinson Kingsford City Housing Commission 01 - Upper Peninsula Prosperity Alliance Authority No Retirement Submission Yes
Dickinson Norway 01 - Upper Peninsula Prosperity Alliance City Retirement Pension Deny Yes
Eaton Charlotte Community Library 07 - South Central Prosperity Region Library Both Approve No
Eaton Eaton County Health & Rehabilition Services 07 - South Central Prosperity Region Hospital Finance Authority No Retirement Submission Yes
Eaton Eaton Rapids 07 - South Central Prosperity Region City Both Deny Yes
Eaton Grand Ledge Area Emergency Services Authority 07 - South Central Prosperity Region Authority Retirement Health Care Deny Yes
Genesee Beecher Metropolitan District 06 - East Michigan Prosperity Region Authority Retirement Health Care Deny Yes
Genesee Burton 06 - East Michigan Prosperity Region City Retirement Pension Deny Yes
Genesee Davison 06 - East Michigan Prosperity Region City Both Deny Yes
Genesee Davison Richfield Senior Citizens Authority 06 - East Michigan Prosperity Region Authority Retirement Pension Approve No
Genesee Flint 06 - East Michigan Prosperity Region City Both Deny Yes
Genesee Flint Charter Township 06 - East Michigan Prosperity Region Township Retirement Health Care
Genesee Flushing 06 - East Michigan Prosperity Region City Both Deny Yes
Genesee Genesee Charter Township 06 - East Michigan Prosperity Region Township Retirement Pension
Genesee Genesee County Road Commission 06 - East Michigan Prosperity Region Road Commission Retirement Pension Approve No
Genesee Genesee County Water & Waste Services 06 - East Michigan Prosperity Region Authority Retirement Health Care
Genesee Genesee District Library 06 - East Michigan Prosperity Region Library Retirement Health Care
Genesee Genesee Health System 06 - East Michigan Prosperity Region Authority Under Review
Genesee Grand Blanc Charter Township 06 - East Michigan Prosperity Region Township Retirement Health Care
Genesee Mass Transportation Authority 06 - East Michigan Prosperity Region Authority Retirement Health Care Approve No
Genesee Metro Police Authority Of Genesee County 06 - East Michigan Prosperity Region Authority Retirement Health Care
Genesee Montrose 06 - East Michigan Prosperity Region City Retirement Health Care No Waiver Submission Yes
Genesee Mount Morris Charter Township 06 - East Michigan Prosperity Region Township Both Deny Yes
Genesee Richfield Township 06 - East Michigan Prosperity Region Township Retirement Health Care Deny Yes
Gladwin Gladwin County Road Commission 05 - East Central Michigan Prosperity Region Road Commission Both
2 of 39Updated 08/10/2018
Source: Fiscal year 2017 audited financial statements or most recent year available for biennial filers
Local Unit Summary
County Local Unit Name Prosperity Region Local Unit Type
Preliminary Underfunded
Status (1) Waiver Status (2)
Corrective Action Plan
Required (3)
Corrective Action Plan
Approved (4)
Michigan Department of TreasuryLocal Unit Retirement System Summary
As of August 10, 20181Note: PA 202 of 2017 defines "underfunded status" to mean the following:
A) For retirement pension systems, the triggers for primary units (cities, villages, counties, and townships) are if the unit is less than 60% funded and has an annual required contribution that is over 10% of governmental fund revenues. The non-primary unit trigger is if the unit is less
than 60% funded.
B) For retirement health care systems, the triggers for primary units (cities, villages, counties and townships) are if the unit is less than 40% funded and has an annual required contribution greater than 12% of governmental fund revenues. The non-primary unit trigger is if the unit is
less than 40% funded.
2Split units have at least one underfunded system requiring a corrective action plan and at least one system that was approved for a waiver.
3Any local unit of government required to submit a corrective action plan has at least one underfunded retirement system as determined by PA 202 of 2017
4Following receipt of the corrective action plan by Treasury, the Municipal Stability Board(the Board) will accept the corrective action plan submission at the next scheduled meeting of the Board. The Board shall then approve or reject the corrective action plan within 45 days from the
date of the meeting.
Gladwin Tobacco Township 05 - East Central Michigan Prosperity Region Township Under Review
Gogebic Gogebic County Community Mental Health Authority 01 - Upper Peninsula Prosperity Alliance Authority Retirement Pension Approve No
Gogebic Gogebic County Road Commission 01 - Upper Peninsula Prosperity Alliance Road Commission Retirement Health Care
Gogebic Ironwood 01 - Upper Peninsula Prosperity Alliance City Retirement Pension Deny Yes
Grand Traverse Grand Traverse County 02 - Northwest Prosperity Region County Under Review
Grand Traverse Grand Traverse County Road Commission 02 - Northwest Prosperity Region Road Commission Retirement Health Care
Grand Traverse Grand Traverse Metro Emergency Services Authority 02 - Northwest Prosperity Region Authority Retirement Health Care Under Review Pending Review
Grand Traverse Traverse City Light & Power 02 - Northwest Prosperity Region Authority Retirement Pension Deny Yes
Gratiot Gratiot County Road Commission 05 - East Central Michigan Prosperity Region Road Commission Both Split Yes
Houghton Houghton 01 - Upper Peninsula Prosperity Alliance County Under Review
Houghton Houghton County Road Commission 01 - Upper Peninsula Prosperity Alliance Road Commission Retirement Health Care Approve No
Ingham Capital Area Transportation Authority- Cata 07 - South Central Prosperity Region Authority Retirement Health Care No Waiver Submission Yes
Ingham Capital Region Airport Authority 07 - South Central Prosperity Region Authority Retirement Health Care Deny Yes
Ingham East Lansing 07 - South Central Prosperity Region City Retirement Pension Deny Yes
Ingham Lansing 07 - South Central Prosperity Region City Both Deny Yes
Ingham Lansing Housing Commission 07 - South Central Prosperity Region Authority Retirement Health Care No Waiver Submission Yes
Ingham Michigan County Road Commission Self- Insurance Pool 07 - South Central Prosperity Region Authority No Retirement Submission Yes
Ingham Tri- County Aging Consortium (ingham/clinton/eaton) 07 - South Central Prosperity Region Authority Retirement Health Care Approve No
Ionia Ionia 04 - West Michigan Prosperity Alliance City Retirement Pension Deny Yes
Ionia Ionia County Road Commission 04 - West Michigan Prosperity Alliance Road Commission Both
Ionia Saranac Village Housing Commission 04 - West Michigan Prosperity Alliance Authority Retirement Pension Approve No
Iosco Iosco County Road Commission 03 - Northeast Prosperity Region Road Commission Retirement Health Care Under Review Pending Review
Iosco Tawas Police Authority 03 - Northeast Prosperity Region Authority Retirement Pension Deny Yes
Iron Crystal Falls 01 - Upper Peninsula Prosperity Alliance City Both Split Yes
Iron Iron County Medical Care Facility 01 - Upper Peninsula Prosperity Alliance Authority Retirement Health Care
Iron Iron County Road Commission 01 - Upper Peninsula Prosperity Alliance Road Commission Both
Iron West Iron County Sewer Authority 01 - Upper Peninsula Prosperity Alliance Authority Retirement Pension Deny Yes
Isabella Central Michigan District Health Department 05 - East Central Michigan Prosperity Region Authority No Retirement Submission Yes
Jackson Blackman Charter Township 09 - Southeast Michigan Prosperity Region Township Retirement Health Care
Jackson Jackson 09 - Southeast Michigan Prosperity Region City Retirement Pension Split Yes
Jackson Jackson District Library 09 - Southeast Michigan Prosperity Region Library Retirement Health Care
Jackson Region 2 Planning Commission 09 - Southeast Michigan Prosperity Region Authority Retirement Health Care Approve No
Jackson Summit Township 09 - Southeast Michigan Prosperity Region Township Retirement Pension Approve No
Kalamazoo Vicksburg District Library 08 - Southwest Prosperity Region Library Retirement Pension Deny Yes
Kalkaska Kalkaska County Road Commission 02 - Northwest Prosperity Region Road Commission Both Under Review Pending Review
Kent Grand Rapids City Housing Commission 04 - West Michigan Prosperity Alliance Authority Retirement Health Care No Waiver Submission Yes
Kent Interurban Transit Partnership 04 - West Michigan Prosperity Alliance Authority No Retirement Submission Yes
Kent Kent County Road Commission 04 - West Michigan Prosperity Alliance Road Commission Retirement Pension Approve No
Kent Lakeland Library Cooperative 04 - West Michigan Prosperity Alliance Library Under Review
Kent Plainfield Charter Township 04 - West Michigan Prosperity Alliance Township Under Review
Kent Wyoming 04 - West Michigan Prosperity Alliance City Retirement Health Care Approve No
3 of 39Updated 08/10/2018
Source: Fiscal year 2017 audited financial statements or most recent year available for biennial filers
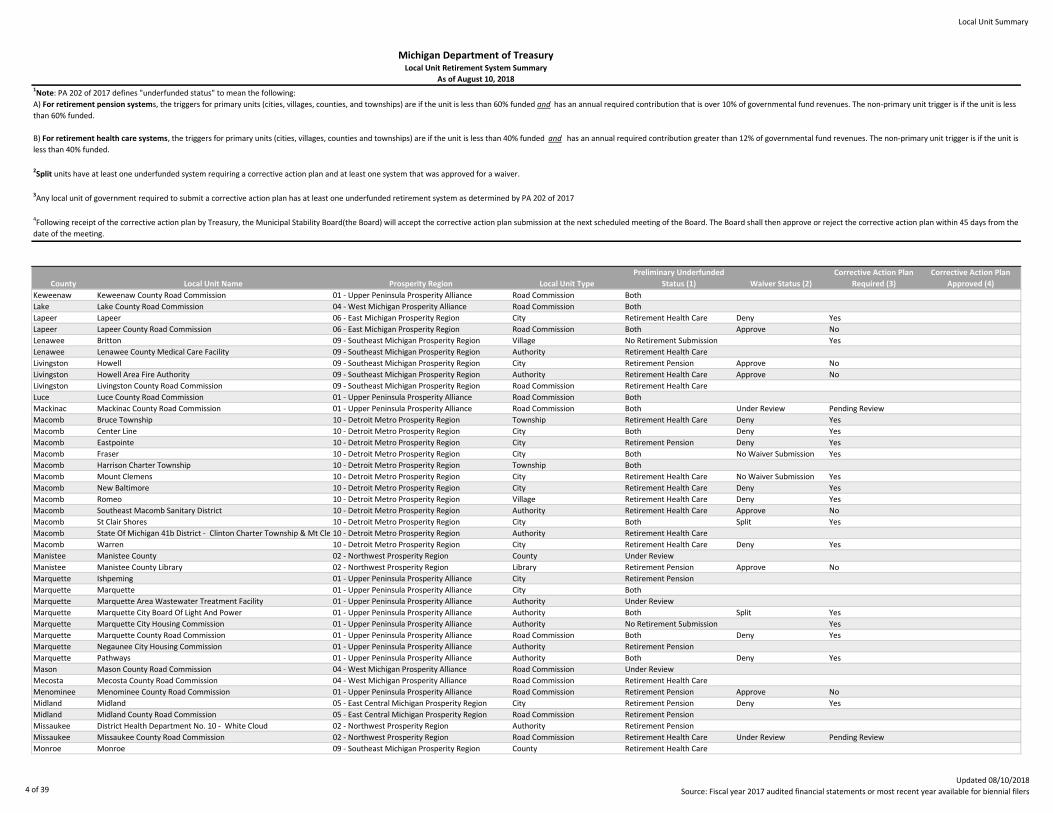
Local Unit Summary
County Local Unit Name Prosperity Region Local Unit Type
Preliminary Underfunded
Status (1) Waiver Status (2)
Corrective Action Plan
Required (3)
Corrective Action Plan
Approved (4)
Michigan Department of TreasuryLocal Unit Retirement System Summary
As of August 10, 20181Note: PA 202 of 2017 defines "underfunded status" to mean the following:
A) For retirement pension systems, the triggers for primary units (cities, villages, counties, and townships) are if the unit is less than 60% funded and has an annual required contribution that is over 10% of governmental fund revenues. The non-primary unit trigger is if the unit is less
than 60% funded.
B) For retirement health care systems, the triggers for primary units (cities, villages, counties and townships) are if the unit is less than 40% funded and has an annual required contribution greater than 12% of governmental fund revenues. The non-primary unit trigger is if the unit is
less than 40% funded.
2Split units have at least one underfunded system requiring a corrective action plan and at least one system that was approved for a waiver.
3Any local unit of government required to submit a corrective action plan has at least one underfunded retirement system as determined by PA 202 of 2017
4Following receipt of the corrective action plan by Treasury, the Municipal Stability Board(the Board) will accept the corrective action plan submission at the next scheduled meeting of the Board. The Board shall then approve or reject the corrective action plan within 45 days from the
date of the meeting.
Keweenaw Keweenaw County Road Commission 01 - Upper Peninsula Prosperity Alliance Road Commission Both
Lake Lake County Road Commission 04 - West Michigan Prosperity Alliance Road Commission Both
Lapeer Lapeer 06 - East Michigan Prosperity Region City Retirement Health Care Deny Yes
Lapeer Lapeer County Road Commission 06 - East Michigan Prosperity Region Road Commission Both Approve No
Lenawee Britton 09 - Southeast Michigan Prosperity Region Village No Retirement Submission Yes
Lenawee Lenawee County Medical Care Facility 09 - Southeast Michigan Prosperity Region Authority Retirement Health Care
Livingston Howell 09 - Southeast Michigan Prosperity Region City Retirement Pension Approve No
Livingston Howell Area Fire Authority 09 - Southeast Michigan Prosperity Region Authority Retirement Health Care Approve No
Livingston Livingston County Road Commission 09 - Southeast Michigan Prosperity Region Road Commission Retirement Health Care
Luce Luce County Road Commission 01 - Upper Peninsula Prosperity Alliance Road Commission Both
Mackinac Mackinac County Road Commission 01 - Upper Peninsula Prosperity Alliance Road Commission Both Under Review Pending Review
Macomb Bruce Township 10 - Detroit Metro Prosperity Region Township Retirement Health Care Deny Yes
Macomb Center Line 10 - Detroit Metro Prosperity Region City Both Deny Yes
Macomb Eastpointe 10 - Detroit Metro Prosperity Region City Retirement Pension Deny Yes
Macomb Fraser 10 - Detroit Metro Prosperity Region City Both No Waiver Submission Yes
Macomb Harrison Charter Township 10 - Detroit Metro Prosperity Region Township Both
Macomb Mount Clemens 10 - Detroit Metro Prosperity Region City Retirement Health Care No Waiver Submission Yes
Macomb New Baltimore 10 - Detroit Metro Prosperity Region City Retirement Health Care Deny Yes
Macomb Romeo 10 - Detroit Metro Prosperity Region Village Retirement Health Care Deny Yes
Macomb Southeast Macomb Sanitary District 10 - Detroit Metro Prosperity Region Authority Retirement Health Care Approve No
Macomb St Clair Shores 10 - Detroit Metro Prosperity Region City Both Split Yes
Macomb State Of Michigan 41b District - Clinton Charter Township & Mt Clemens10 - Detroit Metro Prosperity Region Authority Retirement Health Care
Macomb Warren 10 - Detroit Metro Prosperity Region City Retirement Health Care Deny Yes
Manistee Manistee County 02 - Northwest Prosperity Region County Under Review
Manistee Manistee County Library 02 - Northwest Prosperity Region Library Retirement Pension Approve No
Marquette Ishpeming 01 - Upper Peninsula Prosperity Alliance City Retirement Pension
Marquette Marquette 01 - Upper Peninsula Prosperity Alliance City Both
Marquette Marquette Area Wastewater Treatment Facility 01 - Upper Peninsula Prosperity Alliance Authority Under Review
Marquette Marquette City Board Of Light And Power 01 - Upper Peninsula Prosperity Alliance Authority Both Split Yes
Marquette Marquette City Housing Commission 01 - Upper Peninsula Prosperity Alliance Authority No Retirement Submission Yes
Marquette Marquette County Road Commission 01 - Upper Peninsula Prosperity Alliance Road Commission Both Deny Yes
Marquette Negaunee City Housing Commission 01 - Upper Peninsula Prosperity Alliance Authority Retirement Pension
Marquette Pathways 01 - Upper Peninsula Prosperity Alliance Authority Both Deny Yes
Mason Mason County Road Commission 04 - West Michigan Prosperity Alliance Road Commission Under Review
Mecosta Mecosta County Road Commission 04 - West Michigan Prosperity Alliance Road Commission Retirement Health Care
Menominee Menominee County Road Commission 01 - Upper Peninsula Prosperity Alliance Road Commission Retirement Pension Approve No
Midland Midland 05 - East Central Michigan Prosperity Region City Retirement Pension Deny Yes
Midland Midland County Road Commission 05 - East Central Michigan Prosperity Region Road Commission Retirement Pension
Missaukee District Health Department No. 10 - White Cloud 02 - Northwest Prosperity Region Authority Retirement Pension
Missaukee Missaukee County Road Commission 02 - Northwest Prosperity Region Road Commission Retirement Health Care Under Review Pending Review
Monroe Monroe 09 - Southeast Michigan Prosperity Region County Retirement Health Care
4 of 39Updated 08/10/2018
Source: Fiscal year 2017 audited financial statements or most recent year available for biennial filers

Local Unit Summary
County Local Unit Name Prosperity Region Local Unit Type
Preliminary Underfunded
Status (1) Waiver Status (2)
Corrective Action Plan
Required (3)
Corrective Action Plan
Approved (4)
Michigan Department of TreasuryLocal Unit Retirement System Summary
As of August 10, 20181Note: PA 202 of 2017 defines "underfunded status" to mean the following:
A) For retirement pension systems, the triggers for primary units (cities, villages, counties, and townships) are if the unit is less than 60% funded and has an annual required contribution that is over 10% of governmental fund revenues. The non-primary unit trigger is if the unit is less
than 60% funded.
B) For retirement health care systems, the triggers for primary units (cities, villages, counties and townships) are if the unit is less than 40% funded and has an annual required contribution greater than 12% of governmental fund revenues. The non-primary unit trigger is if the unit is
less than 40% funded.
2Split units have at least one underfunded system requiring a corrective action plan and at least one system that was approved for a waiver.
3Any local unit of government required to submit a corrective action plan has at least one underfunded retirement system as determined by PA 202 of 2017
4Following receipt of the corrective action plan by Treasury, the Municipal Stability Board(the Board) will accept the corrective action plan submission at the next scheduled meeting of the Board. The Board shall then approve or reject the corrective action plan within 45 days from the
date of the meeting.
Monroe Monroe Community Mental Health Authority 09 - Southeast Michigan Prosperity Region Authority Retirement Health Care
Monroe Monroe County Road Commission 09 - Southeast Michigan Prosperity Region Road Commission Retirement Health Care No Waiver Submission Yes
Monroe Monroe Housing Commission 09 - Southeast Michigan Prosperity Region Authority No Retirement Submission Yes
Montcalm Mid- Michigan District Health Department 04 - West Michigan Prosperity Alliance Authority Retirement Health Care
Montcalm Montcalm County Road Commission 04 - West Michigan Prosperity Alliance Road Commission Both Deny Yes
Montcalm White Pine District Library 04 - West Michigan Prosperity Alliance Library Retirement Pension No Waiver Submission Yes Approved
Montmorency Montmorency 03 - Northeast Prosperity Region County Under Review
Montmorency Montmorency County Road Commission 03 - Northeast Prosperity Region Road Commission Retirement Health Care
Montmorency Montmorency- Oscoda- Alpena Solid Waste Management Authority03 - Northeast Prosperity Region Authority Retirement Health Care
Muskegon Muskegon Central Dispatch 9- 1- 1 04 - West Michigan Prosperity Alliance Authority Retirement Health Care No Waiver Submission Yes
Muskegon Muskegon Heights City Housing Commission 04 - West Michigan Prosperity Alliance Authority No Retirement Submission Yes
Muskegon North Muskegon 04 - West Michigan Prosperity Alliance City Retirement Health Care Deny Yes
Muskegon Norton Shores 04 - West Michigan Prosperity Alliance City Retirement Pension Deny Yes
Newaygo Fremont 04 - West Michigan Prosperity Alliance City Retirement Pension Approve No
Newaygo Newaygo County Road Commission 04 - West Michigan Prosperity Alliance Road Commission Retirement Health Care Deny Yes
Oakland Berkley 10 - Detroit Metro Prosperity Region City Retirement Health Care Deny Yes
Oakland Bloomfield Charter Township 10 - Detroit Metro Prosperity Region Township Retirement Health Care Deny Yes
Oakland Bloomfield Township Public Library 10 - Detroit Metro Prosperity Region Library Retirement Health Care Deny Yes
Oakland Clawson 10 - Detroit Metro Prosperity Region City Retirement Pension Deny Yes
Oakland Ferndale City Housing Commission 10 - Detroit Metro Prosperity Region Authority Under Review
Oakland Hazel Park 10 - Detroit Metro Prosperity Region City Both Deny Yes
Oakland Holly 10 - Detroit Metro Prosperity Region Village Retirement Pension Deny Yes
Oakland Huntington Woods 10 - Detroit Metro Prosperity Region City Retirement Pension Approve No
Oakland Madison Heights 10 - Detroit Metro Prosperity Region City Both Deny Yes
Oakland Oak Park 10 - Detroit Metro Prosperity Region City Both Deny Yes
Oakland Oakland County Road Commission 10 - Detroit Metro Prosperity Region Road Commission Retirement Health Care Approve No
Oakland Pontiac 10 - Detroit Metro Prosperity Region City Retirement Health Care Deny Yes
Oakland Southfield 10 - Detroit Metro Prosperity Region City Retirement Health Care Deny Yes
Oakland State Of Michigan 48th Judicial District Court 10 - Detroit Metro Prosperity Region Authority Retirement Health Care Under Review Pending Review
Oakland Waterford Charter Township 10 - Detroit Metro Prosperity Region Township Retirement Health Care
Oceana Hart 04 - West Michigan Prosperity Alliance City Retirement Health Care Deny Yes
Oceana Oceana County Road Commission 04 - West Michigan Prosperity Alliance Road Commission Retirement Health Care
Ogemaw Ogemaw County Road Commission 03 - Northeast Prosperity Region Road Commission Both Split Yes
Ontonagon Ontonagon 01 - Upper Peninsula Prosperity Alliance Village Retirement Pension No Waiver Submission Yes
Ontonagon Ontonagon County Road Commission 01 - Upper Peninsula Prosperity Alliance Road Commission Both Deny Yes
Osceola Osceola County Road Commission 04 - West Michigan Prosperity Alliance Road Commission Both Under Review Pending Review
Osceola Reed City Housing Commission 04 - West Michigan Prosperity Alliance Authority Retirement Pension Approve No
Oscoda Oscoda County Road Commission 03 - Northeast Prosperity Region Road Commission Retirement Health Care
Otsego Otsego County Road Commission 03 - Northeast Prosperity Region Road Commission Both Deny Yes
Ottawa Coopersville Area District Library 04 - West Michigan Prosperity Alliance Library Retirement Pension Approve No
Ottawa Holland Charter Township 04 - West Michigan Prosperity Alliance Township Under Review
5 of 39Updated 08/10/2018
Source: Fiscal year 2017 audited financial statements or most recent year available for biennial filers

Local Unit Summary
County Local Unit Name Prosperity Region Local Unit Type
Preliminary Underfunded
Status (1) Waiver Status (2)
Corrective Action Plan
Required (3)
Corrective Action Plan
Approved (4)
Michigan Department of TreasuryLocal Unit Retirement System Summary
As of August 10, 20181Note: PA 202 of 2017 defines "underfunded status" to mean the following:
A) For retirement pension systems, the triggers for primary units (cities, villages, counties, and townships) are if the unit is less than 60% funded and has an annual required contribution that is over 10% of governmental fund revenues. The non-primary unit trigger is if the unit is less
than 60% funded.
B) For retirement health care systems, the triggers for primary units (cities, villages, counties and townships) are if the unit is less than 40% funded and has an annual required contribution greater than 12% of governmental fund revenues. The non-primary unit trigger is if the unit is
less than 40% funded.
2Split units have at least one underfunded system requiring a corrective action plan and at least one system that was approved for a waiver.
3Any local unit of government required to submit a corrective action plan has at least one underfunded retirement system as determined by PA 202 of 2017
4Following receipt of the corrective action plan by Treasury, the Municipal Stability Board(the Board) will accept the corrective action plan submission at the next scheduled meeting of the Board. The Board shall then approve or reject the corrective action plan within 45 days from the
date of the meeting.
Ottawa Lakeshore Coordinating Council 04 - West Michigan Prosperity Alliance Authority No Retirement Submission Yes
Ottawa Ottawa County Road Commission 04 - West Michigan Prosperity Alliance Road Commission Both Deny Yes
Presque Isle Presque Isle County Road Commission 03 - Northeast Prosperity Region Road Commission Both Split Yes
Presque Isle Rogers City 03 - Northeast Prosperity Region City Retirement Pension Deny Yes
Roscommon Houghton Lake Sewer Authority 03 - Northeast Prosperity Region Authority Retirement Health Care
Roscommon Roscommon County 03 - Northeast Prosperity Region County Under Review
Roscommon Roscommon County Road Commission 03 - Northeast Prosperity Region Road Commission Retirement Health Care Under Review Pending Review
Saginaw Mbs International Airport Commission 05 - East Central Michigan Prosperity Region Authority Both
Saginaw Saginaw 05 - East Central Michigan Prosperity Region City Both Deny Yes
Saginaw Saginaw City Housing Commission 05 - East Central Michigan Prosperity Region Authority Both No Waiver Submission Yes
Saginaw Saginaw County Road Commission 05 - East Central Michigan Prosperity Region Road Commission Retirement Health Care
Saginaw Saginaw Transit Authority Regional Services 05 - East Central Michigan Prosperity Region Authority No Retirement Submission Yes
Saginaw St Charles 05 - East Central Michigan Prosperity Region Village Retirement Pension Approve No
Sanilac Croswell 06 - East Michigan Prosperity Region City Retirement Pension Deny Yes
Sanilac Lexington 06 - East Michigan Prosperity Region Village Retirement Health Care Deny Yes
Sanilac Sanilac County Community Mental Health Authority 06 - East Michigan Prosperity Region Authority Retirement Health Care Under Review Pending Review
Sanilac Sanilac County Road Commission 06 - East Michigan Prosperity Region Road Commission Retirement Health Care Under Review Pending Review
Schoolcraft Manistique 01 - Upper Peninsula Prosperity Alliance City Retirement Pension Deny Yes
Schoolcraft Schoolcraft County Road Commission 01 - Upper Peninsula Prosperity Alliance Road Commission Both Approve No
Shiawassee Shiawassee County Road Commission 06 - East Michigan Prosperity Region Road Commission Retirement Health Care Approve No
St Joseph St Joseph County Road Commission 08 - Southwest Prosperity Region Road Commission Retirement Health Care
St Joseph Sturgis City Housing Commission 08 - Southwest Prosperity Region Authority Under Review
St. Clair Marine City 06 - East Michigan Prosperity Region City Retirement Health Care No Waiver Submission Yes
St. Clair Marysville 06 - East Michigan Prosperity Region City Retirement Pension Split Yes
St. Clair Port Huron 06 - East Michigan Prosperity Region City Retirement Pension Deny Yes
St. Clair St Clair 06 - East Michigan Prosperity Region City Retirement Pension
St. Clair St Clair County Road Commission 06 - East Michigan Prosperity Region Road Commission Retirement Health Care No Waiver Submission Yes
St. Clair St Clair River Sewer & Water Authority 06 - East Michigan Prosperity Region Authority Under Review
Tuscola Tuscola County Road Commission 06 - East Michigan Prosperity Region Road Commission Both
Van Buren South Haven Area Emergency Services Authority 08 - Southwest Prosperity Region Authority Retirement Health Care
Van Buren Van Buren County 08 - Southwest Prosperity Region County Under Review
Van Buren Van Buren County Public Transit Authority 08 - Southwest Prosperity Region Authority No Retirement Submission Yes
Van Buren Van Buren County Road Commission 08 - Southwest Prosperity Region Road Commission Retirement Health Care
Washtenaw Ann Arbor Transportation Authority 09 - Southeast Michigan Prosperity Region Authority Retirement Health Care No Waiver Submission Yes
Washtenaw Milan 09 - Southeast Michigan Prosperity Region City Retirement Pension Deny Yes
Washtenaw Milan Public Library 09 - Southeast Michigan Prosperity Region Library Retirement Pension Deny Yes Pending
Washtenaw Saline Area Fire Department 09 - Southeast Michigan Prosperity Region Authority Retirement Health Care No Waiver Submission Yes
Washtenaw Washtenaw County Road Commission 09 - Southeast Michigan Prosperity Region Road Commission Both Approve No
Washtenaw Ypsilanti City Housing Commission Authority 09 - Southeast Michigan Prosperity Region Authority No Retirement Submission Yes
Washtenaw Ypsilanti Community Utilities Authority 09 - Southeast Michigan Prosperity Region Authority Retirement Pension Deny Yes
Wayne 33rd District Court- Woodhaven Authority 10 - Detroit Metro Prosperity Region Authority Under Review
6 of 39Updated 08/10/2018
Source: Fiscal year 2017 audited financial statements or most recent year available for biennial filers

Local Unit Summary
County Local Unit Name Prosperity Region Local Unit Type
Preliminary Underfunded
Status (1) Waiver Status (2)
Corrective Action Plan
Required (3)
Corrective Action Plan
Approved (4)
Michigan Department of TreasuryLocal Unit Retirement System Summary
As of August 10, 20181Note: PA 202 of 2017 defines "underfunded status" to mean the following:
A) For retirement pension systems, the triggers for primary units (cities, villages, counties, and townships) are if the unit is less than 60% funded and has an annual required contribution that is over 10% of governmental fund revenues. The non-primary unit trigger is if the unit is less
than 60% funded.
B) For retirement health care systems, the triggers for primary units (cities, villages, counties and townships) are if the unit is less than 40% funded and has an annual required contribution greater than 12% of governmental fund revenues. The non-primary unit trigger is if the unit is
less than 40% funded.
2Split units have at least one underfunded system requiring a corrective action plan and at least one system that was approved for a waiver.
3Any local unit of government required to submit a corrective action plan has at least one underfunded retirement system as determined by PA 202 of 2017
4Following receipt of the corrective action plan by Treasury, the Municipal Stability Board(the Board) will accept the corrective action plan submission at the next scheduled meeting of the Board. The Board shall then approve or reject the corrective action plan within 45 days from the
date of the meeting.
Wayne 35th District- Plymouth Authority 10 - Detroit Metro Prosperity Region Authority Both
Wayne Allen Park 10 - Detroit Metro Prosperity Region City Retirement Health Care Deny Yes
Wayne Dearborn 10 - Detroit Metro Prosperity Region City Retirement Health Care Deny Yes
Wayne Dearborn Heights 10 - Detroit Metro Prosperity Region City Retirement Health Care No Waiver Submission Yes
Wayne Ecorse 10 - Detroit Metro Prosperity Region City Retirement Pension No Waiver Submission Yes Approved
Wayne Garden City 10 - Detroit Metro Prosperity Region City Retirement Health Care Deny Yes
Wayne Gibraltar 10 - Detroit Metro Prosperity Region City Retirement Health Care Deny Yes
Wayne Grosse Ile Township 10 - Detroit Metro Prosperity Region Township Retirement Pension Approve No
Wayne Grosse Pointe Farms 10 - Detroit Metro Prosperity Region City Retirement Health Care Deny Yes
Wayne Grosse Pointe Woods 10 - Detroit Metro Prosperity Region City Retirement Health Care Deny Yes
Wayne Grosse Pointes- Clinton Refuse Disposal Authority 10 - Detroit Metro Prosperity Region Authority No Retirement Submission Yes
Wayne Hamtramck 10 - Detroit Metro Prosperity Region City Retirement Pension No Waiver Submission Yes
Wayne Harper Woods 10 - Detroit Metro Prosperity Region City Under Review
Wayne Highland Park 10 - Detroit Metro Prosperity Region City Retirement Pension Deny Yes
Wayne Lincoln Park 10 - Detroit Metro Prosperity Region City Both No Waiver Submission Yes
Wayne Melvindale 10 - Detroit Metro Prosperity Region City Both
Wayne Northville Parks & Recreation Commission 10 - Detroit Metro Prosperity Region Authority Retirement Health Care Approve No
Wayne Plymouth 10 - Detroit Metro Prosperity Region City Retirement Pension Approve No
Wayne Plymouth Charter Township 10 - Detroit Metro Prosperity Region Township Retirement Health Care
Wayne Redford Charter Township 10 - Detroit Metro Prosperity Region Township Both Split Yes
Wayne Redford Township District Library 10 - Detroit Metro Prosperity Region Library No Retirement Submission None Yes
Wayne River Rouge 10 - Detroit Metro Prosperity Region City Retirement Health Care Approve No
Wayne Riverview 10 - Detroit Metro Prosperity Region City Retirement Health Care Deny Yes
Wayne Rockwood 10 - Detroit Metro Prosperity Region City Retirement Health Care Deny Yes
Wayne Romulus 10 - Detroit Metro Prosperity Region City Retirement Health Care Deny Yes
Wayne Southgate 10 - Detroit Metro Prosperity Region City Both Split Yes
Wayne Suburban Mobility Authority For Regional Transportation 10 - Detroit Metro Prosperity Region Authority Retirement Health Care Deny Yes
Wayne Taylor 10 - Detroit Metro Prosperity Region City Both No Waiver Submission Yes
Wayne Taylor City Housing Commission 10 - Detroit Metro Prosperity Region Authority Under Review
Wayne Trenton 10 - Detroit Metro Prosperity Region City Both Split Yes
Wayne Van Buren Charter Township 10 - Detroit Metro Prosperity Region Township Retirement Health Care Under Review Pending Review
Wayne Wayne 10 - Detroit Metro Prosperity Region City Both No Waiver Submission Yes
Wayne Wayne County Airport Authority 10 - Detroit Metro Prosperity Region Authority Retirement Health Care No Waiver Submission Yes
Wayne Westland 10 - Detroit Metro Prosperity Region City Both Deny Yes
Wayne Woodhaven 10 - Detroit Metro Prosperity Region City Retirement Health Care Deny Yes
Wayne Wyandotte 10 - Detroit Metro Prosperity Region City Retirement Health Care Deny Yes
Wexford Cadillac City Housing Commission Authority 02 - Northwest Prosperity Region Authority Retirement Health Care Under Review Pending Review
Wexford Wexford County Road Commission 02 - Northwest Prosperity Region Road Commission Retirement Health Care Deny Yes
7 of 39Updated 08/10/2018
Source: Fiscal year 2017 audited financial statements or most recent year available for biennial filers

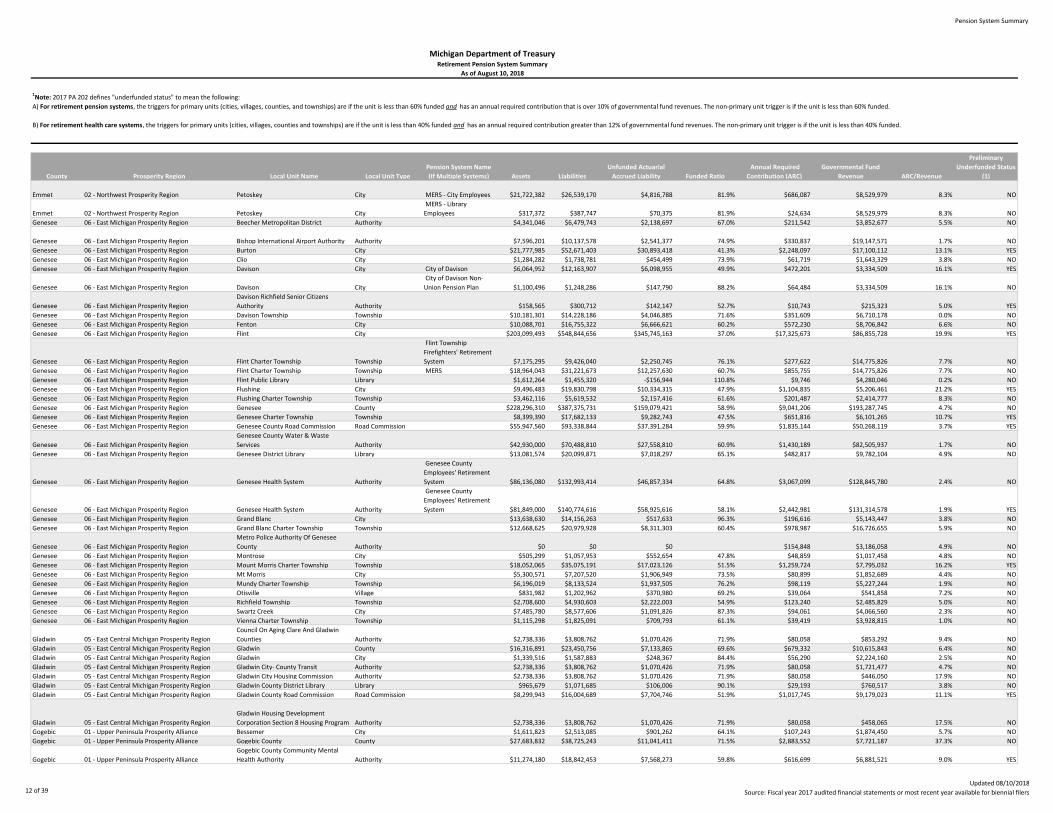
Pension System Summary
County Prosperity Region Local Unit Name Local Unit Type
Pension System Name
(If Multiple Systems) Assets Liabilities
Unfunded Actuarial
Accrued Liability Funded Ratio
Annual Required
Contribution (ARC)
Governmental Fund
Revenue ARC/Revenue
Preliminary
Underfunded Status
(1)
Alcona 03 - Northeast Prosperity Region Alcona County County $10,146,124 $14,829,718 $4,683,594 68.4% $608,566 $8,177,921 7.4% NO
Alger 01 - Upper Peninsula Prosperity Alliance Alger County County $8,577,641 $12,705,133 $4,127,492 67.5% $400,129 $5,819,750 6.9% NO
Alger 01 - Upper Peninsula Prosperity Alliance Alger County Road Commission Road Commission $6,529,419 $9,708,637 $3,179,218 67.3% $377,324 $5,596,095 6.7% NO
Alger 01 - Upper Peninsula Prosperity Alliance Munising City $5,394,509 $8,717,673 $3,323,164 61.9% $251,568 $2,867,233 8.8% NO
Allegan 04 - West Michigan Prosperity Alliance Allegan City $3,787,258 $5,522,862 $1,735,604 68.6% $153,600 $5,257,880 2.9% NO
Allegan 04 - West Michigan Prosperity Alliance Allegan County County $53,766,163 $63,684,208 $9,918,045 84.4% $909,864 $49,121,384 1.9% NO
Allegan 04 - West Michigan Prosperity Alliance
Allegan County Community Mental
Health Services Board Authority $3,162,594 $2,715,088 -$447,506 116.5% $11,388 $27,970,651 0.0% NO
Allegan 04 - West Michigan Prosperity Alliance Allegan County Road Commission Road Commission $13,052,258 $23,237,923 $10,185,665 56.2% $707,736 $28,763,960 2.5% YES
Allegan 04 - West Michigan Prosperity Alliance Douglas Village, City Of City $2,835,345 $3,545,627 $710,282 80.0% $132,427 $3,530,849 3.8% NO
Allegan 04 - West Michigan Prosperity Alliance Interurban Transit Authority Authority $1,128,689 $1,364,280 $235,591 82.7% $14,736 $888,709 1.7% NO
Allegan 04 - West Michigan Prosperity Alliance Manlius Township Township $488,649 $556,754 $68,105 87.8% $11,111 $970,992 1.1% NO
Allegan 04 - West Michigan Prosperity Alliance Saugatuck City $1,507,581 $1,848,628 $341,047 81.6% $48,167 $3,359,318 1.4% NO
Allegan 04 - West Michigan Prosperity Alliance Saugatuck Township Township $297,090 $962,462 $665,372 30.9% $52,497 $1,544,305 3.4% NO
Allegan 04 - West Michigan Prosperity Alliance Saugatuck Township Fire District Authority $335,383 $437,279 $101,896 76.7% $25,655 $1,036,230 2.5% NO
Allegan 04 - West Michigan Prosperity Alliance Wayland City $5,238,987 $7,631,717 $2,392,730 68.6% $227,562 $2,889,620 7.9% NO
Alpena 03 - Northeast Prosperity Region Alpena City $25,700,239 $33,608,796 $7,908,557 76.5% $722,318 $11,655,565 6.2% NO
Alpena 03 - Northeast Prosperity Region Alpena County County $13,211,624 $21,011,694 $7,800,070 62.9% $764,357 $15,676,128 4.9% NO
Alpena 03 - Northeast Prosperity Region Alpena County Road Commission Road Commission $9,185,718 $12,427,308 $3,241,590 73.9% $352,368 $6,339,188 5.6% NO
Antrim 02 - Northwest Prosperity Region Antrim County County
MERS Primary
Government $20,979,715 $28,519,749 $7,540,034 73.6% $908,394 $16,115,906 9.9% NO
Antrim 02 - Northwest Prosperity Region Antrim County County
MERS Meadow Brook
Medical Care Facility $12,362,360 $16,750,269 $4,387,909 73.8% $679,675 $16,115,906 9.9% NO
Antrim 02 - Northwest Prosperity Region Antrim County Road Commission Road Commission $7,237,314 $13,882,954 $6,645,640 52.1% $617,664 $9,155,597 6.7% YES
Antrim 02 - Northwest Prosperity Region Central Lake Village $187,164 $201,577 $14,413 92.8% $15,419 $695,777 2.2% NO
Antrim 02 - Northwest Prosperity Region Elk Rapids Village $1,727,272 $2,384,163 $656,891 72.4% $94,228 $1,820,934 5.2% NO
Arenac 05 - East Central Michigan Prosperity Region Arenac County County $9,324,199 $12,844,392 $3,520,193 72.6% $572,091 $7,906,186 7.2% NO
Arenac 05 - East Central Michigan Prosperity Region Arenac County Road Commission Road Commission $2,122,935 $6,460,191 $4,337,256 32.9% $370,077 $7,603,931 4.9% YES
Arenac 05 - East Central Michigan Prosperity Region Au Gres City $1,535,851 $2,257,476 $721,625 68.0% $48,858 $720,389 6.8% NO
Arenac 05 - East Central Michigan Prosperity Region Sims- Whitney Utilities Authority Authority $254,056 $335,237 $81,181 75.8% $13,993 $2,883,527 0.5% NO
Arenac 05 - East Central Michigan Prosperity Region Standish City $1,627,910 $2,677,773 $1,049,863 60.8% $173,772 $1,588,209 10.9% NO
Arenac 05 - East Central Michigan Prosperity Region Sterling Village $304,785 $208,767 -$96,018 146.0% $0 $249,606 0.0% NO
Baraga 01 - Upper Peninsula Prosperity Alliance Baraga Village $1,510,817 $3,700,904 $2,190,087 40.8% $156,679 $632,651 24.8% YES
Baraga 01 - Upper Peninsula Prosperity Alliance Baraga County County $4,584,408 $7,065,791 $2,481,383 64.9% $231,945 $4,096,930 5.7% NO
Baraga 01 - Upper Peninsula Prosperity Alliance Baraga County Road Commission Road Commission $3,512,613 $7,430,276 $3,917,663 47.3% $228,153 $4,185,665 5.5% YES
Baraga 01 - Upper Peninsula Prosperity Alliance L'anse Village $3,085,850 $6,655,642 $3,569,792 46.4% $250,787 $1,893,226 13.2% YES
Barry 04 - West Michigan Prosperity Alliance Barry County County $40,480,754 $51,877,682 $11,396,928 78.0% $1,637,841 $23,740,604 6.9% NO
Barry 04 - West Michigan Prosperity Alliance
Barry County Community Mental Health
Authority Authority $7,060,362 $8,709,900 $1,649,538 81.1% $434,223 $11,241,836 3.9% NO
Barry 04 - West Michigan Prosperity Alliance Hastings City $7,982,175 $15,968,218 $7,986,043 50.0% $567,651 $5,827,849 9.7% NO
Barry 04 - West Michigan Prosperity Alliance Middleville Village $1,477,463 $1,904,831 $427,368 77.6% $55,650 $1,931,923 2.9% NO
Barry 04 - West Michigan Prosperity Alliance Nashville Village $429,833 $407,048 -$22,785 105.6% $12,130 $752,950 1.6% NO
Barry 04 - West Michigan Prosperity Alliance Thornapple Manor Authority $16,295,739 $18,502,708 $2,206,969 88.1% $633,302 $18,313,709 3.5% NO
Bay 05 - East Central Michigan Prosperity Region Auburn City $1,035,931 $2,020,116 $984,185 51.3% $83,661 $1,178,440 7.1% NO
Bay 05 - East Central Michigan Prosperity Region Bay- Arenac Behavioral Health Authority $50,013,796 $52,404,397 $2,390,601 95.4% $1,243,668 $47,353,767 2.6% NO
Bay 05 - East Central Michigan Prosperity Region Bay City City
General Employees
Retirement System-
MERS $49,234,657 $73,093,322 $23,858,665 67.4% $4,598,968 $29,824,637 20.5% NO
Bay 05 - East Central Michigan Prosperity Region Bay City City
Bay City Police and Fire
Retirement System $54,689,794 $72,884,757 $18,194,963 75.0% $1,521,054 $29,824,637 20.5% NO
Bay 05 - East Central Michigan Prosperity Region
Bay County Department Of Water &
Sewer Authority $261,487,178 $243,696,202 -$17,790,976 107.3% $1,958,204 $16,215,478 12.1% NO
Bay 05 - East Central Michigan Prosperity Region Bay County Road Commission Road Commission $35,875,872 $33,435,119 -$2,440,753 107.3% $587,549 $15,286,729 3.8% NO
Bay 05 - East Central Michigan Prosperity Region
Bay Metropolitan Transportation
Authority Authority $9,537,193 $17,330,619 $7,793,426 55.0% $672,674 $8,140,484 8.3% YES
Bay 05 - East Central Michigan Prosperity Region Essexville City $4,499,712 $6,820,262 $2,320,550 66.0% $260,893 $2,337,041 11.2% NO
Bay 05 - East Central Michigan Prosperity Region Pinconning City $1,284,294 $2,319,768 $1,035,474 55.4% $68,101 $1,073,060 6.3% NO
Benzie 02 - Northwest Prosperity Region Benzie County Road Commission Road Commission $2,598,755 $7,460,412 $4,861,657 34.8% $340,746 $5,934,879 5.7% YES
Benzie 02 - Northwest Prosperity Region
Benzie Leelanau District Health
Department Authority $714,840 $982,788 $267,948 72.7% $31,254 $2,377,753 1.3% NO
Benzie 02 - Northwest Prosperity Region Benzie Shores District Library Library $305,147 $282,350 -$22,797 108.1% $6,189 $326,582 1.9% NO
Benzie 02 - Northwest Prosperity Region Benzie Transportation Authority Authority $805,451 $730,941 -$74,510 110.2% $17,894 $1,838,271 1.0% NO
Michigan Department of TreasuryRetirement Pension System Summary
As of August 10, 2018
1Note: 2017 PA 202 defines "underfunded status" to mean the following:
A) For retirement pension systems, the triggers for primary units (cities, villages, counties, and townships) are if the unit is less than 60% funded and has an annual required contribution that is over 10% of governmental fund revenues. The non-primary unit trigger is if the unit is less than 60% funded.
B) For retirement health care systems, the triggers for primary units (cities, villages, counties and townships) are if the unit is less than 40% funded and has an annual required contribution greater than 12% of governmental fund revenues. The non-primary unit trigger is if the unit is less than 40% funded.
8 of 39Updated 08/10/2018
Source: Fiscal year 2017 audited financial statements or most recent year available for biennial filers

Pension System Summary
County Prosperity Region Local Unit Name Local Unit Type
Pension System Name
(If Multiple Systems) Assets Liabilities
Unfunded Actuarial
Accrued Liability Funded Ratio
Annual Required
Contribution (ARC)
Governmental Fund
Revenue ARC/Revenue
Preliminary
Underfunded Status
(1)
Michigan Department of TreasuryRetirement Pension System Summary
As of August 10, 2018
1Note: 2017 PA 202 defines "underfunded status" to mean the following:
A) For retirement pension systems, the triggers for primary units (cities, villages, counties, and townships) are if the unit is less than 60% funded and has an annual required contribution that is over 10% of governmental fund revenues. The non-primary unit trigger is if the unit is less than 60% funded.
B) For retirement health care systems, the triggers for primary units (cities, villages, counties and townships) are if the unit is less than 40% funded and has an annual required contribution greater than 12% of governmental fund revenues. The non-primary unit trigger is if the unit is less than 40% funded.
Benzie 02 - Northwest Prosperity Region Frankfort City $1,742,258 $3,496,957 $1,754,699 49.8% $137,376 $2,355,358 5.8% NO
Benzie 02 - Northwest Prosperity Region
Maples- Benzie County Medical Care
Facility Authority $6,648,710 $8,600,070 $1,951,360 77.3% $276,312 $8,522,322 3.2% NO
Berrien 08 - Southwest Prosperity Region Baroda Lake Police Department Authority $302,984 $411,970 $108,986 73.5% $28,380 $684,689 4.1% NO
Berrien 08 - Southwest Prosperity Region Benton Charter Township Township $18,713,681 $27,013,359 $8,299,678 69.3% $1,056,574 $8,713,860 12.1% NO
Berrien 08 - Southwest Prosperity Region Benton Harbor City $9,917,959 $26,400,392 $16,482,433 37.6% $1,115,747 $8,078,323 13.8% YES
Berrien 08 - Southwest Prosperity Region Berrien County County $154,066,086 $245,503,345 $91,437,259 62.8% $7,727,058 $92,058,324 8.4% NO
Berrien 08 - Southwest Prosperity Region Berrien Mental Health Authority Authority $21,389,921 $26,052,523 $4,662,602 82.1% $637,650 $47,018,272 1.4% NO
Berrien 08 - Southwest Prosperity Region Berrien Springs Village $1,456,538 $1,570,383 $113,845 92.8% $21,337 $1,332,052 1.6% NO
Berrien 08 - Southwest Prosperity Region Bridgman City $1,298,291 $1,839,690 $541,399 70.6% $76,193 $2,112,181 3.6% NO
Berrien 08 - Southwest Prosperity Region Buchanan City $7,340,585 $7,298,418 -$42,167 100.6% $159,475 $3,818,155 4.2% NO
Berrien 08 - Southwest Prosperity Region Buchanan District Library Library $302,649 $287,631 -$15,018 105.2% $4,319 $624,560 0.7% NO
Berrien 08 - Southwest Prosperity Region Chikaming Township Township $1,573,868 $2,381,200 $807,332 66.1% $65,632 $2,020,050 3.2% NO
Berrien 08 - Southwest Prosperity Region Coloma City $773,222 $928,405 $155,183 83.3% $15,563 $1,145,004 1.4% NO
Berrien 08 - Southwest Prosperity Region Coloma Charter Township Township $1,419,377 $2,328,866 $909,489 60.9% $78,884 $2,595,384 3.0% NO
Berrien 08 - Southwest Prosperity Region Eau Claire Village $182,945 $534,421 $351,476 34.2% $15,522 $376,223 4.1% NO
Berrien 08 - Southwest Prosperity Region Grand Beach Village $327,920 $341,931 $14,011 95.9% $25,551 $1,013,328 2.5% NO
Berrien 08 - Southwest Prosperity Region New Buffalo City $1,964,311 $2,565,283 $600,972 76.6% $84,229 $4,745,132 1.8% NO
Berrien 08 - Southwest Prosperity Region Niles City Retirement Plan A $17,771,562 $21,766,281 $3,994,719 81.6% $493,188 $7,717,038 13.9% NO
Berrien 08 - Southwest Prosperity Region Niles City Retirement Plan B $14,352,950 $20,492,805 $6,139,855 70.0% $582,561 $7,717,038 13.9% NO
Berrien 08 - Southwest Prosperity Region Niles Charter Township Township $3,918,673 $6,381,361 $2,462,688 61.4% $212,560 $3,645,080 5.8% NO
Berrien 08 - Southwest Prosperity Region Niles District Library Library $866,195 $1,055,947 $189,752 82.0% $15,878 $1,175,080 1.4% NO
Berrien 08 - Southwest Prosperity Region Oronoko Charter Township Township $1,614,028 $2,327,953 $713,925 69.3% $65,114 $2,435,694 2.7% NO
Berrien 08 - Southwest Prosperity Region
Southwestern Michigan Community
Ambulance Service Authority $2,279,234 $2,955,311 $676,077 77.1% $89,427 $2,949,401 3.0% NO
Berrien 08 - Southwest Prosperity Region St Joseph City $66,144,316 $65,125,082 -$1,019,234 101.6% $893,357 $13,288,797 6.7% NO
Branch 08 - Southwest Prosperity Region Branch County County $12,697,335 $17,012,012 $4,314,677 74.6% $442,927 $19,613,381 2.3% NO
Branch 08 - Southwest Prosperity Region Branch County Road Commission Road Commission $3,482,692 $5,482,719 $2,000,027 63.5% $395,708 $8,034,658 4.9% NO
Branch 08 - Southwest Prosperity Region
Branch- Hillsdale- St Joseph Community
Health Agency Authority $11,909,056 $14,321,279 $2,412,223 83.2% $209,441 $6,085,112 3.4% NO
Branch 08 - Southwest Prosperity Region Bronson City $1,299,193 $2,232,253 $933,060 58.2% $50,666 $1,447,367 3.5% NO
Branch 08 - Southwest Prosperity Region Coldwater City $18,665,234 $28,489,971 $9,824,737 65.5% $919,584 $12,925,380 7.1% NO
Calhoun 08 - Southwest Prosperity Region Albion City
Public Safety Officers'
Pension Fund $22,536,247 $13,435,967 -$9,100,280 167.7% $0 $6,603,512 1.8% NO
Calhoun 08 - Southwest Prosperity Region Albion City MERS $12,945,481 $13,771,328 $825,847 94.0% $122,066 $6,603,512 1.8% NO
Calhoun 08 - Southwest Prosperity Region Battle Creek City
Municipal Employees'
Retirement System of
Michigan $81,255,431 $141,255,649 $60,000,218 57.5% $4,865,316 $62,276,477 15.4% YES
Calhoun 08 - Southwest Prosperity Region Battle Creek City
City of Battle Creek
Police and Fire
Retirement System $138,509,334 $176,579,083 $38,069,749 78.4% $4,746,323 $62,276,477 15.4% NO
Calhoun 08 - Southwest Prosperity Region Calhoun County County
Municipal Employees'
Retirement System of
Michigan $51,165,413 $80,966,571 $29,801,158 63.2% $1,937,410 $80,444,094 3.4% NO
Calhoun 08 - Southwest Prosperity Region Calhoun County County
Municipal Employees'
Retirement System of
Michigan - Road
Department $8,111,640 $18,274,757 $10,163,117 44.4% $824,587 $80,444,094 3.4% NO
Calhoun 08 - Southwest Prosperity Region
Calhoun County Consolidated Dispatch
Authority Authority $5,568,398 $5,640,552 $72,154 98.7% $27,816 $3,444,422 0.8% NO
Calhoun 08 - Southwest Prosperity Region Emmett Charter Township Township $3,872,870 $5,198,537 $1,325,667 74.5% $97,716 $4,155,750 2.4% NO
Calhoun 08 - Southwest Prosperity Region Marshall City $21,237,785 $34,352,142 $13,114,357 61.8% $815,277 $7,465,578 10.9% NO
Calhoun 08 - Southwest Prosperity Region
Marshall Area Fire Fighters Ambulance
Authority Authority $863,433 $845,695 -$17,738 102.1% $24,926 $2,030,288 1.2% NO
Calhoun 08 - Southwest Prosperity Region Marshall District Library Library $95,336 $165,738 $70,402 57.5% $14,700 $1,049,614 1.4% YES
Calhoun 08 - Southwest Prosperity Region Pennfield Charter Township Township $1,886,853 $2,775,733 $888,880 68.0% $82,953 $3,011,198 2.8% NO
Calhoun 08 - Southwest Prosperity Region Springfield City $6,443,725 $10,127,290 $3,683,565 63.6% $218,062 $3,809,173 5.7% NO
Calhoun 08 - Southwest Prosperity Region
Summit Pointe Community Mental
Health Authority Authority $21,857,009 $5,581,541 -$16,275,468 391.6% $0 $51,673,560 0.0% NO
9 of 39Updated 08/10/2018
Source: Fiscal year 2017 audited financial statements or most recent year available for biennial filers

Pension System Summary
County Prosperity Region Local Unit Name Local Unit Type
Pension System Name
(If Multiple Systems) Assets Liabilities
Unfunded Actuarial
Accrued Liability Funded Ratio
Annual Required
Contribution (ARC)
Governmental Fund
Revenue ARC/Revenue
Preliminary
Underfunded Status
(1)
Michigan Department of TreasuryRetirement Pension System Summary
As of August 10, 2018
1Note: 2017 PA 202 defines "underfunded status" to mean the following:
A) For retirement pension systems, the triggers for primary units (cities, villages, counties, and townships) are if the unit is less than 60% funded and has an annual required contribution that is over 10% of governmental fund revenues. The non-primary unit trigger is if the unit is less than 60% funded.
B) For retirement health care systems, the triggers for primary units (cities, villages, counties and townships) are if the unit is less than 40% funded and has an annual required contribution greater than 12% of governmental fund revenues. The non-primary unit trigger is if the unit is less than 40% funded.
Calhoun 08 - Southwest Prosperity Region Willard Public Library Library $3,115,708 $3,569,009 $453,301 87.3% $110,988 $6,042,355 1.8% NO
Cass 08 - Southwest Prosperity Region Cass County $21,201,533 $30,492,200 $9,290,667 69.5% $709,320 $21,387,248 3.3% NO
Cass 08 - Southwest Prosperity Region Cass County Medical Care Facility Authority $5,319,944 $5,854,504 $534,560 90.9% $47,554 $8,147,328 0.6% NO
Cass 08 - Southwest Prosperity Region Cass District Library Library $863,557 $970,398 $106,841 89.0% $20,200 $1,268,286 1.6% NO
Cass 08 - Southwest Prosperity Region Dowagiac City $9,877,054 $20,298,454 $10,421,400 48.7% $801,290 $4,606,684 17.4% YES
Cass 08 - Southwest Prosperity Region Dowagiac District Library Library $94,804 $97,395 $2,591 97.3% $4,824 $424,935 1.1% NO
Cass 08 - Southwest Prosperity Region Dowagiac Housing Commission Authority $240,478 $213,071 -$27,407 112.9% $0 $1,047,310 0.0% NO
Cass 08 - Southwest Prosperity Region Howard Township Township $111,722 $144,777 $33,055 77.2% $5,997 $881,176 0.7% NO
Charlevoix 02 - Northwest Prosperity Region Boyne City City $6,505,015 $8,888,687 $2,383,672 73.2% $252,664 $6,508,633 3.9% NO
Charlevoix 02 - Northwest Prosperity Region Boyne City Housing Commission Authority $655,789 $1,126,292 $470,503 58.2% $29,552 $680,558 4.3% YES
Charlevoix 02 - Northwest Prosperity Region Charlevoix City $8,264,805 $13,333,864 $5,069,059 62.0% $318,731 $4,544,932 7.0% NO
Charlevoix 02 - Northwest Prosperity Region Charlevoix County $37,484,999 $51,910,946 $14,425,947 72.2% $1,398,350 $18,326,889 7.6% NO
Charlevoix 02 - Northwest Prosperity Region Charlevoix County Road Commission Road Commission $6,177,289 $8,185,654 $2,008,365 75.5% $224,810 $10,585,980 2.1% NO
Charlevoix 02 - Northwest Prosperity Region East Jordan City $3,222,269 $4,921,457 $1,699,188 65.5% $129,081 $2,076,328 6.2% NO
Charlevoix 02 - Northwest Prosperity Region East Jordan City Housing Commission Authority $108,175 $119,022 $10,847 90.9% $145,696 0.0% NO
Charlevoix 02 - Northwest Prosperity Region Grandvue Medical Care Facility Authority $18,663,510 $18,620,737 -$42,773 100.2% $597,290 $15,895,109 3.8% NO
Charlevoix 02 - Northwest Prosperity Region Jordan Valley District Library Library $249,867 $264,694 $14,827 94.4% $5,568 $367,595 1.5% NO
Charlevoix 02 - Northwest Prosperity Region
Northwest Michigan Community Health
Agency Authority $4,712,798 $6,507,100 $1,794,302 72.4% $255,366 $20,855,867 1.2% NO
Cheboygan 03 - Northeast Prosperity Region Cheboygan City $6,366,289 $10,434,677 $4,068,388 61.0% $284,658 $3,375,855 8.4% NO
Cheboygan 03 - Northeast Prosperity Region Cheboygan County $19,498,074 $27,992,330 $8,494,256 69.7% $974,897 $15,636,197 6.2% NO
Cheboygan 03 - Northeast Prosperity Region Cheboygan County Road Commission Road Commission $9,782,185 $20,804,660 $11,022,475 47.0% $912,327 $10,905,721 8.4% YES
Cheboygan 03 - Northeast Prosperity Region Mackinaw City Village $915,176 $1,115,766 $200,590 82.0% $27,936 $2,594,164 1.1% NO
Cheboygan 03 - Northeast Prosperity Region Tuscarora Township Township $1,519,447 $2,282,831 $763,384 66.6% $86,165 $1,908,789 4.5% NO
Chippewa 01 - Upper Peninsula Prosperity Alliance Chippewa County $29,608,775 $43,282,064 $13,673,289 68.4% $1,477,710 $25,656,723 5.8% NO
Chippewa 01 - Upper Peninsula Prosperity Alliance Chippewa County Health Department Authority $8,857,301 $12,679,868 $3,822,567 69.9% $312,144 $6,373,655 4.9% NO
Chippewa 01 - Upper Peninsula Prosperity Alliance Chippewa County Road Commission Road Commission $10,192,701 $19,743,836 $9,551,135 51.6% $842,918 $12,660,984 6.7% YES
Chippewa 01 - Upper Peninsula Prosperity Alliance Detour Village $183,099 $482,622 $299,523 37.9% $29,960 $582,184 5.1% NO
Chippewa 01 - Upper Peninsula Prosperity Alliance Drummond Island Township $165,539 $205,774 $40,235 80.4% $9,126 $1,044,022 0.9% NO
Chippewa 01 - Upper Peninsula Prosperity Alliance
Eastern Upper Peninsula Regional
Planning & Development Commission Authority $305,105 $226,562 -$78,543 134.7% $3,354 $679,481 0.5% NO
Chippewa 01 - Upper Peninsula Prosperity Alliance
Eastern Upper Peninsula Transportation
Authority Authority $5,031,330 $11,408,816 $6,377,486 44.1% $423,807 $4,381,794 9.7% YES
Chippewa 01 - Upper Peninsula Prosperity Alliance
Ecomonic Development Commission Of
The City Of Sault Ste Marie Authority $166,792 $250,600 $83,808 66.6% $4,647 $197,025 2.4% NO
Chippewa 01 - Upper Peninsula Prosperity Alliance
Economic Development Corporation Of
Chippewa County Authority $1,457,328 $1,864,002 $406,674 78.2% $47,815 $3,794,995 1.3% NO
Chippewa 01 - Upper Peninsula Prosperity Alliance Sault Ste Marie City
City of Sault Ste Marie
Firemen and Policemen
Retirement System $14,343,657 $28,367,680 $14,024,023 50.6% $1,369,975 $15,181,049 12.7% YES
Chippewa 01 - Upper Peninsula Prosperity Alliance Sault Ste Marie City MERS $19,856,088 $29,833,182 $9,977,094 66.6% $553,169 $15,181,049 12.7% NO
Chippewa 01 - Upper Peninsula Prosperity Alliance
Sault Ste Marie City Housing
Commission Authority $1,902,630 $2,045,853 $143,223 93.0% $24,426 $2,107,125 1.2% NO
Chippewa 01 - Upper Peninsula Prosperity Alliance Superior District Library Library $1,222,608 $819,927 -$402,681 149.1% $0 $1,046,962 0.0% NO
Clare 05 - East Central Michigan Prosperity Region Clare City $5,133,579 $8,633,270 $3,499,691 59.5% $246,242 $3,829,166 6.4% NO
Clare 05 - East Central Michigan Prosperity Region Clare County
MERS for the Transit
Corporation $174,210 $260,996 $86,786 66.7% $22,068 $14,940,262 4.8% NO
Clare 05 - East Central Michigan Prosperity Region Clare County
Municipal Employees
Retirement System $15,514,617 $22,676,997 $7,162,380 68.4% $691,336 $14,940,262 4.8% NO
Clare 05 - East Central Michigan Prosperity Region Clare County Road Commission Road Commission $7,602,960 $11,756,616 $4,153,656 64.7% $277,078 $7,658,894 3.6% NO
Clare 05 - East Central Michigan Prosperity Region Harrison City $2,456,627 $3,493,634 $1,037,007 70.3% $86,154 $2,672,246 3.2% NO
Clare 05 - East Central Michigan Prosperity Region Harrison District Library Library $157,487 $252,696 $95,209 62.3% $8,293 $298,123 2.8% NO
Clinton 07 - South Central Prosperity Region Bath Charter Township Township $5,573,524 $7,427,598 $1,854,074 75.0% $149,977 $4,554,778 3.3% NO
Clinton 07 - South Central Prosperity Region Clinton County MERS $59,015,258 $58,384,353 -$630,905 101.1% $1,077,588 $28,067,353 3.8% NO
10 of 39Updated 08/10/2018
Source: Fiscal year 2017 audited financial statements or most recent year available for biennial filers

Pension System Summary
County Prosperity Region Local Unit Name Local Unit Type
Pension System Name
(If Multiple Systems) Assets Liabilities
Unfunded Actuarial
Accrued Liability Funded Ratio
Annual Required
Contribution (ARC)
Governmental Fund
Revenue ARC/Revenue
Preliminary
Underfunded Status
(1)
Michigan Department of TreasuryRetirement Pension System Summary
As of August 10, 2018
1Note: 2017 PA 202 defines "underfunded status" to mean the following:
A) For retirement pension systems, the triggers for primary units (cities, villages, counties, and townships) are if the unit is less than 60% funded and has an annual required contribution that is over 10% of governmental fund revenues. The non-primary unit trigger is if the unit is less than 60% funded.
B) For retirement health care systems, the triggers for primary units (cities, villages, counties and townships) are if the unit is less than 40% funded and has an annual required contribution greater than 12% of governmental fund revenues. The non-primary unit trigger is if the unit is less than 40% funded.
Clinton 07 - South Central Prosperity Region Clinton County MERS $59,015,258 $58,384,353 -$630,905 101.1% $1,077,588 $28,067,353 3.8% NO
Clinton 07 - South Central Prosperity Region Clinton County Road Commission Road Commission $12,845,729 $21,633,871 $8,788,142 59.4% $695,686 $15,599,555 4.5% YES
Clinton 07 - South Central Prosperity Region Dewitt City $2,479,768 $5,126,008 $2,646,240 48.4% $198,528 $3,426,919 5.8% NO
Clinton 07 - South Central Prosperity Region Dewitt Charter Township Township $3,912,316 $5,614,349 $1,702,033 69.7% $187,397 $6,939,096 2.7% NO
Clinton 07 - South Central Prosperity Region Fowler Village $289,552 $396,886 $107,334 73.0% $17,370 $568,499 3.1% NO
Clinton 07 - South Central Prosperity Region
Southern Clinton County Municipal
Utilities Authority Authority $3,350,004 $4,045,382 $695,378 82.8% $71,460 $3,593,699 2.0% NO
Clinton 07 - South Central Prosperity Region St Johns City $8,029,317 $17,584,767 $9,555,450 45.7% $762,754 $6,429,394 11.9% YES
Clinton 07 - South Central Prosperity Region Westphalia Village $435,003 $598,832 $163,829 72.6% $14,844 $532,292 2.8% NO
Crawford 03 - Northeast Prosperity Region Crawford County $20,166,870 $20,275,857 $108,987 99.5% $45,890 $10,318,947 0.4% NO
Crawford 03 - Northeast Prosperity Region
Crawford County Transportation
Authority Authority $4,021,837 $5,634,138 $1,612,301 71.4% $109,022 $1,553,170 7.0% NO
Crawford 03 - Northeast Prosperity Region Grayling City $2,276,930 $4,003,525 $1,726,595 56.9% $179,580 $3,260,341 5.5% NO
Delta 01 - Upper Peninsula Prosperity Alliance Delta County $25,490,405 $37,481,999 $11,991,594 68.0% $879,024 $15,559,288 5.6% NO
Delta 01 - Upper Peninsula Prosperity Alliance Delta Area Transit Authority Authority $37,352 $43,863 $6,511 85.2% $9,731 $289,438 3.4% NO
Delta 01 - Upper Peninsula Prosperity Alliance Delta County Road Commission Road Commission $6,077,386 $12,099,849 $6,022,463 50.2% $439,535 $8,482,520 5.2% YES
Delta 01 - Upper Peninsula Prosperity Alliance Escanaba City MERS $19,677,756 $35,812,342 $16,134,586 54.9% $1,332,991 $11,862,536 20.8% YES
Delta 01 - Upper Peninsula Prosperity Alliance Escanaba City Act 345 $28,608,175 $34,276,632 $5,668,457 83.5% $1,134,353 $11,862,536 20.8% NO
Delta 01 - Upper Peninsula Prosperity Alliance Gladstone City $6,015,667 $13,189,003 $7,173,336 45.6% $721,620 $4,193,365 17.2% YES
Delta 01 - Upper Peninsula Prosperity Alliance
Public Health, Delta And Menominee
County Authority $8,828,966 $10,061,042 $1,232,076 87.8% $319,441 $3,385,136 9.4% NO
Dickinson 01 - Upper Peninsula Prosperity Alliance Dickinson County $21,574,395 $35,453,783 $13,879,388 60.9% $1,166,542 $15,498,279 7.5% NO
Dickinson 01 - Upper Peninsula Prosperity Alliance Dickinson County Road Commission Road Commission $4,840,383 $10,482,381 $5,641,998 46.2% $390,252 $6,515,924 6.0% YES
Dickinson 01 - Upper Peninsula Prosperity Alliance Iron Mountain City P&F PENSION (PA 345) $10,481,877 $16,597,624 $6,115,747 63.2% $632,912 $7,672,814 14.3% NO
Dickinson 01 - Upper Peninsula Prosperity Alliance Iron Mountain City MERS $4,754,795 $12,468,657 $7,713,862 38.1% $467,151 $7,672,814 14.3% YES
Dickinson 01 - Upper Peninsula Prosperity Alliance
Iron Mountain- Kingsford Joint Sewage
Authority Authority $842,203 $1,360,658 $518,455 61.9% $37,069 $1,019,652 3.6% NO
Dickinson 01 - Upper Peninsula Prosperity Alliance Kingsford City
City of Kingsford Police
and Firemen Retirement
System $17,734,052 $17,211,977 -$522,075 103.0% $415,442 $4,654,082 13.1% NO
Dickinson 01 - Upper Peninsula Prosperity Alliance Kingsford City
Municipal Employees
Retirement System $5,292,471 $8,414,436 $3,121,965 62.9% $192,851 $4,654,082 13.1% NO
Dickinson 01 - Upper Peninsula Prosperity Alliance
Northpointe Behavioral Healthcare
Systems Authority $10,981,301 $12,940,663 $1,959,362 84.9% $276,712 $17,027,564 1.6% NO
Dickinson 01 - Upper Peninsula Prosperity Alliance Norway City $8,356,885 $19,809,486 $11,452,601 42.2% $687,116 $3,752,293 18.3% YES
Eaton 07 - South Central Prosperity Region Barry- Eaton District Health Department Authority $14,381,735 $20,478,126 $6,096,391 70.2% $502,469 $6,489,702 7.7% NO
Eaton 07 - South Central Prosperity Region Charlotte City $12,243,499 $21,747,435 $9,503,936 56.3% $604,246 $6,308,536 9.6% NO
Eaton 07 - South Central Prosperity Region Charlotte Community Library Library $381,410 $770,927 $389,517 49.5% $38,880 $526,015 7.4% YES
Eaton 07 - South Central Prosperity Region Delta Charter Township Township $10,936,244 $14,148,458 $3,212,214 77.3% $258,411 $18,489,601 1.4% NO
Eaton 07 - South Central Prosperity Region Dimondale Village $644,134 $849,891 $205,757 75.8% $16,848 $694,421 2.4% NO
Eaton 07 - South Central Prosperity Region Eaton County
Eaton County Medical
Care Facility - MERS $9,590,451 $11,267,232 $1,676,781 85.1% $448,109 $43,603,891 7.8% NO
Eaton 07 - South Central Prosperity Region Eaton County Eaton County - MERS $84,469,694 $152,754,300 $68,284,606 55.3% $2,969,160 $43,603,891 7.8% NO
Eaton 07 - South Central Prosperity Region Eaton Rapids City $8,538,127 $14,544,381 $6,006,254 58.7% $424,370 $3,585,598 11.8% YES
Eaton 07 - South Central Prosperity Region Grand Ledge City $1,858,341 $3,225,633 $1,367,292 57.6% $90,446 $4,818,251 1.9% NO
Eaton 07 - South Central Prosperity Region Grand Ledge Area District Library Library $17,793 $19,418 $1,625 91.6% $4,391 $734,050 0.6% NO
Eaton 07 - South Central Prosperity Region
Grand Ledge Area Emergency Services
Authority Authority $1,345,385 $1,561,417 $216,032 86.2% $52,881 $1,802,127 2.9% NO
Eaton 07 - South Central Prosperity Region Potterville City $662,348 $948,270 $285,922 69.8% $46,903 $1,461,731 3.2% NO
Emmet 02 - Northwest Prosperity Region
Bay Bluffs - Emmet County Medical
Care Facility Authority $2,233,528 $2,135,867 -$97,661 104.6% $0 $13,219,008 0.0% NO
Emmet 02 - Northwest Prosperity Region Emmet County $4,660,272 $4,208,182 -$452,090 110.7% $0 $32,023,155 0.0% NO
Emmet 02 - Northwest Prosperity Region Emmet County Road Commission Road Commission $9,874,215 $14,222,673 $4,348,458 69.4% $645,673 $13,951,932 4.6% NO
Emmet 02 - Northwest Prosperity Region
Harbor Springs Area Sewage Disposal
Authority Authority $979,024 $1,097,451 $118,427 89.2% $28,176 $1,564,468 1.8% NO
Emmet 02 - Northwest Prosperity Region Lakeview Cemetery Board Authority $115,277 $117,435 $2,158 98.2% $5,751 $158,846 3.6% NO
Emmet 02 - Northwest Prosperity Region Pellston Village $343,213 $475,576 $132,363 72.2% $7,697 $421,137 1.8% NO
11 of 39Updated 08/10/2018
Source: Fiscal year 2017 audited financial statements or most recent year available for biennial filers
Pension System Summary
County Prosperity Region Local Unit Name Local Unit Type
Pension System Name
(If Multiple Systems) Assets Liabilities
Unfunded Actuarial
Accrued Liability Funded Ratio
Annual Required
Contribution (ARC)
Governmental Fund
Revenue ARC/Revenue
Preliminary
Underfunded Status
(1)
Michigan Department of TreasuryRetirement Pension System Summary
As of August 10, 2018
1Note: 2017 PA 202 defines "underfunded status" to mean the following:
A) For retirement pension systems, the triggers for primary units (cities, villages, counties, and townships) are if the unit is less than 60% funded and has an annual required contribution that is over 10% of governmental fund revenues. The non-primary unit trigger is if the unit is less than 60% funded.
B) For retirement health care systems, the triggers for primary units (cities, villages, counties and townships) are if the unit is less than 40% funded and has an annual required contribution greater than 12% of governmental fund revenues. The non-primary unit trigger is if the unit is less than 40% funded.
Emmet 02 - Northwest Prosperity Region Petoskey City MERS - City Employees $21,722,382 $26,539,170 $4,816,788 81.9% $686,087 $8,529,979 8.3% NO
Emmet 02 - Northwest Prosperity Region Petoskey City
MERS - Library
Employees $317,372 $387,747 $70,375 81.9% $24,634 $8,529,979 8.3% NO
Genesee 06 - East Michigan Prosperity Region Beecher Metropolitan District Authority $4,341,046 $6,479,743 $2,138,697 67.0% $211,542 $3,852,677 5.5% NO
Genesee 06 - East Michigan Prosperity Region Bishop International Airport Authority Authority $7,596,201 $10,137,578 $2,541,377 74.9% $330,837 $19,147,571 1.7% NO
Genesee 06 - East Michigan Prosperity Region Burton City $21,777,985 $52,671,403 $30,893,418 41.3% $2,248,097 $17,100,112 13.1% YES
Genesee 06 - East Michigan Prosperity Region Clio City $1,284,282 $1,738,781 $454,499 73.9% $61,719 $1,643,329 3.8% NO
Genesee 06 - East Michigan Prosperity Region Davison City City of Davison $6,064,952 $12,163,907 $6,098,955 49.9% $472,201 $3,334,509 16.1% YES
Genesee 06 - East Michigan Prosperity Region Davison City
City of Davison Non-
Union Pension Plan $1,100,496 $1,248,286 $147,790 88.2% $64,484 $3,334,509 16.1% NO
Genesee 06 - East Michigan Prosperity Region
Davison Richfield Senior Citizens
Authority Authority $158,565 $300,712 $142,147 52.7% $10,743 $215,323 5.0% YES
Genesee 06 - East Michigan Prosperity Region Davison Township Township $10,181,301 $14,228,186 $4,046,885 71.6% $351,609 $6,710,178 0.0% NO
Genesee 06 - East Michigan Prosperity Region Fenton City $10,088,701 $16,755,322 $6,666,621 60.2% $572,230 $8,706,842 6.6% NO
Genesee 06 - East Michigan Prosperity Region Flint City $203,099,493 $548,844,656 $345,745,163 37.0% $17,325,673 $86,855,728 19.9% YES
Genesee 06 - East Michigan Prosperity Region Flint Charter Township Township
Flint Township
Firefighters' Retirement
System $7,175,295 $9,426,040 $2,250,745 76.1% $277,622 $14,775,826 7.7% NO
Genesee 06 - East Michigan Prosperity Region Flint Charter Township Township MERS $18,964,043 $31,221,673 $12,257,630 60.7% $855,755 $14,775,826 7.7% NO
Genesee 06 - East Michigan Prosperity Region Flint Public Library Library $1,612,264 $1,455,320 -$156,944 110.8% $9,746 $4,280,046 0.2% NO
Genesee 06 - East Michigan Prosperity Region Flushing City $9,496,483 $19,830,798 $10,334,315 47.9% $1,104,835 $5,206,461 21.2% YES
Genesee 06 - East Michigan Prosperity Region Flushing Charter Township Township $3,462,116 $5,619,532 $2,157,416 61.6% $201,487 $2,414,777 8.3% NO
Genesee 06 - East Michigan Prosperity Region Genesee County $228,296,310 $387,375,731 $159,079,421 58.9% $9,041,206 $193,287,745 4.7% NO
Genesee 06 - East Michigan Prosperity Region Genesee Charter Township Township $8,399,390 $17,682,133 $9,282,743 47.5% $651,816 $6,101,265 10.7% YES
Genesee 06 - East Michigan Prosperity Region Genesee County Road Commission Road Commission $55,947,560 $93,338,844 $37,391,284 59.9% $1,835,144 $50,268,119 3.7% YES
Genesee 06 - East Michigan Prosperity Region
Genesee County Water & Waste
Services Authority $42,930,000 $70,488,810 $27,558,810 60.9% $1,430,189 $82,505,937 1.7% NO
Genesee 06 - East Michigan Prosperity Region Genesee District Library Library $13,081,574 $20,099,871 $7,018,297 65.1% $482,817 $9,782,104 4.9% NO
Genesee 06 - East Michigan Prosperity Region Genesee Health System Authority
Genesee County
Employees' Retirement
System $86,136,080 $132,993,414 $46,857,334 64.8% $3,067,099 $128,845,780 2.4% NO
Genesee 06 - East Michigan Prosperity Region Genesee Health System Authority
Genesee County
Employees' Retirement
System $81,849,000 $140,774,616 $58,925,616 58.1% $2,442,981 $131,314,578 1.9% YES
Genesee 06 - East Michigan Prosperity Region Grand Blanc City $13,638,630 $14,156,263 $517,633 96.3% $196,616 $5,143,447 3.8% NO
Genesee 06 - East Michigan Prosperity Region Grand Blanc Charter Township Township $12,668,625 $20,979,928 $8,311,303 60.4% $978,987 $16,726,655 5.9% NO
Genesee 06 - East Michigan Prosperity Region
Metro Police Authority Of Genesee
County Authority $0 $0 $0 $154,848 $3,186,058 4.9% NO
Genesee 06 - East Michigan Prosperity Region Montrose City $505,299 $1,057,953 $552,654 47.8% $48,859 $1,017,458 4.8% NO
Genesee 06 - East Michigan Prosperity Region Mount Morris Charter Township Township $18,052,065 $35,075,191 $17,023,126 51.5% $1,259,724 $7,795,032 16.2% YES
Genesee 06 - East Michigan Prosperity Region Mt Morris City $5,300,571 $7,207,520 $1,906,949 73.5% $80,899 $1,852,689 4.4% NO
Genesee 06 - East Michigan Prosperity Region Mundy Charter Township Township $6,196,019 $8,133,524 $1,937,505 76.2% $98,119 $5,227,244 1.9% NO
Genesee 06 - East Michigan Prosperity Region Otisville Village $831,982 $1,202,962 $370,980 69.2% $39,064 $541,858 7.2% NO
Genesee 06 - East Michigan Prosperity Region Richfield Township Township $2,708,600 $4,930,603 $2,222,003 54.9% $123,240 $2,485,829 5.0% NO
Genesee 06 - East Michigan Prosperity Region Swartz Creek City $7,485,780 $8,577,606 $1,091,826 87.3% $94,061 $4,066,560 2.3% NO
Genesee 06 - East Michigan Prosperity Region Vienna Charter Township Township $1,115,298 $1,825,091 $709,793 61.1% $39,419 $3,928,815 1.0% NO
Gladwin 05 - East Central Michigan Prosperity Region
Council On Aging Clare And Gladwin
Counties Authority $2,738,336 $3,808,762 $1,070,426 71.9% $80,058 $853,292 9.4% NO
Gladwin 05 - East Central Michigan Prosperity Region Gladwin County $16,316,891 $23,450,756 $7,133,865 69.6% $679,332 $10,615,843 6.4% NO
Gladwin 05 - East Central Michigan Prosperity Region Gladwin City $1,339,516 $1,587,883 $248,367 84.4% $56,290 $2,224,160 2.5% NO
Gladwin 05 - East Central Michigan Prosperity Region Gladwin City- County Transit Authority $2,738,336 $3,808,762 $1,070,426 71.9% $80,058 $1,721,477 4.7% NO
Gladwin 05 - East Central Michigan Prosperity Region Gladwin City Housing Commission Authority $2,738,336 $3,808,762 $1,070,426 71.9% $80,058 $446,050 17.9% NO
Gladwin 05 - East Central Michigan Prosperity Region Gladwin County District Library Library $965,679 $1,071,685 $106,006 90.1% $29,193 $760,517 3.8% NO
Gladwin 05 - East Central Michigan Prosperity Region Gladwin County Road Commission Road Commission $8,299,943 $16,004,689 $7,704,746 51.9% $1,017,745 $9,179,023 11.1% YES
Gladwin 05 - East Central Michigan Prosperity Region
Gladwin Housing Development
Corporation Section 8 Housing Program Authority $2,738,336 $3,808,762 $1,070,426 71.9% $80,058 $458,065 17.5% NO
Gogebic 01 - Upper Peninsula Prosperity Alliance Bessemer City $1,611,823 $2,513,085 $901,262 64.1% $107,243 $1,874,450 5.7% NO
Gogebic 01 - Upper Peninsula Prosperity Alliance Gogebic County County $27,683,832 $38,725,243 $11,041,411 71.5% $2,883,552 $7,721,187 37.3% NO
Gogebic 01 - Upper Peninsula Prosperity Alliance
Gogebic County Community Mental
Health Authority Authority $11,274,180 $18,842,453 $7,568,273 59.8% $616,699 $6,881,521 9.0% YES
12 of 39Updated 08/10/2018
Source: Fiscal year 2017 audited financial statements or most recent year available for biennial filers
Pension System Summary
County Prosperity Region Local Unit Name Local Unit Type
Pension System Name
(If Multiple Systems) Assets Liabilities
Unfunded Actuarial
Accrued Liability Funded Ratio
Annual Required
Contribution (ARC)
Governmental Fund
Revenue ARC/Revenue
Preliminary
Underfunded Status
(1)
Michigan Department of TreasuryRetirement Pension System Summary
As of August 10, 2018
1Note: 2017 PA 202 defines "underfunded status" to mean the following:
A) For retirement pension systems, the triggers for primary units (cities, villages, counties, and townships) are if the unit is less than 60% funded and has an annual required contribution that is over 10% of governmental fund revenues. The non-primary unit trigger is if the unit is less than 60% funded.
B) For retirement health care systems, the triggers for primary units (cities, villages, counties and townships) are if the unit is less than 40% funded and has an annual required contribution greater than 12% of governmental fund revenues. The non-primary unit trigger is if the unit is less than 40% funded.
Gogebic 01 - Upper Peninsula Prosperity Alliance Gogebic County Road Commission Road Commission $6,646,458 $11,017,166 $4,370,708 60.3% $383,743 $7,002,911 5.5% NO
Gogebic 01 - Upper Peninsula Prosperity Alliance Gogebic- Iron Wastewater Authority Authority $2,057,408 $3,050,744 $993,336 67.4% $74,513 $2,439,125 3.1% NO
Gogebic 01 - Upper Peninsula Prosperity Alliance Ironwood City $8,876,970 $18,469,060 $9,592,090 48.1% $980,646 $4,642,053 21.1% YES
Gogebic 01 - Upper Peninsula Prosperity Alliance Marenisco Township Township $332,786 $454,791 $122,005 73.2% $16,768 $776,265 2.2% NO
Grand Traverse 02 - Northwest Prosperity Region Bay Area Transportation Authority Authority $5,693,504 $5,899,157 $205,653 96.5% $234,317 $8,436,490 2.8% NO
Grand Traverse 02 - Northwest Prosperity Region Grand Traverse County County MERS - Pavilions $31,107,864 $38,972,485 $7,864,621 79.8% $1,442,859 $54,333,084 12.2% NO
Grand Traverse 02 - Northwest Prosperity Region Grand Traverse County County MERS - County $49,702,657 $95,780,941 $46,078,284 51.9% $5,174,005 $54,333,084 12.2% YES
Grand Traverse 02 - Northwest Prosperity Region
Grand Traverse County Road
Commission Road Commission $7,972,501 $9,014,963 $1,042,462 88.4% $715,668 $18,667,922 3.8% NO
Grand Traverse 02 - Northwest Prosperity Region
Northern Lakes Community Mental
Health Authority Authority $19,942,677 $25,391,474 $5,448,797 78.5% $928,205 $64,825,301 1.4% NO
Grand Traverse 02 - Northwest Prosperity Region
Northwestern Regional Airport
Commission Authority $6,369,653 $6,727,658 $358,005 94.7% $157,423 $12,376,681 1.3% NO
Grand Traverse 02 - Northwest Prosperity Region Traverse Area District Library Library $5,935,003 $7,157,590 $1,222,587 82.9% $99,777 $5,888,427 1.7% NO
Grand Traverse 02 - Northwest Prosperity Region Traverse City City MERS Pension Plan $23,025,579 $38,064,373 $15,038,794 60.5% $1,153,788 $22,823,560 13.0% NO
Grand Traverse 02 - Northwest Prosperity Region Traverse City City
Act 345 Retirement
System $28,784,416 $43,550,395 $14,765,979 66.1% $1,803,930 $22,823,560 13.0% NO
Grand Traverse 02 - Northwest Prosperity Region Traverse City Light & Power Authority $16,498,454 $29,463,198 $12,964,744 56.0% $944,388 $35,372,568 2.7% YES
Gratiot 05 - East Central Michigan Prosperity Region Alma City $16,861,571 $22,454,433 $5,592,862 75.1% $456,069 $6,130,882 7.4% NO
Gratiot 05 - East Central Michigan Prosperity Region Breckenridge Village $913,094 $2,367,775 $1,454,681 38.6% $80,794 $1,140,640 7.1% NO
Gratiot 05 - East Central Michigan Prosperity Region Gratiot County $22,365,724 $29,245,834 $6,880,110 76.5% $1,599,756 $17,334,643 9.2% NO
Gratiot 05 - East Central Michigan Prosperity Region Gratiot County Road Commission Road Commission $10,223,209 $17,709,150 $7,485,941 57.7% $548,863 $8,586,881 6.4% YES
Gratiot 05 - East Central Michigan Prosperity Region Ithaca City $2,519,831 $4,575,078 $2,055,247 55.1% $149,790 $2,537,568 5.9% NO
Gratiot 05 - East Central Michigan Prosperity Region Perrinton Village $92,911 $91,338 -$1,573 101.7% $2,977 $262,545 1.1% NO
Gratiot 05 - East Central Michigan Prosperity Region St Louis City $5,690,522 $7,698,125 $2,007,603 73.9% $320,220 $2,703,603 11.8% NO
Gratiot 05 - East Central Michigan Prosperity Region St Louis City Housing Commission Authority $858,194 $1,010,774 $152,580 84.9% $17,940 $1,170,548 1.5% NO
Hillsdale 09 - Southeast Michigan Prosperity Region Hillsdale City $18,273,259 $23,029,773 $4,756,514 79.3% $353,776 $6,132,817 5.8% NO
Hillsdale 09 - Southeast Michigan Prosperity Region Hillsdale County $5,122,002 $8,329,456 $3,207,454 61.5% $161,856 $16,448,288 1.0% NO
Hillsdale 09 - Southeast Michigan Prosperity Region Hillsdale City Housing Commission Authority $206,696 $193,892 -$12,804 106.6% $3,345 $324,129 1.0% NO
Hillsdale 09 - Southeast Michigan Prosperity Region Hillsdale County Road Commission Road Commission $7,298,802 $11,541,724 $4,242,922 63.2% $424,259 $8,252,485 5.1% NO
Hillsdale 09 - Southeast Michigan Prosperity Region Litchfield City $1,197,865 $1,864,159 $666,294 64.3% $68,328 $1,212,450 5.6% NO
Hillsdale 09 - Southeast Michigan Prosperity Region Michigan South Central Power Agency Authority $12,646,702 $13,415,538 $768,836 94.3% $368,496 $46,570,330 0.8% NO
Hillsdale 09 - Southeast Michigan Prosperity Region Reading City $353,497 $428,757 $75,260 82.4% $7,739 $473,074 1.6% NO
Houghton 01 - Upper Peninsula Prosperity Alliance Hancock City $2,497,079 $4,017,435 $1,520,356 62.2% $113,009 $7,312,076 1.5% NO
Houghton 01 - Upper Peninsula Prosperity Alliance Houghton City $3,520,598 $4,301,326 $780,728 81.8% $162,513 $5,083,202 3.2% NO
Houghton 01 - Upper Peninsula Prosperity Alliance Houghton County Medical Care Facility Authority $32,324,702 $35,989,639 $3,664,937 89.8% $2,223,484 $24,119,028 9.2% NO
Houghton 01 - Upper Peninsula Prosperity Alliance Houghton County Road Commission Road Commission $2,697,537 $4,347,820 $1,650,283 62.0% $251,234 $8,438,125 3.0% NO
Houghton 01 - Upper Peninsula Prosperity Alliance Lake Linden Village $630,912 $1,255,082 $624,170 50.3% $67,620 $741,278 9.1% NO
Houghton 01 - Upper Peninsula Prosperity Alliance Laurium Village $1,372,528 $2,472,350 $1,099,822 55.5% $97,127 $1,552,762 6.3% NO
Houghton 01 - Upper Peninsula Prosperity Alliance
North Houghton County Water &
Sewage Authority Authority $527,709 $682,257 $154,548 77.3% $25,112 $1,306,458 1.9% NO
Houghton 01 - Upper Peninsula Prosperity Alliance Western Up District Health Department Authority $8,777,028 $14,408,682 $5,631,654 60.9% $430,625 $3,864,764 11.1% NO
Houghton 01 - Upper Peninsula Prosperity Alliance
Western Up Planning & Development
Region Commission Authority $1,171,905 $1,381,041 $209,136 84.9% $9,552 $499,879 1.9% NO
Huron 06 - East Michigan Prosperity Region Bad Axe City $4,368,279 $7,877,814 $3,509,535 55.5% $218,774 $2,588,083 8.5% NO
Huron 06 - East Michigan Prosperity Region Bad Axe Area District Library Library $108,328 $135,545 $27,217 79.9% $4,875 $255,498 1.9% NO
Huron 06 - East Michigan Prosperity Region Caseville City $1,981,756 $2,724,212 $742,456 72.7% $82,564 $1,285,123 6.4% NO
Huron 06 - East Michigan Prosperity Region Elkton Village $525,951 $593,573 $67,622 88.6% $51,336 $981,881 5.2% NO
Huron 06 - East Michigan Prosperity Region Harbor Beach City $5,573,677 $7,974,623 $2,400,946 69.9% $115,180 $2,713,819 4.2% NO
Huron 06 - East Michigan Prosperity Region Huron County $55,785,863 $83,486,135 $27,700,272 66.8% $2,189,633 $23,974,019 9.1% NO
Huron 06 - East Michigan Prosperity Region Huron Behavioral Health Authority $15,379,936 $17,616,058 $2,236,122 87.3% $282,361 $10,494,826 2.7% NO
Huron 06 - East Michigan Prosperity Region Huron County Road Commission Road Commission $17,800,055 $26,846,605 $9,046,550 66.3% $690,276 $17,781,259 3.9% NO
Huron 06 - East Michigan Prosperity Region Kinde Village $242,968 $242,292 -$676 100.3% $8,426 $344,483 2.4% NO
Huron 06 - East Michigan Prosperity Region Pigeon Village $688,979 $1,156,649 $467,670 59.6% $36,216 $1,272,129 2.8% NO
Huron 06 - East Michigan Prosperity Region Port Austin Village $499,622 $675,830 $176,208 73.9% $15,710 $962,937 1.6% NO
Huron 06 - East Michigan Prosperity Region Sebewaing Village $6,676,849 $7,669,227 $992,378 87.1% $96,897 $1,331,824 7.3% NO
Huron 06 - East Michigan Prosperity Region Ubly Village $636,725 $949,978 $313,253 67.0% $17,049 $806,641 2.1% NO
Ingham 07 - South Central Prosperity Region Capital Area District Library Library $7,735,668 $9,173,151 $1,437,483 84.3% $297,624 $11,380,259 2.6% NO
13 of 39Updated 08/10/2018
Source: Fiscal year 2017 audited financial statements or most recent year available for biennial filers
Pension System Summary
County Prosperity Region Local Unit Name Local Unit Type
Pension System Name
(If Multiple Systems) Assets Liabilities
Unfunded Actuarial
Accrued Liability Funded Ratio
Annual Required
Contribution (ARC)
Governmental Fund
Revenue ARC/Revenue
Preliminary
Underfunded Status
(1)
Michigan Department of TreasuryRetirement Pension System Summary
As of August 10, 2018
1Note: 2017 PA 202 defines "underfunded status" to mean the following:
A) For retirement pension systems, the triggers for primary units (cities, villages, counties, and townships) are if the unit is less than 60% funded and has an annual required contribution that is over 10% of governmental fund revenues. The non-primary unit trigger is if the unit is less than 60% funded.
B) For retirement health care systems, the triggers for primary units (cities, villages, counties and townships) are if the unit is less than 40% funded and has an annual required contribution greater than 12% of governmental fund revenues. The non-primary unit trigger is if the unit is less than 40% funded.
Ingham 07 - South Central Prosperity Region
Capital Area Transportation Authority-
Cata Authority
Administrative
Employees Pension Plan $18,116,293 $20,837,015 $2,720,722 86.9% $645,500 $53,631,807 2.0% NO
Ingham 07 - South Central Prosperity Region
Capital Area Transportation Authority-
Cata Authority
Union Employees
Pension Plan $32,154,390 $32,221,042 $66,652 99.8% $446,533 $53,631,807 2.0% NO
Ingham 07 - South Central Prosperity Region Capital Region Airport Authority Authority $12,464,098 $17,050,396 $4,586,298 73.1% $513,865 $19,029,621 2.7% NO
Ingham 07 - South Central Prosperity Region East Lansing City $89,397,475 $178,803,545 $89,406,070 50.0% $6,367,446 $46,629,753 13.7% YES
Ingham 07 - South Central Prosperity Region
East Lansing- Meridian Water & Sewer
Authority Authority $2,929,107 $3,671,047 $741,940 79.8% $98,400 $4,281,821 2.3% NO
Ingham 07 - South Central Prosperity Region Ingham County MERS-County $235,375,440 $383,349,826 $147,974,386 61.4% $11,340,321 $166,576,103 7.6% NO
Ingham 07 - South Central Prosperity Region Ingham County
MERS-Medical Care
Facility $26,706,277 $24,637,776 -$2,068,501 108.4% $166,576,103 7.6% NO
Ingham 07 - South Central Prosperity Region Ingham County
MERS-Road
Department $19,864,461 $38,897,483 $19,033,022 51.1% $1,355,684 $166,576,103 7.6% NO
Ingham 07 - South Central Prosperity Region Lansing City
Employee Retirement
System $169,965,440 $307,450,034 $137,484,594 55.3% $10,246,872 $153,167,115 14.2% YES
Ingham 07 - South Central Prosperity Region Lansing City
Police and Fire
Retirement System $288,441,203 $429,670,098 $141,228,895 67.1% $11,521,768 $153,167,115 14.2% NO
Ingham 07 - South Central Prosperity Region Lansing Charter Township Township $7,408,770 $8,890,928 $1,482,158 83.3% $248,140 $8,054,559 3.1% NO
Ingham 07 - South Central Prosperity Region Lansing City Board Of Water & Light Authority $65,923,813 $56,894,658 -$9,029,155 115.9% $0 $372,823,261 0.0% NO
Ingham 07 - South Central Prosperity Region Lansing Housing Commission Authority $7,523,808 $8,886,861 $1,363,053 84.7% $122,057 $18,837,632 0.6% NO
Ingham 07 - South Central Prosperity Region Leslie City $1,305,815 $1,913,476 $607,661 68.2% $50,878 $1,634,885 3.1% NO
Ingham 07 - South Central Prosperity Region Leslie Township Township $366,850 $449,011 $82,161 81.7% $17,868 $435,038 4.1% NO
Ingham 07 - South Central Prosperity Region Mason City $11,764,426 $18,768,300 $7,003,874 62.7% $459,148 $6,839,837 6.7% NO
Ingham 07 - South Central Prosperity Region Meridian Charter Township Township
Municipal Employees
Retirement System $34,557,642 $62,305,206 $27,747,564 55.5% $1,835,443 $24,165,266 8.4% NO
Ingham 07 - South Central Prosperity Region Meridian Charter Township Township
Charter Township of
Meridian Employees $4,507,484 $5,332,500 $825,016 84.5% $206,057 $24,165,266 8.4% NO
Ingham 07 - South Central Prosperity Region Stockbridge Village $621,519 $1,043,604 $422,085 59.6% $37,482 $700,256 5.4% NO
Ingham 07 - South Central Prosperity Region
Tri- County Aging Consortium
(ingham/clinton/eaton) Authority $7,964,109 $8,888,392 $924,283 89.6% $245,572 $25,751,367 1.0% NO
Ingham 07 - South Central Prosperity Region Vevay Township Township $333,995 $635,044 $301,049 52.6% $39,302 $647,088 6.1% NO
Ingham 07 - South Central Prosperity Region Williamston City $3,119,101 $4,826,548 $1,707,447 64.6% $152,459 $2,504,272 6.1% NO
Ionia 04 - West Michigan Prosperity Alliance Belding City $1,173,784 $2,358,608 $1,184,824 49.8% $72,060 $4,141,353 1.7% NO
Ionia 04 - West Michigan Prosperity Alliance Ionia County MERS $7,830,072 $9,805,899 $1,975,827 79.9% $294,478 $19,730,887 2.9% NO
Ionia 04 - West Michigan Prosperity Alliance Ionia County
County of Ionia Pension
Plan $10,101,642 $11,191,619 $1,089,977 90.3% $285,715 $19,730,887 2.9% NO
Ionia 04 - West Michigan Prosperity Alliance Ionia City $9,929,353 $21,618,661 $11,689,308 45.9% $865,744 $6,738,507 12.8% YES
Ionia 04 - West Michigan Prosperity Alliance Ionia City Housing Commission Authority $879,377 $1,229,409 $350,032 71.5% $36,084 $857,179 4.2% NO
Ionia 04 - West Michigan Prosperity Alliance Ionia Community Library Library $422,032 $657,425 $235,393 64.2% $27,696 $556,549 5.0% NO
Ionia 04 - West Michigan Prosperity Alliance Ionia County Road Commission Road Commission $6,623,237 $17,524,445 $10,901,208 37.8% $708,456 $12,825,407 5.5% YES
Ionia 04 - West Michigan Prosperity Alliance Lake Odessa Village $334,655 $325,128 -$9,527 102.9% $12,353 $1,191,890 1.0% NO
Ionia 04 - West Michigan Prosperity Alliance Lyons Village $180,734 $191,934 $11,200 94.2% $4,379 $340,739 1.3% NO
Ionia 04 - West Michigan Prosperity Alliance Muir Village $260,623 $347,979 $87,356 74.9% $11,604 $518,009 2.2% NO
Ionia 04 - West Michigan Prosperity Alliance Pewamo Village $247,406 $343,737 $96,331 72.0% $9,641 $293,952 3.3% NO
Ionia 04 - West Michigan Prosperity Alliance Portland City $8,248,863 $13,686,785 $5,437,922 60.3% $512,810 $4,808,706 10.7% NO
Ionia 04 - West Michigan Prosperity Alliance Saranac Village Housing Commission Authority $457,788 $808,946 $351,158 56.6% $24,271 $1,142,571 2.1% YES
Iosco 03 - Northeast Prosperity Region Iosco County $19,677,151 $27,263,101 $7,585,950 72.2% $952,113 $14,542,601 6.5% NO
Iosco 03 - Northeast Prosperity Region Iosco County Medical Care Facility Authority $6,605,182 $6,582,305 -$22,877 100.3% $102,535 $8,256,846 1.2% NO
Iosco 03 - Northeast Prosperity Region Iosco County Road Commission Road Commission $8,647,101 $11,588,958 $2,941,857 74.6% $214,896 $7,993,823 2.7% NO
Iosco 03 - Northeast Prosperity Region Oscoda Charter Township Township $2,738,958 $4,200,675 $1,461,717 65.2% $140,600 $3,889,108 3.6% NO
Iosco 03 - Northeast Prosperity Region Oscoda- Wurtsmith Airport Authority Authority $310,484 $411,134 $100,650 75.5% $13,667 $1,539,488 0.9% NO
Iosco 03 - Northeast Prosperity Region Tawas Police Authority Authority $629,637 $1,157,930 $528,293 54.4% $25,127 $518,670 4.8% YES
Iron 01 - Upper Peninsula Prosperity Alliance Alpha Village $65,954 $47,514 -$18,440 138.8% $0 $98,256 0.0% NO
Iron 01 - Upper Peninsula Prosperity Alliance Bates Township Township $130,202 $299,265 $169,063 43.5% $12,732 $433,295 2.9% NO
Iron 01 - Upper Peninsula Prosperity Alliance Caspian City $607,308 $1,297,520 $690,212 46.8% $55,932 $788,102 7.1% NO
Iron 01 - Upper Peninsula Prosperity Alliance Crystal Falls City $5,202,137 $9,220,492 $4,018,355 56.4% $374,566 $1,438,452 26.0% YES
Iron 01 - Upper Peninsula Prosperity Alliance Gaastra City $198,314 $318,956 $120,642 62.2% $9,055 $356,078 2.5% NO
Iron 01 - Upper Peninsula Prosperity Alliance Iron County $6,000,215 $8,518,382 $2,518,167 70.4% $322,809 $8,945,929 3.6% NO
Iron 01 - Upper Peninsula Prosperity Alliance Iron County Housing Commission Authority $624,437 $1,000,118 $375,681 62.4% $24,885 $1,265,980 2.0% NO
14 of 39Updated 08/10/2018
Source: Fiscal year 2017 audited financial statements or most recent year available for biennial filers

Pension System Summary
County Prosperity Region Local Unit Name Local Unit Type
Pension System Name
(If Multiple Systems) Assets Liabilities
Unfunded Actuarial
Accrued Liability Funded Ratio
Annual Required
Contribution (ARC)
Governmental Fund
Revenue ARC/Revenue
Preliminary
Underfunded Status
(1)
Michigan Department of TreasuryRetirement Pension System Summary
As of August 10, 2018
1Note: 2017 PA 202 defines "underfunded status" to mean the following:
A) For retirement pension systems, the triggers for primary units (cities, villages, counties, and townships) are if the unit is less than 60% funded and has an annual required contribution that is over 10% of governmental fund revenues. The non-primary unit trigger is if the unit is less than 60% funded.
B) For retirement health care systems, the triggers for primary units (cities, villages, counties and townships) are if the unit is less than 40% funded and has an annual required contribution greater than 12% of governmental fund revenues. The non-primary unit trigger is if the unit is less than 40% funded.
Iron 01 - Upper Peninsula Prosperity Alliance Iron County Medical Care Facility Authority $23,328,106 $31,427,213 $8,099,107 74.2% $1,047,260 $22,659,110 4.6% NO
Iron 01 - Upper Peninsula Prosperity Alliance Iron County Road Commission Road Commission $5,412,073 $12,612,803 $7,200,730 42.9% $540,440 $6,490,702 8.3% YES
Iron 01 - Upper Peninsula Prosperity Alliance Iron River City $5,510,291 $9,787,578 $4,277,287 56.3% $257,720 $2,707,542 9.5% NO
Iron 01 - Upper Peninsula Prosperity Alliance Stambaugh Township Township $90,742 $157,003 $66,261 57.8% $4,688 $474,403 1.0% NO
Iron 01 - Upper Peninsula Prosperity Alliance West Iron County Sewer Authority Authority $554,999 $1,155,854 $600,855 48.0% $50,328 $806,159 6.2% YES
Isabella 05 - East Central Michigan Prosperity Region Chippewa River District Library Library $2,748,211 $3,117,503 $369,292 88.2% $79,037 $2,313,365 3.4% NO
Isabella 05 - East Central Michigan Prosperity Region
City Of Mt Pleasant Tifa - Central
Business District Authority $391,934 $567,471 $175,537 69.1% $17,050 $247,254 6.9% NO
Isabella 05 - East Central Michigan Prosperity Region
Community Mental Health For Central
Michigan Authority $58,309,502 $74,161,577 $15,852,075 78.6% $2,098,809 $92,716,981 2.3% NO
Isabella 05 - East Central Michigan Prosperity Region Isabella County $31,604,686 $46,222,011 $14,617,325 68.4% $1,880,760 $17,879,583 10.5% NO
Isabella 05 - East Central Michigan Prosperity Region Isabella County Medical Care Facility Authority $12,235,231 $12,866,149 $630,918 95.1% $294,024 $14,734,283 2.0% NO
Isabella 05 - East Central Michigan Prosperity Region Isabella County Road Commission Road Commission $8,811,127 $13,199,630 $4,388,503 66.8% $289,860 $15,732,771 1.8% NO
Isabella 05 - East Central Michigan Prosperity Region
Isabella County Transportation
Commission Authority $2,053,646 $2,571,631 $517,985 79.9% $48,285 $5,671,623 0.9% NO
Isabella 05 - East Central Michigan Prosperity Region Mt Pleasant City MERS $21,774,135 $31,526,171 $9,752,036 69.1% $947,233 $17,735,459 9.5% NO
Isabella 05 - East Central Michigan Prosperity Region Mt Pleasant City Act 345 Fire & Police $26,001,818 $28,575,055 $2,573,237 91.0% $732,666 $17,735,459 9.5% NO
Isabella 05 - East Central Michigan Prosperity Region Shepherd Village $515,960 $594,266 $78,306 86.8% $9,615 $836,952 1.1% NO
Jackson 09 - Southeast Michigan Prosperity Region Blackman Charter Township Township $7,724,042 $12,377,473 $4,653,431 62.4% $312,369 $5,795,256 5.4% NO
Jackson 09 - Southeast Michigan Prosperity Region Brooklyn Village $752,344 $1,152,910 $400,566 65.3% $43,892 $982,128 4.5% NO
Jackson 09 - Southeast Michigan Prosperity Region Jackson City
Policemen's &
Firemens' Pension $3,273,277 $7,549,654 $4,276,377 43.4% $565,463 $44,412,412 12.6% YES
Jackson 09 - Southeast Michigan Prosperity Region Jackson City
Act 345 Policemen and
Firemen Retirement
System $39,599,297 $74,506,757 $34,907,460 53.1% $4,098,288 $44,412,412 12.6% YES
Jackson 09 - Southeast Michigan Prosperity Region Jackson City
Employees Retirement
System $39,184,812 $48,905,447 $9,720,635 80.1% $933,208 $44,412,412 12.6% NO
Jackson 09 - Southeast Michigan Prosperity Region Jackson City Transportation Authority Authority $6,068,314 $8,031,968 $1,963,654 75.6% $162,673 $4,646,548 3.5% NO
Jackson 09 - Southeast Michigan Prosperity Region Jackson County County $148,113,560 $207,591,278 $59,477,718 71.3% $6,636,508 $92,190,349 7.2% NO
Jackson 09 - Southeast Michigan Prosperity Region Jackson District Library Library $7,901,996 $8,090,634 $188,638 97.7% $131,309 $6,995,839 1.9% NO
Jackson 09 - Southeast Michigan Prosperity Region Leoni Township Township $4,074,440 $6,123,327 $2,048,887 66.5% $131,921 $2,621,010 5.0% NO
Jackson 09 - Southeast Michigan Prosperity Region Lifeways- Jackson & Hillsdale Counties Authority $14,785,458 $14,263,741 -$521,717 103.7% $1,011,733 $64,015,130 1.6% NO
Jackson 09 - Southeast Michigan Prosperity Region Summit Township Township $8,305,500 $14,411,362 $6,105,862 57.6% $516,076 $4,242,568 12.2% YES
Kalamazoo 08 - Southwest Prosperity Region Central County Transportation Authority Authority $21,714,192 $23,416,017 $1,701,825 92.7% $0 $19,003,743 0.0% NO
Kalamazoo 08 - Southwest Prosperity Region Kalamazoo City $670,927,960 $461,005,777 -$209,922,183 145.5% $0 $85,695,998 0.0% NO
Kalamazoo 08 - Southwest Prosperity Region Kalamazoo Charter Township Township $9,959,297 $13,160,346 $3,201,049 75.7% $411,289 $10,198,639 4.0% NO
Kalamazoo 08 - Southwest Prosperity Region
Kalamazoo Community Mental Health &
Substance Abuse Services Authority $37,977,900 $31,380,491 -$6,597,409 121.0% $477,497 $80,092,185 0.6% NO
Kalamazoo 08 - Southwest Prosperity Region Kalamazoo County County $168,292,168 $130,049,452 -$38,242,716 129.4% $662,427 $105,253,988 0.6% NO
Kalamazoo 08 - Southwest Prosperity Region Kalamazoo County Road Commission Road Commission $15,770,686 $12,186,955 -$3,583,731 129.4% $0 $26,781,166 0.0% NO
Kalamazoo 08 - Southwest Prosperity Region Kalamazoo Public Library Library $6,344,522 $7,705,824 $1,361,302 82.3% $376,552 $12,785,665 2.9% NO
Kalamazoo 08 - Southwest Prosperity Region Parchment City $2,019,099 $3,448,581 $1,429,482 58.5% $47,447 $1,579,062 3.0% NO
Kalamazoo 08 - Southwest Prosperity Region Portage City $2,263,161 $2,370,135 $106,974 95.5% $40,258 $39,140,599 0.1% NO
Kalamazoo 08 - Southwest Prosperity Region Vicksburg Village $1,853,576 $2,851,050 $997,474 65.0% $100,613 $1,977,497 5.1% NO
Kalamazoo 08 - Southwest Prosperity Region Vicksburg District Library Library $73,823 $128,802 $54,979 57.3% $6,248 $626,937 1.0% YES
Kalkaska 02 - Northwest Prosperity Region Clearwater Township Township $96,134 $126,747 $30,613 75.8% $4,046 $694,180 0.6% NO
Kalkaska 02 - Northwest Prosperity Region Kalkaska Village $2,633,663 $5,437,684 $2,804,021 48.4% $179,714 $1,866,681 9.6% NO
Kalkaska 02 - Northwest Prosperity Region Kalkaska County County $15,642,861 $21,245,435 $5,602,574 73.6% $745,157 $10,519,594 7.1% NO
Kalkaska 02 - Northwest Prosperity Region Kalkaska County Road Commission Road Commission $3,951,351 $9,772,734 $5,821,383 40.4% $398,576 $7,819,098 5.1% YES
Kalkaska 02 - Northwest Prosperity Region Kalkaska Public Transit Authority Authority $1,807,375 $2,117,632 $310,257 85.3% $44,996 $924,506 4.9% NO
Kent 04 - West Michigan Prosperity Alliance Cascade Charter Township Township $8,476,243 $10,564,726 $2,088,483 80.2% $290,039 $10,906,673 2.7% NO
Kent 04 - West Michigan Prosperity Alliance Cedar Springs City $2,601,824 $3,315,506 $713,682 78.5% $35,940 $3,287,039 1.1% NO
Kent 04 - West Michigan Prosperity Alliance East Grand Rapids City $8,735,603 $18,354,787 $9,619,184 47.6% $1,042,416 $13,998,473 7.4% NO
Kent 04 - West Michigan Prosperity Alliance
Gerald R. Ford International Airport
Authority Authority $24,064,645 $16,118,957 -$7,945,688 149.3% $169,775 $57,108,229 0.3% NO
15 of 39Updated 08/10/2018
Source: Fiscal year 2017 audited financial statements or most recent year available for biennial filers

Pension System Summary
County Prosperity Region Local Unit Name Local Unit Type
Pension System Name
(If Multiple Systems) Assets Liabilities
Unfunded Actuarial
Accrued Liability Funded Ratio
Annual Required
Contribution (ARC)
Governmental Fund
Revenue ARC/Revenue
Preliminary
Underfunded Status
(1)
Michigan Department of TreasuryRetirement Pension System Summary
As of August 10, 2018
1Note: 2017 PA 202 defines "underfunded status" to mean the following:
A) For retirement pension systems, the triggers for primary units (cities, villages, counties, and townships) are if the unit is less than 60% funded and has an annual required contribution that is over 10% of governmental fund revenues. The non-primary unit trigger is if the unit is less than 60% funded.
B) For retirement health care systems, the triggers for primary units (cities, villages, counties and townships) are if the unit is less than 40% funded and has an annual required contribution greater than 12% of governmental fund revenues. The non-primary unit trigger is if the unit is less than 40% funded.
Kent 04 - West Michigan Prosperity Alliance Grand Rapids City
Police & Fire
Retirement System $383,172,939 $481,925,023 $98,752,084 79.5% $8,861,774 $218,902,989 8.7% NO
Kent 04 - West Michigan Prosperity Alliance Grand Rapids City
General Retirement
System $390,189,761 $510,324,266 $120,134,505 76.5% $10,237,538 $218,902,989 8.7% NO
Kent 04 - West Michigan Prosperity Alliance Grand Rapids City Housing Commission Authority $1,458,767 $2,281,968 $823,201 63.9% $123,996 $29,601,694 0.4% NO
Kent 04 - West Michigan Prosperity Alliance Kent County County $896,919,895 $859,986,247 -$36,933,648 104.3% $8,965,098 $282,563,171 3.2% NO
Kent 04 - West Michigan Prosperity Alliance
Kent County Community Mental Health
Authority Authority $30,871,760 $33,841,628 $2,969,868 91.2% $499,092 $151,794,519 0.3% NO
Kent 04 - West Michigan Prosperity Alliance Kent County Road Commission Road Commission $57,664 $172,820 $115,156 33.4% $49,380 $62,012,637 0.1% YES
Kent 04 - West Michigan Prosperity Alliance Kent District Library Library $51,053,008 $41,363,821 -$9,689,187 123.4% $45,485 $24,231,152 0.2% NO
Kent 04 - West Michigan Prosperity Alliance Kentwood City $36,593,460 $36,925,657 $332,197 99.1% $1,332,000 $35,434,090 3.8% NO
Kent 04 - West Michigan Prosperity Alliance Lowell City $8,745,794 $14,223,997 $5,478,203 61.5% $336,384 $3,192,363 10.5% NO
Kent 04 - West Michigan Prosperity Alliance Rockford City $5,507,197 $8,776,310 $3,269,113 62.8% $289,808 $4,105,621 7.1% NO
Kent 04 - West Michigan Prosperity Alliance Sparta Village $3,738,628 $5,266,936 $1,528,308 71.0% $167,230 $2,549,400 6.6% NO
Kent 04 - West Michigan Prosperity Alliance Walker City $12,924,111 $22,688,373 $9,764,262 57.0% $1,267,788 $22,066,406 5.7% NO
Kent 04 - West Michigan Prosperity Alliance Wyoming City $166,842,165 $188,929,725 $22,087,560 88.3% $4,924,584 $46,618,811 10.6% NO
Keweenaw 01 - Upper Peninsula Prosperity Alliance Keweenaw County County $2,710,381 $3,442,199 $731,818 78.7% $98,537 $2,119,982 4.6% NO
Keweenaw 01 - Upper Peninsula Prosperity Alliance Keweenaw County Road Commission Road Commission $3,292,418 $6,792,153 $3,499,735 48.5% $287,378 $3,371,998 8.5% YES
Lake 04 - West Michigan Prosperity Alliance Lake County County $12,732,804 $17,897,063 $5,164,259 71.1% $778,941 $14,459,044 5.4% NO
Lake 04 - West Michigan Prosperity Alliance Lake County Road Commission Road Commission $5,136,143 $10,431,557 $5,295,414 49.2% $413,769 $6,697,458 6.2% YES
Lapeer 06 - East Michigan Prosperity Region Almont Village $2,078,666 $2,743,173 $664,507 75.8% $80,204 $2,283,669 3.5% NO
Lapeer 06 - East Michigan Prosperity Region Columbiaville Village $366,799 $488,222 $121,423 75.1% $9,521 $678,234 1.4% NO
Lapeer 06 - East Michigan Prosperity Region Dryden Village $308,898 $406,557 $97,659 76.0% $4,548 $496,451 0.9% NO
Lapeer 06 - East Michigan Prosperity Region Imlay City City $5,230,295 $8,278,308 $3,048,013 63.2% $246,338 $3,522,291 7.0% NO
Lapeer 06 - East Michigan Prosperity Region Lapeer City $17,727,446 $26,812,037 $9,084,591 66.1% $833,666 $14,117,899 5.9% NO
Lapeer 06 - East Michigan Prosperity Region Lapeer County $103,425,033 $119,663,872 $16,238,839 86.4% $3,601,123 $51,147,742 7.0% NO
Lapeer 06 - East Michigan Prosperity Region Lapeer County Road Commission Road Commission $9,942,570 $17,679,772 $7,737,202 56.2% $1,178,266 $16,564,816 7.1% YES
Lapeer 06 - East Michigan Prosperity Region Lapeer District Library Library $3,259,402 $4,804,884 $1,545,482 67.8% $181,317 $1,935,135 9.4% NO
Lapeer 06 - East Michigan Prosperity Region Metamora Township Township $999,662 $1,188,211 $188,549 84.1% $30,438 $1,357,868 2.2% NO
Leelanau 02 - Northwest Prosperity Region Leelanau County County $24,736,620 $28,436,876 $3,700,256 87.0% $796,798 $15,388,967 5.2% NO
Leelanau 02 - Northwest Prosperity Region Leelanau County Road Commission Road Commission $6,225,173 $7,529,775 $1,304,602 82.7% $214,116 $6,827,650 3.1% NO
Lenawee 09 - Southeast Michigan Prosperity Region
Addison Fire Department & Emergency
Medical Service Authority $279,406 $318,608 $39,202 87.7% $10,620 $1,136,558 0.9% NO
Lenawee 09 - Southeast Michigan Prosperity Region Adrian City $39,177,107 $61,024,502 $21,847,395 64.2% $1,783,319 $17,337,066 10.3% NO
Lenawee 09 - Southeast Michigan Prosperity Region Blissfield Village $3,453,257 $4,107,595 $654,338 84.1% $111,509 $2,663,655 4.2% NO
Lenawee 09 - Southeast Michigan Prosperity Region Clinton Village $5,118,857 $5,499,344 $380,487 93.1% $6,130 $1,552,735 0.4% NO
Lenawee 09 - Southeast Michigan Prosperity Region Deerfield Village $1,007,147 $1,520,665 $513,518 66.2% $24,703 $408,766 6.0% NO
Lenawee 09 - Southeast Michigan Prosperity Region
Lenawee Community Mental Health
Authority Authority $13,220,658 $15,138,855 $1,918,197 87.3% $339,795 $19,337,565 1.8% NO
Lenawee 09 - Southeast Michigan Prosperity Region Lenawee County County
Lenawee County
Medical Care Facility -
Defined Benefit - Union $2,385,204 $2,234,078 -$151,126 106.8% $71,240 $41,095,466 3.7% NO
Lenawee 09 - Southeast Michigan Prosperity Region Lenawee County County
Lenawee County
Employees' Retirement
Income Plan $71,837,001 $86,156,377 $14,319,376 83.4% $1,281,247 $41,095,466 3.7% NO
Lenawee 09 - Southeast Michigan Prosperity Region Lenawee County County
Lenawee County
Medical Care Facility -
Defined Benefit -
Salaried $6,572,172 $7,738,057 $1,165,885 84.9% $152,392 $41,095,466 3.7% NO
Lenawee 09 - Southeast Michigan Prosperity Region Lenawee County Medical Care Facility Authority
Lenawee County BOC
Retirement Income Plan
- Salaried $6,572,172 $7,738,057 $1,165,885 84.9% $152,392 $13,524,834 1.7% NO
Lenawee 09 - Southeast Michigan Prosperity Region Lenawee County Medical Care Facility Authority
Lenawee County BOC
Retirement Income Plan
- Union $2,385,204 $2,234,078 -$151,126 106.8% $71,240 $13,524,834 1.7% NO
Lenawee 09 - Southeast Michigan Prosperity Region Lenawee County Road Commission Road Commission $12,273,978 $13,094,181 $820,203 93.7% $346,461 $21,207,953 1.6% NO
Lenawee 09 - Southeast Michigan Prosperity Region Madison Charter Township Township $1,130,862 $1,544,456 $413,594 73.2% $42,629 $2,352,057 1.8% NO
Lenawee 09 - Southeast Michigan Prosperity Region Tecumseh City $21,707,185 $25,868,397 $4,161,212 83.9% $495,685 $7,428,974 6.7% NO
16 of 39Updated 08/10/2018
Source: Fiscal year 2017 audited financial statements or most recent year available for biennial filers
Pension System Summary
County Prosperity Region Local Unit Name Local Unit Type
Pension System Name
(If Multiple Systems) Assets Liabilities
Unfunded Actuarial
Accrued Liability Funded Ratio
Annual Required
Contribution (ARC)
Governmental Fund
Revenue ARC/Revenue
Preliminary
Underfunded Status
(1)
Michigan Department of TreasuryRetirement Pension System Summary
As of August 10, 2018
1Note: 2017 PA 202 defines "underfunded status" to mean the following:
A) For retirement pension systems, the triggers for primary units (cities, villages, counties, and townships) are if the unit is less than 60% funded and has an annual required contribution that is over 10% of governmental fund revenues. The non-primary unit trigger is if the unit is less than 60% funded.
B) For retirement health care systems, the triggers for primary units (cities, villages, counties and townships) are if the unit is less than 40% funded and has an annual required contribution greater than 12% of governmental fund revenues. The non-primary unit trigger is if the unit is less than 40% funded.
Livingston 09 - Southeast Michigan Prosperity Region Brighton City $13,320,253 $22,159,574 $8,839,321 60.1% $576,133 $9,137,468 6.3% NO
Livingston 09 - Southeast Michigan Prosperity Region Brighton Area Fire Authority Authority $431,638 $457,453 $25,815 94.4% $7,632 $4,026,643 0.2% NO
Livingston 09 - Southeast Michigan Prosperity Region Brighton Charter Township Township $1,729,684 $1,942,612 $212,928 89.0% $9,179 $4,727,924 0.2% NO
Livingston 09 - Southeast Michigan Prosperity Region
Community Mental Health Services Of
Livingston County Authority $18,245,101 $25,770,336 $7,525,235 70.8% $529,476 $31,968,328 1.7% NO
Livingston 09 - Southeast Michigan Prosperity Region Fowlerville Village $2,976,632 $3,758,130 $781,498 79.2% $42,121 $2,437,363 1.7% NO
Livingston 09 - Southeast Michigan Prosperity Region Fowlerville District Library Library $433,555 $496,207 $62,652 87.4% $14,213 $857,075 1.7% NO
Livingston 09 - Southeast Michigan Prosperity Region Genoa Charter Township Township $296,479 $380,798 $84,319 77.9% $22,062 $8,485,731 0.3% NO
Livingston 09 - Southeast Michigan Prosperity Region Green Oak Township Township $4,816,340 $8,050,853 $3,234,513 59.8% $262,330 $9,741,377 2.7% NO
Livingston 09 - Southeast Michigan Prosperity Region Hamburg Township Township $3,184,069 $4,790,368 $1,606,299 66.5% $157,281 $9,552,700 1.6% NO
Livingston 09 - Southeast Michigan Prosperity Region Hartland Deerfield Fire Authority Authority $638,735 $731,934 $93,199 87.3% $36,632 $1,553,738 2.4% NO
Livingston 09 - Southeast Michigan Prosperity Region Howell City $13,663,084 $24,376,021 $10,712,937 56.1% $843,252 $8,328,618 10.1% YES
Livingston 09 - Southeast Michigan Prosperity Region Howell Area Fire Authority Authority $1,254,090 $1,352,746 $98,656 92.7% $37,213 $2,557,779 1.5% NO
Livingston 09 - Southeast Michigan Prosperity Region Howell Carnegie District Library Library $1,367,614 $1,500,342 $132,728 91.2% $44,140 $2,746,132 1.6% NO
Livingston 09 - Southeast Michigan Prosperity Region Huron- Clinton Metropolitan Authority Authority $59,897,338 $78,844,190 $18,946,852 76.0% $2,996,208 $51,459,905 5.8% NO
Livingston 09 - Southeast Michigan Prosperity Region Livingston County County $94,350,856 $138,591,942 $44,241,086 68.1% $4,713,118 $68,265,263 6.9% NO
Livingston 09 - Southeast Michigan Prosperity Region Livingston County Road Commission Road Commission $17,054,905 $22,883,314 $5,828,409 74.5% $682,284 $28,118,066 2.4% NO
Livingston 09 - Southeast Michigan Prosperity Region Oceola Township Township $1,134,380 $1,282,907 $148,527 88.4% $23,447 $3,974,965 0.6% NO
Livingston 09 - Southeast Michigan Prosperity Region Pinckney Village $2,405,899 $2,873,565 $467,666 83.7% $79,836 $1,723,856 4.6% NO
Luce 01 - Upper Peninsula Prosperity Alliance Luce County County $3,913,497 $7,062,168 $3,148,671 55.4% $277,125 $5,397,303 5.1% NO
Luce 01 - Upper Peninsula Prosperity Alliance Luce County Ambulance Service Authority $421,510 $395,652 -$25,858 106.5% $35,196 $1,020,421 3.4% NO
Luce 01 - Upper Peninsula Prosperity Alliance Luce County Road Commission Road Commission $4,219,963 $10,700,635 $6,480,672 39.4% $493,248 $3,483,769 14.2% YES
Luce 01 - Upper Peninsula Prosperity Alliance
Luce/mackinac/alger/schoolcraft
District Health Department Authority $7,392,437 $9,468,793 $2,076,356 78.1% $129,989 $3,327,538 3.9% NO
Mackinac 01 - Upper Peninsula Prosperity Alliance Mackinac County $13,066,381 $18,143,188 $5,076,807 72.0% $629,383 $9,148,897 6.9% NO
Mackinac 01 - Upper Peninsula Prosperity Alliance Mackinac County Housing Commission Authority $356,477 $422,113 $65,636 84.5% $15,391 $262,237 5.9% NO
Mackinac 01 - Upper Peninsula Prosperity Alliance Mackinac County Road Commission Road Commission $4,764,224 $9,068,635 $4,304,411 52.5% $494,148 $5,318,905 9.3% YES
Mackinac 01 - Upper Peninsula Prosperity Alliance St Ignace City $7,515,518 $12,052,760 $4,537,242 62.4% $329,048 $3,425,995 9.6% NO
Macomb 10 - Detroit Metro Prosperity Region Center Line City
City of Center Line
Police and Fire
Retirement System $11,950,967 $18,532,982 $6,582,015 64.5% $759,728 $10,069,798 10.3% NO
Macomb 10 - Detroit Metro Prosperity Region Center Line City MERS $3,870,553 $8,207,135 $4,336,582 47.2% $273,151 $10,069,798 10.3% YES
Macomb 10 - Detroit Metro Prosperity Region Chesterfield Charter Township Township $26,951,719 $37,276,913 $10,325,194 72.3% $1,290,876 $21,595,835 6.0% NO
Macomb 10 - Detroit Metro Prosperity Region Chesterfield Township Library Library $1,547,880 $1,257,749 -$290,131 123.1% $0 $1,237,696 0.0% NO
Macomb 10 - Detroit Metro Prosperity Region Clinton Charter Township Township MERS $42,464,285 $72,753,118 $30,288,833 58.4% $1,959,949 $57,250,431 9.7% NO
Macomb 10 - Detroit Metro Prosperity Region Clinton Charter Township Township
Clinton Township Fire
and Police Retirement
System $117,203,154 $162,002,648 $44,799,494 72.3% $3,611,452 $57,250,431 9.7% NO
Macomb 10 - Detroit Metro Prosperity Region Eastpointe City $40,193,729 $83,769,745 $43,576,016 48.0% $3,341,277 $29,178,945 11.5% YES
Macomb 10 - Detroit Metro Prosperity Region Eastpointe City Housing Commission Authority $847,633 $1,093,826 $246,193 77.5% $34,051 $2,087,098 1.6% NO
Macomb 10 - Detroit Metro Prosperity Region Fraser City $28,741,299 $57,749,685 $29,008,386 49.8% $2,140,225 $18,162,760 11.8% YES
Macomb 10 - Detroit Metro Prosperity Region Harrison Charter Township Township Employees Retirement $14,671,695 $22,024,593 $7,352,898 66.6% $735,521 $12,054,541 13.5% NO
Macomb 10 - Detroit Metro Prosperity Region Harrison Charter Township Township
Firemen's Pension
System $12,837,084 $26,484,654 $13,647,570 48.5% $891,543 $12,054,541 13.5% YES
Macomb 10 - Detroit Metro Prosperity Region Macomb County County $1,016,599,094 $1,023,600,051 $7,000,957 99.3% $19,920,483 $373,249,067 5.3% NO
Macomb 10 - Detroit Metro Prosperity Region Macomb Township Township $2,799,375 $3,342,047 $542,672 83.8% $236,000 $25,602,463 0.9% NO
Macomb 10 - Detroit Metro Prosperity Region Mount Clemens City $61,950,099 $59,884,124 -$2,065,975 103.4% $386,887 $12,274,364 3.2% NO
Macomb 10 - Detroit Metro Prosperity Region New Baltimore City $13,094,239 $16,201,705 $3,107,466 80.8% $302,807 $8,462,542 3.6% NO
Macomb 10 - Detroit Metro Prosperity Region Romeo Village $4,894,580 $8,044,411 $3,149,831 60.8% $284,428 $3,910,373 7.3% NO
Macomb 10 - Detroit Metro Prosperity Region Romeo District Library Library $2,718,070 $3,346,281 $628,211 81.2% $55,992 $2,177,997 2.6% NO
Macomb 10 - Detroit Metro Prosperity Region Roseville City $137,318,575 $194,236,076 $56,917,501 70.7% $5,107,000 $41,760,095 12.2% NO
Macomb 10 - Detroit Metro Prosperity Region Shelby Charter Township Township $111,331,018 $107,556,770 -$3,774,248 103.5% $1,971,756 $49,085,365 4.0% NO
Macomb 10 - Detroit Metro Prosperity Region Southeast Macomb Sanitary District Authority $3,086,812 $3,272,499 $185,687 94.3% $141,546 $22,857,417 0.6% NO
Macomb 10 - Detroit Metro Prosperity Region St Clair Shores City
City of St. Clair Shores
Police and Fire
Retirement System $102,735,561 $163,603,344 $60,867,783 62.8% $5,519,497 $51,603,156 15.6% NO
17 of 39Updated 08/10/2018
Source: Fiscal year 2017 audited financial statements or most recent year available for biennial filers

Pension System Summary
County Prosperity Region Local Unit Name Local Unit Type
Pension System Name
(If Multiple Systems) Assets Liabilities
Unfunded Actuarial
Accrued Liability Funded Ratio
Annual Required
Contribution (ARC)
Governmental Fund
Revenue ARC/Revenue
Preliminary
Underfunded Status
(1)
Michigan Department of TreasuryRetirement Pension System Summary
As of August 10, 2018
1Note: 2017 PA 202 defines "underfunded status" to mean the following:
A) For retirement pension systems, the triggers for primary units (cities, villages, counties, and townships) are if the unit is less than 60% funded and has an annual required contribution that is over 10% of governmental fund revenues. The non-primary unit trigger is if the unit is less than 60% funded.
B) For retirement health care systems, the triggers for primary units (cities, villages, counties and townships) are if the unit is less than 40% funded and has an annual required contribution greater than 12% of governmental fund revenues. The non-primary unit trigger is if the unit is less than 40% funded.
Macomb 10 - Detroit Metro Prosperity Region St Clair Shores City
City of St. Clair Shores
General Employees
Retirement System $39,096,042 $65,928,071 $26,832,029 59.3% $2,554,204 $51,603,156 15.6% YES
Macomb 10 - Detroit Metro Prosperity Region
State Of Michigan 41b District - Clinton
Charter Township & Mt Clemens Authority $6,789,304 $9,258,796 $2,469,492 73.3% $212,884 $5,517,588 3.9% NO
Macomb 10 - Detroit Metro Prosperity Region Sterling Heights City GERS $110,237,923 $141,973,242 $31,735,319 77.6% $2,648,960 $116,144,128 9.2% NO
Macomb 10 - Detroit Metro Prosperity Region Sterling Heights City PFRS $201,782,196 $309,385,005 $107,602,809 65.2% $7,994,747 $116,144,128 9.2% NO
Macomb 10 - Detroit Metro Prosperity Region Utica City
MERS - General
employees $3,362,261 $5,525,116 $2,162,855 60.9% $170,206 $6,205,944 7.0% NO
Macomb 10 - Detroit Metro Prosperity Region Utica City Police and Fire $8,235,425 $12,139,098 $3,903,673 67.8% $263,025 $6,205,944 7.0% NO
Macomb 10 - Detroit Metro Prosperity Region Warren City
CITY OF WARREN
POLICEMEN AND
FIREMEN RETIREMENT
SYSTEM $280,400,662 $456,883,017 $176,482,355 61.4% $10,357,456 $157,213,369 12.4% NO
Macomb 10 - Detroit Metro Prosperity Region Warren City
CITY OF WARREN
EMPLOYEES
RETIREMENT SYSTEM $117,981,347 $186,209,023 $68,227,676 63.4% $9,075,977 $157,213,369 12.4% NO
Manistee 02 - Northwest Prosperity Region Manistee City $15,007,763 $18,967,414 $3,959,651 79.1% $284,796 $8,367,099 3.4% NO
Manistee 02 - Northwest Prosperity Region Manistee County County $31,027,430 $46,561,271 $15,533,841 66.6% $1,713,793 $13,258,189 12.9% NO
Manistee 02 - Northwest Prosperity Region Manistee County 911 Central Dispatch Authority $1,572,784 $1,734,522 $161,738 90.7% $37,567 $1,321,276 2.8% NO
Manistee 02 - Northwest Prosperity Region Manistee County Library Library $1,708,576 $2,973,689 $1,265,113 57.5% $90,003 $1,454,274 6.2% YES
Manistee 02 - Northwest Prosperity Region Manistee County Medical Care Facility Authority $13,974,238 $19,953,741 $5,979,503 70.0% $516,378 $9,840,124 5.2% NO
Manistee 02 - Northwest Prosperity Region Manistee County Road Commission Road Commission $7,719,187 $12,476,934 $4,757,747 61.9% $449,084 $7,733,375 5.8% NO
Marquette 01 - Upper Peninsula Prosperity Alliance Chocolay Charter Township Township $1,762,765 $1,688,623 -$74,142 104.4% $67,179 $2,278,853 2.9% NO
Marquette 01 - Upper Peninsula Prosperity Alliance Forsyth Township Township $3,619,731 $6,898,552 $3,278,821 52.5% $279,021 $3,489,337 8.0% NO
Marquette 01 - Upper Peninsula Prosperity Alliance Ishpeming City
Policemen and Firemen
Retirement System $4,420,761 $6,464,961 $2,044,200 68.4% $181,160 $5,619,217 13.3% NO
Marquette 01 - Upper Peninsula Prosperity Alliance Ishpeming City MERS $8,482,340 $16,329,953 $7,847,613 51.9% $565,838 $5,619,217 13.3% YES
Marquette 01 - Upper Peninsula Prosperity Alliance
Ishpeming Area Joint Wastewater
Treatment Facility Authority $1,882,797 $1,782,951 -$99,846 105.6% $42,168 $1,157,409 3.6% NO
Marquette 01 - Upper Peninsula Prosperity Alliance Ishpeming Township Township $1,507,221 $1,748,121 $240,900 86.2% $283,320 $1,274,098 22.2% NO
Marquette 01 - Upper Peninsula Prosperity Alliance Marquette City MERS $33,423,624 $59,096,922 $25,673,298 56.6% $3,690,779 $32,796,113 15.8% YES
Marquette 01 - Upper Peninsula Prosperity Alliance Marquette City
City of Marquette - Fire-
Police Retirement
System $32,304,354 $44,209,176 $11,904,822 73.1% $1,489,696 $32,796,113 15.8% NO
Marquette 01 - Upper Peninsula Prosperity Alliance Marquette Charter Township Township $2,125,025 $2,988,777 $863,752 71.1% $127,288 $2,893,614 4.4% NO
Marquette 01 - Upper Peninsula Prosperity Alliance
Marquette City Board Of Light And
Power Authority $23,591,091 $41,361,190 $17,770,099 57.0% $1,764,280 $48,675,549 3.6% YES
Marquette 01 - Upper Peninsula Prosperity Alliance
Marquette City Fire- Police Retirement
System Authority $32,304,354 $44,209,176 $11,904,822 73.1% $1,489,696 0.0% NO
Marquette 01 - Upper Peninsula Prosperity Alliance Marquette County County $62,296,438 $101,458,472 $39,162,034 61.4% $6,586,515 $37,316,614 17.7% NO
Marquette 01 - Upper Peninsula Prosperity Alliance Marquette County Road Commission Road Commission $12,429,268 $28,055,795 $15,626,527 44.3% $1,066,733 $16,183,756 6.6% YES
Marquette 01 - Upper Peninsula Prosperity Alliance
Marquette County Solid Waste
Management Authority Authority $2,560,760 $2,658,790 $98,030 96.3% $298,251 $3,641,072 8.2% NO
Marquette 01 - Upper Peninsula Prosperity Alliance Marquette County Transit Authority Authority $3,057,172 $3,472,493 $415,321 88.0% $57,756 $3,161,481 1.8% NO
Marquette 01 - Upper Peninsula Prosperity Alliance Negaunee City
Policemen Retirement
System $3,257,924 $3,368,448 $110,524 96.7% $61,796 $5,170,263 9.7% NO
Marquette 01 - Upper Peninsula Prosperity Alliance Negaunee City MERS $6,906,339 $12,503,404 $5,597,065 55.2% $439,814 $5,170,263 9.7% NO
Marquette 01 - Upper Peninsula Prosperity Alliance Negaunee City Housing Commission Authority $346,513 $631,710 $285,197 54.9% $35,106 $459,269 7.6% YES
Marquette 01 - Upper Peninsula Prosperity Alliance Negaunee Township Township $565,395 $616,390 $50,995 91.7% $121,302 $1,282,018 9.5% NO
Marquette 01 - Upper Peninsula Prosperity Alliance Pathways Authority $24,843,169 $53,613,818 $28,770,649 46.3% $2,267,622 $35,924,516 6.3% YES
Marquette 01 - Upper Peninsula Prosperity Alliance Peter White Public Library Library $2,190,369 $3,386,156 $1,195,787 64.7% $105,706 $2,387,859 4.4% NO
Marquette 01 - Upper Peninsula Prosperity Alliance Superiorland Library Cooperative Library $701,778 $973,707 $271,929 72.1% $9,383 $694,087 1.4% NO
18 of 39Updated 08/10/2018
Source: Fiscal year 2017 audited financial statements or most recent year available for biennial filers

Pension System Summary
County Prosperity Region Local Unit Name Local Unit Type
Pension System Name
(If Multiple Systems) Assets Liabilities
Unfunded Actuarial
Accrued Liability Funded Ratio
Annual Required
Contribution (ARC)
Governmental Fund
Revenue ARC/Revenue
Preliminary
Underfunded Status
(1)
Michigan Department of TreasuryRetirement Pension System Summary
As of August 10, 2018
1Note: 2017 PA 202 defines "underfunded status" to mean the following:
A) For retirement pension systems, the triggers for primary units (cities, villages, counties, and townships) are if the unit is less than 60% funded and has an annual required contribution that is over 10% of governmental fund revenues. The non-primary unit trigger is if the unit is less than 60% funded.
B) For retirement health care systems, the triggers for primary units (cities, villages, counties and townships) are if the unit is less than 40% funded and has an annual required contribution greater than 12% of governmental fund revenues. The non-primary unit trigger is if the unit is less than 40% funded.
Mason 04 - West Michigan Prosperity Alliance Ludington City
City of Ludington
Municipal Employees
Retirement System $12,527,186 $20,461,290 $7,934,104 61.2% $630,237 $6,912,337 13.6% NO
Mason 04 - West Michigan Prosperity Alliance Ludington City
City of Ludington Police
Retirement System $5,598,414 $7,661,736 $2,063,322 73.1% $318,015 $7,463,771 12.0% NO
Mason 04 - West Michigan Prosperity Alliance Ludington City
City of Ludington Police
Retirement System $5,058,130 $7,225,261 $2,167,131 70.0% $311,491 $6,912,337 13.6% NO
Mason 04 - West Michigan Prosperity Alliance Ludington City MERS $13,505,495 $19,698,844 $6,193,349 68.6% $574,990 $7,463,771 12.0% NO
Mason 04 - West Michigan Prosperity Alliance Mason County County $43,657,867 $58,555,867 $14,898,000 74.6% $1,827,570 $16,395,211 11.1% NO
Mason 04 - West Michigan Prosperity Alliance Mason- Oceana 911 Drain District $2,040,272 $2,383,274 $343,002 85.6% $59,764 $1,889,148 3.2% NO
Mason 04 - West Michigan Prosperity Alliance Scottville City $581,702 $700,064 $118,362 83.1% $21,946 $1,062,831 2.1% NO
Mason 04 - West Michigan Prosperity Alliance
West Michigan Community Mental
Health System Authority $4,258,864 $5,233,042 $974,178 81.4% $60,720 $21,262,107 0.3% NO
Mecosta 04 - West Michigan Prosperity Alliance Big Rapids City
Act 345 Plan - Police
and Fire $4,872,302 $6,860,175 $1,987,873 71.0% $507,614 $10,031,819 12.6% NO
Mecosta 04 - West Michigan Prosperity Alliance Big Rapids City MERS $9,094,175 $14,978,608 $5,884,433 60.7% $758,703 $10,031,819 12.6% NO
Mecosta 04 - West Michigan Prosperity Alliance Big Rapids City Housing Commission Authority $1,659,405 $2,222,320 $562,915 74.7% $46,008 $2,369,522 1.9% NO
Mecosta 04 - West Michigan Prosperity Alliance
Meceola Consolidated Central Dispatch
Authority Authority $2,753,143 $3,243,819 $490,676 84.9% $86,832 $1,503,766 5.8% NO
Mecosta 04 - West Michigan Prosperity Alliance Mecosta County $36,675,795 $36,032,787 -$643,008 101.8% $843,150 $19,269,677 4.4% NO
Mecosta 04 - West Michigan Prosperity Alliance Mecosta County Road Commission Road Commission $7,832,922 $10,200,248 $2,367,326 76.8% $207,374 $8,862,877 2.3% NO
Menominee 01 - Upper Peninsula Prosperity Alliance Menominee City
Police and Fire
Retirement System $10,382,459 $17,202,155 $6,819,696 60.4% $599,595 $9,613,132 8.6% NO
Menominee 01 - Upper Peninsula Prosperity Alliance Menominee City
MICHIGAN MUNICIPAL
EMPLOYEES
RETIREMENT SYSTEM $6,947,748 $9,325,008 $2,377,260 74.5% $229,664 $9,613,132 8.6% NO
Menominee 01 - Upper Peninsula Prosperity Alliance Menominee City Housing Commission Authority $758,273 $1,017,725 $259,452 74.5% $122,706 $1,138,246 10.8% NO
Menominee 01 - Upper Peninsula Prosperity Alliance Menominee County County $17,187,410 $25,216,823 $8,029,413 68.2% $772,122 $11,752,944 6.6% NO
Menominee 01 - Upper Peninsula Prosperity Alliance Menominee County Road Commission Road Commission $2,957,634 $5,076,447 $2,118,813 58.3% $172,116 $7,519,836 2.3% YES
Menominee 01 - Upper Peninsula Prosperity Alliance Stephenson City $361,458 $641,206 $279,748 56.4% $29,004 $423,258 6.9% NO
Midland 05 - East Central Michigan Prosperity Region Coleman City $1,761,805 $2,784,719 $1,022,914 63.3% $77,268 $1,015,535 7.6% NO
Midland 05 - East Central Michigan Prosperity Region Midland City
City of Midland Police
and Fire Fighter
Retirement System $62,397,197 $85,840,652 $23,443,455 72.7% $2,575,684 $64,446,539 13.2% NO
Midland 05 - East Central Michigan Prosperity Region Midland City
Municipal Employees'
Retirement System of
Michigan $77,290,283 $141,414,757 $64,124,474 54.7% $5,950,113 $64,446,539 13.2% YES
Midland 05 - East Central Michigan Prosperity Region Midland County County
Midland County Act
345 Retirement System $26,283,288 $29,085,708 $2,802,420 90.4% $937,074 $53,311,603 3.5% NO
Midland 05 - East Central Michigan Prosperity Region Midland County County
Midland County
Employees' Retirement
System $59,242,509 $61,139,920 $1,897,411 96.9% $910,082 $53,311,603 3.5% NO
Midland 05 - East Central Michigan Prosperity Region
Midland County Central Dispatch
Authority Authority $3,073,585 $4,062,700 $989,115 75.7% $111,109 $2,430,707 4.6% NO
Midland 05 - East Central Michigan Prosperity Region Midland County Road Commission Road Commission $11,769,183 $21,161,969 $9,392,786 55.6% $894,352 $14,835,601 6.0% YES
Missaukee 02 - Northwest Prosperity Region
District Health Department No. 10 -
White Cloud Authority
MERS Defined Benefit
Plan $16,537,071 $28,622,504 $12,085,433 57.8% $953,242 $19,509,274 4.9% YES
Missaukee 02 - Northwest Prosperity Region
District Health Department No. 10 -
White Cloud Authority
MERS Defined Benefit
Plan $16,537,071 $28,622,504 $12,085,433 57.8% $953,242 $19,509,274 4.9% YES
Missaukee 02 - Northwest Prosperity Region Missaukee County County $4,566,086 $6,563,876 $1,997,790 69.6% $230,094 $7,542,901 3.1% NO
Monroe 09 - Southeast Michigan Prosperity Region Ash Township Township $419,598 $837,993 $418,395 50.1% $45,422 $1,125,865 4.0% NO
Monroe 09 - Southeast Michigan Prosperity Region Carleton Village $930,133 $1,328,120 $397,987 70.0% $26,121 $1,056,078 2.5% NO
Monroe 09 - Southeast Michigan Prosperity Region Dundee Village $2,342,009 $4,000,782 $1,658,773 58.5% $75,572 $3,265,887 2.3% NO
Monroe 09 - Southeast Michigan Prosperity Region Erie Township Township $125,301 $93,202 -$32,099 134.4% $8,125 $1,689,998 0.5% NO
19 of 39Updated 08/10/2018
Source: Fiscal year 2017 audited financial statements or most recent year available for biennial filers

Pension System Summary
County Prosperity Region Local Unit Name Local Unit Type
Pension System Name
(If Multiple Systems) Assets Liabilities
Unfunded Actuarial
Accrued Liability Funded Ratio
Annual Required
Contribution (ARC)
Governmental Fund
Revenue ARC/Revenue
Preliminary
Underfunded Status
(1)
Michigan Department of TreasuryRetirement Pension System Summary
As of August 10, 2018
1Note: 2017 PA 202 defines "underfunded status" to mean the following:
A) For retirement pension systems, the triggers for primary units (cities, villages, counties, and townships) are if the unit is less than 60% funded and has an annual required contribution that is over 10% of governmental fund revenues. The non-primary unit trigger is if the unit is less than 60% funded.
B) For retirement health care systems, the triggers for primary units (cities, villages, counties and townships) are if the unit is less than 40% funded and has an annual required contribution greater than 12% of governmental fund revenues. The non-primary unit trigger is if the unit is less than 40% funded.
Monroe 09 - Southeast Michigan Prosperity Region Monroe County $189,010,932 $280,595,291 $91,584,359 67.4% $5,945,974 $65,220,644 9.1% NO
Monroe 09 - Southeast Michigan Prosperity Region Monroe City $136,614,724 $148,419,521 $11,804,797 92.0% $1,845,799 $24,133,301 7.6% NO
Monroe 09 - Southeast Michigan Prosperity Region
Monroe Community Mental Health
Authority Authority $13,079,556 $19,417,194 $6,337,638 67.4% $605,211 $33,147,616 1.8% NO
Monroe 09 - Southeast Michigan Prosperity Region Monroe County Library System Library $12,077,798 $17,930,039 $5,852,241 67.4% $618,390 $7,706,151 8.0% NO
Monroe 09 - Southeast Michigan Prosperity Region Monroe County Road Commission Road Commission $21,172,824 $31,432,016 $10,259,192 67.4% $809,440 $28,736,359 2.8% NO
Monroe 09 - Southeast Michigan Prosperity Region Petersburg City $520,527 $492,006 -$28,521 105.8% $27,317 $836,829 3.3% NO
Montcalm 04 - West Michigan Prosperity Alliance Carson City City $293,194 $422,175 $128,981 69.4% $30,769 $1,294,802 2.4% NO
Montcalm 04 - West Michigan Prosperity Alliance Greenville City $4,411,434 $6,247,428 $1,835,994 70.6% $63,297 $9,478,233 0.7% NO
Montcalm 04 - West Michigan Prosperity Alliance Howard City Village $638,202 $832,042 $193,840 76.7% $32,732 $1,242,819 2.6% NO
Montcalm 04 - West Michigan Prosperity Alliance
Mid- Michigan District Health
Department Authority $8,425,497 $11,023,442 $2,597,945 76.4% $266,008 $6,149,006 4.3% NO
Montcalm 04 - West Michigan Prosperity Alliance Montcalm County $22,806,307 $41,456,051 $18,649,744 55.0% $826,402 $19,310,220 4.3% NO
Montcalm 04 - West Michigan Prosperity Alliance Montcalm Care Network Authority $8,650,506 $9,070,377 $419,871 95.4% $656,637 $16,060,782 4.1% NO
Montcalm 04 - West Michigan Prosperity Alliance Montcalm County Road Commission Road Commission $9,177,919 $17,871,912 $8,693,993 51.4% $686,334 $14,059,557 4.9% YES
Montcalm 04 - West Michigan Prosperity Alliance Stanton City $100,551 $54,040 -$46,511 186.1% $0 $758,664 0.0% NO
Montcalm 04 - West Michigan Prosperity Alliance White Pine District Library Library $122,888 $253,262 $130,374 48.5% $7,000 $256,852 2.7% YES
Montmorency 03 - Northeast Prosperity Region
Montmorency- Oscoda- Alpena Solid
Waste Management Authority Authority $878,436 $924,138 $45,702 95.1% $22,800 $2,932,929 0.8% NO
Muskegon 04 - West Michigan Prosperity Alliance Hackley Public Library Library $223,109 $312,318 $89,209 71.4% $22,375 $2,211,411 1.0% NO
Muskegon 04 - West Michigan Prosperity Alliance Montague City $3,930,386 $6,002,522 $2,072,136 65.5% $154,871 $2,613,186 5.9% NO
Muskegon 04 - West Michigan Prosperity Alliance Muskegon County $168,948,063 $270,404,777 $101,456,714 62.5% $6,883,845 $131,384,403 5.2% NO
Muskegon 04 - West Michigan Prosperity Alliance Muskegon City $84,417,960 $108,324,914 $23,906,954 77.9% $1,897,158 $35,334,049 5.4% NO
Muskegon 04 - West Michigan Prosperity Alliance Muskegon Area District Library Library $1,956,605 $2,357,955 $401,350 83.0% $97,775 $3,940,040 2.5% NO
Muskegon 04 - West Michigan Prosperity Alliance Muskegon Central Dispatch 9- 1- 1 Authority $5,147,590 $6,293,177 $1,145,587 81.8% $101,828 $3,516,207 2.9% NO
Muskegon 04 - West Michigan Prosperity Alliance Muskegon Charter Township Township $14,852,395 $22,110,043 $7,257,648 67.2% $480,936 $6,363,072 7.6% NO
Muskegon 04 - West Michigan Prosperity Alliance Muskegon County Road Commission Road Commission $16,339,910 $23,696,008 $7,356,098 69.0% $839,145 $19,600,470 4.3% NO
Muskegon 04 - West Michigan Prosperity Alliance Muskegon Housing Commission Authority $568,649 $777,297 $208,648 73.2% $30,612 $1,779,999 1.7% NO
Muskegon 04 - West Michigan Prosperity Alliance North Muskegon City $4,824,995 $6,485,459 $1,660,464 74.4% $122,628 $3,111,398 3.9% NO
Muskegon 04 - West Michigan Prosperity Alliance Norton Shores City $21,243,536 $45,372,303 $24,128,767 46.8% $1,793,736 $17,366,218 10.3% YES
Muskegon 04 - West Michigan Prosperity Alliance Ravenna Village $533,517 $591,563 $58,046 90.2% $13,524 $666,038 2.0% NO
Muskegon 04 - West Michigan Prosperity Alliance Roosevelt Park City $3,134,848 $5,586,717 $2,451,869 56.1% $203,232 $2,985,344 6.8% NO
Muskegon 04 - West Michigan Prosperity Alliance
West Michigan Shoreline Regional
Development Commission Authority $4,253,881 $3,870,966 -$382,915 109.9% $0 $6,254,905 0.0% NO
Muskegon 04 - West Michigan Prosperity Alliance Whitehall City $4,201,778 $6,006,828 $1,805,050 70.0% $168,861 $2,913,206 5.8% NO
Newaygo 04 - West Michigan Prosperity Alliance Fremont City $7,122,542 $12,518,581 $5,396,039 56.9% $450,358 $4,121,811 10.9% YES
Newaygo 04 - West Michigan Prosperity Alliance Fremont Area District Library Library $811,712 $1,197,257 $385,545 67.8% $45,734 $869,283 5.3% NO
Newaygo 04 - West Michigan Prosperity Alliance Newaygo County $20,077,306 $25,919,697 $5,842,391 77.5% $744,876 $23,990,857 3.1% NO
Newaygo 04 - West Michigan Prosperity Alliance Newaygo County Mental Health Board Authority $3,496,569 $3,181,617 -$314,952 109.9% $0 $12,762,651 0.0% NO
Newaygo 04 - West Michigan Prosperity Alliance Newaygo County Road Commission Road Commission $7,998,957 $10,439,861 $2,440,904 76.6% $256,518 $11,624,609 2.2% NO
Newaygo 04 - West Michigan Prosperity Alliance Newaygo Medical Care Facility Authority $12,704,006 $13,260,952 $556,946 95.8% $195,528 $11,676,934 1.7% NO
Newaygo 04 - West Michigan Prosperity Alliance White Cloud City $567,941 $995,709 $427,768 57.0% $49,988 $781,311 6.4% NO
Newaygo 04 - West Michigan Prosperity Alliance White Cloud Community Library Library $389,110 $469,458 $80,348 82.9% $9,321 $359,589 2.6% NO
Newaygo 04 - West Michigan Prosperity Alliance White Cloud/sherman Utilities Authority Authority $270,859 $368,072 $97,213 73.6% $16,155 $555,693 2.9% NO
Oakland 10 - Detroit Metro Prosperity Region Auburn Hills City $52,366,158 $70,685,205 $18,319,047 74.1% $1,034,387 $32,518,762 3.2% NO
Oakland 10 - Detroit Metro Prosperity Region Berkley City
Public Safety Pension
System $18,505,881 $23,489,258 $4,983,377 78.8% $713,669 $14,203,634 8.7% NO
Oakland 10 - Detroit Metro Prosperity Region Berkley City
General Employees'
Defined Benefit Pension
Plan $11,414,846 $20,915,484 $9,500,638 54.6% $528,385 $14,203,634 8.7% NO
Oakland 10 - Detroit Metro Prosperity Region Beverly Hills Village $20,818,082 $24,583,791 $3,765,709 84.7% $393,492 $9,853,366 4.0% NO
Oakland 10 - Detroit Metro Prosperity Region Bingham Farms Village $233,885 $302,511 $68,626 77.3% $11,477 $1,972,047 0.6% NO
Oakland 10 - Detroit Metro Prosperity Region Birmingham City $100,033,792 $115,193,852 $15,160,060 86.8% $1,863,849 $37,084,921 5.0% NO
Oakland 10 - Detroit Metro Prosperity Region Bloomfield Charter Township Township $209,875,152 $215,308,703 $5,433,551 97.5% $0 $55,327,842 0.0% NO
Oakland 10 - Detroit Metro Prosperity Region Bloomfield Hills City $29,503,008 $35,699,755 $6,196,747 82.6% $269,316 $10,977,741 2.5% NO
Oakland 10 - Detroit Metro Prosperity Region Bloomfield Township Public Library Library $7,772,556 $7,977,165 $204,609 97.4% $0 $7,154,434 0.0% NO
Oakland 10 - Detroit Metro Prosperity Region Brandon Charter Township Township $5,638,040 $7,047,591 $1,409,551 80.0% $194,939 $5,129,496 3.8% NO
Oakland 10 - Detroit Metro Prosperity Region Clawson City MERS $9,975,949 $24,393,064 $14,417,115 40.9% $1,493,316 $11,859,217 13.2% YES
20 of 39Updated 08/10/2018
Source: Fiscal year 2017 audited financial statements or most recent year available for biennial filers

Pension System Summary
County Prosperity Region Local Unit Name Local Unit Type
Pension System Name
(If Multiple Systems) Assets Liabilities
Unfunded Actuarial
Accrued Liability Funded Ratio
Annual Required
Contribution (ARC)
Governmental Fund
Revenue ARC/Revenue
Preliminary
Underfunded Status
(1)
Michigan Department of TreasuryRetirement Pension System Summary
As of August 10, 2018
1Note: 2017 PA 202 defines "underfunded status" to mean the following:
A) For retirement pension systems, the triggers for primary units (cities, villages, counties, and townships) are if the unit is less than 60% funded and has an annual required contribution that is over 10% of governmental fund revenues. The non-primary unit trigger is if the unit is less than 60% funded.
B) For retirement health care systems, the triggers for primary units (cities, villages, counties and townships) are if the unit is less than 40% funded and has an annual required contribution greater than 12% of governmental fund revenues. The non-primary unit trigger is if the unit is less than 40% funded.
Oakland 10 - Detroit Metro Prosperity Region Clawson City
Clawson Fire
Department Defined
Benefit Plan $3,548,204 $3,685,493 $137,289 96.3% $73,000 $11,859,217 13.2% NO
Oakland 10 - Detroit Metro Prosperity Region Farmington City $19,326,489 $24,872,667 $5,546,178 77.7% $545,225 $10,067,693 5.4% NO
Oakland 10 - Detroit Metro Prosperity Region Farmington Community Library Library $8,460,802 $8,851,075 $390,273 95.6% $0 $6,382,463 0.0% NO
Oakland 10 - Detroit Metro Prosperity Region Farmington Hills City $149,579,950 $188,838,977 $39,259,027 79.2% $4,710,485 $84,244,215 5.6% NO
Oakland 10 - Detroit Metro Prosperity Region Ferndale City
City of Ferndale
Employees Retirement
System $19,934,028 $7,890,351 -$12,043,677 252.6% $0 $26,823,045 1.4% NO
Oakland 10 - Detroit Metro Prosperity Region Ferndale City
City of Ferndale
Policemen and Firemen
Retirement System $43,527,485 $46,672,054 $3,144,569 93.3% $383,765 $26,823,045 1.4% NO
Oakland 10 - Detroit Metro Prosperity Region Franklin Village $3,982,666 $7,368,805 $3,386,139 54.0% $221,903 $3,689,507 6.0% NO
Oakland 10 - Detroit Metro Prosperity Region Groveland Township Township $1,762,533 $1,753,004 -$9,529 100.5% $12,509 $2,535,907 0.5% NO
Oakland 10 - Detroit Metro Prosperity Region Hazel Park City $31,488,429 $64,640,242 $33,151,813 48.7% $2,106,236 $19,099,285 11.0% YES
Oakland 10 - Detroit Metro Prosperity Region Holly Village $6,858,874 $13,924,151 $7,065,277 49.3% $459,643 $3,742,925 12.3% YES
Oakland 10 - Detroit Metro Prosperity Region Huntington Woods City $13,733,138 $24,118,999 $10,385,861 56.9% $1,169,604 $11,088,118 10.5% YES
Oakland 10 - Detroit Metro Prosperity Region Independence Charter Township Township $8,245,403 $12,250,803 $4,005,400 67.3% $280,292 $19,589,854 1.4% NO
Oakland 10 - Detroit Metro Prosperity Region Keego Harbor City $2,161,482 $4,409,152 $2,247,670 49.0% $108,384 $2,321,020 4.7% NO
Oakland 10 - Detroit Metro Prosperity Region Lake Orion Village $2,588,396 $3,885,315 $1,296,919 66.6% $115,236 $2,304,715 5.0% NO
Oakland 10 - Detroit Metro Prosperity Region Lathrup Village City $6,358,020 $8,289,132 $1,931,112 76.7% $88,140 $4,277,753 2.1% NO
Oakland 10 - Detroit Metro Prosperity Region Madison Heights City
Madison Heights Police
and Fire 345 Plan
Pension System $42,364,918 $78,198,411 $35,833,493 54.2% $2,473,171 $31,789,005 11.5% YES
Oakland 10 - Detroit Metro Prosperity Region Madison Heights City
Madison Heights
General Employees -
MERS System $39,446,823 $39,563,402 $116,579 99.7% $1,175,689 $31,789,005 11.5% NO
Oakland 10 - Detroit Metro Prosperity Region Milford Village $10,466,738 $13,921,376 $3,454,638 75.2% $435,754 $7,402,323 5.9% NO
Oakland 10 - Detroit Metro Prosperity Region Novi City $59,427,850 $97,108,697 $37,680,847 61.2% $3,137,158 $53,630,017 5.8% NO
Oakland 10 - Detroit Metro Prosperity Region Oak Park City
Employees' Retirement
System $19,305,654 $40,735,745 $21,430,091 47.4% $1,256,953 $30,019,441 11.9% YES
Oakland 10 - Detroit Metro Prosperity Region Oak Park City
Public Safety
Employees' Retirement
System $40,470,218 $71,651,880 $31,181,662 56.5% $2,314,911 $30,019,441 11.9% YES
Oakland 10 - Detroit Metro Prosperity Region Oakland County $785,011,127 $762,513,562 -$22,497,565 103.0% $0 $483,643,659 0.0% NO
Oakland 10 - Detroit Metro Prosperity Region Oakland County Road Commission Road Commission $181,947,947 $227,440,112 $45,492,165 80.0% $4,552,404 $141,368,615 3.2% NO
Oakland 10 - Detroit Metro Prosperity Region Orchard Lake Village City $3,976,477 $5,831,079 $1,854,602 68.2% $337,942 $3,743,705 9.0% NO
Oakland 10 - Detroit Metro Prosperity Region Oxford Village $1,987,110 $3,298,942 $1,311,832 60.2% $125,964 $2,187,825 5.8% NO
Oakland 10 - Detroit Metro Prosperity Region Oxford Charter Township Township $3,013,765 $5,274,322 $2,260,557 57.1% $270,672 $12,474,937 2.2% NO
Oakland 10 - Detroit Metro Prosperity Region Pleasant Ridge City $2,998,723 $5,936,043 $2,937,320 50.5% $255,997 $4,604,403 5.6% NO
Oakland 10 - Detroit Metro Prosperity Region Pontiac City
Police and Fire
Retirement System $223,057,297 $250,798,054 $27,740,757 88.9% $2,041,923 $49,613,970 4.1% NO
Oakland 10 - Detroit Metro Prosperity Region Pontiac City
General Employees'
Retirement System $466,152,032 $264,641,819 -$201,510,213 176.1% $0 $49,613,970 4.1% NO
Oakland 10 - Detroit Metro Prosperity Region Rochester City $13,848,737 $21,751,481 $7,902,744 63.7% $641,904 $13,980,304 4.6% NO
Oakland 10 - Detroit Metro Prosperity Region Royal Oak City $154,970,885 $216,591,581 $61,620,696 71.5% $7,178,082 $77,412,606 9.3% NO
Oakland 10 - Detroit Metro Prosperity Region Royal Oak Charter Township Township $2,813,907 $2,294,787 -$519,120 122.6% $0 $1,771,169 0.0% NO
Oakland 10 - Detroit Metro Prosperity Region South Lyon City $10,015,205 $15,147,424 $5,132,219 66.1% $470,446 $6,554,745 7.2% NO
Oakland 10 - Detroit Metro Prosperity Region
Southeastern Oakland County Resource
Recovery Auth Authority MERS Union $3,411,780 $5,630,520 $2,218,740 60.6% $173,006 $22,965,006 1.0% NO
Oakland 10 - Detroit Metro Prosperity Region
Southeastern Oakland County Resource
Recovery Auth Authority MERS Salaried $2,513,109 $3,184,086 $670,977 78.9% $64,069 $22,965,006 1.0% NO
Oakland 10 - Detroit Metro Prosperity Region
Southeastern Oakland County Water
Authority Authority $5,026,217 $6,368,170 $1,341,953 78.9% $128,137 $27,134,589 0.5% NO
Oakland 10 - Detroit Metro Prosperity Region Southfield City
Southfield Employees
Retirement System $104,809,803 $152,159,455 $47,349,652 68.9% $2,866,029 $105,659,035 8.1% NO
Oakland 10 - Detroit Metro Prosperity Region Southfield City
Southfield Fire and
Police Retirement
System $188,041,031 $253,346,417 $65,305,386 74.2% $5,664,576 $105,659,035 8.1% NO
Oakland 10 - Detroit Metro Prosperity Region Sylvan Lake City $1,871,277 $2,899,361 $1,028,084 64.5% $67,812 $2,635,735 2.6% NO
21 of 39Updated 08/10/2018
Source: Fiscal year 2017 audited financial statements or most recent year available for biennial filers

Pension System Summary
County Prosperity Region Local Unit Name Local Unit Type
Pension System Name
(If Multiple Systems) Assets Liabilities
Unfunded Actuarial
Accrued Liability Funded Ratio
Annual Required
Contribution (ARC)
Governmental Fund
Revenue ARC/Revenue
Preliminary
Underfunded Status
(1)
Michigan Department of TreasuryRetirement Pension System Summary
As of August 10, 2018
1Note: 2017 PA 202 defines "underfunded status" to mean the following:
A) For retirement pension systems, the triggers for primary units (cities, villages, counties, and townships) are if the unit is less than 60% funded and has an annual required contribution that is over 10% of governmental fund revenues. The non-primary unit trigger is if the unit is less than 60% funded.
B) For retirement health care systems, the triggers for primary units (cities, villages, counties and townships) are if the unit is less than 40% funded and has an annual required contribution greater than 12% of governmental fund revenues. The non-primary unit trigger is if the unit is less than 40% funded.
Oakland 10 - Detroit Metro Prosperity Region Troy City
Volunteer Firefighter
Incentive Plan and Trust $8,368,828 $18,835,515 $10,466,687 44.4% $1,113,496 $82,169,775 2.2% NO
Oakland 10 - Detroit Metro Prosperity Region Troy City
Employee Retirement
System $188,439,991 $161,344,515 -$27,095,476 116.8% $658,557 $82,169,775 2.2% NO
Oakland 10 - Detroit Metro Prosperity Region Walled Lake City $4,163,212 $14,166,917 $10,003,705 29.4% $512,898 $5,689,591 9.0% NO
Oakland 10 - Detroit Metro Prosperity Region Waterford Charter Township Township
Waterford Twp.
Employees Retirement
System $65,536,884 $63,384,410 -$2,152,474 103.4% $989,146 $50,966,440 7.7% NO
Oakland 10 - Detroit Metro Prosperity Region Waterford Charter Township Township
Waterford Township
Policemen and Firemen
Retirement System $97,481,518 $108,223,757 $10,742,239 90.1% $2,946,541 $50,966,440 7.7% NO
Oakland 10 - Detroit Metro Prosperity Region West Bloomfield Charter Township Township $138,248,329 $156,515,803 $18,267,474 88.3% $4,129,208 $48,645,579 8.5% NO
Oakland 10 - Detroit Metro Prosperity Region White Lake Charter Township Township $21,075,258 $29,839,197 $8,763,939 70.6% $859,452 $18,447,714 4.7% NO
Oakland 10 - Detroit Metro Prosperity Region Wixom City $17,741,479 $32,715,698 $14,974,219 54.2% $1,039,531 $15,912,216 6.5% NO
Oakland 10 - Detroit Metro Prosperity Region Wolverine Lake Village $1,782,656 $3,210,191 $1,427,535 55.5% $55,678 $2,781,410 2.0% NO
Oceana 04 - West Michigan Prosperity Alliance Hesperia Village $62,930 $31,820 -$31,110 197.8% $1,761 $462,372 0.4% NO
Oceana 04 - West Michigan Prosperity Alliance Oceana County $15,340,810 $23,027,524 $7,686,714 66.6% $660,384 $14,684,916 4.5% NO
Oceana 04 - West Michigan Prosperity Alliance Oceana County Medical Care Facility Authority $13,855,171 $17,343,846 $3,488,675 79.9% $442,140 $17,581,046 2.5% NO
Oceana 04 - West Michigan Prosperity Alliance Pentwater Village $1,472,631 $2,031,651 $559,020 72.5% $57,818 $1,543,510 3.7% NO
Ogemaw 03 - Northeast Prosperity Region
District Health Department #2 Ogemaw
County Authority $5,451,341 $7,620,053 $2,168,712 71.5% $332,697 $5,252,847 6.3% NO
Ogemaw 03 - Northeast Prosperity Region Ogemaw County $20,468,507 $28,683,593 $8,215,086 71.4% $666,043 $11,218,683 5.9% NO
Ogemaw 03 - Northeast Prosperity Region
Ogemaw City Emergency Medical
Services Authority Authority $2,914,404 $3,344,235 $429,831 87.1% $114,297 $2,464,331 4.6% NO
Ogemaw 03 - Northeast Prosperity Region Ogemaw County Road Commission Road Commission $5,530,502 $9,735,511 $4,205,009 56.8% $493,619 $6,508,774 7.6% YES
Ogemaw 03 - Northeast Prosperity Region Rose City City $541,898 $657,469 $115,571 82.4% $16,853 $713,948 2.4% NO
Ogemaw 03 - Northeast Prosperity Region Rose Township Township $355,283 $151,285 -$203,998 234.8% $0 $354,980 0.0% NO
Ogemaw 03 - Northeast Prosperity Region West Branch City $3,629,107 $5,614,170 $1,985,063 64.6% $107,225 $2,065,221 5.2% NO
Ogemaw 03 - Northeast Prosperity Region West Branch District Library Library $397,658 $484,222 $86,564 82.1% $8,670 $312,167 2.8% NO
Ontonagon 01 - Upper Peninsula Prosperity Alliance Ontonagon Village $7,997,621 $14,194,949 $6,197,328 56.3% $287,317 $1,073,081 26.8% YES
Ontonagon 01 - Upper Peninsula Prosperity Alliance Ontonagon County County MERS $6,750,640 $10,167,796 $3,417,156 66.4% $293,587 $5,415,551 5.4% NO
Ontonagon 01 - Upper Peninsula Prosperity Alliance Ontonagon County County MERS $6,750,640 $10,167,796 $3,417,156 66.4% $293,587 $5,415,551 5.4% NO
Ontonagon 01 - Upper Peninsula Prosperity Alliance Ontonagon County Road Commission Road Commission $9,988,360 $23,912,525 $13,924,165 41.8% $1,028,055 $8,518,407 12.1% YES
Osceola 04 - West Michigan Prosperity Alliance Evart City $236,868 $514,180 $277,312 46.1% $1,321,392 0.0% NO
Osceola 04 - West Michigan Prosperity Alliance Marion Village $478,012 $635,543 $157,531 75.2% $13,191 $514,666 2.6% NO
Osceola 04 - West Michigan Prosperity Alliance Osceola County MERS $17,232,957 $20,245,355 $3,012,398 85.1% $647,368 $13,004,793 5.0% NO
Osceola 04 - West Michigan Prosperity Alliance Osceola County MERS $17,232,957 $20,245,355 $3,012,398 85.1% $647,368 $13,004,793 5.0% NO
Osceola 04 - West Michigan Prosperity Alliance Osceola County Road Commission Road Commission $4,241,559 $7,997,394 $3,755,835 53.0% $275,088 $6,557,935 4.2% YES
Osceola 04 - West Michigan Prosperity Alliance Reed City City $4,139,558 $6,779,478 $2,639,920 61.1% $223,678 $1,602,833 0.0% NO
Osceola 04 - West Michigan Prosperity Alliance Reed City Housing Commission Authority $793,227 $1,387,084 $593,857 57.2% $53,228 $931,395 5.7% YES
Oscoda 03 - Northeast Prosperity Region Oscoda County $6,904,419 $10,630,441 $3,726,022 64.9% $448,032 $7,212,288 6.2% NO
Otsego 03 - Northeast Prosperity Region Gaylord City $7,953,372 $13,880,919 $5,927,547 57.3% $446,136 $5,499,077 8.1% NO
Otsego 03 - Northeast Prosperity Region Otsego County County $13,589,341 $21,963,521 $8,374,180 61.9% $856,396 $16,405,974 5.2% NO
Otsego 03 - Northeast Prosperity Region Otsego County Bus System Authority $2,038,768 $2,616,603 $577,835 77.9% $73,553 $1,662,134 4.4% NO
Otsego 03 - Northeast Prosperity Region Otsego County Road Commission Road Commission $7,153,522 $12,227,596 $5,074,074 58.5% $437,460 $10,409,106 4.2% YES
Ottawa 04 - West Michigan Prosperity Alliance Coopersville City $2,139,712 $2,824,861 $685,149 75.7% $79,128 $3,624,188 2.2% NO
Ottawa 04 - West Michigan Prosperity Alliance Coopersville Area District Library Library $226,927 $490,633 $263,706 46.3% $18,739 $517,130 3.6% YES
Ottawa 04 - West Michigan Prosperity Alliance Ferrysburg City $1,482,188 $2,116,304 $634,116 70.0% $52,326 $2,636,946 2.0% NO
Ottawa 04 - West Michigan Prosperity Alliance Grand Haven City $73,178,036 $101,218,656 $28,040,620 72.3% $1,528,835 $13,168,741 11.6% NO
Ottawa 04 - West Michigan Prosperity Alliance Herrick District Library Library $6,321,664 $8,425,265 $2,103,601 75.0% $163,129 $5,728,141 2.8% NO
Ottawa 04 - West Michigan Prosperity Alliance Holland City $104,314,657 $131,221,216 $26,906,559 79.5% $1,789,641 $34,376,620 5.2% NO
Ottawa 04 - West Michigan Prosperity Alliance
Holland Area Community Swimming
Pool Authority Authority $999,810 $1,032,975 $33,165 96.8% $30,912 $3,326,159 0.9% NO
Ottawa 04 - West Michigan Prosperity Alliance Hudsonville City $1,517,587 $2,266,276 $748,689 67.0% $116,364 $4,422,171 2.6% NO
Ottawa 04 - West Michigan Prosperity Alliance Loutit District Library Library $1,952,975 $2,434,059 $481,084 80.2% $65,257 $2,523,349 2.6% NO
Ottawa 04 - West Michigan Prosperity Alliance Olive Township Township $270,569 $415,365 $144,796 65.1% $7,652 $1,458,850 0.5% NO
Ottawa 04 - West Michigan Prosperity Alliance Ottawa County County $213,948,789 $273,495,148 $59,546,359 78.2% $5,606,562 $144,747,894 3.9% NO
Ottawa 04 - West Michigan Prosperity Alliance
Ottawa County Central Dispatch
Authority Authority $1,931,821 $2,354,640 $422,819 82.0% $79,884 $5,540,837 1.4% NO
22 of 39Updated 08/10/2018
Source: Fiscal year 2017 audited financial statements or most recent year available for biennial filers

Pension System Summary
County Prosperity Region Local Unit Name Local Unit Type
Pension System Name
(If Multiple Systems) Assets Liabilities
Unfunded Actuarial
Accrued Liability Funded Ratio
Annual Required
Contribution (ARC)
Governmental Fund
Revenue ARC/Revenue
Preliminary
Underfunded Status
(1)
Michigan Department of TreasuryRetirement Pension System Summary
As of August 10, 2018
1Note: 2017 PA 202 defines "underfunded status" to mean the following:
A) For retirement pension systems, the triggers for primary units (cities, villages, counties, and townships) are if the unit is less than 60% funded and has an annual required contribution that is over 10% of governmental fund revenues. The non-primary unit trigger is if the unit is less than 60% funded.
B) For retirement health care systems, the triggers for primary units (cities, villages, counties and townships) are if the unit is less than 40% funded and has an annual required contribution greater than 12% of governmental fund revenues. The non-primary unit trigger is if the unit is less than 40% funded.
Ottawa 04 - West Michigan Prosperity Alliance Ottawa County Road Commission Road Commission $30,643,532 $55,068,361 $24,424,829 55.6% $1,466,702 $41,565,263 3.5% YES
Ottawa 04 - West Michigan Prosperity Alliance Port Sheldon Township Township $901,415 $894,679 -$6,736 100.8% $7,837 $1,494,368 0.5% NO
Ottawa 04 - West Michigan Prosperity Alliance Spring Lake Village $2,998,848 $3,827,076 $828,228 78.4% $53,402 $2,225,119 2.4% NO
Ottawa 04 - West Michigan Prosperity Alliance Spring Lake District Library Library $2,109,293 $2,020,814 -$88,479 104.4% $45,549 $2,006,888 2.3% NO
Ottawa 04 - West Michigan Prosperity Alliance Zeeland City $8,674,976 $10,176,028 $1,501,052 85.2% $278,979 $10,568,030 2.6% NO
Presque Isle 03 - Northeast Prosperity Region Onaway City $645,959 $736,690 $90,731 87.7% $23,093 $547,852 4.2% NO
Presque Isle 03 - Northeast Prosperity Region Presque Isle County County $8,437,550 $12,990,234 $4,552,684 65.0% $367,623 $7,125,144 5.2% NO
Presque Isle 03 - Northeast Prosperity Region Presque Isle County Road Commission Road Commission $4,796,540 $9,774,568 $4,978,028 49.1% $338,169 $5,593,373 6.0% YES
Presque Isle 03 - Northeast Prosperity Region Rogers City City $5,165,576 $10,992,314 $5,826,738 47.0% $301,987 $2,147,660 14.1% YES
Roscommon 03 - Northeast Prosperity Region Houghton Lake Public Library Library $726,917 $759,805 $32,888 95.7% $26,349 $648,858 4.1% NO
Roscommon 03 - Northeast Prosperity Region Richfield Township Township $1,824,701 $2,939,003 $1,114,302 62.1% $86,985 $2,251,478 3.9% NO
Roscommon 03 - Northeast Prosperity Region
Roscommon County Transportation
Authority Authority $2,260,224 $2,964,142 $703,918 76.3% $98,326 $1,973,596 5.0% NO
Saginaw 05 - East Central Michigan Prosperity Region Birch Run Village $1,355,545 $1,575,500 $219,955 86.0% $23,129 $1,115,457 2.1% NO
Saginaw 05 - East Central Michigan Prosperity Region Bridgeport Charter Township Township $5,485,931 $8,892,627 $3,406,696 61.7% $322,712 $3,515,718 9.2% NO
Saginaw 05 - East Central Michigan Prosperity Region Buena Vista Charter Township Township $7,956,975 $12,031,505 $4,074,530 66.1% $413,818 $5,319,238 7.8% NO
Saginaw 05 - East Central Michigan Prosperity Region Carrollton Township Township $2,963,742 $4,131,425 $1,167,683 71.7% $122,698 $1,968,005 6.2% NO
Saginaw 05 - East Central Michigan Prosperity Region Chesaning Village $608,432 $3,299,604 $2,691,172 18.4% $174,547 $2,017,550 8.7% NO
Saginaw 05 - East Central Michigan Prosperity Region Frankenmuth City $10,058,121 $14,731,995 $4,673,874 68.3% $310,131 $7,151,343 4.3% NO
Saginaw 05 - East Central Michigan Prosperity Region Frankenmuth James E. Wickson Library Library $133,943 $180,701 $46,758 74.1% $7,920 $402,199 2.0% NO
Saginaw 05 - East Central Michigan Prosperity Region Mbs International Airport Commission Authority $6,204,858 $11,106,005 $4,901,147 55.9% $327,418 $5,319,494 6.2% YES
Saginaw 05 - East Central Michigan Prosperity Region Public Libraries Of Saginaw Library $2,477,766 $1,661,193 -$816,573 149.2% $34,030 $4,038,400 0.8% NO
Saginaw 05 - East Central Michigan Prosperity Region Richland Township Township $2,701,681 $4,837,375 $2,135,694 55.9% $129,513 $1,875,947 6.9% NO
Saginaw 05 - East Central Michigan Prosperity Region Saginaw City $172,861,032 $334,484,884 $161,623,852 51.7% $24,998,362 $50,807,603 49.2% YES
Saginaw 05 - East Central Michigan Prosperity Region Saginaw Charter Township Township $12,231,952 $19,332,590 $7,100,638 63.3% $362,548 $18,224,541 2.0% NO
Saginaw 05 - East Central Michigan Prosperity Region Saginaw City Housing Commission Authority $1,969,417 $4,148,367 $2,178,950 47.5% $144,264 $11,266,131 1.3% YES
Saginaw 05 - East Central Michigan Prosperity Region Saginaw County County $119,192,976 $145,505,305 $26,312,329 81.9% $701,460 $107,502,095 0.7% NO
Saginaw 05 - East Central Michigan Prosperity Region
Saginaw County 911 Communications
Center Authority Authority $8,406,831 $12,995,542 $4,588,711 64.7% $469,620 $5,982,934 7.8% NO
Saginaw 05 - East Central Michigan Prosperity Region
Saginaw County Community Mental
Health Authority Authority $11,131,508 $17,664,212 $6,532,704 63.0% $248,411 $78,980,289 0.3% NO
Saginaw 05 - East Central Michigan Prosperity Region Saginaw County Road Commission Road Commission $23,687,628 $33,525,923 $9,838,295 70.7% $623,888 $23,864,132 2.6% NO
Saginaw 05 - East Central Michigan Prosperity Region
Saginaw- Midland Municipal Water
Supply Corporation Authority $3,105,731 $4,750,486 $1,644,755 65.4% $208,860 $6,062,700 3.4% NO
Saginaw 05 - East Central Michigan Prosperity Region
Saginaw Transit Authority Regional
Services Authority $2,312,394 $2,429,771 $117,377 95.2% $75,049 $6,363,538 1.2% NO
Saginaw 05 - East Central Michigan Prosperity Region St Charles Village $2,362,292 $4,278,120 $1,915,828 55.2% $138,937 $1,215,241 11.4% YES
Saginaw 05 - East Central Michigan Prosperity Region Swan Creek Township Township $609,493 $758,950 $149,457 80.3% $24,363 $601,349 4.1% NO
Saginaw 05 - East Central Michigan Prosperity Region Tittabawassee Township Township $3,057,850 $3,312,526 $254,676 92.3% $44,877 $3,263,638 1.4% NO
Sanilac 06 - East Michigan Prosperity Region Aitkin Memorial District Library Library $133,736 $78,541 -$55,195 170.3% $0 $253,504 0.0% NO
Sanilac 06 - East Michigan Prosperity Region Croswell City $5,344,040 $10,258,664 $4,914,624 52.1% $421,272 $2,163,124 19.5% YES
Sanilac 06 - East Michigan Prosperity Region Lexington Village $1,638,881 $2,671,596 $1,032,715 61.3% $67,032 $1,278,677 5.2% NO
Sanilac 06 - East Michigan Prosperity Region Marlette City $1,434,930 $1,979,028 $544,098 72.5% $80,452 $1,310,462 6.1% NO
Sanilac 06 - East Michigan Prosperity Region Port Sanilac Village $604,743 $1,030,751 $426,008 58.7% $38,388 $565,421 6.8% NO
Sanilac 06 - East Michigan Prosperity Region Sandusky City $2,486,422 $4,481,532 $1,995,110 55.5% $143,391 $2,276,171 6.3% NO
Sanilac 06 - East Michigan Prosperity Region Sandusky District Library Library $256,627 $266,008 $9,381 96.5% $3,005 $304,348 1.0% NO
Sanilac 06 - East Michigan Prosperity Region Sanilac County County $60,612,120 $70,165,182 $9,553,062 86.4% $2,285,884 $25,725,728 8.9% NO
Sanilac 06 - East Michigan Prosperity Region
Sanilac County Community Mental
Health Authority Authority $8,930,282 $12,141,989 $3,211,707 73.5% $486,553 $17,050,045 2.9% NO
Sanilac 06 - East Michigan Prosperity Region Sanilac County Road Commission Road Commission $6,566,343 $8,309,855 $1,743,512 79.0% $191,161 $17,546,937 1.1% NO
Schoolcraft 01 - Upper Peninsula Prosperity Alliance
Hiawatha Community Behavioral Health
Authority Authority $13,597,319 $18,642,509 $5,045,190 72.9% $348,104 $15,350,812 2.3% NO
Schoolcraft 01 - Upper Peninsula Prosperity Alliance Manistique City $6,594,183 $14,520,318 $7,926,135 45.4% $579,919 $3,460,531 16.8% YES
Schoolcraft 01 - Upper Peninsula Prosperity Alliance Schoolcraft County County $8,699,130 $14,886,487 $6,187,357 58.4% $462,424 $4,754,265 9.7% NO
Schoolcraft 01 - Upper Peninsula Prosperity Alliance Schoolcraft County Housing Commission Authority $516,665 $797,210 $280,545 64.8% $16,121 $413,650 3.9% NO
Schoolcraft 01 - Upper Peninsula Prosperity Alliance Schoolcraft County Medical Care Facility Authority $11,538,420 $17,910,347 $6,371,927 64.4% $623,227 $7,442,972 8.4% NO
Schoolcraft 01 - Upper Peninsula Prosperity Alliance
Schoolcraft County Public Transit
System Authority Authority $675,080 $906,660 $231,580 74.5% $73,343 $129,969 56.4% NO
23 of 39Updated 08/10/2018
Source: Fiscal year 2017 audited financial statements or most recent year available for biennial filers

Pension System Summary
County Prosperity Region Local Unit Name Local Unit Type
Pension System Name
(If Multiple Systems) Assets Liabilities
Unfunded Actuarial
Accrued Liability Funded Ratio
Annual Required
Contribution (ARC)
Governmental Fund
Revenue ARC/Revenue
Preliminary
Underfunded Status
(1)
Michigan Department of TreasuryRetirement Pension System Summary
As of August 10, 2018
1Note: 2017 PA 202 defines "underfunded status" to mean the following:
A) For retirement pension systems, the triggers for primary units (cities, villages, counties, and townships) are if the unit is less than 60% funded and has an annual required contribution that is over 10% of governmental fund revenues. The non-primary unit trigger is if the unit is less than 60% funded.
B) For retirement health care systems, the triggers for primary units (cities, villages, counties and townships) are if the unit is less than 40% funded and has an annual required contribution greater than 12% of governmental fund revenues. The non-primary unit trigger is if the unit is less than 40% funded.
Schoolcraft 01 - Upper Peninsula Prosperity Alliance Schoolcraft County Road Commission Road Commission $6,722,322 $14,918,075 $8,195,753 45.1% $408,642 $5,113,091 8.0% YES
Shiawassee 06 - East Michigan Prosperity Region Bancroft Village $27,926 $92,333 $64,407 30.2% $4,620 $227,512 2.0% NO
Shiawassee 06 - East Michigan Prosperity Region Corunna City $3,508,685 $5,819,847 $2,311,162 60.3% $299,434 $2,819,235 10.6% NO
Shiawassee 06 - East Michigan Prosperity Region Durand City $3,907,876 $6,116,259 $2,208,383 63.9% $209,594 $2,545,525 8.2% NO
Shiawassee 06 - East Michigan Prosperity Region Laingsburg City $494,039 $553,932 $59,893 89.2% $9,509 $1,242,421 0.8% NO
Shiawassee 06 - East Michigan Prosperity Region Owosso City MERS $3,113,258 $4,829,803 $1,716,545 64.5% $128,079 $10,933,290 6.9% NO
Shiawassee 06 - East Michigan Prosperity Region Owosso City OWOSSO ERS $31,715,358 $37,240,151 $5,524,793 85.2% $629,143 $10,933,290 6.9% NO
Shiawassee 06 - East Michigan Prosperity Region
Shiawassee County Community Mental
Health Authority Authority $11,968,976 $14,826,775 $2,857,799 80.7% $534,646 $19,201,622 2.8% NO
Shiawassee 06 - East Michigan Prosperity Region Shiawassee County Road Commission Road Commission $14,753,434 $20,424,609 $5,671,175 72.2% $1,029,796 $12,850,525 8.0% NO
Shiawassee 06 - East Michigan Prosperity Region Shiawassee District Library Library $1,815,699 $1,907,575 $91,876 95.2% $0 $884,705 0.0% NO
St Joseph 08 - Southwest Prosperity Region St Joseph County County $42,769,992 $45,352,941 $2,582,949 94.3% $635,270 $23,709,638 2.7% NO
St Joseph 08 - Southwest Prosperity Region Sturgis City $35,555,000 $35,114,000 -$441,000 101.3% $483,387 $13,312,532 3.6% NO
St Joseph 08 - Southwest Prosperity Region Three Rivers City $12,154,200 $17,960,417 $5,806,217 67.7% $462,888 $8,447,819 5.5% NO
St Joseph 08 - Southwest Prosperity Region White Pigeon Village $232,746 $260,042 $27,296 89.5% $7,190 $661,560 1.1% NO
St. Clair 06 - East Michigan Prosperity Region Algonac City $4,578,906 $6,083,425 $1,504,519 75.3% $154,342 $2,869,063 5.4% NO
St. Clair 06 - East Michigan Prosperity Region
Blue Water Area Transportation
Commission Authority $7,099,134 $9,917,328 $2,818,194 71.6% $386,497 $13,215,630 2.9% NO
St. Clair 06 - East Michigan Prosperity Region Capac Village $625,901 $2,586,540 $1,960,639 24.2% $62,094 $1,063,686 5.8% NO
St. Clair 06 - East Michigan Prosperity Region Clay Township Township $5,857,835 $9,528,599 $3,670,764 61.5% $296,081 $6,011,244 4.9% NO
St. Clair 06 - East Michigan Prosperity Region East China Charter Township Township $5,473,118 $8,753,972 $3,280,854 62.5% $230,708 $2,206,249 10.5% NO
St. Clair 06 - East Michigan Prosperity Region Marine City City $5,042,689 $6,949,032 $1,906,343 72.6% $189,645 $3,254,359 5.8% NO
St. Clair 06 - East Michigan Prosperity Region Marysville City
Police Officers and
Firefighters Retirement
System $12,771,017 $24,937,758 $12,166,741 51.2% $635,516 $10,721,282 10.4% YES
St. Clair 06 - East Michigan Prosperity Region Marysville City
General City Employee
Retirement System $15,501,114 $26,286,823 $10,785,709 59.0% $480,103 $10,721,282 10.4% YES
St. Clair 06 - East Michigan Prosperity Region Port Huron City $80,577,119 $151,424,735 $70,847,616 53.2% $4,169,901 $35,085,176 11.9% YES
St. Clair 06 - East Michigan Prosperity Region Port Huron Charter Township Township $2,646,566 $3,801,807 $1,155,241 69.6% $126,144 $3,812,260 3.3% NO
St. Clair 06 - East Michigan Prosperity Region Port Huron City Housing Commission Authority $5,230,839 $8,582,105 $3,351,266 61.0% $0 $8,040,521 0.0% NO
St. Clair 06 - East Michigan Prosperity Region St Clair City MERS $12,040,034 $21,957,226 $9,917,192 54.8% $624,846 $5,953,798 10.5% YES
St. Clair 06 - East Michigan Prosperity Region St Clair City
St. Clair, City of (7703),
MERS $12,040,034 $21,957,226 $9,917,192 57.5% $624,846 $5,953,798 10.5% YES
St. Clair 06 - East Michigan Prosperity Region St Clair Area Fire Authority Authority $129,118 $0 -$129,118 $0 $628,800 0.0% NO
St. Clair 06 - East Michigan Prosperity Region St Clair County County
St. Clair County
Retirement System $241,595,039 $260,274,178 $18,679,139 92.8% $3,822,897 $87,318,474 4.4% NO
St. Clair 06 - East Michigan Prosperity Region St Clair County County
St. Clair County Other
Postemployment $148,098,237 $167,538,870 $19,440,633 88.4% $3,822,897 $87,318,474 4.4% NO
St. Clair 06 - East Michigan Prosperity Region
St Clair County Community Mental
Health Authority Authority $38,305,235 $46,020,768 $7,715,533 83.2% $1,285,108 $52,093,539 2.5% NO
St. Clair 06 - East Michigan Prosperity Region St Clair County Road Commission Road Commission $35,868,468 $42,355,452 $6,486,984 84.7% $910,369 $28,590,485 3.2% NO
Tuscola 06 - East Michigan Prosperity Region Caro City $1,577,882 $1,509,554 -$68,328 104.5% $0 $3,560,099 0.0% NO
Tuscola 06 - East Michigan Prosperity Region Indianfields Township Township $311,435 $272,608 -$38,827 114.2% $1,525 $623,636 0.2% NO
Tuscola 06 - East Michigan Prosperity Region Millington Village $1,395,735 $1,413,193 $17,458 98.8% $0 $585,030 0.0% NO
Tuscola 06 - East Michigan Prosperity Region Tuscola County County $34,951,025 $35,238,873 $287,848 99.2% $359,904 $23,871,257 1.5% NO
Tuscola 06 - East Michigan Prosperity Region
Tuscola County Community Mental
Health Authority Authority $14,104,284 $15,993,667 $1,889,383 88.2% $523,018 $18,409,752 2.8% NO
Tuscola 06 - East Michigan Prosperity Region
Tuscola County Health Department
Authority Authority $7,767,837 $10,918,919 $3,151,082 71.1% $216,504 $6,049,774 3.6% NO
Tuscola 06 - East Michigan Prosperity Region Tuscola County Medical Care Facility Authority $16,385,688 $17,239,479 $853,791 95.0% $315,912 $22,284,825 1.4% NO
Tuscola 06 - East Michigan Prosperity Region Tuscola County Road Commission Road Commission MERS of Michigan $4,568,570 $6,297,307 $1,728,737 72.5% $192,617 $16,242,409 1.5% NO
Tuscola 06 - East Michigan Prosperity Region Tuscola County Road Commission Road Commission
Pension Plan for
Employees of Tuscola
County Road
Commission $164,443 $577,114 $412,671 28.5% $44,031 $16,242,409 1.5% YES
Tuscola 06 - East Michigan Prosperity Region Vassar City $4,392,762 $7,255,206 $2,862,444 60.5% $158,268 $1,975,674 8.0% NO
Van Buren 08 - Southwest Prosperity Region Bangor City $2,028,586 $1,677,012 -$351,574 121.0% $0 $1,457,987 0.0% NO
24 of 39Updated 08/10/2018
Source: Fiscal year 2017 audited financial statements or most recent year available for biennial filers

Pension System Summary
County Prosperity Region Local Unit Name Local Unit Type
Pension System Name
(If Multiple Systems) Assets Liabilities
Unfunded Actuarial
Accrued Liability Funded Ratio
Annual Required
Contribution (ARC)
Governmental Fund
Revenue ARC/Revenue
Preliminary
Underfunded Status
(1)
Michigan Department of TreasuryRetirement Pension System Summary
As of August 10, 2018
1Note: 2017 PA 202 defines "underfunded status" to mean the following:
A) For retirement pension systems, the triggers for primary units (cities, villages, counties, and townships) are if the unit is less than 60% funded and has an annual required contribution that is over 10% of governmental fund revenues. The non-primary unit trigger is if the unit is less than 60% funded.
B) For retirement health care systems, the triggers for primary units (cities, villages, counties and townships) are if the unit is less than 40% funded and has an annual required contribution greater than 12% of governmental fund revenues. The non-primary unit trigger is if the unit is less than 40% funded.
Van Buren 08 - Southwest Prosperity Region Covert Township Township $1,194,153 $1,669,096 $474,943 71.5% $67,772 $4,356,162 1.6% NO
Van Buren 08 - Southwest Prosperity Region Lawrence Village $114,637 $117,803 $3,166 97.3% $0 $510,916 0.0% NO
Van Buren 08 - Southwest Prosperity Region Paw Paw Village $6,705,331 $9,482,443 $2,777,112 70.7% $171,970 $2,734,063 6.3% NO
Van Buren 08 - Southwest Prosperity Region
Paw Paw Lake Regional Joint Sewage
Disposal Board Authority $1,446,626 $2,029,274 $582,648 71.3% $40,061 $1,001,214 4.0% NO
Van Buren 08 - Southwest Prosperity Region South Haven City $22,204,889 $28,409,888 $6,204,999 78.2% $538,807 $8,668,838 6.2% NO
Van Buren 08 - Southwest Prosperity Region
South Haven Area Emergency Services
Authority Authority $5,326,284 $7,843,874 $2,517,590 67.9% $235,392 $2,572,195 9.2% NO
Van Buren 08 - Southwest Prosperity Region Van Buren County County $23,451,952 $35,944,379 $12,492,427 65.2% $1,043,032 $31,982,095 3.3% NO
Van Buren 08 - Southwest Prosperity Region Van Buren County Road Commission Road Commission $8,626,089 $8,781,873 $155,784 98.2% $215,978 $14,874,414 1.5% NO
Van Buren 08 - Southwest Prosperity Region Van Buren District Library Library $1,592,039 $2,012,128 $420,089 79.1% $48,663 $2,229,045 2.2% NO
Washtenaw 09 - Southeast Michigan Prosperity Region Ann Arbor City $491,273,658 $559,385,658 $68,112,000 87.8% $11,348,853 $128,940,812 8.8% NO
Washtenaw 09 - Southeast Michigan Prosperity Region Barton Hills Village $656,525 $915,469 $258,944 71.7% $15,588 $951,702 1.6% NO
Washtenaw 09 - Southeast Michigan Prosperity Region Chelsea City $8,932,775 $12,728,358 $3,795,583 70.2% $679,104 $5,784,524 11.7% NO
Washtenaw 09 - Southeast Michigan Prosperity Region Chelsea Area Fire Authority Authority $882,966 $812,622 -$70,344 108.7% $50,159 $1,512,230 3.3% NO
Washtenaw 09 - Southeast Michigan Prosperity Region Dexter City $3,020,903 $3,867,832 $846,929 78.1% $84,624 $5,891,353 1.4% NO
Washtenaw 09 - Southeast Michigan Prosperity Region Dexter Area Fire Department Authority Authority $1,120,866 $1,713,818 $592,952 65.4% $78,504 $1,936,496 4.1% NO
Washtenaw 09 - Southeast Michigan Prosperity Region Dexter Township Township $662,880 $869,813 $206,933 76.2% $10,286 $2,814,263 0.4% NO
Washtenaw 09 - Southeast Michigan Prosperity Region Lima Township Township $445,788 $398,568 -$47,220 111.8% $5,195 $630,646 0.8% NO
Washtenaw 09 - Southeast Michigan Prosperity Region Milan City $5,967,697 $12,787,879 $6,820,182 46.7% $633,787 $5,878,097 10.8% YES
Washtenaw 09 - Southeast Michigan Prosperity Region Milan Public Library Library $229,938 $404,908 $174,970 56.8% $14,129 $382,776 3.7% YES
Washtenaw 09 - Southeast Michigan Prosperity Region Northfield Township Township $1,704,156 $1,916,882 $212,726 88.9% $56,582 $4,718,824 1.2% NO
Washtenaw 09 - Southeast Michigan Prosperity Region Pittsfield Charter Township Township $27,807,147 $36,752,095 $8,944,948 75.7% $1,475,913 $20,659,986 7.1% NO
Washtenaw 09 - Southeast Michigan Prosperity Region Saline City $16,392,976 $26,450,164 $10,057,188 62.0% $805,287 $12,921,254 6.2% NO
Washtenaw 09 - Southeast Michigan Prosperity Region Scio Township Township $2,081,159 $2,875,332 $794,173 72.4% $118,886 $6,919,637 1.7% NO
Washtenaw 09 - Southeast Michigan Prosperity Region Superior Charter Township Township $5,440,714 $7,573,400 $2,132,686 71.8% $243,677 $6,947,323 3.5% NO
Washtenaw 09 - Southeast Michigan Prosperity Region Washtenaw County County
Municipal Employees'
Retirement System $90,258,258 $114,914,404 $24,656,146 78.5% $3,740,713 $262,432,767 5.0% NO
Washtenaw 09 - Southeast Michigan Prosperity Region Washtenaw County County
Washtenaw County
Employees' Retirement
System $279,717,636 $361,536,795 $81,819,159 77.4% $9,367,571 $262,432,767 5.0% NO
Washtenaw 09 - Southeast Michigan Prosperity Region Washtenaw County Road Commission Road Commission $34,136,640 $63,614,065 $29,477,425 53.7% $2,007,861 $48,555,372 4.1% YES
Washtenaw 09 - Southeast Michigan Prosperity Region Ypsilanti City
Police and Fire
Retirement System $26,659,246 $46,044,195 $19,384,949 57.9% $1,355,989 $21,590,541 6.5% NO
Washtenaw 09 - Southeast Michigan Prosperity Region Ypsilanti City
Municipal Employees'
Retirement System $17,909,091 $14,203,912 -$3,705,179 126.1% $41,680 $21,590,541 6.5% NO
Washtenaw 09 - Southeast Michigan Prosperity Region Ypsilanti Charter Township Township MERS $14,758,758 $21,420,292 $6,661,534 68.9% $468,622 $30,274,531 4.1% NO
Washtenaw 09 - Southeast Michigan Prosperity Region Ypsilanti Charter Township Township
Police and Firefighters
Pension Plan $27,248,380 $32,684,010 $5,435,630 83.4% $763,874 $30,274,531 4.1% NO
Washtenaw 09 - Southeast Michigan Prosperity Region Ypsilanti Community Utilities Authority Authority $29,139,150 $52,883,046 $23,743,896 55.1% $1,929,047 $42,916,770 4.5% YES
Wayne 10 - Detroit Metro Prosperity Region 35th District- Plymouth Authority Authority $2,705,870 $4,854,672 $2,148,802 55.7% $116,374 $4,951,905 2.4% YES
Wayne 10 - Detroit Metro Prosperity Region Allen Park City $83,408,540 $108,031,121 $24,622,581 77.2% $2,641,242 $37,586,040 7.0% NO
Wayne 10 - Detroit Metro Prosperity Region Belleville City $4,512,926 $8,315,794 $3,802,868 54.3% $216,257 $2,578,835 8.4% NO
Wayne 10 - Detroit Metro Prosperity Region Brownstown Charter Township Township $19,548,925 $27,336,209 $7,787,284 71.5% $817,797 $20,732,004 3.9% NO
Wayne 10 - Detroit Metro Prosperity Region Canton Charter Township Township $76,083,398 $121,527,157 $45,443,759 62.6% $4,719,515 $68,653,917 6.9% NO
Wayne 10 - Detroit Metro Prosperity Region Canton Public Library Library $4,174,913 $4,395,134 $220,221 95.0% $123,449 $5,717,346 2.2% NO
Wayne 10 - Detroit Metro Prosperity Region
Central Wayne County Sanitation
Authority Authority $1,722,958 $2,279,433 $556,475 75.6% $92,952 $2,787,778 3.3% NO
Wayne 10 - Detroit Metro Prosperity Region Dearborn City
City of Dearborn
Chapter 22 Retirement
System $141,226,033 $185,375,206 $44,149,173 76.2% $3,718,752 $139,878,108 10.1% NO
Wayne 10 - Detroit Metro Prosperity Region Dearborn City
Municipal Employees
Retirement System of
Michigan (MERS) $10,785,175 $10,340,655 -$444,520 104.3% $1,131,533 $139,878,108 10.1% NO
25 of 39Updated 08/10/2018
Source: Fiscal year 2017 audited financial statements or most recent year available for biennial filers

Pension System Summary
County Prosperity Region Local Unit Name Local Unit Type
Pension System Name
(If Multiple Systems) Assets Liabilities
Unfunded Actuarial
Accrued Liability Funded Ratio
Annual Required
Contribution (ARC)
Governmental Fund
Revenue ARC/Revenue
Preliminary
Underfunded Status
(1)
Michigan Department of TreasuryRetirement Pension System Summary
As of August 10, 2018
1Note: 2017 PA 202 defines "underfunded status" to mean the following:
A) For retirement pension systems, the triggers for primary units (cities, villages, counties, and townships) are if the unit is less than 60% funded and has an annual required contribution that is over 10% of governmental fund revenues. The non-primary unit trigger is if the unit is less than 60% funded.
B) For retirement health care systems, the triggers for primary units (cities, villages, counties and townships) are if the unit is less than 40% funded and has an annual required contribution greater than 12% of governmental fund revenues. The non-primary unit trigger is if the unit is less than 40% funded.
Wayne 10 - Detroit Metro Prosperity Region Dearborn City
City of Dearborn
Chapter 21 Retirement
System $25,408,169 $10,634,310 -$14,773,859 238.9% $0 $139,878,108 10.1% NO
Wayne 10 - Detroit Metro Prosperity Region Dearborn City
City of Dearborn
Chapter 23 Retirement
System $278,327,029 $367,161,180 $88,834,151 75.8% $9,333,396 $139,878,108 10.1% NO
Wayne 10 - Detroit Metro Prosperity Region Dearborn Heights City
Police and Fire
Retirement System $174,367,274 $199,472,907 $25,105,633 87.4% $2,511,017 $47,291,305 7.2% NO
Wayne 10 - Detroit Metro Prosperity Region Dearborn Heights City
General Government
Employees' Retirement
System $39,512,564 $52,791,859 $13,279,295 74.8% $904,328 $47,291,305 7.2% NO
Wayne 10 - Detroit Metro Prosperity Region Detroit City
The General
Retirement System of
the City of Detroit-
Component II $1,933,541,307 $2,926,421,953 $992,880,646 66.1% $0 $1,334,474,794 1.9% NO
Wayne 10 - Detroit Metro Prosperity Region Detroit City
The Police and Fire
Retriement System of
the City of Detroit-
Component II $2,950,470,450 $3,809,685,847 $859,215,397 77.4% $0 $1,334,474,794 1.9% NO
Wayne 10 - Detroit Metro Prosperity Region Detroit City
The General
Retirement System of
the City of Detroit-
Component I $36,253,554 $49,160,644 $12,907,090 73.7% $9,484,992 $1,334,474,794 1.9% NO
Wayne 10 - Detroit Metro Prosperity Region Detroit City
The Police and Fire
Retriement System of
the City of Detroit-
Component I $42,283,763 $49,809,170 $7,525,407 84.9% $16,448,246 $1,334,474,794 1.9% NO
Wayne 10 - Detroit Metro Prosperity Region Ecorse City $15,734,253 $41,661,704 $25,927,451 37.8% $4,907,707 $16,076,526 30.5% YES
Wayne 10 - Detroit Metro Prosperity Region Flat Rock City $11,531,028 $24,956,391 $13,425,363 46.2% $794,184 $14,872,610 5.3% NO
Wayne 10 - Detroit Metro Prosperity Region Garden City City MERS - City employees $55,195,412 $87,732,884 $32,537,472 62.9% $1,813,606 $22,448,925 8.5% NO
Wayne 10 - Detroit Metro Prosperity Region Garden City City MERS - District court $1,712,640 $2,754,671 $1,042,031 62.2% $97,536 $22,448,925 8.5% NO
Wayne 10 - Detroit Metro Prosperity Region Gibraltar City
General Employes'
Retirement System $1,670,905 $1,578,536 -$92,369 105.9% $27,285 $3,967,907 3.7% NO
Wayne 10 - Detroit Metro Prosperity Region Gibraltar City
Public Safety Officers'
Retirement System $8,833,407 $8,654,053 -$179,354 102.1% $119,780 $3,967,907 3.7% NO
Wayne 10 - Detroit Metro Prosperity Region Grosse Ile Township Township $19,098,597 $32,873,041 $13,774,444 58.1% $1,037,698 $9,085,378 11.4% YES
Wayne 10 - Detroit Metro Prosperity Region Grosse Pointe City $38,337,629 $32,336,308 -$6,001,321 118.6% $0 $8,103,360 0.0% NO
Wayne 10 - Detroit Metro Prosperity Region Grosse Pointe Farms City
City of Grosse Pointe
Farms Employees
Retirement System $23,754,198 $25,381,186 $1,626,988 93.6% $299,240 $14,646,653 2.0% NO
Wayne 10 - Detroit Metro Prosperity Region Grosse Pointe Farms City
City of Grosse Pointe
Farms Public Safety
Retirement System $39,759,120 $35,862,170 -$3,896,950 110.9% $0 $14,646,653 2.0% NO
Wayne 10 - Detroit Metro Prosperity Region Grosse Pointe Park City $24,051,823 $45,093,834 $21,042,011 53.3% $1,378,416 $14,508,269 9.5% NO
Wayne 10 - Detroit Metro Prosperity Region Grosse Pointe Shores City Of The Village City $20,755,504 $27,575,067 $6,819,563 75.3% $309,565 $6,512,211 4.8% NO
Wayne 10 - Detroit Metro Prosperity Region Grosse Pointe Woods City
City of Grosse Pointe
Woods Employees
Retirement System $37,614,854 $60,316,215 $22,701,361 62.4% $1,076,000 $18,991,373 7.2% NO
Wayne 10 - Detroit Metro Prosperity Region Grosse Pointe Woods City
City of Grosse Pointe
Woods Supplemental
Annuity Fund $1,610,133 $3,190,039 $1,579,906 50.5% $290,000 $18,991,373 7.2% NO
Wayne 10 - Detroit Metro Prosperity Region Hamtramck City $40,917,408 $96,139,335 $55,221,927 42.6% $4,666,848 $19,622,588 23.8% YES
Wayne 10 - Detroit Metro Prosperity Region Highland Park City
Public Safety
Employees $652,623 $31,847,236 $31,194,613 3.7% $4,032,000 $16,874,119 32.6% YES
Wayne 10 - Detroit Metro Prosperity Region Highland Park City Police and Fire Plan $295,487 $4,347,752 $4,052,265 6.8% $594,000 $16,874,119 32.6% YES
Wayne 10 - Detroit Metro Prosperity Region Highland Park City
MERS - General
Employees $230,925 $6,173,544 $5,942,619 2.0% $872,000 $16,874,119 32.6% YES
Wayne 10 - Detroit Metro Prosperity Region Huron Charter Township Township $14,339,308 $21,802,812 $7,463,504 65.8% $519,402 $9,487,586 5.5% NO
Wayne 10 - Detroit Metro Prosperity Region Inkster City
General Employees
Retirement System $10,361,481 $12,759,993 $2,398,512 81.2% $539,315 $19,633,911 6.8% NO
26 of 39Updated 08/10/2018
Source: Fiscal year 2017 audited financial statements or most recent year available for biennial filers

Pension System Summary
County Prosperity Region Local Unit Name Local Unit Type
Pension System Name
(If Multiple Systems) Assets Liabilities
Unfunded Actuarial
Accrued Liability Funded Ratio
Annual Required
Contribution (ARC)
Governmental Fund
Revenue ARC/Revenue
Preliminary
Underfunded Status
(1)
Michigan Department of TreasuryRetirement Pension System Summary
As of August 10, 2018
1Note: 2017 PA 202 defines "underfunded status" to mean the following:
A) For retirement pension systems, the triggers for primary units (cities, villages, counties, and townships) are if the unit is less than 60% funded and has an annual required contribution that is over 10% of governmental fund revenues. The non-primary unit trigger is if the unit is less than 60% funded.
B) For retirement health care systems, the triggers for primary units (cities, villages, counties and townships) are if the unit is less than 40% funded and has an annual required contribution greater than 12% of governmental fund revenues. The non-primary unit trigger is if the unit is less than 40% funded.
Wayne 10 - Detroit Metro Prosperity Region Inkster City
Policemen and Firemen
Retirement System $26,060,797 $34,205,106 $8,144,309 76.2% $791,347 $19,633,911 6.8% NO
Wayne 10 - Detroit Metro Prosperity Region Lincoln Park City MERS $7,418,158 $41,054,720 $33,636,562 18.1% $3,527,338 $29,372,372 32.5% YES
Wayne 10 - Detroit Metro Prosperity Region Lincoln Park City
Police and Fire
Employees $21,591,583 $80,257,718 $58,666,135 26.9% $6,030,575 $29,372,372 32.5% YES
Wayne 10 - Detroit Metro Prosperity Region Livonia City $231,055,992 $219,435,490 -$11,620,502 105.3% $336,320 $101,813,976 0.3% NO
Wayne 10 - Detroit Metro Prosperity Region Melvindale City MERS $16,098,157 $41,012,348 $24,914,191 39.3% $1,716,437 $13,532,738 15.7% YES
Wayne 10 - Detroit Metro Prosperity Region Melvindale City
Policemen and Fire
Retirement System I $5,891,960 $5,663,708 -$228,252 104.0% $408,648 $13,532,738 15.7% NO
Wayne 10 - Detroit Metro Prosperity Region Melvindale Housing Commission Authority $966,748 $1,314,939 $348,191 73.5% $32,667 $2,073,161 1.6% NO
Wayne 10 - Detroit Metro Prosperity Region Northville City $11,481,583 $19,905,529 $8,423,946 57.7% $901,164 $9,662,435 9.3% NO
Wayne 10 - Detroit Metro Prosperity Region Northville Charter Township Township $30,637,948 $44,948,013 $14,310,065 68.2% $2,086,065 $25,497,439 8.2% NO
Wayne 10 - Detroit Metro Prosperity Region Northville District Library Library $2,438,985 $3,183,268 $744,283 76.6% $154,645 $2,858,670 5.4% NO
Wayne 10 - Detroit Metro Prosperity Region Plymouth City $8,486,310 $16,169,823 $7,683,513 52.5% $1,365,298 $12,914,678 10.6% YES
Wayne 10 - Detroit Metro Prosperity Region Plymouth Charter Township Township $20,337,646 $29,835,307 $9,497,661 68.2% $738,427 $15,154,543 4.9% NO
Wayne 10 - Detroit Metro Prosperity Region Plymouth District Library Library $3,692,751 $4,515,771 $823,020 81.8% $136,414 $3,743,153 3.6% NO
Wayne 10 - Detroit Metro Prosperity Region Redford Charter Township Township
Police and Fire Pension
Plan $63,281,796 $111,474,258 $48,192,462 56.8% $4,320,943 $38,453,626 15.4% YES
Wayne 10 - Detroit Metro Prosperity Region Redford Charter Township Township
MERS - General
Employees $28,414,826 $50,895,851 $22,481,025 55.8% $1,609,912 $38,453,626 15.4% YES
Wayne 10 - Detroit Metro Prosperity Region Redford Township District Library Library $2,359,700 $2,826,468 $466,768 83.5% $95,860 $2,798,041 3.4% NO
Wayne 10 - Detroit Metro Prosperity Region River Rouge City
Policemen and Firemen
Retirement System $33,528,867 $43,293,984 $9,765,117 77.4% $2,123,051 $18,795,265 17.5% NO
Wayne 10 - Detroit Metro Prosperity Region River Rouge City
General Employees'
Retirement System $17,843,400 $20,367,249 $2,523,849 87.6% $1,175,488 $18,795,265 17.5% NO
Wayne 10 - Detroit Metro Prosperity Region Riverview City $30,143,435 $36,270,078 $6,126,643 83.1% $1,092,653 $9,970,825 11.0% NO
Wayne 10 - Detroit Metro Prosperity Region Rockwood City $2,265,495 $2,543,687 $278,192 89.1% $60,617 $3,014,339 2.0% NO
Wayne 10 - Detroit Metro Prosperity Region Romulus City $19,936,765 $50,844,067 $30,907,302 39.2% $2,202,543 $27,921,448 7.9% NO
Wayne 10 - Detroit Metro Prosperity Region
Southeast Michigan Council Of
Governments Authority $25,380,477 $30,665,543 $5,285,066 82.8% $526,205 $10,895,567 4.8% NO
Wayne 10 - Detroit Metro Prosperity Region Southgate City
City of Southgate
Municipal Emoployees'
Retirement System $18,719,289 $29,164,527 $10,445,238 64.2% $854,841 $27,401,773 13.8% NO
Wayne 10 - Detroit Metro Prosperity Region Southgate City
City of Southgate
Policemen and Firemen
Retirement System $43,250,895 $72,513,577 $29,262,682 59.6% $2,940,014 $27,401,773 13.8% YES
Wayne 10 - Detroit Metro Prosperity Region
Suburban Mobility Authority For
Regional Transportation Authority $168,162,179 $243,159,671 $74,997,492 69.2% $5,725,357 $160,476,853 3.6% NO
Wayne 10 - Detroit Metro Prosperity Region Sumpter Township Township $6,087,451 $8,558,415 $2,470,964 71.1% $214,548 $6,462,861 3.3% NO
Wayne 10 - Detroit Metro Prosperity Region Taylor City General Government Employees' Retirement System$38,698,098 $83,051,749 $44,353,651 46.6% $3,530,436 $65,615,183 13.4% YES
Wayne 10 - Detroit Metro Prosperity Region Taylor City 23rd District Court - MERS $2,793,808 $3,841,638 $1,047,830 72.7% $42,463 $65,615,183 13.4% NO
Wayne 10 - Detroit Metro Prosperity Region Taylor City Police and Fire Retirement System$122,481,035 $226,318,289 $103,837,254 54.1% $5,190,370 $65,615,183 13.4% YES
Wayne 10 - Detroit Metro Prosperity Region Taylor City Housing Commission Authority $663,096 0.0% $6,976,458 0.0% YES
Wayne 10 - Detroit Metro Prosperity Region The Library Network Library $5,527,214 $7,693,951 $2,166,737 71.8% $170,375 $3,085,067 5.5% NO
Wayne 10 - Detroit Metro Prosperity Region Trenton City Police & Fire Pension $52,257,573 $69,879,009 $17,621,436 74.8% $1,479,258 $22,826,477 15.1% NO
Wayne 10 - Detroit Metro Prosperity Region Trenton City MERS $24,909,943 $45,670,671 $20,760,728 54.5% $1,964,796 $22,826,477 15.1% YES
Wayne 10 - Detroit Metro Prosperity Region Van Buren Charter Township Township $13,067,795 $17,822,858 $4,755,063 73.3% $485,671 $17,219,661 2.8% NO
Wayne 10 - Detroit Metro Prosperity Region Wayne City $63,791,363 $111,745,606 $47,954,243 57.1% $3,331,359 $19,406,110 17.2% YES
Wayne 10 - Detroit Metro Prosperity Region Wayne County County $799,345,415 $1,447,254,447 $647,909,032 55.2% $47,467,616 $842,467,821 5.6% NO
Wayne 10 - Detroit Metro Prosperity Region Wayne County Airport Authority Authority $110,277,974 $161,200,880 $50,922,906 68.4% $6,924,296 $458,318,405 1.5% NO
Wayne 10 - Detroit Metro Prosperity Region Wayne Housing Commission Authority $574,282 $812,199 $237,917 70.7% $25,079 $470,458 5.3% NO
Wayne 10 - Detroit Metro Prosperity Region Westland City MERS $53,884,463 $132,490,334 $78,605,871 40.7% $5,249,635 $73,345,154 16.5% YES
Wayne 10 - Detroit Metro Prosperity Region Westland City Westland Police & Fire Pension Fund $157,970,145 $225,516,042 $67,545,897 70.0% $6,841,964 $73,345,154 16.5% NO
Wayne 10 - Detroit Metro Prosperity Region Woodhaven City $21,994,166 $27,871,621 $5,877,455 78.9% $897,613 $15,662,620 5.7% NO
Wayne 10 - Detroit Metro Prosperity Region Wyandotte City $65,156,206 $94,331,393 $29,175,187 69.1% $4,224,526 $25,864,003 16.3% NO
Wexford 02 - Northwest Prosperity Region Cadillac City Policemen and Firemen Retirement System$10,749,330 $13,476,626 $2,727,296 79.8% $533,253 $9,095,881 9.0% NO
Wexford 02 - Northwest Prosperity Region Cadillac City Municipal Employees Retirement System (MERS)$9,487,263 $12,369,739 $2,882,476 76.7% $281,993 $9,095,881 9.0% NO
Wexford 02 - Northwest Prosperity Region Cadillac City Housing Commission AuthorityAuthority $563,098 $666,059 $102,961 84.5% $20,330 $972,808 2.1% NO
Wexford 02 - Northwest Prosperity Region Cadillac Wexford Public Library Library $1,329,743 $1,602,206 $272,463 83.0% $41,021 $1,060,283 3.9% NO
27 of 39Updated 08/10/2018
Source: Fiscal year 2017 audited financial statements or most recent year available for biennial filers

Pension System Summary
County Prosperity Region Local Unit Name Local Unit Type
Pension System Name
(If Multiple Systems) Assets Liabilities
Unfunded Actuarial
Accrued Liability Funded Ratio
Annual Required
Contribution (ARC)
Governmental Fund
Revenue ARC/Revenue
Preliminary
Underfunded Status
(1)
Michigan Department of TreasuryRetirement Pension System Summary
As of August 10, 2018
1Note: 2017 PA 202 defines "underfunded status" to mean the following:
A) For retirement pension systems, the triggers for primary units (cities, villages, counties, and townships) are if the unit is less than 60% funded and has an annual required contribution that is over 10% of governmental fund revenues. The non-primary unit trigger is if the unit is less than 60% funded.
B) For retirement health care systems, the triggers for primary units (cities, villages, counties and townships) are if the unit is less than 40% funded and has an annual required contribution greater than 12% of governmental fund revenues. The non-primary unit trigger is if the unit is less than 40% funded.
Wexford 02 - Northwest Prosperity Region Cadillac- Wexford Transit Authority Authority $1,612,850 $2,324,357 $711,507 69.4% $72,951 $477,046 15.3% NO
Wexford 02 - Northwest Prosperity Region Manton City $687,853 $1,940,180 $1,252,327 35.5% $78,927 $946,975 8.3% NO
Wexford 02 - Northwest Prosperity Region Mid- Michigan Library League Library $670,306 $750,838 $80,532 89.3% $4,587 $257,961 1.8% NO
Wexford 02 - Northwest Prosperity Region Wexford County County $19,800,803 $29,439,942 $9,639,139 67.3% $914,818 $16,088,202 5.7% NO
Wexford 02 - Northwest Prosperity Region Wexford County Road Commission Road Commission $9,881,619 $14,040,293 $4,158,674 70.4% $395,574 $8,568,846 4.6% NO
28 of 39Updated 08/10/2018
Source: Fiscal year 2017 audited financial statements or most recent year available for biennial filers

Health Care Summary
County Prosperity Region Local Unit Name Local Unit Type
Retirement Health
Care Name (If
Multiple Systems) Assets Liabilities
Unfunded
Actuarial Accrued
Liability Funded Ratio
Annual Required
Contribution (ARC)
Governmental Fund
Revenue ARC/Revenue
Preliminary
Underfunded Status
Alger 01 - Upper Peninsula Prosperity Alliance Alger County County $0 $3,958,469 $3,958,469 0.0% $294,783 $5,819,750 5.1% NO
Alger 01 - Upper Peninsula Prosperity Alliance Alger County Road Commission Road Commission $0 $4,212,810 $4,212,810 0.0% $168,018 $5,596,095 3.0% YES
Allegan 04 - West Michigan Prosperity Alliance Plainwell City $0 $957,424 $957,424 0.0% $122,028 $2,435,433 5.0% NO
Alpena 03 - Northeast Prosperity Region Alpena City $1,168,212 $5,518,555 $4,350,343 21.2% $582,327 $11,655,565 5.0% NO
Alpena 03 - Northeast Prosperity Region Alpena County Road Commission Road Commission $0 $865,216 $865,216 0.0% $132,138 $6,339,188 2.1% YES
Antrim 02 - Northwest Prosperity Region Antrim County County $0 $464,373 $464,373 0.0% $58,838 $16,115,906 0.4% NO
Antrim 02 - Northwest Prosperity Region Antrim County Road Commission Road Commission $0 $1,864,941 $1,864,941 0.0% $102,775 $9,155,597 1.1% YES
Arenac 05 - East Central Michigan Prosperity Region Au Gres City $0 $254,000 $254,000 0.0% $44,194 $720,389 6.1% NO
Baraga 01 - Upper Peninsula Prosperity Alliance Baraga County County $0 $1,123,804 $1,123,804 0.0% $164,325 $4,096,930 4.0% NO
Baraga 01 - Upper Peninsula Prosperity Alliance Baraga County Road Commission Road Commission $0 $891,581 $891,581 0.0% $72,365 $4,185,665 1.7% YES
Baraga 01 - Upper Peninsula Prosperity Alliance
Copper Country Community Mental Health Services
Board Authority $0 $3,881,800 $3,881,800 0.0% $245,300 $15,962,422 1.5% YES
Barry 04 - West Michigan Prosperity Alliance Barry County County $1,321,483 $1,433,971 $112,488 92.2% $52,192 $23,740,604 0.2% NO
Barry 04 - West Michigan Prosperity Alliance Barry County Road Commission Road Commission $0 $960,881 $960,881 0.0% $94,690 $9,671,778 1.0% YES
Barry 04 - West Michigan Prosperity Alliance Hastings City $218,223 $10,019,025 $9,800,802 2.2% $820,520 $5,827,849 14.1% YES
Barry 04 - West Michigan Prosperity Alliance Middleville Village $0 $651,714 $651,714 0.0% $71,875 $1,931,923 3.7% NO
Bay 05 - East Central Michigan Prosperity Region Bay- Arenac Behavioral Health Authority $14,398,127 $8,502,548 -$5,895,579 169.3% $0 $47,353,767 0.0% NO
Bay 05 - East Central Michigan Prosperity Region Bay City City $17,001,598 $132,292,254 $115,290,656 12.9% $7,788,653 $29,824,637 26.1% YES
Bay 05 - East Central Michigan Prosperity Region Bay County Department Of Water & Sewer Authority $4,548,660 $12,870,635 $8,321,975 35.3% $672,541 $16,215,478 4.1% YES
Bay 05 - East Central Michigan Prosperity Region Bay County Road Commission Road Commission $904,055 $30,689,652 $29,785,597 2.9% $2,821,742 $15,286,729 18.5% YES
Bay 05 - East Central Michigan Prosperity Region Bay Metropolitan Transportation Authority Authority $0 $772,229 $772,229 0.0% $84,714 $8,140,484 1.0% YES
Bay 05 - East Central Michigan Prosperity Region Essexville City $0 $3,758,218 $3,758,218 0.0% $548,267 $2,337,041 23.5% YES
Bay 05 - East Central Michigan Prosperity Region Hampton Township Township $77,915 $4,277,193 $4,199,278 1.8% $943,812 $4,200,733 22.5% YES
Benzie 02 - Northwest Prosperity Region Benzie County Road Commission Road Commission $260,665 $259,513 -$1,152 100.4% $32,396 $5,934,879 0.5% NO
Benzie 02 - Northwest Prosperity Region Frankfort City $111,260 $656,935 $545,675 16.9% $42,724 $2,355,358 1.8% NO
Berrien 08 - Southwest Prosperity Region Benton Charter Township Township $1,528,395 $3,081,607 $1,553,212 49.6% $193,018 $8,713,860 2.2% NO
Berrien 08 - Southwest Prosperity Region Berrien County County $35,000,478 $70,407,341 $35,406,863 49.7% $4,250,834 $92,058,324 4.6% NO
Berrien 08 - Southwest Prosperity Region Berrien Mental Health Authority Authority $4,499,690 $3,874,300 -$625,390 116.1% $59,463 $47,018,272 0.1% NO
Berrien 08 - Southwest Prosperity Region Niles City $0 $4,469,619 $4,469,619 0.0% $7,717,038 0.0% NO
Berrien 08 - Southwest Prosperity Region St Joseph City $0 $2,079,964 $2,079,964 0.0% $229,374 $13,288,797 1.7% NO
Branch 08 - Southwest Prosperity Region Branch County County $0 $879,205 $879,205 0.0% $117,039 $19,613,381 0.6% NO
Branch 08 - Southwest Prosperity Region Branch County Road Commission Road Commission $0 $1,085,241 $1,085,241 0.0% $110,153 $8,034,658 1.4% YES
Branch 08 - Southwest Prosperity Region Union City Village $0 $1,657,315 $1,657,315 0.0% $256,687 $735,072 34.9% YES
Calhoun 08 - Southwest Prosperity Region Albion City $45,824 $336,338 $290,514 13.6% $28,622 $6,603,512 0.4% NO
Calhoun 08 - Southwest Prosperity Region Battle Creek City $5,895,335 $76,546,178 $70,650,843 7.7% $3,823,865 $62,276,477 6.1% NO
Calhoun 08 - Southwest Prosperity Region Calhoun County County
Calhoun County
Road Department
Retiree Medical Plan $0 $8,872,512 $8,872,512 0.0% $621,009 $80,444,094 2.6% NO
Calhoun 08 - Southwest Prosperity Region Calhoun County County
Calhoun County
Retiree Medical Plan $0 $10,183,199 $10,183,199 0.0% $1,471,011 $80,444,094 2.6% NO
Calhoun 08 - Southwest Prosperity Region Marshall City $775,338 $25,020,779 $24,245,441 3.1% $1,438,495 $7,465,578 19.3% YES
Calhoun 08 - Southwest Prosperity Region Marshall District Library Library $0 $130,639 $130,639 0.0% $7,344 $1,049,614 0.7% YES
Calhoun 08 - Southwest Prosperity Region Springfield City $390,735 $1,066,690 $675,955 36.6% $77,311 $3,809,173 2.0% NO
Cass 08 - Southwest Prosperity Region Cass County Road Commission Road Commission $0 $3,025,448 $3,025,448 0.0% $167,385 $9,813,815 1.7% YES
Cass 08 - Southwest Prosperity Region Dowagiac City $425,837 $645,739 $219,902 65.9% $43,497 $4,606,684 0.9% NO
Cass 08 - Southwest Prosperity Region Woodlands Behavioral Healthcare Network Authority $775,062 $524,917 -$250,145 147.7% $0 $12,355,870 0.0% NO
Charlevoix 02 - Northwest Prosperity Region Boyne City City $0 $460,827 $460,827 0.0% $40,071 $6,508,633 0.6% NO
Charlevoix 02 - Northwest Prosperity Region Charlevoix County $3,036,916 $10,286,473 $7,249,557 29.5% $440,393 $18,326,889 2.4% NO
Cheboygan 03 - Northeast Prosperity Region Cheboygan City $0 $991,366 $991,366 0.0% $37,814 $3,375,855 1.1% NO
Cheboygan 03 - Northeast Prosperity Region Cheboygan County Road Commission Road Commission $640,135 $12,380,885 $11,740,750 5.2% $829,932 $10,905,721 7.6% YES
Chippewa 01 - Upper Peninsula Prosperity Alliance Chippewa County $5,948,811 $11,838,847 $5,890,036 50.2% $637,847 $25,656,723 2.5% NO
Chippewa 01 - Upper Peninsula Prosperity Alliance Chippewa County Health Department Authority $1,246,487 $6,148,907 $4,902,420 20.3% $461,622 $6,373,665 7.2% YES
Chippewa 01 - Upper Peninsula Prosperity Alliance Chippewa County Road Commission Road Commission $0 $27,396,310 $27,396,310 0.0% $1,542,729 $12,660,984 12.2% YES
Chippewa 01 - Upper Peninsula Prosperity Alliance
Economic Development Corporation Of Chippewa
County Authority $348,507 $444,162 $95,655 78.5% $35,933 $3,794,995 0.9% NO
Chippewa 01 - Upper Peninsula Prosperity Alliance Sault Ste Marie City Housing Commission Authority $0 $56,706 $56,706 0.0% $10,107 $2,107,125 0.5% YES
Clare 05 - East Central Michigan Prosperity Region Clare County $0 $196,654 $196,654 0.0% $13,944 $14,940,262 0.1% NO
Clare 05 - East Central Michigan Prosperity Region Clare County Road Commission Road Commission $0 $1,684,907 $1,684,907 0.0% $239,293 $7,658,894 3.1% YES
Clare 05 - East Central Michigan Prosperity Region Harrison City $0 $0 $0 0.0% $24,600 $2,672,246 0.9% NO
Clare 05 - East Central Michigan Prosperity Region Michigan Works! Region B Consortium Authority $0 $81,652 $81,652 0.0% $83,285 $4,934,408 1.7% YES
Michigan Department of TreasuryRetirement Health Care System Summary
As of August 10, 2018
1Note: 2017 PA 202 defines "underfunded status" to mean the following:
A) For retirement pension systems, the triggers for primary units (cities, villages, counties, and townships) are if the unit is less than 60% funded and has an annual required contribution that is over 10% of governmental fund revenues. The non-primary unit trigger is if the unit is less than 60% funded.
B) For retirement health care systems, the triggers for primary units (cities, villages, counties and townships) are if the unit is less than 40% funded and has an annual required contribution greater than 12% of governmental fund revenues. The non-primary unit trigger is if the unit is less than 40% funded.
29 of 39Updated 08/10/2018
Source: Fiscal year 2017 audited financial statements or most recent year available for biennial filers

Health Care Summary
County Prosperity Region Local Unit Name Local Unit Type
Retirement Health
Care Name (If
Multiple Systems) Assets Liabilities
Unfunded
Actuarial Accrued
Liability Funded Ratio
Annual Required
Contribution (ARC)
Governmental Fund
Revenue ARC/Revenue
Preliminary
Underfunded Status
Michigan Department of TreasuryRetirement Health Care System Summary
As of August 10, 2018
1Note: 2017 PA 202 defines "underfunded status" to mean the following:
A) For retirement pension systems, the triggers for primary units (cities, villages, counties, and townships) are if the unit is less than 60% funded and has an annual required contribution that is over 10% of governmental fund revenues. The non-primary unit trigger is if the unit is less than 60% funded.
B) For retirement health care systems, the triggers for primary units (cities, villages, counties and townships) are if the unit is less than 40% funded and has an annual required contribution greater than 12% of governmental fund revenues. The non-primary unit trigger is if the unit is less than 40% funded.
Clinton 07 - South Central Prosperity Region Clinton County $10,795,446 $9,519,525 -$1,275,921 113.4% $151,927 $28,067,353 0.5% NO
Clinton 07 - South Central Prosperity Region Clinton County Road Commission Road Commission $4,591,399 $5,756,787 $1,165,388 79.8% $344,220 $15,599,555 2.2% NO
Clinton 07 - South Central Prosperity Region Dewitt City $337,136 $311,223 -$25,913 108.3% $10,286 $3,426,919 0.3% NO
Crawford 03 - Northeast Prosperity Region Crawford County $0 $3,345,130 $3,345,130 0.0% $300,865 $10,318,947 2.9% NO
Delta 01 - Upper Peninsula Prosperity Alliance Gladstone City $0 $2,489,098 $2,489,098 0.0% $190,860 $4,193,365 4.6% NO
Dickinson 01 - Upper Peninsula Prosperity Alliance Dickinson County $3,169,882 $23,931,214 $20,761,332 13.2% $1,244,418 $15,498,279 8.0% NO
Dickinson 01 - Upper Peninsula Prosperity Alliance Dickinson County Road Commission Road Commission $0 $3,262,333 $3,262,333 0.0% $415,857 $6,515,924 6.4% YES
Dickinson 01 - Upper Peninsula Prosperity Alliance Iron Mountain City $0 $34,106,325 $34,106,325 0.0% $1,591,318 $7,672,814 20.7% YES
Dickinson 01 - Upper Peninsula Prosperity Alliance Kingsford City $105,176 $1,186,216 $1,081,040 8.9% $82,992 $4,654,082 1.8% NO
Dickinson 01 - Upper Peninsula Prosperity Alliance Norway City $180,788 $1,266,922 $1,086,134 14.3% $89,149 $3,752,293 2.4% NO
Eaton 07 - South Central Prosperity Region Bellevue Village $0 $1,650,278 $1,650,278 0.0% $50,000 $615,848 8.1% NO
Eaton 07 - South Central Prosperity Region Charlotte City $0 $3,718,314 $3,718,314 0.0% $188,698 $6,308,536 3.0% NO
Eaton 07 - South Central Prosperity Region Charlotte Community Library Library $0 $9,282 $9,282 0.0% $1,320 $526,015 0.3% YES
Eaton 07 - South Central Prosperity Region Delta Charter Township Township $14,149,177 $18,130,669 $3,981,492 78.0% $590,971 $18,489,601 3.2% NO
Eaton 07 - South Central Prosperity Region Delta Township District Library Library $401,331 $361,904 -$39,427 110.9% $5,831 $1,674,140 0.3% NO
Eaton 07 - South Central Prosperity Region Eaton County
Eaton County
Medical Care Facility $0 $1,442,278 $1,442,278 0.0% $134,667 $43,603,891 11.6% NO
Eaton 07 - South Central Prosperity Region Eaton County
Eaton County
Retiree Health Care
Trust $12,071,303 $54,833,411 $42,762,108 22.0% $5,041,943 $43,603,891 11.6% NO
Eaton 07 - South Central Prosperity Region Eaton County Road Commission Road Commission $4,334,285 $4,782,631 $448,346 90.6% $121,673 $17,983,884 0.7% NO
Eaton 07 - South Central Prosperity Region Eaton Rapids City $0 $10,396,289 $10,396,289 0.0% $786,168 $3,585,598 21.9% YES
Eaton 07 - South Central Prosperity Region Grand Ledge City $165,798 $937,523 $771,725 17.7% $109,451 $4,818,251 2.3% NO
Eaton 07 - South Central Prosperity Region Grand Ledge Area Emergency Services Authority Authority $0 $999,591 $999,591 0.0% $150,223 $1,802,127 8.3% YES
Genesee 06 - East Michigan Prosperity Region Beecher Metropolitan District Authority $0 $3,465,625 $3,465,625 0.0% $158,005 $3,852,677 4.1% YES
Genesee 06 - East Michigan Prosperity Region Burton City $2,239,169 $12,600,103 $10,360,934 17.8% $847,619 $17,100,112 5.0% NO
Genesee 06 - East Michigan Prosperity Region Clio City $68,333 $399,628 $331,295 17.1% $50,871 $1,643,329 3.1% NO
Genesee 06 - East Michigan Prosperity Region Davison City $425,475 $19,654,305 $19,228,830 2.2% $1,452,012 $3,334,509 43.5% YES
Genesee 06 - East Michigan Prosperity Region Davison Township Township $1,742,317 $6,852,955 $5,110,638 25.4% $554,352 $6,710,178 8.3% NO
Genesee 06 - East Michigan Prosperity Region Fenton City $0 $9,106,113 $9,106,113 0.0% $713,721 $8,706,842 8.2% NO
Genesee 06 - East Michigan Prosperity Region Fenton Charter Township Township $351,992 $721,770 $369,778 48.8% $103,724 $4,896,214 2.1% NO
Genesee 06 - East Michigan Prosperity Region Flint City $0 $293,607,373 $293,607,373 0.0% $20,617,796 $86,855,728 23.7% YES
Genesee 06 - East Michigan Prosperity Region Flint Charter Township Township $208,110 $24,203,667 $23,995,557 0.9% $3,070,622 $14,775,826 20.8% YES
Genesee 06 - East Michigan Prosperity Region Flushing City $569,171 $11,654,669 $11,085,498 4.9% $1,693,998 $5,206,461 32.5% YES
Genesee 06 - East Michigan Prosperity Region Flushing Charter Township Township $0 $661,972 $661,972 0.0% $62,735 $2,414,777 2.6% NO
Genesee 06 - East Michigan Prosperity Region Genesee County $32,821,620 $341,629,201 $308,807,581 9.6% $18,883,352 $193,287,745 9.9% NO
Genesee 06 - East Michigan Prosperity Region Genesee Charter Township Township $1,346 $6,259,326 $6,257,980 0.0% $499,542 $6,101,265 8.2% NO
Genesee 06 - East Michigan Prosperity Region Genesee County Road Commission Road Commission $30,753,116 $47,421,605 $16,668,489 64.9% $2,033,459 $50,268,119 4.0% NO
Genesee 06 - East Michigan Prosperity Region Genesee County Water & Waste Services Authority $14,759,698 $45,608,638 $30,848,940 32.4% $3,033,990 $82,505,937 3.7% YES
Genesee 06 - East Michigan Prosperity Region Genesee District Library Library $0 $8,109,785 $8,109,785 0.0% $1,102,911 $9,782,104 11.3% YES
Genesee 06 - East Michigan Prosperity Region Genesee Health System Authority
Retiree Healthcare
Plan $46,884,584 $55,899,583 $9,014,999 83.9% $3,221,643 $128,845,780 2.5% NO
Genesee 06 - East Michigan Prosperity Region Genesee Health System Authority
Genesee Health
System Retiree
Healthcare Plan $46,884,584 $55,899,583 $9,014,999 83.9% $7,885,191 $131,314,578 6.0% NO
Genesee 06 - East Michigan Prosperity Region Grand Blanc City $512,738 $3,652,291 $3,139,553 14.0% $307,317 $5,143,447 6.0% NO
Genesee 06 - East Michigan Prosperity Region Grand Blanc Charter Township Township $4,601,228 $34,779,739 $30,178,511 13.2% $3,138,563 $16,726,655 18.8% YES
Genesee 06 - East Michigan Prosperity Region Linden City $368,013 $1,426,313 $1,058,300 25.8% $117,989 $2,593,462 4.5% NO
Genesee 06 - East Michigan Prosperity Region Mass Transportation Authority Authority $344,381 $1,619,080 $1,274,699 21.3% $139,619 $48,964,718 0.3% YES
Genesee 06 - East Michigan Prosperity Region Metro Police Authority Of Genesee County Authority $0 $385,858 $385,858 0.0% $158,677 $3,186,058 5.0% YES
Genesee 06 - East Michigan Prosperity Region Montrose City Union $0 $928,966 $928,966 0.0% $103,891 $1,017,458 14.4% YES
Genesee 06 - East Michigan Prosperity Region Montrose City Non-Union $0 $604,922 $604,922 0.0% $42,454 $1,017,458 14.4% YES
Genesee 06 - East Michigan Prosperity Region Mount Morris Charter Township Township $0 $14,538,229 $14,538,229 0.0% $1,880,853 $7,795,032 24.1% YES
Genesee 06 - East Michigan Prosperity Region Mundy Charter Township Township $1,396,257 $3,460,056 $2,063,799 40.4% $208,522 $5,227,244 4.0% NO
Genesee 06 - East Michigan Prosperity Region Richfield Township Township $1,210,286 $4,715,450 $3,505,164 25.7% $385,217 $2,485,829 15.5% YES
Genesee 06 - East Michigan Prosperity Region Thetford Township Township $0 $1,136,825 $1,136,825 0.0% $91,202 $1,555,600 5.9% NO
Genesee 06 - East Michigan Prosperity Region Vienna Charter Township Township $214,397 $2,081,277 $1,866,880 10.3% $163,828 $3,928,815 4.2% NO
Gladwin 05 - East Central Michigan Prosperity Region Gladwin County $0 $7,312,111 $7,312,111 0.0% $174,298 $10,615,843 1.6% NO
Gladwin 05 - East Central Michigan Prosperity Region Gladwin County Road Commission Road Commission $84,369 $6,758,168 $6,673,799 1.2% $435,952 $9,179,023 4.7% YES
Gogebic 01 - Upper Peninsula Prosperity Alliance Gogebic County County $1,019,950 $2,993,575 $1,973,625 34.1% $54,857 $7,721,187 0.7% NO
30 of 39Updated 08/10/2018
Source: Fiscal year 2017 audited financial statements or most recent year available for biennial filers

Health Care Summary
County Prosperity Region Local Unit Name Local Unit Type
Retirement Health
Care Name (If
Multiple Systems) Assets Liabilities
Unfunded
Actuarial Accrued
Liability Funded Ratio
Annual Required
Contribution (ARC)
Governmental Fund
Revenue ARC/Revenue
Preliminary
Underfunded Status
Michigan Department of TreasuryRetirement Health Care System Summary
As of August 10, 2018
1Note: 2017 PA 202 defines "underfunded status" to mean the following:
A) For retirement pension systems, the triggers for primary units (cities, villages, counties, and townships) are if the unit is less than 60% funded and has an annual required contribution that is over 10% of governmental fund revenues. The non-primary unit trigger is if the unit is less than 60% funded.
B) For retirement health care systems, the triggers for primary units (cities, villages, counties and townships) are if the unit is less than 40% funded and has an annual required contribution greater than 12% of governmental fund revenues. The non-primary unit trigger is if the unit is less than 40% funded.
Gogebic 01 - Upper Peninsula Prosperity Alliance Gogebic County Road Commission Road Commission $0 $1,620,427 $1,620,427 0.0% $189,375 $7,002,911 2.7% YES
Gogebic 01 - Upper Peninsula Prosperity Alliance Ironwood City $1,603,344 $1,630,887 $27,543 98.3% $68,898 $4,642,053 1.5% NO
Gogebic 01 - Upper Peninsula Prosperity Alliance Wakefield City $0 $892,906 $892,906 0.0% $95,543 $1,775,990 5.4% NO
Grand Traverse 02 - Northwest Prosperity Region Grand Traverse County County
Grand Traverse
County - Pavilions $0 $5,631,381 $5,631,381 0.0% $518,025 $54,333,084 2.2% NO
Grand Traverse 02 - Northwest Prosperity Region Grand Traverse County County
Grand Traverse
County - County $256,131 $2,771,988 $2,515,857 9.2% $665,740 $54,333,084 2.2% NO
Grand Traverse 02 - Northwest Prosperity Region Grand Traverse County Road Commission Road Commission $155,960 $1,224,136 $1,068,176 12.7% $90,845 $18,667,922 0.5% YES
Grand Traverse 02 - Northwest Prosperity Region Grand Traverse Metro Emergency Services Authority Authority $0 $726,596 $726,596 0.0% $26,202 $4,013,459 0.7% YES
Grand Traverse 02 - Northwest Prosperity Region Long Lake Township Township $76,648 $178,508 $101,860 42.9% $14,265 $1,937,402 0.7% NO
Grand Traverse 02 - Northwest Prosperity Region Traverse City City
Act 345 Police and
Fire Health Care
Trust $3,761,310 $8,094,695 $4,333,385 46.5% $385,866 $22,823,560 2.8% NO
Grand Traverse 02 - Northwest Prosperity Region Traverse City City
Retiree Health
Insurance Trust $4,205,338 $6,669,514 $2,464,176 63.1% $258,717 $22,823,560 2.8% NO
Gratiot 05 - East Central Michigan Prosperity Region Gratiot County $0 $4,365,282 $4,365,282 0.0% $17,334,643 3.8% NO
Gratiot 05 - East Central Michigan Prosperity Region Gratiot County Road Commission Road Commission $0 $1,548,753 $1,548,753 0.0% $51,625 $8,586,881 0.6% YES
Hillsdale 09 - Southeast Michigan Prosperity Region Hillsdale County $0 $1,581,723 $1,581,723 0.0% $154,640 $16,448,288 0.9% NO
Houghton 01 - Upper Peninsula Prosperity Alliance Houghton City $0 $1,039,987 $1,039,987 0.0% $70,003 $5,083,202 1.4% NO
Houghton 01 - Upper Peninsula Prosperity Alliance Houghton County Road Commission Road Commission $0 $300,533 $300,533 0.0% $29,072 $8,438,125 0.3% YES
Huron 06 - East Michigan Prosperity Region Harbor Beach City $0 $818,945 $818,945 0.0% $47,538 $2,713,819 1.8% NO
Huron 06 - East Michigan Prosperity Region Huron County $4,219,613 $21,619,649 $17,400,036 19.5% $2,756,111 $23,974,019 11.5% NO
Huron 06 - East Michigan Prosperity Region Huron Behavioral Health Authority $4,711,673 $3,811,969 -$899,704 123.6% $0 $10,494,826 0.0% NO
Ingham 07 - South Central Prosperity Region Capital Area Transportation Authority- Cata Authority $4,224,146 $23,668,973 $19,444,827 17.8% $2,732,609 $53,631,807 5.1% YES
Ingham 07 - South Central Prosperity Region Capital Region Airport Authority Authority $0 $15,114,881 $15,114,881 0.0% $1,214,279 $19,029,621 6.4% YES
Ingham 07 - South Central Prosperity Region Delhi Charter Township Township $4,035,124 $7,393,077 $3,357,953 54.6% $476,141 $12,023,214 4.0% NO
Ingham 07 - South Central Prosperity Region East Lansing City $12,608,070 $52,996,758 $40,388,688 23.8% $4,205,636 $46,629,753 9.0% NO
Ingham 07 - South Central Prosperity Region East Lansing- Meridian Water & Sewer Authority Authority $465,182 $1,047,284 $582,102 44.4% $75,430 $4,281,821 1.8% NO
Ingham 07 - South Central Prosperity Region Ingham County
Retiree Health Care
Plan - Road
Department $378,941 $12,068,044 $11,689,103 3.1% $824,804 $166,576,103 4.7% NO
Ingham 07 - South Central Prosperity Region Ingham County
Retiree Health Care
Plan - Medical Care
Facility $5,017,993 $5,429,101 $411,108 92.4% $145,672 $166,576,103 4.7% NO
Ingham 07 - South Central Prosperity Region Ingham County
Retiree Health Care
Plan - County $13,659,381 $91,294,403 $77,635,022 15.0% $6,819,230 $166,576,103 4.7% NO
Ingham 07 - South Central Prosperity Region Lansing City General Employees $54,680,726 $231,583,031 $176,902,305 23.6% $10,582,235 $153,167,115 19.8% YES
Ingham 07 - South Central Prosperity Region Lansing City Police and Fire $34,133,238 $294,892,197 $260,758,959 11.6% $19,759,521 $153,167,115 19.8% YES
Ingham 07 - South Central Prosperity Region Lansing Charter Township Township $84,518 $5,876,185 $5,791,667 1.4% $759,082 $8,054,559 9.4% NO
Ingham 07 - South Central Prosperity Region Lansing City Board Of Water & Light Authority $145,274,000 $205,215,000 $59,941,000 70.8% $372,823,261 0.0% NO
Ingham 07 - South Central Prosperity Region Lansing Housing Commission Authority $0 $2,850,309 $2,850,309 0.0% $616,028 $18,837,632 3.3% YES
Ingham 07 - South Central Prosperity Region Mason City $441,323 $1,749,786 $1,308,463 25.2% $115,800 $6,839,837 1.7% NO
Ingham 07 - South Central Prosperity Region Meridian Charter Township Township $4,310,358 $8,778,804 $4,468,446 49.1% $453,565 $24,165,266 1.9% NO
Ingham 07 - South Central Prosperity Region
Tri- County Aging Consortium
(ingham/clinton/eaton) Authority $0 $32,284 $32,284 0.0% $9,804 $25,751,367 0.0% YES
Ingham 07 - South Central Prosperity Region Williamston City $0 $1,852,608 $1,852,608 0.0% $48,922 $2,504,272 2.0% NO
Ionia 04 - West Michigan Prosperity Alliance Belding City $0 $475,194 $475,194 0.0% $33,118 $4,141,353 0.8% NO
Ionia 04 - West Michigan Prosperity Alliance Ionia County $0 $1,338,892 $1,338,892 0.0% $192,527 $19,730,887 1.0% NO
Ionia 04 - West Michigan Prosperity Alliance Ionia County Road Commission Road Commission $174,331 $7,862,064 $7,687,733 2.2% $562,056 $12,825,407 4.4% YES
Ionia 04 - West Michigan Prosperity Alliance Portland City $0 $1,245,219 $1,245,219 0.0% $116,705 $4,808,706 2.4% NO
Iosco 03 - Northeast Prosperity Region Iosco County Road Commission Road Commission $0 $295,429 $295,429 0.0% $24,031 $7,993,823 0.3% YES
Iron 01 - Upper Peninsula Prosperity Alliance Crystal Falls City $90,534 $3,182,654 $3,092,120 2.8% $198,410 $1,438,452 13.8% YES
Iron 01 - Upper Peninsula Prosperity Alliance Iron County Medical Care Facility Authority $0 $2,224,560 $2,224,560 0.0% $197,725 $22,659,110 0.9% YES
Iron 01 - Upper Peninsula Prosperity Alliance Iron County Road Commission Road Commission $0 $4,011,437 $4,011,437 0.0% $732,320 $6,490,702 11.3% YES
Isabella 05 - East Central Michigan Prosperity Region Community Mental Health For Central Michigan Authority $859,258 $426,742 -$432,516 201.4% $0 $92,716,981 0.0% NO
Isabella 05 - East Central Michigan Prosperity Region Isabella County Road Commission Road Commission $132,613 $283,820 $151,207 46.7% $23,353 $15,732,771 0.1% NO
31 of 39Updated 08/10/2018
Source: Fiscal year 2017 audited financial statements or most recent year available for biennial filers

Health Care Summary
County Prosperity Region Local Unit Name Local Unit Type
Retirement Health
Care Name (If
Multiple Systems) Assets Liabilities
Unfunded
Actuarial Accrued
Liability Funded Ratio
Annual Required
Contribution (ARC)
Governmental Fund
Revenue ARC/Revenue
Preliminary
Underfunded Status
Michigan Department of TreasuryRetirement Health Care System Summary
As of August 10, 2018
1Note: 2017 PA 202 defines "underfunded status" to mean the following:
A) For retirement pension systems, the triggers for primary units (cities, villages, counties, and townships) are if the unit is less than 60% funded and has an annual required contribution that is over 10% of governmental fund revenues. The non-primary unit trigger is if the unit is less than 60% funded.
B) For retirement health care systems, the triggers for primary units (cities, villages, counties and townships) are if the unit is less than 40% funded and has an annual required contribution greater than 12% of governmental fund revenues. The non-primary unit trigger is if the unit is less than 40% funded.
Isabella 05 - East Central Michigan Prosperity Region Mt Pleasant City
Police Officers Post-
Retirement Health
Care Plan $1,501,552 $2,116,834 $615,282 70.9% $79,526 $17,735,459 0.4% NO
Isabella 05 - East Central Michigan Prosperity Region Mt Pleasant City
Post-Retirement
Health Care $0 $4,037,457 $4,037,457 0.0% $17,735,459 0.4% NO
Isabella 05 - East Central Michigan Prosperity Region Mt Pleasant City Police Retiree Health $1,501,552 $2,116,834 $615,282 70.9% $79,526 $17,735,459 0.4% NO
Isabella 05 - East Central Michigan Prosperity Region Mt Pleasant City
Post-Retirement
Health Care Plan $0 $4,037,457 $4,037,457 0.0% $17,735,459 0.4% NO
Jackson 09 - Southeast Michigan Prosperity Region Blackman Charter Township Township $0 $14,711,775 $14,711,775 0.0% $861,285 $5,795,256 14.9% YES
Jackson 09 - Southeast Michigan Prosperity Region Brooklyn Village $0 $57,221 $57,221 0.0% $5,763 $982,128 0.6% NO
Jackson 09 - Southeast Michigan Prosperity Region Jackson City $784,843 $55,689,665 $54,904,822 1.4% $3,972,858 $44,412,412 8.9% NO
Jackson 09 - Southeast Michigan Prosperity Region Jackson County County $0 $117,277,316 $117,277,316 0.0% $8,792,893 $92,190,349 9.5% NO
Jackson 09 - Southeast Michigan Prosperity Region Jackson District Library Library $504,609 $1,440,219 $935,610 35.0% $76,725 $6,995,839 1.1% YES
Jackson 09 - Southeast Michigan Prosperity Region Leoni Township Township $0 $422,203 $422,203 0.0% $37,429 $2,621,010 1.4% NO
Jackson 09 - Southeast Michigan Prosperity Region Region 2 Planning Commission Authority $0 $53,183 $53,183 0.0% $4,585 $843,304 0.5% YES
Kalamazoo 08 - Southwest Prosperity Region Central County Transportation Authority Authority $6,933,725 $12,081,084 $5,147,359 57.4% $615,667 $19,003,743 3.2% NO
Kalamazoo 08 - Southwest Prosperity Region Cooper Charter Township Township $233,174 $387,660 $154,486 60.1% $29,894 $1,761,911 1.7% NO
Kalamazoo 08 - Southwest Prosperity Region Kalamazoo City $95,305,474 $166,056,971 $70,751,497 57.4% $7,000,597 $85,695,998 8.2% NO
Kalamazoo 08 - Southwest Prosperity Region Kalamazoo Charter Township Township $0 $4,612,975 $4,612,975 0.0% $454,609 $10,198,639 4.5% NO
Kalamazoo 08 - Southwest Prosperity Region
Kalamazoo Community Mental Health & Substance
Abuse Services Authority $3,083,914 $4,800,580 $1,716,666 64.2% $231,786 $80,092,185 0.3% NO
Kalamazoo 08 - Southwest Prosperity Region Kalamazoo County County $12,374,383 $55,006,432 $42,632,049 22.5% $4,722,640 $105,253,988 4.5% NO
Kalamazoo 08 - Southwest Prosperity Region Kalamazoo County Road Commission Road Commission $1,997,442 $3,404,148 $1,406,706 58.7% $179,423 $26,781,166 0.7% NO
Kalamazoo 08 - Southwest Prosperity Region Oshtemo Charter Township Township $205,960 $205,960 $0 100.0% $0 $8,382,113 0.0% NO
Kalamazoo 08 - Southwest Prosperity Region Parchment City $0 $531,714 $531,714 0.0% $70,783 $1,579,062 4.5% NO
Kalamazoo 08 - Southwest Prosperity Region Portage City $7,773,952 $6,006,301 -$1,767,651 129.4% $0 $39,140,599 0.0% NO
Kalkaska 02 - Northwest Prosperity Region Kalkaska Village $0 $2,044,340 $2,044,340 0.0% $136,636 $1,866,681 7.3% NO
Kalkaska 02 - Northwest Prosperity Region Kalkaska County County $254,816 $1,234,506 $979,690 20.6% $38,601 $10,519,594 0.4% NO
Kalkaska 02 - Northwest Prosperity Region Kalkaska County Road Commission Road Commission $0 $1,523,873 $1,523,873 0.0% $81,538 $7,819,098 1.0% YES
Kent 04 - West Michigan Prosperity Alliance Byron Township Township $0 $470,350 $470,350 0.0% $56,000 $5,154,461 1.1% NO
Kent 04 - West Michigan Prosperity Alliance East Grand Rapids City $1,295,568 $3,264,267 $1,968,699 39.7% $0 $13,998,473 0.0% NO
Kent 04 - West Michigan Prosperity Alliance Grand Rapids City
Library Retiree
Health Care $0 $218,870 $218,870 0.0% $72,957 $218,902,989 5.7% NO
Kent 04 - West Michigan Prosperity Alliance Grand Rapids City
General Retiree
Health Care $9,411,146 $58,696,918 $49,285,772 16.0% $5,071,594 $218,902,989 5.7% NO
Kent 04 - West Michigan Prosperity Alliance Grand Rapids City
Fire Retiree Health
Care $14,421,497 $38,620,175 $24,198,678 37.3% $3,036,781 $218,902,989 5.7% NO
Kent 04 - West Michigan Prosperity Alliance Grand Rapids City
Police Retiree Health
Care $24,090,346 $61,553,466 $37,463,120 39.1% $4,192,648 $218,902,989 5.7% NO
Kent 04 - West Michigan Prosperity Alliance Grand Rapids City Housing Commission Authority $0 $529,030 $529,030 0.0% $22,065 $29,601,694 0.1% YES
Kent 04 - West Michigan Prosperity Alliance Grandville City $1,191,747 $4,021,713 $2,829,966 29.6% $401,525 $11,756,144 3.4% NO
Kent 04 - West Michigan Prosperity Alliance Kent County County $25,315,572 $58,712,816 $33,397,244 43.1% $3,394,981 $282,563,171 1.2% NO
Kent 04 - West Michigan Prosperity Alliance Kent County Community Mental Health Authority Authority $949,596 $1,069,354 $119,758 88.8% $52,663 $151,794,519 0.0% NO
Kent 04 - West Michigan Prosperity Alliance Kent County Road Commission Road Commission $2,617,113 $4,132,474 $1,515,361 63.3% $241,894 $62,012,637 0.4% NO
Kent 04 - West Michigan Prosperity Alliance Kentwood City $1,981,106 $1,121,607 -$859,499 176.6% $0 $35,434,090 0.0% NO
Kent 04 - West Michigan Prosperity Alliance Lowell City $0 $467,011 $467,011 0.0% $56,588 $3,192,363 1.8% NO
Kent 04 - West Michigan Prosperity Alliance Plainfield Charter Township Township $0 $1,667,638 $1,667,638 0.0% $148,445 $9,648,034 1.5% YES
Kent 04 - West Michigan Prosperity Alliance Sparta Village $0 $253,375 $253,375 0.0% $21,000 $2,549,400 0.8% NO
Kent 04 - West Michigan Prosperity Alliance Walker City $1,121,106 $7,410,666 $6,289,560 15.1% $814,831 $22,066,406 3.7% NO
Kent 04 - West Michigan Prosperity Alliance Wyoming City $36,651,197 $99,743,580 $63,092,383 36.7% $10,225,610 $46,618,811 21.9% YES
Keweenaw 01 - Upper Peninsula Prosperity Alliance Keweenaw County Road Commission Road Commission $0 $478,464 $478,464 0.0% $100,058 $3,371,998 3.0% YES
Lake 04 - West Michigan Prosperity Alliance Lake County County $0 $5,662,729 $5,662,729 0.0% $668,992 $14,459,044 4.6% NO
Lake 04 - West Michigan Prosperity Alliance Lake County Road Commission Road Commission $104,305 $1,791,285 $1,686,980 5.8% $183,240 $6,697,458 2.7% YES
Lapeer 06 - East Michigan Prosperity Region Almont Village $0 $1,459,747 $1,459,747 0.0% $173,413 $2,283,669 7.6% NO
Lapeer 06 - East Michigan Prosperity Region Imlay City City $331,100 $482,026 $150,926 68.7% $14,964 $3,522,291 0.4% NO
Lapeer 06 - East Michigan Prosperity Region Lapeer City $1,373,085 $26,052,375 $24,679,290 5.3% $2,295,306 $14,117,899 16.3% YES
Lapeer 06 - East Michigan Prosperity Region Lapeer County Road Commission Road Commission $968,156 $18,615,261 $17,647,105 5.2% $1,730,409 $16,564,816 10.4% YES
Lapeer 06 - East Michigan Prosperity Region Metamora Township Township $424,883 $583,591 $158,708 72.8% $46,794 $1,357,868 3.4% NO
Lenawee 09 - Southeast Michigan Prosperity Region Lenawee County County $0 $929,263 $929,263 0.0% $61,612 $41,095,466 0.1% NO
Lenawee 09 - Southeast Michigan Prosperity Region Lenawee County Medical Care Facility Authority $0 $929,263 $929,263 0.0% $61,612 $13,524,834 0.5% YES
32 of 39Updated 08/10/2018
Source: Fiscal year 2017 audited financial statements or most recent year available for biennial filers
Health Care Summary
County Prosperity Region Local Unit Name Local Unit Type
Retirement Health
Care Name (If
Multiple Systems) Assets Liabilities
Unfunded
Actuarial Accrued
Liability Funded Ratio
Annual Required
Contribution (ARC)
Governmental Fund
Revenue ARC/Revenue
Preliminary
Underfunded Status
Michigan Department of TreasuryRetirement Health Care System Summary
As of August 10, 2018
1Note: 2017 PA 202 defines "underfunded status" to mean the following:
A) For retirement pension systems, the triggers for primary units (cities, villages, counties, and townships) are if the unit is less than 60% funded and has an annual required contribution that is over 10% of governmental fund revenues. The non-primary unit trigger is if the unit is less than 60% funded.
B) For retirement health care systems, the triggers for primary units (cities, villages, counties and townships) are if the unit is less than 40% funded and has an annual required contribution greater than 12% of governmental fund revenues. The non-primary unit trigger is if the unit is less than 40% funded.
Lenawee 09 - Southeast Michigan Prosperity Region Lenawee County Road Commission Road Commission $14,369,806 $13,393,022 -$976,784 107.3% $21,517 $21,207,953 0.1% NO
Lenawee 09 - Southeast Michigan Prosperity Region Tecumseh City $1,276,738 $1,455,367 $178,629 87.7% $21,875 $7,428,974 0.3% NO
Livingston 09 - Southeast Michigan Prosperity Region Brighton City $1,311,527 $13,505,203 $12,193,676 9.7% $951,817 $9,137,468 10.4% NO
Livingston 09 - Southeast Michigan Prosperity Region Brighton Area Fire Authority Authority $382,701 $351,344 -$31,357 108.9% $36,705 $4,026,643 0.9% NO
Livingston 09 - Southeast Michigan Prosperity Region
Community Mental Health Services Of Livingston
County Authority $1,584,667 $1,959,284 $374,617 80.9% $185,347 $31,968,328 0.6% NO
Livingston 09 - Southeast Michigan Prosperity Region Green Oak Township Township $162,486 $1,442,787 $1,280,301 11.3% $97,159 $9,741,377 1.0% NO
Livingston 09 - Southeast Michigan Prosperity Region Howell City $0 $9,571,436 $9,571,436 0.0% $653,691 $8,328,618 7.8% NO
Livingston 09 - Southeast Michigan Prosperity Region Howell Area Fire Authority Authority $187,061 $618,283 $431,222 30.3% $65,318 $2,557,779 2.6% YES
Livingston 09 - Southeast Michigan Prosperity Region Huron- Clinton Metropolitan Authority Authority $25,072,686 $36,819,142 $11,746,456 68.1% $1,415,660 $51,459,905 2.8% NO
Livingston 09 - Southeast Michigan Prosperity Region Livingston County Road Commission Road Commission $0 $5,357,622 $5,357,622 0.0% $253,315 $28,118,066 0.9% YES
Livingston 09 - Southeast Michigan Prosperity Region Pinckney Village $95,497 $168,045 $72,548 56.8% $14,977 $1,723,856 0.9% NO
Luce 01 - Upper Peninsula Prosperity Alliance Luce County Road Commission Road Commission $0 $3,132,987 $3,132,987 0.0% $247,755 $3,483,769 7.1% YES
Mackinac 01 - Upper Peninsula Prosperity Alliance Mackinac County $540,587 $2,280,897 $1,740,310 23.7% $204,970 $9,148,897 2.2% NO
Mackinac 01 - Upper Peninsula Prosperity Alliance Mackinac County Road Commission Road Commission $0 $1,630,239 $1,630,239 0.0% $283,379 $5,318,905 5.3% YES
Mackinac 01 - Upper Peninsula Prosperity Alliance St Ignace City $0 $860,764 $860,764 0.0% $50,274 $3,425,995 1.5% NO
Macomb 10 - Detroit Metro Prosperity Region Bruce Township Township $0 $4,714,632 $4,714,632 0.0% $647,259 $4,073,793 15.9% YES
Macomb 10 - Detroit Metro Prosperity Region Center Line City $3,330,297 $23,270,422 $19,940,125 14.3% $1,758,188 $10,069,798 17.5% YES
Macomb 10 - Detroit Metro Prosperity Region Chesterfield Charter Township Township $14,678,963 $24,377,074 $9,698,111 60.2% $1,251,756 $21,595,835 5.8% NO
Macomb 10 - Detroit Metro Prosperity Region Clinton Charter Township Township $39,209,334 $102,350,462 $63,141,128 38.3% $4,264,099 $57,250,431 7.4% NO
Macomb 10 - Detroit Metro Prosperity Region Eastpointe City $7,361,111 $35,865,768 $28,504,657 20.5% $2,634,835 $29,178,945 9.0% NO
Macomb 10 - Detroit Metro Prosperity Region Fraser City $0 $39,098,867 $39,098,867 0.0% $3,592,003 $18,162,760 19.8% YES
Macomb 10 - Detroit Metro Prosperity Region Harrison Charter Township Township General Employees $2,133,639 $16,561,796 $14,428,157 12.9% $1,343,074 $12,054,541 21.2% YES
Macomb 10 - Detroit Metro Prosperity Region Harrison Charter Township Township Fire Employees $2,035,851 $15,802,745 $13,766,894 12.9% $1,218,272 $12,054,541 21.2% YES
Macomb 10 - Detroit Metro Prosperity Region Macomb County County
MC Retiree Health
Care Trust Fund $255,490,138 $550,168,310 $294,678,172 46.4% $36,488,654 $373,249,067 10.8% NO
Macomb 10 - Detroit Metro Prosperity Region Macomb County County
MC Roads Retiree
Health Care Plan $44,338,622 $73,051,905 $28,713,283 60.7% $4,006,707 $373,249,067 10.8% NO
Macomb 10 - Detroit Metro Prosperity Region Macomb Township Township $23,320,740 $20,496,848 -$2,823,892 113.8% $779,267 $25,602,463 3.0% NO
Macomb 10 - Detroit Metro Prosperity Region Mount Clemens City $0 $52,986,424 $52,986,424 0.0% $3,155,767 $12,274,364 25.7% YES
Macomb 10 - Detroit Metro Prosperity Region New Baltimore City $2,863,861 $13,691,560 $10,827,699 20.9% $1,071,082 $8,462,542 12.7% YES
Macomb 10 - Detroit Metro Prosperity Region Romeo Village $0 $7,184,188 $7,184,188 0.0% $655,105 $3,910,373 16.8% YES
Macomb 10 - Detroit Metro Prosperity Region Roseville City $6,864,532 $75,830,417 $68,965,885 9.1% $4,263,419 $41,760,095 10.2% NO
Macomb 10 - Detroit Metro Prosperity Region Shelby Charter Township Township $28,838,457 $79,110,395 $50,271,938 36.5% $4,488,364 $49,085,365 9.1% NO
Macomb 10 - Detroit Metro Prosperity Region Southeast Macomb Sanitary District Authority $838,945 $6,497,398 $5,658,453 12.9% $449,053 $22,857,417 2.0% YES
Macomb 10 - Detroit Metro Prosperity Region St Clair Shores City
City of St. Clair
Shores Police and
Fire Retiree Health
Care Plan $12,494,721 $103,374,469 $90,879,748 12.1% $5,901,168 $51,603,156 20.2% YES
Macomb 10 - Detroit Metro Prosperity Region St Clair Shores City
City of St. Clair
Shores General
Retiree Health Care
Plan $6,287,279 $61,886,932 $55,599,653 10.2% $4,509,377 $51,603,156 20.2% YES
Macomb 10 - Detroit Metro Prosperity Region
State Of Michigan 41b District - Clinton Charter
Township & Mt Clemens Authority $2,446,651 $8,939,225 $6,492,574 27.4% $467,646 $5,517,588 8.5% YES
Macomb 10 - Detroit Metro Prosperity Region Sterling Heights City $101,249,866 $199,105,195 $97,855,329 50.9% $11,452,950 $116,144,128 9.9% NO
Macomb 10 - Detroit Metro Prosperity Region Utica City $1,143,855 $3,954,026 $2,810,171 28.9% $175,290 $6,205,944 2.8% NO
Macomb 10 - Detroit Metro Prosperity Region Warren City
CITY OF WARREN
POLICE AND FIRE
RETIREMENT HEALTH
BENEFITS PLAN AND
TRUST $22,439,078 $170,182,661 $147,743,583 13.2% $13,621,425 $157,213,369 16.2% YES
Macomb 10 - Detroit Metro Prosperity Region Warren City
CITY OF WARREN,
MICHIGAN CITY
EMPLOYEES'
RETIREMENT
HEALTH, LIFE $32,751,358 $155,719,046 $122,967,688 21.0% $11,800,171 $157,213,369 16.2% YES
Macomb 10 - Detroit Metro Prosperity Region Washington Township Township $427,244 $515,764 $88,520 82.8% $4,680 $10,925,347 0.0% NO
Manistee 02 - Northwest Prosperity Region Manistee City $0 $330,195 $330,195 0.0% $24,394 $8,367,099 0.3% NO
Manistee 02 - Northwest Prosperity Region Manistee County County $0 $2,994,987 $2,994,987 0.0% $200,105 $13,258,189 1.5% YES
Marquette 01 - Upper Peninsula Prosperity Alliance Forsyth Township Township $0 $26,349 $26,349 0.0% $878 $3,489,337 0.0% NO
33 of 39Updated 08/10/2018
Source: Fiscal year 2017 audited financial statements or most recent year available for biennial filers

Health Care Summary
County Prosperity Region Local Unit Name Local Unit Type
Retirement Health
Care Name (If
Multiple Systems) Assets Liabilities
Unfunded
Actuarial Accrued
Liability Funded Ratio
Annual Required
Contribution (ARC)
Governmental Fund
Revenue ARC/Revenue
Preliminary
Underfunded Status
Michigan Department of TreasuryRetirement Health Care System Summary
As of August 10, 2018
1Note: 2017 PA 202 defines "underfunded status" to mean the following:
A) For retirement pension systems, the triggers for primary units (cities, villages, counties, and townships) are if the unit is less than 60% funded and has an annual required contribution that is over 10% of governmental fund revenues. The non-primary unit trigger is if the unit is less than 60% funded.
B) For retirement health care systems, the triggers for primary units (cities, villages, counties and townships) are if the unit is less than 40% funded and has an annual required contribution greater than 12% of governmental fund revenues. The non-primary unit trigger is if the unit is less than 40% funded.
Marquette 01 - Upper Peninsula Prosperity Alliance Marquette City $0 $8,422,352 $8,422,352 0.0% $1,714,491 $32,796,113 5.2% YES
Marquette 01 - Upper Peninsula Prosperity Alliance Marquette City Board Of Light And Power Authority $2,489,643 $21,128,213 $18,638,570 11.8% $1,819,341 $48,675,549 3.7% YES
Marquette 01 - Upper Peninsula Prosperity Alliance Marquette County County $0 $54,792,835 $54,792,835 0.0% $3,142,274 $37,316,614 8.4% NO
Marquette 01 - Upper Peninsula Prosperity Alliance Marquette County Road Commission Road Commission $926,366 $12,990,797 $12,064,431 7.1% $954,506 $16,183,756 5.9% YES
Marquette 01 - Upper Peninsula Prosperity Alliance Negaunee City $0 $9,608,174 $9,608,174 0.0% $591,380 $5,170,263 11.4% NO
Marquette 01 - Upper Peninsula Prosperity Alliance Pathways Authority $1,724,994 $8,120,178 $6,395,184 21.2% $690,102 $35,924,516 1.9% YES
Mason 04 - West Michigan Prosperity Alliance Ludington City
MERS Health Care
Savings Plan $0 $843,173 $843,173 0.0% $76,164 $7,463,771 1.0% NO
Mason 04 - West Michigan Prosperity Alliance Ludington City
City of Ludington
Post Employment
Benefits $0 $843,173 $843,173 0.0% $73,323 $6,912,337 1.1% NO
Mason 04 - West Michigan Prosperity Alliance Mason County County $4,475,277 $4,531,136 $55,859 98.8% $202,133 $16,395,211 1.2% NO
Mecosta 04 - West Michigan Prosperity Alliance Mecosta County Road Commission Road Commission $0 $1,317,223 $1,317,223 0.0% $43,907 $8,862,877 0.5% YES
Mecosta 04 - West Michigan Prosperity Alliance Morton Township Township $0 $264,110 $264,110 0.0% $40,977 $1,739,418 2.4% NO
Midland 05 - East Central Michigan Prosperity Region Midland City $40,317,063 $91,458,225 $51,141,162 44.1% $5,055,234 $64,446,539 7.8% NO
Midland 05 - East Central Michigan Prosperity Region Midland County County $26,520,818 $65,073,684 $38,552,866 40.8% $4,162,709 $53,311,603 7.8% NO
Midland 05 - East Central Michigan Prosperity Region Midland County Road Commission Road Commission $3,198,561 $6,526,340 $3,327,779 49.0% $249,206 $14,835,601 1.7% NO
Missaukee 02 - Northwest Prosperity Region Missaukee County County 0.0% 0.0% NO
Missaukee 02 - Northwest Prosperity Region Missaukee County Road Commission Road Commission $0 $2,360,353 $2,360,353 0.0% $90,053 $6,181,017 1.5% YES
Monroe 09 - Southeast Michigan Prosperity Region Bedford Township Township $0 $924,844 $924,844 0.0% $44,243 $7,008,049 0.6% NO
Monroe 09 - Southeast Michigan Prosperity Region Frenchtown Charter Township Township $6,098,014 $7,471,979 $1,373,965 81.6% $305,464 $10,116,005 3.0% NO
Monroe 09 - Southeast Michigan Prosperity Region Monroe County $50,126,969 $127,617,401 $77,490,432 39.3% $8,693,115 $65,220,644 13.3% YES
Monroe 09 - Southeast Michigan Prosperity Region Monroe City $57,151,937 $67,480,069 $10,328,132 84.7% $3,963,730 $24,133,301 16.4% NO
Monroe 09 - Southeast Michigan Prosperity Region Monroe Community Mental Health Authority Authority $2,120,089 $10,335,973 $8,215,884 20.5% $491,302 $33,147,616 1.5% YES
Monroe 09 - Southeast Michigan Prosperity Region Monroe County Library System Library $4,498,967 $6,155,806 $1,656,839 73.1% $273,424 $7,706,151 3.5% NO
Monroe 09 - Southeast Michigan Prosperity Region Monroe County Road Commission Road Commission $2,999,315 $26,883,901 $23,884,586 11.2% $1,973,766 $28,736,359 6.9% YES
Monroe 09 - Southeast Michigan Prosperity Region Raisinville Township Township $0 $524,896 $524,896 0.0% $43,315 $1,214,446 3.6% NO
Montcalm 04 - West Michigan Prosperity Alliance Greenville City $0 $1,499,683 $1,499,683 0.0% $99,329 $9,478,233 1.0% NO
Montcalm 04 - West Michigan Prosperity Alliance Mid- Michigan District Health Department Authority $0 $175,379 $175,379 0.0% $25,398 $6,149,006 0.4% YES
Montcalm 04 - West Michigan Prosperity Alliance Montcalm County $0 $1,719,774 $1,719,774 0.0% $245,317 $19,310,220 1.3% NO
Montcalm 04 - West Michigan Prosperity Alliance Montcalm County Road Commission Road Commission $372,343 $2,464,134 $2,091,791 15.1% $319,837 $14,059,557 2.3% YES
Montmorency 03 - Northeast Prosperity Region Montmorency County Road Commission Road Commission $36,252 $1,078,268 $1,042,016 3.4% $63,736 $5,584,846 1.1% YES
Montmorency 03 - Northeast Prosperity Region
Montmorency- Oscoda- Alpena Solid Waste
Management Authority Authority $0 $243,880 $243,880 0.0% $40,034 $2,932,929 1.4% YES
Muskegon 04 - West Michigan Prosperity Alliance Egelston Township Township $99,000 $1,248,000 $1,149,000 7.9% $131,586 $2,409,958 5.5% NO
Muskegon 04 - West Michigan Prosperity Alliance Fruitport Charter Township Township $208,000 $1,655,000 $1,447,000 12.6% $261,138 $3,672,443 7.1% NO
Muskegon 04 - West Michigan Prosperity Alliance Laketon Township Township $0 $657,615 $657,615 0.0% $99,937 $1,682,298 5.9% NO
Muskegon 04 - West Michigan Prosperity Alliance Montague City $701,000 $986,000 $285,000 71.1% $61,237 $2,613,186 2.3% NO
Muskegon 04 - West Michigan Prosperity Alliance Muskegon County $48,916,791 $87,667,314 $38,750,523 55.8% $4,951,356 $131,384,403 3.8% NO
Muskegon 04 - West Michigan Prosperity Alliance Muskegon City $17,921,000 $22,029,000 $4,108,000 81.4% $606,506 $35,334,049 1.7% NO
Muskegon 04 - West Michigan Prosperity Alliance Muskegon Area District Library Library $768,000 $466,000 -$302,000 164.8% $55,325 $3,940,040 1.4% NO
Muskegon 04 - West Michigan Prosperity Alliance Muskegon Central Dispatch 9- 1- 1 Authority $56,000 $376,000 $320,000 14.9% $28,826 $3,516,207 0.8% YES
Muskegon 04 - West Michigan Prosperity Alliance Muskegon Charter Township Township $0 $9,779,125 $9,779,125 0.0% $552,730 $6,363,072 8.7% NO
Muskegon 04 - West Michigan Prosperity Alliance Muskegon County Road Commission Road Commission $1,316,000 $2,055,000 $739,000 64.0% $155,447 $19,600,470 0.8% NO
Muskegon 04 - West Michigan Prosperity Alliance North Muskegon City $641,000 $3,203,000 $2,562,000 20.0% $438,057 $3,111,398 14.1% YES
Muskegon 04 - West Michigan Prosperity Alliance Norton Shores City $2,149,662 $26,190,104 $24,040,442 8.2% $0 $17,366,218 0.0% NO
Muskegon 04 - West Michigan Prosperity Alliance Roosevelt Park City $221,000 $1,550,000 $1,329,000 14.3% $214,085 $2,985,344 7.2% NO
Muskegon 04 - West Michigan Prosperity Alliance Whitehall City $0 $953,852 $953,852 0.0% $82,478 $2,913,206 2.8% NO
Newaygo 04 - West Michigan Prosperity Alliance Fremont City $23,551 $256,465 $232,914 9.2% $19,952 $4,121,811 0.5% NO
Newaygo 04 - West Michigan Prosperity Alliance Newaygo County $2,990,339 $13,123,688 $10,133,349 22.8% $745,750 $23,990,857 3.1% NO
Newaygo 04 - West Michigan Prosperity Alliance Newaygo County Mental Health Board Authority $1,048,917 $876,829 -$172,088 119.6% $0 $12,762,651 0.0% NO
Newaygo 04 - West Michigan Prosperity Alliance Newaygo County Road Commission Road Commission $37,223 $4,588,035 $4,550,812 0.8% $857,540 $11,624,609 6.3% YES
Oakland 10 - Detroit Metro Prosperity Region Auburn Hills City $18,059,976 $32,014,455 $13,954,479 56.4% $1,457,864 $32,518,762 4.5% NO
Oakland 10 - Detroit Metro Prosperity Region Berkley City $2,223,325 $27,663,815 $25,440,490 8.0% $2,512,485 $14,203,634 17.7% YES
Oakland 10 - Detroit Metro Prosperity Region Beverly Hills Village $6,141,787 $14,916,871 $8,775,084 41.2% $720,855 $9,853,366 7.3% NO
Oakland 10 - Detroit Metro Prosperity Region Birmingham City $32,463,599 $59,346,031 $26,882,432 54.7% $3,248,596 $37,084,921 8.8% NO
Oakland 10 - Detroit Metro Prosperity Region Bloomfield Charter Township Township $5,437,023 $157,390,635 $151,953,612 3.5% $13,238,120 $55,327,842 23.9% YES
Oakland 10 - Detroit Metro Prosperity Region Bloomfield Hills City $1,512,555 $11,044,714 $9,532,159 13.7% $670,697 $10,977,741 6.1% NO
Oakland 10 - Detroit Metro Prosperity Region Bloomfield Township Public Library Library $0 $5,257,680 $5,257,680 0.0% $531,108 $7,154,434 7.4% YES
Oakland 10 - Detroit Metro Prosperity Region Brandon Charter Township Township $901,285 $2,926,053 $2,024,768 30.8% $232,123 $5,129,496 4.5% NO
Oakland 10 - Detroit Metro Prosperity Region Clawson City $0 $14,093,576 $14,093,576 0.0% $1,009,825 $11,859,217 8.5% NO
Oakland 10 - Detroit Metro Prosperity Region Commerce Charter Township Township $363,287 $282,209 -$81,078 128.7% $7,159 $22,357,697 0.0% NO
34 of 39Updated 08/10/2018
Source: Fiscal year 2017 audited financial statements or most recent year available for biennial filers
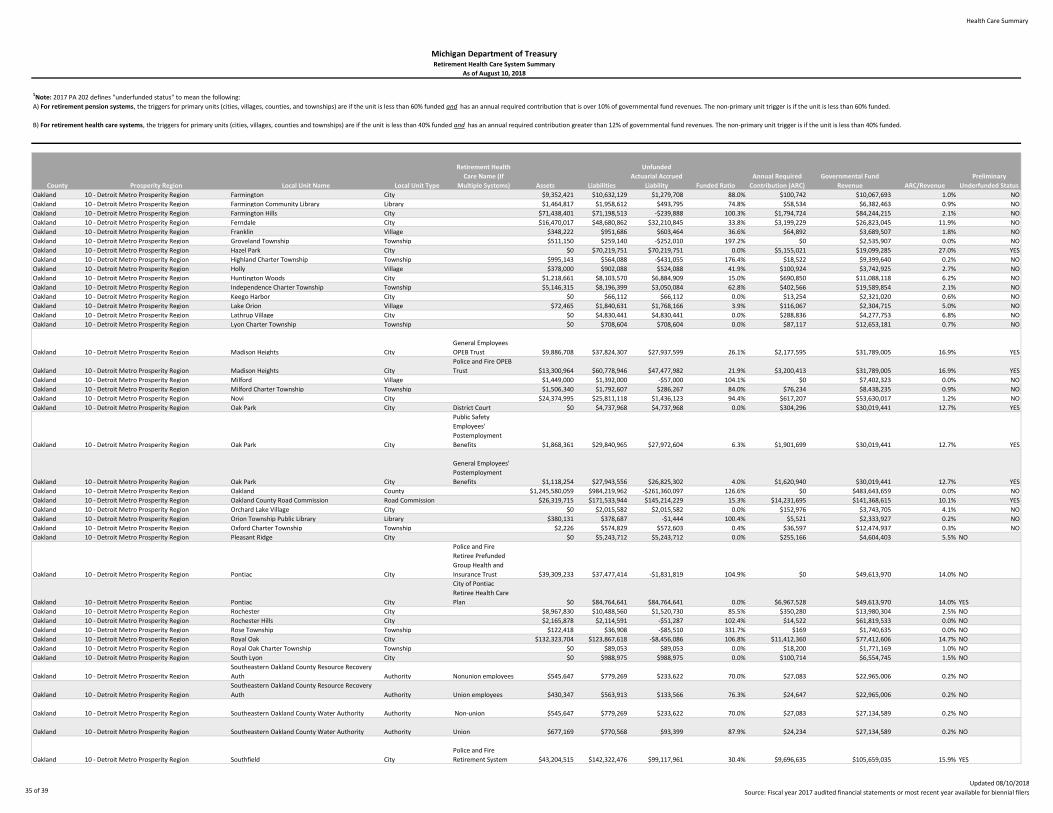
Health Care Summary
County Prosperity Region Local Unit Name Local Unit Type
Retirement Health
Care Name (If
Multiple Systems) Assets Liabilities
Unfunded
Actuarial Accrued
Liability Funded Ratio
Annual Required
Contribution (ARC)
Governmental Fund
Revenue ARC/Revenue
Preliminary
Underfunded Status
Michigan Department of TreasuryRetirement Health Care System Summary
As of August 10, 2018
1Note: 2017 PA 202 defines "underfunded status" to mean the following:
A) For retirement pension systems, the triggers for primary units (cities, villages, counties, and townships) are if the unit is less than 60% funded and has an annual required contribution that is over 10% of governmental fund revenues. The non-primary unit trigger is if the unit is less than 60% funded.
B) For retirement health care systems, the triggers for primary units (cities, villages, counties and townships) are if the unit is less than 40% funded and has an annual required contribution greater than 12% of governmental fund revenues. The non-primary unit trigger is if the unit is less than 40% funded.
Oakland 10 - Detroit Metro Prosperity Region Farmington City $9,352,421 $10,632,129 $1,279,708 88.0% $100,742 $10,067,693 1.0% NO
Oakland 10 - Detroit Metro Prosperity Region Farmington Community Library Library $1,464,817 $1,958,612 $493,795 74.8% $58,534 $6,382,463 0.9% NO
Oakland 10 - Detroit Metro Prosperity Region Farmington Hills City $71,438,401 $71,198,513 -$239,888 100.3% $1,794,724 $84,244,215 2.1% NO
Oakland 10 - Detroit Metro Prosperity Region Ferndale City $16,470,017 $48,680,862 $32,210,845 33.8% $3,199,229 $26,823,045 11.9% NO
Oakland 10 - Detroit Metro Prosperity Region Franklin Village $348,222 $951,686 $603,464 36.6% $64,892 $3,689,507 1.8% NO
Oakland 10 - Detroit Metro Prosperity Region Groveland Township Township $511,150 $259,140 -$252,010 197.2% $0 $2,535,907 0.0% NO
Oakland 10 - Detroit Metro Prosperity Region Hazel Park City $0 $70,219,751 $70,219,751 0.0% $5,155,021 $19,099,285 27.0% YES
Oakland 10 - Detroit Metro Prosperity Region Highland Charter Township Township $995,143 $564,088 -$431,055 176.4% $18,522 $9,399,640 0.2% NO
Oakland 10 - Detroit Metro Prosperity Region Holly Village $378,000 $902,088 $524,088 41.9% $100,924 $3,742,925 2.7% NO
Oakland 10 - Detroit Metro Prosperity Region Huntington Woods City $1,218,661 $8,103,570 $6,884,909 15.0% $690,850 $11,088,118 6.2% NO
Oakland 10 - Detroit Metro Prosperity Region Independence Charter Township Township $5,146,315 $8,196,399 $3,050,084 62.8% $402,566 $19,589,854 2.1% NO
Oakland 10 - Detroit Metro Prosperity Region Keego Harbor City $0 $66,112 $66,112 0.0% $13,254 $2,321,020 0.6% NO
Oakland 10 - Detroit Metro Prosperity Region Lake Orion Village $72,465 $1,840,631 $1,768,166 3.9% $116,067 $2,304,715 5.0% NO
Oakland 10 - Detroit Metro Prosperity Region Lathrup Village City $0 $4,830,441 $4,830,441 0.0% $288,836 $4,277,753 6.8% NO
Oakland 10 - Detroit Metro Prosperity Region Lyon Charter Township Township $0 $708,604 $708,604 0.0% $87,117 $12,653,181 0.7% NO
Oakland 10 - Detroit Metro Prosperity Region Madison Heights City
General Employees
OPEB Trust $9,886,708 $37,824,307 $27,937,599 26.1% $2,177,595 $31,789,005 16.9% YES
Oakland 10 - Detroit Metro Prosperity Region Madison Heights City
Police and Fire OPEB
Trust $13,300,964 $60,778,946 $47,477,982 21.9% $3,200,413 $31,789,005 16.9% YES
Oakland 10 - Detroit Metro Prosperity Region Milford Village $1,449,000 $1,392,000 -$57,000 104.1% $0 $7,402,323 0.0% NO
Oakland 10 - Detroit Metro Prosperity Region Milford Charter Township Township $1,506,340 $1,792,607 $286,267 84.0% $76,234 $8,438,235 0.9% NO
Oakland 10 - Detroit Metro Prosperity Region Novi City $24,374,995 $25,811,118 $1,436,123 94.4% $617,207 $53,630,017 1.2% NO
Oakland 10 - Detroit Metro Prosperity Region Oak Park City District Court $0 $4,737,968 $4,737,968 0.0% $304,296 $30,019,441 12.7% YES
Oakland 10 - Detroit Metro Prosperity Region Oak Park City
Public Safety
Employees'
Postemployment
Benefits $1,868,361 $29,840,965 $27,972,604 6.3% $1,901,699 $30,019,441 12.7% YES
Oakland 10 - Detroit Metro Prosperity Region Oak Park City
General Employees'
Postemployment
Benefits $1,118,254 $27,943,556 $26,825,302 4.0% $1,620,940 $30,019,441 12.7% YES
Oakland 10 - Detroit Metro Prosperity Region Oakland County $1,245,580,059 $984,219,962 -$261,360,097 126.6% $0 $483,643,659 0.0% NO
Oakland 10 - Detroit Metro Prosperity Region Oakland County Road Commission Road Commission $26,319,715 $171,533,944 $145,214,229 15.3% $14,231,695 $141,368,615 10.1% YES
Oakland 10 - Detroit Metro Prosperity Region Orchard Lake Village City $0 $2,015,582 $2,015,582 0.0% $152,976 $3,743,705 4.1% NO
Oakland 10 - Detroit Metro Prosperity Region Orion Township Public Library Library $380,131 $378,687 -$1,444 100.4% $5,521 $2,333,927 0.2% NO
Oakland 10 - Detroit Metro Prosperity Region Oxford Charter Township Township $2,226 $574,829 $572,603 0.4% $36,597 $12,474,937 0.3% NO
Oakland 10 - Detroit Metro Prosperity Region Pleasant Ridge City $0 $5,243,712 $5,243,712 0.0% $255,166 $4,604,403 5.5% NO
Oakland 10 - Detroit Metro Prosperity Region Pontiac City
Police and Fire
Retiree Prefunded
Group Health and
Insurance Trust $39,309,233 $37,477,414 -$1,831,819 104.9% $0 $49,613,970 14.0% NO
Oakland 10 - Detroit Metro Prosperity Region Pontiac City
City of Pontiac
Retiree Health Care
Plan $0 $84,764,641 $84,764,641 0.0% $6,967,528 $49,613,970 14.0% YES
Oakland 10 - Detroit Metro Prosperity Region Rochester City $8,967,830 $10,488,560 $1,520,730 85.5% $350,280 $13,980,304 2.5% NO
Oakland 10 - Detroit Metro Prosperity Region Rochester Hills City $2,165,878 $2,114,591 -$51,287 102.4% $14,522 $61,819,533 0.0% NO
Oakland 10 - Detroit Metro Prosperity Region Rose Township Township $122,418 $36,908 -$85,510 331.7% $169 $1,740,635 0.0% NO
Oakland 10 - Detroit Metro Prosperity Region Royal Oak City $132,323,704 $123,867,618 -$8,456,086 106.8% $11,412,360 $77,412,606 14.7% NO
Oakland 10 - Detroit Metro Prosperity Region Royal Oak Charter Township Township $0 $89,053 $89,053 0.0% $18,200 $1,771,169 1.0% NO
Oakland 10 - Detroit Metro Prosperity Region South Lyon City $0 $988,975 $988,975 0.0% $100,714 $6,554,745 1.5% NO
Oakland 10 - Detroit Metro Prosperity Region
Southeastern Oakland County Resource Recovery
Auth Authority Nonunion employees $545,647 $779,269 $233,622 70.0% $27,083 $22,965,006 0.2% NO
Oakland 10 - Detroit Metro Prosperity Region
Southeastern Oakland County Resource Recovery
Auth Authority Union employees $430,347 $563,913 $133,566 76.3% $24,647 $22,965,006 0.2% NO
Oakland 10 - Detroit Metro Prosperity Region Southeastern Oakland County Water Authority Authority Non-union $545,647 $779,269 $233,622 70.0% $27,083 $27,134,589 0.2% NO
Oakland 10 - Detroit Metro Prosperity Region Southeastern Oakland County Water Authority Authority Union $677,169 $770,568 $93,399 87.9% $24,234 $27,134,589 0.2% NO
Oakland 10 - Detroit Metro Prosperity Region Southfield City
Police and Fire
Retirement System $43,204,515 $142,322,476 $99,117,961 30.4% $9,696,635 $105,659,035 15.9% YES
35 of 39Updated 08/10/2018
Source: Fiscal year 2017 audited financial statements or most recent year available for biennial filers

Health Care Summary
County Prosperity Region Local Unit Name Local Unit Type
Retirement Health
Care Name (If
Multiple Systems) Assets Liabilities
Unfunded
Actuarial Accrued
Liability Funded Ratio
Annual Required
Contribution (ARC)
Governmental Fund
Revenue ARC/Revenue
Preliminary
Underfunded Status
Michigan Department of TreasuryRetirement Health Care System Summary
As of August 10, 2018
1Note: 2017 PA 202 defines "underfunded status" to mean the following:
A) For retirement pension systems, the triggers for primary units (cities, villages, counties, and townships) are if the unit is less than 60% funded and has an annual required contribution that is over 10% of governmental fund revenues. The non-primary unit trigger is if the unit is less than 60% funded.
B) For retirement health care systems, the triggers for primary units (cities, villages, counties and townships) are if the unit is less than 40% funded and has an annual required contribution greater than 12% of governmental fund revenues. The non-primary unit trigger is if the unit is less than 40% funded.
Oakland 10 - Detroit Metro Prosperity Region Southfield City
Employee
Retirement System $15,265,279 $103,739,273 $88,473,994 14.7% $7,153,708 $105,659,035 15.9% YES
Oakland 10 - Detroit Metro Prosperity Region Southfield Township Township $118,692 $209,417 $90,725 56.7% $20,523 $674,163 3.0% NO
Oakland 10 - Detroit Metro Prosperity Region State Of Michigan 48th Judicial District Court Authority $0 $7,170,401 $7,170,401 0.0% $531,963 $4,378,868 12.1% YES
Oakland 10 - Detroit Metro Prosperity Region Sylvan Lake City $402,066 $858,804 $456,738 46.8% $66,586 $2,635,735 2.5% NO
Oakland 10 - Detroit Metro Prosperity Region Troy City $77,394,452 $136,996,277 $59,601,825 56.5% $4,668,805 $82,169,775 5.7% NO
Oakland 10 - Detroit Metro Prosperity Region Walled Lake City $8,668 $3,051,600 $3,042,932 0.3% $217,352 $5,689,591 3.8% NO
Oakland 10 - Detroit Metro Prosperity Region Waterford Charter Township Township $11,422,373 $186,829,068 $175,406,695 6.1% $13,688,352 $50,966,440 26.9% YES
Oakland 10 - Detroit Metro Prosperity Region West Bloomfield Charter Township Township $70,864,393 $76,791,648 $5,927,255 92.3% $1,885,052 $48,645,579 3.9% NO
Oakland 10 - Detroit Metro Prosperity Region West Bloomfield Township Public Library Library $1,199,830 $822,468 -$377,362 145.9% $23,055 $5,287,524 0.4% NO
Oakland 10 - Detroit Metro Prosperity Region White Lake Charter Township Township $400,000 $11,576,091 $11,176,091 3.5% $827,842 $18,447,714 4.5% NO
Oakland 10 - Detroit Metro Prosperity Region Wixom City $5,509,798 $10,380,016 $4,870,218 53.1% $563,990 $15,912,216 3.5% NO
Oakland 10 - Detroit Metro Prosperity Region Wolverine Lake Village $4,311 $200,726 $196,415 2.1% $18,019 $2,781,410 0.6% NO
Oceana 04 - West Michigan Prosperity Alliance Hart City $175,165 $2,295,891 $2,120,726 7.6% $353,821 $1,958,917 18.1% YES
Oceana 04 - West Michigan Prosperity Alliance Oceana County $442,106 $864,933 $422,827 51.1% $31,710 $14,684,916 0.2% NO
Oceana 04 - West Michigan Prosperity Alliance Oceana County Road Commission Road Commission $112,408 $1,151,147 $1,038,739 9.8% $319,392 $8,734,602 3.7% YES
Oceana 04 - West Michigan Prosperity Alliance Pentwater Village $54,637 $429,366 $374,729 12.7% $31,138 $1,543,510 2.0% NO
Ogemaw 03 - Northeast Prosperity Region Ogemaw County $0 $652,502 $652,502 0.0% $32,278 $11,218,683 0.3% NO
Ogemaw 03 - Northeast Prosperity Region Ogemaw County Road Commission Road Commission $21,052 $719,652 $698,600 2.9% $69,163 $6,508,774 0.3% YES
Ogemaw 03 - Northeast Prosperity Region West Branch City $0 $145,796 $145,796 0.0% $10,764 $2,065,221 0.5% NO
Ontonagon 01 - Upper Peninsula Prosperity Alliance Ontonagon County Road Commission Road Commission $0 $7,797,255 $7,797,255 0.0% $733,937 $8,518,407 8.6% YES
Osceola 04 - West Michigan Prosperity Alliance Osceola County Road Commission Road Commission $0 $710,781 $710,781 0.0% $23,693 $6,557,935 0.4% YES
Oscoda 03 - Northeast Prosperity Region Oscoda County $0 $303,470 $303,470 0.0% $44,870 $7,212,288 0.6% NO
Oscoda 03 - Northeast Prosperity Region Oscoda County Road Commission Road Commission $0 $2,211,576 $2,211,576 0.0% $190,081 $4,815,947 3.9% YES
Otsego 03 - Northeast Prosperity Region Gaylord City $0 $959,585 $959,585 0.0% $77,567 $5,499,077 1.4% NO
Otsego 03 - Northeast Prosperity Region Otsego County County $0 $1,930,701 $1,930,701 0.0% $150,887 $16,405,974 0.9% NO
Otsego 03 - Northeast Prosperity Region Otsego County Road Commission Road Commission $0 $6,088,899 $6,088,899 0.0% $307,622 $10,409,106 3.0% YES
Ottawa 04 - West Michigan Prosperity Alliance Grand Haven City $1,948,271 $6,353,547 $4,405,276 30.7% $859,095 $13,168,741 6.5% NO
Ottawa 04 - West Michigan Prosperity Alliance Grand Haven Charter Township Township $121,182 $352,241 $231,059 34.4% $31,068 $6,369,253 0.5% NO
Ottawa 04 - West Michigan Prosperity Alliance Holland City $0 $5,192,937 $5,192,937 0.0% $522,606 $34,376,620 1.5% NO
Ottawa 04 - West Michigan Prosperity Alliance Holland Charter Township Township $0 $139,685 $139,685 0.0% $15,243 $13,213,254 0.1% YES
Ottawa 04 - West Michigan Prosperity Alliance Ottawa County County $5,205,196 $7,198,033 $1,992,837 72.3% $80,471 $144,747,894 0.1% NO
Ottawa 04 - West Michigan Prosperity Alliance Ottawa County Road Commission Road Commission $0 $1,632,020 $1,632,020 0.0% $337,063 $41,565,263 0.8% YES
Ottawa 04 - West Michigan Prosperity Alliance Park Township Township 0.0% $6,559,111 0.0% NO
Ottawa 04 - West Michigan Prosperity Alliance Spring Lake District Library Library $924,764 $445,804 -$478,960 207.4% $0 $2,006,888 0.0% NO
Ottawa 04 - West Michigan Prosperity Alliance Spring Lake Township Township $0 $923,798 $923,798 0.0% $64,874 $4,466,299 1.5% NO
Ottawa 04 - West Michigan Prosperity Alliance Zeeland City $2,109,380 $2,028,072 -$81,308 104.0% $14,373 $10,568,030 0.1% NO
Presque Isle 03 - Northeast Prosperity Region Presque Isle County Road Commission Road Commission $0 $1,327,286 $1,327,286 0.0% $60,942 $5,593,373 1.1% YES
Presque Isle 03 - Northeast Prosperity Region Rogers City City $0 $648,725 $648,725 0.0% $86,098 $2,147,660 4.0% NO
Roscommon 03 - Northeast Prosperity Region Houghton Lake Sewer Authority Authority $0 $92,715 $92,715 0.0% $0 $2,408,627 0.0% YES
Roscommon 03 - Northeast Prosperity Region Roscommon County Road Commission Road Commission $0 $1,139,332 $1,139,332 0.0% $73,398 $8,938,481 0.8% YES
Saginaw 05 - East Central Michigan Prosperity Region Bridgeport Charter Township Township $0 $1,026,964 $1,026,964 0.0% $69,994 $3,515,718 2.0% NO
Saginaw 05 - East Central Michigan Prosperity Region Buena Vista Charter Township Township $0 $2,594,879 $2,594,879 0.0% $152,172 $5,319,238 2.9% NO
Saginaw 05 - East Central Michigan Prosperity Region Chesaning Village $0 $212,380 $212,380 0.0% $23,145 $2,017,550 1.1% NO
Saginaw 05 - East Central Michigan Prosperity Region Frankenmuth City $0 $252,700 $252,700 0.0% $34,844 $7,151,343 0.5% NO
Saginaw 05 - East Central Michigan Prosperity Region Mbs International Airport Commission Authority $0 $2,786,701 $2,786,701 0.0% $327,418 $5,319,494 6.2% YES
Saginaw 05 - East Central Michigan Prosperity Region Richland Township Township $0 $1,655,751 $1,655,751 0.0% $79,365 $1,875,947 4.2% NO
Saginaw 05 - East Central Michigan Prosperity Region Saginaw City $0 $272,539,089 $272,539,089 0.0% $21,883,599 $50,807,603 43.1% YES
Saginaw 05 - East Central Michigan Prosperity Region Saginaw Charter Township Township $2,566,542 $10,109,362 $7,542,820 25.4% $744,161 $18,224,541 4.1% NO
Saginaw 05 - East Central Michigan Prosperity Region Saginaw City Housing Commission Authority $0 $4,268,137 $4,268,137 0.0% $329,743 $11,266,131 2.9% YES
Saginaw 05 - East Central Michigan Prosperity Region Saginaw County County $19,873,325 $101,019,776 $81,146,451 19.7% $12,051,002 $107,502,095 11.2% NO
Saginaw 05 - East Central Michigan Prosperity Region
Saginaw County 911 Communications Center
Authority Authority $5,151,418 $9,723,917 $4,572,499 53.0% $410,087 $5,982,934 6.9% NO
Saginaw 05 - East Central Michigan Prosperity Region
Saginaw County Community Mental Health
Authority Authority $13,091,430 $15,538,813 $2,447,383 84.2% $603,964 $78,980,289 0.8% NO
Saginaw 05 - East Central Michigan Prosperity Region Saginaw County Road Commission Road Commission $0 $22,518,466 $22,518,466 0.0% $3,737,749 $23,864,132 15.7% YES
Saginaw 05 - East Central Michigan Prosperity Region
Saginaw- Midland Municipal Water Supply
Corporation Authority $1,465,089 $2,703,594 $1,238,505 54.2% $156,582 $6,062,700 2.6% NO
Saginaw 05 - East Central Michigan Prosperity Region Saginaw Transit Authority Regional Services Authority $593,039 $1,007,243 $414,204 58.9% $107,549 $6,363,538 1.7% NO
Saginaw 05 - East Central Michigan Prosperity Region St Charles Village $0 $1,299,434 $1,299,434 0.0% $131,931 $1,215,241 10.9% NO
Saginaw 05 - East Central Michigan Prosperity Region Tittabawassee Township Township $0 $73,983 $73,983 0.0% $14,806 $3,263,638 0.5% NO
36 of 39Updated 08/10/2018
Source: Fiscal year 2017 audited financial statements or most recent year available for biennial filers

Health Care Summary
County Prosperity Region Local Unit Name Local Unit Type
Retirement Health
Care Name (If
Multiple Systems) Assets Liabilities
Unfunded
Actuarial Accrued
Liability Funded Ratio
Annual Required
Contribution (ARC)
Governmental Fund
Revenue ARC/Revenue
Preliminary
Underfunded Status
Michigan Department of TreasuryRetirement Health Care System Summary
As of August 10, 2018
1Note: 2017 PA 202 defines "underfunded status" to mean the following:
A) For retirement pension systems, the triggers for primary units (cities, villages, counties, and townships) are if the unit is less than 60% funded and has an annual required contribution that is over 10% of governmental fund revenues. The non-primary unit trigger is if the unit is less than 60% funded.
B) For retirement health care systems, the triggers for primary units (cities, villages, counties and townships) are if the unit is less than 40% funded and has an annual required contribution greater than 12% of governmental fund revenues. The non-primary unit trigger is if the unit is less than 40% funded.
Sanilac 06 - East Michigan Prosperity Region Croswell City $0 $982,395 $982,395 0.0% $84,612 $2,163,124 3.9% NO
Sanilac 06 - East Michigan Prosperity Region Lexington Village $0 $2,319,909 $2,319,909 0.0% $241,155 $1,278,677 18.9% YES
Sanilac 06 - East Michigan Prosperity Region Sandusky City $150,945 $213,621 $62,676 70.7% $21,120 $2,276,171 0.9% NO
Sanilac 06 - East Michigan Prosperity Region Sanilac County County $0 $12,689,946 $12,689,946 0.0% $987,929 $25,725,728 3.8% NO
Sanilac 06 - East Michigan Prosperity Region Sanilac County Community Mental Health Authority Authority $0 $119,491 $119,491 0.0% $0 $17,050,045 0.0% YES
Sanilac 06 - East Michigan Prosperity Region Sanilac County Road Commission Road Commission $0 $11,181,591 $11,181,591 0.0% $2,217,009 $17,546,937 12.6% YES
Schoolcraft 01 - Upper Peninsula Prosperity Alliance Manistique City $2,041 $1,172,327 $1,170,286 0.2% $90,576 $3,460,531 2.6% NO
Schoolcraft 01 - Upper Peninsula Prosperity Alliance Schoolcraft County Road Commission Road Commission $195,598 $2,190,027 $1,994,429 8.9% $220,557 $5,113,091 4.3% YES
Shiawassee 06 - East Michigan Prosperity Region Corunna City $33,035 $251,800 $218,765 13.1% $15,169 $2,819,235 0.5% NO
Shiawassee 06 - East Michigan Prosperity Region Durand City $0 $3,755,162 $3,755,162 0.0% $211,539 $2,545,525 8.3% NO
Shiawassee 06 - East Michigan Prosperity Region Perry City $0 $777,238 $777,238 0.0% $97,843 $1,375,725 7.1% NO
Shiawassee 06 - East Michigan Prosperity Region
Shiawassee County Community Mental Health
Authority Authority $2,620,804 $3,063,458 $442,654 85.6% $330,989 $19,201,622 39.2% NO
Shiawassee 06 - East Michigan Prosperity Region Shiawassee County Road Commission Road Commission $380,985 $4,467,701 $4,086,716 8.5% $574,165 $12,850,525 4.5% YES
St Joseph 08 - Southwest Prosperity Region St Joseph County Road Commission Road Commission $0 $493,323 $493,323 0.0% $36,709 $11,593,655 0.3% YES
St Joseph 08 - Southwest Prosperity Region Sturgis City $7,096,892 $11,000,666 $3,903,774 64.5% $1,629,825 $13,312,532 12.2% NO
St. Clair 06 - East Michigan Prosperity Region Algonac City $488,733 $300,256 -$188,477 162.8% $0 $2,869,063 0.0% NO
St. Clair 06 - East Michigan Prosperity Region Capac Village $0 $1,076,049 $1,076,049 0.0% $51,892 $1,063,686 4.9% NO
St. Clair 06 - East Michigan Prosperity Region Clay Township Township $2,272,715 $8,288,645 $6,015,930 27.4% $533,352 $6,011,244 8.9% NO
St. Clair 06 - East Michigan Prosperity Region East China Charter Township Township $464,932 $901,493 $436,561 51.6% $61,187 $2,206,249 2.8% NO
St. Clair 06 - East Michigan Prosperity Region Fort Gratiot Charter Township Township $0 $846,246 $846,246 0.0% $73,235 $4,340,663 1.7% NO
St. Clair 06 - East Michigan Prosperity Region Marine City City $172,980 $14,409,192 $14,236,212 1.2% $569,428 $3,254,359 17.5% YES
St. Clair 06 - East Michigan Prosperity Region Marysville City $14,099,553 $23,945,569 $9,846,016 58.9% $810,015 $10,721,282 7.6% NO
St. Clair 06 - East Michigan Prosperity Region Port Huron City $14,441,000 $51,551,000 $37,110,000 28.0% $2,697,774 $35,085,176 7.7% NO
St. Clair 06 - East Michigan Prosperity Region Port Huron Charter Township Township $0 $190,908 $190,908 0.0% $17,170 $3,812,260 0.5% NO
St. Clair 06 - East Michigan Prosperity Region St Clair City
City of St. Clair OPEB,
No plan/trust $0 $3,642,565 $3,642,565 0.0% $306,129 $5,953,798 5.1% NO
St. Clair 06 - East Michigan Prosperity Region St Clair City
Post-employment
Health Care Benefits $0 $3,642,565 $3,642,565 0.0% $306,129 $5,953,798 5.1% NO
St. Clair 06 - East Michigan Prosperity Region St Clair County County
St. Clair County
Other
Postemployment $24,356,391 $100,883,309 $76,526,918 24.1% $9,841,176 $87,318,474 11.3% NO
St. Clair 06 - East Michigan Prosperity Region St Clair County County
St. Clair County
Other
Postemployment $24,356,391 $100,883,309 $76,526,918 24.1% $9,841,176 $87,318,474 11.3% NO
St. Clair 06 - East Michigan Prosperity Region St Clair County Community Mental Health Authority Authority $16,324,626 $25,252,659 $8,928,033 64.6% $1,633,525 $52,093,539 3.1% NO
St. Clair 06 - East Michigan Prosperity Region St Clair County Road Commission Road Commission $1,360,548 $27,224,192 $25,863,644 5.0% $2,748,314 $28,590,485 9.6% YES
Tuscola 06 - East Michigan Prosperity Region Tuscola County Road Commission Road Commission $0 $8,937,161 $8,937,161 0.0% $659,307 $16,242,409 4.1% YES
Tuscola 06 - East Michigan Prosperity Region Vassar City $68,788 $636,969 $568,181 10.8% $64,343 $1,975,674 3.3% NO
Van Buren 08 - Southwest Prosperity Region Antwerp Township Township $0 $2,310,639 $2,310,639 0.0% $204,517 $1,967,628 10.4% NO
Van Buren 08 - Southwest Prosperity Region Bangor City $0 $1,204,281 $1,204,281 0.0% $85,653 $1,457,987 5.9% NO
Van Buren 08 - Southwest Prosperity Region South Haven City $0 $818,850 $818,850 0.0% $68,254 $8,668,838 0.8% NO
Van Buren 08 - Southwest Prosperity Region South Haven Area Emergency Services Authority Authority $0 $593,140 $593,140 0.0% $37,129 $2,572,195 1.4% YES
Van Buren 08 - Southwest Prosperity Region Van Buren County County $0 $5,101,712 $5,101,712 0.0% $185,796 $31,982,095 0.6% YES
Van Buren 08 - Southwest Prosperity Region Van Buren County Road Commission Road Commission $30,000 $10,687,444 $10,657,444 0.3% $1,087,595 $14,874,414 7.3% YES
Washtenaw 09 - Southeast Michigan Prosperity Region Ann Arbor City $157,900,000 $278,900,000 $121,000,000 56.6% $11,168,000 $128,940,812 8.7% NO
Washtenaw 09 - Southeast Michigan Prosperity Region Ann Arbor Transportation Authority Authority $105,895 $1,420,888 $1,314,993 7.5% $85,212 $47,256,743 0.2% YES
Washtenaw 09 - Southeast Michigan Prosperity Region Chelsea City $1,599,307 $3,213,260 $1,613,953 49.8% $189,018 $5,784,524 3.3% NO
Washtenaw 09 - Southeast Michigan Prosperity Region Dexter City $871,116 $2,139,820 $1,268,704 40.7% $110,478 $5,891,353 1.9% NO
Washtenaw 09 - Southeast Michigan Prosperity Region Manchester Village $142,550 $221,552 $79,002 64.3% $17,650 $2,274,807 0.8% NO
Washtenaw 09 - Southeast Michigan Prosperity Region Milan City $0 $3,549,323 $3,549,323 0.0% $453,227 $5,878,097 7.7% NO
Washtenaw 09 - Southeast Michigan Prosperity Region Pittsfield Charter Township Township $7,877,000 $9,216,000 $1,339,000 85.5% $303,212 $20,659,986 1.5% NO
Washtenaw 09 - Southeast Michigan Prosperity Region Saline City $3,308,676 $11,043,587 $7,734,911 30.0% $667,807 $12,921,254 5.2% NO
Washtenaw 09 - Southeast Michigan Prosperity Region Saline Area Fire Department Authority $0 $732,984 $732,984 0.0% $65,644 $1,140,811 5.8% YES
Washtenaw 09 - Southeast Michigan Prosperity Region Scio Township Township $0 $943,936 $943,936 0.0% $162,348 $6,919,637 2.3% NO
Washtenaw 09 - Southeast Michigan Prosperity Region Washtenaw County County $117,909,141 $235,863,833 $117,954,692 50.0% $10,501,156 $262,432,767 4.0% NO
Washtenaw 09 - Southeast Michigan Prosperity Region Washtenaw County Road Commission Road Commission $9,606,771 $26,032,034 $16,425,263 36.9% $1,774,746 $48,555,372 3.7% YES
37 of 39Updated 08/10/2018
Source: Fiscal year 2017 audited financial statements or most recent year available for biennial filers

Health Care Summary
County Prosperity Region Local Unit Name Local Unit Type
Retirement Health
Care Name (If
Multiple Systems) Assets Liabilities
Unfunded
Actuarial Accrued
Liability Funded Ratio
Annual Required
Contribution (ARC)
Governmental Fund
Revenue ARC/Revenue
Preliminary
Underfunded Status
Michigan Department of TreasuryRetirement Health Care System Summary
As of August 10, 2018
1Note: 2017 PA 202 defines "underfunded status" to mean the following:
A) For retirement pension systems, the triggers for primary units (cities, villages, counties, and townships) are if the unit is less than 60% funded and has an annual required contribution that is over 10% of governmental fund revenues. The non-primary unit trigger is if the unit is less than 60% funded.
B) For retirement health care systems, the triggers for primary units (cities, villages, counties and townships) are if the unit is less than 40% funded and has an annual required contribution greater than 12% of governmental fund revenues. The non-primary unit trigger is if the unit is less than 40% funded.
Washtenaw 09 - Southeast Michigan Prosperity Region Ypsilanti City $6,412,638 $22,037,740 $15,625,102 29.1% $1,434,982 $21,590,541 6.6% NO
Washtenaw 09 - Southeast Michigan Prosperity Region Ypsilanti Charter Township Township
Firefighter's Health
Care Plan $4,925,399 $11,819,527 $6,894,128 41.7% $629,226 $30,274,531 4.2% NO
Washtenaw 09 - Southeast Michigan Prosperity Region Ypsilanti Charter Township Township
General Township
Employee Health
Care Plan $4,940,088 $11,103,052 $6,162,964 44.5% $646,163 $30,274,531 4.2% NO
Washtenaw 09 - Southeast Michigan Prosperity Region Ypsilanti Community Utilities Authority Authority $14,714,923 $28,820,484 $14,105,561 51.1% $2,753,063 $42,916,770 6.4% NO
Wayne 10 - Detroit Metro Prosperity Region 35th District- Plymouth Authority Authority $502,730 $7,194,941 $6,692,211 7.0% $853,033 $4,951,905 17.2% YES
Wayne 10 - Detroit Metro Prosperity Region Allen Park City $500,006 $88,864,837 $88,364,831 0.6% $5,848,567 $37,586,040 15.6% YES
Wayne 10 - Detroit Metro Prosperity Region Belleville City $0 $3,914,770 $3,914,770 0.0% $270,510 $2,578,835 10.5% NO
Wayne 10 - Detroit Metro Prosperity Region Brownstown Charter Township Township $2,907,746 $22,779,465 $19,871,719 12.8% $1,896,373 $20,732,004 9.1% NO
Wayne 10 - Detroit Metro Prosperity Region Canton Charter Township Township $14,012,172 $59,852,655 $45,840,483 23.4% $3,582,601 $68,653,917 5.2% NO
Wayne 10 - Detroit Metro Prosperity Region Dearborn City
Retiree Life
Insurance $1,232,638 $0 -$1,232,638 0.0% $0 $139,878,108 12.8% NO
Wayne 10 - Detroit Metro Prosperity Region Dearborn City
City of Dearborn
Retiree Health Care
Plan $64,510,866 $226,037,850 $161,526,984 28.5% $17,887,412 $139,878,108 12.8% YES
Wayne 10 - Detroit Metro Prosperity Region Dearborn Heights City $0 $168,693,439 $168,693,439 0.0% $13,983,925 $47,291,305 29.6% YES
Wayne 10 - Detroit Metro Prosperity Region Detroit City $4,002,000 $3,292,916 -$709,084 121.5% $60,295 $1,334,474,794 0.0% NO
Wayne 10 - Detroit Metro Prosperity Region Ecorse City $0 $22,623,093 $22,623,093 0.0% $1,522,195 $16,076,526 9.5% NO
Wayne 10 - Detroit Metro Prosperity Region Flat Rock City $0 $14,388,666 $14,388,666 0.0% $1,292,869 $14,872,610 8.7% NO
Wayne 10 - Detroit Metro Prosperity Region Garden City City $0 $132,273,081 $132,273,081 0.0% $5,718,760 $22,448,925 25.5% YES
Wayne 10 - Detroit Metro Prosperity Region Gibraltar City $404,972 $8,464,004 $8,059,032 4.8% $647,051 $3,967,907 16.3% YES
Wayne 10 - Detroit Metro Prosperity Region Grosse Ile Township Township $0 $17,186,369 $17,186,369 0.0% $1,027,530 $9,085,378 11.3% NO
Wayne 10 - Detroit Metro Prosperity Region Grosse Pointe City $773,012 $12,471,890 $11,698,878 6.2% $253,312 $8,103,360 3.1% NO
Wayne 10 - Detroit Metro Prosperity Region Grosse Pointe Farms City
City of Grosse Pointe
Farms Public Safety
Retiree Health Plan $5,166,669 $16,592,175 $11,425,506 31.1% $1,144,288 $14,646,653 14.5% YES
Wayne 10 - Detroit Metro Prosperity Region Grosse Pointe Farms City
City of Grosse Pointe
Farms Employees
Retiree Health Plan $1,947,830 $12,986,382 $11,038,552 15.0% $986,558 $14,646,653 14.5% YES
Wayne 10 - Detroit Metro Prosperity Region Grosse Pointe Park City $189,982 $26,810,552 $26,620,570 0.7% $902,066 $14,508,269 6.2% NO
Wayne 10 - Detroit Metro Prosperity Region Grosse Pointe Shores City Of The Village City $2,210,740 $10,324,502 $8,113,762 21.4% $645,392 $6,512,211 9.9% NO
Wayne 10 - Detroit Metro Prosperity Region Grosse Pointe Woods City $50,000 $53,796,070 $53,746,070 0.1% $3,320,383 $18,991,373 17.5% YES
Wayne 10 - Detroit Metro Prosperity Region Hamtramck City $0 $33,241,386 $33,241,386 0.0% $2,285,998 $19,622,588 11.6% NO
Wayne 10 - Detroit Metro Prosperity Region Highland Park City $0 $24,087,834 $24,087,834 0.0% $557,966 $16,874,119 3.3% NO
Wayne 10 - Detroit Metro Prosperity Region Huron Charter Township Township $6,053,114 $11,630,906 $5,577,792 52.0% $631,953 $9,487,586 6.7% NO
Wayne 10 - Detroit Metro Prosperity Region Inkster City $0 $8,119,400 $8,119,400 0.0% $602,175 $19,633,911 3.1% NO
Wayne 10 - Detroit Metro Prosperity Region Lincoln Park City Police and Fire $0 $57,736,481 $57,736,481 0.0% $3,466,031 $29,372,372 24.0% YES
Wayne 10 - Detroit Metro Prosperity Region Lincoln Park City Municipal Employees $0 $53,192,760 $53,192,760 0.0% $3,589,713 $29,372,372 24.0% YES
Wayne 10 - Detroit Metro Prosperity Region Livonia City $98,722,000 $161,226,000 $62,504,000 61.2% $4,517,014 $101,813,976 4.4% NO
Wayne 10 - Detroit Metro Prosperity Region Melvindale City
Police and Fire
System I $2,644,417 $2,487,319 -$157,098 106.3% $0 $13,532,738 14.2% NO
Wayne 10 - Detroit Metro Prosperity Region Melvindale City
City of Melvindale -
Self Insured $0 $45,097,236 $45,097,236 0.0% $1,919,050 $13,532,738 14.2% YES
Wayne 10 - Detroit Metro Prosperity Region Northville City $8,098,937 $18,716,200 $10,617,263 43.3% $808,187 $9,662,435 8.4% NO
Wayne 10 - Detroit Metro Prosperity Region Northville Charter Township Township $5,786,208 $6,682,942 $896,734 86.6% $231,376 $25,497,439 0.9% NO
Wayne 10 - Detroit Metro Prosperity Region Northville District Library Library $1,203,871 $144,647 -$1,059,224 832.3% $0 $2,858,670 0.0% NO
Wayne 10 - Detroit Metro Prosperity Region Northville Parks & Recreation Commission Authority $548,560 $1,438,334 $889,774 38.1% $74,666 $2,451,095 3.0% YES
Wayne 10 - Detroit Metro Prosperity Region Plymouth City $0 $12,656,374 $12,656,374 0.0% $926,180 $12,914,678 7.2% NO
Wayne 10 - Detroit Metro Prosperity Region Plymouth Charter Township Township $0 $16,383,116 $16,383,116 0.0% $2,168,016 $15,154,543 14.3% YES
Wayne 10 - Detroit Metro Prosperity Region Plymouth District Library Library $1,336,970 $1,043,036 -$293,934 128.2% $38,000 $3,743,153 1.0% NO
Wayne 10 - Detroit Metro Prosperity Region Redford Charter Township Township
OPEB - Police and
Fire $4,134,869 $88,060,417 $83,925,548 4.7% $4,480,511 $38,453,626 18.9% YES
Wayne 10 - Detroit Metro Prosperity Region Redford Charter Township Township
OPEB - General
Employees $2,016,917 $54,131,489 $52,114,572 3.7% $2,792,937 $38,453,626 18.9% YES
Wayne 10 - Detroit Metro Prosperity Region Redford Township District Library Library $211,326 $2,236,028 $2,024,702 9.5% $417,118 $2,798,041 14.9% YES
38 of 39Updated 08/10/2018
Source: Fiscal year 2017 audited financial statements or most recent year available for biennial filers

Health Care Summary
County Prosperity Region Local Unit Name Local Unit Type
Retirement Health
Care Name (If
Multiple Systems) Assets Liabilities
Unfunded
Actuarial Accrued
Liability Funded Ratio
Annual Required
Contribution (ARC)
Governmental Fund
Revenue ARC/Revenue
Preliminary
Underfunded Status
Michigan Department of TreasuryRetirement Health Care System Summary
As of August 10, 2018
1Note: 2017 PA 202 defines "underfunded status" to mean the following:
A) For retirement pension systems, the triggers for primary units (cities, villages, counties, and townships) are if the unit is less than 60% funded and has an annual required contribution that is over 10% of governmental fund revenues. The non-primary unit trigger is if the unit is less than 60% funded.
B) For retirement health care systems, the triggers for primary units (cities, villages, counties and townships) are if the unit is less than 40% funded and has an annual required contribution greater than 12% of governmental fund revenues. The non-primary unit trigger is if the unit is less than 40% funded.
Wayne 10 - Detroit Metro Prosperity Region River Rouge City $0 $62,108,641 $62,108,641 0.0% $3,884,657 $18,795,265 20.7% YES
Wayne 10 - Detroit Metro Prosperity Region Riverview City $0 $42,226,967 $42,226,967 0.0% $4,139,949 $9,970,825 41.5% YES
Wayne 10 - Detroit Metro Prosperity Region Rockwood City $641,526 $7,237,392 $6,595,866 8.9% $464,001 $3,014,339 15.4% YES
Wayne 10 - Detroit Metro Prosperity Region Romulus City $3,672,128 $62,287,733 $58,615,605 5.9% $5,573,640 $27,921,448 20.0% YES
Wayne 10 - Detroit Metro Prosperity Region Southgate City
City of Southgate
Policemen and
Firemen Retiree
Healthcare System $1,392,279 $51,415,585 $50,023,306 2.7% $3,125,869 $27,401,773 21.2% YES
Wayne 10 - Detroit Metro Prosperity Region Southgate City
City of Southgate
Municipal Employees
Retiree Healthcare
System $2,494,510 $32,557,811 $30,063,301 7.7% $2,695,949 $27,401,773 21.2% YES
Wayne 10 - Detroit Metro Prosperity Region
Suburban Mobility Authority For Regional
Transportation Authority $39,990,911 $195,802,936 $155,812,025 20.4% $13,048,354 $160,476,853 8.1% YES
Wayne 10 - Detroit Metro Prosperity Region Taylor City $0 $333,124,138 $333,124,138 0.0% $17,992,359 $65,615,183 27.4% YES
Wayne 10 - Detroit Metro Prosperity Region Trenton City $7,893,928 $88,429,737 $80,535,809 8.9% $6,195,000 $22,826,477 27.1% YES
Wayne 10 - Detroit Metro Prosperity Region Van Buren Charter Township Township $1,662,860 $28,477,765 $26,814,905 5.8% $5,396,587 $17,219,661 31.3% YES
Wayne 10 - Detroit Metro Prosperity Region Wayne City $2,295,381 $87,842,665 $85,547,284 2.6% $6,219,301 $19,406,110 32.0% YES
Wayne 10 - Detroit Metro Prosperity Region Wayne County County $17,881,000 $302,186,000 $284,305,000 5.9% $21,847,000 $842,467,821 2.6% NO
Wayne 10 - Detroit Metro Prosperity Region Wayne County Airport Authority Authority $45,131,814 $130,697,085 $85,565,271 34.5% $7,443,898 $458,318,405 1.6% YES
Wayne 10 - Detroit Metro Prosperity Region Westland City $0 $279,605,383 $279,605,383 0.0% $14,532,590 $73,345,154 19.8% YES
Wayne 10 - Detroit Metro Prosperity Region Woodhaven City $0 $26,764,283 $26,764,283 0.0% $2,181,584 $15,662,620 13.9% YES
Wayne 10 - Detroit Metro Prosperity Region Wyandotte City $2,138,550 $129,130,793 $126,992,243 1.7% $10,440,580 $25,864,003 40.4% YES
Wexford 02 - Northwest Prosperity Region Cadillac City
Policemen and
Firemen Retiree
Health Care Plan
(PFRHP) $1,837,529 $3,028,119 $1,190,590 60.7% $196,005 $9,095,881 3.3% NO
Wexford 02 - Northwest Prosperity Region Cadillac City
General Retiree
Health Care Plan
(GRHCP) $1,448,999 $1,736,159 $287,160 83.5% $100,308 $9,095,881 3.3% NO
Wexford 02 - Northwest Prosperity Region Cadillac City Housing Commission Authority Authority $0 $37,618 $37,618 0.0% $5,310 $972,808 0.5% YES
Wexford 02 - Northwest Prosperity Region Wexford County Road Commission Road Commission $0 $621,287 $621,287 0.0% $26,380 $8,568,846 0.3% YES
39 of 39Updated 08/10/2018
Source: Fiscal year 2017 audited financial statements or most recent year available for biennial filers