©michael borrus, 2003 wisdom from the wizard of omaha “nothing sedates rationality like large...
Post on 21-Dec-2015
213 views
TRANSCRIPT
©Michael Borrus, 2003
Wisdom from the Wizard of Omaha
“Nothing sedates rationality like large doses of effortless money.”Warren BuffetBerkshire-Hathaway Annual Report for 2000(Net profits rose 113%; earning/share rose 2X)
“Despite three years of falling prices, which have significantly improved the attractiveness of common stocks, we still find very few that even mildly interest us. That dismal fact is testimony to the insanity of valuations reached during The Great Bubble. Unfortunately, the hangover may prove to be proportional to the binge.”
Warren BuffetMarch 2003
©Michael Borrus, 2003
The New Economy Viewup to March 2000
• The Internet changes everything• The economic model of every business will be
transformed• Move first, be the Biggest, Fastest• Spend and spend; Equity is currency• Emphasize marketing hype over real execution• Lay-off the risk onto the Public Market
©Michael Borrus, 2003
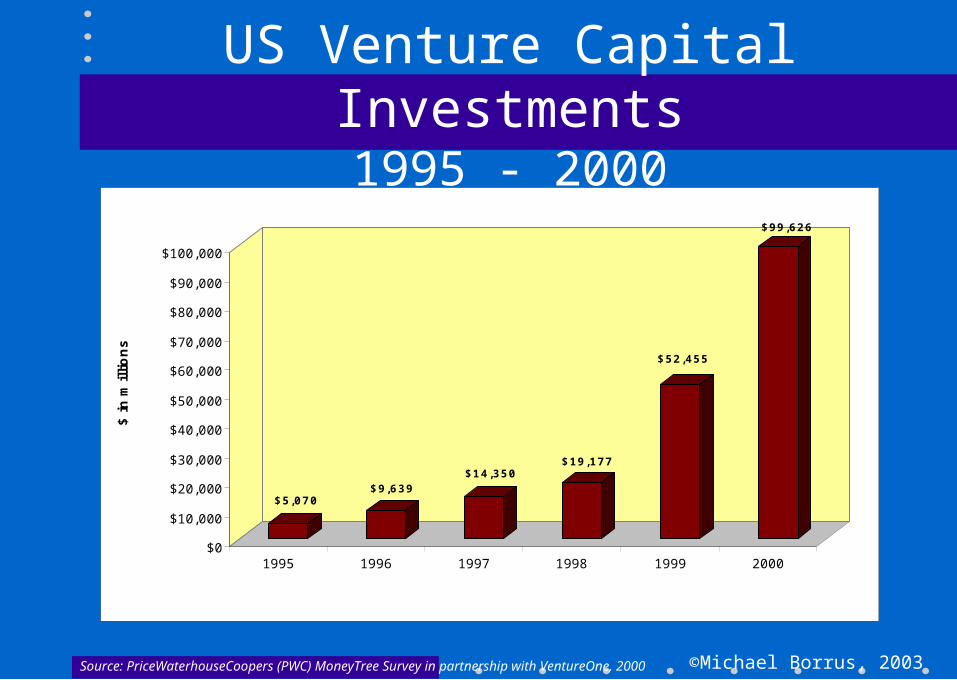
US Venture Capital Investments1995 - 2000
1,174deals
1,676deals
1,840 deals
2,046deals
3,317deals
4,107deals
Source: PriceWaterhouseCoopers (PWC) MoneyTree Survey in partnership with VentureOne, 2000
$5,070$9,639
$14,350$19,177
$52,455
$99,626
$0
$10,000
$20,000
$30,000
$40,000
$50,000
$60,000
$70,000
$80,000
$90,000
$100,000
$ in
million
s
1995 1996 1997 1998 1999 2000
©Michael Borrus, 2003
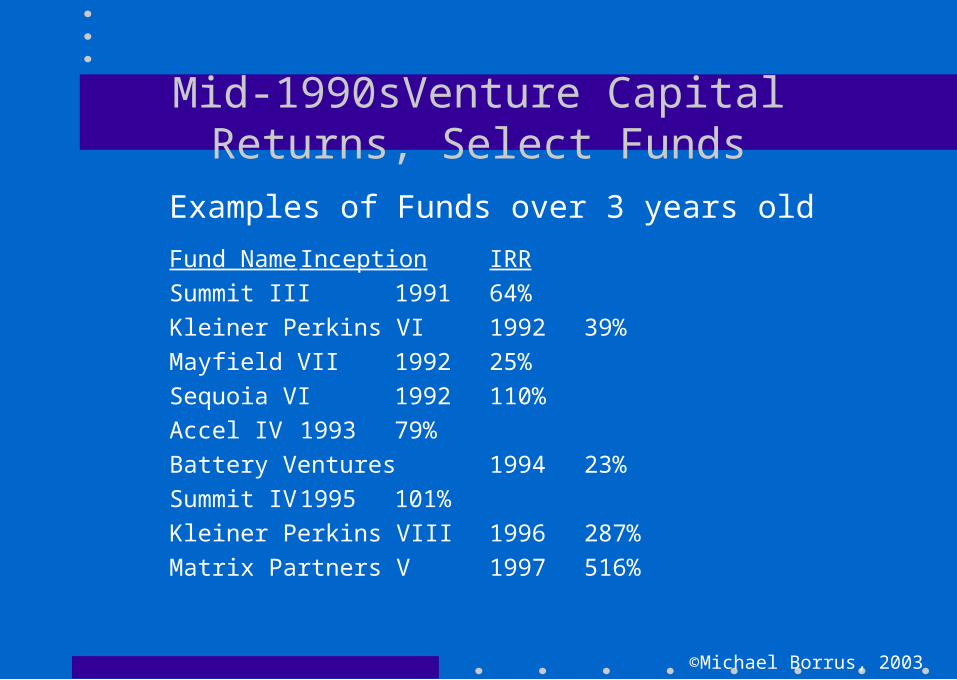
Mid-1990sVenture Capital Returns, Select Funds
Examples of Funds over 3 years old
Fund Name Inception IRR
Summit III 1991 64%
Kleiner Perkins VI 1992 39%
Mayfield VII 1992 25%
Sequoia VI 1992 110%
Accel IV 1993 79%
Battery Ventures 1994 23%
Summit IV 1995 101%
Kleiner Perkins VIII 1996 287%
Matrix Partners V 1997 516%
©Michael Borrus, 2003
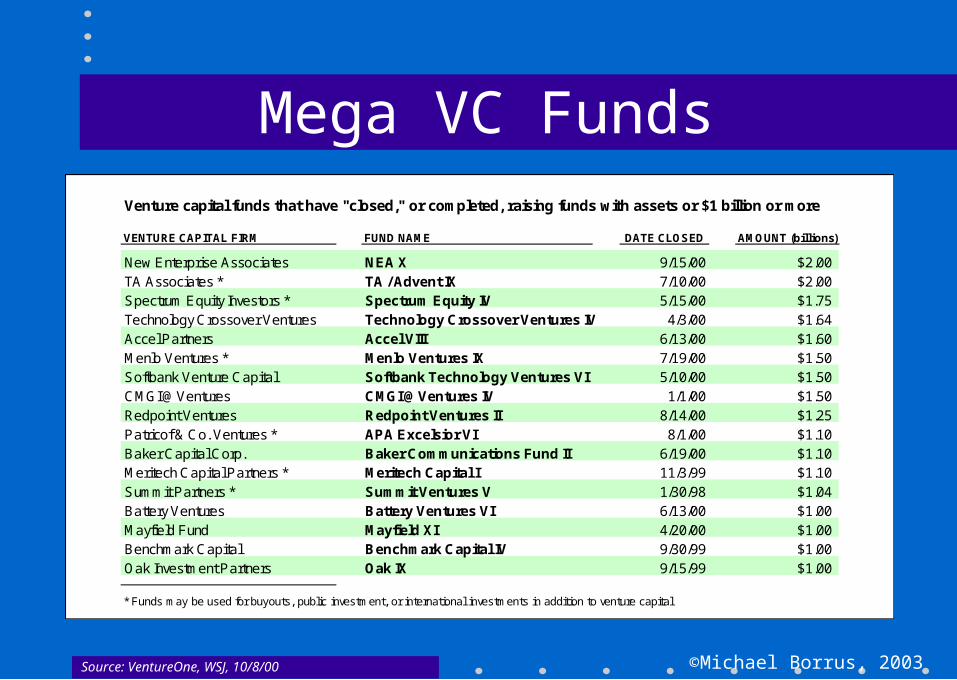
Mega VC Funds
Source: VentureOne, WSJ, 10/8/00
Venture capital funds that have "closed," or completed, raising funds with assets or $1 billion or more
VENTURE CAPITAL FIRM FUND NAME DATE CLOSED AMOUNT (billions)
New Enterprise Associates NEA X 9/15/00 $2.00TA Associates * TA / Advent IX 7/10/00 $2.00Spectrum Equity Investors * Spectrum Equity IV 5/15/00 $1.75Technology Crossover Ventures Technology Crossover Ventures IV 4/3/00 $1.64Accel Partners Accel VIII 6/13/00 $1.60Menlo Ventures * Menlo Ventures IX 7/19/00 $1.50Softbank Venture Capital Softbank Technology Ventures VI 5/10/00 $1.50CMGI @Ventures CMGI @Ventures IV 1/1/00 $1.50Redpoint Ventures Redpoint Ventures II 8/14/00 $1.25Patricof & Co. Ventures * APA Excelsior VI 8/1/00 $1.10Baker Capital Corp. Baker Communications Fund II 6/19/00 $1.10Meritech Capital Partners * Meritech Capital I 11/3/99 $1.10Summit Partners * Summit Ventures V 1/30/98 $1.04Battery Ventures Battery Ventures VI 6/13/00 $1.00Mayfield Fund Mayfield XI 4/20/00 $1.00Benchmark Capital Benchmark Capital IV 9/30/99 $1.00Oak Investment Partners Oak IX 9/15/99 $1.00
* Funds may be used for buyouts, public investment, or international investments in addition to venture capital
©Michael Borrus, 2003
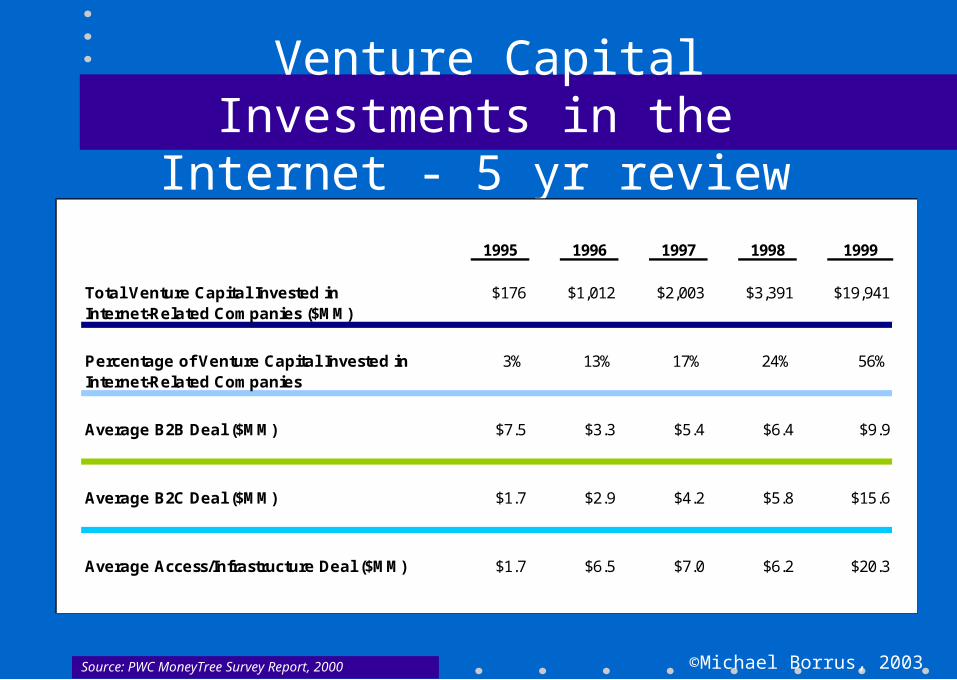
Venture Capital Investments in the Internet - 5 yr review
Source: PWC MoneyTree Survey Report, 2000
1995 1996 1997 1998 1999
Total Venture Capital Invested in $176 $1,012 $2,003 $3,391 $19,941Internet-Related Companies ($MM)
Percentage of Venture Capital Invested in 3% 13% 17% 24% 56%Internet-Related Companies
Average B2B Deal ($MM) $7.5 $3.3 $5.4 $6.4 $9.9
Average B2C Deal ($MM) $1.7 $2.9 $4.2 $5.8 $15.6
Average Access/Infrastructure Deal ($MM) $1.7 $6.5 $7.0 $6.2 $20.3
©Michael Borrus, 2003
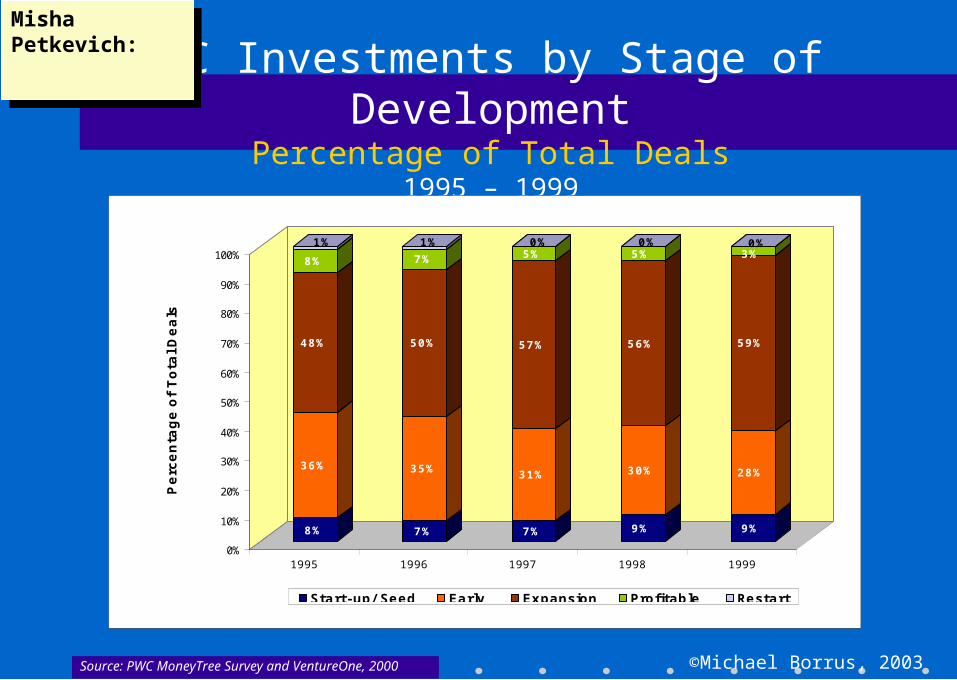
VC Investments by Stage of DevelopmentPercentage of Total Deals
1995 – 1999
Misha Petkevich:Misha Petkevich:
Source: PWC MoneyTree Survey and VentureOne, 2000
8%
36%
48%
8%
1%
7%
35%
50%
7%
1%
7%
31%
57%
5%0%
9%
30%
56%
5%0%
9%
28%
59%
3%0%
0%
10%
20%
30%
40%
50%
60%
70%
80%
90%
100%
Perc
enta
ge o
f Tota
l D
eals
1995 1996 1997 1998 1999
Start-up/ Seed Early Expansion Profitable Restart
©Michael Borrus, 2003
From Capital Market Bubble to Tech Bubble
• Tech spending grew by 2x the ’90-’96 rate from ’97-’00; bandwidth by 130% year on year from ’98-’00
• Unprecedented venture and borrowing activity (next slide) = huge jump in tech spending, esp. comm infrastructure; amplified competitively as older firms responded
• Tech vendors exacerbated by vendor financing and investment in start-ups– Impacts on company financials for quarterly reporting– Compensation impacts
• Self-reinforcing, but ultimately unsustainable tech-capital market cycle
©Michael Borrus, 2003
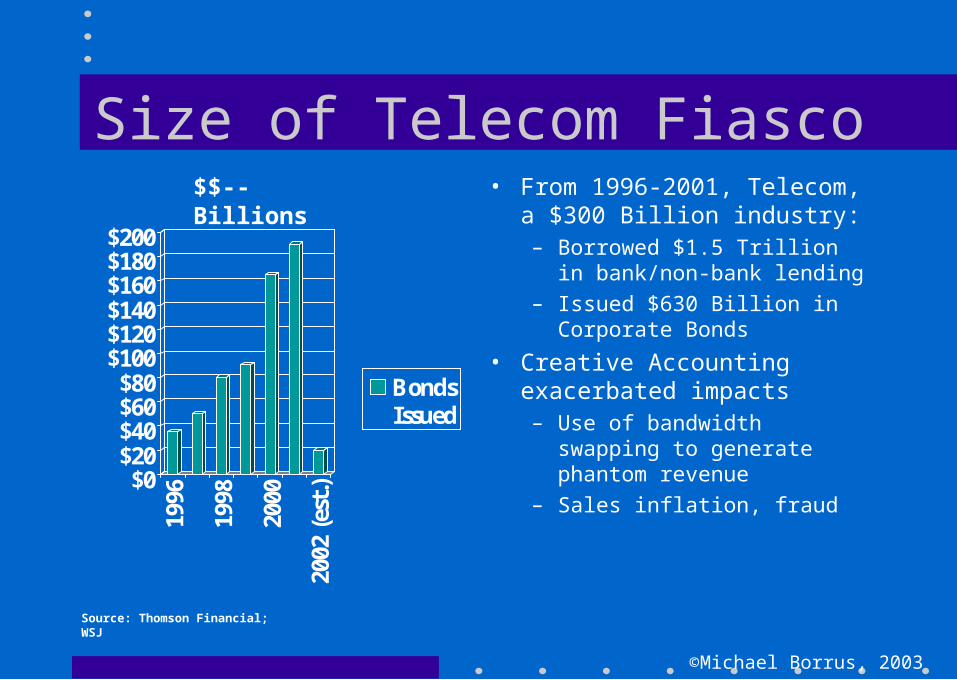
Size of Telecom Fiasco
$0$20$40$60$80
$100$120$140$160$180$200
1996
1998
2000
2002
(es
t.)
BondsIssued
• From 1996-2001, Telecom, a $300 Billion industry:– Borrowed $1.5 Trillion in
bank/non-bank lending
– Issued $630 Billion in Corporate Bonds
• Creative Accounting exacerbated impacts– Use of bandwidth swapping to
generate phantom revenue
– Sales inflation, fraud
$$--Billions
Source: Thomson Financial; WSJ
©Michael Borrus, 2003
• The bursting of the equity market bubble changes everything
• Maybe the New Economy isn’t so New– Amazon and B2C E-tailing – What assumptions were wrong?– B2B – What assumptions were wrong?
• Financial Markets: PROFITS and CASH FLOW, not Marketing hype
• Venture Fund Practice: Conserve Capital– Kill/Dispose of clear losers in existing portfolios– Reinvest to support rest of portfolio
• Pray for recovery
The New New Economy View
©Michael Borrus, 2003
$0
$20,000
$40,000
$60,000
$80,000
$100,000
$120,000
($ in
mill
ion
s)
1995 1996 1997 1998 1999 2000 2001 2002
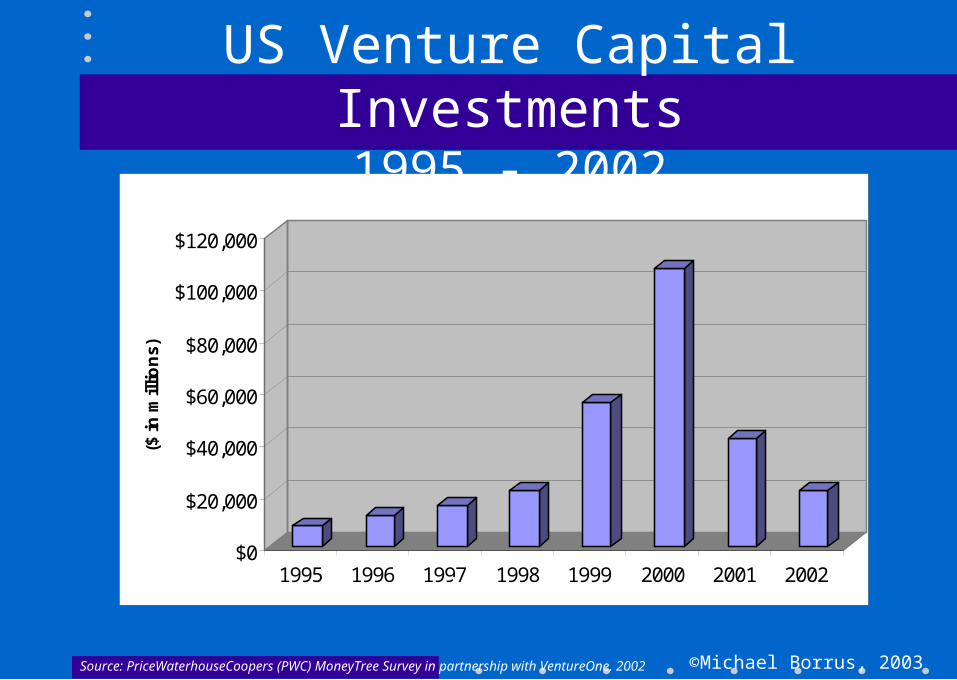
US Venture Capital Investments1995 - 2002
1,840 deals
Source: PriceWaterhouseCoopers (PWC) MoneyTree Survey in partnership with VentureOne, 2002
©Michael Borrus, 2003
$0
$5
$10
$15
$20
$25
$30
($ in
Billio
ns
)
1995Q1
1995Q4
1996Q3
1997Q2
1998Q1
1998Q4
1999Q3
2000Q2
2001Q1
2001Q4
2002Q3
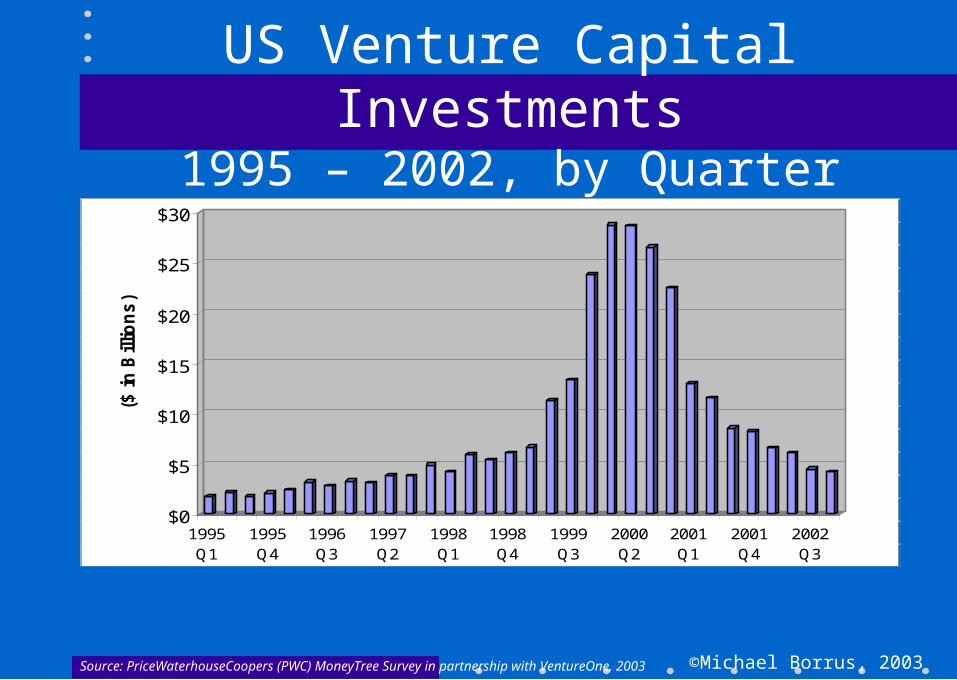
US Venture Capital Investments1995 – 2002, by Quarter
Source: PriceWaterhouseCoopers (PWC) MoneyTree Survey in partnership with VentureOne, 2003
©Michael Borrus, 2003
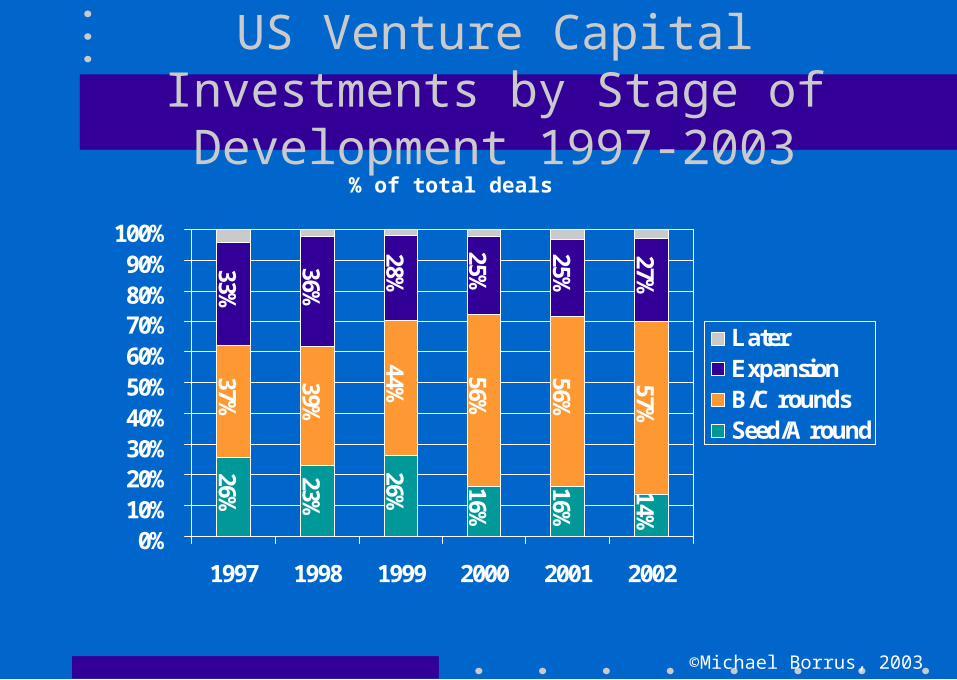
US Venture Capital Investments by Stage of Development 1997-2003
26%
23%
26% 16%
16%
14%
37%
39%
44% 56%
56%
57%
33%
36%
28%
25%
25%
27%
0%10%20%30%40%50%60%70%80%90%
100%
1997 1998 1999 2000 2001 2002
LaterExpansionB/C roundsSeed/A round
% of total deals
©Michael Borrus, 2003
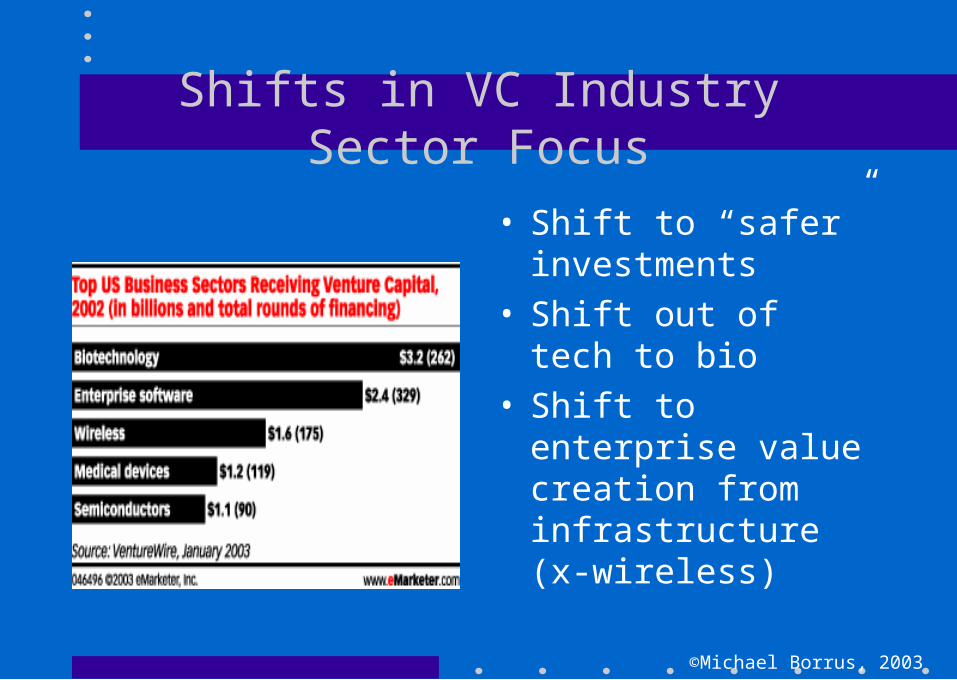
Shifts in VC Industry Sector Focus
• Shift to “safer” investments
• Shift out of tech to bio• Shift to enterprise
value creation from infrastructure (x-wireless)
©Michael Borrus, 2003
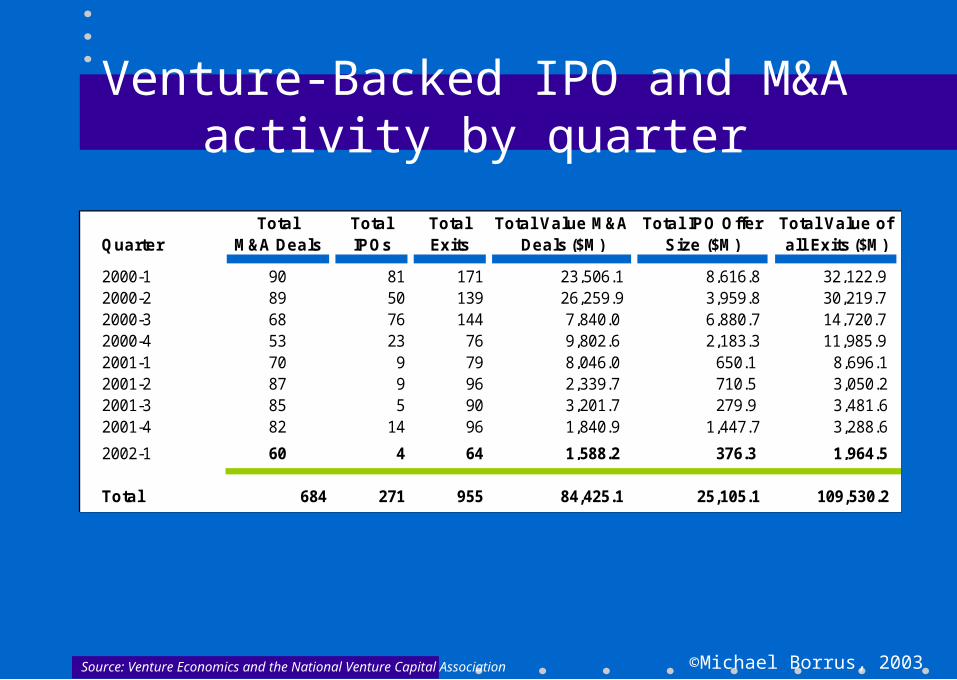
Venture-Backed IPO and M&A activity by quarter
Source: Venture Economics and the National Venture Capital Association
Quarter
2000-1 90 81 171 23,506.1 8,616.8 32,122.9 2000-2 89 50 139 26,259.9 3,959.8 30,219.7 2000-3 68 76 144 7,840.0 6,880.7 14,720.7 2000-4 53 23 76 9,802.6 2,183.3 11,985.9 2001-1 70 9 79 8,046.0 650.1 8,696.1 2001-2 87 9 96 2,339.7 710.5 3,050.2 2001-3 85 5 90 3,201.7 279.9 3,481.6 2001-4 82 14 96 1,840.9 1,447.7 3,288.6
2002-1 60 4 64 1,588.2 376.3 1,964.5
Total 684 271 955 84,425.1 25,105.1 109,530.2
Total IPO Offer Size ($M)
Total Value of all Exits ($M)
Total M&A Deals
Total IPOs
Total Exits
Total Value M&A Deals ($M)
©Michael Borrus, 2003
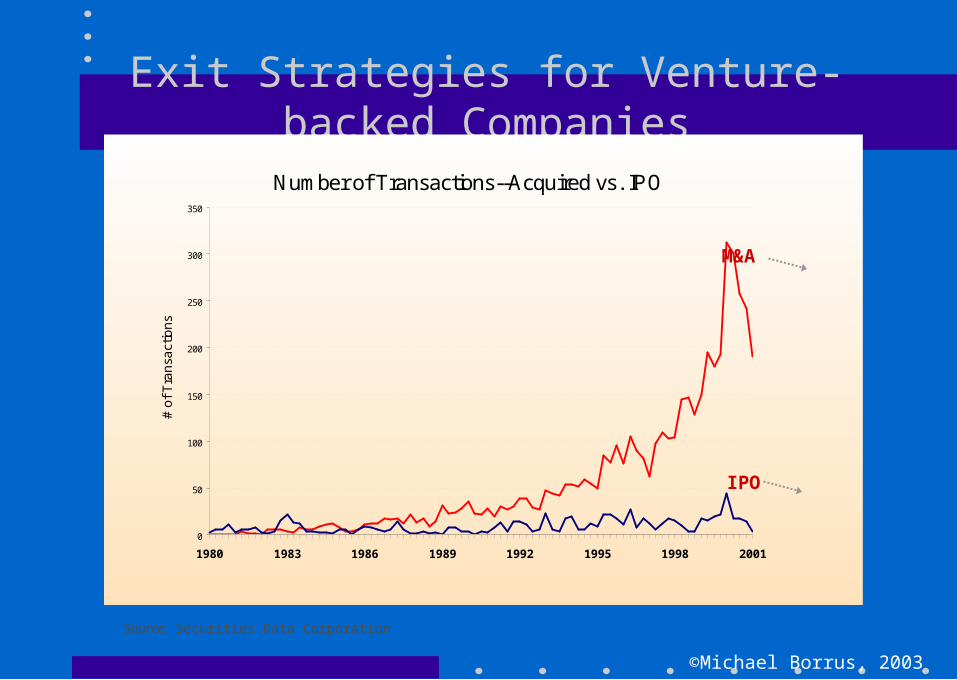
Exit Strategies for Venture-backed Companies
Number of Transactions--Acquired vs. IPO
0
50
100
150
200
250
300
350
1980 1983 1986 1989 1992 1995 1998 2001
# o
f T
ran
sact
ion
s
M&A
IPO
Source: Securities Data Corporation
©Michael Borrus, 2003
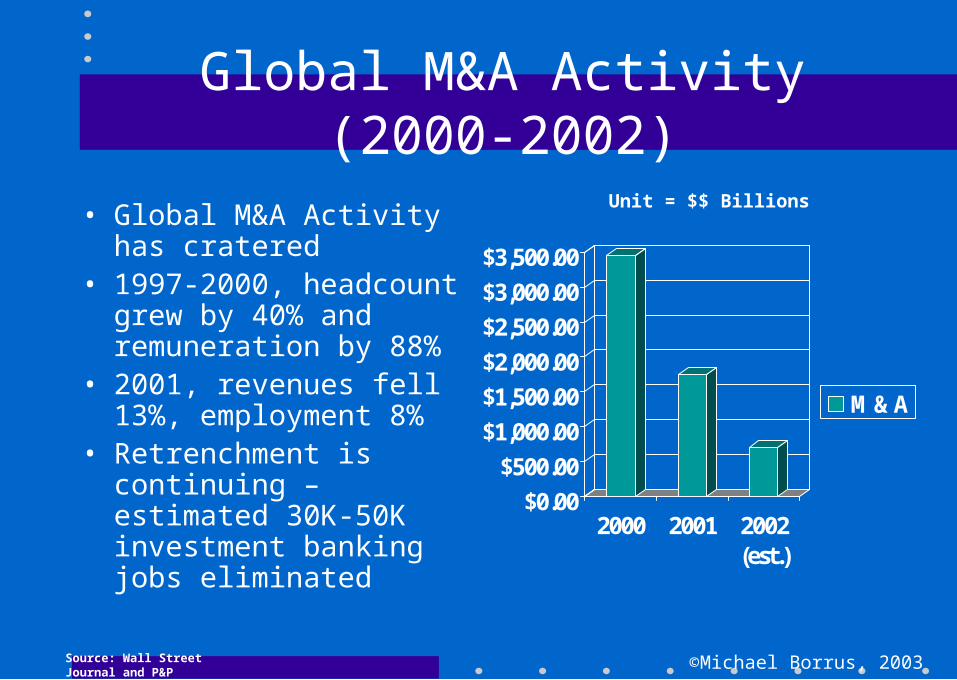
Global M&A Activity(2000-2002)
• Global M&A Activity has cratered
• 1997-2000, headcount grew by 40% and remuneration by 88%
• 2001, revenues fell 13%, employment 8%
• Retrenchment is continuing – estimated 30K-50K investment banking jobs eliminated
$0.00
$500.00
$1,000.00
$1,500.00
$2,000.00
$2,500.00
$3,000.00
$3,500.00
2000 2001 2002(est.)
M&A
Unit = $$ Billions
Source: Wall Street Journal and P&P estimates
©Michael Borrus, 2003
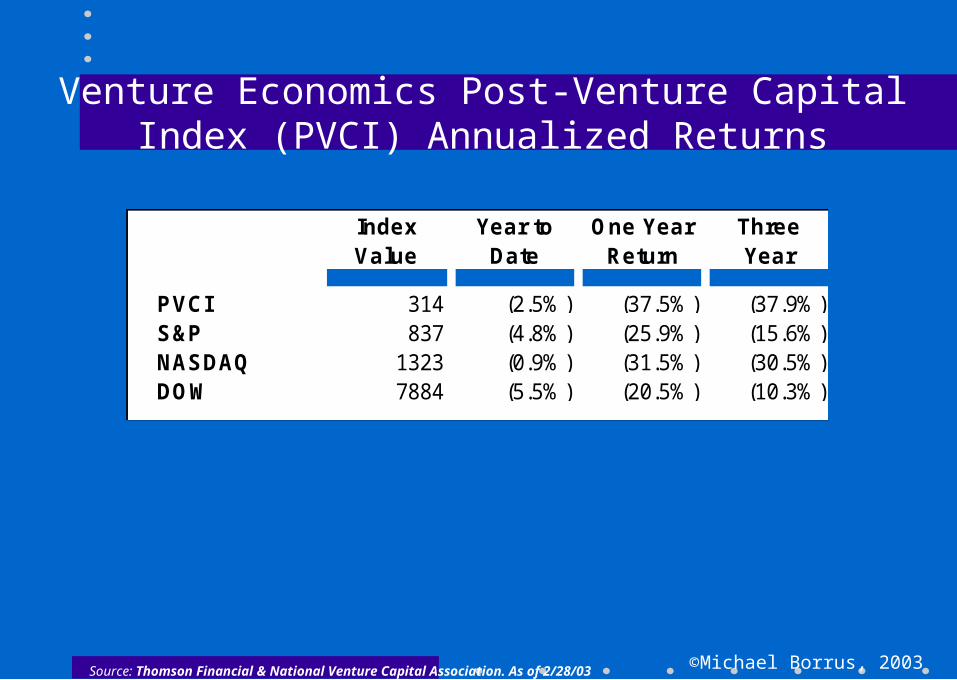
Venture Economics Post-Venture Capital Index (PVCI) Annualized Returns
Source: Thomson Financial & National Venture Capital Association. As of 2/28/03
PVCI 314 (2.5%) (37.5%) (37.9%)S&P 837 (4.8%) (25.9%) (15.6%)NASDAQ 1323 (0.9%) (31.5%) (30.5%)DOW 7884 (5.5%) (20.5%) (10.3%)
Index Value
Year to Date
One Year Return
Three Year
©Michael Borrus, 2003
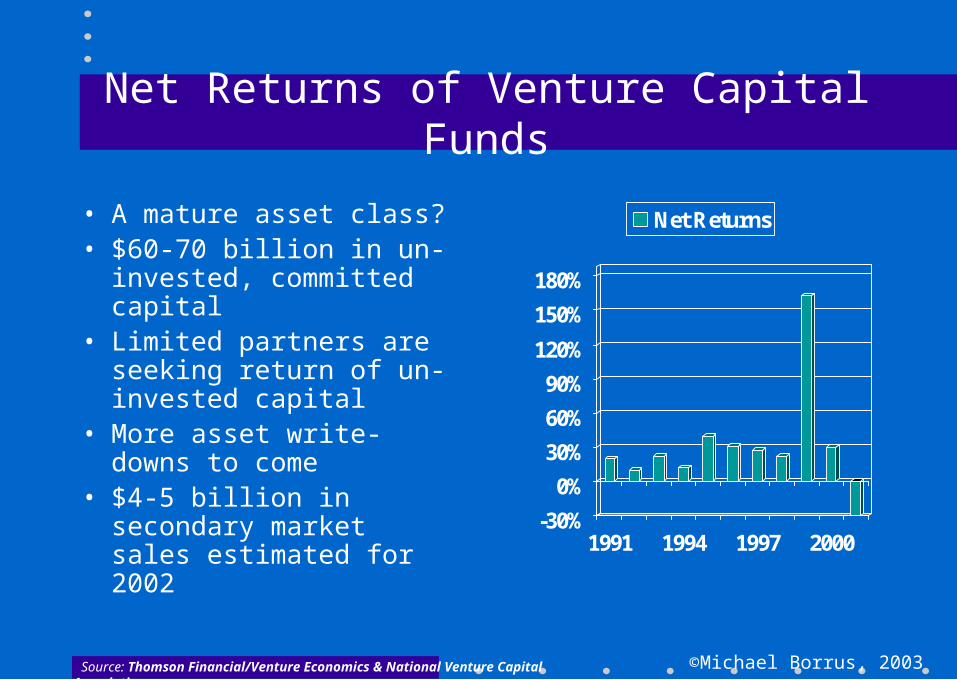
Net Returns of Venture Capital Funds
• A mature asset class?• $60-70 billion in un-
invested, committed capital• Limited partners are seeking
return of un-invested capital • More asset write-downs to
come• $4-5 billion in secondary
market sales estimated for 2002
-30%
0%
30%
60%
90%
120%
150%
180%
1991 1994 1997 2000
Net Returns
Source: Thomson Financial/Venture Economics & National Venture Capital Association
©Michael Borrus, 2003
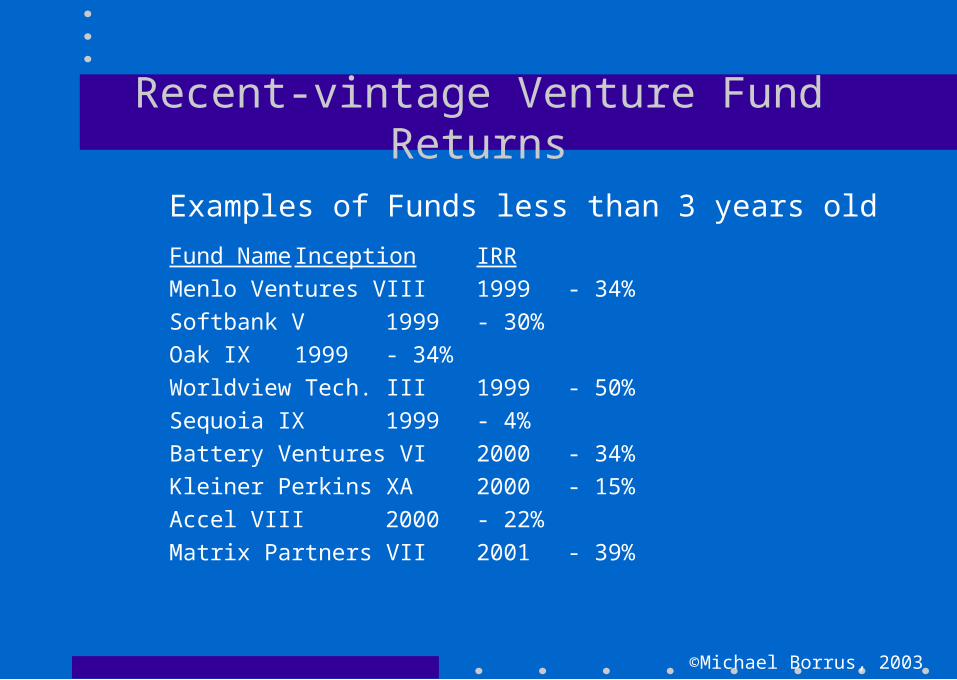
Recent-vintage Venture Fund Returns
Examples of Funds less than 3 years old
Fund Name Inception IRR
Menlo Ventures VIII 1999 - 34%
Softbank V 1999 - 30%
Oak IX 1999 - 34%
Worldview Tech. III 1999 - 50%
Sequoia IX 1999 - 4%
Battery Ventures VI 2000 - 34%
Kleiner Perkins XA 2000 - 15%
Accel VIII 2000 - 22%
Matrix Partners VII 2001 - 39%
©Michael Borrus, 2003
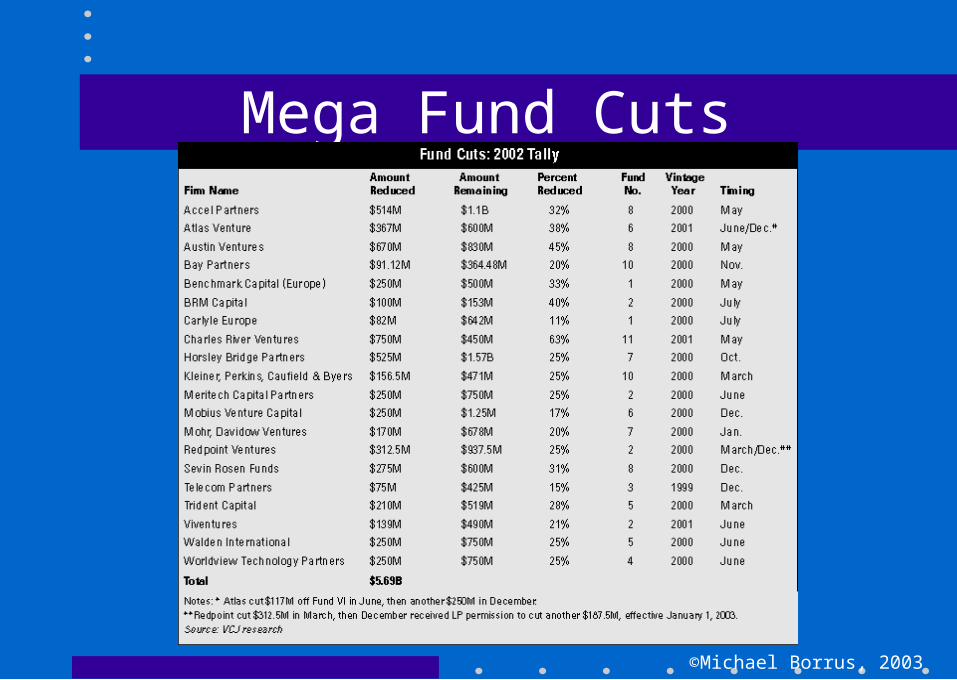
Mega Fund Cuts
©Michael Borrus, 2003
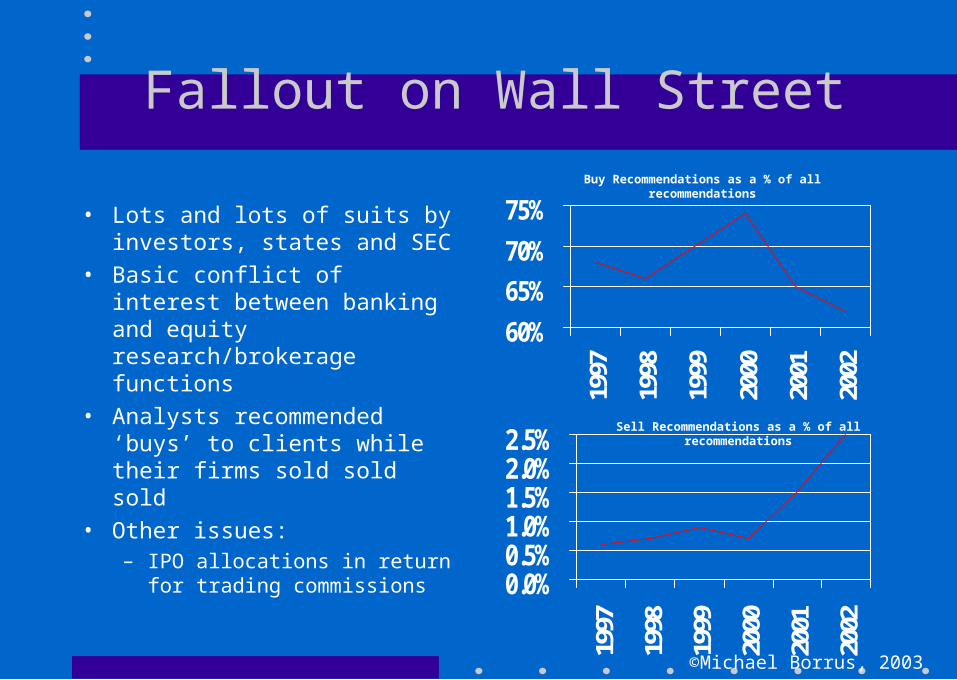
Fallout on Wall Street
• Lots and lots of suits by investors, states and SEC
• Basic conflict of interest between banking and equity research/brokerage functions
• Analysts recommended ‘buys’ to clients while their firms sold sold sold
• Other issues:– IPO allocations in return for
trading commissions
60%
65%
70%
75%
1997
1998
1999
2000
2001
2002
0.0%0.5%1.0%1.5%2.0%2.5%
1997
1998
1999
2000
2001
2002
Buy Recommendations as a % of all recommendations
Sell Recommendations as a % of all recommendations
©Michael Borrus, 2003
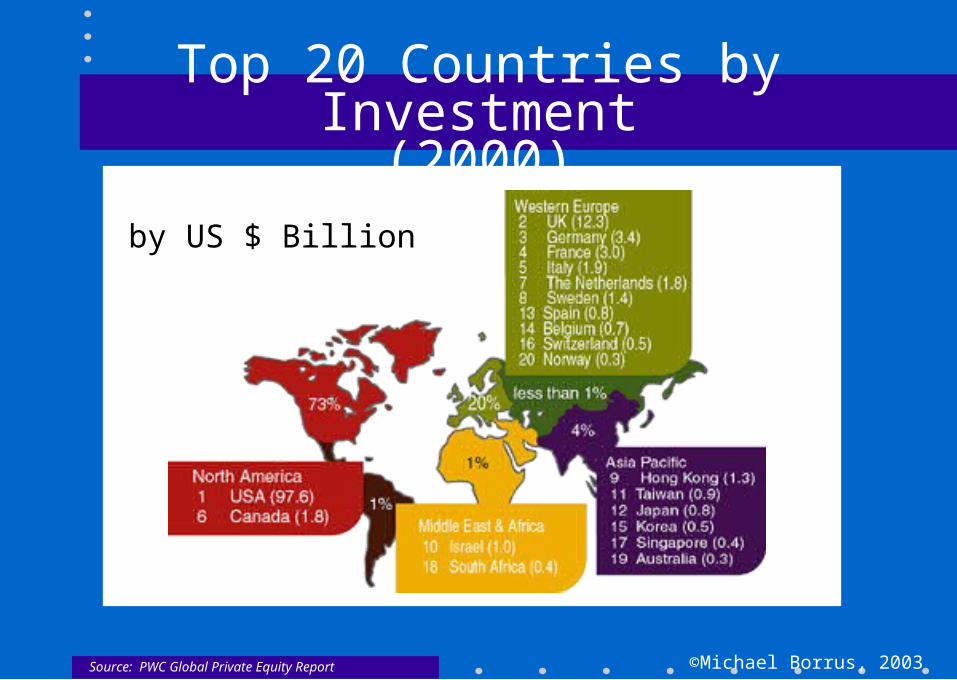
Top 20 Countries by Investment(2000)
Source: PWC Global Private Equity Report
by US $ Billion
©Michael Borrus, 2003
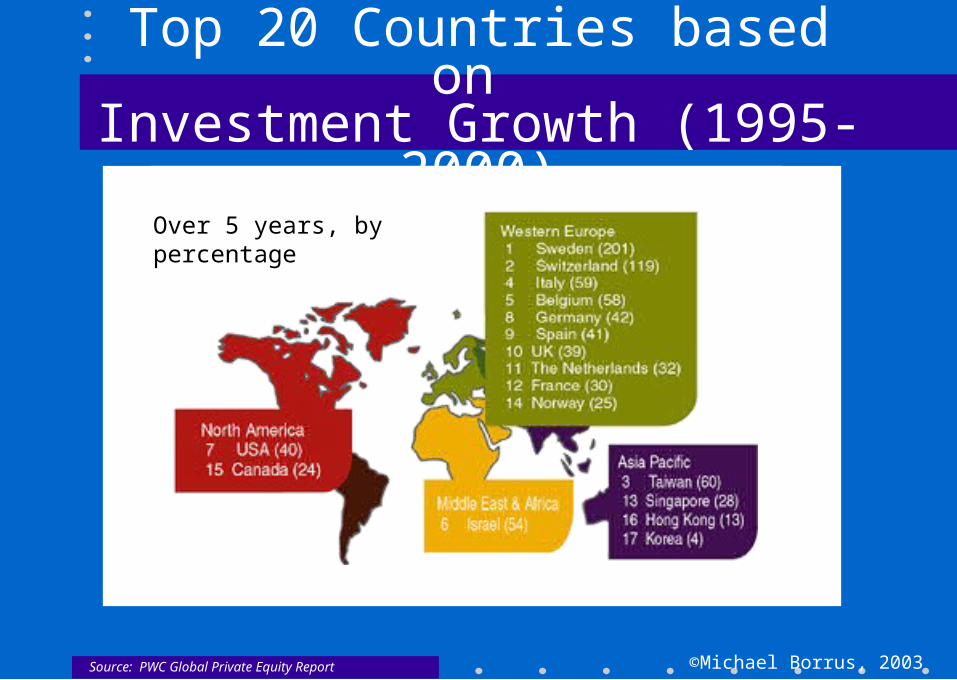
Top 20 Countries based on Investment Growth (1995-2000)
Source: PWC Global Private Equity Report
Over 5 years, by percentage
©Michael Borrus, 2003
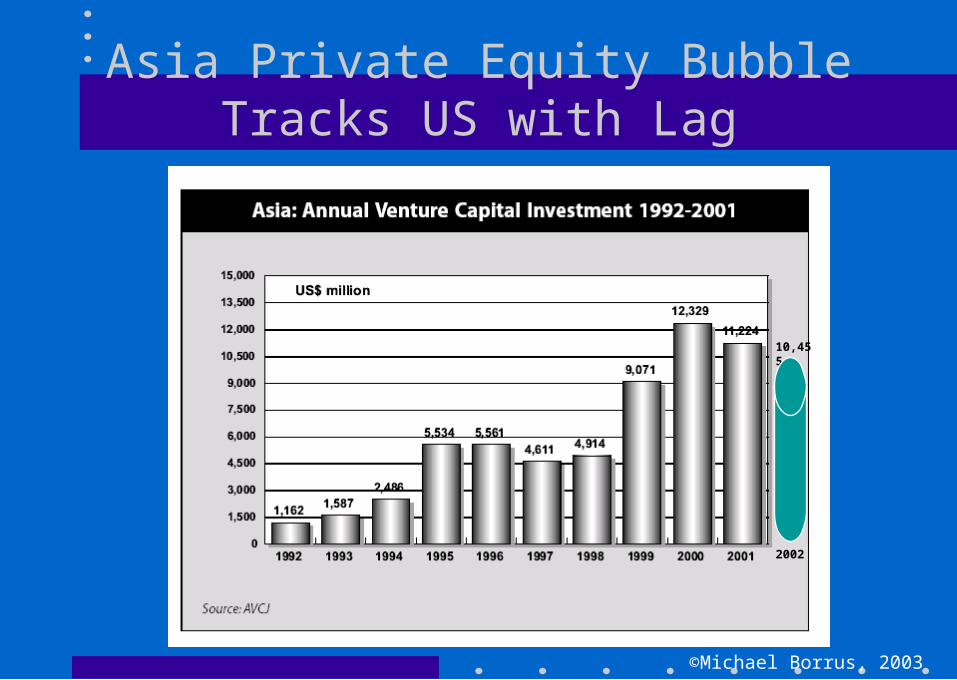
Asia Private Equity Bubble Tracks US with Lag
10,455
2002
©Michael Borrus, 2003
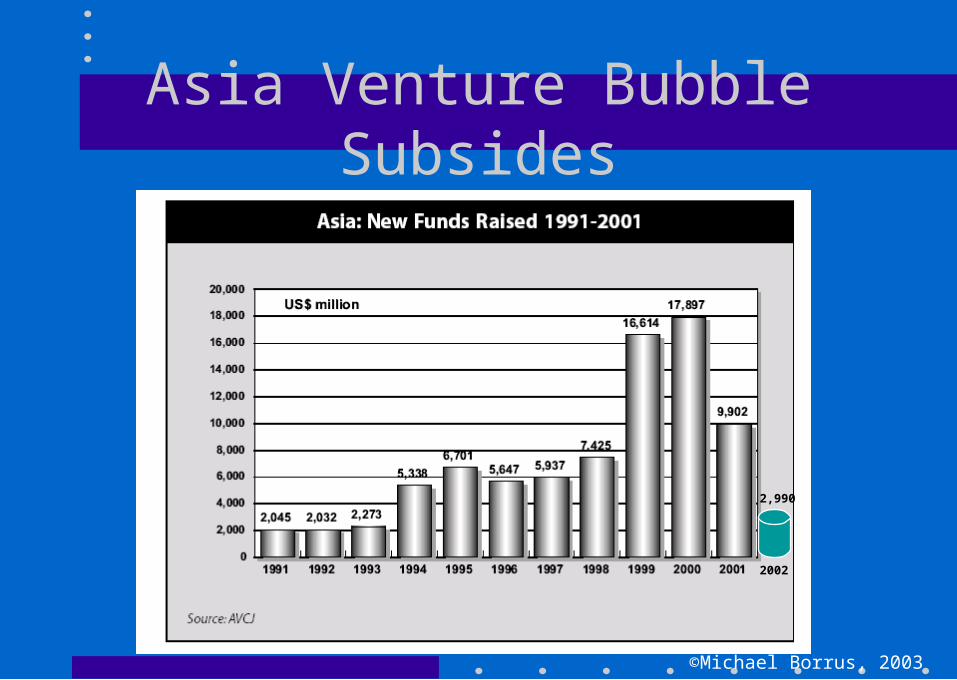
Asia Venture Bubble Subsides
2002
2,990
©Michael Borrus, 2003
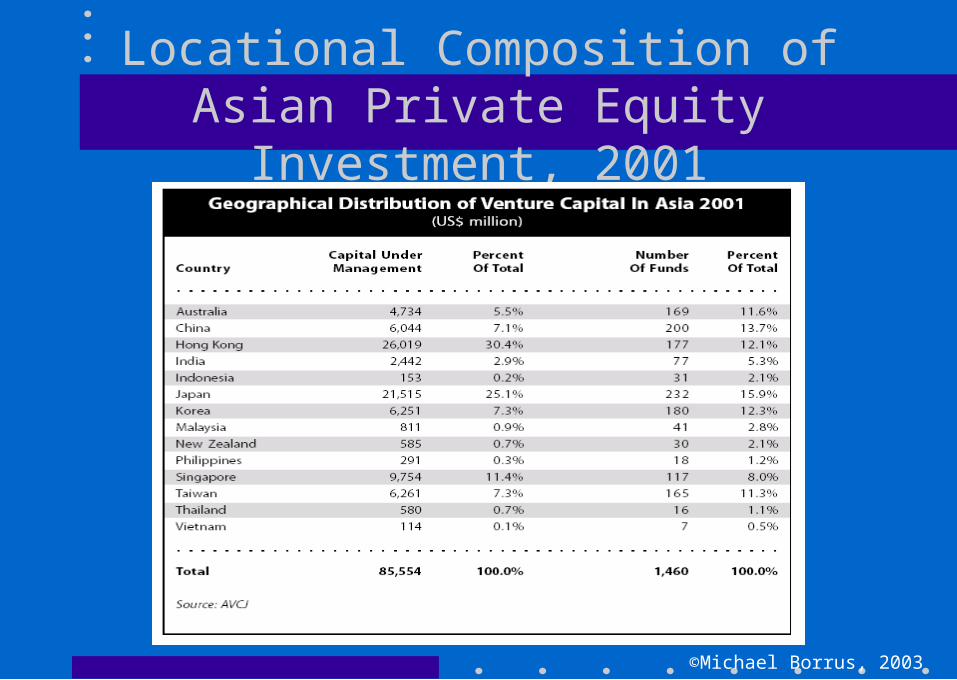
Locational Composition of Asian Private Equity Investment, 2001
©Michael Borrus, 2003
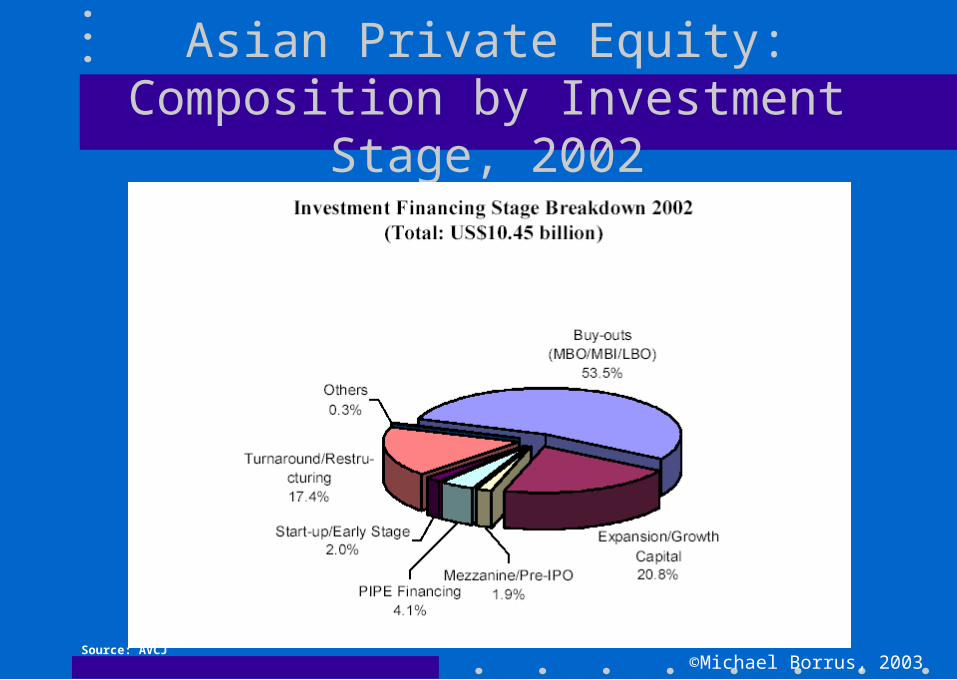
Asian Private Equity: Composition by Investment Stage, 2002
Source: AVCJ
©Michael Borrus, 2003
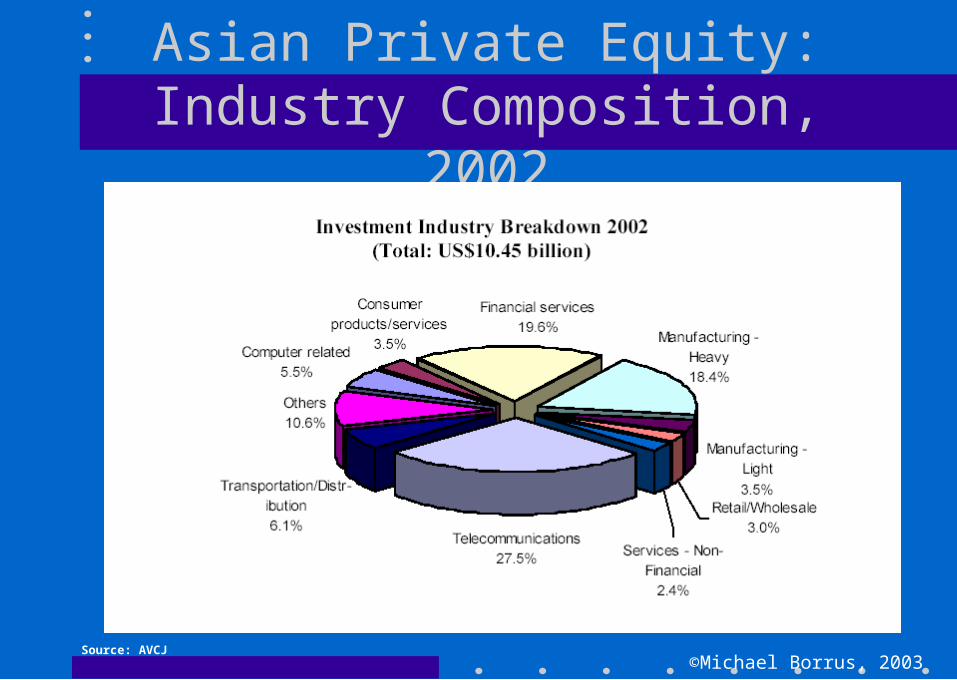
Asian Private Equity: Industry Composition, 2002
Source: AVCJ
©Michael Borrus, 2003
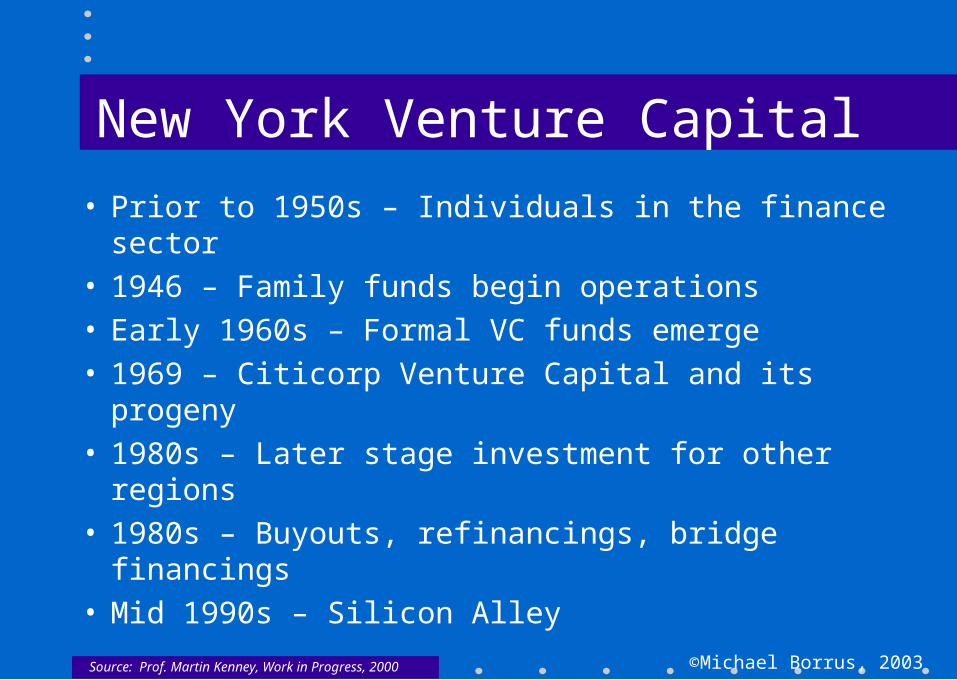
New York Venture Capital
• Prior to 1950s – Individuals in the finance sector• 1946 – Family funds begin operations• Early 1960s – Formal VC funds emerge• 1969 – Citicorp Venture Capital and its progeny • 1980s – Later stage investment for other regions• 1980s – Buyouts, refinancings, bridge financings• Mid 1990s – Silicon Alley
Source: Prof. Martin Kenney, Work in Progress, 2000
©Michael Borrus, 2003
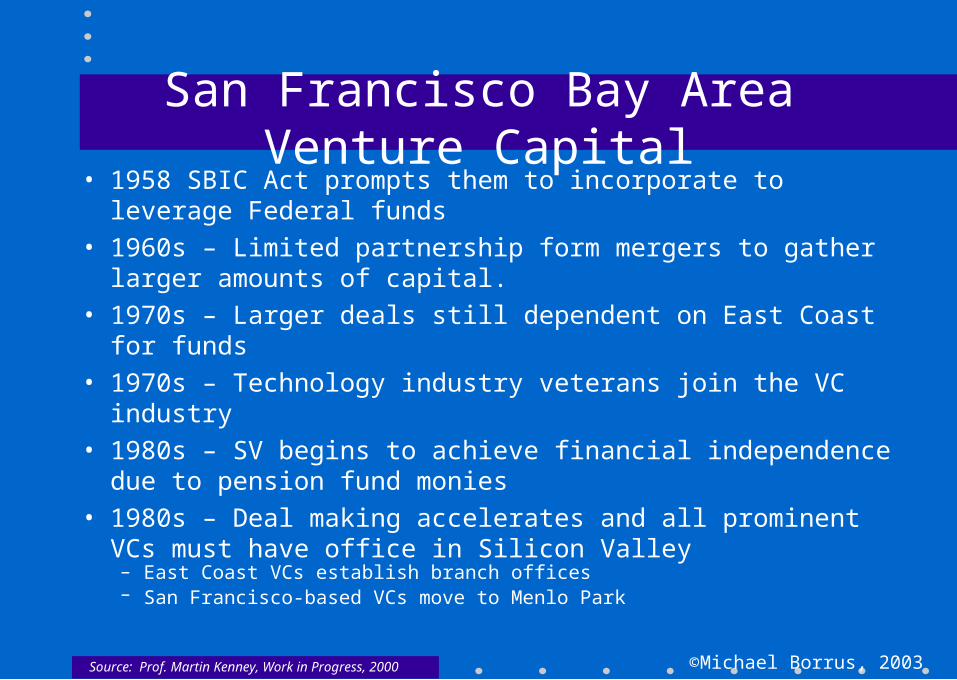
San Francisco Bay Area Venture Capital• 1958 SBIC Act prompts them to incorporate to leverage
Federal funds
• 1960s – Limited partnership form mergers to gather larger amounts of capital.
• 1970s – Larger deals still dependent on East Coast for funds
• 1970s – Technology industry veterans join the VC industry
• 1980s – SV begins to achieve financial independence due to pension fund monies
• 1980s – Deal making accelerates and all prominent VCs must have office in Silicon Valley
– East Coast VCs establish branch offices– San Francisco-based VCs move to Menlo Park
Source: Prof. Martin Kenney, Work in Progress, 2000
©Michael Borrus, 2003
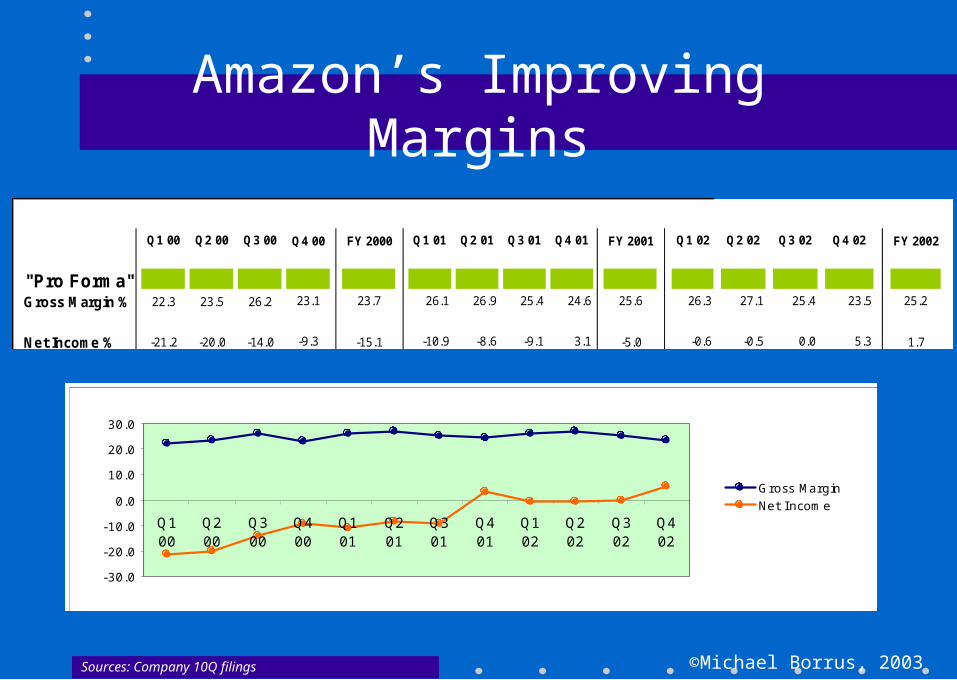
Amazon’s Improving Margins
Sources: Company 10Q filings
Q1 00 Q2 00 Q3 00 Q4 00 FY 2000 Q1 01 Q2 01 Q3 01 Q4 01 FY 2001 Q1 02 Q2 02 Q3 02 Q4 02 FY 2002
"Pro Forma"Gross Margin % 22.3 23.5 26.2 23.1 23.7 26.1 26.9 25.4 24.6 25.6 26.3 27.1 25.4 23.5 25.2
Net Income % -21.2 -20.0 -14.0 -9.3 -15.1 -10.9 -8.6 -9.1 3.1 -5.0 -0.6 -0.5 0.0 5.3 1.7
-30.0
-20.0
-10.0
0.0
10.0
20.0
30.0
Q100
Q200
Q300
Q400
Q101
Q201
Q301
Q401
Q102
Q202
Q302
Q402
Gross MarginNet I ncome
©Michael Borrus, 2003
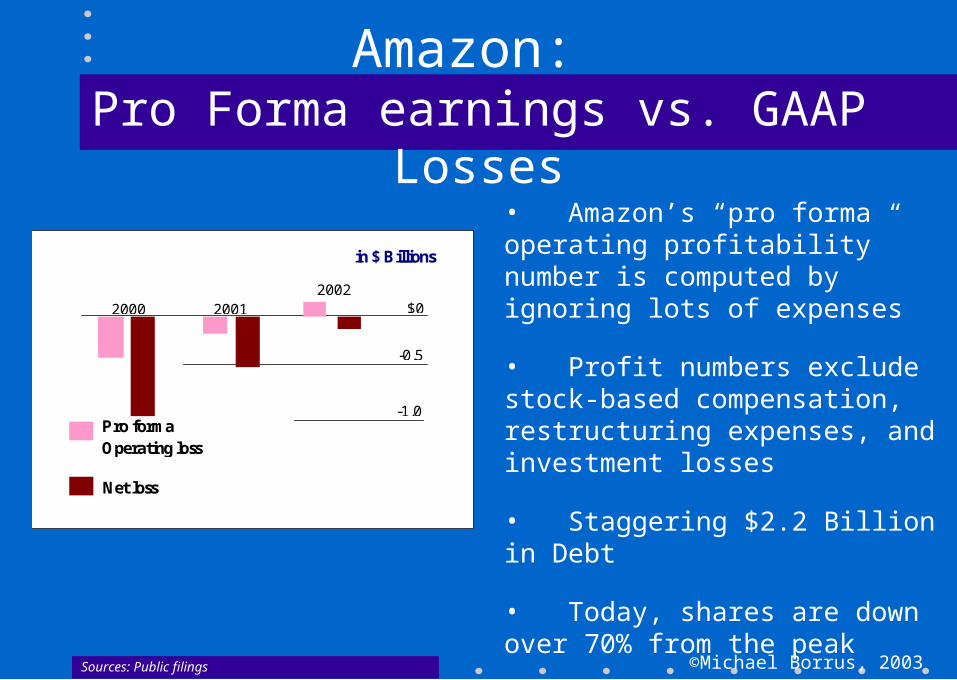
Amazon: Pro Forma earnings vs. GAAP Losses
Sources: Public filings
• Amazon’s “pro forma operating profitability” number is computed by ignoring lots of expenses
• Profit numbers exclude stock-based compensation, restructuring expenses, and investment losses
• Staggering $2.2 Billion in Debt
• Today, shares are down over 70% from the peak
2000 20012002
$0
-0.5
-1.0
in $ Billions
Pro forma Operating loss
Net loss
©Michael Borrus, 2003
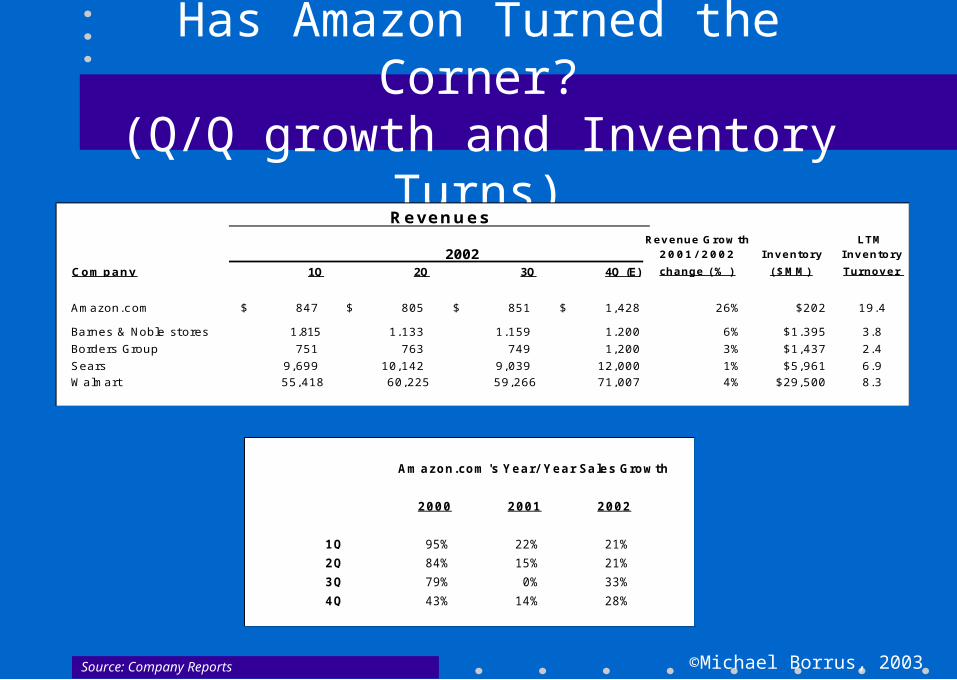
Has Amazon Turned the Corner?(Q/Q growth and Inventory Turns)
Source: Company Reports
Amazon.com's Year/ Year Sales Growth
2000 2001 2002
1Q 95% 22% 21%
2Q 84% 15% 21%
3Q 79% 0% 33%
4Q 43% 14% 28%
Revenue Growth LTM 2002 2001/ 2002 Inventory Inventory
Company 1Q 2Q 3Q 4Q (E) change (% ) ($MM) Turnover
Amazon.com 847$ 805$ 851$ $ 1,428 26% $202 19.4
Barnes & Noble stores 1,815 1,133 1,159 1,200 6% $1,395 3.8
Borders Group 751 763 749 1,200 3% $1,437 2.4
Sears 9,699 10,142 9,039 12,000 1% $5,961 6.9
Walmart 55,418 60,225 59,266 71,007 4% $29,500 8.3
Revenues
©Michael Borrus, 2003
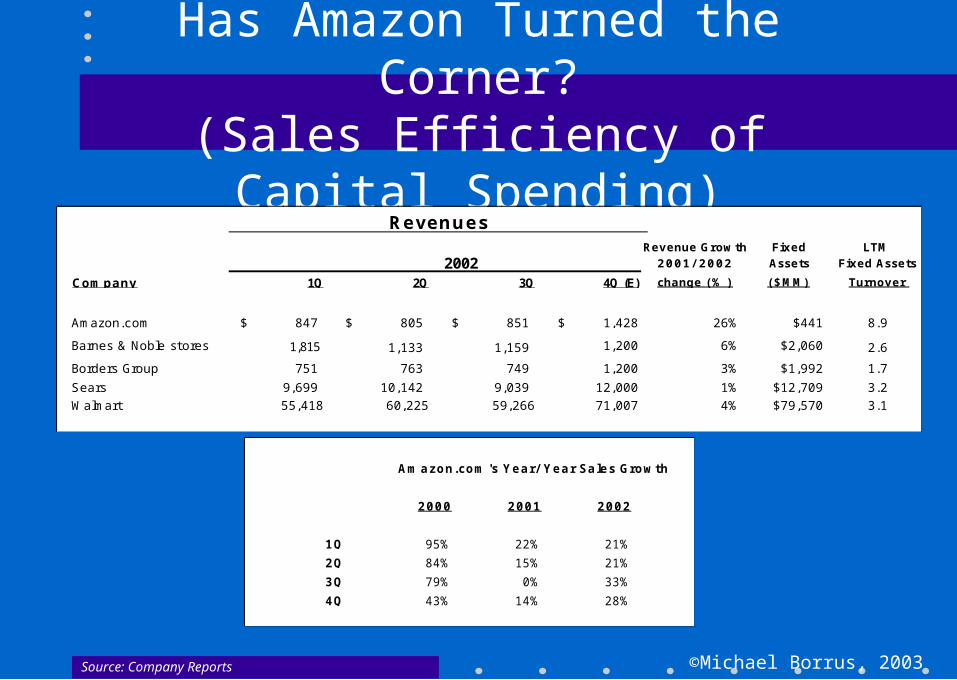
Has Amazon Turned the Corner?(Sales Efficiency of Capital Spending)
Source: Company Reports
Amazon.com's Year/ Year Sales Growth
2000 2001 2002
1Q 95% 22% 21%
2Q 84% 15% 21%
3Q 79% 0% 33%
4Q 43% 14% 28%
Revenue Growth Fixed LTM 2002 2001/ 2002 Assets Fixed Assets
Company 1Q 2Q 3Q 4Q (E) change (% ) ($MM) Turnover
Amazon.com 847$ 805$ 851$ $ 1,428 26% $441 8.9
Barnes & Noble stores 1,815 1,133 1,159 1,200 6% $2,060 2.6
Borders Group 751 763 749 1,200 3% $1,992 1.7
Sears 9,699 10,142 9,039 12,000 1% $12,709 3.2
Walmart 55,418 60,225 59,266 71,007 4% $79,570 3.1
Revenues