miami-dade county industry updates
TRANSCRIPT
© 2021 Expedia, Inc, an Expedia Group Company. All rights reserved. Confidential and proprietary
1
Andrew WobensmithDirector – Research & Business Intelligence
Miami-Dade County Industry UpdatesOctober 27, 2021

© 2021 Expedia, Inc, an Expedia Group Company. All rights reserved. Confidential and proprietary
Miami-Dade County Daily Recovery Indexes
2
VS. 2019 (7 day rolling average)Saturday, October 17, 2020 Saturday, October 16, 2021
Air Travel – MIA passengers 32.5 94.8Hotel – rooms sold 54.2 92.7Dining – in-house seated dining 70.7 115.3Cruise – PortMiami passengers 0.0 25.2*
January 1 – , October 16, 2021
Sources: MIA, STR, Open Table, PortMiami *as of Oct 4, 2021

© 2021 Expedia, Inc, an Expedia Group Company. All rights reserved. Confidential and proprietary
Miami International Airport#1 in USA for International passenger volume
3
2021 vs. 2019 Air Travel Recovery Index – MIA & Total USA
Sources: MIA, TSA
MIA % Domestic / InternationalDate Domestic International
Oct 1, 2021 66% 34%Oct 1, 2020 71% 29%
10.0
20.0
30.0
40.0
50.0
60.0
70.0
80.0
90.0
100.0
Air Travel Recovery - MIA & Total USA
MIA USA
© 2021 Expedia, Inc, an Expedia Group Company. All rights reserved. Confidential and proprietary
4
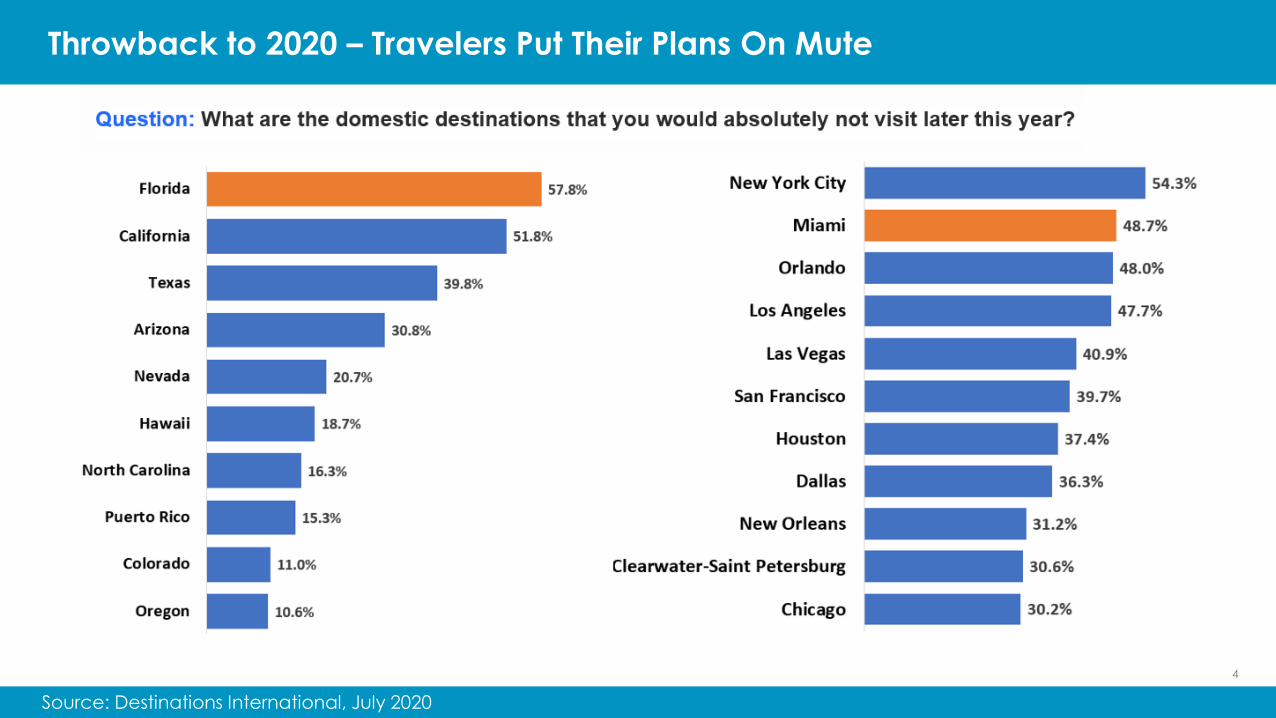
Throwback to 2020 – Travelers Put Their Plans On Mute
Source: Destinations International, July 2020

© 2021 Expedia, Inc, an Expedia Group Company. All rights reserved. Confidential and proprietary
5
Throwback to 2020
Source: Destinations International, Twitter - July 2020

© 2021 Expedia, Inc, an Expedia Group Company. All rights reserved. Confidential and proprietary
6
Throwback to 2020
Source: Ipsos, Summer 2020
Agree/Disagree: I will go back to doing all of the things I did before, including vacations and travel.% Agree (Top 2 Box)

© 2021 Expedia, Inc, an Expedia Group Company. All rights reserved. Confidential and proprietary
Engine Group Insights – October 20th, 27th
Confidence is returning as fear of COVID-19 subsides.74% said they can’t wait to go back to places like movie theaters, shopping centers, restaurants, hotels, concertsand sporting events as often as they used to.
However, there is some growing concern around the present economic impacts of inflation and supply chain woes,with an increasing concern over their pocketbooks for the upcoming holiday season.
National Consumer Sentiment
7
One year ago TodayIndoor arena (sports, concerts) 29% 60%Indoor restaurant 45% 57%Outdoor arena (sports, concerts) 19% 49%
Longwoods, Traveler Survey – October 19th
Traveler confidence is improving to levels not seen since the beginning of summer.
When asked about hesitations that are preventing them from traveling, top reasons are 1) fear of COVID-19 and 2)uncertainty about their financial situation (may point to a more price-sensitive traveler in 2022)
48% of American travelers are changing their plans due to the pandemic (-5 points in just two weeks)58% now support welcoming visitors back into their communities (+10 points in just two weeks)67% now feel safe travelling outside their communities (+10 points in two weeks)70% now feel safe shopping and dining locally… (+12 points in two weeks)

© 2021 Expedia, Inc, an Expedia Group Company. All rights reserved. Confidential and proprietary
How Wrong Were They? 2021 Miami-Dade County - Forecasted Hotel Performance vs Actual
8
OccupancyQuarter Forecast (Q3 2020) Actual (Q1-Q3 2021) + - DifferenceQ1 2021 45.0% 64.1% +19.1%Q2 2021 51.3% 72.9% +21.6%Q3 2021 53.6% 61.3% +7.7%
Room RateQuarter Forecast (Q3 2020) Actual (Q1-Q3 2021) DifferenceQ1 2021 $179.39 $217.23 +$37.84Q2 2021 $139.81 $230.14 +$90.33Q3 2021 $118.64 $191.69 +$73.05
Revenue Per Available RoomQuarter Forecast (Q3 2020) Actual (Q1-Q3 2021) DifferenceQ1 2021 $80.64 $139.24 +$58.61Q2 2021 $71.70 $167.77 +$96.07Q3 2021 $63.62 $117.51 +$53.89
Total Room RevenueQuarter Forecast (Q3 2020) Actual (Q1-Q3 2021) DifferenceQ1 2021 $433,700,000 $765,500,000 +$331,800,000Q2 2021 $394,900,000 $939,300,000 +$544,400,000Q3 2021 $355,000,000 $681,700,000 +$326,700,000
Source: STR Q3 2020, September 2021
© 2021 Expedia, Inc, an Expedia Group Company. All rights reserved. Confidential and proprietary
9
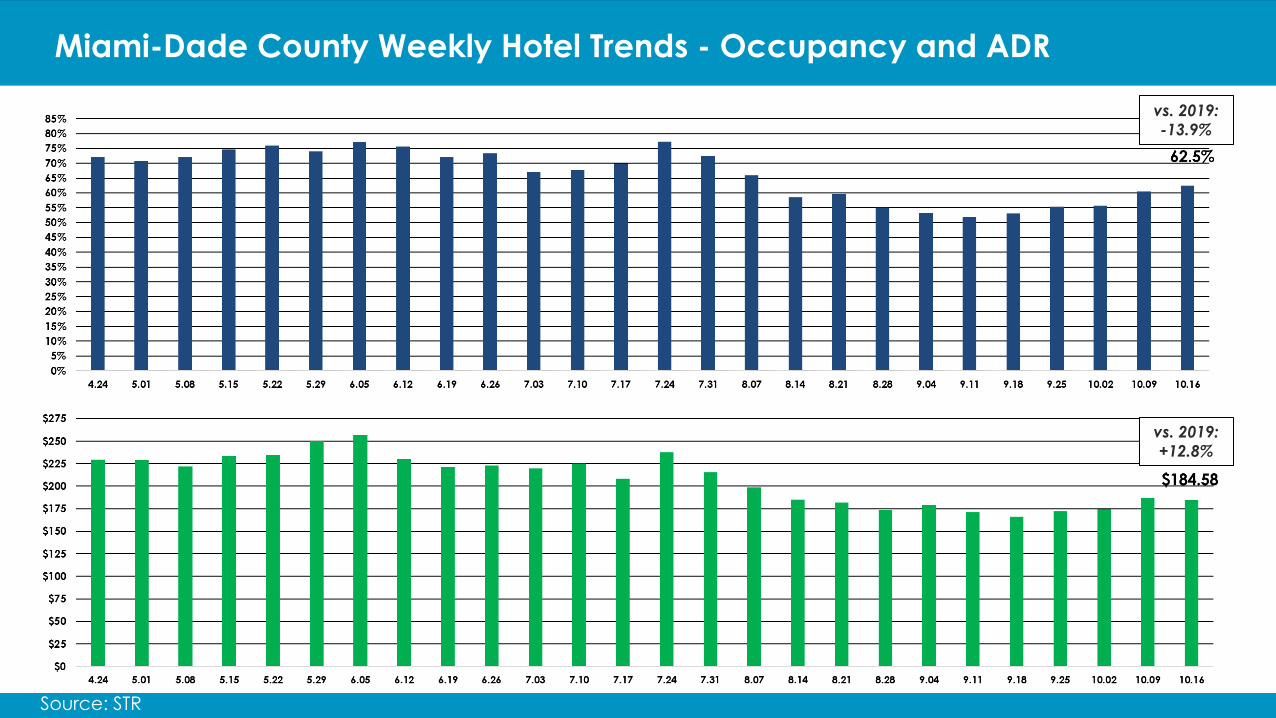
Miami-Dade County Weekly Hotel Trends - Occupancy and ADR
Source: STR
vs. 2019:-13.9%
vs. 2019:+12.8%

© 2021 Expedia, Inc, an Expedia Group Company. All rights reserved. Confidential and proprietary
Travel Restrictions To Be Lifted
10
With the easing of U.S. travel restrictions and scheduled route expansions by some airlines, Miami International Airport (MIA) expects its traffic to increase considerably in November, after registering a brutal 50% drop in foreign passengers due to the COVID-19 pandemic.
The increase in traffic is expected when the government begins allowing vaccinated citizens from at least 39 countries to enter the United States for the first time since early 2020 when the pandemic broke out, according to an MIA statement.
Six of those countries were among the MIA's top 20 international passenger volume markets in 2019. The MIA has been the busiest U.S. airport for international passengers this year with 7.7 million of its 22.8 million total passengers traveling abroad through August.
While domestic travel on the MIA was down just 5% through August compared to 2019, international travel was down 50% due in large part to travel restrictions, according to airport figures.
According to figures published by the airlines, the capacity of departure seats in the MIA from October to December 2021 is already at 10.1% or above its 2019 level.
With the easing of travel restrictions, all foreign travelers coming to the U.S. will be required to demonstrate proof of vaccination before boarding and a negative COVID-19 test performed within three days prior to the flight.Vaccinated passengers will not have to be quarantined, among other measures.
October 22, 2021

© 2021 Expedia, Inc, an Expedia Group Company. All rights reserved. Confidential and proprietary
11
2021 vs. 2019 Weekly Flight Search Pace – Top Hotel Markets
Source: Kayak https://www.kayak.com/flight-trends
Week Ending9/5/2021 9/12/2021 9/19/2021 9/26/2021 10/3/2021 10/10/2021 10/17/2021 10/24/2021
Las Vegas, NV -31% -31% -23% -18% -17% -7% -7% -5%Phoenix, AZ -31% -27% -23% -19% -19% -9% -7% -6%Nashville, TN -35% -32% -28% -27% -24% -10% -12% -9%Dallas, TX -33% -33% -28% -23% -21% -8% -7% -10%Tampa, FL -39% -38% -32% -31% -25% -15% -12% -10%Orlando, FL -32% -36% -30% -25% -21% -12% -13% -10%Miami, FL -33% -36% -30% -26% -21% -11% -12% -11%Boston, MA -31% -37% -33% -29% -29% -22% -17% -12%Houston, TX -30% -34% -32% -28% -26% -18% -17% -13%Atlanta, GA -33% -33% -27% -22% -20% -12% -14% -14%Denver, CO -40% -39% -32% -32% -30% -20% -20% -17%Saint Louis, MO -41% -41% -38% -36% -30% -22% -23% -19%San Diego, CA -38% -40% -37% -35% -32% -25% -22% -20%Philadelphia, PA -43% -40% -36% -34% -31% -27% -26% -20%Chicago, IL -34% -34% -30% -29% -28% -19% -18% -21%Los Angeles, CA -38% -36% -30% -26% -28% -24% -19% -21%New York, NY -36% -39% -34% -31% -31% -23% -22% -21%Detroit, MI -48% -46% -42% -38% -36% -27% -26% -21%Minneapolis, MN -33% -38% -36% -30% -30% -23% -25% -22%San Francisco, CA -54% -49% -43% -39% -36% -27% -27% -22%Oahu Island, HI -39% -40% -40% -35% -34% -30% -28% -23%Seattle, WA -41% -41% -37% -35% -33% -27% -25% -26%Washington, DC -42% -42% -39% -35% -36% -28% -28% -28%New Orleans, LA -71% -63% -60% -56% -52% -45% -42% -41%
AVERAGE -39% -39% -34% -31% -29% -20% -20% -18%Miami above/below average +6% +3% +4% +5% +8% +9% +8% +7%

© 2021 Expedia, Inc, an Expedia Group Company. All rights reserved. Confidential and proprietary
2021/2022 vs. 2019/2020 MIA Future Air Travel Booking Pace Domestic & International
12
Source: ARC (as of September 30, 2021)

© 2021 Expedia, Inc, an Expedia Group Company. All rights reserved. Confidential and proprietary
13
Source: TravelClick
Hotel 6 Month Future Occupancy Booking Pace Year-Over-Year
125%
100%
75%
50%
25%
0%
October November December January February March
9/19
10/17
9/05
Hotel booking activity continues to fall in the short term but pace improves further out

© 2021 Expedia, Inc, an Expedia Group Company. All rights reserved. Confidential and proprietary
250%
200%
150%
100%
50%
0%
14
Source: Transparent
Airbnb 6 Month Future Occupancy Booking Pace Year-Over-Year
October November December January February March
9/05
9/26
10/17
Future Airbnb booking activity is stronger further out but momentum continues to soften week after week

© 2021 Expedia, Inc, an Expedia Group Company. All rights reserved. Confidential and proprietary
Miami-Dade County Employment
15
144.4
70.578.8
96.9 92.2 87.7 93.6
119.7 122.8
104.7 104.4 107.3 109.7 110.7 113.7 116.6 117.4 117.5 117.6
0.0
20.0
40.0
60.0
80.0
100.0
120.0
140.0
160.0
Mar 20 Apr 20 May 20 Jun 20 Jul 20 Aug 20 Sep 20 Oct 20 Nov 20 Dec 20 Jan 21 Feb 21 Mar 21 Apr 21 May 21 Jun 21 Jul 21 Aug 21 Sep 21
Leisure & Hospitality Jobs (1,000s)
1220.4
1034.01061.4
1094.0 1088.3 1090.7 1102.2
1148.2 1161.91137.0
1119.4 1130.1 1139.1 1140.1 1145.0 1138.6 1145.9 1160.9 1163.6
900.0
950.0
1000.0
1050.0
1100.0
1150.0
1200.0
1250.0
Mar 20 Apr 20 May 20 Jun 20 Jul 20 Aug 20 Sep 20 Oct 20 Nov 20 Dec 20 Jan 21 Feb 21 Mar 21 Apr 21 May 21 Jun 21 Jul 21 Aug 21 Sep 21
Total Non-Agriculture Jobs (1,000s)
Source: Florida Department of Economic Opportunity
© 2021 Expedia, Inc, an Expedia Group Company. All rights reserved. Confidential and proprietary
16
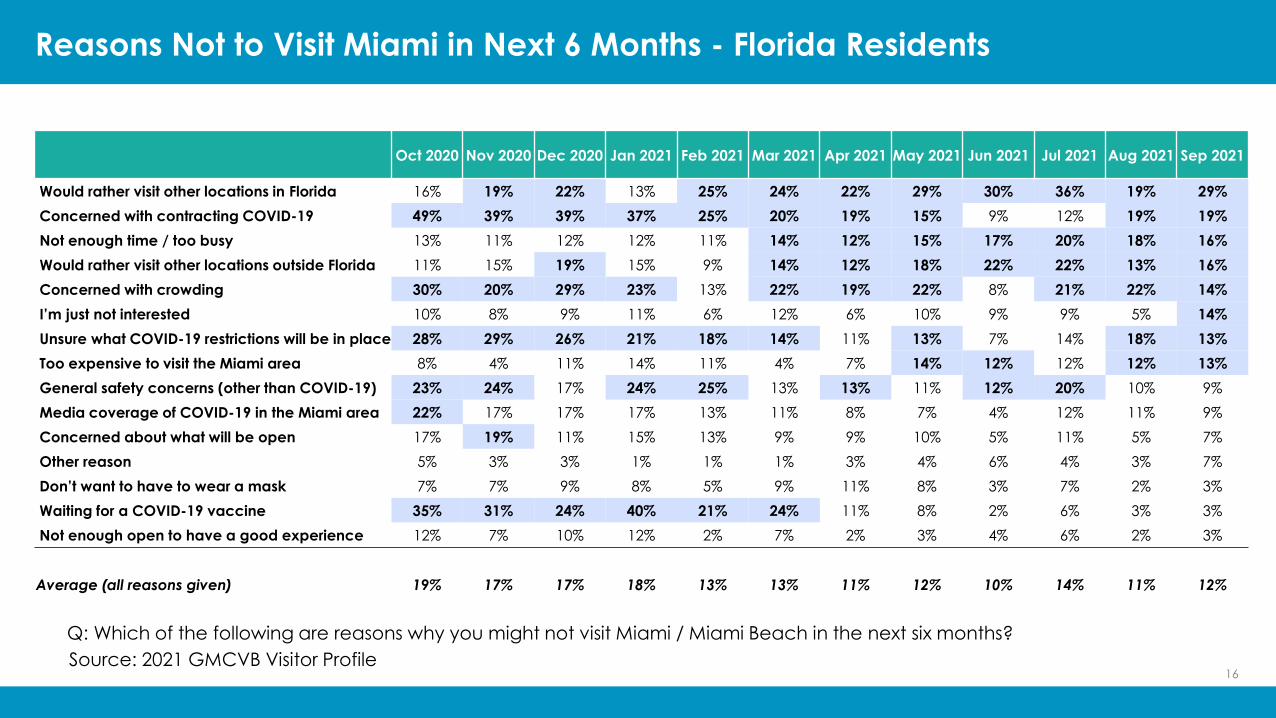
Reasons Not to Visit Miami in Next 6 Months - Florida Residents
Oct 2020 Nov 2020 Dec 2020 Jan 2021 Feb 2021 Mar 2021 Apr 2021 May 2021 Jun 2021 Jul 2021 Aug 2021 Sep 2021
Would rather visit other locations in Florida 16% 19% 22% 13% 25% 24% 22% 29% 30% 36% 19% 29%Concerned with contracting COVID-19 49% 39% 39% 37% 25% 20% 19% 15% 9% 12% 19% 19%Not enough time / too busy 13% 11% 12% 12% 11% 14% 12% 15% 17% 20% 18% 16%Would rather visit other locations outside Florida 11% 15% 19% 15% 9% 14% 12% 18% 22% 22% 13% 16%Concerned with crowding 30% 20% 29% 23% 13% 22% 19% 22% 8% 21% 22% 14%I’m just not interested 10% 8% 9% 11% 6% 12% 6% 10% 9% 9% 5% 14%Unsure what COVID-19 restrictions will be in place 28% 29% 26% 21% 18% 14% 11% 13% 7% 14% 18% 13%Too expensive to visit the Miami area 8% 4% 11% 14% 11% 4% 7% 14% 12% 12% 12% 13%General safety concerns (other than COVID-19) 23% 24% 17% 24% 25% 13% 13% 11% 12% 20% 10% 9%Media coverage of COVID-19 in the Miami area 22% 17% 17% 17% 13% 11% 8% 7% 4% 12% 11% 9%Concerned about what will be open 17% 19% 11% 15% 13% 9% 9% 10% 5% 11% 5% 7%Other reason 5% 3% 3% 1% 1% 1% 3% 4% 6% 4% 3% 7%Don’t want to have to wear a mask 7% 7% 9% 8% 5% 9% 11% 8% 3% 7% 2% 3%Waiting for a COVID-19 vaccine 35% 31% 24% 40% 21% 24% 11% 8% 2% 6% 3% 3%Not enough open to have a good experience 12% 7% 10% 12% 2% 7% 2% 3% 4% 6% 2% 3%
Average (all reasons given) 19% 17% 17% 18% 13% 13% 11% 12% 10% 14% 11% 12%
Q: Which of the following are reasons why you might not visit Miami / Miami Beach in the next six months? Source: 2021 GMCVB Visitor Profile
© 2021 Expedia, Inc, an Expedia Group Company. All rights reserved. Confidential and proprietary
17
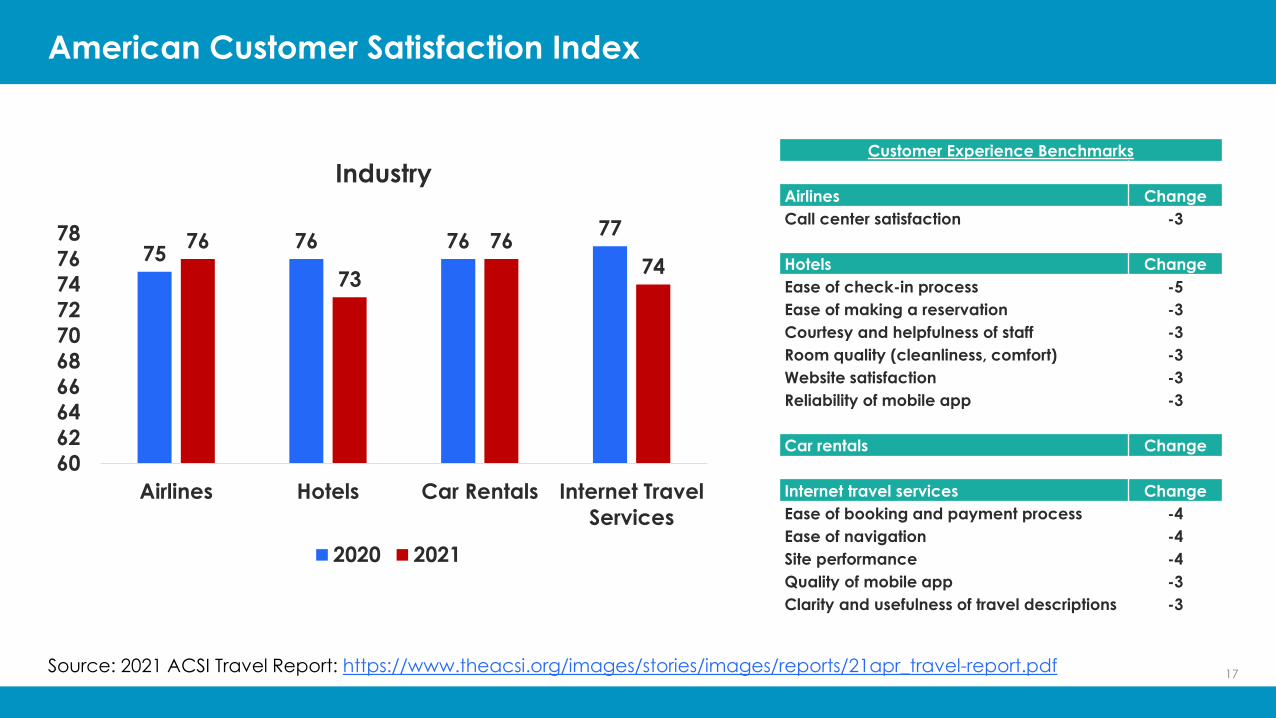
American Customer Satisfaction Index
Source: 2021 ACSI Travel Report: https://www.theacsi.org/images/stories/images/reports/21apr_travel-report.pdf
75 76 76 7776
73
7674
60626466687072747678
Airlines Hotels Car Rentals Internet TravelServices
Industry
2020 2021
Customer Experience Benchmarks
Airlines ChangeCall center satisfaction -3
Hotels ChangeEase of check-in process -5Ease of making a reservation -3Courtesy and helpfulness of staff -3Room quality (cleanliness, comfort) -3Website satisfaction -3Reliability of mobile app -3
Car rentals Change
Internet travel services ChangeEase of booking and payment process -4Ease of navigation -4Site performance -4Quality of mobile app -3Clarity and usefulness of travel descriptions -3

© 2021 Expedia, Inc, an Expedia Group Company. All rights reserved. Confidential and proprietary
18
In Summary
• Industry performance metrics continue to improve and show a steady rebound from July
• Travel optimism is returning after recent downturns
• Price and economic concerns are important to acknowledge and develop strategies to combat
• Employment continues to lag; staffing is critical
• Pay attention to the customer experience

© 2021 Expedia, Inc, an Expedia Group Company. All rights reserved. Confidential and proprietary
Thank you!!!
19
https://www.miamiandbeaches.com/gmcvb-partners/tools-resources/research-statistics-reporting