mgto 324 workshop 3: spss data management. activity 1 collect the following information from any 40...
Post on 21-Dec-2015
219 views
TRANSCRIPT
MGTO 324
Workshop 3: SPSS Data Management
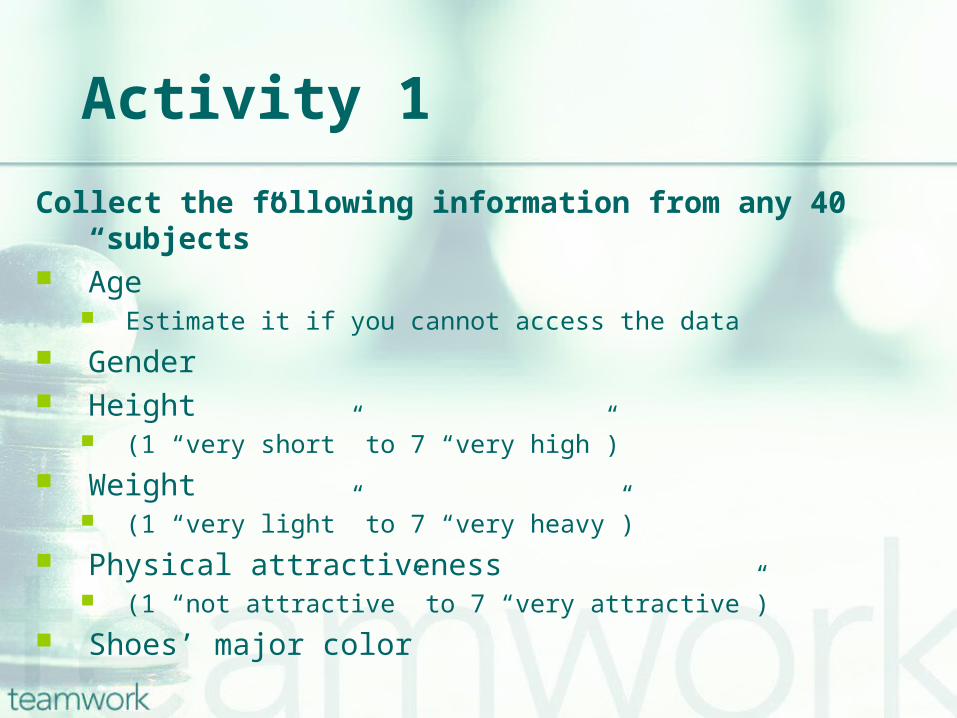
Activity 1
Collect the following information from any 40 “subjects” Age
Estimate it if you cannot access the data
Gender Height
(1 “very short” to 7 “very high”)
Weight (1 “very light” to 7 “very heavy”)
Physical attractiveness (1 “not attractive” to 7 “very attractive”)
Shoes’ major color

SPSS data management
Rule of thumb One row for one “subject” One column for one “variable” At least give one column to identify the
“subject ID” How many variables do we have?

SPSS data management
Essential steps Defining and labeling variables
Give a good name for each variable
Defining the nature of the variables Continuous, ordinal, or categorical (Nominal)
Assigning and labeling values for categorical variables
Missing values
SPSS data management
Basic statistics Descriptive statistics
Mean, Frequency
Correlation Mean Comparison

SPSS data management
Basic statistics Descriptive statistics
Mean, Frequency
Statistics
RATING10
0
2.8000
3.0000
4.00
1.2293
Valid
Missing
N
Mean
Median
Mode
Std. Deviation
subject rating subject rating
1 4 6 4
2 3 7 2
3 4 8 1
4 1 9 2
5 4 10 3

SPSS data management
Basic statistics Descriptive statistics
Mean, Frequency
RATING
2 20.0 20.0 20.0
2 20.0 20.0 40.0
2 20.0 20.0 60.0
4 40.0 40.0 100.0
10 100.0 100.0
1.00 very slow
2.00 slow
3.00 fast
4.00 very fast
Total
ValidFrequency Percent
ValidPercent
Cumulative Percent
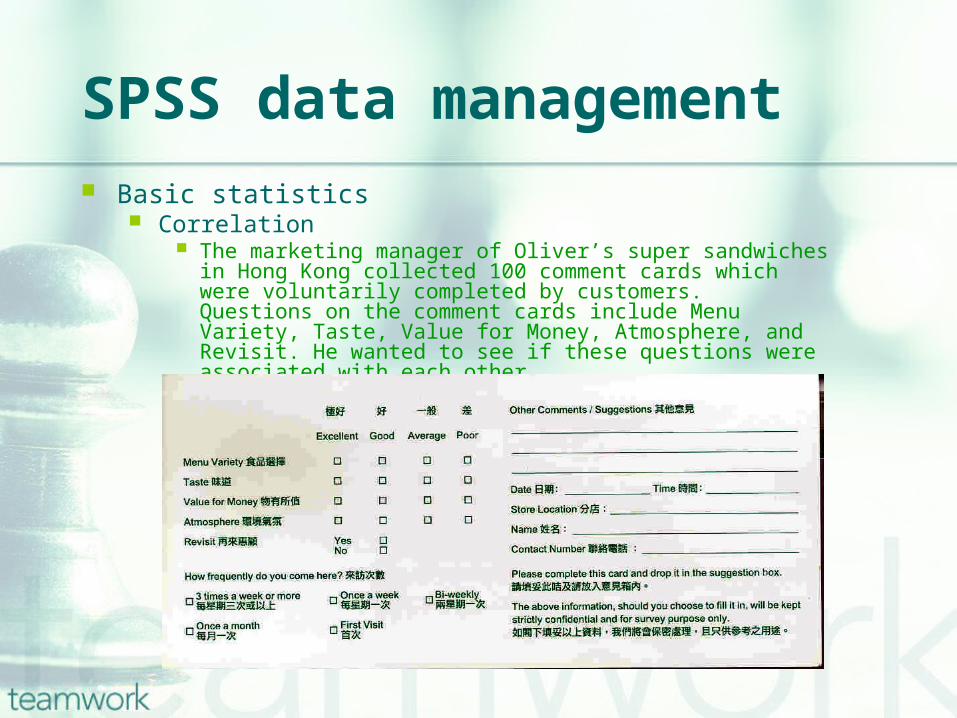
SPSS data management Basic statistics
Correlation The marketing manager of Oliver’s super sandwiches in Hong
Kong collected 100 comment cards which were voluntarily completed by customers. Questions on the comment cards include Menu Variety, Taste, Value for Money, Atmosphere, and Revisit. He wanted to see if these questions were associated with each other.

SPSS data management
Basic statistics Correlation
Correlations
1.000 -.083 .600** -.084 .282**
. .414 .000 .405 .004
100 100 100 100 100
-.083 1.000 -.135 -.254* -.181
.414 . .181 .011 .072
100 100 100 100 100
.600** -.135 1.000 .176 .417**
.000 .181 . .079 .000
100 100 100 100 100
-.084 -.254* .176 1.000 .524**
.405 .011 .079 . .000
100 100 100 100 100
.282** -.181 .417** .524** 1.000
.004 .072 .000 .000 .
100 100 100 100 100
Pearson Correlation
Sig. (2-tailed)
N
Pearson Correlation
Sig. (2-tailed)
N
Pearson Correlation
Sig. (2-tailed)
N
Pearson Correlation
Sig. (2-tailed)
N
Pearson Correlation
Sig. (2-tailed)
N
MENU
TASTE
VALUE
ATMOSPH
REVISIT
MENU TASTE VALUE ATMOSPH REVISIT
Correlation is significant at the 0.01 level (2-tailed).**.
Correlation is significant at the 0.05 level (2-tailed).*.

SPSS data management
Basic statistics Mean comparison
City 1 City 2
Victoria Winnipeg
n 25 25
mean $446.04 $518.92
s.d. $78.16 $57.43

SPSS data management
Basic statistics Mean comparison
Independent Samples Test
.838 .365 -3.757 48 .000 -72.88 19.398 -111.882 -33.878
-3.757 44.066 .001 -72.88 19.398 -111.972 -33.788
Equal variances assumed
Equal variances notassumed
HYDROF Sig.
Levene's Test forEquality of Variances
t df Sig. (2-tailed)Mean
DifferenceStd. ErrorDifference Lower Upper
95% ConfidenceInterval of the
Difference
t-test for Equality of Means
SPSS data management
In class exercise Based on your collected data, write a brief report
telling me the following Mean and SD of age of the subjects % of Male and Female subjects Correlations (Pearson r) between
Height and weight; PA and Height; PA and Weight t test (use independent t test) examining gender
difference in Height, weight, and PA
Copy and paste your SPSS outputs to a word document, then submit the hard copy to me