m&g dividend fund - interim short...
TRANSCRIPT

56596_SR_310818
Contact
Customer Relations* 0800 390 390
Write to us at:**M&G Securities Limited
PO Box 9039
Chelmsford
CM99 2XG
Our website: www.mandg.co.uk
Email us with queries:†
*
For security purposes and to improve the quality of our service, we may record and monitor telephone calls. You will require your M&G client reference. Failure to provide this will affect your ability to transact with us.
** Please remember to quote your name and M&G client reference and sign any written communication to M&G. Failure to provide this may affect your ability to transact with us.
† Please note that information contained within an email cannot be guaranteed as secure. We advise that you do not include any sensitive information when corresponding with M&G in this way.
M&G Securities Limited is authorised and regulated by the Financial Conduct Authorityand provides investment products. The company’s registered office is LaurencePountney Hill, London EC4R 0HH. Registered in England number 90776.
Interim Short Report December 2017For the six months ended 31 December 2017
a sub-fund of M&G Investment Funds (3)
M&G Dividend Fund

2
Fund information
1
Investment approach
The M&G Dividend Fund employs a bottom-up stockpicking approach,driven by the fundamental analysis of individual companies. The fundmanager seeks to invest in companies with excellent capital disciplineand long-term dividend growth potential. The fund manager believesrising dividends create upward pressure on the value of shares.Dividend yield is not the primary consideration for stock selection.
The fund manager aims to create a diversified portfolio with exposureto a broad range of sectors. He selects stocks with different drivers ofdividend growth to construct a portfolio that has the potential to copein a variety of market conditions. The fund invests with a long-terminvestment view and a typical holding period of three to five years.
Risk profile
The fund invests in the shares of UK-listed companies and is,therefore, subject to the price volatility of the UK stockmarket and theperformance of individual companies. The fund’s focus is on sharesof companies that have the potential to grow their dividends over thelong term. Income distributions from the fund’s holdings, however, arenot guaranteed and may vary. Diversification is therefore key inmanaging liquidity risk and reducing market risk. The fund’s risks aremeasured and managed as an integral part of the investment process.
The following table shows the risk number associated with the fundand is based on Sterling Class ‘A’ shares.
The above number:
• is based on the rate at which the value of the fund has moved up and down in the
past and is based on historical data so may not be a reliable indicator of the future
risk profile of the fund.
• is not guaranteed and may change over time and the lowest risk number does not
mean risk free.
• has not changed during this period.
Low risk High risk
Typically lower rewards Typically higher rewards
1 2 3 4 5 6 7
The Authorised Corporate Director (ACD) of M&G Investment Funds (3)presents its Interim Short Report for M&G Dividend Fund which containsa review of the fund’s investment activities and investment performanceduring the period. The ACD’s Interim Long Report and unauditedFinancial Statements for M&G Investment Funds (3), incorporating allthe sub-funds and a Glossary of terms is available free of charge eitherfrom our website at www.mandg.co.uk/reports or by calling M&GCustomer Relations on 0800 390 390.
ACDM&G Securities Limited, Laurence Pountney Hill, London EC4R 0HH Telephone: 0800 390 390
(Authorised and regulated by the Financial Conduct Authority. M&G Securities Limited is a member of the Investment Associationand of the Tax Incentivised Savings Association.)
Investment objective and policy
The fund invests mainly in a range of UK equities with the aim ofachieving a steadily increasing income stream. The fund will target ayield higher than that of the FTSE All-Share Index. Subject to this, theaim will be to maximise total return (the combination of income andgrowth of capital).

4
Investment review
3
The reporting season for the first half of 2017 also gave rise to higherdividends, particularly in financials. Jupiter Fund Management (51%)and Intermediate Capital (20%) delivered impressive dividendincreases among our holdings in asset managers, while Prudentialand Aviva, our largest insurance holdings, reported double-digitgrowth. The majority of the fund’s holdings continued to raise theirdividends in the region of 5% to 15%, in line with previous years, withthe increases spread across different sectors. Publisher RELX, oneof the fund’s top holdings, boosted its interim dividend by 14% insterling, while British American Tobacco reported a 10% increase inconsumer goods. DS Smith, the packaging company, raised itshalf-year dividend by 7%.
Not all of our holdings delivered growth, however. BP and AstraZenecawere among a handful of large-cap holdings that held their dividendsflat, although in the case of AstraZeneca, we are optimistic thatdividend growth can resume over time. Lower down the marketcapitalisation spectrum, Essentra (industrials) and Golar LNG (oil &gas) also held their dividends flat. Both stocks have sufficient valuationbacking to merit their place in the portfolio.
As a trend, we saw less special dividends so far this year. Admiral, thespecialist in car insurance, continued in its vein of paying specialdividends on a regular basis, but was the only holding to do so duringthe review period. Micro Focus in the technology sector returned asignificant amount of cash, equivalent to more than 7% of thecompany’s market value, as it completed the acquisition of HewlettPackard Enterprise (HPE)’s software business. This was done,however, as a return of capital. This was somewhat disappointing asit cannot be distributed as income. We do however applaud thediscipline of returning excess cash to shareholders.
Against this backdrop, we also maintained a yield above that of theFTSE All-Share Index. The challenges presented by the concentrationof yield in the UK stockmarket have been well documented, and theassessment of potential risks associated with individual high-yieldingstocks remains of the utmost importance. We believe from ourthorough company analysis that the fund’s higher yield has beenachieved with due consideration of its sustainability. We continue tobe selective about the dividend streams we back and remain scepticalabout the dividend-paying capacity of certain high-yielding stocks.With our core holdings, we endeavour to strike a sensible balancebetween long-term dividend progression and attractive valuation in fullrecognition of the fact that the combination of a high yield and risingdistribution is important to our investors. We remain committed todelivering on these twin income objectives.
As at 2 January 2018, for the six months ended 31 December 2017
Distribution summary
Over the six-month review period, the fund distributed income of0.8005 pence per Sterling Class ‘A’ (Income) share. This is the samedistribution as the payment made in the same period last year. Thepayout represented a yield (distributed income as a percentage of theshare price) of 4.58% versus a yield of 3.60% for the FTSE All-ShareIndex, a comparative index.
In our previous reports, we highlighted the lack of dividend growthamong the UK’s largest companies. (Dividends represent a share inthe profits of a company and are paid out to the company’sshareholders at set times of the year.) Companies such as RoyalDutch Shell and HSBC have struggled to increase their dividends* ina meaningful way as their underlying businesses showed little signsof growth. At the same time, multinationals with significant US dollarearnings are no longer benefiting from the Brexit-induced weaknessin sterling. That said, the UK market has benefited from the re-emergence of the mining sector where dividend growth hasresumed during the period under review. Dividends from the likes ofRio Tinto and BHP Billiton were slashed in early 2016 in response tofalling commodity prices and our focus on long-term growth allowedus to avoid those pitfalls at the time. We have a natural aversion tocompanies whose dividends are volatile as a result of their sensitivityto external factors which are ultimately beyond their control.
Against this background, we are pleased that the majority of the fund’sholdings continued to deliver healthy dividend growth, in line with theirlong-term commitment. Imperial Brands, the tobacco company, andBritvic, the soft drinks manufacturer, raised their full-year dividends by10% and 8% respectively, while food service group Compassincreased its payment by 6%. Dividend growth of 5-15% from thesestable business models is consistent with their history as well as ourlong-term expectations. Outside this range, McCarthy & Stonereported a 20% dividend increase for the financial year ended August.The UK’s leading developer of retirement homes is ramping up itspayments after rejoining the stockmarket in November 2015.Countryside Properties reported the biggest dividend increase duringthe review period under similar circumstances. The housebuilder andurban regeneration specialist more than doubled its payment for the12 months ended September, the magnitude of the increase reflectingthe robust performance of the underlying businesses as well as thelarge step-up in dividends following the company’s initial public offering(IPO) in February 2016.
* Underlying basis, excluding currency.

6
Investment review
5
To give an indication of the performance of the fund, the following tableshows the compound rate of return, per annum, over the period forSterling Class ‘A’ (Accumulation) shares and Sterling Class ‘I’(Accumulation) shares. Calculated on a price to price basis withincome reinvested.
Long-term performance
Six Three Five Since months years years launch 03.07.17 02.01.15 02.01.13 % [a] % p.a. % p.a. % p.a.
Sterling [b] Class ‘A’ +0.3 +7.9 +7.7 +11.2 [c]
Class ‘I’ +0.7 +8.7 +8.5 +9.3 [d]
[a] Absolute basis.
[b] Price to price with income reinvested.
[c] 6 May 1964, the end of the initial offer period of the predecessor unit trust.
[d] 3 August 2012, the launch date of the share class.
Please note past performance is not a guide to future performanceand the value of investments, and the income from them, will fluctuate.This will cause the fund price to fall as well as rise and you may notget back the original amount you invested.
Investment performance
The fund delivered positive returns in the past six months, but trailedthe FTSE All-Share Index. Relative performance suffered fromnegative sector allocation. The positive effect of having limitedexposure to utilities and healthcare, which underperformed, was morethan offset by the fund’s small weighting in basic materials and oil &gas which led the markets higher during the review period. Not owningGlencore, Rio Tinto and BHP Billiton, which collectively account for5% of the FTSE All-Share Index, detracted as these mining stocksgenerated returns well in excess of 20%. The zero exposure to RoyalDutch Shell, which accounts for more than 8% of the index, alsoproved detrimental as the oil major returned 25%.
From a stock-specific perspective, SES was the biggest detractorduring the review period. The satellite company came under pressurefollowing the announcement of third-quarter results which fell short ofmarket expectations. The stock is under review.
The fund’s distribution and distribution yield are shown in the ‘Specificshare class performance’ tables in the ‘Financial highlights’ section ofthe Interim Long Report and unaudited Financial Statements for M&GInvestment Funds (3). The distribution is subject to changes in themarket environment and there is no guarantee that the fund willincrease the distribution in every reporting period. In keeping with prioryears under the fund manager’s tenure, special dividends formed akey component of the fund’s income and these dividends should beseen as special and not necessarily recurring.
Performance against objective
Between 3 July 2017 (the start of the review period) and 2 January2018, the fund delivered a small positive total return (the combinationof income and growth of capital) across its share classes. However,the fund’s returns in all share classes lagged the FTSE All-ShareIndex, which returned 6% over the six-month period.
While the fund has achieved its objective in terms of delivering adividend yield above that of the FTSE All-Share Index and generatingcapital growth, it did not increase distributions during the six-monthreview period for all share classes. Over a longer period of five years,the fund has achieved all aspects of its objective.*
* For the performance of each share class, please refer to the ‘Long-term
performance by share class’ table in the ‘Fund performance’ section of the Interim
Long Report and unaudited Financial Statements for M&G Investment Funds (3).

8
Investment review
7
Investment activities
We made five new purchases and four complete sales during the sixmonths under review, consistent with our long-term investment horizonof three years or more. Investment decisions are based on the detailedanalysis of company fundamentals and the thorough assessment ofvaluation to determine whether a stock merits its place in the fund.Dialogue with companies is integral to our approach and we aim tomake informed judgments through human engagement.Understanding corporate culture and strategy is a prerequisite tounderstanding the value creation which a company can potentiallydeliver. This entails regular meetings with senior management as wellas site visits to operational facilities, and through the consistentapplication of this routine, we aim to identify new ideas.
Domino’s Pizza, our most recent purchase, is a good illustration of ourdisciplined process working in practice. While the structural threat ofonline aggregators such as Just Eat and Deliveroo cannot be ignored,Domino’s Pizza has a key competitive advantage in the form of scale– a strength which we feel more comfortable about following a site visitto the company’s production and logistics facilities in Milton Keynes.The investment case is not without its controversies, but we havescrutinised the business model in much detail, including severalmeetings with the management team, and we will be looking to add tothe holding on opportunities.
We also bought Unite Group, the UK’s leading manager and developerof student accommodation, on a share price setback. It is a beneficiaryof structural growth and has a strong development pipeline with anincreasing number of university partnerships. We bought back WPPin October when the share price was 25% lower than when we sold itin February. The stock underperformed significantly during theintervening months after the advertising group cut its guidancefollowing a slow start to 2017. The underperformance has beenoverdone, in our view, and we took advantage of an opportunity toinvest in a company capable of sustaining growth, contrary to itsvaluation today.
Hilton Food, which is expanding geographically with a focus on freshfoods, and jewellery company Pandora were the other new purchases.
The fund’s biggest purchase was not a new holding, however. Therecipient of most new capital was BP where we doubled the fund’sexposure to narrow the large underweight position in oil & gas. The oilindustry is demonstrating a new-found discipline that the fund managerhad not seen since the turn of the century. We trimmed some of ourholding in Golar LNG to compensate.
Provident Financial underperformed in response to a profit warning, andthe cancelling of the dividend. The UK consumer finance companywarned that the transition to a new operating model was experiencinggreater disruption than planned, as a result of which the deterioration inoperating performance will reduce profits in the consumer credit divisionin 2017. The stock has been sold as a source of cash for better ideas.
ConvaTec delivered a negative return in a rising market after themanufacturer of medical equipment lowered its revenue guidance for2017 as a result of supply issues and a lower-than-anticipatedcontribution from new products. Despite this setback, the companyannounced its maiden dividend in August and we maintain ourconviction in the long-term prospects.
Turning to the positive contributors, Intermediate Capital added themost value after the asset manager returned more than 30% duringthe six months under review, helped by strong inflows. Jupiter FundManagement was also among the top 10 positive contributors as aresult of considerable operational progress. We have been takingsome profits in both these holdings to take advantage of the sharpshare price increase.
Methanex returned more than 30% in sterling and outperformed arising basic materials sector after the methanol producer benefitedfrom a favourable combination of higher coal prices, higher gas prices,solid demand growth, an environmental clampdown in China andhigher energy prices. The stock’s valuation discount has narrowedconsiderably, but we continue to see further upside. In the oil & gassector which benefited from a higher oil price, Golar LNG and BPmade positive contributions.
Technology was another strong sector during the period under reviewand Micro Focus performed well accordingly. The stock recovered froma disappointing start when the announcement of full-year results inJuly led to expectations being revised down. We added to our holdingon weakness at this time as the company endorsed its confidence inits long-term growth prospects with a 32% dividend increase.Subsequently, the shares rose more than 30% from their lows as thecompany completed the acquisition of HPE’s software business andthe operational performance of the acquired business showed animprovement. We reduced the holding again as the shares rallied, inkeeping with our discipline on stock valuation.

10
Investment review
9
With this in mind, we remain focused on the analysis of companyfundamentals and valuation, in the belief that these factors drivestockmarket returns over the long term. The UK continues to offerexcellent opportunities for stockpickers, particularly outside the largestcompanies which are struggling to grow. Medium-sized companiesremain a source of attractive opportunities given their potential todeliver long-term growth for the benefit of shareholders. The UK isalso home to a multitude of global businesses which are not reliant onthe fortunes of the UK economy. We seek to invest in companies withgreater control over their own destiny. Even among more domesticallybiased businesses, there are attractive opportunities for growth. Theimportance of being selective cannot be emphasised enough.
At the same time we also need to be mindful of potential headwinds.The recent pronounced weakness in the US dollar, coupled with themarked decrease in the number of special dividends present achallenge to growing the income this year.
We remain committed to our dividend growth strategy and ourconviction-based approach, and believe that the cash-generativenature of the fund’s holdings, their ability to grow dividends over thelong term and their attractive valuation in the stockmarket stand us ingood stead for the future. The fund’s current yield of 4.58%, which weaim to grow over time, offers a favourable proposition for long-terminvestors, in our view. We appreciate your continued support.
Phil CliffFund manager
An employee of M&G Limited which is an associate of M&G Securities Limited.
Please note that the views expressed in this Report should not be taken as a
recommendation or advice on how the fund or any holding mentioned in the Report
is likely to perform. If you wish to obtain financial advice as to whether an investment
is suitable for your needs, you should consult a Financial Adviser.
We also added to Imperial Brands which looks cheap as a result ofregulatory concerns in the US tobacco industry and the market’s lackof faith in the company’s ability to deliver growth. Coupled with thenew purchases of Hilton Food and Pandora mentioned above, thefund’s exposure to the consumer goods sector increased from anunderweight to an overweight position relative to the FTSE All-ShareIndex. In industrials, we bought more BAE Systems in defence, andadded to the fund’s exposure to construction and housing by toppingup on VolkerWessels, Countryside Properties and McCarthy & Stone.We also increased the weighting in AstraZeneca, although thehealthcare exposure declined overall as we reduced the holding inGlaxoSmithKline.
Turning to the other major sales, we sold property company Hansteenin its entirety after a strong run. In addition to the sale of ProvidentFinancial, we also exited Ranger Direct Lending and trimmed ourholding in Aviva. The fund’s overweight position in financials has beenremoved as a consequence. We also completed the sale of Saga inSeptember. We were unconvinced about Saga’s growth expectationsand its ability to capitalise on its leading brand for the over 50s. Afterthe sale, the shares dropped more than 20% in December as thecompany reported a profit warning.
On a more positive note, we took profits in GVC, the sports betting andgaming company, which rallied as a result of continued operationalprogress. The proposed acquisition of Ladbrokes Coral has been wellreceived by the market and the stock remains a core holding.
As a result of these transactions, the number of holdings rose to 46.We believe a concentrated portfolio of best ideas is an excellent wayto capture the opportunities for stock selection in the UK.
Outlook
The UK stockmarket continues to defy the critics. The FTSE All-ShareIndex ended 2017 at an all-time high despite the ongoing uncertaintiesat the macroeconomic level: forecasts for economic growth have beenlowered, interest rates have been raised for the first time in 10 yearsand inflation has been on the rise following Brexit and the sterlingweakness that ensued. The stockmarket, however, is not a reflectionof the domestic economy; it is an amalgam of companies from avariety of sectors with varying degrees of geographic diversity thathappen to be listed on the London Stock Exchange.
12
Investment review
11
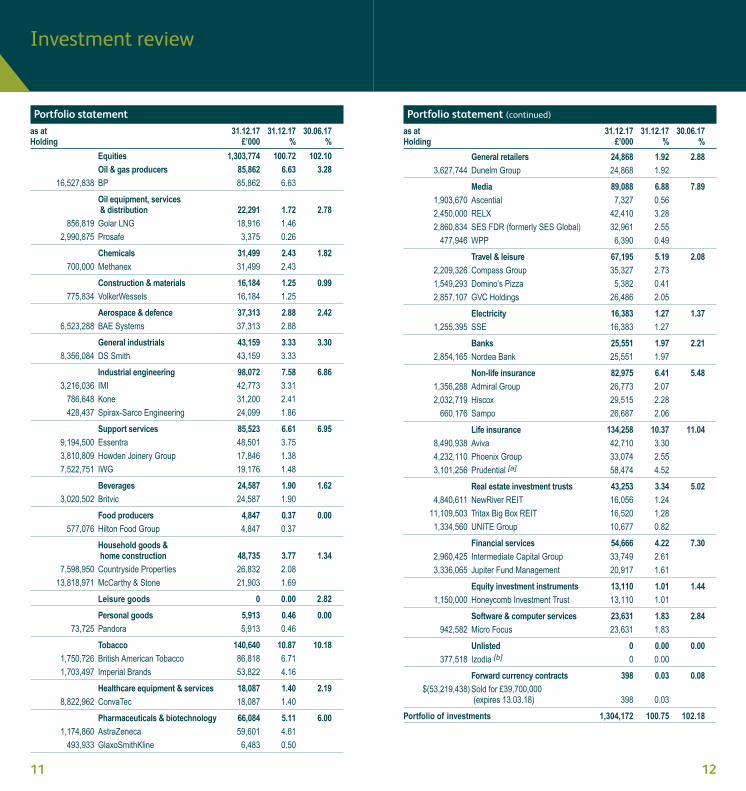
General retailers 24,868 1.92 2.88 3,627,744 Dunelm Group 24,868 1.92
Media 89,088 6.88 7.89 1,903,670 Ascential 7,327 0.56
2,450,000 RELX 42,410 3.28
2,860,834 SES FDR (formerly SES Global) 32,961 2.55
477,946 WPP 6,390 0.49
Travel & leisure 67,195 5.19 2.08 2,209,326 Compass Group 35,327 2.73
1,549,293 Domino’s Pizza 5,382 0.41
2,857,107 GVC Holdings 26,486 2.05
Electricity 16,383 1.27 1.37 1,255,395 SSE 16,383 1.27
Banks 25,551 1.97 2.21 2,854,165 Nordea Bank 25,551 1.97
Non-life insurance 82,975 6.41 5.48 1,356,288 Admiral Group 26,773 2.07
2,032,719 Hiscox 29,515 2.28
660,176 Sampo 26,687 2.06
Life insurance 134,258 10.37 11.04 8,490,938 Aviva 42,710 3.30
4,232,110 Phoenix Group 33,074 2.55
3,101,256 Prudential [a] 58,474 4.52
Real estate investment trusts 43,253 3.34 5.02 4,840,611 NewRiver REIT 16,056 1.24
11,109,503 Tritax Big Box REIT 16,520 1.28
1,334,560 UNITE Group 10,677 0.82
Financial services 54,666 4.22 7.30 2,960,425 Intermediate Capital Group 33,749 2.61
3,336,065 Jupiter Fund Management 20,917 1.61
Equity investment instruments 13,110 1.01 1.44 1,150,000 Honeycomb Investment Trust 13,110 1.01
Software & computer services 23,631 1.83 2.84 942,582 Micro Focus 23,631 1.83
Unlisted 0 0.00 0.00 377,518 Izodia [b] 0 0.00
Forward currency contracts 398 0.03 0.08 $(53,219,438)Sold for £39,700,000 (expires 13.03.18) 398 0.03
Portfolio of investments 1,304,172 100.75 102.18
Portfolio statement
as at 31.12.17 31.12.17 30.06.17Holding £’000 % %
Equities 1,303,774 100.72 102.10 Oil & gas producers 85,862 6.63 3.28 16,527,838 BP 85,862 6.63
Oil equipment, services & distribution 22,291 1.72 2.78 856,819 Golar LNG 18,916 1.46
2,990,875 Prosafe 3,375 0.26
Chemicals 31,499 2.43 1.82 700,000 Methanex 31,499 2.43
Construction & materials 16,184 1.25 0.99 775,834 VolkerWessels 16,184 1.25
Aerospace & defence 37,313 2.88 2.42 6,523,288 BAE Systems 37,313 2.88
General industrials 43,159 3.33 3.30 8,356,084 DS Smith 43,159 3.33
Industrial engineering 98,072 7.58 6.86 3,216,036 IMI 42,773 3.31
786,648 Kone 31,200 2.41
428,437 Spirax-Sarco Engineering 24,099 1.86
Support services 85,523 6.61 6.95 9,194,500 Essentra 48,501 3.75
3,810,809 Howden Joinery Group 17,846 1.38
7,522,751 IWG 19,176 1.48
Beverages 24,587 1.90 1.62 3,020,502 Britvic 24,587 1.90
Food producers 4,847 0.37 0.00 577,076 Hilton Food Group 4,847 0.37
Household goods & home construction 48,735 3.77 1.34 7,598,950 Countryside Properties 26,832 2.08
13,818,971 McCarthy & Stone 21,903 1.69
Leisure goods 0 0.00 2.82
Personal goods 5,913 0.46 0.00 73,725 Pandora 5,913 0.46
Tobacco 140,640 10.87 10.18 1,750,726 British American Tobacco 86,818 6.71
1,703,497 Imperial Brands 53,822 4.16
Healthcare equipment & services 18,087 1.40 2.19 8,822,962 ConvaTec 18,087 1.40
Pharmaceuticals & biotechnology 66,084 5.11 6.00 1,174,860 AstraZeneca 59,601 4.61
493,933 GlaxoSmithKline 6,483 0.50
Portfolio statement (continued)
as at 31.12.17 31.12.17 30.06.17Holding £’000 % %

Financial highlightsFund performance
14
Investment review
13
Please note past performance is not a guide to future performanceand the value of investments, and the income from them, will fluctuate.This will cause the fund price to fall as well as rise and you may notget back the original amount you invested.
The following charts and tables show the performance for two of thefund’s share classes – Sterling Class ‘A’ (Accumulation) shares andSterling Class ‘I’ (Accumulation) shares.
We show performance for these two share classes because:
• The performance of the Sterling Class ‘A’ (Accumulation) share iswhat most individuals investing directly with M&G have received. Ithas the highest ongoing charge of all the sterling share classes.Performance is shown after deduction of this charge. All UKinvestors in the fund therefore received this performance or better.
• The performance of the Sterling Class ‘I’ (Accumulation) share isthe most appropriate to compare with the average performance ofthe fund’s comparative sector. It is the share class used by theInvestment Association in the calculation of the comparativesector’s average performance. This share class is available fordirect investment with M&G subject to minimum investment criteria,or via third parties who may charge additional fees. Theperformance shown takes the deduction of the ongoing charge forthis share class into account but it does not take account of chargesapplied by any other party through which you may have invested.
The fund is available for investment in different share classes, each withvarying levels of charges and minimum investments; please refer to theProspectus for M&G Investment Funds (3), which is available free ofcharge either from our website at www.mandg.co.uk/prospectuses or bycalling M&G Customer Relations. For the specific performance tablesof all share classes, please refer to the Interim Long Report andunaudited Financial Statements for M&G Investment Funds (3), which is available free of charge either from our website atwww.mandg.co.uk/reports or by calling M&G Customer Relations.
Fund level performance
Fund net asset value
31.12.17 30.06.17 30.06.16as at £’000 £’000 £’000
Fund net asset value (NAV) 1,294,474 1,288,318 1,212,080
‘AAA’ rated money market funds [c] 816 0.06 0.67 816,000 Northern Trust Global Fund - Sterling 816 0.06
Total portfolio 1,304,988 100.81 102.85Net other assets / (liabilities) (10,514) (0.81) (2.85)
Net assets attributable to shareholders 1,294,474 100.00 100.00
All securities are on an official stock exchange listing except where referenced.
[a] Related party to the fund.
[b] Suspended.
[c] Uncommitted surplus cash is placed into ‘AAA’ rated money market funds with the
aim of reducing counterparty risk.
Top ten portfolio transactionsfor the six months to 31 December 2017
Largest purchases £’000
BP 33,654Micro Focus 15,948Imperial Brands 13,710BAE Systems 10,247UNITE Group 9,112VolkerWessels 6,866WPP 6,663AstraZeneca 6,418Countryside Properties 5,716McCarthy & Stone 5,454
Other purchases 60,594
Total purchases 174,382
Largest sales £’000
Micro Focus 30,612Hansteen Holdings REIT 22,942Jupiter Fund Management 19,861Saga 16,511Golar LNG 12,389Provident Financial 11,623GlaxoSmithKline 9,351GVC Holdings 7,827Aviva 7,355Intermediate Capital Group 6,835
Other sales 33,106
Total sales 178,412
Purchases and sales exclude the cost and proceeds of ‘AAA’ rated money market funds.
Portfolio statement (continued)
as at 31.12.17 31.12.17 30.06.17Holding £’000 % %

16
Financial highlightsFund performance
15
Ten-year performance
Please note that comparative data is not available from fund launch.Therefore a ten-year comparable performance chart is shown below.
The fund’s Sterling Class ‘I’ (Accumulation) shares were launched on3 August 2012. Performance data shown prior to this date is that ofthe fund’s Sterling Class ‘A’ (Accumulation) shares.
90
80
70
120
100
140
200
180
160
602008 2009 2010 2011 2012 2013 2014 2015 2016 2017
Ten years, 2 January 2008 = 100, plotted monthly Chart date 2 January 2018
Sterling Class ‘A’ (Accumulation) shares*
Sterling Class ‘I’ (Accumulation) shares*
FTSE All-Share Index
* Income reinvested Source: Morningstar, Inc. and M&G
Morningstar (IA) UK Equity Income sector average*
Share class performance since launch
To give an indication of how the fund has performed since launch,the chart below shows performance of Sterling Class ‘A’(Accumulation) shares and Sterling Class ‘A’ (Income) shares. WithAccumulation shares, income received from an investment isreinvested, while with Income shares, the income is paid out toshareholders.
200150
100
70
2,000
300
1,000700500
1,500
3,000
5,0007,000
10,000
15,000
25,000
40,000
64 66 68 70 72 74 76 78 80 82 84 86 88 90 92 94 96 98 00 02 04 06 08 10 12 14 16 18
Share class graph. From May 1964 = 100, plotted monthly. Chart date 2 January 2018
Sterling Class ‘A’
Sterling Class ‘A’ (Income) shares
Sterling Class ‘A’ (Accumulation) shares*
* Income reinvested Source: Morningstar, Inc. and M&G

18
Financial highlightsFund performance
17
Distribution since launch
The charts below show the annual distribution of Sterling Class ‘A’(Income) shares and Sterling Class ‘I’ (Income) shares since launch.
Specific share class performance
0.0
10.0
30.0
20.0
50.0
40.0
60.0
2013 2014 2015 2016 2017
Annual distributions since launch of the share class Chart date 3 July 2017
Sterling Class ‘I’ (Income) shares
Year ending June
Dis
trib
utio
n (p
ence
per
sha
re)
Source: M&G
0.0
0.5
1.0
2.0
2.5
1.5
3.0
65 67 69 71 73 75 77 79 81 83 85 87 89 91 93 95 97 99 01 03 05 07 09 11 13 15 17
Annual distributions since launch of the share class Chart date 3 July 2017
Sterling Class ‘A’ (Income) shares
Year ending June
Dis
trib
utio
n (p
ence
per
sha
re)
Source: M&G
Historic yield
The chart below shows the historic yield of Sterling Class ‘A’ (Income)shares against that of a comparative index.
Historic yield: The historic yield reflects distributions declared over thepast twelve months as a percentage of the mid-market price, as at thedate shown. It does not include any preliminary charge and investorsmay be subject to tax on their distributions.
2
4
6
8
10
12
14
16
65 67 69 71 73 75 77 79 81 83 85 87 89 91 93 95 97 99 01 03 05 07 09 11 13 15 17 18
Yield comparison from May 1964 = 100, plotted monthly Chart date 2 January 2018
Sterling Class ‘A’ (Income) shares yield
FTSE All-Share Index yield
Source: Morningstar, Inc. and M&G

20
Financial highlightsFund performance
19
Sterling Class ‘I’ Accumulation share performanceThe share class was launched on 3 August 2012.
Six months to Year to Year to 31.12.17 30.06.17 30.06.16Change in NAV per share UK p UK p UK p
Opening NAV 1,608.51 1,327.98 1,358.02Return before operating charges and after directportfolio transaction costs 16.92 294.13 (17.92)Operating charges (7.18) (13.60) (12.12)
Return after operating charges 9.74 280.53 (30.04)
Distributions (13.96) (56.52) (63.88)
Retained distributions 13.96 56.52 63.88
Closing NAV 1,618.25 1,608.51 1,327.98
Direct portfolio transaction costs UK p UK p UK p
Costs before dilution adjustments 1.02 2.09 2.74Dilution adjustments [a] (0.25) (0.30) (0.42)
Total direct portfolio transaction costs 0.77 1.79 2.32
Performance and charges % % %
Direct portfolio transaction costs [b] 0.10 0.12 0.17Operating charges 0.91 0.91 0.91Return after operating charges +0.61 +21.12 -2.21Historic yield 3.45 3.52 4.70Effect on yield of charges offset against capital 0.01 0.01 0.91
Other information
Closing NAV (£’000) 22,809 19,636 16,664Closing NAV percentage of total fund NAV (%) 1.76 1.52 1.37Number of shares 1,409,497 1,220,766 1,254,832Highest share price (UK p) 1,632.10 1,657.16 1,398.07Lowest share price (UK p) 1,544.43 1,343.61 1,213.02
[a] In respect of direct portfolio transaction costs.
[b] As a percentage of average net asset value.
To give an indication of how the fund has performed during the periodthe tables below show the performance of Sterling Class ‘A’(Accumulation) and Sterling Class ‘I’ (Accumulation) shares.
All ‘Performance and charges’ percentages represent an annual rateexcept for the ‘Return after operating charges’ which is calculated asa percentage of the opening net asset value per share (NAV). ‘Dilutionadjustments’ are only in respect of direct portfolio transaction costs.
Historic yields for the current period are calculated as at 12 January 2018.
Sterling Class ‘A’ Accumulation share performanceThe share class was launched on 6 May 1964.
Six months to Year to Year to 31.12.17 30.06.17 30.06.16Change in NAV per share UK p UK p UK p
Opening NAV 714.80 594.58 612.62
Return before operating charges and after directportfolio transaction costs 7.46 131.29 (8.10)
Operating charges (5.81) (11.07) (9.94)
Return after operating charges 1.65 120.22 (18.04)
Distributions (4.01) (20.18) (28.70)
Retained distributions 4.01 20.18 28.70
Closing NAV 716.45 714.80 594.58
Direct portfolio transaction costs UK p UK p UK p
Costs before dilution adjustments 0.45 0.93 1.23
Dilution adjustments [a] (0.11) (0.13) (0.19)
Total direct portfolio transaction costs 0.34 0.80 1.04
Performance and charges % % %
Direct portfolio transaction costs [b] 0.10 0.12 0.17
Operating charges 1.66 1.66 1.66
Return after operating charges +0.23 +20.22 -2.94
Historic yield 2.69 2.83 4.72
Effect on yield of charges offset against capital 0.01 0.01 1.66
Other information
Closing NAV (£’000) 82,347 88,701 80,425
Closing NAV percentage of total fund NAV (%) 6.36 6.89 6.64
Number of shares 11,493,837 12,409,112 13,526,383
Highest share price (UK p) 724.97 736.85 630.43
Lowest share price (UK p) 685.24 601.50 544.66

22
Financial highlightsOperating charges and portfolio transaction costs
21
• Direct portfolio transaction costs: Broker execution commissionand taxes.
• Indirect portfolio transaction costs: ‘Dealing spread’ – thedifference between the buying and selling prices of the fund’sinvestments; some types of investment, such as fixed interestsecurities, have no direct transaction costs and only the dealingspread is paid.
Investments are bought or sold by a fund when changes are made tothe investment portfolio and in response to net flows of money into orout of the fund from investors buying and selling shares in the fund.
To protect existing investors, portfolio transaction costs incurred as aresult of investors buying and selling shares in the fund are recoveredfrom those investors through a ‘dilution adjustment’ to the price theypay or receive. The table below shows direct portfolio transaction costspaid by the fund before and after that part of the dilution adjustmentrelating to direct portfolio transaction costs. To give an indication of theindirect portfolio dealing costs the table also shows the averageportfolio dealing spread.
Further information on this process is in the Prospectus, which isavailable free of charge on request either from our website atwww.mandg.co.uk/prospectuses or by calling M&G Customer Relations.
Portfolio transaction costs
Six months to Year to Year to Average [a]
31.12.17 30.06.17 30.06.16 Direct portfolio transaction costs [b] % % % %
Broker commission 0.02 0.04 0.05 0.04
Taxes 0.11 0.10 0.15 0.12
Costs before dilution adjustments 0.13 0.14 0.20 0.16
Dilution adjustments [c] (0.03) (0.02) (0.03) (0.03)
Total direct portfolio transaction costs 0.10 0.12 0.17 0.13
as at 31.12.17 30.06.17 30.06.16 Average [a]
Indirect portfolio transaction costs % % % %
Average portfolio dealing spread 0.11 0.12 0.13 0.12
[a] Average of first three columns.
[b] As a percentage of average net asset value.
[c] In respect of direct portfolio transaction costs. Please see the section above this
table for an explanation of dilution adjustments.
We explain below the payments made to meet the ongoing costs ofinvesting and managing the fund, comprising operating charges andportfolio transaction costs.
Operating charges
Operating charges include payments made to M&G and to providersindependent of M&G:
• Investment management: Charge paid to M&G for investmentmanagement of the fund (also known as Annual ManagementCharge).
• Administration: Charge paid to M&G for administration servicesin addition to investment management – any surplus from thischarge will be retained by M&G.
• Oversight and other independent services: Charges paid toproviders independent of M&G for services which includedepositary, custody and audit.
• Ongoing charges from underlying funds: Ongoing charges onholdings in underlying funds that are not rebated.
Operating charges do not include portfolio transaction costs or any entryand exit charges (also known as initial and redemption charges). Thecharging structures of share classes may differ, and therefore theoperating charges may differ.
Operating charges are the same as the ongoing charges shown in theKey Investor Information Document, other than where an estimate hasbeen used for the ongoing charge because a material change has madethe operating charges unreliable as an estimate of future charges.
For this fund there is no difference between operating charges andongoing charges figures, unless disclosed under the specific shareclass performance table.
Portfolio transaction costs
Portfolio transaction costs are incurred by funds when buying andselling investments. These costs vary depending on the types ofinvestment, their market capitalisation, country of exchange andmethod of execution. They are made up of direct and indirect portfoliotransaction costs:

56596_SR_310818
Contact
Customer Relations* 0800 390 390
Write to us at:**M&G Securities Limited
PO Box 9039
Chelmsford
CM99 2XG
Our website: www.mandg.co.uk
Email us with queries:†
*
For security purposes and to improve the quality of our service, we may record and monitor telephone calls. You will require your M&G client reference. Failure to provide this will affect your ability to transact with us.
** Please remember to quote your name and M&G client reference and sign any written communication to M&G. Failure to provide this may affect your ability to transact with us.
† Please note that information contained within an email cannot be guaranteed as secure. We advise that you do not include any sensitive information when corresponding with M&G in this way.
M&G Securities Limited is authorised and regulated by the Financial Conduct Authorityand provides investment products. The company’s registered office is LaurencePountney Hill, London EC4R 0HH. Registered in England number 90776.
Interim Short Report December 2017For the six months ended 31 December 2017
a sub-fund of M&G Investment Funds (3)
M&G Dividend Fund