mexico - iuj.ac.jp · the aztec empire was brought to an end by the spanish conquistadores who made...
TRANSCRIPT
COUNTRY PROFILE 2001
MexicoThis Country Profile is a reference tool, which providesanalysis of historical political, infrastructural and economictrends. It is revised and updated annually. The EIU’squarterly Country Reports analyse current trends andprovide a two-year forecast
The full publishing schedule for Country Profiles is nowavailable on our website at http://www.eiu.com/schedule
The Economist Intelligence Unit15 Regent St, London SW1Y 4LRUnited Kingdom
The Economist Intelligence UnitThe Economist Intelligence Unit is a specialist publisher serving companies establishing and managingoperations across national borders. For over 50 years it has been a source of information on businessdevelopments, economic and political trends, government regulations and corporate practice worldwide.
The EIU delivers its information in four ways: through our digital portfolio, where our latest analysis isupdated daily; through printed subscription products ranging from newsletters to annual referenceworks; through research reports; and by organising seminars and presentations. The firm is a member ofThe Economist Group.
LondonThe Economist Intelligence Unit15 Regent StLondonSW1Y 4LRUnited KingdomTel: (44.20) 7830 1007Fax: (44.20) 7499 9767E-mail: [email protected]
New YorkThe Economist Intelligence UnitThe Economist Building111 West 57th StreetNew YorkNY 10019, USTel: (1.212) 554 0600Fax: (1.212) 586 1181/2E-mail: [email protected]
Hong KongThe Economist Intelligence Unit25/F, Dah Sing Financial Centre108 Gloucester RoadWanchaiHong KongTel: (852) 2585 3888Fax: (852) 2802 7638E-mail: [email protected]
Website: http://www.eiu.com
Electronic deliveryThis publication can be viewed by subscribing online at http://store.eiu.com
Reports are also available in various other electronic formats, such as CD-ROM, Lotus Notes, on-linedatabases and as direct feeds to corporate intranets. For further information, please contact your nearestEconomist Intelligence Unit office
London: Jan Frost Tel: (44.20) 7830 1183 Fax: (44.20) 7830 1023New York: Dante Cantu Tel: (1.212) 554 0643 Fax: (1.212) 586 1181Hong Kong: Amy Ha Tel: (852) 2802 7288/2585 3888 Fax: (852) 2802 7720/7638
Copyright© 2001 The Economist Intelligence Unit Limited. All rights reserved. Neither this publication norany part of it may be reproduced, stored in a retrieval system, or transmitted in any form or by anymeans, electronic, mechanical, photocopying, recording or otherwise, without the prior permissionof The Economist Intelligence Unit Limited.
All information in this report is verified to the best of the author’s and the publisher’s ability. However,the EIU does not accept responsibility for any loss arising from reliance on it.
ISSN 0269-5596
Symbols for tables“n/a” means not available; “–” means not applicable
Printed and distributed by Redhouse Press Ltd, Unit 151, Dartford Trade Park, Dartford, Kent DA1 1QB, UK

!

EIU Country Profile 2001 © The Economist Intelligence Unit Limited 2001
Comparative economic indicators,

1
EIU Country Profile 2001 © The Economist Intelligence Unit Limited 2001
Contents
3 Basic data
4 Political background4 Historical background9 Constitution and institutions
10 Political forces13 International relations and defence
14 Resources and infrastructure14 Population15 Education16 Health17 Natural resources and the environment18 Transport and communications20 Energy provision
22 The economy22 Economic structure23 Economic policy26 Economic performance28 Regional trends
29 Economic sectors29 Agriculture, forestry and fishing30 Manufacturing32 Mining and semi-processing33 Construction34 Financial services37 Other services
38 The external sector38 Trade in goods40 Invisibles and the current account42 Capital flows and external debt44 Foreign reserves and the exchange rate
46 Appendices46 Sources of information49 Reference tables49 Population49 Labour force49 Unemployment rates in urban areas50 Crude oil and gas production50 Non-financial public-sector finances50 Federal government budget revenue and expenditure51 Money supply and credit51 Interest rates51 Gross domestic product52 Gross domestic product by sector52 Gross domestic product by expenditure52 Prices and earnings

2
EIU Country Profile 2001 © The Economist Intelligence Unit Limited 2001
53 Production of principal crops53 Livestock production53 Manufacturing production54 Minerals production54 Stockmarket indicators54 Merchandise sales54 Tourism55 Main exports and imports55 Main trading partners56 Direction and composition of trade, 199957 Balance of payments, national statistics57 Balance of payments, IMF estimates58 Total foreign investment58 External debt, World Bank estimates58 Gross external debt, national estimates59 Amortisation schedule of global external debt59 Foreign reserves59 Exchange rates

Mexico 3
EIU Country Profile 2001 © The Economist Intelligence Unit Limited 2001
Mexico
Basic data
1,953,162 sq km
97.4m (February 14th 2000, preliminary estimate from Instituto Nacional deEstadística, Geografía e Informática 2000 census)
Population (m), 2000
Mexico City (capital) 17.8Guadalajara 3.7Monterrey 3.2
Tropical in the south, temperate in the highlands, dry in the north
Hottest month, May, 12-26°C (average daily minimum and maximum); coldestmonth, January, 6-19°C; driest month, February, 5 mm average rainfall; wettestmonth, July, 170 mm average rainfall
Spanish is the official language. Over 60 indigenous languages are also spoken,mainly Náhuatl, Maya, Zapoteco and Mixteco
Metric system; also old Spanish measures
Peso. Average exchange rate in 2000: Ps9.46:US$1; exchange rate at end-January 2001: Ps9.68:US$1
Six hours behind GMT in Mexico City
January 1st, February 5th, March 21st, Maundy Thursday, Good Friday, May 1stand 5th, September 16th, October 12th, All Souls’ Day (partial), November20th, December 12th (partial) and 25th
Land area
Population
Main towns
Climate
Weather in Mexico City(altitude 2,309 metres)
Languages
Measures
Currency
Time
Public holidays

4 Mexico
EIU Country Profile 2001 © The Economist Intelligence Unit Limited 2001
Political background
The election of Vicente Fox Quesada of the Partido Acción Nacional (PAN) aspresident in July 2000 signified the start of a new era in Mexico’s political life,ending seven decades of domination of the political system by the PartidoRevolucionario Institucional (PRI). Mr Fox will maintain the disciplinedmarket-oriented policies pursued by the past three PRI governments. The newpresident will have to work with opposition parties to pass legislation as for thefirst time in the country’s history no political party has an absolute majorityeither in the Chamber of Deputies (for the 2000-03 legislature) or in the Senate(for the 2000-06 legislature).
Historical background
Mexico’s early history was characterised by the rise and fall of several civilis-ations, including the Olmecs, the Mayas and the Aztecs. The Aztec empire wasbrought to an end by the Spanish conquistadores who made New Spain, com-prising the states of the US south-west, Mexico and Central America, a colonyin 1521. Independence from Spain was achieved in 1821.
Independence did not signal peace and prosperity. For more than a generationMexico was subject to civil wars and predatory incursions. Texas seceded fromMexico in 1835-36. In 1845 a war broke out with the US, which was to costMexico the additional loss of California, Arizona and New Mexico. In 1864France imposed a Hapsburg archduke, Maximilian, as emperor. However, afterthe withdrawal of French troops in 1867, the archduke was quickly overthrownand executed. Under the dictatorship of Porfirio Díaz (1876-1911) order wasimposed and the economy developed. But when General Díaz engineered hisown re-election for the seventh time in 1910, opposition forces led byFrancisco Madero resorted to arms. They were joined by rebel peasants underthe leadership of Emiliano Zapata. General Díaz was forced into exile in 1911and Mr Madero became president, but he was ousted and killed in 1913. Newrebellions followed and although the rebels were crushed, their ideals, in-cluding land reform, were incorporated into a new constitution in 1917.
Plutarco Elías Calles, president between 1924 an 1928, did much to shapefuture political developments, particularly through the creation of the PartidoNacional Revolucionario (PNR). Another important presidency was that ofLázaro Cárdenas (1934-40), who carried out extensive land redistribution andexpropriated foreign oil companies. In 1945 the party was renamed the PRI.For many years sustained economic growth ensured the PRI a high degree ofpopular support. A corporatist system was developed as the regime co-optedany potential opponents such as the labour and peasant movements. When itconsidered it necessary, the PRI resorted to electoral fraud in order to ensure anabsolute monopoly of power. Political stability came under strain in the late1960s when intellectuals and students, influenced by left-wing ideals, soughtmore political openness, but were repressed by the state. A deterioration in
Instability and dictatorshipfollow independence
The PRI created

Mexico 5
EIU Country Profile 2001 © The Economist Intelligence Unit Limited 2001
economic policy in the 1970s precipitated an external debt crisis in 1982 andthe president, Miguel de la Madrid (1982-88), was forced to embark on apolitically costly process of structural economic reform.
Important recent events
January 1994: North-American Free Trade Agreement (NAFTA) commences.Peasant rebel uprising in Chiapas, but the military threat is quickly contained.
March 1994: Assassination of Luis Donaldo Colosio, presidential candidatefor the ruling PRI. Ernesto Zedillo Ponce de León is nominated as the party’sreplacement candidate and is elected president in August.
December 1994: Mr Zedillo takes office. Precipitous devaluation of the pesoleads to a banking crisis and deep recession in 1995.
July 1996: All political parties in Congress agree on constitutional changes toimplement a radical electoral reform, passed later in the year.
July 1997: National elections. For the first time in nearly 70 years, the PRIloses majority control of the Chamber of Deputies. The election for the govern-orship of Mexico City, the first held since 1928, is won by CuauhtémocCárdenas of the Partido de la Revolución Democrática (PRD). The PAN alsomakes important advances, winning the governorships of Querétaro and theimportant industrial state of Nuevo León.
September 1997: The four opposition parties in Congress unite to outvotethe PRI on major issues, creating a counterweight to the executive.
1998-99: The opposition continues to advance, but the PRI proves resilient. Of17 governorships contested in 1998-99, just five go to the opposition, includingthree to the PRD, its first state governorships. Francisco Labastida wins the first-ever PRI presidential primary held at the end of 1999.
July-December 2000: National elections. Vicente Fox Quesada, the PAN’spresidential candidate, defeats Mr Labastida, ending 71 years of PRI rule. ThePRD wins Mexico City again, as well as the governorship of the state ofChiapas in coalition with the PAN. After an uneventful transition period,Mr Fox takes office on December 1st, appointing a mostly non-partisan pro-business cabinet.
PRI presidential candidates were traditionally chosen by the outgoing pres-ident. In a bid to influence the decision, a section of the party led by a formerPRI president, Porfirio Muñoz Ledo, and a former governor of Michoacán,Cuauhtémoc Cárdenas, son of Lázaro Cárdenas, formed the CorrienteDemocrática (CD). When Mr de la Madrid selected Carlos Salinas de Gortari asthe PRI’s candidate in the 1988 election, the CD split from the PRI. Mr Cárdenasstood in the election and managed to attract the support of most of the left forhis Frente Democrático Nacional (FDN) alliance. The official results, alleged tobe fraudulent, gave Mr Salinas victory with only 50.4% of the vote. PRIgovernments had rarely announced victories of less than 85% before 1982.
The 1988 election marredby allegations of fraud
6 Mexico
EIU Country Profile 2001 © The Economist Intelligence Unit Limited 2001
During his presidency (1988-94) Mr Salinas restructured the economy and per-mitted some electoral gains by the opposition, for example, of governorships,which had previously been monopolised by the PRI. An uprising in Chiapasstate in January 1994 by the Ejército Zapatista de Liberación Nacional (EZLN)highlighted the fact that despite economic progress, social tensions weremounting. Consequently, as well as negotiating with the EZLN, the govern-ment enacted comprehensive electoral reform, including the granting of auto-nomy to the Instituto Federal Electoral (IFE, the electoral authority), along withother measures to diminish the possibility of electoral fraud. Elections held inAugust 1994 were recognised generally as transparent. Ernesto Zedillo Ponce deLeón of the PRI won the presidential contest with 50.2% of the valid votes cast.Diego Fernández de Cevallos of the right-wing PAN polled 26.7%.Mr Cárdenas, who stood for the left-wing Partido de la RevoluciónDemocrática (PRD), took 17.1% of the vote. In Congress the PRI held on to itsmajority, but lost seats to both the PAN and the PRD.
Mr Zedillo (1994-2000) continued the process of political change. Progress onelectoral reform was slow, but a breakthrough was finally achieved in July 1996when representatives of all four parties in Congress—the PRI, the PAN, the PRDand the left-wing Partido del Trabajo (PT)—agreed to new election rules andapproved the necessary constitutional changes. However, the specific legis-lation was approved by the PRI alone, because of disagreements about the levelof public funding permitted for political parties and restrictions placed on theformation of political coalitions.
The new rules were introduced in time for the 1997 mid-term congressionalelections. The governorships of six states and Mexico City were also disputed.For the first time in almost 70 years, the PRI lost its majority in the Chamber ofDeputies. The most important gains were made by the PRD, which became thesecond most important force in the new Congress and won the governorshipof Mexico City. The PAN also won congressional seats and the governorships ofNuevo León and Querétaro, thereby gaining control of six of 31 states. Thefour opposition parties that won seats in the Chamber of Deputies in July 1997united to control it, but the alliance proved fragile. The PAN at times joinedwith the PRI to approve important economic legislation, with the PRDcategorically opposed to the government.
Of the 17 governorships contested in 1998-99, 12 were won by the PRI, one bythe PAN, three by the PRD—each of them in former PRI strongholds, withestranged PRI members as candidates—and one by a coalition headed by thePAN and the PRD. Thus by the beginning of 2000 the opposition held the gov-ernorships of ten states. Confidence in clean elections had increased and can-didates and regional issues had become more important.
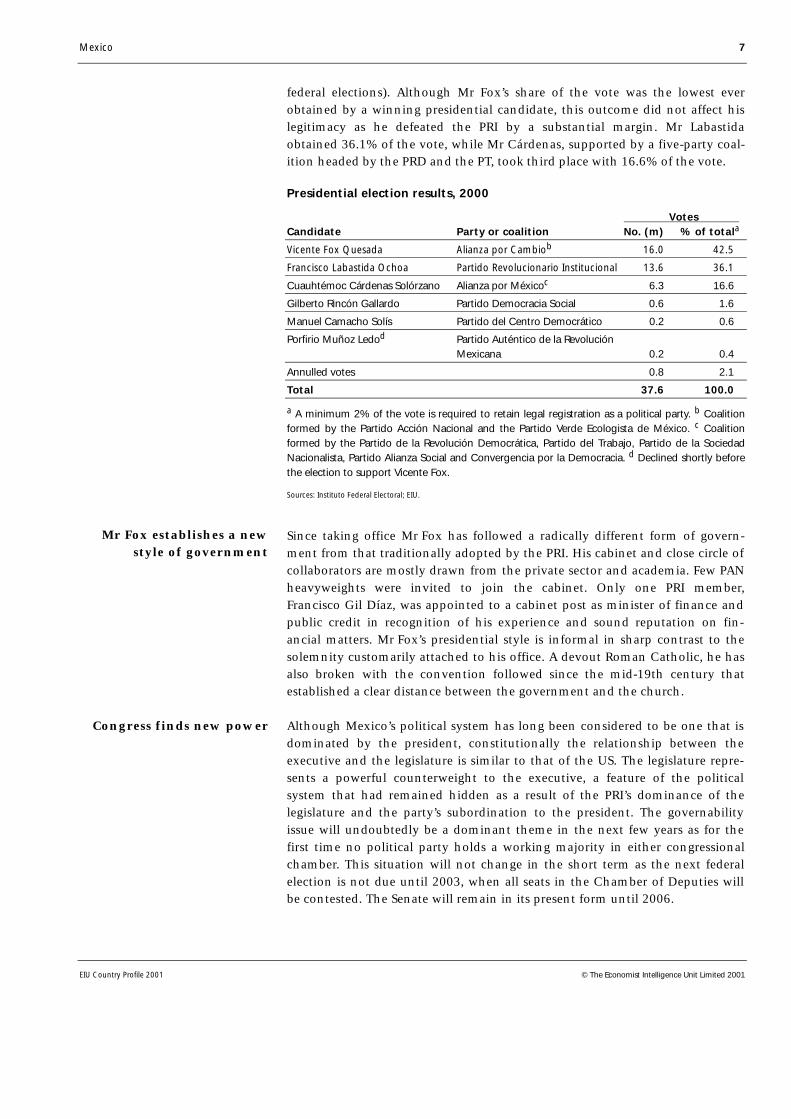
The elections held in July 2000, the most open and democratic to date, broughtsweeping political change when Mr Fox, the candidate of the coalition formedby the PAN and the green Partido Verde Ecologista de México (PVEM), defeatedthe PRI’s candidate, Francisco Labastida, ending the party’s 71-year reign.Mr Fox won the presidency with 42.5% of the vote (there are no run-offs in
Reforms accelerate inresponse to unrest in 1994
Patchy progress onpolitical reform in 1995-96
Gains for the oppositionin 1997
A multiparty democracyemerges
The PRI loses the 2000presidential election
Mexico 7
EIU Country Profile 2001 © The Economist Intelligence Unit Limited 2001
federal elections). Although Mr Fox’s share of the vote was the lowest everobtained by a winning presidential candidate, this outcome did not affect hislegitimacy as he defeated the PRI by a substantial margin. Mr Labastidaobtained 36.1% of the vote, while Mr Cárdenas, supported by a five-party coal-ition headed by the PRD and the PT, took third place with 16.6% of the vote.
Presidential election results, 2000
Votes Candidate Party or coalition No. (m) % of totala
Vicente Fox Quesada Alianza por Cambiob 16.0 42.5
Francisco Labastida Ochoa Partido Revolucionario Institucional 13.6 36.1
Cuauhtémoc Cárdenas Solórzano Alianza por Méxicoc 6.3 16.6
Gilberto Rincón Gallardo Partido Democracia Social 0.6 1.6
Manuel Camacho Solís Partido del Centro Democrático 0.2 0.6
Porfirio Muñoz Ledod Partido Auténtico de la RevoluciónMexicana 0.2 0.4
Annulled votes 0.8 2.1
Total 37.6 100.0
a A minimum 2% of the vote is required to retain legal registration as a political party. b Coalitionformed by the Partido Acción Nacional and the Partido Verde Ecologista de México. c Coalitionformed by the Partido de la Revolución Democrática, Partido del Trabajo, Partido de la SociedadNacionalista, Partido Alianza Social and Convergencia por la Democracia. d Declined shortly beforethe election to support Vicente Fox.
Sources: Instituto Federal Electoral; EIU.
Since taking office Mr Fox has followed a radically different form of govern-ment from that traditionally adopted by the PRI. His cabinet and close circle ofcollaborators are mostly drawn from the private sector and academia. Few PANheavyweights were invited to join the cabinet. Only one PRI member,Francisco Gil Díaz, was appointed to a cabinet post as minister of finance andpublic credit in recognition of his experience and sound reputation on fin-ancial matters. Mr Fox’s presidential style is informal in sharp contrast to thesolemnity customarily attached to his office. A devout Roman Catholic, he hasalso broken with the convention followed since the mid-19th century thatestablished a clear distance between the government and the church.
Although Mexico’s political system has long been considered to be one that isdominated by the president, constitutionally the relationship between theexecutive and the legislature is similar to that of the US. The legislature repre-sents a powerful counterweight to the executive, a feature of the politicalsystem that had remained hidden as a result of the PRI’s dominance of thelegislature and the party’s subordination to the president. The governabilityissue will undoubtedly be a dominant theme in the next few years as for thefirst time no political party holds a working majority in either congressionalchamber. This situation will not change in the short term as the next federalelection is not due until 2003, when all seats in the Chamber of Deputies willbe contested. The Senate will remain in its present form until 2006.
Congress finds new power
Mr Fox establishes a newstyle of government
8 Mexico
EIU Country Profile 2001 © The Economist Intelligence Unit Limited 2001
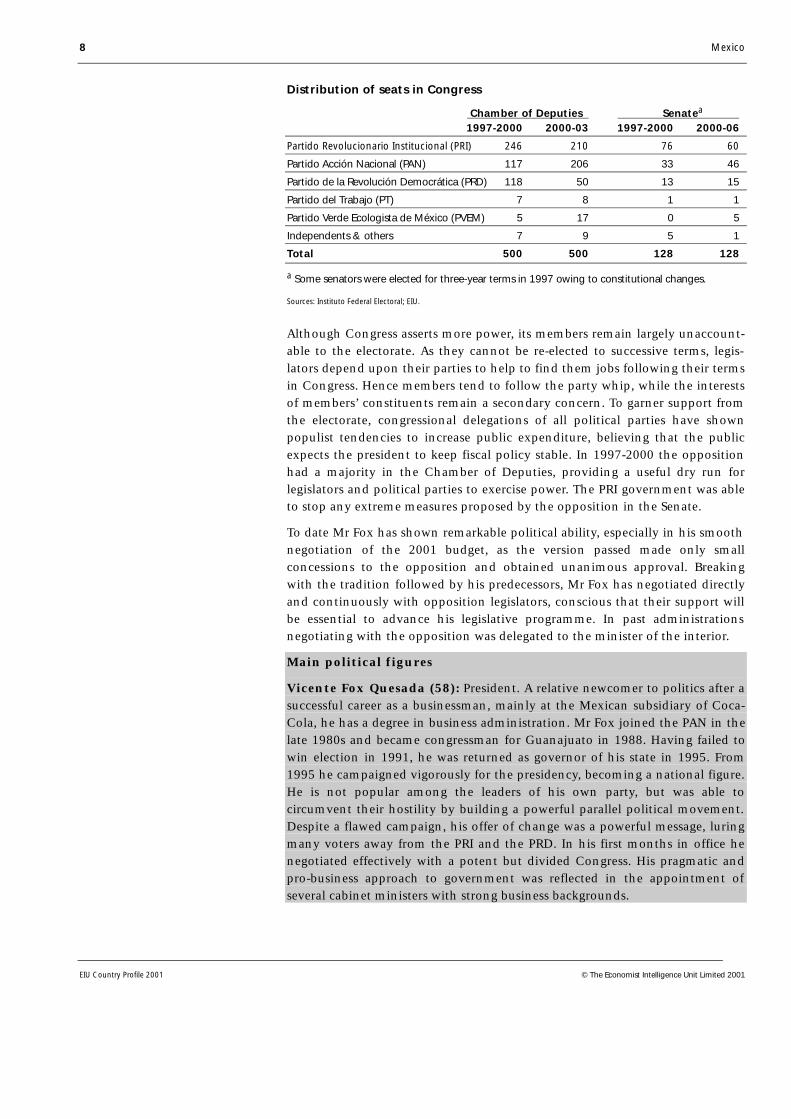
Distribution of seats in Congress
Chamber of Deputies Senatea
1997-2000 2000-03 1997-2000 2000-06
Partido Revolucionario Institucional (PRI) 246 210 76 60
Partido Acción Nacional (PAN) 117 206 33 46
Partido de la Revolución Democrática (PRD) 118 50 13 15
Partido del Trabajo (PT) 7 8 1 1
Partido Verde Ecologista de México (PVEM) 5 17 0 5
Independents & others 7 9 5 1
Total 500 500 128 128
a Some senators were elected for three-year terms in 1997 owing to constitutional changes.
Sources: Instituto Federal Electoral; EIU.
Although Congress asserts more power, its members remain largely unaccount-able to the electorate. As they cannot be re-elected to successive terms, legis-lators depend upon their parties to help to find them jobs following their termsin Congress. Hence members tend to follow the party whip, while the interestsof members’ constituents remain a secondary concern. To garner support fromthe electorate, congressional delegations of all political parties have shownpopulist tendencies to increase public expenditure, believing that the publicexpects the president to keep fiscal policy stable. In 1997-2000 the oppositionhad a majority in the Chamber of Deputies, providing a useful dry run forlegislators and political parties to exercise power. The PRI government was ableto stop any extreme measures proposed by the opposition in the Senate.
To date Mr Fox has shown remarkable political ability, especially in his smoothnegotiation of the 2001 budget, as the version passed made only smallconcessions to the opposition and obtained unanimous approval. Breakingwith the tradition followed by his predecessors, Mr Fox has negotiated directlyand continuously with opposition legislators, conscious that their support willbe essential to advance his legislative programme. In past administrationsnegotiating with the opposition was delegated to the minister of the interior.
Main political figures
Vicente Fox Quesada (58): President. A relative newcomer to politics after asuccessful career as a businessman, mainly at the Mexican subsidiary of Coca-Cola, he has a degree in business administration. Mr Fox joined the PAN in thelate 1980s and became congressman for Guanajuato in 1988. Having failed towin election in 1991, he was returned as governor of his state in 1995. From1995 he campaigned vigorously for the presidency, becoming a national figure.He is not popular among the leaders of his own party, but was able tocircumvent their hostility by building a powerful parallel political movement.Despite a flawed campaign, his offer of change was a powerful message, luringmany voters away from the PRI and the PRD. In his first months in office henegotiated effectively with a potent but divided Congress. His pragmatic andpro-business approach to government was reflected in the appointment ofseveral cabinet ministers with strong business backgrounds.
Mexico 9
EIU Country Profile 2001 © The Economist Intelligence Unit Limited 2001
Cuauhtémoc Cárdenas Solórzano (67): Three times presidential candidateand despite his lacklustre performance in the 1994 and 2000 elections, theundisputed leading voice of the PRD. He was a PRI senator in 1976, under-secretary for agriculture in 1976-80 and governor of Michoacán in 1980-86.When he left the PRI to run for president in 1988 he successfully united whathad been a fragmented left-wing opposition. Having lost an election marred byfraud, his stature declined under the Salinas administration and he achievedonly third place in a relatively clean election in 1994. Making an impressivepolitical comeback, Mr Cárdenas won the 1997 Mexico City election by a land-slide. However, his uninspiring performance once in office and his inability toappeal to voters in the middle ground eliminated any chance he might havehad of winning the presidency. His determination to remain the PRD’s mainfigurehead is causing divisions within the organisation, but no other partymember has the stature to challenge him.
Santiago Creel Miranda (47): Interior minister. Mr Creel, a lawyer in pri-vate practice with links to academia, received the PAN’s nomination to becomea member of the IFE in 1994, just as that organisation had been granted fullautonomy. He became a deputy for the PAN in 1997, although he was notofficially a party member until 1999, building his political reputation as one ofthe main leaders of the opposition bloc that held a majority in the Chamber ofDeputies. In 2000 he stood as the PAN’s candidate in the contest for the gov-ernorship of Mexico City and came a close second to the PRD. In his role asinterior minister Mr Creel has dealt skilfully with opposition parties, helped byhis legislative experience.
Roberto Madrazo Pintado (50): In 1999 Mr Madrazo stood for the PRIpresidential nomination against the eventual winner, Mr Labastida, gainingstanding as a party heavyweight. He is popular among the PRI’s grassroots ashe has had a long career in the party, having risen from being a leader of itsyouth movement to the post of party secretary. Mr Madrazo was governor ofTabasco in 1995-2000 and has been twice been elected to the Chamber ofDeputies—in 1976-79 and in 1991-94—and to the Senate in 1988-91.
Felipe Calderón Hinojosa (38): PAN leader in the Chamber of Deputies.Despite his youth Mr Calderón is one of the main leaders within his party,having been head of its youth movement in 1987-89, secretary-general in1993-95 and president in 1996-99. A local congressman in the Mexico Cityassembly in 1988-91, he was first elected to Congress in 1991-94 and is nowserving his second term as a federal congressman. As PAN leader in the lowerhouse he treads a fine line: never a supporter of Mr Fox, he has statedrepeatedly that the president does not have the unquestioning support of PANlegislators, while recognising that he cannot obstruct the first PAN adminis-tration in history too militantly.
Constitution and institutions
The constitution of 1917, which is still in force, was a far more social docu-ment than that written in 1857. Apart from subordinating the rights of privateproperty to the public interest and making specific provision for land reform, it
A resilient constitution

10 Mexico
EIU Country Profile 2001 © The Economist Intelligence Unit Limited 2001
stressed the rights of labour and also curtailed greatly the power and influenceof the clergy. The constitution also established the framework for a federalsystem of government covering 31 states and the Distrito Federal (the FederalDistrict, which includes Mexico City) and provided for the separation of exec-utive, legislative and judicial powers. In practice government has been central-ised and the president has had far greater powers than Congress, as well as con-siderable influence over the judiciary. The dominance of the president hasstarted to diminish recently. Reforms implemented in the mid-1990s gave theSupreme Court greater autonomy and Congress has also emerged as a moreimportant political force since the PRI lost majority control of the Chamber ofDeputies in 1997. Mr Fox called for a thorough revision of the constitution inFebruary 2001, but it is highly improbable that Congress would agree to anyradical overhaul in the near term.
Congress comprises the Senate and the Chamber of Deputies. Senators servefor six years and deputies for three years. In the Chamber of Deputies 300 seatsare allocated using the first-past-the-post system and 200 by proportionalrepresentation. In the Senate 96 seats are elected directly, while 32 are electedby proportional representation. Of the directly elected seats in the Senate, 64are elected on a first-past-the-post basis and 32 are elected using the first min-ority principle. Reforms approved by Congress in 1996 made it easier for asingle party to gain a working majority in Congress, but impossible for any oneparty to achieve the two-thirds majority necessary to change the constitution.Despite these reforms, the 2000 election result was unprecedented in that noone party enjoys a working majority in either house.
The most important political post in the cabinet is that of interior minister asthe Ministry of the Interior is charged with preserving the country’s politicalstability. The Ministry of Finance and Public Credit is responsible for economicpolicymaking at the highest level, although the Ministry of the Economy(formerly the Ministry for Trade and Industry) also plays a major role.
Political forces
Three parties dominate the political landscape: the PAN, the PRI and the PRD.After more than 60 years in opposition, the PAN won the presidency in theJuly 2000 election. The PAN was founded in 1939 and has built up a supportbase mainly in northern and central states and among the urban middleclasses, although it has widened slightly beyond these groups since the early1990s. Although inclined to free-market policies, the party has also shownsome populist tendencies. The leadership of Luis Felipe Bravo Mena, who waselected president of the party in March 1999, has been undermined by theauthority of the party chiefs in Congress and by the powerful personality ofMr Fox. PAN members are divided in their support for Mr Fox. Although nearlyall members are pleased that the PAN nominee won the presidency, asignificant number also feel that Mr Fox hijacked the party as a vehicle tofurther his personal ambition. In the main Mr Fox shares the party’s policyorientation, notably in his strong support for free-market policies, but he has
Composition of Congress
Ranking of ministries
Political parties and groups

Mexico 11
EIU Country Profile 2001 © The Economist Intelligence Unit Limited 2001
never presented himself as a loyal party servant and may break from PANpositions on occasion. As a result of his uncertain loyalty to the party line, thePAN cannot count on Mr Fox to put its interests first. Conversely, the presidentcannot count on the full support of his own party for his legislative initiatives.But this apparent disadvantage has helped the government to work more easilywith opposition parties.
For the first time since it was established in 1929, the PRI is in opposition atthe federal level, a reality that has proved difficult for most of its members toaccept. Detached from presidential power, the PRI is struggling to reinventitself. Having lacked any coherent ideology for decades, the party became ameans of winning and exercising power, and largely followed the direction setby the president. In addition, since the early 1980s a clear separationdeveloped between the party’s traditionalists, who are mostly positioned in thelegislature and local government, and its technocrats, who although only aminority hold important positions in the executive. Following the loss of thepresidency, a battle for control of the party will take place in 2001, aconfrontation that may well bring important defections and splinters. Mostprobably the PRI will evolve into a party of the centre-left with a socialdemocratic agenda. But if the party manages to stay together, it will remain apowerful political force and could regain the presidency in 2006. Currently thePRI has 18 of the 31 state governorships and the biggest parliamentary groupsboth in the Chamber of Deputies and the Senate.
The PRD was formed in 1989 by the groups that had supported Mr Cárdenas’spresidential bid in 1988. After his defeat in the 1994 election, the party suffereda temporary decline in importance. Between 1996 and 1999 under theleadership of Andrés Manuel López Obrador the party’s electoral fortunes im-proved, partly owing to the significant protest vote against the governmentduring the economic crisis. When Mr Cárdenas won the governorship ofMexico City with ease in 1997, the PRD became the second most importantforce in Congress. The party diversified its base by embracing disaffected PRImembers, wresting from its control states that had previously been consideredimpregnable. The PRD made important gains by opposing almost any measureproposed by the government. The March 1999 internal election to choose itsnew president was marred by fraud and had to be annulled. After another con-troversial election, senator Amalia García was elected party leader in August1999. Mr Cárdenas managed a distant third place in the 2000 presidentialelection as many of his supporters defected to vote for Mr Fox, while the partyalso suffered broad losses in Congress. The PRD will hold a nationwide partycongress in April 2001. With rival groups emerging, some splintering is likelywhether or not Mr Cárdenas manages to retain his overarching influence.
A three-party system has evolved since 1997, with the small PT and the greenPVEM on the fringes, which occasionally form alliances with the PAN or thePRD on antiPRI electoral tickets. Support from PT and PVEM deputies wascritical to PAN and PRD majorities in the lower house of the legislature in the1997-2000 term as it enabled both parties to enjoy a certain amount ofinfluence in government. Both the PT and the PVEM have lost influence in thenew legislature, while the PVEM did not benefit from having backed Mr Fox’s

12 Mexico
EIU Country Profile 2001 © The Economist Intelligence Unit Limited 2001
presidential bid as he refused to give the party a cabinet post. Six additionalpolitical parties were granted official registry by the electoral authorities at theend of 1999: the Partido de la Sociedad Nacionalista (PSN), the Covergenciapor la Democracia (CPD), the Partido Alianza Social (PAS), the Partido delCentro Democrático (PCD), the Partido Auténtico de la Revolución Mexicana(PARM) and the Partido Democracia Social (PDS). Both the CPD and the PCDare small splinter groups of the PRI. The PSN, the CPD and the PAS joined thePRD and the PT to form the Alianza por México, to support Mr Cárdenas’spresidential candidacy. The PCD, the PARM and the PDS nominated their ownpresidential candidates, but failed to obtain the 2% of votes necessary to keeptheir parties registered. The CPD, the PAS and the PSN managed to win someseats in the Chamber of Deputies as a result of an alliance with the PRD, buttheir numbers are minimal and as the PRD will almost certainly reject forminga coalition with them again, these parties may disappear in the 2003 election.
Civic organisations have developed a degree of strength in recent years. Amongthem is the Barzón (Yoke) movement, which has been at the forefront of adebtors’ revolt. In addition, Mexico has two rebel groups: the EZLN, which isbased in the state of Chiapas, and the Ejército Popular Revolucionario (EPR),based in Guerrero, which divided into splinter groups in 1998-99. No formalpeace negotiations have taken place since 1996 as both the government andthe EZLN have been unwilling to cede on certain questions.
The EZLN, cornered militarily, has a small political base but a formidable prop-aganda machine. In September 1997 a political front, the Frente Zapatista deLiberación Nacional (FZLN), was established to mobilise national support forthe principles of the Zapatistas, but it will not participate in elections. Theprominence of the EZLN has increased since the start of Mr Fox’s presidency ashe is determined to negotiate a peace settlement with the movement. Thepresident removed the army unilaterally from several major positions, liberatedimprisoned EZLN members and most importantly has sent a constitutional in-itiative to Congress that if passed would increase the autonomy of indigenousgroups. However, the Zapatistas have refused to negotiate a final peace accorduntil the legislation is approved, although it is unlikely to be passed byCongress soon. Meanwhile, the EZLN leadership has captured the limelight,although it is unclear whether it aims to become a political force.
Neither the church nor the military are major participants in politics. In 1992the constitution was modified to give official recognition to the RomanCatholic Church. Since then several church leaders have made intermittentattempts to influence public policy, particularly on education, but have beenrebuffed by politicians. The military has also become more prominent incivilian affairs. The institutional loyalty of the armed forces was tested in the2000 political transition, but proved to be strong when Mr Fox appointed aminister of defence of his choosing over several more senior generals.
Forces outside parliament

Mexico 13
EIU Country Profile 2001 © The Economist Intelligence Unit Limited 2001
International relations and defence
Mexico’s foreign policy is defined by its historical relationship with the US, towhich it lost almost one-half of its original territory in the mid-19th century.AntiUS sentiment has remained strong since then, although relations have im-proved in the past decade. Under the Salinas government Mexico into Mexicobecame a signatory to the North American Free-Trade Agreement (NAFTA), theprovisions of which came into force on January 1st 1994. The US adminis-tration of Bill Clinton was quick to offer help when Mexico ran into seriousfinancial difficulties at the end of 1994 by making US$20bn available from theUS Treasury. Relations between the two countries have remained strong,despite the persistent and thorny issues of illegal migration, drug-trafficking,money-laundering and Cuba. The relationship between the US and Mexico isset to become stronger under the presidencies of Mr Fox and George W Bush.The Fox administration espouses an activist foreign policy, a reversal of thenon-interventionist stance adopted by PRI governments since the 1930s, andone that largely supports US initiatives. Mr Bush visited Mexico in February2001 in his first trip outside the US as president, a sign of the increased close-ness between the two countries that started when he was governor of Texas.
Mexico has also strengthened ties with other countries and economic blocs.The country was admitted as a full member of the Asia-Pacific EconomicCo-operation forum in 1993 and to the OECD in 1994, having joined what isnow known as the World Trade Organisation in 1986. Mexico has also pursuedgreater regional integration by entering into free-trade agreements (FTAs) withCosta Rica, Bolivia, Venezuela and Colombia (1995), Nicaragua (1998), Chile(1992 and 1998), Israel and the EU (2000). In addition, Mexico trades withEuropean Free-Trade Area signatories and is a member of the Triangulo delNorte (Northern Triangle) trade bloc alongside Guatemala, Honduras and ElSalvador. The new administration is set to continue to negotiate new FTAs suchas that currently being negotiated with Singapore and preliminary negotiationswith Japan have begun. Mr Fox has also expressed interest in reachingagreement with the Mercado Común del Sur (Mercosur, the southern customsunion), although similar efforts have failed in the past owing to trade conflictsbetween Mexico and Brazil.
Although the armed forces are ill-equipped to defend Mexico from externalaggression, their role in domestic affairs has increased in the past few years. Inaddition to waging a perennial war against drug-traffickers, they have beencalled on to contain guerillas from both the EZLN and the EPR, and even totake on policing duties. But scandals related to corruption and human rightsabuses have tarnished the army’s image. For the 2001 (January-December)fiscal year Congress authorised defence spending, including that for the navy,for a sum equivalent to 0.5% of GDP.
Armed forces, 2000
Active force: 192,770
Reserve force: 300,000
Relations with the USimproving
Priorities of the armedforces

14 Mexico
EIU Country Profile 2001 © The Economist Intelligence Unit Limited 2001
Army: 140,000 soldiers, of which 60,000 are conscripts. There are 12 militaryregions with garrisons in 44 zones. Each garrison comprises 81 infantrybrigades, one of which is mechanised, 19 motorised cavalry brigades, threeartillery regiments and one air-mobile unit. The strategic reserve includes fourarmoured brigades and one presidential guard brigade.
Navy: 37,000 seamen, including 8,600 marines and 1,100 naval air personnel.There are 17 naval regions, six in the Gulf of Mexico and 11 in the PacificOcean. The navy possesses three destroyers and eight frigates.
Air force: 11,770 airmen, including one squadron with ten fighters and 71armed helicopters.
Resources and infrastructure
Population
Mexico’s estimated population in mid-February 2000 stood at 97.4m, acc-ording to preliminary results from the year’s census. The rate of populationgrowth has slowed from more than 3% per year in the early 1970s to just 1.5%per year in the late 1990s. This deceleration reflects declining fertility rates aswell as improved healthcare, which has lowered infant mortality rates. Annualpopulation growth is expected to be 1.4% in 2001. (For historical data on pop-ulation see Reference table 1.)
At the end of 1997 an estimated 34.9% of the population was 14 years orunder. Inevitably this distribution results in pressures on the education systemand the labour market. In 1997 146,865 Mexicans migrated legally to the US,compared with 163,572 in 1996, while between 1988 and 1996 an estimatedaverage of 150,000 people per year migrated there illegally. In 1990 the numberof people of Mexican extraction living in the US was estimated at 13.5m, 4m-5m of whom were born in Mexico. By the end of 1996 an estimated 2.7millegal immigrants from Mexico were living in the US. In October1999-September 2000 1.6m people were apprehended by US border patrols,although this number is inflated by overcounting as many people return to theUS as soon as they are expelled; also, not all of those persons apprehended areof Mexican origin. In October 2000-January 2001 the number of peopleapprehended fell to 330,325, a sharp decline compared with the 425,002people apprehended in the year-earlier period. (For historical data on employ-ment see Reference tables 2 and 3.)
Rural areas show a high level of population dispersion: 96% of the country’stowns and villages have fewer than 1,000 inhabitants and seven out of ten ofthese suffer from high to very high levels of poverty, a factor partly attributableto geographical marginalisation. Within Mexico the search for better livingstandards has led to rural to urban migration, especially to Mexico City and thecities of Monterrey and Guadalajara, but also in more recent times to northernmaquiladora (in-bond assembly for re-export) towns such as Tijuana and
Emigration to the US hasbeen substantial
Internal migration

Mexico 15
EIU Country Profile 2001 © The Economist Intelligence Unit Limited 2001
Ciudad Juárez, as well as to tourist centres such as Cancún. In 1990 some 71%of the population lived in urban areas. According to preliminary estimatesfrom the 2000 census, 47.3% of the total population live in urban areas with atleast 100,000 inhabitants.
Immigrant population of statesa, 1995(% of state population that is immigrant)
Quintana Roo 53.4
Baja California 49.5
Estado de México 38.5
Morelos 35.4
Colima 34.7
Baja California Sur 33.7
Campeche 30.3
Distrito Federal (Federal District incl Mexico City) 30.1
a States where immigrants form at least 30% of the population.
Source: Instituto Nacional de Estadística, Geografía e Informática, Conteo de Población y Vivienda.
Roughly 6% of the population are pure Indian. There are over 60 recognisedethnic and language groups, and around 1% of the total population does notspeak any Spanish. The most numerous indigenous groups are the Náhuatl,with 1.2m speakers, the Maya (714,000), the Zapotec (403,00) and the Mixtec(387,000). Indigenous people’s customs and languages differ greatly from onegroup to another, but they have suffered generally from exploitation, margin-alisation and poverty.
Education
In 2000 9.6% of the population of 15 years or over was illiterate. The averagenumber of years of schooling per child stood at 7.6 years, compared with6.5 years in 1990. Although primary education for children age between fiveand 11 years is both free and compulsory, in 2000 only 70.3% of the popul-ation age 15 years or over had completed the primary level. Attendance atsecondary level has been limited and only a very small proportion of studentsgo on to higher education. Less than one-half of the population—46.1%—age15 years or over had completed secondary school or completed studies at atechnical school. In the 2000/01 academic cycle Mexico had only1,860 students in higher education per 100,000 of the population, comparedwith 5,500 per 100,000 in the US. Education spending is around 5% of GDP,compared with 7% in the US and Canada.
The government has increased its budget allocations for education and init-iated a programme to bring basic education up to date by revising the syllabusand improving teachers’ training and pay. Secondary schooling for childrenage 11-14 years has been made compulsory and technical training facilitieshave been expanded. For the 2000/01 academic cycle there were more than
The Indian population
A poorly educatedworkforce
Educational reforms
16 Mexico
EIU Country Profile 2001 © The Economist Intelligence Unit Limited 2001
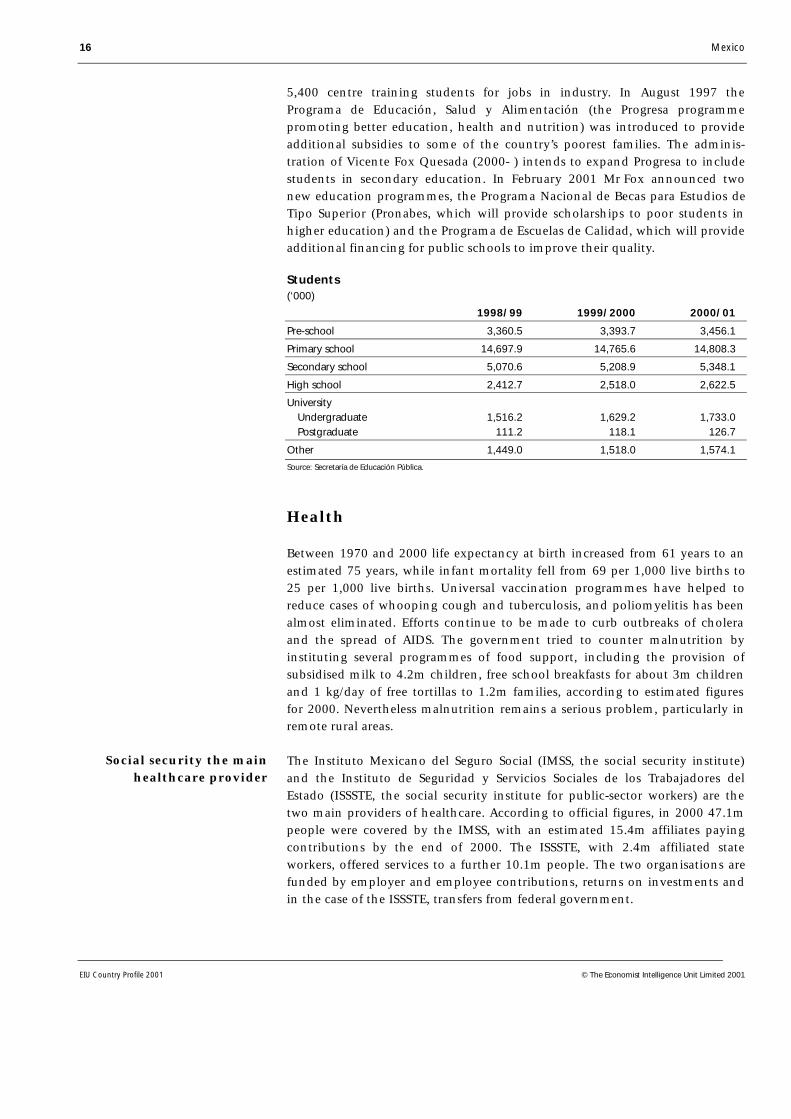
5,400 centre training students for jobs in industry. In August 1997 thePrograma de Educación, Salud y Alimentación (the Progresa programmepromoting better education, health and nutrition) was introduced to provideadditional subsidies to some of the country’s poorest families. The adminis-tration of Vicente Fox Quesada (2000- ) intends to expand Progresa to includestudents in secondary education. In February 2001 Mr Fox announced twonew education programmes, the Programa Nacional de Becas para Estudios deTipo Superior (Pronabes, which will provide scholarships to poor students inhigher education) and the Programa de Escuelas de Calidad, which will provideadditional financing for public schools to improve their quality.
Students(‘000)
1998/99 1999/2000 2000/01
Pre-school 3,360.5 3,393.7 3,456.1
Primary school 14,697.9 14,765.6 14,808.3
Secondary school 5,070.6 5,208.9 5,348.1
High school 2,412.7 2,518.0 2,622.5
University Undergraduate 1,516.2 1,629.2 1,733.0 Postgraduate 111.2 118.1 126.7
Other 1,449.0 1,518.0 1,574.1
Source: Secretaría de Educación Pública.
Health
Between 1970 and 2000 life expectancy at birth increased from 61 years to anestimated 75 years, while infant mortality fell from 69 per 1,000 live births to25 per 1,000 live births. Universal vaccination programmes have helped toreduce cases of whooping cough and tuberculosis, and poliomyelitis has beenalmost eliminated. Efforts continue to be made to curb outbreaks of choleraand the spread of AIDS. The government tried to counter malnutrition byinstituting several programmes of food support, including the provision ofsubsidised milk to 4.2m children, free school breakfasts for about 3m childrenand 1 kg/day of free tortillas to 1.2m families, according to estimated figuresfor 2000. Nevertheless malnutrition remains a serious problem, particularly inremote rural areas.
The Instituto Mexicano del Seguro Social (IMSS, the social security institute)and the Instituto de Seguridad y Servicios Sociales de los Trabajadores delEstado (ISSSTE, the social security institute for public-sector workers) are thetwo main providers of healthcare. According to official figures, in 2000 47.1mpeople were covered by the IMSS, with an estimated 15.4m affiliates payingcontributions by the end of 2000. The ISSSTE, with 2.4m affiliated stateworkers, offered services to a further 10.1m people. The two organisations arefunded by employer and employee contributions, returns on investments andin the case of the ISSSTE, transfers from federal government.
Social security the mainhealthcare provider
Mexico 17
EIU Country Profile 2001 © The Economist Intelligence Unit Limited 2001
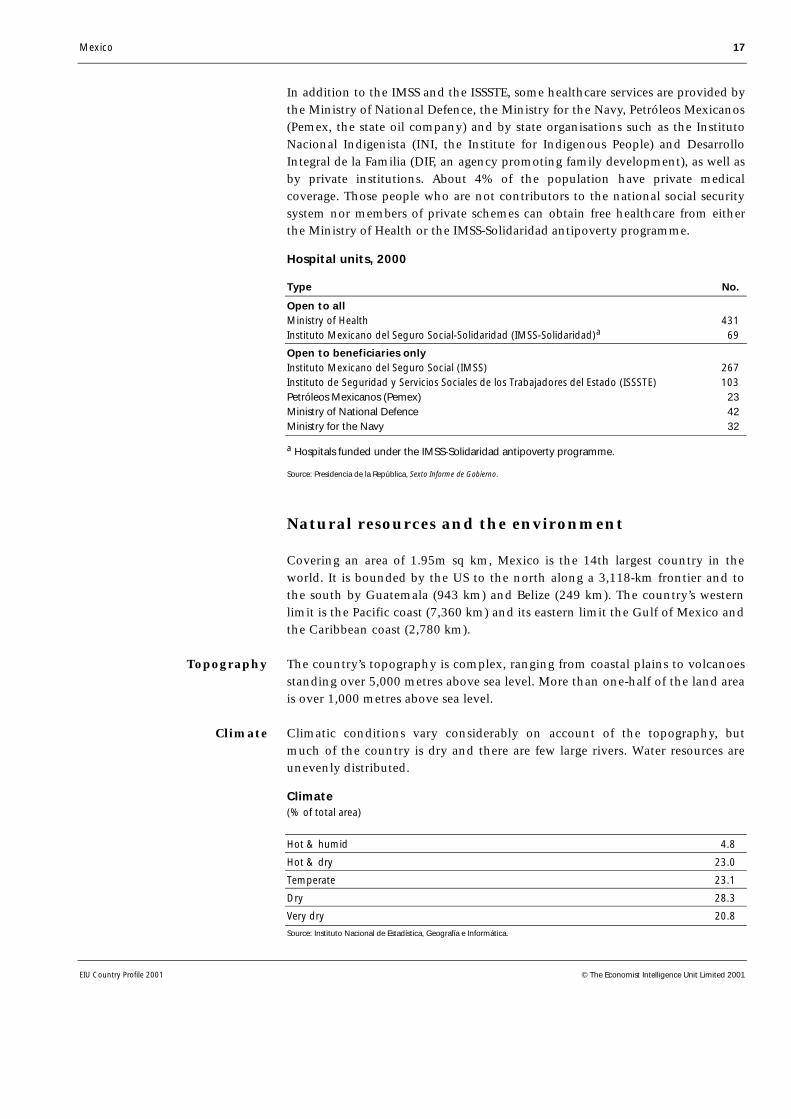
In addition to the IMSS and the ISSSTE, some healthcare services are provided bythe Ministry of National Defence, the Ministry for the Navy, Petróleos Mexicanos(Pemex, the state oil company) and by state organisations such as the InstitutoNacional Indigenista (INI, the Institute for Indigenous People) and DesarrolloIntegral de la Familia (DIF, an agency promoting family development), as well asby private institutions. About 4% of the population have private medicalcoverage. Those people who are not contributors to the national social securitysystem nor members of private schemes can obtain free healthcare from eitherthe Ministry of Health or the IMSS-Solidaridad antipoverty programme.
Hospital units, 2000
Type No.
Open to allMinistry of Health 431Instituto Mexicano del Seguro Social-Solidaridad (IMSS-Solidaridad)a 69
Open to beneficiaries onlyInstituto Mexicano del Seguro Social (IMSS) 267Instituto de Seguridad y Servicios Sociales de los Trabajadores del Estado (ISSSTE) 103Petróleos Mexicanos (Pemex) 23Ministry of National Defence 42Ministry for the Navy 32
a Hospitals funded under the IMSS-Solidaridad antipoverty programme.
Source: Presidencia de la República, Sexto Informe de Gobierno.
Natural resources and the environment
Covering an area of 1.95m sq km, Mexico is the 14th largest country in theworld. It is bounded by the US to the north along a 3,118-km frontier and tothe south by Guatemala (943 km) and Belize (249 km). The country’s westernlimit is the Pacific coast (7,360 km) and its eastern limit the Gulf of Mexico andthe Caribbean coast (2,780 km).
The country’s topography is complex, ranging from coastal plains to volcanoesstanding over 5,000 metres above sea level. More than one-half of the land areais over 1,000 metres above sea level.
Climatic conditions vary considerably on account of the topography, butmuch of the country is dry and there are few large rivers. Water resources areunevenly distributed.
Climate(% of total area)
Hot & humid 4.8
Hot & dry 23.0
Temperate 23.1
Dry 28.3
Very dry 20.8
Source: Instituto Nacional de Estadística, Geografía e Informática.
Topography
Climate

18 Mexico
EIU Country Profile 2001 © The Economist Intelligence Unit Limited 2001
Owing to topography and climate, only about 21% of the country is suitablefor arable farming and a further 57% for pasture. Forests and woodland coveraround 17% of the land. There is great potential for fishing to be developed.
As a signatory to the North American Free-Trade Agreement (NAFTA) Mexico isunder pressure to raise its environmental standards. Air pollution is a seriousproblem in Mexico City, Guadalajara and Monterrey, and northern borderareas also suffer a high degree of pollution and other environmental problems.In the 1980s the authorities became aware of the need to tackle environmentaldegradation, but the General Law of Ecological Balance and EnvironmentalProtection was not enacted until 1988. Under the administration led byErnesto Zedillo Ponce de León (1994-2000) the Ministry for Fisheries becamethe Ministry of Environment, Natural Resources and Fisheries. Amendments tothe law in 1996 delegated important enforcement functions to both state andlocal governments and introduced the concept that polluters should pay.Mr Fox has transferred the fisheries’ brief to the Ministry of Agriculture.Owners of old cars in Mexico City are required to leave their cars at home onone day each week and on two days a week during environmental emergencies.Moves are being made to substitute natural gas for diesel in power stations andindustry, and environmental policing is being stepped up generally, althoughenforcement remains lax.
Transport and communications
Private companies were offered concessions to build and to operate toll roadsunder the administration of Carlos Salinas de Gortari (1988-94). A lower thanexpected volume of traffic and economic crisis from December 1994 caused thegovernment to revoke 23 of the concessions, while also offering financialassistance to the companies involved. Some roads are to be privatised and newconcessions are to be offered under the Fox administration.
Integral port administrators were created in 1993. The administration of eachseaport was awarded by concession to an administrator, who operates port ter-minals and facilities, providing related port services. The privatisation of portadministration began in 1995 and continued under the Zedillo administration.Foreign investors may hold up to 49% equity in a port administrator and up to100% equity in ventures providing some port services.
The Salinas government managed to cut the losses of the FerrocarrilesNacionales (Ferronales, the state-owned railway company); the Zedillo admin-istration split it into regional companies and in 1997-98 transferred themanagement of most of these companies to the private sector under 50-yearconcessions. Small loss-making segments were excluded from the sale, alongwith the railway running through the Tehuantepec isthmus, owing to its pol-itical sensitivity. Three regional railway companies, Noreste, Pacífico-Norte andSureste, as well as four short lines, were under private-sector management bythe end of 2000.
Environmental standards
Road improvements
Port facilities
Railways
Land use
Mexico 19
EIU Country Profile 2001 © The Economist Intelligence Unit Limited 2001
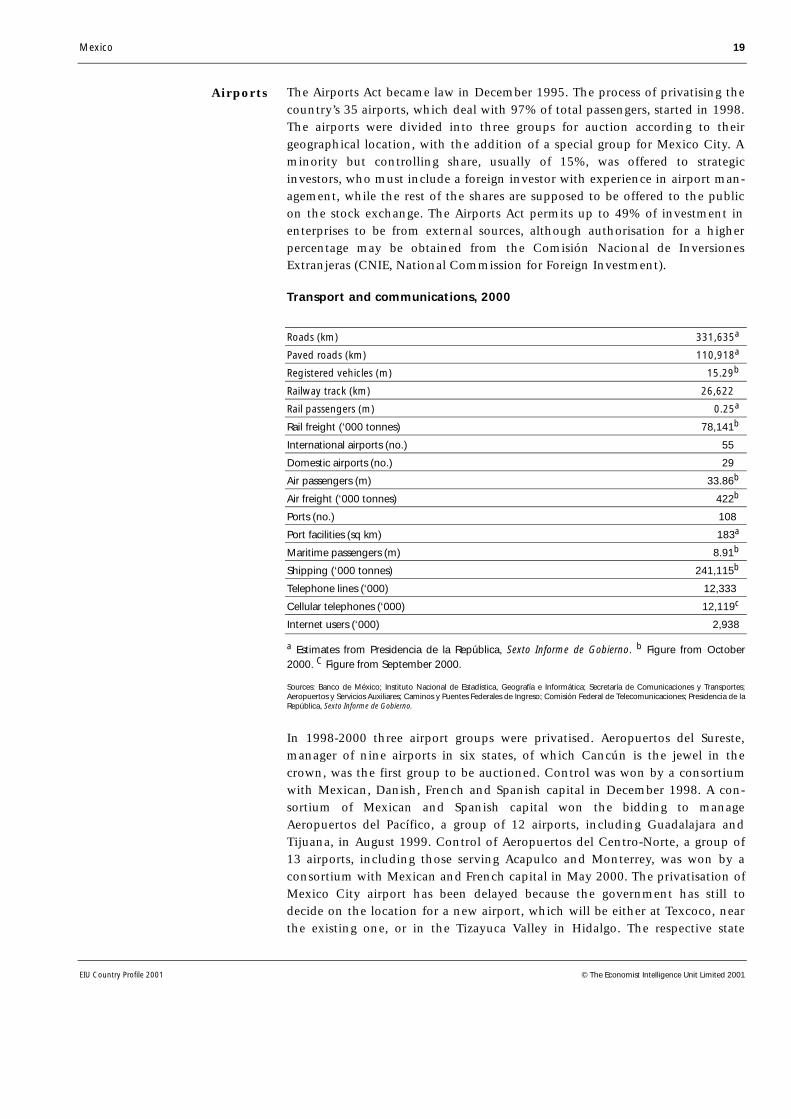
The Airports Act became law in December 1995. The process of privatising thecountry’s 35 airports, which deal with 97% of total passengers, started in 1998.The airports were divided into three groups for auction according to theirgeographical location, with the addition of a special group for Mexico City. Aminority but controlling share, usually of 15%, was offered to strategicinvestors, who must include a foreign investor with experience in airport man-agement, while the rest of the shares are supposed to be offered to the publicon the stock exchange. The Airports Act permits up to 49% of investment inenterprises to be from external sources, although authorisation for a higherpercentage may be obtained from the Comisión Nacional de InversionesExtranjeras (CNIE, National Commission for Foreign Investment).
Transport and communications, 2000
Roads (km) 331,635a
Paved roads (km) 110,918a
Registered vehicles (m) 15.29b
Railway track (km) 26,622
Rail passengers (m) 0.25a
Rail freight (‘000 tonnes) 78,141b
International airports (no.) 55
Domestic airports (no.) 29
Air passengers (m) 33.86b
Air freight (‘000 tonnes) 422b
Ports (no.) 108
Port facilities (sq km) 183a
Maritime passengers (m) 8.91b
Shipping (‘000 tonnes) 241,115b
Telephone lines (‘000) 12,333
Cellular telephones (‘000) 12,119c
Internet users (‘000) 2,938
a Estimates from Presidencia de la República, Sexto Informe de Gobierno. b Figure from October2000. C Figure from September 2000.
Sources: Banco de México; Instituto Nacional de Estadística, Geografía e Informática; Secretaría de Comunicaciones y Transportes;Aeropuertos y Servicios Auxiliares; Caminos y Puentes Federales de Ingreso; Comisión Federal de Telecomunicaciones; Presidencia de laRepública, Sexto Informe de Gobierno.
In 1998-2000 three airport groups were privatised. Aeropuertos del Sureste,manager of nine airports in six states, of which Cancún is the jewel in thecrown, was the first group to be auctioned. Control was won by a consortiumwith Mexican, Danish, French and Spanish capital in December 1998. A con-sortium of Mexican and Spanish capital won the bidding to manageAeropuertos del Pacífico, a group of 12 airports, including Guadalajara andTijuana, in August 1999. Control of Aeropuertos del Centro-Norte, a group of13 airports, including those serving Acapulco and Monterrey, was won by aconsortium with Mexican and French capital in May 2000. The privatisation ofMexico City airport has been delayed because the government has still todecide on the location for a new airport, which will be either at Texcoco, nearthe existing one, or in the Tizayuca Valley in Hidalgo. The respective state
Airports

20 Mexico
EIU Country Profile 2001 © The Economist Intelligence Unit Limited 2001
governments have each lobbied strongly for the airport to be build in theirregions. The decision passed to the Fox administration, which will announcethe winner in the first half of 2001. The placement of 85% of shares in pri-vatised airport groups on the stock exchange has been delayed several times.Shares in the Sureste group were placed on the Mexico City and New Yorkstock exchanges in September 2000. Shares for the other airport groups mayalso be placed on those stock exchanges in 2001.
In 1990 the government privatised Teléfonos de México (Telmex), which hassince greatly expanded the telephone network. The number of telephone linesincreased by 130% between 1990 and 2000, when density rose from 6.4 linesper 100 people to 12.5 lines per 100 people. With privatisation came con-cessions for cellular telephone operations and in August 1996 the long-distancemarket was opened to competition. A total of 24 concessions were granted and19 companies had won concessions to compete against Telmex in the localtelephone service market by the end of 2000. An important agreement settlingdisputed issues such as interconnection fees was reached between Telmex andits competitors in January 2001.
Energy provision
Mexico, the world’s fifth largest oil producer in 2000, produced an average of3.5m barrels/day of crude oil and liquid gas equivalent. The country producesthree types of oil: heavy Maya, at 22.3° American Petroleum Institute (API),Isthmus (34.6° API) and Olmeca (39.1° API). Official hydrocarbons reserves atthe start of 2000 stood at 58.2bn barrels, of which 46.2bn were crude oil andcondensates, and 12bn gas equivalent. Reserves have declined steadily in thepast 15 years, reflecting a contraction in exploratory activity. About 56% ofreserves are in the Gulf of Mexico, 24% in the Chicontepec region and 15% inChiapas and Tabasco.
Oil exports did well in 1996-97 as a result of higher volumes and prices, ex-ceeding earnings of US$10bn for the first time since 1985. However, oil pricesstarted to plunge in December 1997 and remained extremely depressed, thelowest in real terms since Mexico became an important oil exporter, untilFebruary 1999. This outcome caused a negative shock as crude oil is the secondmost important export as Pemex, the state oil company, accounts for morethan one-third—34.9% in the first three quarters of 2000—of federal govern-ment revenue. Prices started to recover in February 1999 in response to astrengthening of global demand and in light of OPEC production curbs. In1999-2000 average prices were comfortably above government budget est-imates, generating substantial windfalls for the country.
Outside companies have been brought in to undertake drilling operations forPemex, although to date they have been doing so under limited service andperformance contracts, given that the constitution severely limits the circum-stances under which payment can be made to third parties. (For historical dataon oil and gas production and reserves see Reference table 4.)
Oil production
Communications

Mexico 21
EIU Country Profile 2001 © The Economist Intelligence Unit Limited 2001
There has been a steady reduction of the company’s monopoly over the prod-uction of petrochemicals. Modifications to the constitution in November 1996restricted the state’s exclusive production rights to only eight basic petro-chemicals. The private sector may now participate in the production of petro-chemicals other than those eight reserved for the state and may own 100% ofthe equity of a producing company, but only 49% of the equity in plantsowned by Pemex. This restriction has deterred investors and an attempt topart-privatise some complexes foundered in 1999. It is unclear what steps theFox administration will take regarding the plants.
Oil and gas production
1999/20002000 % change
Crude oil incl liquid gas (‘000 barrels/day) 3,450 3.2
Gas (m cu ft/day) 4,679 –2.3
Source: Petróleos Mexicanos.
In May 1995 Congress approved legislation permitting the private ownershipand operation of natural gas transport, storage and distribution facilities. Thelaw permitted facilities in urban areas to be auctioned from 1996, although thecorresponding permits for Mexico City were not granted until August 1998. Anopen access policy on Pemex’s pipelines was also implemented from 1996. Theprocess has continued in 1999-2000.
Energy balance, 1999(m tonnes oil equivalent)
Oil Gas Coal Electricity Other Total
Primary supplyPrimary production 169.5 31.6 4.7 10.7a 8.2 224.7Imports 15.5 1.7 1.3 0.1a 0.0 18.6Exports –89.5 –1.4 0.0 0.0a 0.0 –90.9Total 95.5 31.9 6.0 10.8a 8.2 152.4Output basis – – – 4.2 – 145.8
Processing & transformationInput to refining –70.0 0.0 0.0 0.0 0.0 –70.0 Input to transformation –22.5 –6.1 –4.0 –10.8a 0.0 –43.4 Refining & transformation output 70.0 0.0 0.0 16.8b 0.0 86.8 Energy industry fuel & losses –10.5 –11.2 0.0 –3.6b 0.0 –25.3
Final consumptionTransport fuels 37.0 0.0 0.0 0.1b 0.0 37.1 Industrial fuels 8.5 12.6 2.0 8.1b 2.3 33.5 Residential & other uses 12.0 0.8 0.0 5.0b 5.9 23.7 Non-energy uses 5.0 1.2 0.0 0.0 0.0 6.2 Total 62.5 14.6 2.0 13.2b 8.2 100.5
a Input equivalents on an assumed generating efficiency of 38.5%.
Source: Energy Data Associates.
Pemex and thepetrochemical industry
Natural gas

22 Mexico
EIU Country Profile 2001 © The Economist Intelligence Unit Limited 2001
The economy
Economic structure
In the past two decades the services sector has accounted consistently foraround two-thirds of GDP, while industry has accounted for between 25% and30%. In January-September 2000 services accounted for 67.8% of GDP, withcommunity and social services representing 21.4% of GDP, financial services13% and transport and communications 11.4%. Industry generated 26.8% ofGDP. Manufacturing dominates industrial production, accounting for 20.8% ofGDP, followed by construction, with 4.8%. Manufacturing is not only the mostimportant productive sector, but is also the main source of exports. Manu-facturing accounted for 87.3% of total exports in 2000. One-half of that totalwas produced in maquiladoras (in-bond assembly plants).
Main economic indicators, 2000
Real GDP growth (%; based on constant 1993 prices) 6.9
Consumer price inflation (year-end; %) 9.0
Current-account balance (US$ bn) 18.2a
External debt (US$ bn) 171.5a
Exchange rate (av; Ps:US$) 9.46
Population (m) 97.4b
a EIU estimate. b Preliminary estimate from the 2000 census.
Sources: Banco de México; Consejo Nacional de Población.
Agriculture accounted for 4.2% of GDP in the first nine months of 2000,employing about 23% of the total workforce. Mining accounted for just 1.2%of GDP, a proportion that heavily understates the importance of oil productionto the economy, particularly in terms of government revenue. After therecovery in oil prices in 1999-2000, oil exports represented 7.3% of totalexports in the first three quarters of 2000 and 9.8% of total exports for the yearas a whole. Oil-related government revenue as a percentage of total govern-ment revenue in 1999-2000 reached 32.5% in the first three quarters of 2000and 34.9% for the year as a whole.
The results of the first systematic attempt to measure informal economic activ-ities were published by the Instituto Nacional de Estadística, Geografía eInformática (INEGI, the National Institute of Statistics, Geography andInformatics) in August 2000. According to the results, the informal sector—excluding illegal activities—had a value of Ps445.5bn (US$47bn), equivalent to12.7% of GDP, and provided 17% of the profits generated by the economy. Ofnon-agricultural jobs, 28.5% of the total are in the informal sector. Commerceand restaurants employ the greatest number of workers informally, estimatedat around 30.8% of the total, followed by personal services (11.5%), manu-facturing (6.1%), transportation (4.6%) and construction (3.3%).
Services sector dominatesGDP
Mexico 23
EIU Country Profile 2001 © The Economist Intelligence Unit Limited 2001
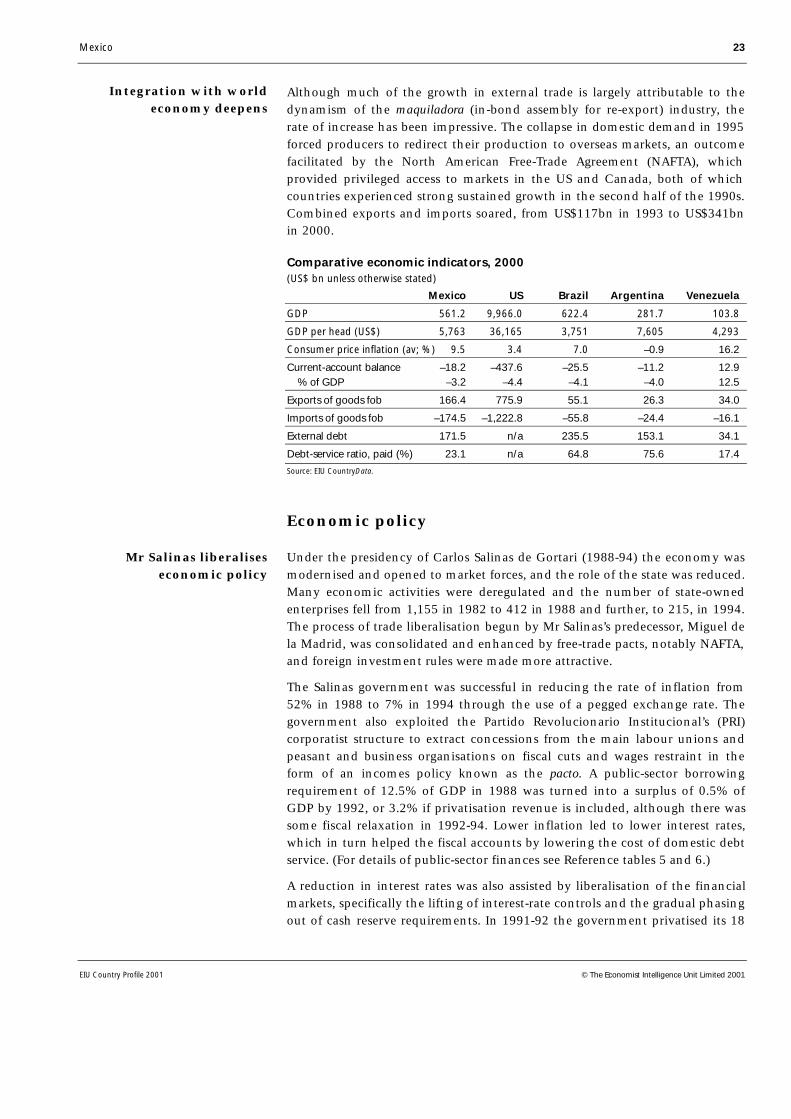
Although much of the growth in external trade is largely attributable to thedynamism of the maquiladora (in-bond assembly for re-export) industry, therate of increase has been impressive. The collapse in domestic demand in 1995forced producers to redirect their production to overseas markets, an outcomefacilitated by the North American Free-Trade Agreement (NAFTA), whichprovided privileged access to markets in the US and Canada, both of whichcountries experienced strong sustained growth in the second half of the 1990s.Combined exports and imports soared, from US$117bn in 1993 to US$341bnin 2000.
Comparative economic indicators, 2000(US$ bn unless otherwise stated)
Mexico US Brazil Argentina Venezuela
GDP 561.2 9,966.0 622.4 281.7 103.8
GDP per head (US$) 5,763 36,165 3,751 7,605 4,293
Consumer price inflation (av; %) 9.5 3.4 7.0 –0.9 16.2
Current-account balance –18.2 –437.6 –25.5 –11.2 12.9 % of GDP –3.2 –4.4 –4.1 –4.0 12.5
Exports of goods fob 166.4 775.9 55.1 26.3 34.0
Imports of goods fob –174.5 –1,222.8 –55.8 –24.4 –16.1
External debt 171.5 n/a 235.5 153.1 34.1
Debt-service ratio, paid (%) 23.1 n/a 64.8 75.6 17.4
Source: EIU CountryData.
Economic policy
Under the presidency of Carlos Salinas de Gortari (1988-94) the economy wasmodernised and opened to market forces, and the role of the state was reduced.Many economic activities were deregulated and the number of state-ownedenterprises fell from 1,155 in 1982 to 412 in 1988 and further, to 215, in 1994.The process of trade liberalisation begun by Mr Salinas’s predecessor, Miguel dela Madrid, was consolidated and enhanced by free-trade pacts, notably NAFTA,and foreign investment rules were made more attractive.
The Salinas government was successful in reducing the rate of inflation from52% in 1988 to 7% in 1994 through the use of a pegged exchange rate. Thegovernment also exploited the Partido Revolucionario Institucional’s (PRI)corporatist structure to extract concessions from the main labour unions andpeasant and business organisations on fiscal cuts and wages restraint in theform of an incomes policy known as the pacto. A public-sector borrowingrequirement of 12.5% of GDP in 1988 was turned into a surplus of 0.5% ofGDP by 1992, or 3.2% if privatisation revenue is included, although there wassome fiscal relaxation in 1992-94. Lower inflation led to lower interest rates,which in turn helped the fiscal accounts by lowering the cost of domestic debtservice. (For details of public-sector finances see Reference tables 5 and 6.)
A reduction in interest rates was also assisted by liberalisation of the financialmarkets, specifically the lifting of interest-rate controls and the gradual phasingout of cash reserve requirements. In 1991-92 the government privatised its 18
Integration with worldeconomy deepens
Mr Salinas liberaliseseconomic policy
24 Mexico
EIU Country Profile 2001 © The Economist Intelligence Unit Limited 2001
commercial banks and in 1993 allowed new domestic banks to be established.In 1994 market access was granted to foreign banks, albeit only those operatingin the US and Canada, the object being to improve the availability of creditand to drive intermediation margins down through competition. In April 1994the Banco de México (the central bank) became independent. However, theMinistry of Finance retained control of exchange-rate policy, creating apossible source of conflict. A proposal put to Congress in 1998 by the pres-ident, Ernesto Zedillo Ponce de León, to give the central bank full control ofexchange-rate policy was never passed. (For historical data on money, creditand interest rates see Reference tables 7 and 8.)
The exchange rate was unified in November 1991 and exchange controls wereabolished. The existing policy of a daily depreciation was retained, although itapplied only to the ceiling of the band in which the peso was allowed to float,a condition that allowed the real exchange rate to appreciate steadily under theSalinas administration. The government stuck resolutely to its exchange-ratepolicy even though overvaluation, trade liberalisation and economic growthproduced ever wider trade and current-account deficits. The administrationargued that the size of the current-account deficit was unimportant since itreflected dynamism in the private sector and that if capital were to cease toflow into the economy, the current account would adjust accordingly. In 1994the government rolled over domestic debt by issuing US$29.2bn of Tesobonos(US dollar-dominated bonds) to try to halt a loss of reserves. Investors becameincreasingly skittish as the euphoria that had built up about Mexico’seconomic prospects dissipated when political shocks struck in an election year.Eventually the exchange-rate policy ceased to be tenable. (For historical dataon the exchange rate see Reference table 30.)
On December 20th 1994, only three weeks into its term, the Zedillo govern-ment devalued by lifting the exchange-band ceiling by 15%. Billions of USdollars left the country in a few hours. With reserves depleted, the peso wasfloated, but it remained under speculative attack. From P3.107:US$1 at thebeginning of 1994, the peso had fallen to Ps5.325:US$1 by year-end. The pesocontinued to plunge in the first few weeks of 1995 as economic agents feared—correctly as it turned out—that the government lacked the resources to fundpayment of US$29bn of Tesobonos falling due in 1995. The solvency of thebanking system became another cause for concern. Banks faced a huge increasein external debt-servicing costs as a result of the devaluation as well as anescalation of bad debts as the government forced interest rates up to try to keepforeign and domestic capital in the country. In January 1995 the governmentagreed an emergency economic plan with labour and business comprisingtighter fiscal and monetary policy, and wages restraint. On the strength of thisplan the US contributed US$20bn, the Bank for International SettlementsUS$10bn and the IMF a total of US$17.8bn. However, the plan failed to restoreinvestor confidence and in March the government was forced to redouble itsadjustment efforts. The rate of value-added tax (VAT) was raised from 10% to15%, government-set prices were increased, public spending was cut and atight lid was kept on wage rises. Despite a contraction of 6.2% in GDP, a non-financial public-sector (NFPS) surplus of 0.7% of GDP was achieved, an
Exchange-rate policyproves to be flawed
Zedillo government forcedto devalue
Mexico 25
EIU Country Profile 2001 © The Economist Intelligence Unit Limited 2001
improvement on the previous year’s public-sector borrowing requirement(PSBR) of 3.4% of GDP. The PSRB included only a fraction of the cost of thebank bail-out. At the end of 2000 that cost, which will be absorbed eventuallyas internal public debt or written down over a 30-year period, was equivalentto 12.9% of GDP.
The government adhered to its policy of fiscal and monetary prudence in 1996.Inflation was nearly halved, from 52% at the end of 1995 to 27.7% at the endof 1996. Public finances almost reached balance, with the NFPS posting adeficit of just 0.1% of GDP. Discretionary spending had to be tightly controlledto compensate for the rising cost of supporting the banking system and fordefaults on tax payments. The central bank maintained its restrictive targets formonetary growth.
Although the government seemed to consider the free-floating peso as a trans-itional phase, over time confidence and reserves were restored and exchange-rate volatility gave way to extended periods in which the peso remainedrelatively stable. The inflation target for 1997 of 15% was almost achieved. Thepublic finances registered a deficit in 1997 slightly above the goal of 0.5% ofGDP. The deficit included costs related to reform of the social security systemincurred in the second half of the year,
The main feature of the new pensions system is that a worker’s pensionbenefits depends on the contributions made to his individual pension account.The accounts are managed by an administradora de fondos para el retiro (Afore, aretirement fund administrator) of the contributor’s choosing. In 1997 17Afores, most of them allied with foreign companies, started operation.
In 1998 the volatility of the peso increased markedly. Oil prices collapsed andMexico was also affected by the general loss of confidence in emerging marketsin the wake of the crisis in south-east Asia. The central bank tightenedmonetary policy several times during the year by restricting liquidity in themoney market. The government also tightened fiscal policy through three bud-get cuts totalling Ps36.2bn (US$4bn), equivalent to 1% of GDP, implementedin January, March and July respectively. Despite tight money and governmentspending cuts, the economy managed to grow by 4.9% in 1998, althoughmomentum was lost by the end of the year. At 1.25% of GDP, the NFPS deficitclosed precisely on target. However, the downward trend of inflation wasbroken and ended 1998 at 18.6%, well above the original target of 12%.
Although the peso was affected by the devaluation of the Brazilian Real inJanuary 1999, it quickly recovered and even regained some of the ground lostafter the Russian devaluation in 1998. Investors began to believe the gov-ernment’s repeated claims that Mexico was fundamentally stronger than otheremerging markets. The peso remained stable throughout the rest of 1999 as thegovernment managed to keep the fiscal accounts under control, aided by risingoil prices and a diminishing trade-account deficit. Inflation ended the year at12.3%, below the official target of 13%, but economic growth of 3.8%surpassed the 3% target. Both goals had been considered optimistic by privateanalysts at the beginning of 1999.
Little scope for relaxationin 1996
Mexico shows strongfundamentals in 1999-2000
26 Mexico
EIU Country Profile 2001 © The Economist Intelligence Unit Limited 2001
The peso remained remarkably stable in 2000, despite the political uncertaintygenerated by the presidential campaign, and was again bolstered by high oilprices and strong exports, although the trade deficit started to climb from Mayonwards. The central bank criticised what it considered to be the government’soverly loose fiscal policy, although the deficit was kept under control on theback of higher oil-related receipts and higher tax revenue as a result ofexceptionally strong economic growth.
Although he was unable to implement radical changes in 2000 because of anunco-operative Congress, Mr Zedillo did achieve his central aim for the year ofending the cycle of economic crises that coincided with changes of govern-ment. The inflation rate, which at 9% again fell short of the stated target, thistime of 10%, was the lowest annual rate since December 1994. At 6.9% realeconomic growth reached its highest level since 1981, outstripping the mostoptimistic expectations.
Orthodox economic policies, discredited by the 1994-95 crisis, regained publicsupport during the recovery and no major party is proposing a crediblealternative. The president, Vicente Fox Quesada, signalled his commitment tosound public finances with the appointment of a respected technocrat,Francisco Gil Díaz, as minister for finance and public credit. Although adivided Congress represents a potential problem for policymaking, the govern-ment has shown good negotiating skills to date. In a political first, the 2001budget was approved unanimously, with the government making only smallconcessions to Congress. The opposition, mainly the centre-left PartidoRevolucionario Institucional (PRI) and the left-wing Partido de la RevoluciónDemocrática (PRD), are unlikely to approve important structural changeswithout significant concessions.
Economic performance
In 1992 the delayed effects of recession in the US, together with an overvaluedpeso, held real growth of exports of goods and services to 5%, while imports ofgoods and services increased by 19.6% in real terms. The deterioration in thenet external balance was mainly responsible for a slowdown in GDP growth, to3.6%. In 1993 the arrival of a US new administration led by Bill Clintonbrought uncertainty with respect to the approval of NAFTA that exerted up-ward pressure on domestic interest rates and exacerbated the problem ofgrowing bad debts. Following a recovery in the US and slack domestic demand,exports grew by 8.1% in real terms and imports by 1.9%, while GDP growthstood at 1.9%. In 1994, an election year, public consumption grew by 2.9%and public investment by a similar amount. NAFTA helped to revive privateinvestment, which rose by 9.8% despite political upheavals, and to boostexports, which grew by 17.8% in real terms. A recovery in domestic demandboosted imports again, limiting GDP growth to 4.5%. (For historical data onGDP see Reference tables 9-11.)
The financial crisis at the end of 1994 had a profound effect on the economyin 1995. High real interest rates, tight monetary policy and the loss of businessconfidence choked off private investment. Large fiscal cuts precipitated sharp
Uneven growth in 1992-94
Recession follows in 1995

Mexico 27
EIU Country Profile 2001 © The Economist Intelligence Unit Limited 2001
falls in public investment and spending. In August the official and very narrowmeasure of open urban unemployment reached 7.6%, before falling to 5.2% inDecember, well above the 3.2% recorded at the end of 1994. Inflation, fuelledby the weakness of the peso, eroded wages, while private consumption col-lapsed. GDP contracted by 6.2% in the worst recession experienced by thecountry since the Great Depression of the 1930s. The only positive develop-ments were in the external sector, where a surge in exports was accompaniedby a fall in imports. An increase in exports helped to lift the economy out ofrecession in 1996. Private consumption was held back by declining real wagesand stubbornly high levels of unemployment. At the same time a huge debtoverhang depressed both private consumption and investment, and there wasa credit crunch as domestic banks struggled to deal with non-performing loansand to build up both capital and reserves. Inflation fell from 52% in December1995 to 27.7% at the end of 1996.
Gross domestic product(annual av; % real change; constant 1993 prices)
1990-95 1996 1997 1998 1999 2000a
Private consumption 2.1 2.2 6.5 5.4 4.3 9.7
Government consumption 2.5 –0.7 2.9 2.2 1.0 5.0
Gross fixed investment 2.0 16.4 21.0 10.3 5.8 10.7
Exports of goods & services 8.2 18.2 10.7 12.1 13.9 16.4
Imports of goods & services 11.9 22.8 22.7 16.5 12.8 22.8
GDP at market prices 2.2 5.2 6.8 4.8 3.7 7.1b
a Preliminary estimates from the Banco de México (the central bank). b The most recent globalestimate is 6.9%.
Sources: Instituto Nacional de Estadística, Geografía e Informática; Banco de México.
The economic recovery broadened and strengthened in 1997, when GDPgrowth rose by 6.8% and inflation fell to 15.7% by year-end. Mexico attractedrecord levels of foreign direct investment. Private consumption recoveredfinally as a result of job creation efforts and a rebound in real earnings. Newinvestment and strong demand in the US ensured that exports continued tocontribute to output growth.
Inflation2000 1996-2000
% change, year on year annual average
Consumer prices 9.5 19.4
Source: Banco de México.
Although GDP growth lost momentum toward the end of 1998, overall GDPincreased by 4.8%, fuelled by private-sector consumption, investment and ex-ports. In response to a plunge in oil prices the government restricted spendingso that public consumption rose by only 2.2% and gross fixed investment by10.3%. The year-end inflation rate edged up to 18.6%. The government’s tightfiscal stance continued in 1999, when public consumption increased by just1%. The private sector was the engine of growth once more, with private
Recovery in 1997-98

28 Mexico
EIU Country Profile 2001 © The Economist Intelligence Unit Limited 2001
consumption rising by 4.3% and exports by 13.9%. GDP also grew, by 3.7%,and inflation fell to 12.3% by the end of the year (For historical data oninflation see Reference table 12.)
In 2000 government spending grew on the back of much higher than expectedoil revenue, but without widening the NFPS deficit. Private consumption grewstrongly, by 9.7%, and public consumption also increased. Investmentfollowed a similar trend, with gross fixed capital investment rising by 10.7%during the year, while investment in both the private (up by 11%) and public(up by 7.8%) sectors grew. With exports increasing markedly owing to a boomin the US economy, GDP rose by an estimated 6.9%. Inflation continued tofall, particularly in the first three quarters of the year, closing 2000 at 9%, thelowest rate since 1994.
Regional trends
Regional development has been uneven, with industrialisation and the declineof agriculture sharpening divisions between different areas as a result of theirvaried natural resource endowments and location.
The Distrito Federal (the Federal District, including the capital, Mexico City)accounted for more than 23% of GDP and 21% of manufacturing value addedin 1997 (more recent data are not available). The central region, which in-cludes the Distrito Federal and the state of Mexico bordering it, accounted fornearly one-third of GDP although it covers only 1.2% of the land area. Thenext most important economic zones are the north-east, the central northerndistrict and the west. Monterrey (Nuevo León) and Guadalajara (Jalisco) are theleading industrial cities after the capital. On the Gulf coast, Veracruz hasbenefited from agricultural and more importantly oil production.
The thriving maquiladora (in-bond assembly for re-export) industry has boostedemployment in the northern border area, but some states such as Chiapas,Hidalgo, Guerrero and Oaxaca still suffer from extreme poverty. Tijuana in BajaCalifornia and Ciudad Juárez in Chihuahua have evolved into importantmaquiladora cities. An inadequate transport and communications infrastructurehas impeded more balanced regional growth.
However, the present government is continuing the infrastructure improve-ments begun by its predecessor. The 1998 budget included the creation of anew item, Ramo 33 (Branch 33), through which resources for expenditure onbasic education, healthcare services and municipal infrastructure are trans-ferred to states and local governments. This measure has brought an enormousincrease in the amount of transfer payments from central to state and localgovernment. Moreover, transfers are spread evenly throughout the year,compared with previous programmes when large sums were allocated in thefourth quarter of the year. State and local governments account for only about1% of national tax and social security collection, compared with 32% in the USand 25% in Japan. A proposal in the 1999 and 2000 budgets to allow states totop up the VAT rate by up to 2% was rejected by the opposition and scrapped.
The importance of theFederal District
Regional inequalitiesremain severe
The economy exceptionallystrong in 2000
Mexico 29
EIU Country Profile 2001 © The Economist Intelligence Unit Limited 2001
From 2000 restrictions placed on state governments issuing debt eased anddebt will be graded by rating agencies in an attempt to make the processmarket-oriented.
Economic sectors
Agriculture, forestry and fishing
Although northern parts of Mexico are very dry and can suffer drought for fiveor six years out of ten, they have become the most productive areas for agri-culture, not only because these areas benefited most from public irrigationschemes in the 1950s and 1960s, but because the larger farms established therehave geared themselves increasingly to production for the US market. Farms incentral and southern regions have lagged behind, partly as a result of thelegacy of agrarian reform, when large landholdings there were divided up intoejidos (communally owned areas of land where plots were allocated by thegovernment as units to be worked by individuals or communes). Eijdos couldnot be sold, rented or mortgaged, but could inherited and were liable to beexpropriated if not worked. The system caused increasing fragmentation offarming units, as well as insecurity and inefficiency. The government of CarlosSalinas de Gortari (1988-94) amended the constitution in 1992, concludingofficially the agrarian reform process after 75 years and paving the way forejidatarios (owners of ejidos) to be given full property rights in respect of over9m plots on 30,000 ejidos covering one-half of the country’s area. By August2000 the Ministry for Agrarian Reform and agrarian tribunals had providedownership titles to 6.2m ejidatarios (2.8m families), covering 54m ha, under thePrograma de Certificación de Derechos Ejidales y Titulación de Solares(Procede, the land rights’ programme for ejidos). The current president, VicenteFox Quesada (2000- ) has continued to implement Procede, reaffirming thatthere will not be any further land distributions other than those ordered byagrarian tribunals to settle claims.
The Salinas government also privatised sugar mills, the tobacco company andparts of the now defunct Compañía Nacional de Subsistencias Populares(Conasupo, the state-owned basic foods supply company). In 1993 a newscheme, the Programa de Apoyos Directos al Campo (Procampo, a programmeproviding yearly cash payments for 15 years to producers of cotton, rice,safflower, barley, beans, maize, sorghum, soybeans and wheat) was introducedto replace the former system of price support for basic grains. In 1995 ErnestoZedillo Ponce de León initiated the Alianza para el Campo (Alliance for theCountryside) programme, reinforcing the Procampo system of direct cash sub-sidies by mandating that these should be maintained in real terms for 15 years.Mr Fox has announced that the Procampo coverage will be extended.
Inadequate investment and low productivity continue to affect agriculture, ex-acerbating already extreme levels of poverty in rural areas. The sector hasunderperformed consistently compared with the rest of the economy, havinggrown by just 0.8% in 1998, by 3.5% in 1999 and by 4.2% in the first three
Land ownership reforms
30 Mexico
EIU Country Profile 2001 © The Economist Intelligence Unit Limited 2001
quarters of 2000. Agricultural output as a proportion of total GDP fell from5.8% to 4.5% between 1993 and 1999. At the same time Mexico has tended torun deficits on its trade in imported agricultural products. Between January andNovember 2000 the agricultural deficit reached US$442m, compared with adeficit of US$554m for 1999 as a whole. In order to support its agriculturalprogramme the government has raised the level of financing per hectare and isimproving the flow of credit from state agencies. In 1996 it also had to step inwith a rescheduling plan to assist debtors in the farming and fishing industries,and to provide emergency funding to help the sector confront a third con-secutive year of drought. The Punto Final (Full Stop) refinancing programmewas instituted at the end of 1998 and ended a year later (see Financial services).
Maize, beans, wheat and sorghum are important for the domestic market andcoffee, sugar, fruit and vegetables are the leading agricultural exports. Prod-uction of some traditional crops stagnated or declined in 2000 compared withharvests in recent years. Livestock contributes about 32% of agricultural out-put. In 2000 meat production, the most important area of livestock, increasedby 4% to a record 4.3m tonnes, while milk production increased by 4.1%, to9.3bn litres, also a record. (For historical data on agricultural and livestockproduction see Reference tables 13 and 14.)
Forestry accounts for about 21% of sectoral output. Excessive exploitation anda lack of investment and planning have hindered the industry’s growth inrecent times. Widespread fires in 1998 added further complications. Reform ofthe land tenure system has not apparently reduced exploitation and at the endof 2000 the Procuraduría Federal de Protección al Ambiente (Profepa, theFederal Office for Environment Protection) issued a scathing report warningthat forestry areas in 23 states were in severe danger. Aiming to confront theproblem, the Fox administration announced a national forestry commissionthat began its work in the first quarter of 2001.
The full potential of fishing is a long way from being realised. Preliminary est-imates indicate that in 2000 the catch was 1.4m tonnes, up on the 1.3mtonnes caught in 1999, but well below the 1.6m tonnes registered in 1997.Among the main types of fish caught are tuna, prawn, sardine and squid. Anestimated 350,263 tonnes of fishing products were processed in 2000, up from341,004 tonnes in 1999. At an estimated 11.1 kg per head in 2000, domesticconsumption is not high. The trade balance in fishing products has shown asurplus for several years, estimated at US$525m in 2000. Export earningstotalled US$679m in 2000, compared with US$682m in 1999 and US$676m in1998. The fishing fleet, which comprised 102,807 vessels in 1998, and thecountry’s 62 fishing ports are in need of modernisation.
Manufacturing
The debt crisis of the early 1980s triggered a change in the direction of ind-ustrial development away from import substitution and towards export pro-motion. Exports of manufactures accounted for 87% of total export earnings in
Crop production important
Forestry
Fishing
Focus on export promotionmaintained
Mexico 31
EIU Country Profile 2001 © The Economist Intelligence Unit Limited 2001
2000 compared with less than 24% in 1982, and growth has been accom-panied by increased productivity. Between 1993 and 1999 labour productivityin manufacturing increased by an accumulated 38.9%, compared with in-creases of 34.7% in the US, 58.6% in Germany and 91.3% in South Korea. InJanuary-November 2000 productivity increased by 4.6%. Owing to Mexico’sdependence on imported intermediate goods, export growth has inflated theimport bill. In addition, trade liberalisation has created serious difficulties for alarge number of businesses that have had to face competition from importedgoods. With the appreciation of the peso in the early 1990s, salaries convertedinto US dollars increased more than productivity. Interest rates in US dollarterms were also much higher than those paid by external competitors. Thesehigher costs led to a sharp decline in output in some sectors. The problem ofhigher production costs re-emerged in 1999-2000. (For historical data onmanufacturing output see Reference table 15.)
Manufacturing output(% unless otherwise stated)
1995-2000a 2000 Annual average Change Sectoral Exportsd Employmentd
real growth in outputb outputc (US$ m) (% of total)
Food, beverages & tobacco 3.8 3.2 24.0 3,846 24.7
Clothing & footwear 5.5 8.4 8.3 11,562 13.1
Wood products 2.0 1.3 2.5 1,045 1.8
Paper, printing & publishing 3.6 4.7 4.5 1,227 6.1
Chemicals, petroleum products, rubber & plastics 4.3 2.2 14.7 9,031e 16.3
Non-metallic minerals excl oil 3.0 4.9 6.8 2,661 5.1
Basic metal industries 7.4 4.6 4.9 4,349 3.7
Metal products, machinery & equipment 10.3 12.2 31.5 99,231 28.5
Other industries 6.7 7.0 3.0 1,386 0.7
Total manufacturing output 5.9 6.0 100.0 134,336 100.0
a January-September for 2000. b Actual. c January-September at 1993 prices. d January-November.e Includes petroleum derivatives.
Source: Instituto Nacional de Estadística, Geografía e Informática.
The real exchange rate has experienced significant swings in the past few years.A big depreciation in 1995 was followed by appreciation in 1996-97, depre-ciation in 1998 and appreciation once again in 1999-2000. The floatingexchange-rate regime reduced the risk of a build-up of large macroeconomicimbalances, but real interest rates remain high, having reached an average of10.7% in 1999 and 8.2% In January-October 2000, compared with rates in theUS of 2.4% and 2.1% respectively. Financial crisis and undercapitalisation of thebanking system led to credit rationing. The most dynamic sectors of theeconomy are those that have been able to increase exports.
One sector where exports have been especially important is metal products,machinery and equipment. The sector grew by an annual average of 10.3%between 1995 and the third quarter of 2000. In January-September 2000
Metal products, machineryand equipment
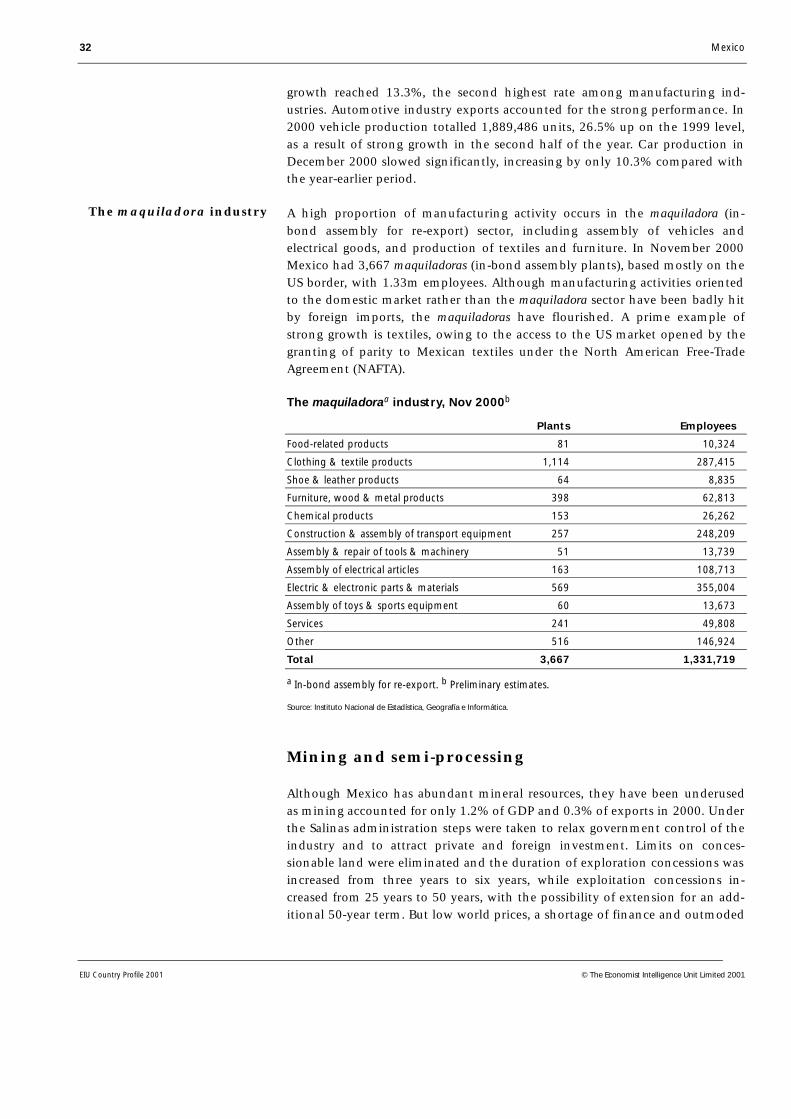
32 Mexico
EIU Country Profile 2001 © The Economist Intelligence Unit Limited 2001
growth reached 13.3%, the second highest rate among manufacturing ind-ustries. Automotive industry exports accounted for the strong performance. In2000 vehicle production totalled 1,889,486 units, 26.5% up on the 1999 level,as a result of strong growth in the second half of the year. Car production inDecember 2000 slowed significantly, increasing by only 10.3% compared withthe year-earlier period.
A high proportion of manufacturing activity occurs in the maquiladora (in-bond assembly for re-export) sector, including assembly of vehicles andelectrical goods, and production of textiles and furniture. In November 2000Mexico had 3,667 maquiladoras (in-bond assembly plants), based mostly on theUS border, with 1.33m employees. Although manufacturing activities orientedto the domestic market rather than the maquiladora sector have been badly hitby foreign imports, the maquiladoras have flourished. A prime example ofstrong growth is textiles, owing to the access to the US market opened by thegranting of parity to Mexican textiles under the North American Free-TradeAgreement (NAFTA).
The maquiladoraa industry, Nov 2000b
Plants Employees
Food-related products 81 10,324
Clothing & textile products 1,114 287,415
Shoe & leather products 64 8,835
Furniture, wood & metal products 398 62,813
Chemical products 153 26,262
Construction & assembly of transport equipment 257 248,209
Assembly & repair of tools & machinery 51 13,739
Assembly of electrical articles 163 108,713
Electric & electronic parts & materials 569 355,004
Assembly of toys & sports equipment 60 13,673
Services 241 49,808
Other 516 146,924
Total 3,667 1,331,719
a In-bond assembly for re-export. b Preliminary estimates.
Source: Instituto Nacional de Estadística, Geografía e Informática.
Mining and semi-processing
Although Mexico has abundant mineral resources, they have been underusedas mining accounted for only 1.2% of GDP and 0.3% of exports in 2000. Underthe Salinas administration steps were taken to relax government control of theindustry and to attract private and foreign investment. Limits on conces-sionable land were eliminated and the duration of exploration concessions wasincreased from three years to six years, while exploitation concessions in-creased from 25 years to 50 years, with the possibility of extension for an add-itional 50-year term. But low world prices, a shortage of finance and outmoded
The maquiladora industry

Mexico 33
EIU Country Profile 2001 © The Economist Intelligence Unit Limited 2001
technology still held the industry back. Mining was the only sector toexperience a drop in output in 1999, contracting by 3.2%. In the first threequarters of 2000 it increased by 5.2%.
Mexico is the world’s largest producer of silver, with mines mainly based in thestates of Chihuahua and Zacatecas. Mexico also leads the world in producingfluorite, celestite and sodium sulphate, and is one of the biggest global prod-ucers of bismuth, graphite, antimony, arsenic, barite, sulphur and copper. Thetwo largest mines in the country, Cananea (copper) and Real del Monte (silver),were privatised by the Salinas government. Lead, zinc and iron are other im-portant metals. (For historical production data for a range of minerals seeReference table 16.)
Minerals production(‘000 tonnes unless otherwise indicated)
2000a
Gold (kg) 24,535.0
Silver (‘000 kg) 2,572.0
Copper 310.3
Zinc 328.0
Manganese 151.0
Lead 141.5
Molybdenum 6.2
Arsenic 2.3
Antimony 0.1
Cadmium 1.2
Bismuth 1.0
a Preliminary estimates for January-November.
Source: Instituto Nacional de Estadística, Geografía e Informática.
Construction
Construction grew by an annual average of around 4.5% in 1988-94, largely onthe strength of infrastructure development and housing. However, a slump indemand in 1995 had a devastating effect on the industry, causing the value ofoutput to contract by 23.5%, and not until May 1996 did the first signs of atentative recovery emerge. Accumulated growth between 1996 and 1999 hasbarely returned the sector to pre-crisis levels as in 1999 the value of output wasalmost equal to that for 1994. In the first three quarters of 2000 the industrygrew by 6.3% in real terms, but this growth has not been reflected in increasedemployment. In November 2000 the sector employed 243,113 people, com-pared with 291,404 in the year-earlier period and 448,573 in November 1994.Several of the largest construction groups in the sector have been badly hit byunsuccessful ventures in building and operating toll highways.
34 Mexico
EIU Country Profile 2001 © The Economist Intelligence Unit Limited 2001
Financial services
In the past few years the financial sector has undergone a fundamental change.In addition to the liberalisation of interest rates and credit terms, new financialinstruments and institutions have been created. In September 2000 there were34 commercial banks in operation. In 1991-92 18 banks in which the govern-ment had held a majority shareholding since their nationalisation in 1982were privatised. The government then acted to allow the establishment of newdomestic banks and in 1994 granted licences to the subsidiaries of banksoperating in the US and Canada. In December 1998 Congress removed alllimitations to the foreign ownership of banks.
Privatised commercial banks have had problems almost from the outset. Theprincipal cause has been poor credit-risk management, manifested by an in-creasingly serious burden of non-performing loans. This situation was alreadyevident in 1994 when the economy was growing, but worsened when a deeprecession took hold. By September 1995 the ratio of bad debts to the bankingsystem’s total loan portfolio had risen from 8.3% at the end of 1994 to 17.2%,rising further to reach 19.2% in February 1996, before slowly beginning tosubside. Faced with the prospect of a systemic banking collapse, the govern-ment proposed measures to deal with the problem of bad debts. In 1995-98seven different programmes were launched to provide help to debtors. In April1995 loans started to be converted into unidades de inversión (UDIs, units linkedto the consumer price index). The aim was to support debtors holding intrin-sically viable loans who faced temporary difficulties in servicing their debtsowing to high nominal interest rates in 1995. Special programmes were estab-lished to help debtors with mortgage, consumer, small business and agriculturalloans. A programme introduced in 1997 aimed to support state and localgovernments. A programme announced at the end of 1998, the last of this kindand appropriately named the Punto Final programme, gave additional subsidiesto debtors with mortgage, small business and agricultural loans.
Apart from providing relief for debtors, the government set up the Programa deCapitalización Temporal (Procapte, a programme to enable banks to meet theircapital and loan loss provisions), as well as the Fondo Bancario de Protecciónde Ahorro (Fobaproa, a fund able to take over banks’ bad debts in exchange fornew capital injections by shareholders), which was superseded by the Institutode Protección al Ahorro Bancario (IPAB, the Institute for the Protection of BankSavings). Nevertheless, the government had to step in and to take control of anumber of institutions. Five commercial banks received support from Procaptein 1995. By mid-1997, when all banks had been able to liquidate their debts,the programme was closed.
Under Fobaproa, banks deliver income from duly qualifying loans with ade-quate provisions for an amount equivalent to twice the fresh capital contrib-uted by stockholders to a trust fund of which Fobaproa is the primary bene-ficiary. Banks receive pagarés (IOUs) guaranteed by the government in returnfor loans.
Financial sector liberalised
Bad debts forcegovernment support
Mexico 35
EIU Country Profile 2001 © The Economist Intelligence Unit Limited 2001
Although the government needed to shore up the banking sector in order torevive the economy, financial institutions also had to apply US general acc-ounting principles from the beginning of 1997, which treat the full amount ofa loan as non-performing. Previous practice in Mexico had been to report onlythe overdue portion of loans as non-performing.
By 1998 it had become apparent that only a small percentage—estimatedinitially at around 30% and then lowered to 20% in 1999—of the face value ofthe loans absorbed by Fobaproa would be recovered, in part owing to bank-ruptcy legislation favouring debtors. An agency established in 1996 to appraiseand to sell off the banking assets acquired by Fobaproa held only one auctionbefore being wound up. A new agency, the IPAB, was approved by Congress atthe end of 1998. The Punto Final programme was a condition imposed on thegovernment by the Partido Acción Nacional (PAN) in exchange for the party’sapproval of the new agency, along with the conversion of pagarés issued tosupport banks, which had been registered originally as contingent debt, thentransformed into permanent liabilities. Political bargaining delayed the formalinstallation of the IPAB until the beginning of May 1999. According to theMinistry of Finance and Public Credit, at the end of 2000 IPAB liabilities wereequivalent to 12.9% of GDP.
The government has sold most failing banks to other domestic and foreignbanks. By the beginning of 2001 only one of the 18 banks privatised in1991-92 remained in the hands of its original owners. Eight banks remainunder the supervision of the Comisión Nacional Bancaria y de Valores (CNBV,the National Banking and Securities Commission).
Fobaproa, the IPAB and the financial sector
The government proposed several changes to financial legislation at the end ofMarch 1998, unleashing a political storm that was to have grave consequences.A request to an opposition-dominated Congress to approve conversion ofFobaproa’s liabilities, registered officially as temporary debt, into public andtherefore permanent debt provoked hostility. The Partido NacionalRevolucionario (PRD) mounted a successful campaign, portraying Fobaproa asa body that had rescued large depositors and allowed fraudulent bankers tosiphon millions of US dollars through its operations, including the financing ofpolitical campaigns for the Partido Revolucionario Institucional (PRI) and hadthen left taxpayers to pick up the bill. The PAN, fearful of the political costs,quickly sided with the PRD, even demanding the resignation of the publicofficials that had headed Fobaproa’s operations, notably the governor of theBanco de México (the central bank), who had been finance secretary in the firsthalf of the administration led by Ernesto Zedillo Ponce de León, as well as thehead of the Comisión Nacional Bancaria y de Valores (CNBV, the NationalBanking and Securities Commission).
The government had to allow Fobaproa’s accounts to be inspected by anauditor appointed by Congress. The exercise did not expose any of theexpected cover-ups, but negotiations took a considerable time. It was not untilthe end of 1998 that the PAN agreed to approve the establishment of asuccessor to Fobaproa and it took five more months to agree the appointment
Bail-out costs substantial

36 Mexico
EIU Country Profile 2001 © The Economist Intelligence Unit Limited 2001
of the IPAB’s executive board. The delay almost froze much-needed financial-sector reform for 15 months as the government refused to sideline theconversion of Fobaproa liabilities.
Once formally established, the IPAB continued to shore up several banks thatwere technically bankrupt, notably Banca Serfín, the third-largest bank in thecountry, and Bancrecer, which needed a capital injection of nearly US$11bn.Since its foundation the IPAB has taken several steps to ensure that thetransformation and consolidation of the banking sector will continue. In May1999 IPAB enacted new insurance quotas for commercial banks to cover theirdeposits and announced a seven-step programme to reduce deposit insurancestarting from 2005. The programme will be limited to savings worth 400,000UDIs (about US$105,000) and will cover 95% of all bank accounts. From thefourth quarter of 1999 the IPAB carried out several auctions of the rights tomanage and to recover segments of past-due loans accumulated by Fobaproa.In February 2000 it started to issue three-year bonds and in August five-yearbonds, which will be swapped for Fobaproa promissory notes. This change willboost banks’ liquidity as in contrast to Fobaproa’s obligations these bonds willbe traded on a secondary market. The bonds were rated by Standard & Poor’s inDecember 2000 as equivalent to bonds issued by the government.
The IPAB has also began the process of selling off the banks it owns. In May2000 Banca Serfín was sold to Spain’s Banco Santander Central Hispanico andBancomer, which subsequently merged with Spain’s Banco Bilbao VizcayaArgentaria. Bancomer then absorbed Banca Promex in August. In NovemberCanada’s Scotiabank acquired a majority stake in Inverlat. In January 2001IPAB ceased to guarantee any liabilities incurred by banks through operationson the stockmarket.
There are five state development banks: the Nacional Financiera (Nafin, mainlyfor small and medium-sized businesses), the Banco Nacional de ComercioExterior (Bancomext, for foreign trade), the Banco Nacional de Obras yServicios Públicos (for public works and services), the Financiera NacionalAzucarera (for the sugar industry) and the Banco Nacional de Crédito Rural (forrural development). Nafin and Bancomext are by far the most important. In1997 the government took the unusual step of starting the liquidation of theBanco Nacional de Comercio Interior.
The Bolsa Mexicana de Valores (BVM, the Mexican Stock Exchange) opened toforeign traders just a decade ago, allowing them to purchase stocks in 1989 andpublic internal debt in 1990. After several years of strong growth in real terms,particularly in 1993 and for most of 1994, the crisis that started in December1994 weakened the market.
After three years of consecutive declines in real terms, the stockmarket indexincreased by 34.4% in real terms in 1997, primarily as a result of economicrecovery, foreign investment and declining interest rates. These gains werewiped out completely in 1998 when the index lost 45% in real terms duringthe year, or 38% in US dollar terms. From mid-January 1999 the BVMrecovered strongly and gained a nominal 80% during the year that when
State development banks
The stockmarket

Mexico 37
EIU Country Profile 2001 © The Economist Intelligence Unit Limited 2001
coupled with an appreciation of the peso represented a gain in US dollar termsof 88%. Following other international bourses, 2000 saw a steep fall, with a lossin nominal terms of 20.7%. (For historical data on stockmarket performancesee Reference table 17.)
Other services
The retail sector underwent major changes in the 1990s. Large overseas com-panies entered the market, setting up price clubs, discount stores and hyper-market chains, sometimes merging with or even buying major Mexicanretailers. Competition from foreign firms pushed leading Mexican companiesto modernise and to increase cost controls and as the main urban centres havecome to be increasingly well-served they have widened their areas of operationto the smaller provincial cities. Along with the arrival of foreign firms, a majorchange in the retail sector in recent years has been the development of largeshopping centres. At present large modern outlets account for only about 40-45% of retail sales as the majority are accounted for by small family-runbusinesses offering a limited range of goods.
Having collapsed by 19% in 1995, retail sales started to recover only in 1997,with larger establishments such as department stores the main beneficiaries.However, strong growth was not observed until 2000. In January-November2000 wholesale merchandise sales increased by 5.7% in real terms and retailsales by 10.4% in real terms, these items having risen by just 2% and 4.3% in1999 respectively. However, these sharp increases took the level of sales to justslightly over that recorded in the same period of 1994. (For historical data onmerchandise sales see Reference table 18.)
The tourism industry is important both as a source of foreign exchange and asan employer. In January-September 2000 tourism earnings, excluding visitorsfrom US border states on short-term shopping trips, stood at US$4.4bn, whileborder trips brought in an additional US$1.7bn. In 1993-98 tourism repre-sented 8.3% of GDP and employed 6% of the total working population dir-ectly. The industry has benefited from substantial investment and promotion.In addition, the relaxation of investment rules has encouraged many majornew developments by private and foreign investors, and contributed to anincrease in hotel capacity.
In 1999 the estimated number of rooms reached 419,608. Around 80-85% oftourists to Mexico come from the US each year. Mexico captures 3-4% per yearof tourism worldwide. (For historical data on tourism see Reference table 19.)
Retail trade
Tourism
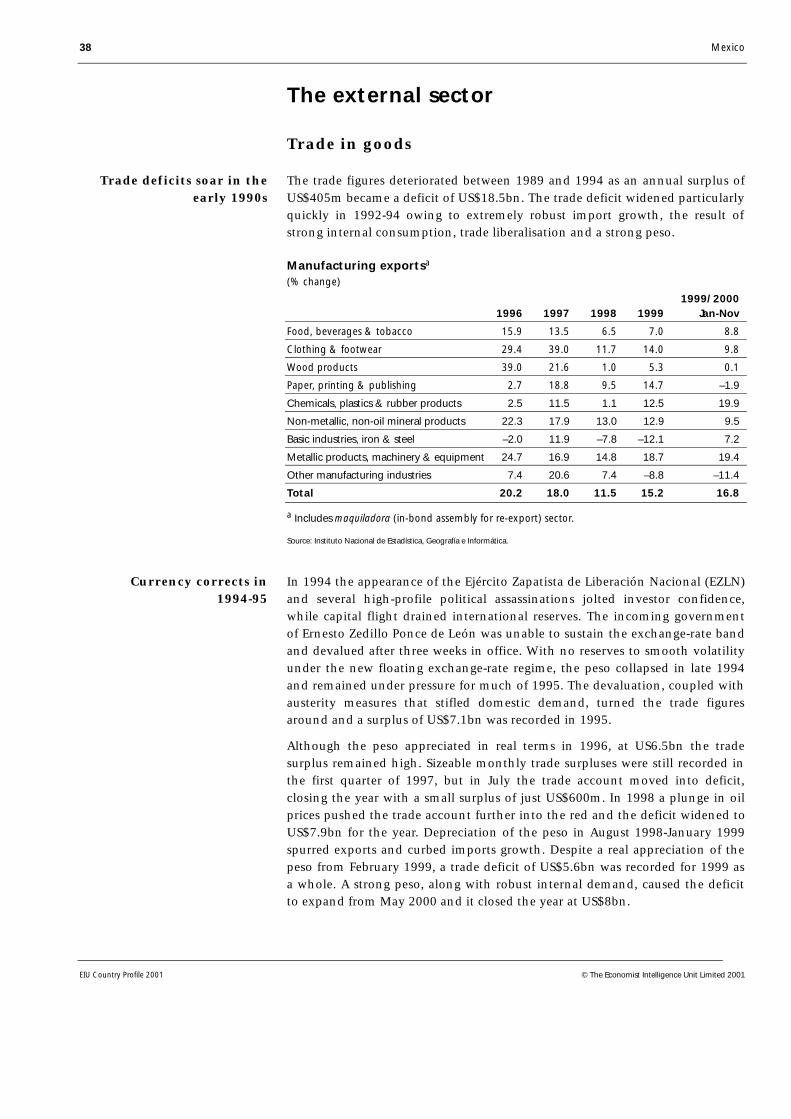
38 Mexico
EIU Country Profile 2001 © The Economist Intelligence Unit Limited 2001
The external sector
Trade in goods
The trade figures deteriorated between 1989 and 1994 as an annual surplus ofUS$405m became a deficit of US$18.5bn. The trade deficit widened particularlyquickly in 1992-94 owing to extremely robust import growth, the result ofstrong internal consumption, trade liberalisation and a strong peso.
Manufacturing exportsa
(% change)
1999/20001996 1997 1998 1999 Jan-Nov
Food, beverages & tobacco 15.9 13.5 6.5 7.0 8.8
Clothing & footwear 29.4 39.0 11.7 14.0 9.8
Wood products 39.0 21.6 1.0 5.3 0.1
Paper, printing & publishing 2.7 18.8 9.5 14.7 –1.9
Chemicals, plastics & rubber products 2.5 11.5 1.1 12.5 19.9
Non-metallic, non-oil mineral products 22.3 17.9 13.0 12.9 9.5
Basic industries, iron & steel –2.0 11.9 –7.8 –12.1 7.2
Metallic products, machinery & equipment 24.7 16.9 14.8 18.7 19.4
Other manufacturing industries 7.4 20.6 7.4 –8.8 –11.4
Total 20.2 18.0 11.5 15.2 16.8
a Includes maquiladora (in-bond assembly for re-export) sector.
Source: Instituto Nacional de Estadística, Geografía e Informática.
In 1994 the appearance of the Ejército Zapatista de Liberación Nacional (EZLN)and several high-profile political assassinations jolted investor confidence,while capital flight drained international reserves. The incoming governmentof Ernesto Zedillo Ponce de León was unable to sustain the exchange-rate bandand devalued after three weeks in office. With no reserves to smooth volatilityunder the new floating exchange-rate regime, the peso collapsed in late 1994and remained under pressure for much of 1995. The devaluation, coupled withausterity measures that stifled domestic demand, turned the trade figuresaround and a surplus of US$7.1bn was recorded in 1995.
Although the peso appreciated in real terms in 1996, at US6.5bn the tradesurplus remained high. Sizeable monthly trade surpluses were still recorded inthe first quarter of 1997, but in July the trade account moved into deficit,closing the year with a small surplus of just US$600m. In 1998 a plunge in oilprices pushed the trade account further into the red and the deficit widened toUS$7.9bn for the year. Depreciation of the peso in August 1998-January 1999spurred exports and curbed imports growth. Despite a real appreciation of thepeso from February 1999, a trade deficit of US$5.6bn was recorded for 1999 asa whole. A strong peso, along with robust internal demand, caused the deficitto expand from May 2000 and it closed the year at US$8bn.
Currency corrects in1994-95
Trade deficits soar in theearly 1990s
Mexico 39
EIU Country Profile 2001 © The Economist Intelligence Unit Limited 2001
In 1990-2000 the value of exports quadrupled from US$40.7bn to US$166.4bnas a result of a sharp rise in sales of manufactured goods, including those fromthe maquiladora (in-bond assembly for re-export) sector, which by 2000 acc-ounted for 87% of total earnings compared with 68% in 1990 and just 38% in1985. By contrast the share of crude oil and minerals fell from 25% to 10% in1990-2000. Growth of non-oil exports in recent years has been a major factorin the expansion of intermediate good imports, which accounted for 76% oftotal imports in 2000. Capital goods accounted for 14% and consumer goodsfor 10% of total imports in 2000. (For historical data on main exports andimports see Reference table 20.)
Foreign trade regulations
Export incentives: The Programa de Importación Temporal para ProducirArtículos de Exportación (Pitex) allows duty-free entry to temporary imports ofraw materials, parts, machinery and equipment used to manufacture exports.The Programa de Empresas Altamente Exportadoras (Altex) reimburses value-added tax and import tariffs for customs clearance. To be eligible for Altex acompany must earn at least US$2m per year from export sales. The BancoNacional de Comercio Exterior, the state development bank that funds foreigntrade, provides credit for exporters below commercial bank rates. Maquiladoras(in-bond assembly plants) do not pay import duties as their products aredestined for re-export. Under a new scheme announced in October 1999 thatwill run until 2002, maquiladoras will have the option to declare a minimumtaxable profit equivalent to 6.9% of the total value of their assets or to 6.5% oftheir total operating costs and expenditure, with tax being be paid on which-ever sum is greater, or to request agreement with the revenue service on trans-fer prices in order to determine taxable profits.
Exchange controls: There are no foreign-exchange controls.
Import tariffs: The maximum import tariff is 20% and the minimum 10%;exceptions pay 0-5%.
Import licences: Import licence requirements have been phased outgradually and few are still in force.
In January-November 2000 the US market accounted for 89% of Mexico’sexports and provided 74% of its imports. Despite efforts to diversify its exportbase, Mexico’s reliance on the US has increased rather than diminished inrecent years. Mexico has moved to develop trade with Latin America and theCaribbean through free-trade agreements (FTAs) with Chile (1992), Colombia,Venezuela, Costa Rica and Bolivia (1995) and Nicaragua (1998). In May 2000negotiation of an FTA with the Triangulo del Norte (the Northern Triangletrading bloc comprising Guatemala, Honduras and El Salvador) was concludedand the agreement will come into effect in 2001. FTAs with the EU and Israelwere signed in March 2000 and negotiation of an FTA with Panama continues.At the end of November 2000, a few days before leaving office, Mr Zedillosigned an FTA with the members of the European Free-Trade Area (EFTA,comprising Iceland, Liechetenstein, Norway and Switzerland) that will alsocome into effect in 2001. Including this agreement, Mexico has now signed
Imports and exports growstrongly in 1990-2000
Dependence on US market

40 Mexico
EIU Country Profile 2001 © The Economist Intelligence Unit Limited 2001
FTAs with 31 nations. By the end of 2001 the government expects that around90% of its exports will enjoy some kind of preferential treatment. Mexico, amember of the Asia-Pacific Economic Co-operation forum, is also seekingstronger trade relations with Pacific Rim countries, particularly through FTAswith Japan and Singapore. Negotiations with Singapore are set to continue in2001. (For historical data on Mexico’s main trading partners and on the dir-ection and composition of trade see Reference tables 22 and 23.)
Main trading partners, Jan-Nov 2000
Exports to: % of total Imports from: % of total
US 88.9 US 73.5
Canada 2.0 Japan 3.7
Spain 0.9 Germany 3.3
Germany 0.9 Canada 2.3
Japan 0.6 South Korea 2.1
UK 0.5 China 1.6
Venezuela 0.3 Italy 1.0
Source: Instituto Nacional de Estadística, Geografía e Informática.
NAFTA
NAFTA, which came into force on January 1st 1994, will liberalise trade over a15-year period, although some acceleration of the liberalisation process wasnegotiated subsequently. Acknowledging imbalances in development, thetimetable for Mexico to dismantle its trade barriers is more gradual than thatfor the US and Canada, and special rules apply to trade in textiles, vehicles andparts, and agricultural products. In addition, the state has retained exclusiverights to ownership, production and investment in oil, gas, refining, petro-chemicals, nuclear energy and electricity. The treaty also covers trade in ser-vices, including overland transport, ports, telecommunications, financial ser-vices and government procurement.
The Mexico-EU free-trade agreement
Having been approved both by Mexico’s Senate and the European Parliament,a free-trade agreement between Mexico and the EU was signed on March 23rd2000, coming into force on July 1st. Complete elimination of tariffs will taketen years, much less time than under NAFTA provisions. The tariff reductiontimetable addresses imbalances between both parties as 58.2% of Mexican ex-ports to the EU in value terms and 27.6% of EU exports to Mexico enter freely.Agricultural products deemed sensitive by both parties are excluded, includingseveral crops, meat, sugar and milk products. Rules of origin are in the 40-60%range, with those for cars starting at 45%, before increasing to a permanentlevel of 60% by 2005.
Invisibles and the current account
The growth in the trade deficit between 1990 and 1994 was accompanied by awidening of the gap on the invisibles account from US$6.6bn to US$11.2bn. By1994 the current-account deficit had expanded to US$29.7bn, equivalent to
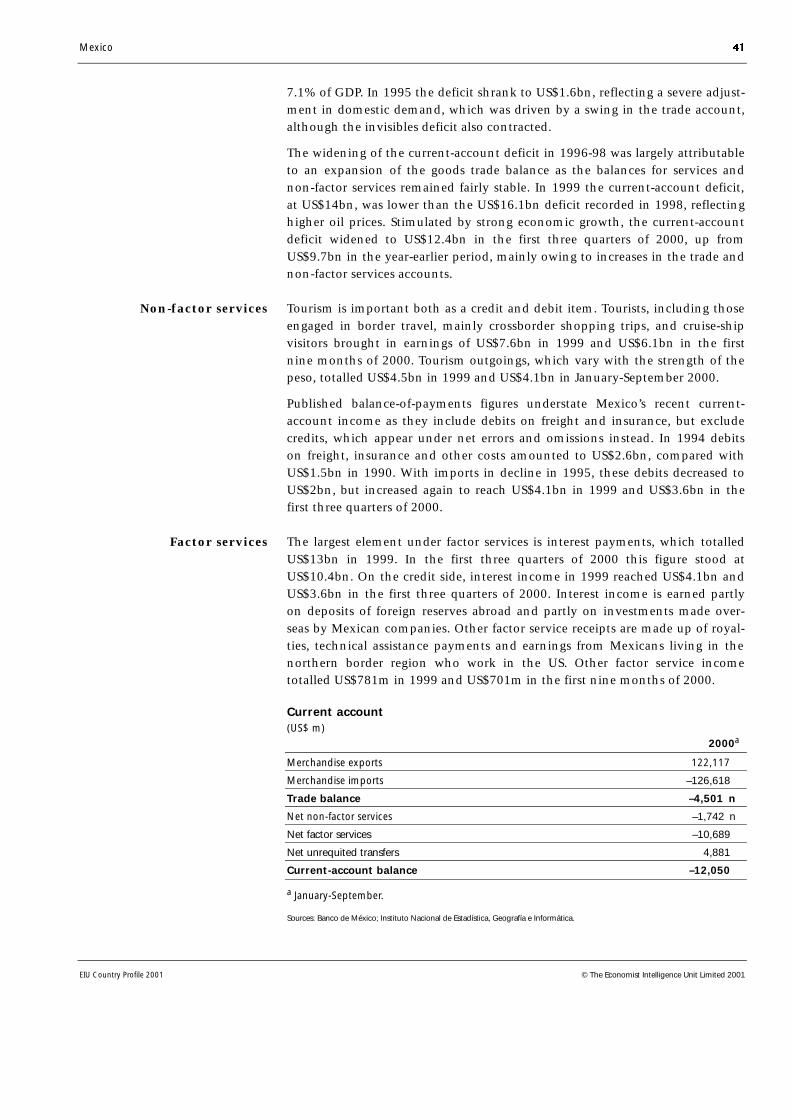
Mexico 41
EIU Country Profile 2001 © The Economist Intelligence Unit Limited 2001
7.1% of GDP. In 1995 the deficit shrank to US$1.6bn, reflecting a severe adjust-ment in domestic demand, which was driven by a swing in the trade account,although the invisibles deficit also contracted.
The widening of the current-account deficit in 1996-98 was largely attributableto an expansion of the goods trade balance as the balances for services andnon-factor services remained fairly stable. In 1999 the current-account deficit,at US$14bn, was lower than the US$16.1bn deficit recorded in 1998, reflectinghigher oil prices. Stimulated by strong economic growth, the current-accountdeficit widened to US$12.4bn in the first three quarters of 2000, up fromUS$9.7bn in the year-earlier period, mainly owing to increases in the trade andnon-factor services accounts.
Tourism is important both as a credit and debit item. Tourists, including thoseengaged in border travel, mainly crossborder shopping trips, and cruise-shipvisitors brought in earnings of US$7.6bn in 1999 and US$6.1bn in the firstnine months of 2000. Tourism outgoings, which vary with the strength of thepeso, totalled US$4.5bn in 1999 and US$4.1bn in January-September 2000.
Published balance-of-payments figures understate Mexico’s recent current-account income as they include debits on freight and insurance, but excludecredits, which appear under net errors and omissions instead. In 1994 debitson freight, insurance and other costs amounted to US$2.6bn, compared withUS$1.5bn in 1990. With imports in decline in 1995, these debits decreased toUS$2bn, but increased again to reach US$4.1bn in 1999 and US$3.6bn in thefirst three quarters of 2000.
The largest element under factor services is interest payments, which totalledUS$13bn in 1999. In the first three quarters of 2000 this figure stood atUS$10.4bn. On the credit side, interest income in 1999 reached US$4.1bn andUS$3.6bn in the first three quarters of 2000. Interest income is earned partlyon deposits of foreign reserves abroad and partly on investments made over-seas by Mexican companies. Other factor service receipts are made up of royal-ties, technical assistance payments and earnings from Mexicans living in thenorthern border region who work in the US. Other factor service incometotalled US$781m in 1999 and US$701m in the first nine months of 2000.
Current account(US$ m)
2000a
Merchandise exports 122,117
Merchandise imports –126,618
Trade balance –4,501 n
Net non-factor services –1,742 n
Net factor services –10,689
Net unrequited transfers 4,881
Current-account balance –12,050
a January-September.
Sources: Banco de México; Instituto Nacional de Estadística, Geografía e Informática.
Non-factor services
Factor services
42 Mexico
EIU Country Profile 2001 © The Economist Intelligence Unit Limited 2001
Transfers are an important element in the invisibles account and contribute asizeable surplus to the balance of payments. Transfers, made up largely of re-mittances from migrant workers, totalled US$5.9bn in 1999, up from US$5.6bnin 1998. Transfers in the first three quarters of 2000 reached US$4.9bn. (Forhistorical data on the balance of payments see Reference tables 23 and 24.)
Capital flows and external debt
The presidency of Carlos Salinas de Gortari (1988-94) was characterised byhuge inflows of volatile short-term capital, which was a major determinant ofthe 1994-95 crisis. The surplus on the capital account narrowed fromUS$32.5bn in 1993 to US$14.6bn in 1994 and reserves were all but exhausted.Under the administration of Ernesto Zedillo Ponce de León (1994-2000) in-flows of short-term capital were relatively unimportant and flows were dom-inated instead by foreign direct investment and long-term debt. In 1995 thecapital-account position improved marginally when the surplus increased toUS$15.4bn, while the current-account deficit almost disappeared and reserveswere rebuilt. Whereas the current-account deficit widened only slightly in1996, the surplus on the capital account contracted considerably, to US$4.1bn.The accumulation of reserves was therefore relatively modest.
In 1997 the surplus on the capital account expanded sharply again, toUS$15.8bn. Although the current-account deficit also widened, inflows on thecapital account again allowed for a substantial and much-needed,accumulation of reserves. In 1998 the surplus increased slightly, to US$17.7bn.As the current-account deficit nearly reached the same level, the accumulationof reserves, at US$2.1bn, was relatively modest. In 1999 a surplus of US$15.7bnwas recorded on the capital account, slightly above the figure for the current-account deficit. The accumulation of reserves continued, at US$594m. In thefirst three quarters of 2000 the surplus stood at US$12.3bn and theaccumulation of reserves reached US$1.1bn.
Foreign investment flows were responsible in the main for the sizeable capital-account surpluses recorded until 1993. Following approval of the NorthAmerican Free-Trade Agreement (NAFTA) in that year, investment levels soared,particularly for portfolio investments. By 1993 foreigners held nearly 40% ofthe internal public debt and accounted for about 27% of stockmarketcapitalisation. However, in 1994 portfolio investments fell, whereas foreigndirect investment (FDI) continued to rise. In 1995 the financial crisis wasaccompanied by large net outflows of portfolio capital, which outstripped netinflows of FDI by US$200m.
In 1996 economic recovery attracted foreign capital back into Mexico’sstockmarket and money market. FDI flows, which had held up in 1995,remained strong in 1996 and set a record of US$12.8bn in 1997. The un-certainty that prevailed in 1998 caused portfolio investments to fall byUS$452m, comprising a net outflow of US$666m from the stockmarket and anet inflow of US$214m to the money market, but FDI flows held up andreached US$11.6bn. In 1999 FDI inflows, at US$11.9bn, remained strong.
External investment flows
Unrequited transfers
Mexico 43
EIU Country Profile 2001 © The Economist Intelligence Unit Limited 2001
Portfolio investments in the stockmarket increased sharply, by US$3.8bn, whilethose in the money market rose modestly, by US$131m, bringing the total toUS$3.9bn. In the first nine months of 2000, FDI stood at US$9.8bn, whileportfolio investments registered a net inflow of US$1.3bn and the moneymarket an outflow of US$244m, representing total flows of US$1.1bn. (Forhistorical data on foreign investment see Reference table 25.)
Foreign investment regulations
The Foreign Investments Law that took effect in December 1993 allows for100% foreign investment participation in the equity of Mexican companiesexcept in specific areas. Exceptions include activities reserved exclusively forthe state such as oil, hydrocarbons, basic petrochemicals, electricity distrib-ution, nuclear power and radioactive minerals; telegraphs, radiotelegraphs andpostal services; the issue of monetary bills and the minting of coins; and otherareas provided for by other legislation. Areas reserved for national investmentinclude domestic cargo and passenger land transport, including tourism; theretailing of petrol and the distribution of liquefied gas; radio and televisionbroadcasting other than cable television; and credit unions, developmentbanks and the technical and professional services provided for in otherlegislation. Foreigners can participate in other areas, but only through neutralinvestments (non-voting equity. There are specific limits to interests held byforeign investors, including limits of 10% in production co-operatives; 25% indomestic air transport, air taxis and specialised air transport; and 49% incertain activities in finance, communications, transport and agriculture (foreigninvestment can exceed the 49% limit, but only in the form of non-votingequity).
External debt increased nearly fivefold under the administration of LuisEcheverría Alvarez (1970-76), particularly in 1973-76, and almost tripled duringthe presidency of José López Portillo y Pacheco (1976-82), mainly in 1981-82.In 1982 Mexico defaulted on its external debt, which restricted access to freshfunds. Attempts to renegotiate the debt were made in 1982-90, the last suchoperation being a Brady Plan deal in which distressed commercial bank debtwas exchanged for bonds at a discount. Although the public-debt stock did notalter greatly, the psychological impact was important and the operation re-stored Mexico’s access to international capital markets. Having remained fairlyconstant between 1990—at US$77.8bn—and 1993—at US$78.7bn—publicexternal debt increased to US$85.4bn in 1994, mainly through bond issues,and to US$100.9bn in 1995 on account of massive borrowing from the IMFand the US government to pay down Tesobonos (US dollar-denominated bonds)(see Economic policy). The government was able to return to the internationalcapital markets in May 1995.
Having been taught a harsh lesson about dependence on external savings inthe 1994-95 crisis, the Zedillo government made the development of the dom-estic debt market a priority. In addition to encouraging domestic debt pur-chases by foreign investment banks, it introduced privately managed pensionplans to foster the creation of a pool of domestic savings. As this policy provedto be successful, the government was able to reduce public-sector external
External public-sector debt
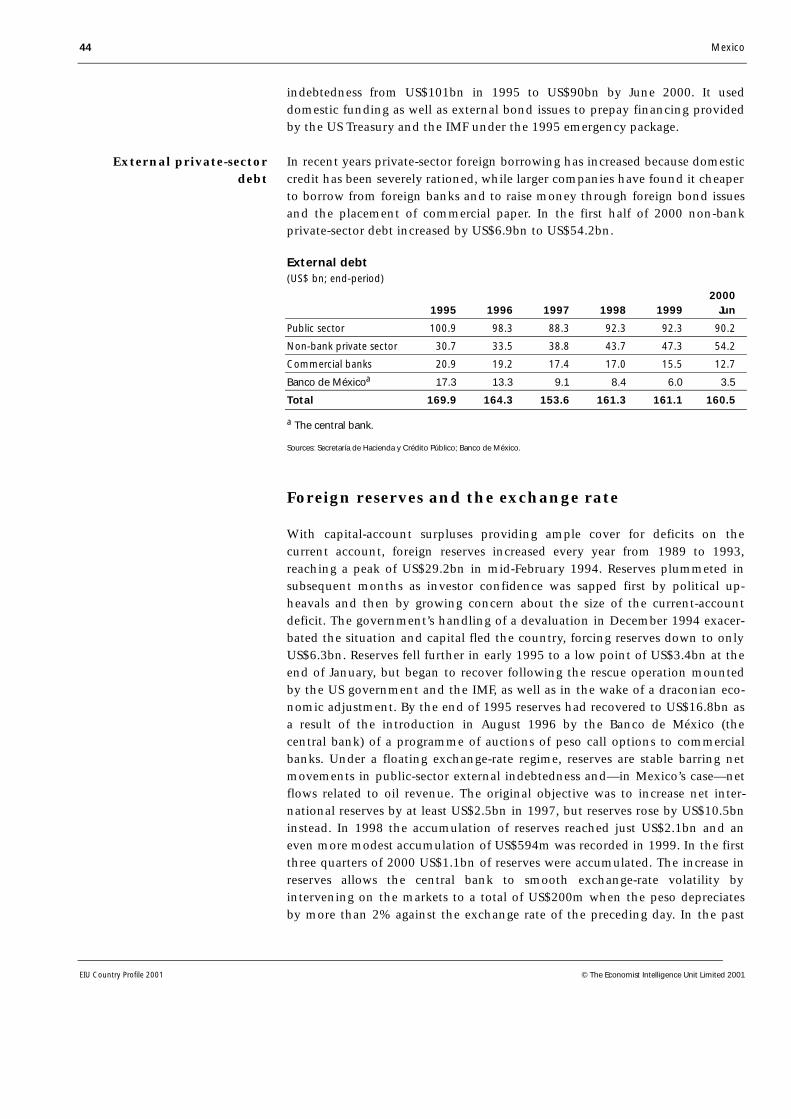
44 Mexico
EIU Country Profile 2001 © The Economist Intelligence Unit Limited 2001
indebtedness from US$101bn in 1995 to US$90bn by June 2000. It useddomestic funding as well as external bond issues to prepay financing providedby the US Treasury and the IMF under the 1995 emergency package.
In recent years private-sector foreign borrowing has increased because domesticcredit has been severely rationed, while larger companies have found it cheaperto borrow from foreign banks and to raise money through foreign bond issuesand the placement of commercial paper. In the first half of 2000 non-bankprivate-sector debt increased by US$6.9bn to US$54.2bn.
External debt(US$ bn; end-period)
20001995 1996 1997 1998 1999 Jun
Public sector 100.9 98.3 88.3 92.3 92.3 90.2
Non-bank private sector 30.7 33.5 38.8 43.7 47.3 54.2
Commercial banks 20.9 19.2 17.4 17.0 15.5 12.7
Banco de Méxicoa 17.3 13.3 9.1 8.4 6.0 3.5
Total 169.9 164.3 153.6 161.3 161.1 160.5
a The central bank.
Sources: Secretaría de Hacienda y Crédito Público; Banco de México.
Foreign reserves and the exchange rate
With capital-account surpluses providing ample cover for deficits on thecurrent account, foreign reserves increased every year from 1989 to 1993,reaching a peak of US$29.2bn in mid-February 1994. Reserves plummeted insubsequent months as investor confidence was sapped first by political up-heavals and then by growing concern about the size of the current-accountdeficit. The government’s handling of a devaluation in December 1994 exacer-bated the situation and capital fled the country, forcing reserves down to onlyUS$6.3bn. Reserves fell further in early 1995 to a low point of US$3.4bn at theend of January, but began to recover following the rescue operation mountedby the US government and the IMF, as well as in the wake of a draconian eco-nomic adjustment. By the end of 1995 reserves had recovered to US$16.8bn asa result of the introduction in August 1996 by the Banco de México (thecentral bank) of a programme of auctions of peso call options to commercialbanks. Under a floating exchange-rate regime, reserves are stable barring netmovements in public-sector external indebtedness and—in Mexico’s case—netflows related to oil revenue. The original objective was to increase net inter-national reserves by at least US$2.5bn in 1997, but reserves rose by US$10.5bninstead. In 1998 the accumulation of reserves reached just US$2.1bn and aneven more modest accumulation of US$594m was recorded in 1999. In the firstthree quarters of 2000 US$1.1bn of reserves were accumulated. The increase inreserves allows the central bank to smooth exchange-rate volatility byintervening on the markets to a total of US$200m when the peso depreciatesby more than 2% against the exchange rate of the preceding day. In the past
External private-sectordebt
Mexico 45
EIU Country Profile 2001 © The Economist Intelligence Unit Limited 2001
two years that rule has been broken only once, when the central bank soldUS$278m on the exchange markets in the aftermath of the Russiandevaluation. (For historical data on foreign reserves see Reference table 29; forhistorical data on the exchange rate see Reference table 30.)
46 Mexico
EIU Country Profile 2001 © The Economist Intelligence Unit Limited 2001
Appendices
Sources of information
Banco de México (the central bank), Indicadores del Sector Externo (monthly)
Banco de México, Indicadores Económicos (monthly)
Banco de México, Informe sobre la Inflación (quarterly)
Banco de México, Programa Monetario (annual)
Banco de México, Informe Anual (annual)
Banco de México, The Mexican Economy (annual)
Banco Nacional de Comercio Exterior, Comercio Exterior (monthly)
Instituto Nacional de Estadística, Geografía e Informática (INEGI, the NationalInstitute of Statistics, Geography and Informatics), Bulletin of StatisticalInformation (quarterly)
Instituto Nacional de Estadística, Geografía e Informática, Sistema de CuentasNacionales (annual)
INEGI also produces annual and quarterly surveys of urban employment,national income and expenditure, industrial performance, as well asinformation on the activity of maquiladoras (in-bond assembly plants)
Nacional Financiera, El Mercado de Valores (monthly)
Presidencia de la República (Office of the President), Informe de Ejecución delPlan Nacional de Desarrollo (annual)
Presidencia de la República, Informe de Gobierno (annual)
Secretaría de Hacienda y Crédito Público (SHCP, Ministry for Credit and PublicFinance), Cuenta de la Hacienda Pública Federal (annual)
Secretaría de Hacienda y Crédito Público, Informe sobre la Situación Económica,las Finanzas Públicas y la Deuda Pública (quarterly)
Secretaría de Hacienda y Crédito Público, Mexico: Economic and FinancialStatistics Data Book (half-yearly)
Main government portal, http://www.precisa.gob.mx
Procuraduría General de la República (PGR, Ministry of the Attorney General),http://www.pgr.gob.mx
Presidencia de la República (Office of the President),http://www.presidencia.gob.mx
Secretaría de Agricultura, Ganadería y Desarrollo Rural (SAGAR, Ministry ofAgriculture, Livestock, Rural Development, Food and Fisheries),http://www.sagar.gob.mx
National statistical sources
Internet addresses
Mexico 47
EIU Country Profile 2001 © The Economist Intelligence Unit Limited 2001
Secretaría de la Reforma Agraria (SRA, Ministry of Agrarian Reform),http://www.sra.gob.mx
Secretaría de Comunicaciones y Transportes (SCT, Ministry of Communicationsand Transport), http://www.sct.gob.mx
Secretaría de la Defensa Nacional (Sedena, Ministry of National Defence),http://www.sedena.gob.mx
Secretaría de Economía (Ministry of the Economy), http://www.se.gob.mx
Secretaría de Energía (SE, Ministry of Energy), http://www.energia.gob.mx
Secretaría de Gobernación (SG, Ministry of Interior),http://www.gobernacion.gob.mx
Secretaría de Hacienda y Crédito Público (SCHP, Ministry of Finance and PublicCredit), http://www.shcp.gob.mx
Secretaría de Medio Ambiente, Recursos Naturales y Pesca (Semarnap, Ministryof the Environment, Natural Resources and Fisheries),http://www.semarnat.gob.mx
Secretaría de Relaciones Exteriores (SRE, Ministry of Foreign Relations),http://www.sre.gob.mx
Secretaría de Salud (SSA, Ministry of Health), http://www.ssa.gob.mx
Secretaría del Trabajo y Previsión Social (STPS, Ministry of Labour and SocialWelfare), http://www.stps.gob.mx
Secretaría de Turismo (Sectur, Ministry of Tourism), http://www.mexico-travel.com
Banco de México (the central bank): http://www.banxico.org.mx
Sistema de Informacion Empresarial Mexicano (SIEM, Mexican BusinessInformation System), http://www.secofi-siem.gob.mx
Cámara de Diputados (Chamber of Deputies),http://www.camaradediputados.gob.mx
Senado de la República (Senate), http://www.senado.gob.mx
Congress (Cámara Diputados del Honorable Congreso de la Unión),http://www.cddhcu.gob.mx
Instituto Federal Electoral (IFE, Federal Electoral Institute),http://www.ife.org.mx
Comisión Reguladora de Energia (CRE, Regulatory Commission for Energy),http://www.cre.gob.mx
Comisión Federal de Electricidad (CFE, Federal Electricity Commission),http://www.cfe.gob.mx
Comisión Federal de Telecomunicaciones (Federal TelecommunicationsCommission), http://www.cofetel.gob.mx
48 Mexico
EIU Country Profile 2001 © The Economist Intelligence Unit Limited 2001
Instituto Nacional de Estadística, Geografía e Informática (INEGI, NationalInstitute of Statistics, Geography and Informatics), http://www.inegi.gob.mx
Legislation: http://www.juridicas.unam.mx/infjur/leg/
Mexican Investment Board (MIB), http://www.mib.org.mx
National Bank for Foreign Trade: http://www.bancomext.gob.mx
Petróleos Mexicanos (Pemex), http://www.pemex.com
Bolsa Mexicana de Valores (the Mexican Stock Exchange),http://www.bmv.com.mx
Suprema Corte de Justicia de la Nación (SCJN, the Supreme Court),http://www.scjn.gob.mx
Energy Data Associates, Bishops Walk House, 19-23 High Street, Pinner,Middlesex HA5 5PJ
IMF, International Financial Statistics (monthly)
Inter-American Development Bank, Economic and Social Progress in LatinAmerica (annual)
OECD, Economic Survey of Mexico, 1999
UN, Monthly Bulletin of Statistics
UN Economic Commission for Latin America and the Caribbean, EconomicSurvey of Latin America and the Caribbean (annual)
UN Food and Agriculture Organisation, Production Yearbook
World Bank, Global Development Finance (annual)
World Bank, World Development Report (annual)
Enrique Cárdenas, La Política Económica en México 1950-1994, FCE, 1996
Jorge G Castañeda, La Herencia, Alfaguara, 1999
Enrique Krauze, La Presidencia Imperial, Tusquets Editores, 1997
Alan Riding, Mexico: Inside the Volcano, I B Tauris, London, 1987
Carlos Salinas de Gortari, México: Un Paso Difícil a la Modernidad, Plaza andJanés, 2000
Luis Spota, Casi el Paraíso, FCE, 1963
Luis Spota, Paraíso 25, FCE, 1983
Select bibliography
International statisticalsources

Mexico 49
EIU Country Profile 2001 © The Economist Intelligence Unit Limited 2001
Reference tables
These reference tables provide the most up-to-date statistics available at the date ofpublication.
Reference table 1
Populationa
(‘000)
1995 1996 1997 1998 1999
Total population 91.2 92.4 93.6 94.8 96.1
a Estimates from the 1995 population count and the 2000 census.
Sources: Consejo Nacional de Población; Instituto Nacional de Estadística, Geografía e Informática.
Reference table 2
Labour forcea
(‘000 unless otherwise indicated)
1996 1997 1998 1999
Menb 23,744 24,952 25,719 26,918
Womenb 12,836 13,393 13,788 14,494
Total 36,581 38,345 39,507 41,412 of which: insured 11,895 12,714 13,611 14,560
Participation rate (urban areas; %) 55.4 56.2 55.7 56.2
a Working population at least 12 years old. b Data for 1995-99 estimated by the EIU using figuresfrom Conapo and INEGI; data for 2000 are preliminary figures from Conapo.
Sources: OECD, Economic Survey of Mexico; Instituto Mexicano de Seguro Social; Consejo Nacional de Población; Presidencia de laRepública, Quinto Informe de Gobierno; Instituto Nacional de Estadística, Geografía e Informática; EIU.
Reference table 3
Unemployment rates in urban areasa
(annual averages; %)
1995 1996 1997 1998 1999 2000
Openb 6.3 5.5 3.7 3.2 2.5 2.2
Underemploymentc 25.7 25.3 23.3 21.8 19.1 18.9
Insufficient incomed 16.2 17.2 16.3 14.7 12.8 10.2
a In 1990-91 the sample covered 16 urban areas; it was extended to 34 in 1992, to 37 by thefourth quarter of 1993, to 41 in the first quarter of 1996 and to 43 from the fourth quarter of 1996.b A narrow measure covering persons age 12 years or over who did not work, but were available forwork in the reference week and who had unsuccessfully sought employment in the two monthsbefore. c Economically active population unemployed, plus those employed for less than 35 hoursper week. d Proportion of economically active population unemployed or employed and earningless than the minimum wage.
Source: Instituto Nacional de Estadística, Geografía e Informática.
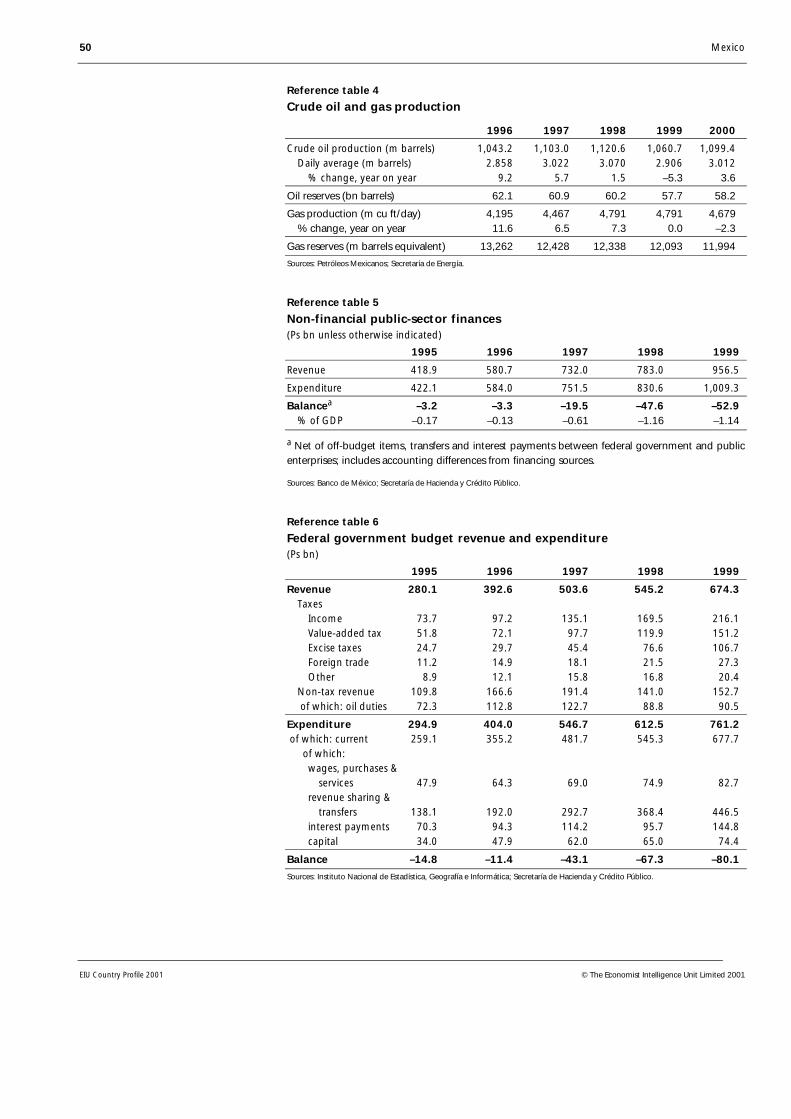
50 Mexico
EIU Country Profile 2001 © The Economist Intelligence Unit Limited 2001
Reference table 4
Crude oil and gas production
1996 1997 1998 1999 2000
Crude oil production (m barrels) 1,043.2 1,103.0 1,120.6 1,060.7 1,099.4 Daily average (m barrels) 2.858 3.022 3.070 2.906 3.012 % change, year on year 9.2 5.7 1.5 –5.3 3.6
Oil reserves (bn barrels) 62.1 60.9 60.2 57.7 58.2
Gas production (m cu ft/day) 4,195 4,467 4,791 4,791 4,679 % change, year on year 11.6 6.5 7.3 0.0 –2.3
Gas reserves (m barrels equivalent) 13,262 12,428 12,338 12,093 11,994
Sources: Petróleos Mexicanos; Secretaría de Energía.
Reference table 5
Non-financial public-sector finances(Ps bn unless otherwise indicated)
1995 1996 1997 1998 1999
Revenue 418.9 580.7 732.0 783.0 956.5
Expenditure 422.1 584.0 751.5 830.6 1,009.3
Balancea –3.2 –3.3 –19.5 –47.6 –52.9 % of GDP –0.17 –0.13 –0.61 –1.16 –1.14
a Net of off-budget items, transfers and interest payments between federal government and publicenterprises; includes accounting differences from financing sources.
Sources: Banco de México; Secretaría de Hacienda y Crédito Público.
Reference table 6
Federal government budget revenue and expenditure(Ps bn)
1995 1996 1997 1998 1999
Revenue 280.1 392.6 503.6 545.2 674.3 Taxes Income 73.7 97.2 135.1 169.5 216.1 Value-added tax 51.8 72.1 97.7 119.9 151.2 Excise taxes 24.7 29.7 45.4 76.6 106.7 Foreign trade 11.2 14.9 18.1 21.5 27.3 Other 8.9 12.1 15.8 16.8 20.4 Non-tax revenue 109.8 166.6 191.4 141.0 152.7 of which: oil duties 72.3 112.8 122.7 88.8 90.5
Expenditure 294.9 404.0 546.7 612.5 761.2 of which: current 259.1 355.2 481.7 545.3 677.7 of which: wages, purchases & services 47.9 64.3 69.0 74.9 82.7 revenue sharing & transfers 138.1 192.0 292.7 368.4 446.5 interest payments 70.3 94.3 114.2 95.7 144.8 capital 34.0 47.9 62.0 65.0 74.4
Balance –14.8 –11.4 –43.1 –67.3 –80.1
Sources: Instituto Nacional de Estadística, Geografía e Informática; Secretaría de Hacienda y Crédito Público.

Mexico 51
EIU Country Profile 2001 © The Economist Intelligence Unit Limited 2001
Reference table 7
Money supply and credit(Ps m unless otherwise indicated; end-period)
1995 1996 1997 1998 1999
Currency in circulation 60,839 74,338 94,340 116,083 164,424
Demand deposits 85,783 128,600 169,337 190,036 229,128
Money (M1) incl others 150,572 206,180 267,113 308,135 395,475 % change, year on year 3.5 36.9 29.6 15.4 28.3
Quasi-money 384,300 464,124 630,139 765,988 804,976
Money (M2) 534,872 670,304 897,252 1,074,123 1,200,451 % change, year on year 31.7 25.3 33.9 19.7 11.8
Domestic credit 516,746 426,642 911,333 1,007,119 1,016,018
Net claims on central government 1,920 –1,339 235,706 256,085 236,422 Local government 5,398 4,024 8,996 13,691 13,729 Non-financial public enterprises 1,208 1,310 1,606 5,264 2,180 Private sector 464,075 394,723 569,258 672,385 667,422 Other banking institutions 18,198 11,079 29,133 21,799 37,252 Other non-bank financial institutions 25,947 16,845 66,634 37,986 59,014
Net foreign assets 5,911 37,479 177,812 277,007 312,986
Memorandum itemAverage cost of funds (% annual rate) 45.1 30.7 19.1 21.1 19.7
Source: IMF, International Financial Statistics.
Reference table 8
Interest rates(%; period averages unless otherwise indicated)
1995 1996 1997 1998 1999
Money-market rate 60.9 33.6 21.9 26.9 24.1
Treasury bills (28-day rate) 48.4 31.4 19.8 24.8 21.4
Deposit rate 38.1 24.7 14.7 13.8 9.6
Cost of funds (av) 45.1 30.7 19.1 21.1 19.7
Source: IMF, International Financial Statistics.
Reference table 9
Gross domestic product1995 1996 1997 1998 1999 2000
Total (Ps m)At current prices 1,840,431 2,529,909 3,179,120 3,848,218 4,588,466 5,432,355At constant 1993 prices 1,230,608 1,293,859 1,381,525 1,449,310 1,505,971 1,609,138Real change (%) –6.2 5.1 6.8 4.9 3.8 6.9
Per head (Ps)At current prices 20,189 27,348 33,871 40,403 47,875 55,291At constant 1993 prices 13,500 13,986 14,719 15,210 15,545 16,527Real change (%) –7.8 3.6 5.2 3.3 2.2 6.3
Sources: Banco de México; Instituto Nacional de Estadística, Geografía e Informática.

52 Mexico
EIU Country Profile 2001 © The Economist Intelligence Unit Limited 2001
Reference table 10
Gross domestic product by sector(% real change; constant 1993 prices)
1996 1997 1998 1999 2000
Agriculture, livestock, forestry & fishing 3.6 0.2 0.8 3.5 3.4
Mining 8.1 4.5 2.7 –2.1 4.0
Manufacturing 10.8 9.9 7.4 4.2 7.1
Construction 9.8 9.3 4.2 5.0 5.0
Electricity, gas & water 4.6 5.2 1.9 7.9 6.2
Commerce, restaurants & hotels 4.8 10.7 5.6 3.4 11.1
Transport & communications 8.0 9.9 6.7 7.8 12.7
Community & social services 1.0 3.3 2.9 2.1 3.0
Financial services & real estate 0.6 3.7 4.6 3.9 4.5
Imputed banking services –5.1 10.6 5.6 5.9 6.2
GDP 5.1 6.8 4.9 3.8 6.9
Sources: Banco de México; Instituto Nacional de Estadística, Geografía e Informática.
Reference table 11
Gross domestic product by expenditure(% real change; constant 1993 prices)
1995 1996 1997 1998 1999
Private consumption –9.5 2.2 6.5 5.4 4.3
Government consumption –1.3 –0.7 2.9 2.2 1.0
Gross fixed investment –29.0 16.4 21.0 10.3 5.8
Exports of goods & services 30.2 18.2 10.7 12.1 13.9
Imports of goods & services –15.0 22.9 22.7 16.5 12.8
GDP at market prices –6.2 5.1 6.8 4.8 3.7
Sources: Banco de México; Instituto Nacional de Estadística, Geografía e Informática.
Reference table 12
Prices and earnings(% change; period averages)
1995 1996 1997 1998 1999 2000
Consumer prices 35.0 34.4 20.6 15.9 16.6 9.5
Producer prices 41.5 34.3 16.0 13.8 15.7 10.1
Wages in manufacturinga –12.6 –9.9 –0.6 2.8 –1.1 6.1b
a Real wages deflated by consumer price inflation. b January-November.
Sources: Banco de México; Instituto Nacional de Estadística, Geografía e Informática.
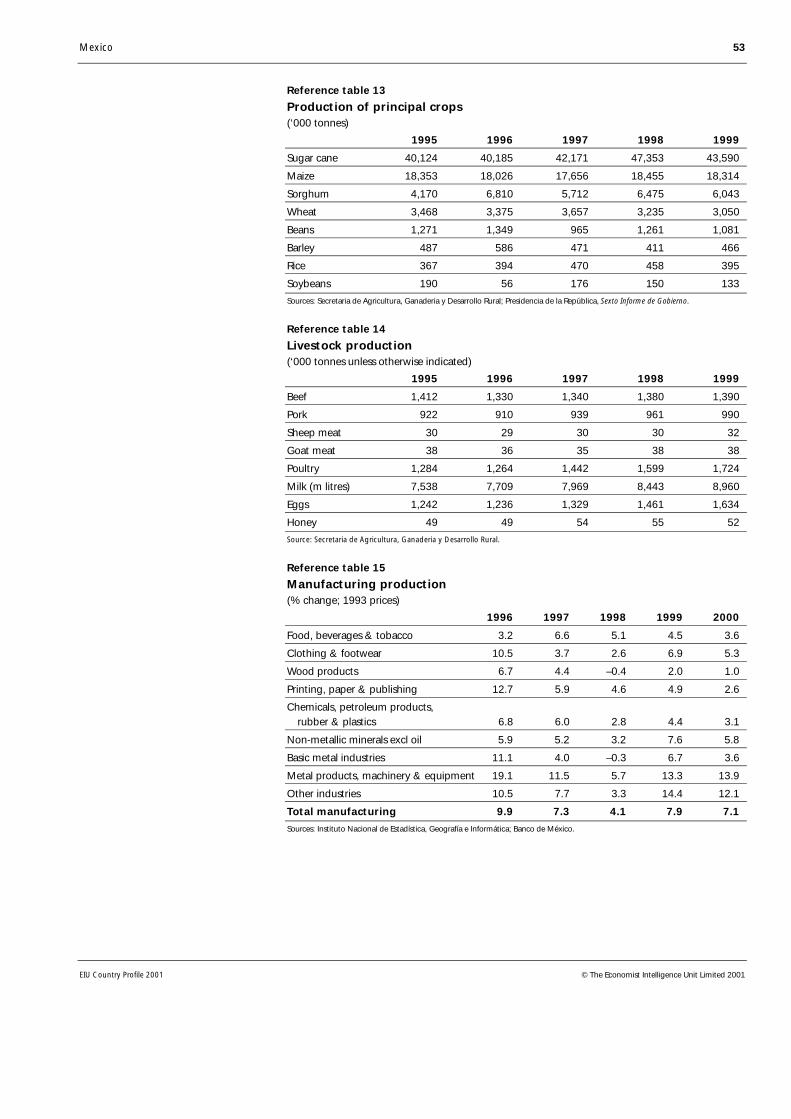
Mexico 53
EIU Country Profile 2001 © The Economist Intelligence Unit Limited 2001
Reference table 13
Production of principal crops(‘000 tonnes)
1995 1996 1997 1998 1999
Sugar cane 40,124 40,185 42,171 47,353 43,590
Maize 18,353 18,026 17,656 18,455 18,314
Sorghum 4,170 6,810 5,712 6,475 6,043
Wheat 3,468 3,375 3,657 3,235 3,050
Beans 1,271 1,349 965 1,261 1,081
Barley 487 586 471 411 466
Rice 367 394 470 458 395
Soybeans 190 56 176 150 133
Sources: Secretaria de Agricultura, Ganaderia y Desarrollo Rural; Presidencia de la República, Sexto Informe de Gobierno.
Reference table 14
Livestock production(‘000 tonnes unless otherwise indicated)
1995 1996 1997 1998 1999
Beef 1,412 1,330 1,340 1,380 1,390
Pork 922 910 939 961 990
Sheep meat 30 29 30 30 32
Goat meat 38 36 35 38 38
Poultry 1,284 1,264 1,442 1,599 1,724
Milk (m litres) 7,538 7,709 7,969 8,443 8,960
Eggs 1,242 1,236 1,329 1,461 1,634
Honey 49 49 54 55 52
Source: Secretaria de Agricultura, Ganaderia y Desarrollo Rural.
Reference table 15
Manufacturing production(% change; 1993 prices)
1996 1997 1998 1999 2000
Food, beverages & tobacco 3.2 6.6 5.1 4.5 3.6
Clothing & footwear 10.5 3.7 2.6 6.9 5.3
Wood products 6.7 4.4 –0.4 2.0 1.0
Printing, paper & publishing 12.7 5.9 4.6 4.9 2.6
Chemicals, petroleum products, rubber & plastics 6.8 6.0 2.8 4.4 3.1
Non-metallic minerals excl oil 5.9 5.2 3.2 7.6 5.8
Basic metal industries 11.1 4.0 –0.3 6.7 3.6
Metal products, machinery & equipment 19.1 11.5 5.7 13.3 13.9
Other industries 10.5 7.7 3.3 14.4 12.1
Total manufacturing 9.9 7.3 4.1 7.9 7.1
Sources: Instituto Nacional de Estadística, Geografía e Informática; Banco de México.
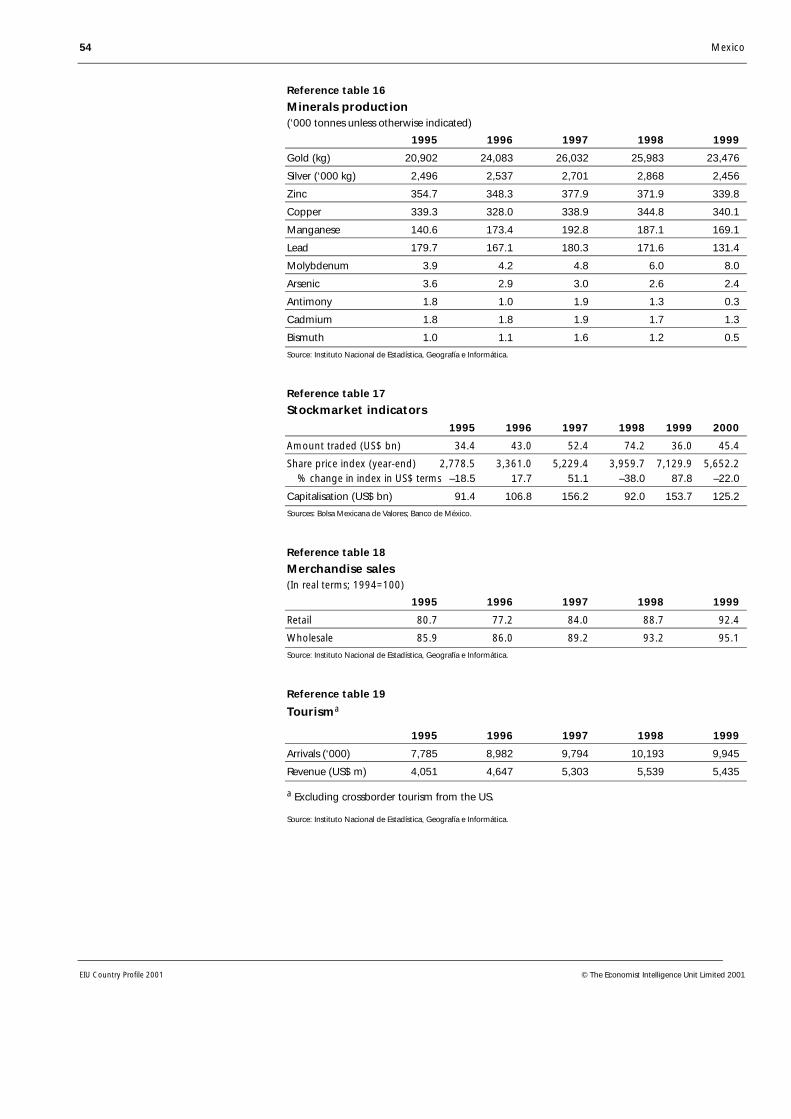
54 Mexico
EIU Country Profile 2001 © The Economist Intelligence Unit Limited 2001
Reference table 16
Minerals production(‘000 tonnes unless otherwise indicated)
1995 1996 1997 1998 1999
Gold (kg) 20,902 24,083 26,032 25,983 23,476
Silver (‘000 kg) 2,496 2,537 2,701 2,868 2,456
Zinc 354.7 348.3 377.9 371.9 339.8
Copper 339.3 328.0 338.9 344.8 340.1
Manganese 140.6 173.4 192.8 187.1 169.1
Lead 179.7 167.1 180.3 171.6 131.4
Molybdenum 3.9 4.2 4.8 6.0 8.0
Arsenic 3.6 2.9 3.0 2.6 2.4
Antimony 1.8 1.0 1.9 1.3 0.3
Cadmium 1.8 1.8 1.9 1.7 1.3
Bismuth 1.0 1.1 1.6 1.2 0.5
Source: Instituto Nacional de Estadística, Geografía e Informática.
Reference table 17
Stockmarket indicators1995 1996 1997 1998 1999 2000
Amount traded (US$ bn) 34.4 43.0 52.4 74.2 36.0 45.4
Share price index (year-end) 2,778.5 3,361.0 5,229.4 3,959.7 7,129.9 5,652.2 % change in index in US$ terms –18.5 17.7 51.1 –38.0 87.8 –22.0
Capitalisation (US$ bn) 91.4 106.8 156.2 92.0 153.7 125.2
Sources: Bolsa Mexicana de Valores; Banco de México.
Reference table 18
Merchandise sales(In real terms; 1994=100)
1995 1996 1997 1998 1999
Retail 80.7 77.2 84.0 88.7 92.4
Wholesale 85.9 86.0 89.2 93.2 95.1
Source: Instituto Nacional de Estadística, Geografía e Informática.
Reference table 19
Tourisma
1995 1996 1997 1998 1999
Arrivals (‘000) 7,785 8,982 9,794 10,193 9,945
Revenue (US$ m) 4,051 4,647 5,303 5,539 5,435
a Excluding crossborder tourism from the US.
Source: Instituto Nacional de Estadística, Geografía e Informática.

Mexico 55
EIU Country Profile 2001 © The Economist Intelligence Unit Limited 2001
Reference table 20
Main exports and importsa
(US$ m)
1995 1996 1997 1998 1999
Exports fobManufacturesb 66,558 80,305 94,802 106,062 122,085Oil exportsc 8,423 11,654 11,323 7,134 9,928Agricultural products 4,016 3,592 3,828 3,797 3,926Mining products 545 449 478 466 453Total 79,542 96,000 110,431 117,459 136,391
Imports fobConsumer goods 5,335 6,657 9,326 11,109 12,175Intermediate goods 58,421 71,890 85,366 96,935 109,270Capital goods 8,697 10,922 15,116 17,329 20,530Total 72,453 89,469 109,808 125,373 141,975
a Includes maquiladoras. b Excludes oil products. c Includes products.
Sources: Banco de México; Instituto Nacional de Estadística, Geografía e Informática.
Reference table 21
Main trading partners(% of total)
1995 1996 1997 1998 1999
Exports fob to:US 83.6 84.0 85.6 87.9 88.4Latin America & the Caribbean 6.1 6.5 6.0 5.0 3.8EU 4.3 3.7 3.6 3.3 3.8Canada 2.5 2.3 2.0 1.3 1.8Japan 1.2 1.4 1.0 0.7 0.6
Imports fob from:US 74.5 75.6 74.8 74.5 74.3EU 9.3 8.6 9.0 9.3 9.0Japan 5.0 4.4 3.9 3.6 3.6Latin America & the Caribbean 2.7 2.5 2.4 2.3 2.3Canada 1.9 1.9 1.8 1.8 2.1
Sources: Banco de México; Instituto Nacional de Estadística, Geografía e Informática.

56 Mexico
EIU Country Profile 2001 © The Economist Intelligence Unit Limited 2001
Reference table 22
Direction and composition of trade, 1999(US$ m)
Exports fob US Canada Germany Total
Animals for food 321 0 0 322Meat, fish & preparations 766 1 0 878Fruit, vegetables & preparations 3,120 28 5 3,386Coffee, cocoa, tea, spices & manufactures 539 1 11 727Crude petroleum 6,794 120 0 8,851Chemicalsa 3,835 66 101 6,110Textile fibres, yarn, cloth & manufactures 2,101 68 5 2,610Non-metallic mineral manufacturesb 2,350 45 55 2,738Metals & manufacturesc 5,059 62 54 5,954 of which: iron & steel & manufacturesc 2,768 39 45 3,407Machinery 16,127 727 243 18,837Electrical & electronic equipment 36,868 125 87 38,056Road vehicles 20,860 883 1,335 23,587Other transport 969 1 0 1,008Furniture, lighting, prefabricated buildings 2,741 14 19 2,867Clothing & footwear 7,570 51 2 8,032Scientific instruments 3,845 22 86 4,180Total incl others 120,610 2,311 2,073 136,703
Imports fob US Japan Germany Total
Food 4,369 2 55 5,672 of which: meat, fish & preparations 1,088 0 0 1,283 cereals & preparations 1,600 0 34 1,916Mineral fuels & lubricants 2,339 7 23 2,988Chemicalsa 13,246 294 562 17,441Rubber & manufactures 1,572 0 0 2,033Paper & manufactures 2,764 12 28 3,118Textile fibres, yarn, cloth & manufactures 4,387 30 63 5,387Metals & manufacturesc 9,506 443 451 12,855 of which: iron, steel & manufacturesc 5,068 327 296 7,071 non-ferrous metals & manufacturesc 2,962 27 49 3,753Machinery 14,618 1,213 1,577 22,123Electrical & electronic equipment 27,983 1,813 619 35,841Road vehicles 9,090 373 1,015 11,837Other transport 622 5 2 752Clothing 3,185 2 3 3,541Scientific instruments 3,119 291 242 4,555Total incl others 105,288 5,083 5,032 142,064
a Includes crude fertilisers and manufactures of plastics. b Includes precious metals and jewellery.c Includes scrap.
Source: Global Trade Information Services, World Trade Atlas.

Mexico 57
EIU Country Profile 2001 © The Economist Intelligence Unit Limited 2001
Reference table 23
Balance of payments, national estimates(US$ m)
1995 1996 1997 1998 1999
Merchandise exports foba 79,542 96,000 110,431 117,460 136,391
Merchandise imports foba –72,453 –89,469 –109,808 –125,373 –141,975
Trade balance 7,089 6,531 623 –7,913 –5,584
Exports of non-factor services 9,665 10,779 11,270 11,523 11,692 of which: tourismb 4,688 5,288 5,748 5,633 5,506
Imports of non-factor services 9,001 10,231 11,800 12,428 13,491 of which: insurance & freight 1,975 2,510 3,312 3,699 4,109 tourismc 1,240 1,536 1,821 2,002 1,950
Exports of factor services 3,828 4,154 4,560 5,047 4,930 of which: interest 3,018 3,307 3,750 4,034 4,149
Imports of factor services 17,117 18,094 17,350 18,331 17,948 of which: interest 13,575 13,361 12,436 12,500 13,014
Services balance –12,625 –13,392 –13,319 –14,189 –14,817
Transfers (net) 3,960 4,531 5,247 6,012 6,313
Current-account balance –1,577 –2,330 –7,448 –16,090 –14,087
Direct investment 9,526 9,185 12,830 11,602 11,869
Portfolio investment –13,340 3,708 3,800 –666 3,769
Other capital 19,220 –8,824 –867 6,716 19
Capital-account balance 15,406 4,069 15,763 17,652 15,657
Net errors & omissions –4,238 35 2,197 576 –979
Change in reservesc 9,593 1,768 10,494 2,137 594
a Includes maquiladoras. b Excludes one-day visitors. c Includes value adjustments and purchases ofgold and silver.
Source: Instituto Nacional de Estadística, Geografía e Informática.
Reference table 24
Balance of payments, IMF estimates(US$ m)
1994 1995 1996 1997 1998 1999
Goods: exports fob 60,882 79,542 96,000 110,431 117,459 136,392
Goods: imports fob –79,346 –72,453 –89,469 –109,808 –125,374 –141,973
Trade balance –18,464 7,089 6,531 623 –7,915 –5,581
Services: credit 10,321 9,780 10,899 11,400 12,065 11,733
Services: debit –13,043 –9,715 –10,816 –12,616 –13,067 –14,295
Services balance –2,722 65 83 –1,216 –1,002 –2,562
Income: credit 3,347 3,713 4,033 4,430 4,911 4,890
Income: debit –15,605 –16,402 –17,505 –16,538 –17,732 –17,227
Income: balance –12,258 –12,689 –13,472 –12,108 –12,821 –12,337
Current transfers: credit 3,822 3,995 4,560 5,272 6,042 6,341
Current transfers: debit –40 –35 –30 –25 –28 –27
Current transfers balance 3,782 3,965 4,530 5,247 6,014 6,314
Current-account balance –29,662 –1,576 –2,328 –7,454 –15,724 –14,166Source: IMF, International Financial Statistics.

58 Mexico
EIU Country Profile 2001 © The Economist Intelligence Unit Limited 2001
Reference table 25
Total foreign investment(US$ bn)
1995 1996 1997 1998 1999
Total –0.2 22.6 17.5 10.9 15.5 Direct investment 9.5 9.2 12.8 11.6 11.9 Portfolio investment –9.7 13.4 5.0 –0.5 3.9 Stockmarket 0.5 2.8 3.2 –0.7 3.8 Government securities –10.2 10.6 1.8 0.2 0.1
Source: Banco de México.
Reference table 26
External debt, World Bank estimates(US$ m unless otherwise indicated; debt stocks as at year-end)
1995 1996 1997 1998 1999
Public medium- & long-terma debt 95,158 94,039 84,373 87,973 87,531
Private medium- & long-terma debt 18,587 20,340 27,375 37,104 50,893
Total medium- & long-terma debt 113,745 114,379 111,748 125,077 138,424 Official creditors 38,995 29,340 22,978 23,055 21,783 Bilateral 20,353 11,607 6,535 5,962 5,093 Multilateral 18,642 17,733 16,443 17,093 16,690 Private creditors 74,750 85,039 88,770 102,022 116,641
Short-term debt 37,300 29,839 27,860 26,321 24,062 of which: interest arrears 0 0 0 0 0
Use of IMF credit 15,828 13,279 9,088 8,380 4,473
Total external debt 166,874 157,496 148,696 159,778 166,960
Principal repayments 15,679 29,071 32,251 16,608 27,508
Interest payments 11,208 11,960 11,162 11,423 12,465 of which: short-term debt 2,611 2,964 2,231 1,774 1,924
Total debt service 26,887 41,031 43,413 28,031 39,973
Ratios (%)Total external debt/GDP 58.3 47.4 37.1 38.0 34.8Debt-service ratio, paidb 27.8 35.6 33.1 20.0 25.2
a Long-term debt is defined as that having an original maturity of more than one year. b Debtservice as a percentage of earnings from exports of goods and services.
Source: World Bank, Global Development Finance.
Reference table 27
Gross external debt, national estimates(US$ bn; debt stocks as at year-end)
1995 1996 1997 1998 1999
Total 169.9 164.3 153.6 161.3 161.1 Public sector 100.9 98.3 88.3 92.3 92.3 Commercial banks 20.9 19.2 17.4 17.0 15.5 Banco de Méxicoa 17.3 13.3 9.1 8.4 6.0 Non-bank private sector 30.7 33.5 38.8 43.7 47.3
a The central bank.
Sources: Banco de México; Secretaría de Hacienda y Crédito Público.
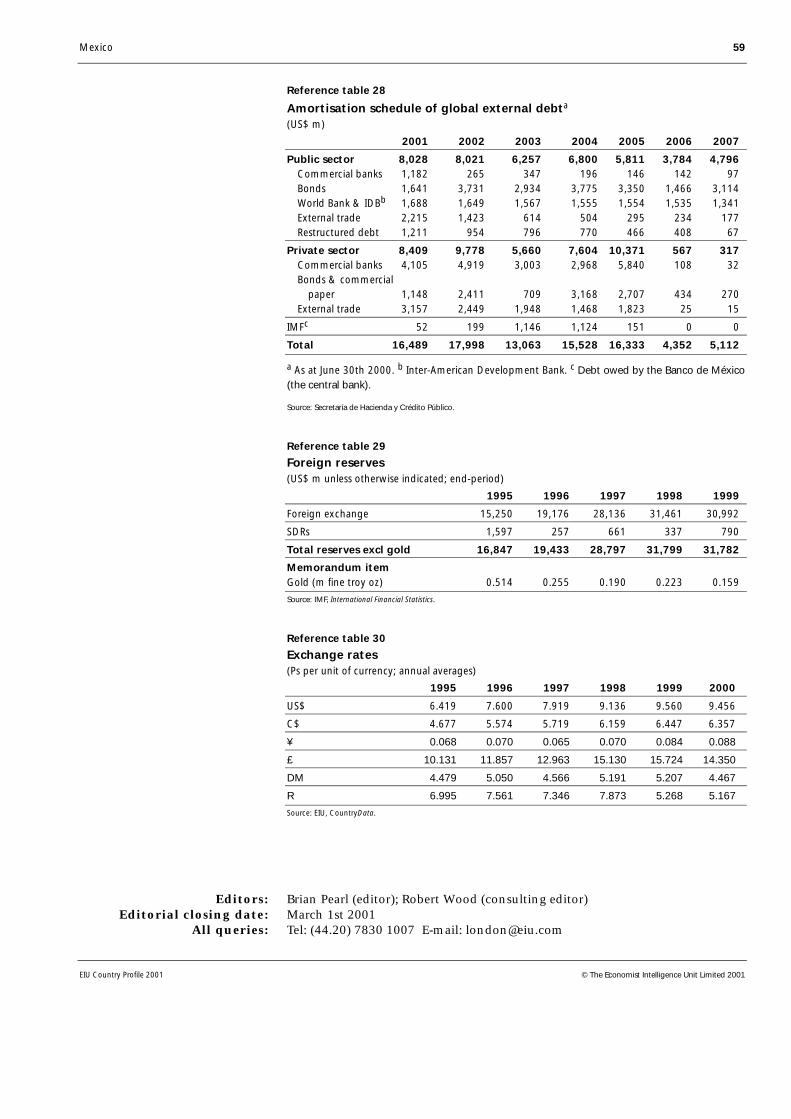
Mexico 59
EIU Country Profile 2001 © The Economist Intelligence Unit Limited 2001
Reference table 28
Amortisation schedule of global external debta
(US$ m)
2001 2002 2003 2004 2005 2006 2007
Public sector 8,028 8,021 6,257 6,800 5,811 3,784 4,796 Commercial banks 1,182 265 347 196 146 142 97 Bonds 1,641 3,731 2,934 3,775 3,350 1,466 3,114 World Bank & IDBb 1,688 1,649 1,567 1,555 1,554 1,535 1,341 External trade 2,215 1,423 614 504 295 234 177 Restructured debt 1,211 954 796 770 466 408 67
Private sector 8,409 9,778 5,660 7,604 10,371 567 317 Commercial banks 4,105 4,919 3,003 2,968 5,840 108 32 Bonds & commercial paper 1,148 2,411 709 3,168 2,707 434 270 External trade 3,157 2,449 1,948 1,468 1,823 25 15
IMFc 52 199 1,146 1,124 151 0 0
Total 16,489 17,998 13,063 15,528 16,333 4,352 5,112
a As at June 30th 2000. b Inter-American Development Bank. c Debt owed by the Banco de México(the central bank).
Source: Secretaría de Hacienda y Crédito Público.
Reference table 29
Foreign reserves(US$ m unless otherwise indicated; end-period)
1995 1996 1997 1998 1999
Foreign exchange 15,250 19,176 28,136 31,461 30,992
SDRs 1,597 257 661 337 790
Total reserves excl gold 16,847 19,433 28,797 31,799 31,782
Memorandum itemGold (m fine troy oz) 0.514 0.255 0.190 0.223 0.159
Source: IMF, International Financial Statistics.
Reference table 30
Exchange rates(Ps per unit of currency; annual averages)
1995 1996 1997 1998 1999 2000
US$ 6.419 7.600 7.919 9.136 9.560 9.456
C$ 4.677 5.574 5.719 6.159 6.447 6.357
¥ 0.068 0.070 0.065 0.070 0.084 0.088
£ 10.131 11.857 12.963 15.130 15.724 14.350
DM 4.479 5.050 4.566 5.191 5.207 4.467
R 6.995 7.561 7.346 7.873 5.268 5.167
Source: EIU, CountryData.
Editors: Brian Pearl (editor); Robert Wood (consulting editor)Editorial closing date: March 1st 2001
All queries: Tel: (44.20) 7830 1007 E-mail: [email protected]