mexico guatemala honduras - jica · map of project area . santo tomas substation : mexico ....
TRANSCRIPT
El Salvador Power Sector Emergency Improvement Project /
Electric Power Sector Project (2) External Evaluator: Kenji Momota (IC Net Ltd.)
Field Survey: January 2006
1. Project Profile and Japan’s ODA Loan
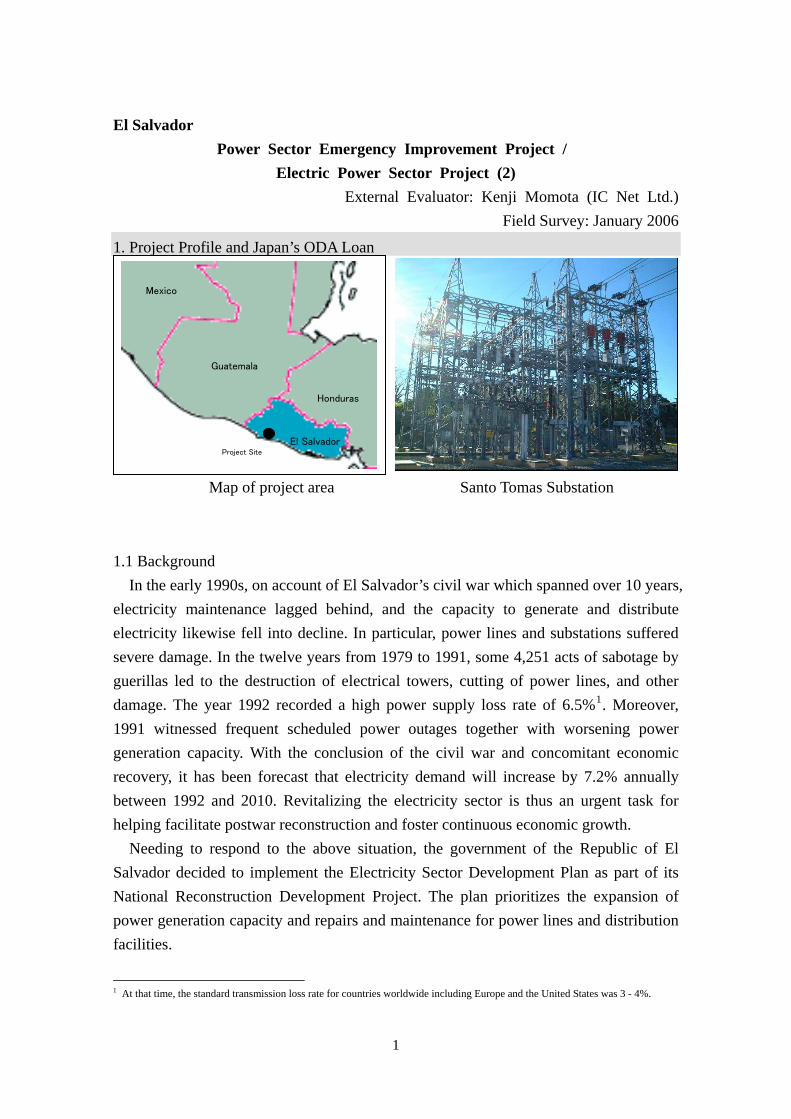
Map of project area Santo Tomas Substation
Mexico
Guatemala
Project Site
Honduras
El Salvador
1.1 Background
In the early 1990s, on account of El Salvador’s civil war which spanned over 10 years, electricity maintenance lagged behind, and the capacity to generate and distribute electricity likewise fell into decline. In particular, power lines and substations suffered severe damage. In the twelve years from 1979 to 1991, some 4,251 acts of sabotage by guerillas led to the destruction of electrical towers, cutting of power lines, and other damage. The year 1992 recorded a high power supply loss rate of 6.5%1. Moreover, 1991 witnessed frequent scheduled power outages together with worsening power generation capacity. With the conclusion of the civil war and concomitant economic recovery, it has been forecast that electricity demand will increase by 7.2% annually between 1992 and 2010. Revitalizing the electricity sector is thus an urgent task for helping facilitate postwar reconstruction and foster continuous economic growth.
Needing to respond to the above situation, the government of the Republic of El Salvador decided to implement the Electricity Sector Development Plan as part of its National Reconstruction Development Project. The plan prioritizes the expansion of power generation capacity and repairs and maintenance for power lines and distribution facilities.
1 At that time, the standard transmission loss rate for countries worldwide including Europe and the United States was 3 - 4%.
1
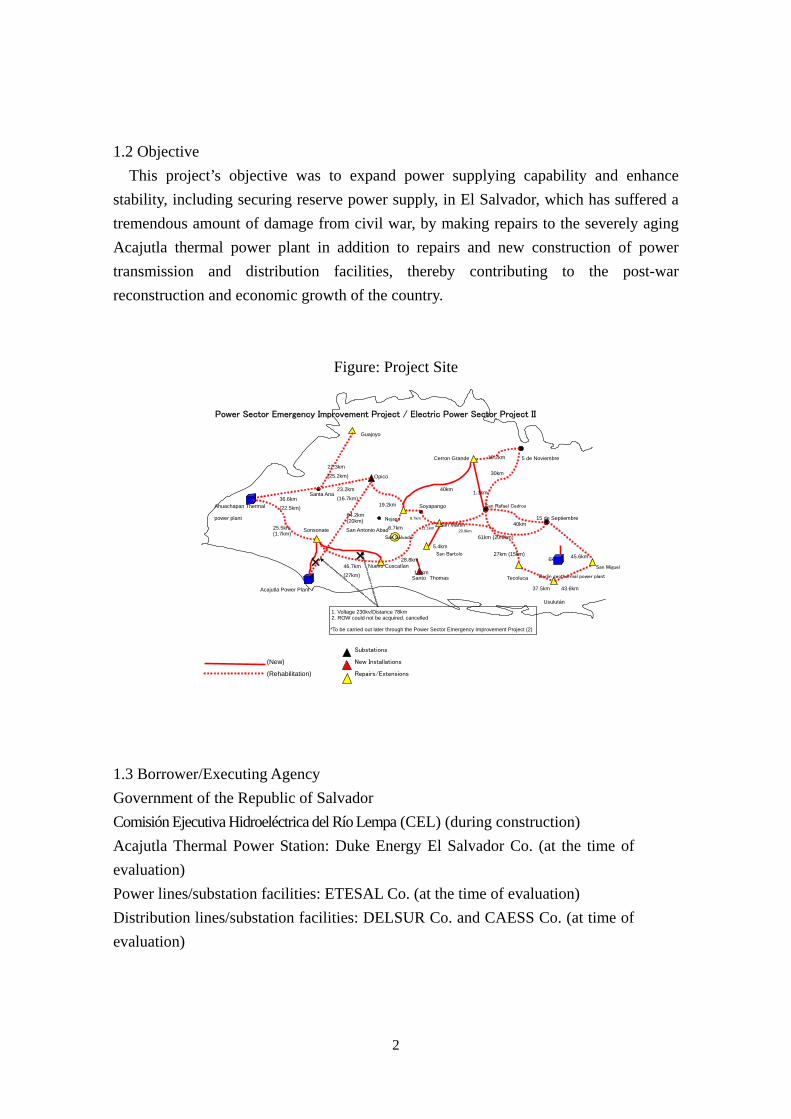
1.2 Objective This project’s objective was to expand power supplying capability and enhance stability, including securing reserve power supply, in El Salvador, which has suffered a tremendous amount of damage from civil war, by making repairs to the severely aging Acajutla thermal power plant in addition to repairs and new construction of power transmission and distribution facilities, thereby contributing to the post-war reconstruction and economic growth of the country.
Figure: Project Site
1.3 Borrower/Executing Agency Government of the Republic of Salvador Comisión Ejecutiva Hidroeléctrica del Río Lempa (CEL) (during construction) Acajutla Thermal Power Station: Duke Energy El Salvador Co. (at the time of evaluation) Power lines/substation facilities: ETESAL Co. (at the time of evaluation) Distribution lines/substation facilities: DELSUR Co. and CAESS Co. (at time of evaluation)
6km
Soyapango
6.7km
61km (20.6km)
37.5kmAcajutla Power Plant
25.5km(1.7km)
Sonsonate
Power Sector Emergency Improvement Project / Electric Power Sector Project II
Guajoyo
San Salvador
Nuevo Cuscatlan
(Rehabilitation) (New)
Nejapa
Cerron Grande
40km
5 de Noviembre
Tecoluca
15 de Septiembre
Substations
San Rafael Cedros
Santo Thomas 1.6km
30km
40km
27km (15km)×
New Installations Repairs/Extensions
×San Bartolo
San Martin
5.4km
1.3km
Berlin geothermal ower plantp
20.9km
18.2km
Opico
19.2km
28.8km
11.1km
9.7km
San Antonio Abad
64.2km(20km)
46.7km
(27km)
Ahuachapan Thermal
Santa Ana36.6km (22.5km)
23.2km
(16.7km)
27.3km
(25.2km)
power plant
45.6km
San Miguel
43.6km Usulután
1. Voltage 230kv/Distance 78km 2. ROW could not be acquired, cancelled
*To be carried out later through the Power Sector Emergency Improvement Project (2)
2
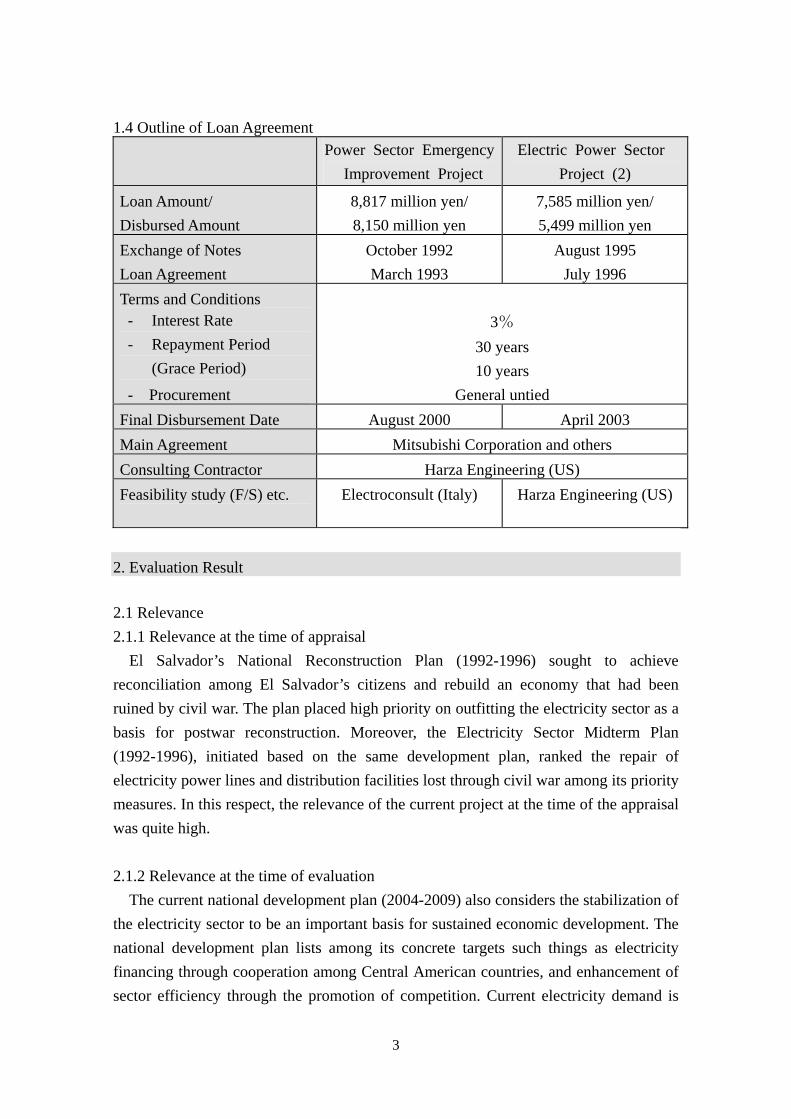
1.4 Outline of Loan Agreement Power Sector Emergency
Improvement Project Electric Power Sector
Project (2)
Loan Amount/ Disbursed Amount
8,817 million yen/ 8,150 million yen
7,585 million yen/ 5,499 million yen
Exchange of Notes Loan Agreement
October 1992 March 1993
August 1995 July 1996
Terms and Conditions - Interest Rate - Repayment Period
(Grace Period)
- Procurement
3%
30 years 10 years
General untied Final Disbursement Date August 2000 April 2003 Main Agreement Mitsubishi Corporation and others Consulting Contractor Harza Engineering (US) Feasibility study (F/S) etc.
Electroconsult (Italy) Harza Engineering (US)
2. Evaluation Result 2.1 Relevance 2.1.1 Relevance at the time of appraisal
El Salvador’s National Reconstruction Plan (1992-1996) sought to achieve reconciliation among El Salvador’s citizens and rebuild an economy that had been ruined by civil war. The plan placed high priority on outfitting the electricity sector as a basis for postwar reconstruction. Moreover, the Electricity Sector Midterm Plan (1992-1996), initiated based on the same development plan, ranked the repair of electricity power lines and distribution facilities lost through civil war among its priority measures. In this respect, the relevance of the current project at the time of the appraisal was quite high. 2.1.2 Relevance at the time of evaluation
The current national development plan (2004-2009) also considers the stabilization of the electricity sector to be an important basis for sustained economic development. The national development plan lists among its concrete targets such things as electricity financing through cooperation among Central American countries, and enhancement of sector efficiency through the promotion of competition. Current electricity demand is
3
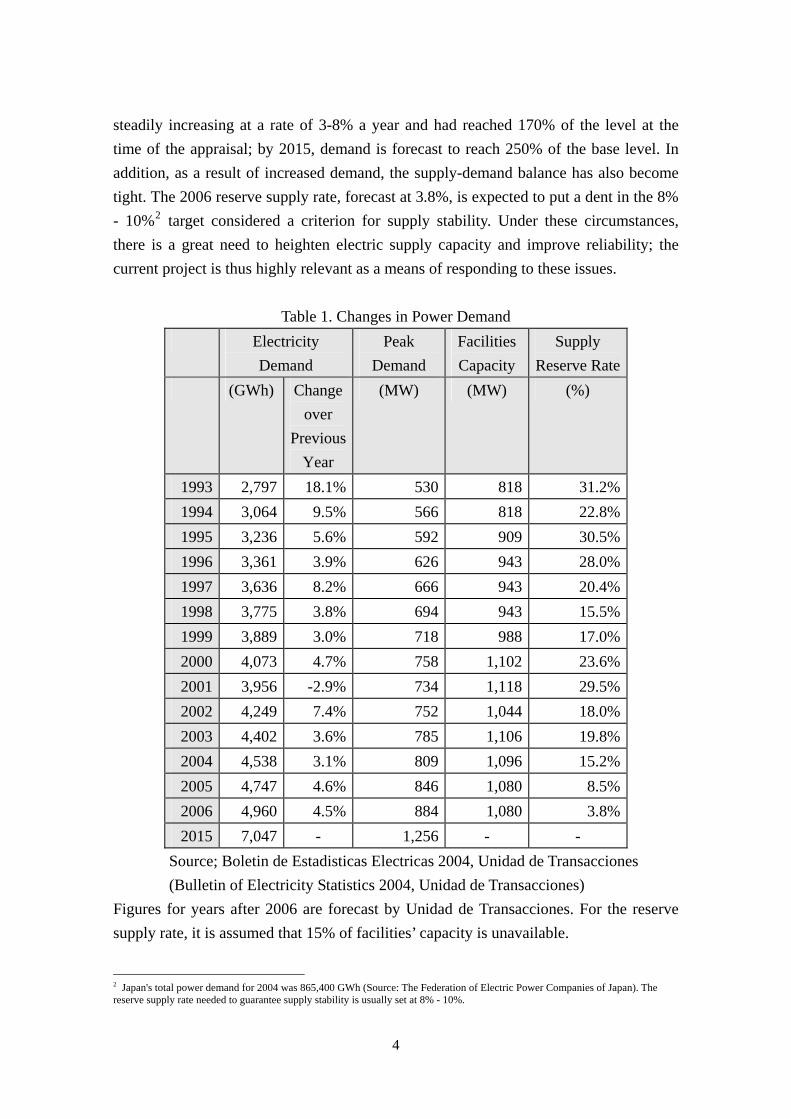
steadily increasing at a rate of 3-8% a year and had reached 170% of the level at the time of the appraisal; by 2015, demand is forecast to reach 250% of the base level. In addition, as a result of increased demand, the supply-demand balance has also become tight. The 2006 reserve supply rate, forecast at 3.8%, is expected to put a dent in the 8% - 10%2 target considered a criterion for supply stability. Under these circumstances, there is a great need to heighten electric supply capacity and improve reliability; the current project is thus highly relevant as a means of responding to these issues.
Table 1. Changes in Power Demand
Electricity Demand
Peak Demand
Facilities Capacity
Supply Reserve Rate
(GWh) Change over
Previous Year
(MW) (MW) (%)
1993 2,797 18.1% 530 818 31.2% 1994 3,064 9.5% 566 818 22.8% 1995 3,236 5.6% 592 909 30.5% 1996 3,361 3.9% 626 943 28.0% 1997 3,636 8.2% 666 943 20.4% 1998 3,775 3.8% 694 943 15.5% 1999 3,889 3.0% 718 988 17.0% 2000 4,073 4.7% 758 1,102 23.6% 2001 3,956 -2.9% 734 1,118 29.5% 2002 4,249 7.4% 752 1,044 18.0% 2003 4,402 3.6% 785 1,106 19.8% 2004 4,538 3.1% 809 1,096 15.2% 2005 4,747 4.6% 846 1,080 8.5% 2006 4,960 4.5% 884 1,080 3.8% 2015 7,047 - 1,256 - -
Source; Boletin de Estadisticas Electricas 2004, Unidad de Transacciones (Bulletin of Electricity Statistics 2004, Unidad de Transacciones)
Figures for years after 2006 are forecast by Unidad de Transacciones. For the reserve supply rate, it is assumed that 15% of facilities’ capacity is unavailable.
2 Japan's total power demand for 2004 was 865,400 GWh (Source: The Federation of Electric Power Companies of Japan). The reserve supply rate needed to guarantee supply stability is usually set at 8% - 10%.
4
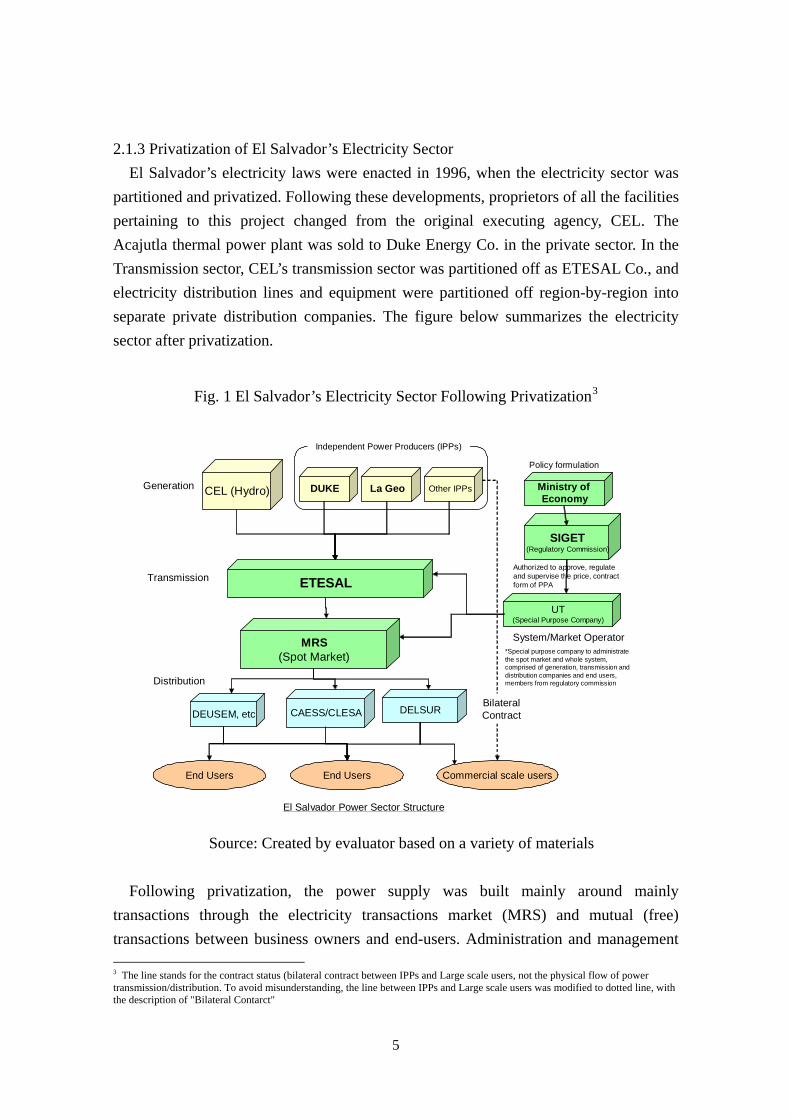
2.1.3 Privatization of El Salvador’s Electricity Sector
El Salvador’s electricity laws were enacted in 1996, when the electricity sector was partitioned and privatized. Following these developments, proprietors of all the facilities pertaining to this project changed from the original executing agency, CEL. The Acajutla thermal power plant was sold to Duke Energy Co. in the private sector. In the Transmission sector, CEL’s transmission sector was partitioned off as ETESAL Co., and electricity distribution lines and equipment were partitioned off region-by-region into separate private distribution companies. The figure below summarizes the electricity sector after privatization.
Fig. 1 El Salvador’s Electricity Sector Following Privatization3
CEL (Hydro)
ETESAL
DEUSEM, etc DELSURCAESS/CLESA
End Users End Users Commercial scale users
Generation
Transmission
Distribution
UT(Special Purpose Company)
System/Market Operator*Special purpose company to administrate the spot market and whole system, comprised of generation, transmission and distribution companies and end users, members from regulatory commission
Independent Power Producers (IPPs)
Other IPPsDUKE
SIGET(Regulatory Commission)
Authorized to approve, regulate and supervise the price, contract form of PPA
El Salvador Power Sector Structure
Ministry of Economy
Policy formulation
La Geo
MRS(Spot Market)
Bilateral Contract
Source: Created by evaluator based on a variety of materials
Following privatization, the power supply was built mainly around mainly
transactions through the electricity transactions market (MRS) and mutual (free) transactions between business owners and end-users. Administration and management 3 The line stands for the contract status (bilateral contract between IPPs and Large scale users, not the physical flow of power transmission/distribution. To avoid misunderstanding, the line between IPPs and Large scale users was modified to dotted line, with the description of "Bilateral Contarct"
5
of the overall system was placed in the hands of Unidad de Transacciones (hereinafter, UT), a special-purpose company built by individual business owners and major users. Superintendencia General de Electricidad y Telecomunicaciones (SIGET), an electricity regulations committee under the jurisdiction of the Ministry of Economics, played the role of a supervising body by keeping tabs on electricity prices and the like.
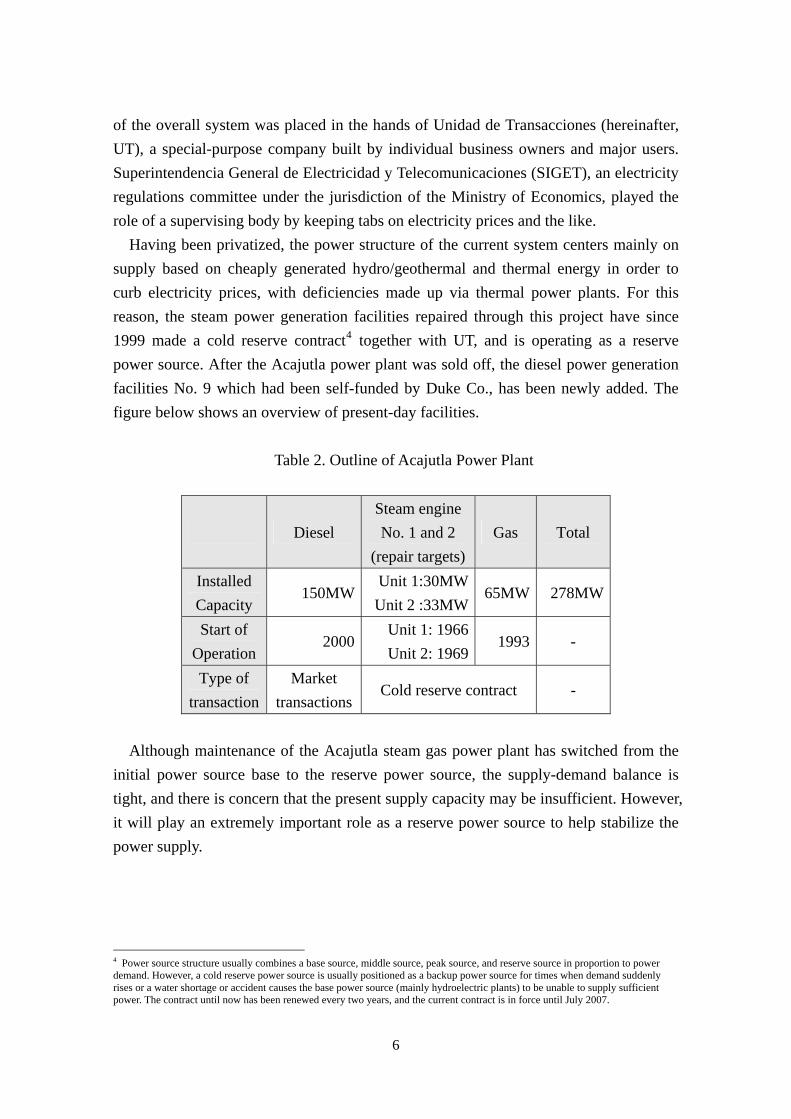
Having been privatized, the power structure of the current system centers mainly on supply based on cheaply generated hydro/geothermal and thermal energy in order to curb electricity prices, with deficiencies made up via thermal power plants. For this reason, the steam power generation facilities repaired through this project have since 1999 made a cold reserve contract4 together with UT, and is operating as a reserve power source. After the Acajutla power plant was sold off, the diesel power generation facilities No. 9 which had been self-funded by Duke Co., has been newly added. The figure below shows an overview of present-day facilities.
Table 2. Outline of Acajutla Power Plant
Diesel Steam engine No. 1 and 2
(repair targets)Gas Total
Installed Capacity
150MWUnit 1:30MWUnit 2 :33MW
65MW 278MW
Start of Operation
2000Unit 1: 1966Unit 2: 1969
1993 -
Type of transaction
Market transactions
Cold reserve contract -
Although maintenance of the Acajutla steam gas power plant has switched from the
initial power source base to the reserve power source, the supply-demand balance is tight, and there is concern that the present supply capacity may be insufficient. However, it will play an extremely important role as a reserve power source to help stabilize the power supply.
4 Power source structure usually combines a base source, middle source, peak source, and reserve source in proportion to power demand. However, a cold reserve power source is usually positioned as a backup power source for times when demand suddenly rises or a water shortage or accident causes the base power source (mainly hydroelectric plants) to be unable to supply sufficient power. The contract until now has been renewed every two years, and the current contract is in force until July 2007.
6
Particulars on Contract Consummation for Cold Reserves
After purchasing the Acajutla power plant, the Duke Co. installed a new engine
(bunker). In the liberalized electricity transactions market, purchase from low-cost hydroelectric and geothermal facilities is price-competitive compared to thermal power plants (especially those with outmoded power generation facilities) for which electricity prices are high. In the current market, sales of electricity from thermal power plant are likely to decrease. Thermal power generation facilities have fixed administration and maintenance costs regardless of the rate of operation. For that reason, in order to avoid the cost burden that results from lowering the rate of operation, the facilities entered a reserve contract wherein earnings for steam power generation facilities and other antiquated thermal power facilities is fixed regardless of the rate of operation. In a cold reserve contract, in addition to a fixed payment per unit of facilities capacity (capacity payment, expressed in MW), variable costs are paid as a function of actual power output.
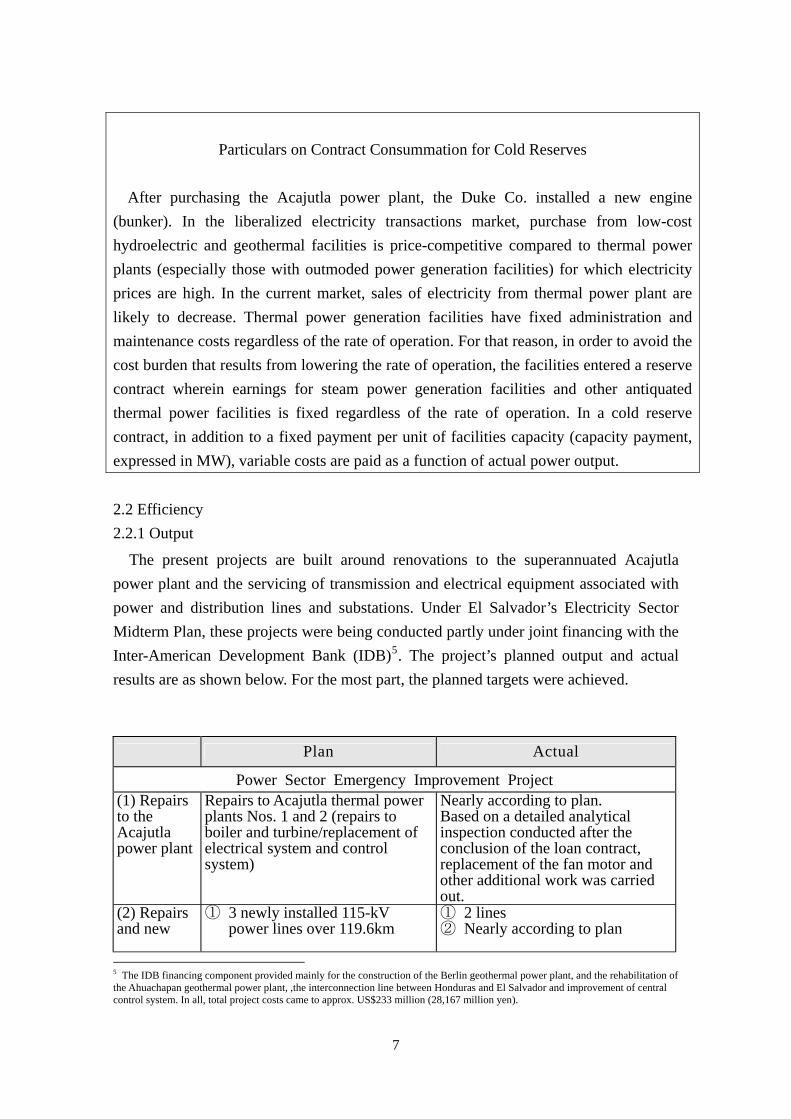
2.2 Efficiency 2.2.1 Output
The present projects are built around renovations to the superannuated Acajutla power plant and the servicing of transmission and electrical equipment associated with power and distribution lines and substations. Under El Salvador’s Electricity Sector Midterm Plan, these projects were being conducted partly under joint financing with the Inter-American Development Bank (IDB)5. The project’s planned output and actual results are as shown below. For the most part, the planned targets were achieved.
Plan Actual
Power Sector Emergency Improvement Project (1) Repairs to the Acajutla power plant
Repairs to Acajutla thermal power plants Nos. 1 and 2 (repairs to boiler and turbine/replacement of electrical system and control system)
Nearly according to plan. Based on a detailed analytical inspection conducted after the conclusion of the loan contract, replacement of the fan motor and other additional work was carried out.
(2) Repairs and new
① 3 newly installed 115-kV power lines over 119.6km
① 2 lines ② Nearly according to plan
5 The IDB financing component provided mainly for the construction of the Berlin geothermal power plant, and the rehabilitation of the Ahuachapan geothermal power plant, ,the interconnection line between Honduras and El Salvador and improvement of central control system. In all, total project costs came to approx. US$233 million (28,167 million yen).
7
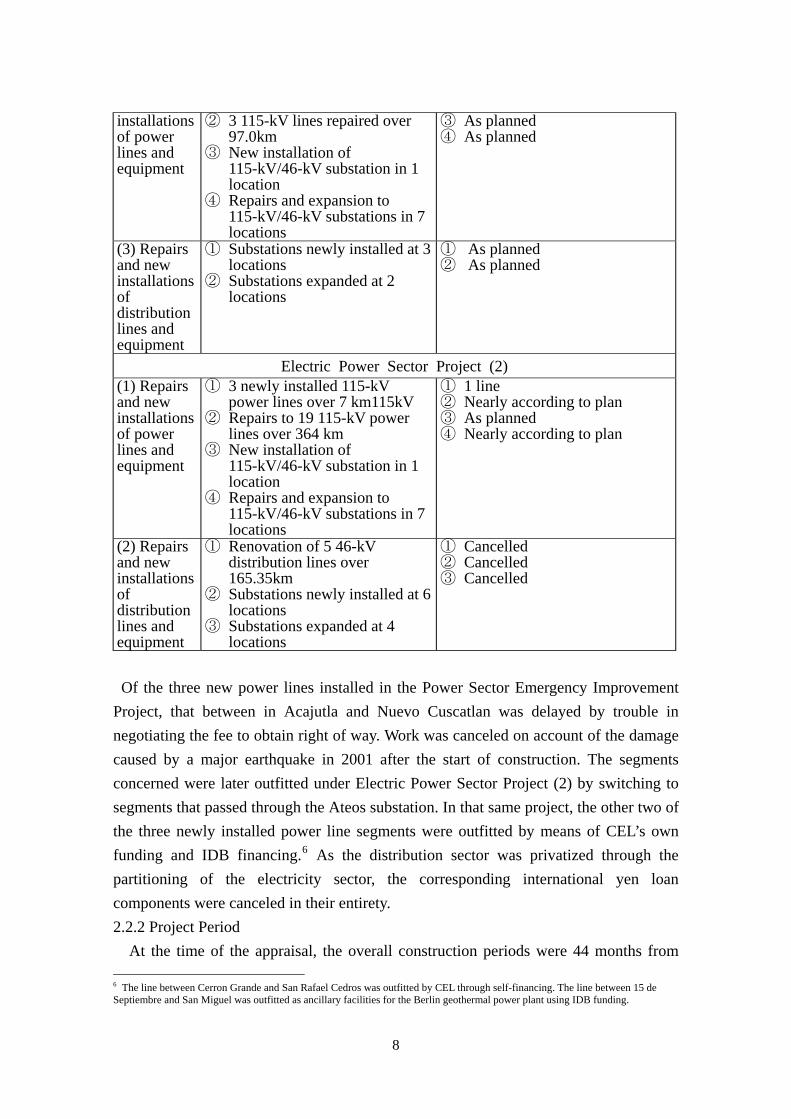
installations of power lines and equipment
② 3 115-kV lines repaired over 97.0km
③ New installation of 115-kV/46-kV substation in 1 location
④ Repairs and expansion to 115-kV/46-kV substations in 7 locations
③ As planned ④ As planned
(3) Repairs and new installations of distribution lines and equipment
① Substations newly installed at 3 locations
② Substations expanded at 2 locations
① As planned ② As planned
Electric Power Sector Project (2) (1) Repairs and new installations of power lines and equipment
① 3 newly installed 115-kV power lines over 7 km115kV
② Repairs to 19 115-kV power lines over 364 km
③ New installation of 115-kV/46-kV substation in 1 location
④ Repairs and expansion to 115-kV/46-kV substations in 7 locations
① 1 line ② Nearly according to plan ③ As planned ④ Nearly according to plan
(2) Repairs and new installations of distribution lines and equipment
① Renovation of 5 46-kV distribution lines over 165.35km
② Substations newly installed at 6 locations
③ Substations expanded at 4 locations
① Cancelled ② Cancelled ③ Cancelled
Of the three new power lines installed in the Power Sector Emergency Improvement Project, that between in Acajutla and Nuevo Cuscatlan was delayed by trouble in negotiating the fee to obtain right of way. Work was canceled on account of the damage caused by a major earthquake in 2001 after the start of construction. The segments concerned were later outfitted under Electric Power Sector Project (2) by switching to segments that passed through the Ateos substation. In that same project, the other two of the three newly installed power line segments were outfitted by means of CEL’s own funding and IDB financing.6 As the distribution sector was privatized through the partitioning of the electricity sector, the corresponding international yen loan components were canceled in their entirety. 2.2.2 Project Period
At the time of the appraisal, the overall construction periods were 44 months from 6 The line between Cerron Grande and San Rafael Cedros was outfitted by CEL through self-financing. The line between 15 de Septiembre and San Miguel was outfitted as ancillary facilities for the Berlin geothermal power plant using IDB funding.
8
March 1993 to October 1996 for the Power Sector Emergency Improvement Project, and 42 months from July 1996 to December 1999 for the Electric Power Sector Project (2). The total for the two projects was 81 months. The actual construction periods were, respectively, 90 months from March 1993 to August 2000, and 82 months from July 1996 to April 2003. Both projects, in effect, were 122 months in duration (151% of their planned durations). The main reasons for the delays were (1) an extension to the work period for construction work added to the Acajutla power generation plant repairs; (2) difficulties in negotiating for right of way to lay out power lines; and (3) interruption of part of the construction work due to a major earthquake in 2001.
2.2.3 Project Cost
At the time of the appraisal, out of the total project costs of 21 billion, 689 million yen, 75% or 16 billion 402 million yen was to be paid via yen loans, and the remaining 25% was to come from the Salvadorean government’s self-financing. The latest figures for capital outlay come to 17 billion 806 million yen, with 77% or 13 billion 649 million yen coming from yen loans. The fact that the yen loan project costs have shrunk to 83% of project estimations is mainly because some project work has been canceled due to privatization of the electrical distribution sector, and because competitive tendering made work orders more efficient, thereby suppressing project costs. All in all, while the work delays in the Electric Power Sector Project (2) stand out, the reason for those is such things as earthquake damage—that is, outside forces that could not have been measured at the time of the appraisal. Output changed appropriately in accordance with needs, and because capital outlay was brought down to 82% of projected costs, there are no major problems with efficiency. 2.3 Effectiveness 2.3.1 Acajutla power plant renovation
The status of operation of the steam generated power plant equipment at the Acajutla power plant before the current project was conducted and following renovations is shown below. Although thermal efficiency improved, power output and equipment usage rates were actually lower than before the project began. As explained under “Relevance,” the main reason was the employment of cold reserve contracts in the three years after 1999. In cold reserve contracts, the operating hours of the power generation equipment changes drastically depending on the supply-demand balance at the time. Thus, these measures cannot be simply compared with the status prior to project implementation.
9
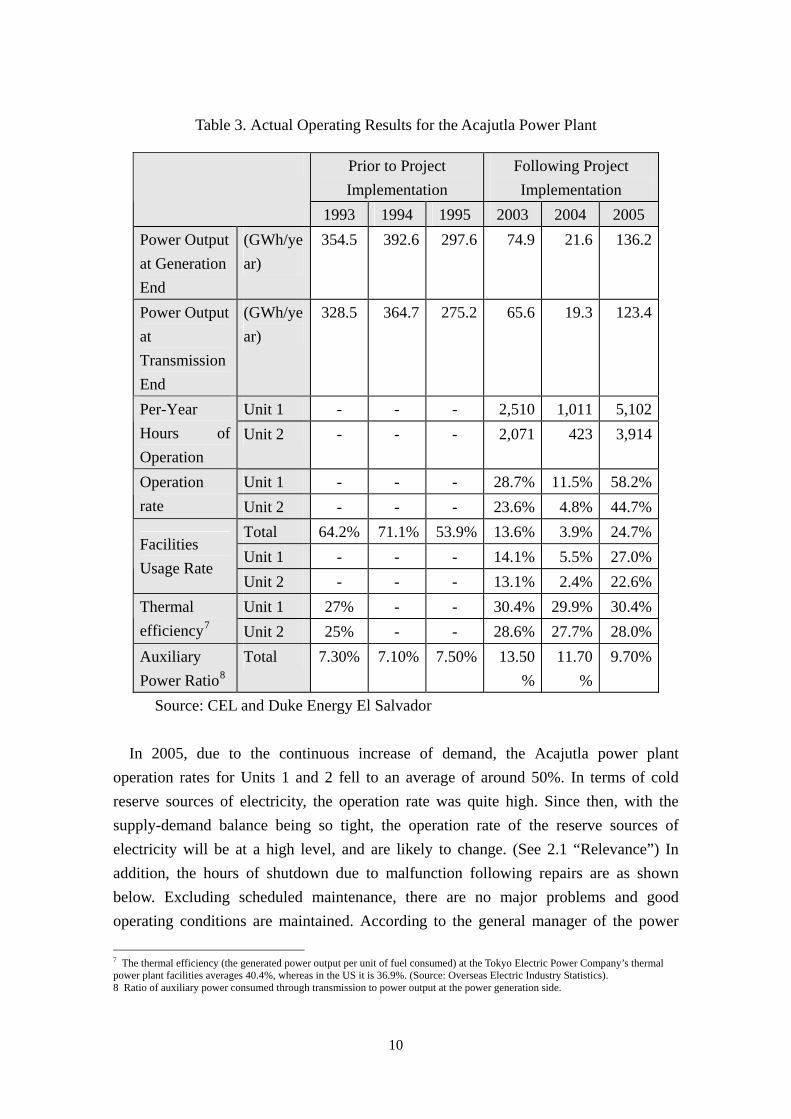
Table 3. Actual Operating Results for the Acajutla Power Plant
Prior to Project Implementation
Following Project Implementation
1993 1994 1995 2003 2004 2005 Power Output at Generation End
(GWh/year)
354.5 392.6 297.6 74.9 21.6 136.2
Power Output at Transmission End
(GWh/year)
328.5 364.7 275.2 65.6 19.3 123.4
Unit 1 - - - 2,510 1,011 5,102 Per-Year Hours of Operation
Unit 2 - - - 2,071 423 3,914
Unit 1 - - - 28.7% 11.5% 58.2% Operation rate Unit 2 - - - 23.6% 4.8% 44.7%
Total 64.2% 71.1% 53.9% 13.6% 3.9% 24.7% Unit 1 - - - 14.1% 5.5% 27.0%
Facilities Usage Rate
Unit 2 - - - 13.1% 2.4% 22.6% Unit 1 27% - - 30.4% 29.9% 30.4% Thermal
efficiency7 Unit 2 25% - - 28.6% 27.7% 28.0%
Auxiliary Power Ratio8
Total 7.30% 7.10% 7.50% 13.50%
11.70%
9.70%
Source: CEL and Duke Energy El Salvador In 2005, due to the continuous increase of demand, the Acajutla power plant
operation rates for Units 1 and 2 fell to an average of around 50%. In terms of cold reserve sources of electricity, the operation rate was quite high. Since then, with the supply-demand balance being so tight, the operation rate of the reserve sources of electricity will be at a high level, and are likely to change. (See 2.1 “Relevance”) In addition, the hours of shutdown due to malfunction following repairs are as shown below. Excluding scheduled maintenance, there are no major problems and good operating conditions are maintained. According to the general manager of the power
7 The thermal efficiency (the generated power output per unit of fuel consumed) at the Tokyo Electric Power Company’s thermal power plant facilities averages 40.4%, whereas in the US it is 36.9%. (Source: Overseas Electric Industry Statistics). 8 Ratio of auxiliary power consumed through transmission to power output at the power generation side.
10
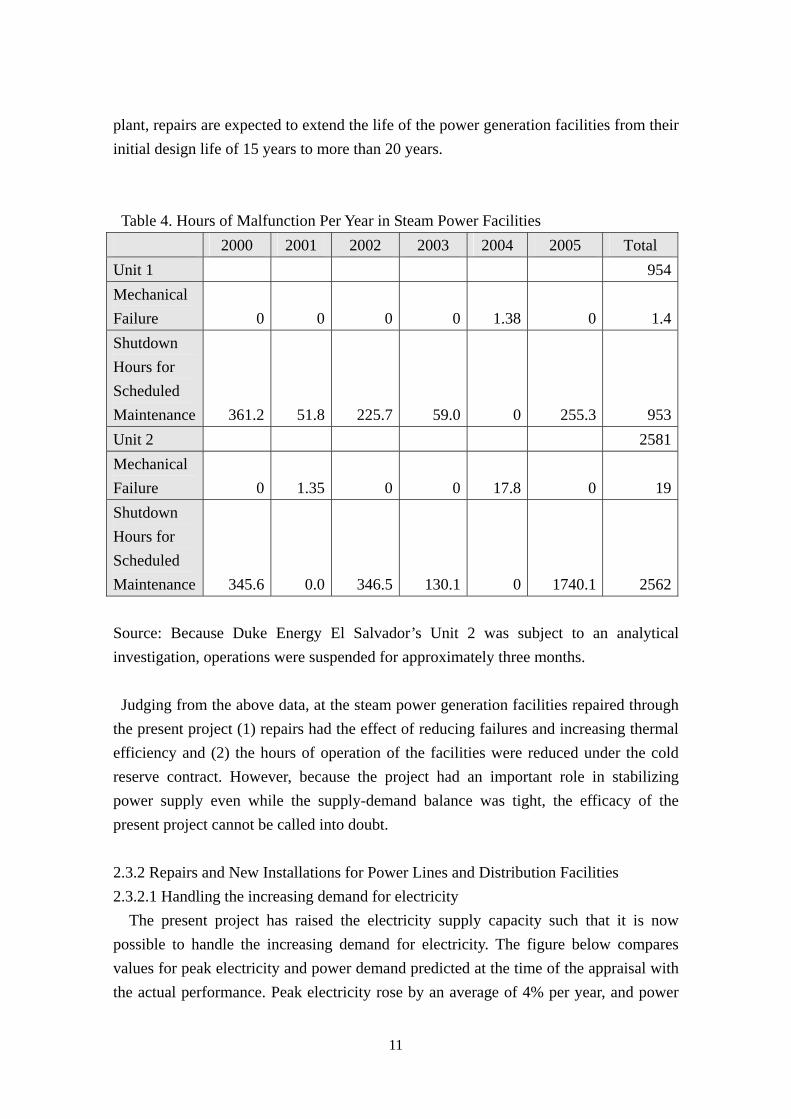
plant, repairs are expected to extend the life of the power generation facilities from their initial design life of 15 years to more than 20 years. Table 4. Hours of Malfunction Per Year in Steam Power Facilities
2000 2001 2002 2003 2004 2005 Total Unit 1 954Mechanical Failure 0 0 0 0 1.38 0 1.4 Shutdown Hours for Scheduled Maintenance 361.2 51.8 225.7 59.0 0 255.3 953 Unit 2 2581Mechanical Failure 0 1.35 0 0 17.8 0 19Shutdown Hours for Scheduled Maintenance 345.6 0.0 346.5 130.1 0 1740.1 2562 Source: Because Duke Energy El Salvador’s Unit 2 was subject to an analytical investigation, operations were suspended for approximately three months. Judging from the above data, at the steam power generation facilities repaired through
the present project (1) repairs had the effect of reducing failures and increasing thermal efficiency and (2) the hours of operation of the facilities were reduced under the cold reserve contract. However, because the project had an important role in stabilizing power supply even while the supply-demand balance was tight, the efficacy of the present project cannot be called into doubt.
2.3.2 Repairs and New Installations for Power Lines and Distribution Facilities 2.3.2.1 Handling the increasing demand for electricity The present project has raised the electricity supply capacity such that it is now possible to handle the increasing demand for electricity. The figure below compares values for peak electricity and power demand predicted at the time of the appraisal with the actual performance. Peak electricity rose by an average of 4% per year, and power
11
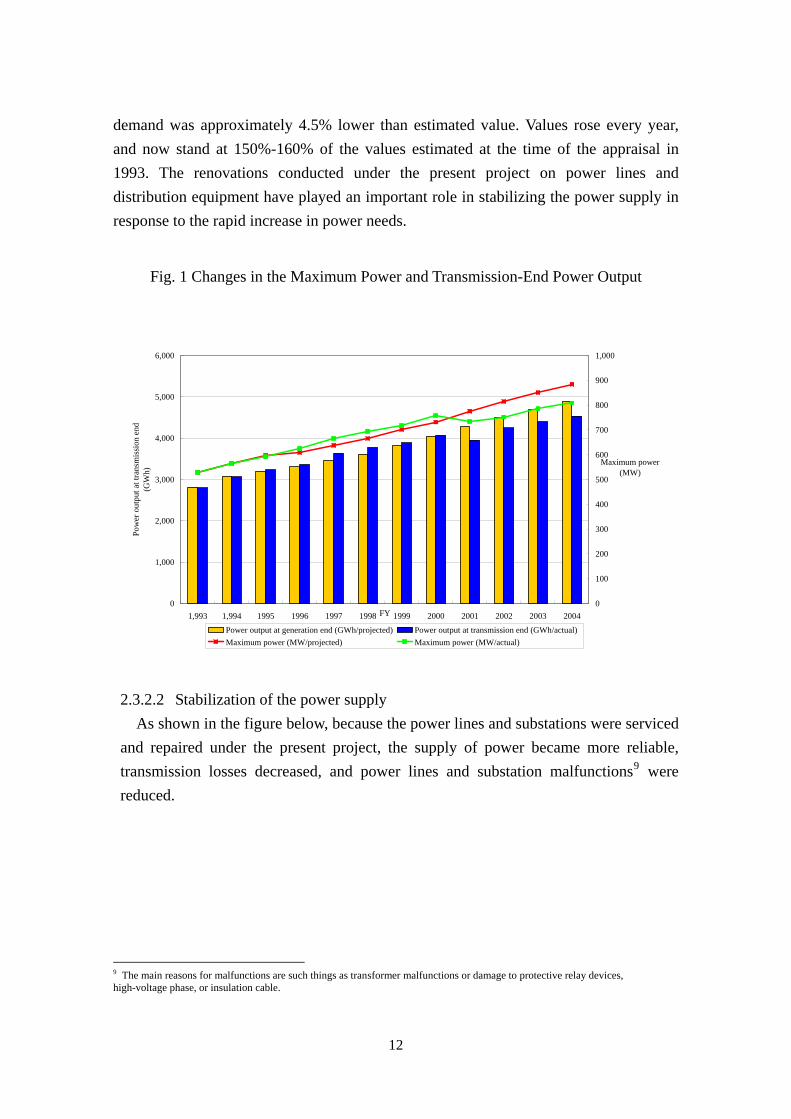
demand was approximately 4.5% lower than estimated value. Values rose every year, and now stand at 150%-160% of the values estimated at the time of the appraisal in 1993. The renovations conducted under the present project on power lines and distribution equipment have played an important role in stabilizing the power supply in response to the rapid increase in power needs.
Fig. 1 Changes in the Maximum Power and Transmission-End Power Output
0
1,000
2,000
3,000
4,000
5,000
6,000
1,993 1,994 1995 1996 1997 1998 1999 2000 2001 2002 2003 2004FY
Pow
er o
utpu
t at t
rans
mis
sion
end
(GW
h)
0
100
200
300
400
500
600
700
800
900
1,000
Maximum power(MW)
Power output at generation end (GWh/projected) Power output at transmission end (GWh/actual)Maximum power (MW/projected) Maximum power (MW/actual)
2.3.2.2 Stabilization of the power supply
As shown in the figure below, because the power lines and substations were serviced and repaired under the present project, the supply of power became more reliable, transmission losses decreased, and power lines and substation malfunctions9 were reduced.
9 The main reasons for malfunctions are such things as transformer malfunctions or damage to protective relay devices, high-voltage phase, or insulation cable.
12
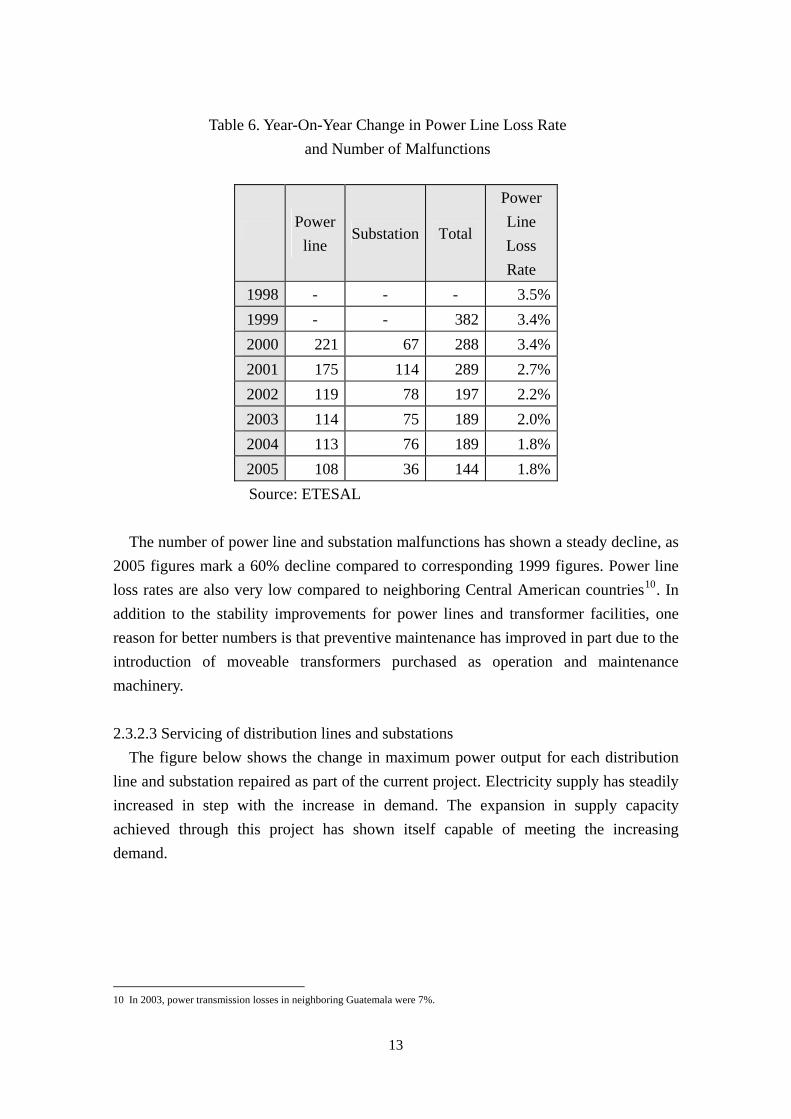
Table 6. Year-On-Year Change in Power Line Loss Rate and Number of Malfunctions
Power
line Substation Total
Power Line Loss Rate
1998 - - - 3.5%1999 - - 382 3.4%2000 221 67 288 3.4%2001 175 114 289 2.7%2002 119 78 197 2.2%2003 114 75 189 2.0%2004 113 76 189 1.8%2005 108 36 144 1.8%Source: ETESAL
The number of power line and substation malfunctions has shown a steady decline, as 2005 figures mark a 60% decline compared to corresponding 1999 figures. Power line loss rates are also very low compared to neighboring Central American countries10. In addition to the stability improvements for power lines and transformer facilities, one reason for better numbers is that preventive maintenance has improved in part due to the introduction of moveable transformers purchased as operation and maintenance machinery. 2.3.2.3 Servicing of distribution lines and substations The figure below shows the change in maximum power output for each distribution
line and substation repaired as part of the current project. Electricity supply has steadily increased in step with the increase in demand. The expansion in supply capacity achieved through this project has shown itself capable of meeting the increasing demand.
10 In 2003, power transmission losses in neighboring Guatemala were 7%.
13
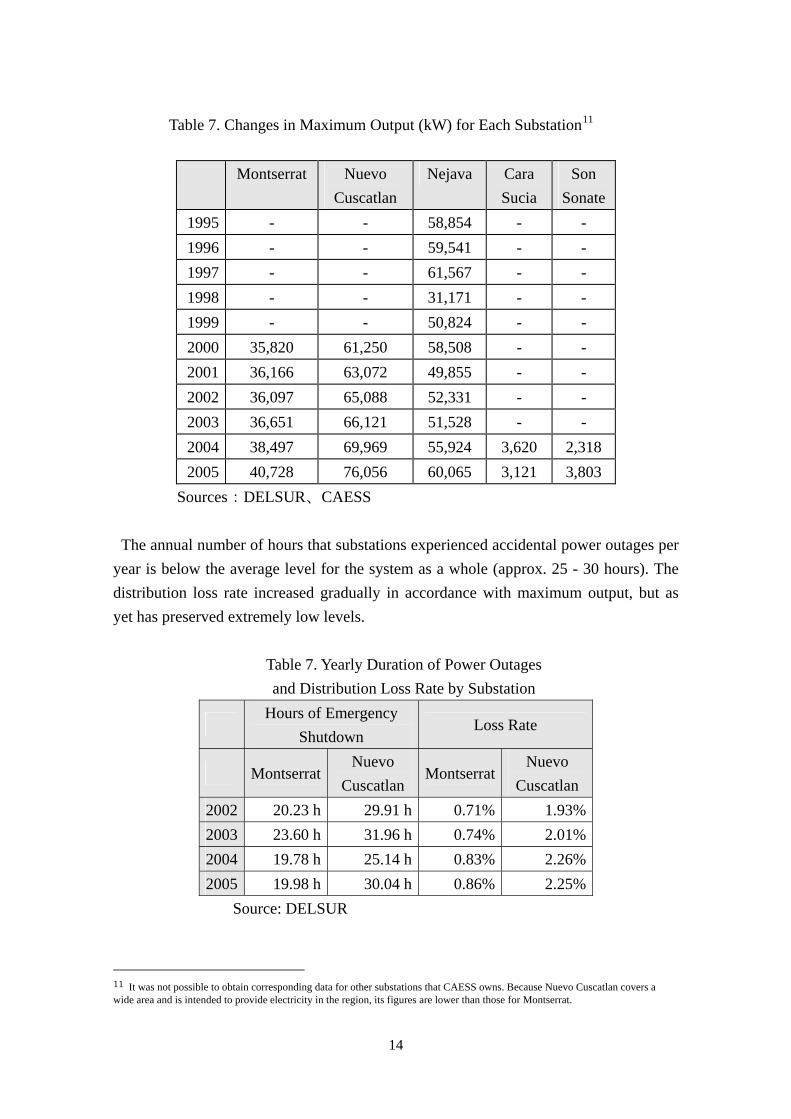
Table 7. Changes in Maximum Output (kW) for Each Substation11
Montserrat Nuevo Cuscatlan
Nejava Cara Sucia
Son Sonate
1995 - - 58,854 - - 1996 - - 59,541 - - 1997 - - 61,567 - - 1998 - - 31,171 - - 1999 - - 50,824 - - 2000 35,820 61,250 58,508 - - 2001 36,166 63,072 49,855 - - 2002 36,097 65,088 52,331 - - 2003 36,651 66,121 51,528 - - 2004 38,497 69,969 55,924 3,620 2,318 2005 40,728 76,056 60,065 3,121 3,803
Sources:DELSUR、CAESS
The annual number of hours that substations experienced accidental power outages per year is below the average level for the system as a whole (approx. 25 - 30 hours). The distribution loss rate increased gradually in accordance with maximum output, but as yet has preserved extremely low levels.
Table 7. Yearly Duration of Power Outages and Distribution Loss Rate by Substation
Hours of Emergency
Shutdown Loss Rate
Montserrat Nuevo
Cuscatlan Montserrat
Nuevo Cuscatlan
2002 20.23 h 29.91 h 0.71% 1.93% 2003 23.60 h 31.96 h 0.74% 2.01% 2004 19.78 h 25.14 h 0.83% 2.26% 2005 19.98 h 30.04 h 0.86% 2.25%
Source: DELSUR
11 It was not possible to obtain corresponding data for other substations that CAESS owns. Because Nuevo Cuscatlan covers a wide area and is intended to provide electricity in the region, its figures are lower than those for Montserrat.
14
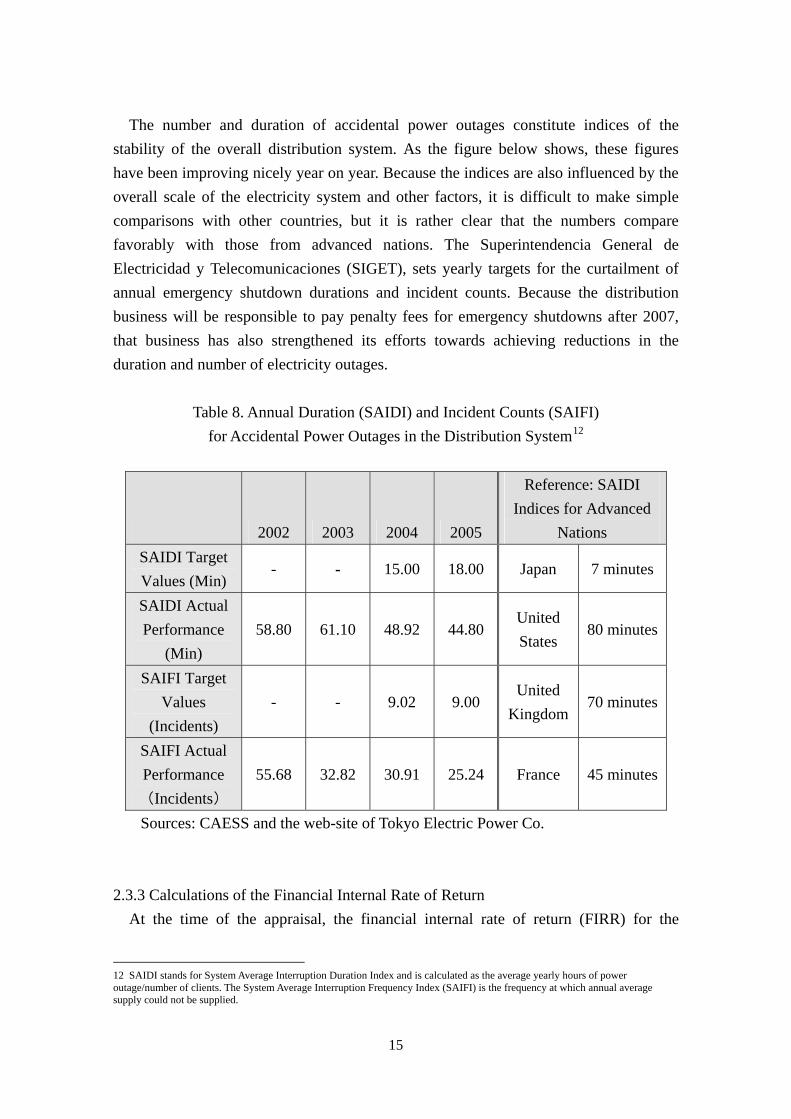
The number and duration of accidental power outages constitute indices of the stability of the overall distribution system. As the figure below shows, these figures have been improving nicely year on year. Because the indices are also influenced by the overall scale of the electricity system and other factors, it is difficult to make simple comparisons with other countries, but it is rather clear that the numbers compare favorably with those from advanced nations. The Superintendencia General de Electricidad y Telecomunicaciones (SIGET), sets yearly targets for the curtailment of annual emergency shutdown durations and incident counts. Because the distribution business will be responsible to pay penalty fees for emergency shutdowns after 2007, that business has also strengthened its efforts towards achieving reductions in the duration and number of electricity outages.
Table 8. Annual Duration (SAIDI) and Incident Counts (SAIFI)
for Accidental Power Outages in the Distribution System12
2002 2003 2004 2005
Reference: SAIDI Indices for Advanced
Nations SAIDI Target Values (Min)
- - 15.00 18.00 Japan 7 minutes
SAIDI Actual Performance
(Min) 58.80 61.10 48.92 44.80
United States
80 minutes
SAIFI Target Values
(Incidents) - - 9.02 9.00
United Kingdom
70 minutes
SAIFI Actual Performance (Incidents)
55.68 32.82 30.91 25.24 France 45 minutes
Sources: CAESS and the web-site of Tokyo Electric Power Co. 2.3.3 Calculations of the Financial Internal Rate of Return
At the time of the appraisal, the financial internal rate of return (FIRR) for the
12 SAIDI stands for System Average Interruption Duration Index and is calculated as the average yearly hours of power outage/number of clients. The System Average Interruption Frequency Index (SAIFI) is the frequency at which annual average supply could not be supplied.
15
Acajutla power plant renovation project was calculated at 19.5%13 with profits counted as deriving from electricity sales and costs including project expenses, operation and maintenance costs, and fuel costs. In the present evaluation, by contrast, profits were seen as including revenue from cold reserve contracts14 for the Acajutla power plant’s steam generation facilities, and costs were recalculated as including project costs, operation and maintenance fees, and fuel costs, the resulting figure coming to 9.72%. The main reason for the lowering of the FIRR has been a reduction in revenue from power output reductions and well as increased costs stemming from a steep rise in fuel costs and an increase in project costs. 2.4 Impact 2.4.1 Economic growth due to postwar reconstruction
Looking at the change in GDP growth rate from the first half of the 1990s (prior to project initiation) and the first half of the 2000s (following project completion), the GDP growth rate fell from 7.4% to 2.0%. The main reason for this is a slowdown in growth due to lowered international competitiveness in major industries like textiles. However, the overall trend following the 1990s has been for continuous economic growth, as the sum total of GDP is now 1.5 times its level at the time of the appraisal. In line with that increase, the amount of power consumption has increased substantially. Because the figures for GDP and the like involve a number of factors, it is not possible to express precisely the direct impact of this project. However, because securing a stable power supply through renovations of the electricity infrastructure are considered indispensable elements forming a basis for economic development and investment expansion, it can be said that to a certain extent this project has provided an underlying basis for continued economic growth.
13 At the time of the appraisal, the calculated value was initially 23.6%. However, because operation and maintenance costs had not been tallied, the current estimation is recalculated at 19.5%. 14 In a cold reserve contract, in addition to the capacity payment (fixed fee per MW capacity of the facilities), variable costs corresponding to actual generated output are also paid. As details on the variable costs were not disclosed, the electricity fees (average market price) for each year was applied.
16
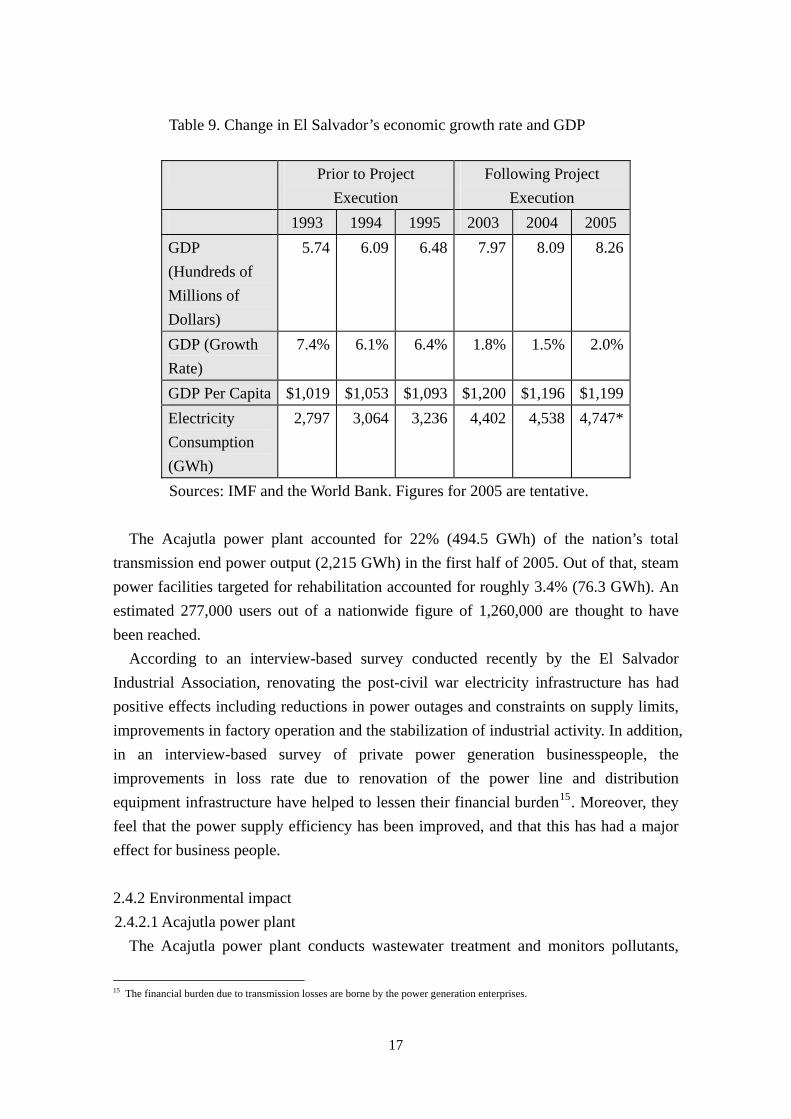
Table 9. Change in El Salvador’s economic growth rate and GDP
Prior to Project Execution
Following Project Execution
1993 1994 1995 2003 2004 2005 GDP (Hundreds of Millions of Dollars)
5.74 6.09 6.48 7.97 8.09 8.26
GDP (Growth Rate)
7.4% 6.1% 6.4% 1.8% 1.5% 2.0%
GDP Per Capita $1,019 $1,053 $1,093 $1,200 $1,196 $1,199 Electricity Consumption (GWh)
2,797 3,064 3,236 4,402 4,538 4,747*
Sources: IMF and the World Bank. Figures for 2005 are tentative.
The Acajutla power plant accounted for 22% (494.5 GWh) of the nation’s total transmission end power output (2,215 GWh) in the first half of 2005. Out of that, steam power facilities targeted for rehabilitation accounted for roughly 3.4% (76.3 GWh). An estimated 277,000 users out of a nationwide figure of 1,260,000 are thought to have been reached.
According to an interview-based survey conducted recently by the El Salvador Industrial Association, renovating the post-civil war electricity infrastructure has had positive effects including reductions in power outages and constraints on supply limits, improvements in factory operation and the stabilization of industrial activity. In addition, in an interview-based survey of private power generation businesspeople, the improvements in loss rate due to renovation of the power line and distribution equipment infrastructure have helped to lessen their financial burden15. Moreover, they feel that the power supply efficiency has been improved, and that this has had a major effect for business people. 2.4.2 Environmental impact 2.4.2.1 Acajutla power plant
The Acajutla power plant conducts wastewater treatment and monitors pollutants,
15 The financial burden due to transmission losses are borne by the power generation enterprises.
17
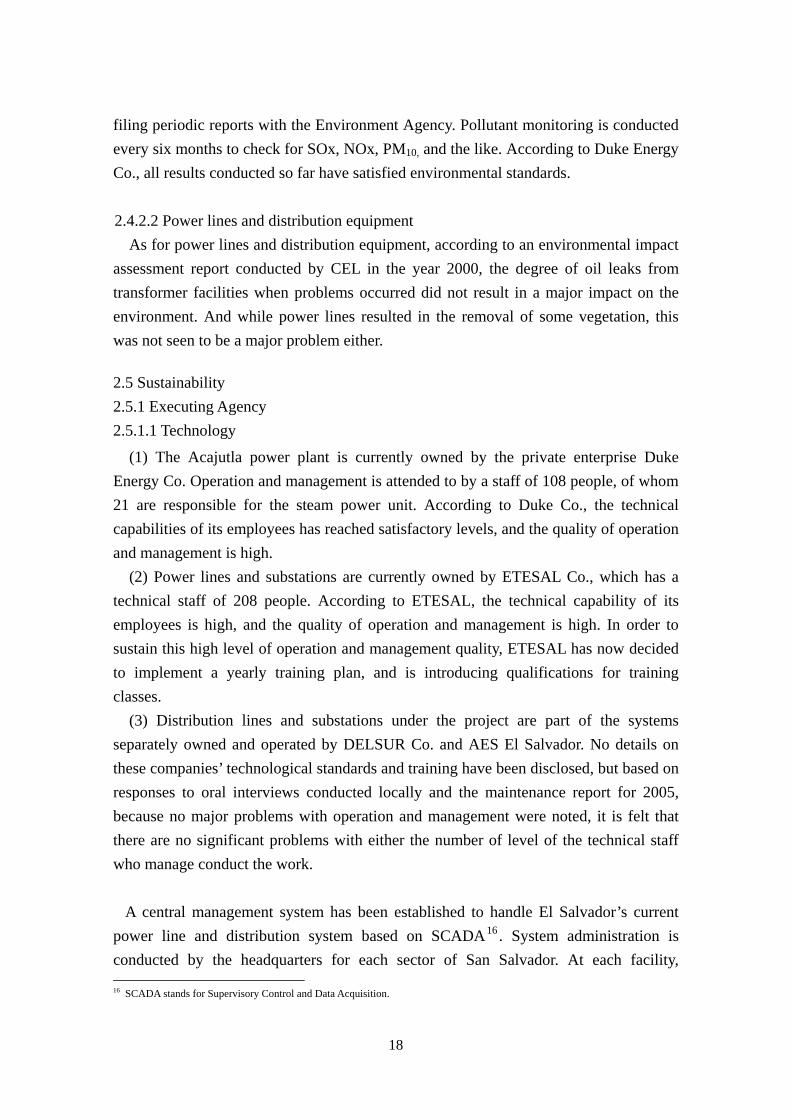
filing periodic reports with the Environment Agency. Pollutant monitoring is conducted every six months to check for SOx, NOx, PM10, and the like. According to Duke Energy Co., all results conducted so far have satisfied environmental standards.
2.4.2.2 Power lines and distribution equipment
As for power lines and distribution equipment, according to an environmental impact assessment report conducted by CEL in the year 2000, the degree of oil leaks from transformer facilities when problems occurred did not result in a major impact on the environment. And while power lines resulted in the removal of some vegetation, this was not seen to be a major problem either. 2.5 Sustainability 2.5.1 Executing Agency 2.5.1.1 Technology
(1) The Acajutla power plant is currently owned by the private enterprise Duke Energy Co. Operation and management is attended to by a staff of 108 people, of whom 21 are responsible for the steam power unit. According to Duke Co., the technical capabilities of its employees has reached satisfactory levels, and the quality of operation and management is high.
(2) Power lines and substations are currently owned by ETESAL Co., which has a technical staff of 208 people. According to ETESAL, the technical capability of its employees is high, and the quality of operation and management is high. In order to sustain this high level of operation and management quality, ETESAL has now decided to implement a yearly training plan, and is introducing qualifications for training classes.
(3) Distribution lines and substations under the project are part of the systems separately owned and operated by DELSUR Co. and AES El Salvador. No details on these companies’ technological standards and training have been disclosed, but based on responses to oral interviews conducted locally and the maintenance report for 2005, because no major problems with operation and management were noted, it is felt that there are no significant problems with either the number of level of the technical staff who manage conduct the work.
A central management system has been established to handle El Salvador’s current
power line and distribution system based on SCADA16. System administration is conducted by the headquarters for each sector of San Salvador. At each facility, 16 SCADA stands for Supervisory Control and Data Acquisition.
18
technicians are not permanently on hand, and so if a problem arises, or if a problem is expected to arise, the problem is dealt with on-site.
2.5.1.2 Structure
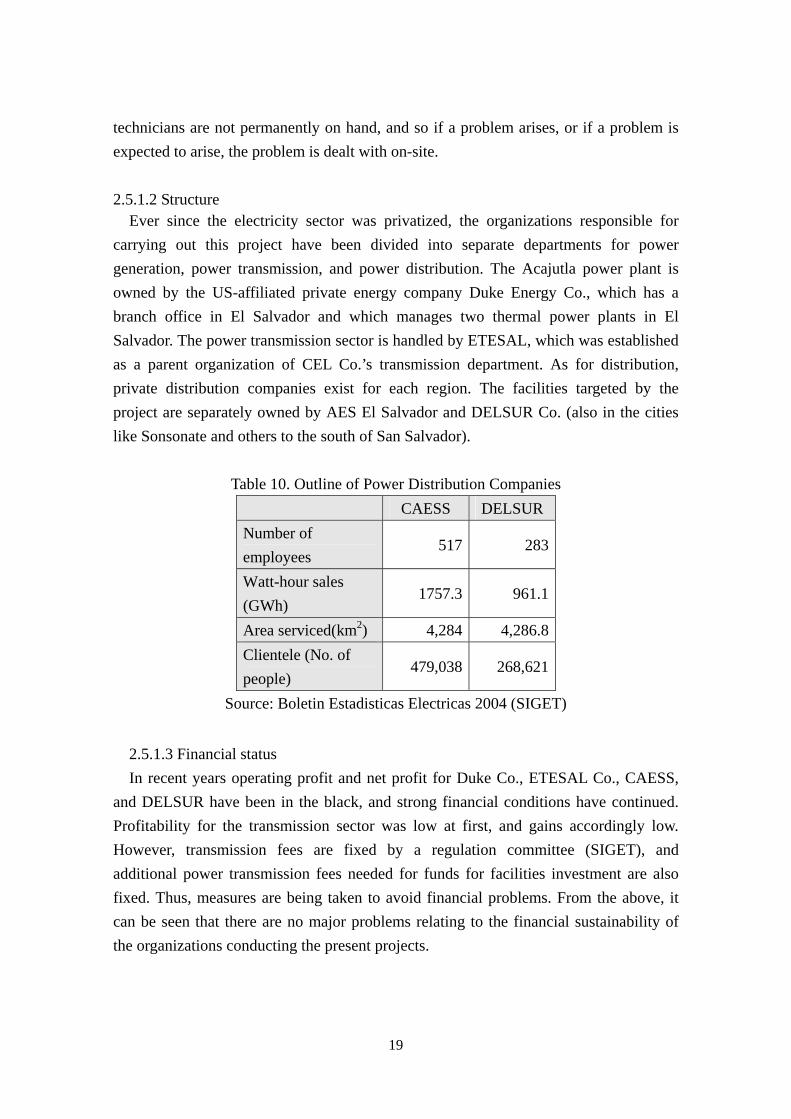
Ever since the electricity sector was privatized, the organizations responsible for carrying out this project have been divided into separate departments for power generation, power transmission, and power distribution. The Acajutla power plant is owned by the US-affiliated private energy company Duke Energy Co., which has a branch office in El Salvador and which manages two thermal power plants in El Salvador. The power transmission sector is handled by ETESAL, which was established as a parent organization of CEL Co.’s transmission department. As for distribution, private distribution companies exist for each region. The facilities targeted by the project are separately owned by AES El Salvador and DELSUR Co. (also in the cities like Sonsonate and others to the south of San Salvador).
Table 10. Outline of Power Distribution Companies CAESS DELSURNumber of employees
517 283
Watt-hour sales (GWh)
1757.3 961.1
Area serviced(km2) 4,284 4,286.8Clientele (No. of people)
479,038 268,621
Source: Boletin Estadisticas Electricas 2004 (SIGET)
2.5.1.3 Financial status In recent years operating profit and net profit for Duke Co., ETESAL Co., CAESS,
and DELSUR have been in the black, and strong financial conditions have continued. Profitability for the transmission sector was low at first, and gains accordingly low. However, transmission fees are fixed by a regulation committee (SIGET), and additional power transmission fees needed for funds for facilities investment are also fixed. Thus, measures are being taken to avoid financial problems. From the above, it can be seen that there are no major problems relating to the financial sustainability of the organizations conducting the present projects.
19
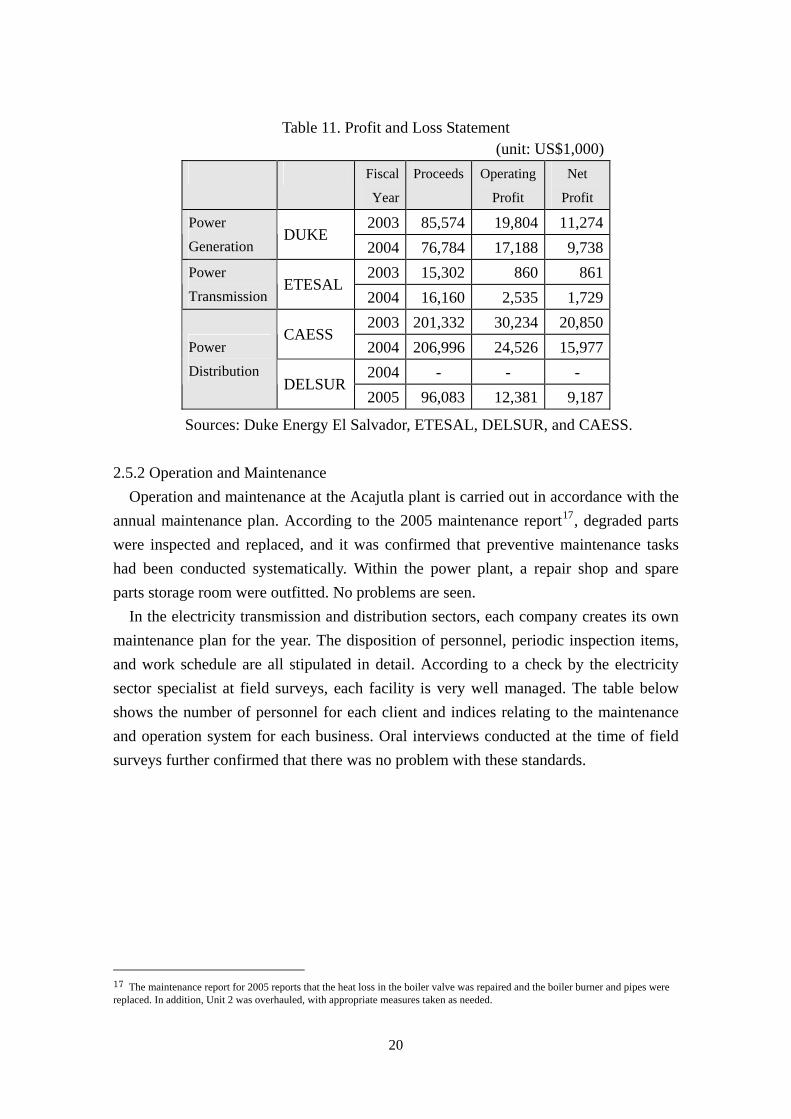
Table 11. Profit and Loss Statement (unit: US$1,000)
Fiscal
Year
Proceeds Operating
Profit
Net
Profit
2003 85,574 19,804 11,274 Power Generation
DUKE 2004 76,784 17,188 9,738 2003 15,302 860 861 Power
Transmission ETESAL
2004 16,160 2,535 1,729 2003 201,332 30,234 20,850
CAESS 2004 206,996 24,526 15,977 2004 - - -
Power Distribution
DELSUR2005 96,083 12,381 9,187
Sources: Duke Energy El Salvador, ETESAL, DELSUR, and CAESS. 2.5.2 Operation and Maintenance
Operation and maintenance at the Acajutla plant is carried out in accordance with the annual maintenance plan. According to the 2005 maintenance report17, degraded parts were inspected and replaced, and it was confirmed that preventive maintenance tasks had been conducted systematically. Within the power plant, a repair shop and spare parts storage room were outfitted. No problems are seen.
In the electricity transmission and distribution sectors, each company creates its own maintenance plan for the year. The disposition of personnel, periodic inspection items, and work schedule are all stipulated in detail. According to a check by the electricity sector specialist at field surveys, each facility is very well managed. The table below shows the number of personnel for each client and indices relating to the maintenance and operation system for each business. Oral interviews conducted at the time of field surveys further confirmed that there was no problem with these standards.
17 The maintenance report for 2005 reports that the heat loss in the boiler valve was repaired and the boiler burner and pipes were replaced. In addition, Unit 2 was overhauled, with appropriate measures taken as needed.
20
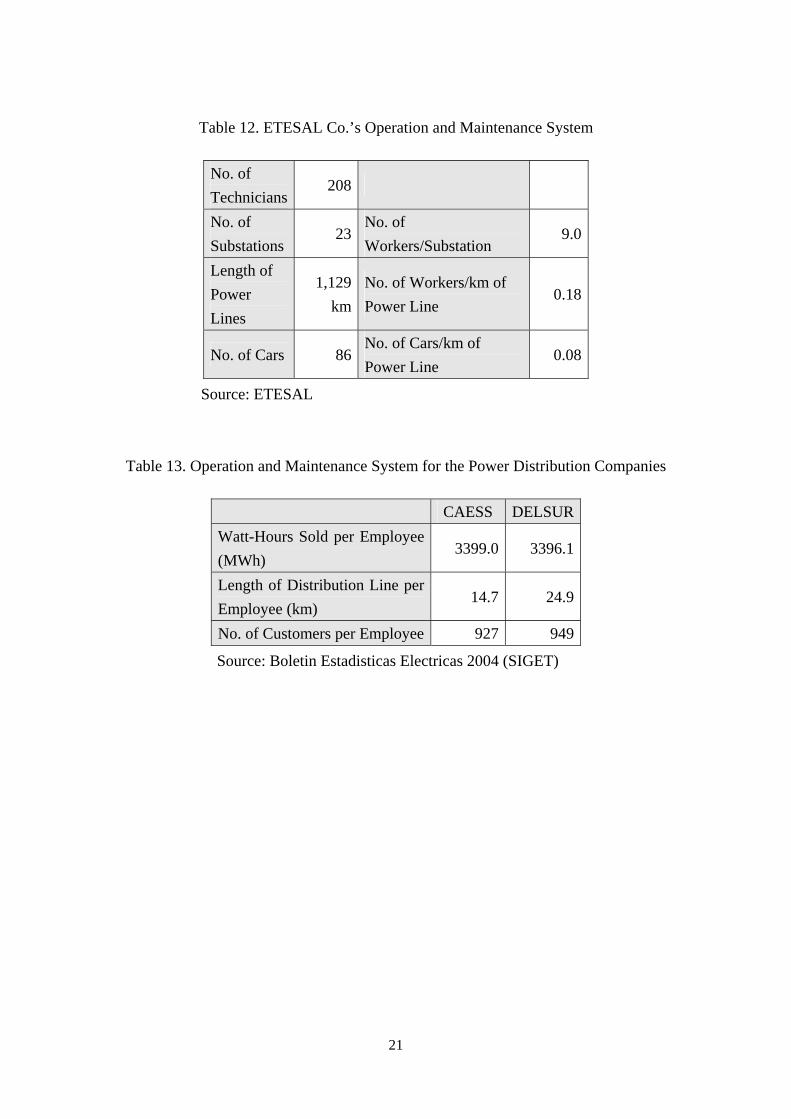
Table 12. ETESAL Co.’s Operation and Maintenance System
No. of Technicians
208
No. of Substations
23No. of Workers/Substation
9.0
Length of Power Lines
1,129 km
No. of Workers/km of Power Line
0.18
No. of Cars 86 No. of Cars/km of Power Line
0.08
Source: ETESAL
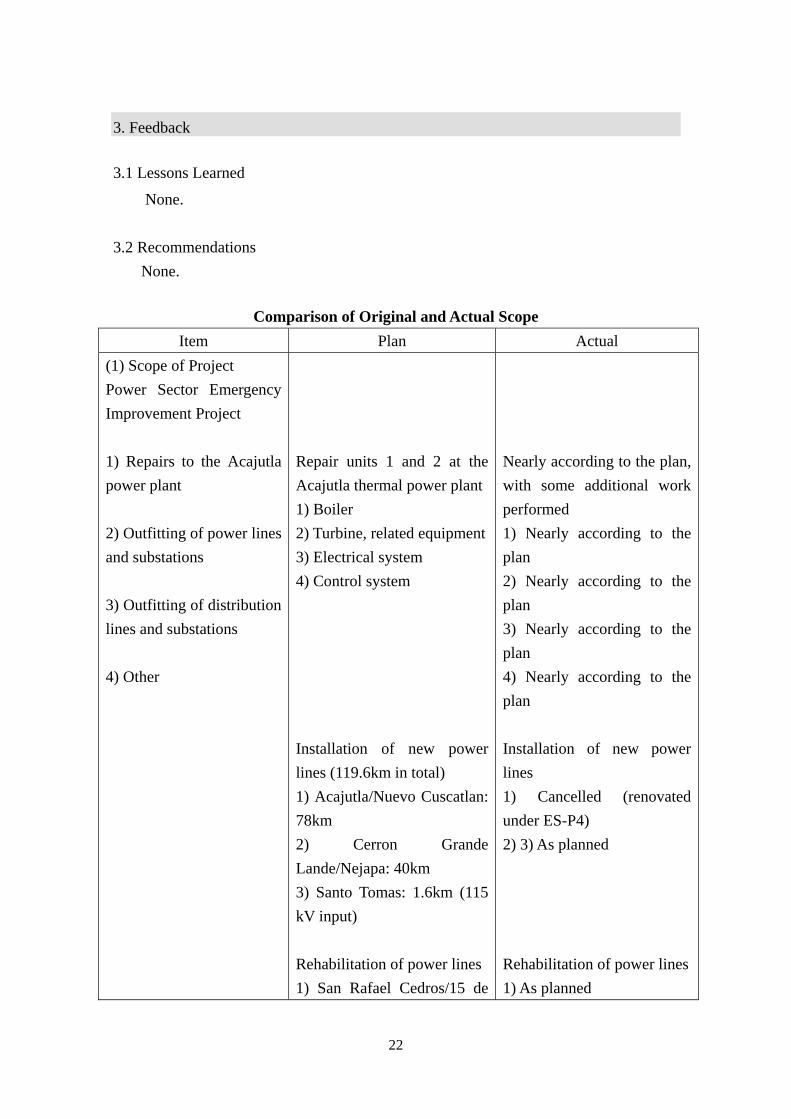
Table 13. Operation and Maintenance System for the Power Distribution Companies
CAESS DELSUR Watt-Hours Sold per Employee (MWh)
3399.0 3396.1
Length of Distribution Line per Employee (km)
14.7 24.9
No. of Customers per Employee 927 949
Source: Boletin Estadisticas Electricas 2004 (SIGET)
21
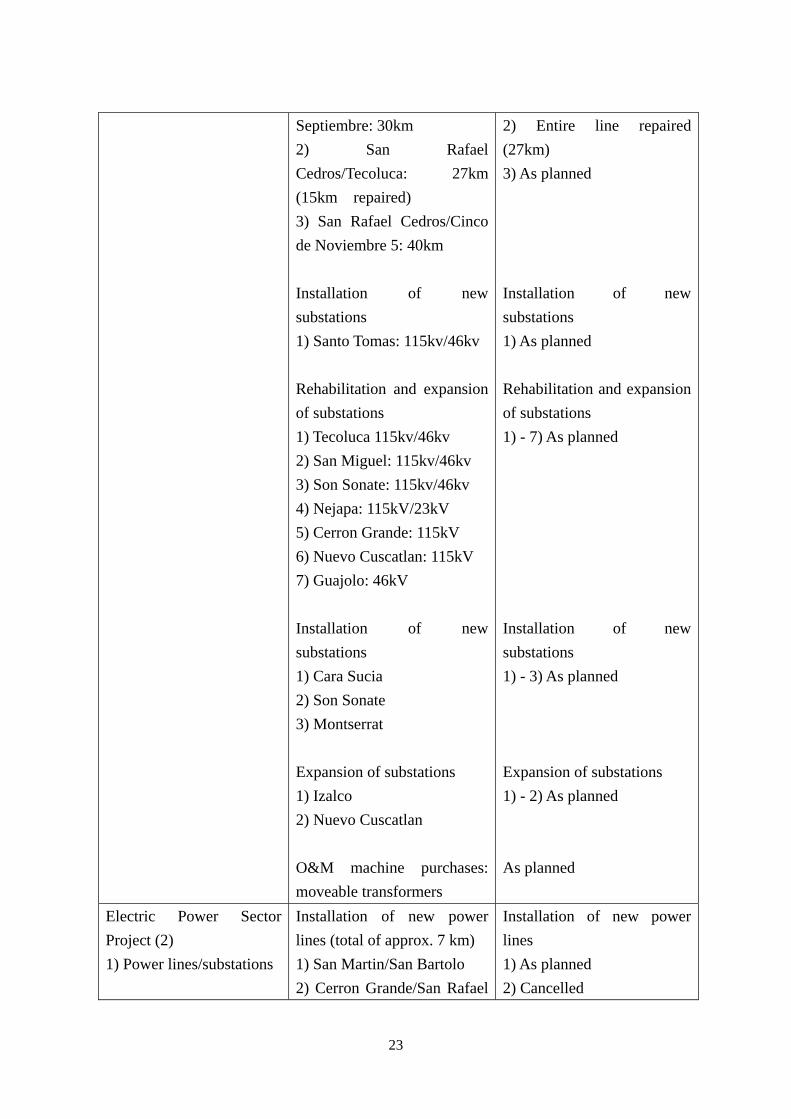
3. Feedback 3.1 Lessons Learned
None. 3.2 Recommendations
None.
Comparison of Original and Actual Scope Item Plan Actual
(1) Scope of Project Power Sector Emergency Improvement Project 1) Repairs to the Acajutla power plant 2) Outfitting of power lines and substations 3) Outfitting of distribution lines and substations 4) Other
Repair units 1 and 2 at the Acajutla thermal power plant 1) Boiler 2) Turbine, related equipment3) Electrical system 4) Control system Installation of new power lines (119.6km in total) 1) Acajutla/Nuevo Cuscatlan: 78km 2) Cerron Grande Lande/Nejapa: 40km 3) Santo Tomas: 1.6km (115 kV input) Rehabilitation of power lines 1) San Rafael Cedros/15 de
Nearly according to the plan, with some additional work performed 1) Nearly according to the plan 2) Nearly according to the plan 3) Nearly according to the plan 4) Nearly according to the plan Installation of new power lines 1) Cancelled (renovated under ES-P4) 2) 3) As planned Rehabilitation of power lines1) As planned
22
Septiembre: 30km 2) San Rafael Cedros/Tecoluca: 27km (15km repaired) 3) San Rafael Cedros/Cinco de Noviembre 5: 40km Installation of new substations 1) Santo Tomas: 115kv/46kv Rehabilitation and expansion of substations 1) Tecoluca 115kv/46kv 2) San Miguel: 115kv/46kv 3) Son Sonate: 115kv/46kv 4) Nejapa: 115kV/23kV 5) Cerron Grande: 115kV 6) Nuevo Cuscatlan: 115kV 7) Guajolo: 46kV Installation of new substations 1) Cara Sucia 2) Son Sonate 3) Montserrat Expansion of substations 1) Izalco 2) Nuevo Cuscatlan O&M machine purchases: moveable transformers
2) Entire line repaired (27km) 3) As planned Installation of new substations 1) As planned Rehabilitation and expansion of substations 1) - 7) As planned Installation of new substations 1) - 3) As planned Expansion of substations 1) - 2) As planned As planned
Electric Power Sector Project (2) 1) Power lines/substations
Installation of new power lines (total of approx. 7 km) 1) San Martin/San Bartolo 2) Cerron Grande/San Rafael
Installation of new power lines 1) As planned 2) Cancelled
23
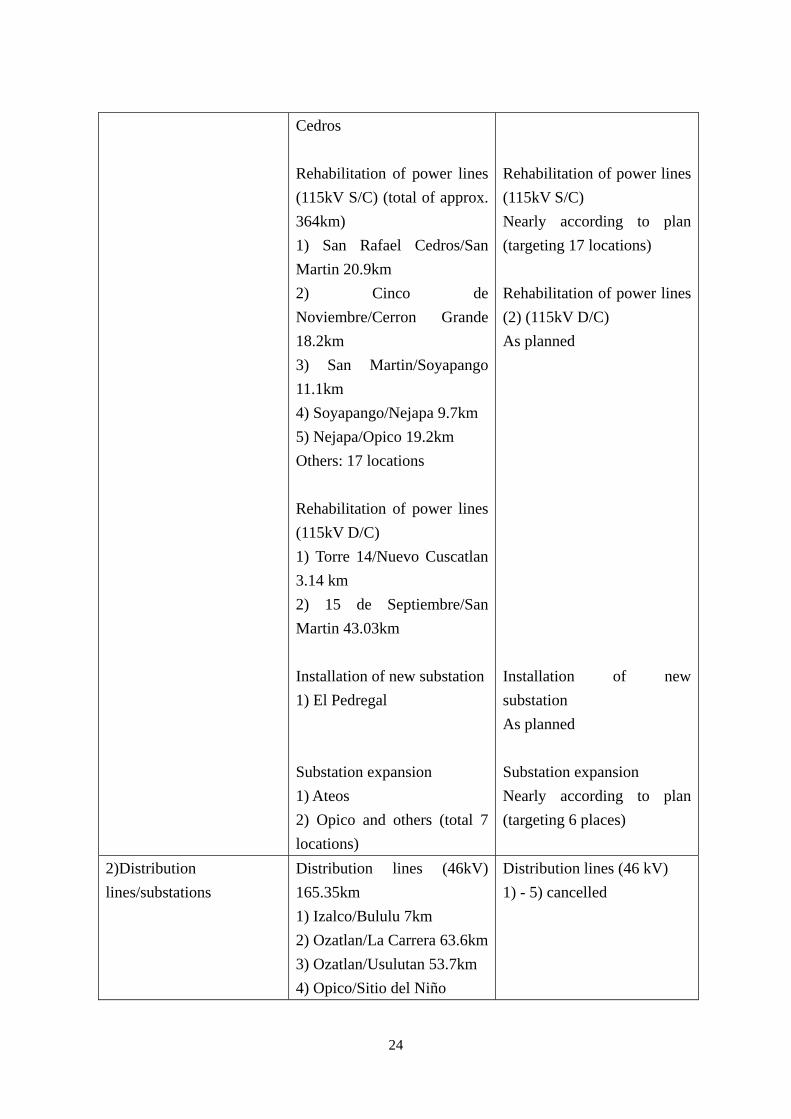
Cedros Rehabilitation of power lines (115kV S/C) (total of approx. 364km) 1) San Rafael Cedros/San Martin 20.9km 2) Cinco de Noviembre/Cerron Grande 18.2km 3) San Martin/Soyapango 11.1km 4) Soyapango/Nejapa 9.7km 5) Nejapa/Opico 19.2km Others: 17 locations Rehabilitation of power lines (115kV D/C) 1) Torre 14/Nuevo Cuscatlan 3.14 km 2) 15 de Septiembre/San Martin 43.03km Installation of new substation1) El Pedregal Substation expansion 1) Ateos 2) Opico and others (total 7 locations)
Rehabilitation of power lines (115kV S/C) Nearly according to plan (targeting 17 locations) Rehabilitation of power lines (2) (115kV D/C) As planned Installation of new substation As planned Substation expansion Nearly according to plan (targeting 6 places)
2)Distribution lines/substations
Distribution lines (46kV) 165.35km 1) Izalco/Bululu 7km 2) Ozatlan/La Carrera 63.6km3) Ozatlan/Usulutan 53.7km 4) Opico/Sitio del Niño
Distribution lines (46 kV) 1) - 5) cancelled
24
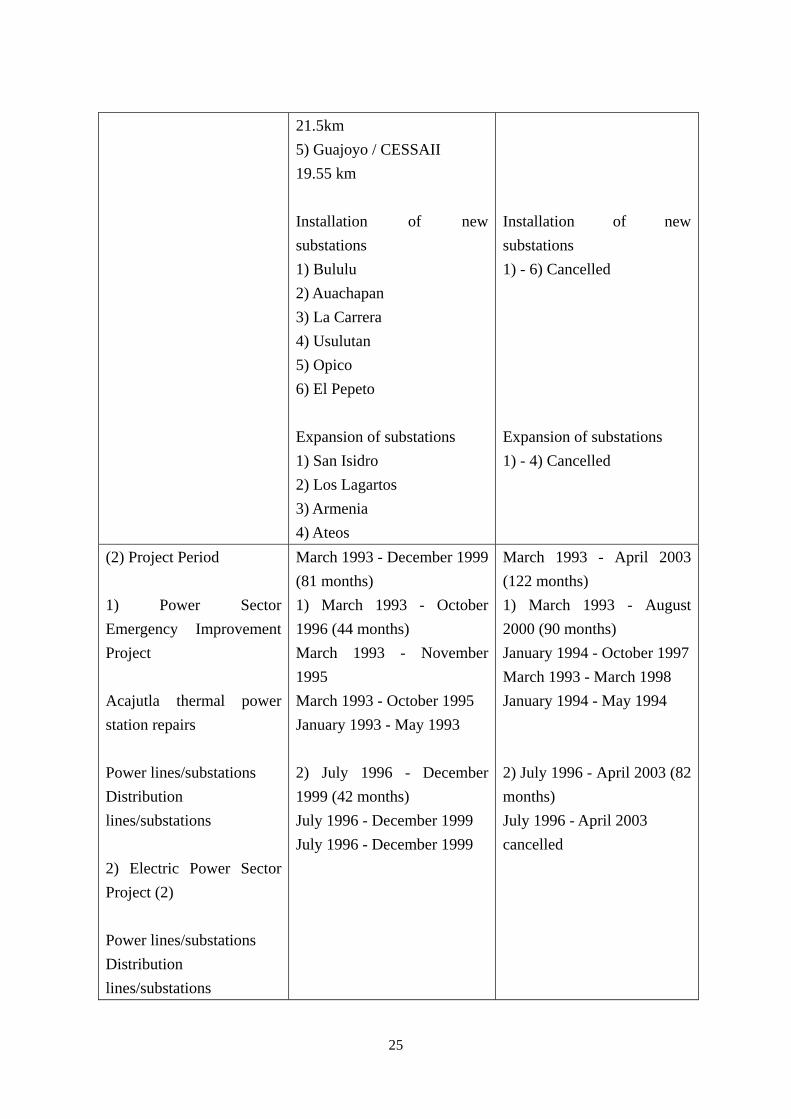
21.5km 5) Guajoyo / CESSAII 19.55 km Installation of new substations 1) Bululu 2) Auachapan 3) La Carrera 4) Usulutan 5) Opico 6) El Pepeto Expansion of substations 1) San Isidro 2) Los Lagartos 3) Armenia 4) Ateos
Installation of new substations 1) - 6) Cancelled Expansion of substations 1) - 4) Cancelled
(2) Project Period 1) Power Sector Emergency Improvement Project Acajutla thermal power station repairs Power lines/substations Distribution lines/substations 2) Electric Power Sector Project (2) Power lines/substations Distribution lines/substations
March 1993 - December 1999 (81 months) 1) March 1993 - October 1996 (44 months) March 1993 - November 1995 March 1993 - October 1995 January 1993 - May 1993 2) July 1996 - December 1999 (42 months) July 1996 - December 1999 July 1996 - December 1999
March 1993 - April 2003 (122 months) 1) March 1993 - August 2000 (90 months) January 1994 - October 1997March 1993 - March 1998 January 1994 - May 1994 2) July 1996 - April 2003 (82 months) July 1996 - April 2003 cancelled
25
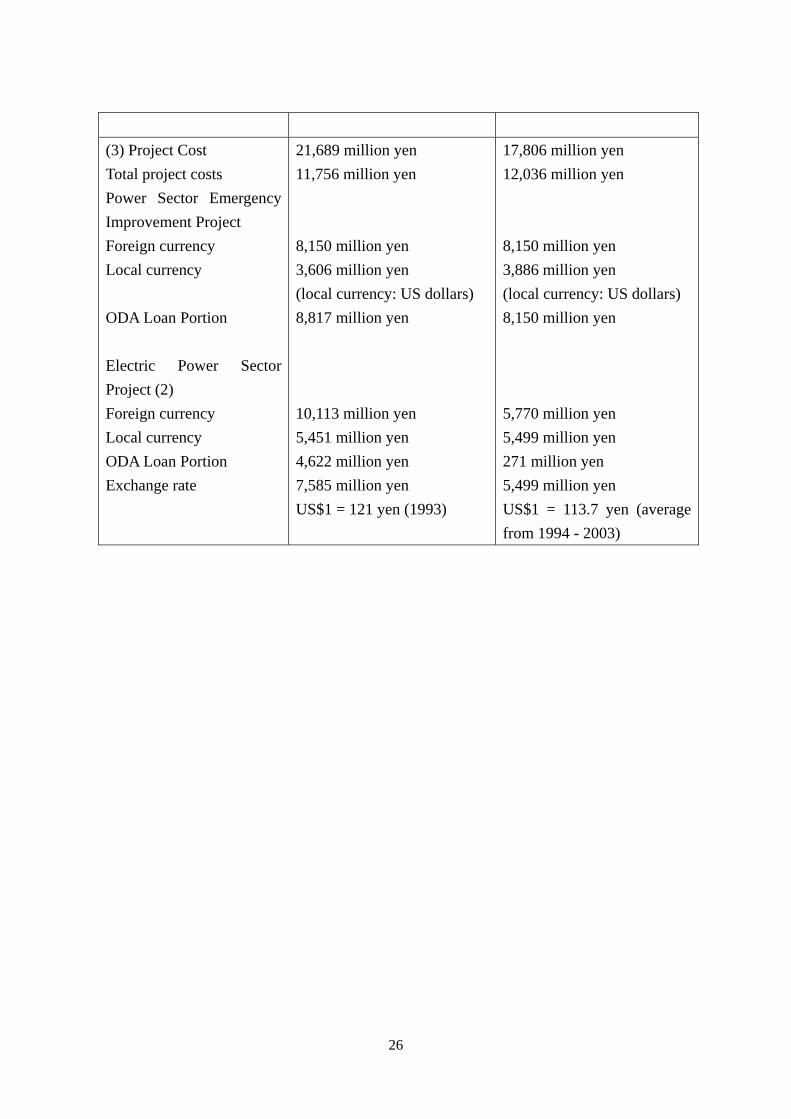
(3) Project Cost Total project costs Power Sector Emergency Improvement Project Foreign currency Local currency ODA Loan Portion Electric Power Sector Project (2) Foreign currency Local currency ODA Loan Portion Exchange rate
21,689 million yen 11,756 million yen 8,150 million yen 3,606 million yen (local currency: US dollars) 8,817 million yen 10,113 million yen 5,451 million yen 4,622 million yen 7,585 million yen US$1 = 121 yen (1993)
17,806 million yen 12,036 million yen 8,150 million yen 3,886 million yen (local currency: US dollars) 8,150 million yen 5,770 million yen 5,499 million yen 271 million yen 5,499 million yen US$1 = 113.7 yen (average from 1994 - 2003)
26