mexico economic outlook - bbva research · mexico economic outlook / 1st quarter 2018 2 contents 1....
TRANSCRIPT

Mexico Economic Outlook 1st QUARTER 2018 | MEXICO UNIT

Mexico Economic Outlook / 1st Quarter 2018 2
Contents
1. Summary 3
2. Global growth is strengthened 5
3. In 2017 the economy grew by 2.3% with seasonally adjusted figures 11
4. After the temporary increase in 4Q17, inflation has resumed its downward trend in 1Q18 as we forecast 23
5. Indicators and forecasts 34
Closing date: 23 February 2018

Mexico Economic Outlook / 1st Quarter 2018 3
1. Summary
World economic growth consolidated in late 2017 at reasonably solid rates, reflecting improved results in all major areas
and showing signs of continuing in good health over the coming quarters. Support from economic policy, above all in
developed economies, eventually had a clear impact on the real economy, with a recovery of investment that gained traction
with support in the form of increased demand and an upturn in international trade, factors which have also driven the
recovery of the industrial sector. Meanwhile, private consumption continues to perform well in advanced economies, while
gaining momentum in emerging economies. Forecasts and market confidence in many such economies have also been
favoured by the higher commodity prices, as well as by financial markets, which continue to encourage the influx of capital.
Confidence indicators continue to improve, the result of strong economic performance and reduced short-term risk, with
forecasts pointing to an ongoing positive panorama. This scenario of increased growth and higher demand has been
accompanied so far by subdued inflation, despite the expansionary measures adopted by the major central banks and the
gradual reduction in idle capacity in the developed economies.
In Mexico, we are maintaining our forecast for growth in 2018 at 2.0%, driven by private consumption that is being
strengthened in a context of lower inflation, and the consolidation of exports driven by improved performance from the US
industrial sector, especially manufacturing activities. In 2017 the economy grew by 2.3%, as a result of a rebound in growth
in the fourth quarter to 0.8%, driven by trade and services, which showed a rapid recovery after the September earthquakes,
and primary activities, which recorded greater dynamism in 4Q17. Manufacturing is beginning to show signs of recovery,
after registering slow dynamism in the first three quarters of the year.
In 2017, the primary balance of the public sector was positive for the first time since 2008, registering an amount of 310.2
billion pesos vs. -25.0 billion pesos in 2016. If this disciplined management of the finances of the federal government and
state-owned enterprises continues for the rest of 2018, the target of 0.8% of GDP will be attained for the primary surplus of
the entire public sector. The historical balance of the public sector’s financial requirements (SHRFSP), the broadest indicator
of public debt, stood at 46.2% vs. 48.7% of GDP at the end of 2017 and 2016, respectively. It is important to mention that
the SHRFSP (% of GDP) had not registered a decrease since 2007.
The decrease in the current account deficit in 2017 of US$4.0 billion (compared to 2016) was mainly due to the significant
swing in the balance of trade for non-oil goods, which went from a deficit of US$377 million to a surplus of US$7.5 billion.
This is due in large part to the greater external impetus coming from the recovery of manufacturing production in the US
during 2017. With regard to the balance of trade, the deficit went from US$13.1 billion in 2016 to US$10.9 billion in 2017.
This lower deficit is mainly explained by the substantial reduction in the deficit of the manufacturing trade balance, which

Mexico Economic Outlook / 1st Quarter 2018 4
fell from US$6.8 billion to US$0.3 billion between 2016 and 2017. For 2018 we estimate that the balance of trade deficit will
stand at US$13.2 billion.
After the temporary increase in 4Q17, inflation has resumed its downward trend in 1Q18 as we forecast. Data for the first
month-and-a-half of the year (to mid-February) clearly indicate that both headline and core inflation are moderating, and
suggest that, as we anticipated, the interruption in the downward trend in inflation during 4Q17 will only be transitory. The
change in trend in inflation in 1Q18 is due mainly to the gradual fading of the two main shocks to which it was exposed in
2017, namely the increase in energy prices in January and the considerable additional depreciation of the peso in reaction
to the result of the US elections which led to an increase in the rate of pass-through to goods.
Inflation will continue to decline at a good pace; the risks to inflation continue to be biased upwards, but have moderated.
We expect both headline and core inflation to continue to decline at a brisk pace throughout 2018. We anticipate that
headline and core inflation will be below 5.0% and 4.0%, respectively, in April, and below 4.0% (at 3.8%) and 3.5% (at
3.3%), respectively, at the end of the year, below the upper limit of variability of the central bank target.
In this context, the end of the rate increase cycle is approaching. Going forward, Banxico will maintain this pre-emptive
approach in the short term, but we believe that Banxico will consider increasing the monetary rate only once more and that
after doing so it will feel more comfortable with inflation falling at a good pace, with anchored medium- and long-term
expectations, with those at 12 months being moderated, and year-end expectations possibly decreasing marginally. In
addition, the increases in rates already observed have brought the benchmark rate to a restrictive level.
The main risk continues to be associated with the NAFTA renegotiation process. The slow advances, if extended, will
continue to delay the recovery of investment and to affect the exchange rate. In fact, the uncertainty surrounding a possible
NAFTA 2.0 has prevented further appreciation of the peso. This week the seventh round of negotiations began. Expectations
are low; major advances are unlikely. Non-controversial chapters will continue to be closed, but there will be hardly any
significant concessions on the crucial issues put on the table by the US: the rules of origin in the automotive sector, the
automatic termination clause every five years, and the resolution of disputes. Both Mexico and Canada know that a NAFTA
2.0 will not be reached without changes in the rules of origin in the automotive sector, and for the moment, the US is showing
no flexibility. The risks of a collapse continue to decline, but those of prolonged negotiation have increased.

Mexico Economic Outlook / 1st Quarter 2018 5
2. Global growth is strengthened
Robust and sustained global growth in 2017
World economic growth consolidated in late 2017 at reasonably solid rates of around 1% QoQ (see Figure 1), reflecting
improved results in all major areas and showing signs of continuing over coming quarters. Support from economic policy
has fostered growth of the real economy, particularly in developed economies. Investment spending has gained traction
with support from increased global demand and an upturn in international trade, allowing a recovery of the industrial sector.
Private consumption continues to perform well in advanced economies and is gaining momentum in emerging economies.
At the same time, an improved growth outlook and enhanced market confidence in many such economies have also been
favoured by higher commodity prices (see Figure 2) and foreign capital inflows. Confidence indicators suggest that the
economic expansion is set to improve, favoured by a sound economic performance and reduced short-term risks. In this
context, we forecast global growth to increase by 0.4 percent points to 3.7% in 2017, 0.2% more than in our October
projections.
Figure 2.1 World GDP growth (QoQ, %)
Forecasts based on BBVA-GAIN Figure 2.2 Price of a barrel of Brent crude (Dollars)
Source: BBVA Research
Source: BBVA Research
Over the past three months, there have been further reasons to remain optimistic in all the large areas. Throughout
2017, recovery in the U.S. has been taking root, with slightly higher-than-expected growth rates and improvement in the
labour market. The tax reform was finally passed and it might lengthen the cyclical recovery. However, we don’t expect it to
have a significant impact in the long-term. Recent Fed appointments suggest continuity in monetary policy management,
which should be reflected by a very gradual normalisation. In China, the measures approved by the government have
0.4
0.6
0.8
1.0
1.2
De
c-1
2
Jun-1
3
De
c-1
3
Jun-1
4
De
c-1
4
Jun-1
5
De
c-1
5
Jun-1
6
De
c-1
6
Jun-1
7
De
c-1
7
CI 20% CI 40% CI 60%
Point Estimates Period average
30
40
50
60
70
80
90
100
110
120
Mar-
11
Se
p-1
1
Mar-
12
Se
p-1
2
Mar-
13
Se
p-1
3
Mar-
14
Se
p-1
4
Mar-
15
Se
p-1
5
Mar-
16
Se
p-1
6
Mar-
17
Se
p-1
7
Mar-
18
Se
p-1
8
Mar-
19
Se
p-1
9
Oct'17 Dec'17

Mexico Economic Outlook / 1st Quarter 2018 6
managed to stabilise the economy, while some structural reforms have been introduced and an economic strategy more
focused on reducing economic imbalances -and less on meeting growth targets- has been adopted. Finally, the eurozone
posted higher growth than expected on the back of an improved global outlook and stronger internal demand that is
benefiting from a more reduced political uncertainty.
This scenario of increased growth and higher demand has been accompanied so far by subdued inflation, despite the
expansionary measures adopted by major central banks and the gradual reduction in idle capacity in developed economies.
Doubts remain as to whether factors underpinning the weakness of inflation are transitory or permanent. Globalisation, the
flexibility of labour markets, low inflation expectations or increased productivity could lie behind the slower response of
prices to increased economic activity. In this context, the degree to which inflationary pressure will remain contained is
uncertain, at least for the time being. Continued economic growth and higher oil prices should push inflation up in the short-
term, facilitating advances in the normalisation of central bank policy in developed economies. Meanwhile, emerging
economies still have room for manoeuvre for using monetary policy to bolster growth.
Optimism in financial markets amidst the normalisation of central bank policy
An optimistic mood has predominated in financial markets over the final quarter of 2017. In the absence of adverse
global economic shocks, market fundamentals have continued to support risk taking by investors (see Figure 3). In
particular, the upbeat economic environment has added to still accommodative monetary conditions -thanks to abundant
liquidity in the system and interest rates at record lows- which has helped to maintain volatility at record lows while favouring
again risky assets (as is the case of peripheral debt and emerging countries’ assets). Yet, this is leading as well to doubts
about a potential overvaluation of certain assets, including equities in advanced countries, which have maintained their
upward trend. The flattening of the US yield curve due to low long-term interest rates and rising short-term rates following
monetary policy decisions are another question marks hanging over financial markets as we enter 2018.
As regards to central banks, there have been no surprises. Nevertheless, the strong pace of growth which
characterises the current economic scenario is increasingly pointing to a normalisation of monetary policy. This
positive outlook has also triggered an upward revision of economic projections by the main central banks - the U.S. Fed
and the ECB- and has also accelerated the process of scaling back the current monetary stimulus.
In December, the Fed increased interest rates to 1.25-1.5% for the fifth time since the beginning of the interest rate hikes
in late 2015, and they have started reducing asset purchases. The Fed's adequate communication policy is also facilitating
the transition towards the new phase of monetary policy without causing major shocks in financial markets. Moreover,
they maintain their forecast of three interest rate hikes of 25 basis points in 2018 -in line with our upwardly revised
current expectation, adjusted after the introduction of the tax reform and its estimated impact on economic growth. Thus
Mexico Economic Outlook / 1st Quarter 2018 7
far, the dollar has not capitalised the new fiscal and monetary policy decisions (as it continues to trade at around $1.20
against the euro).
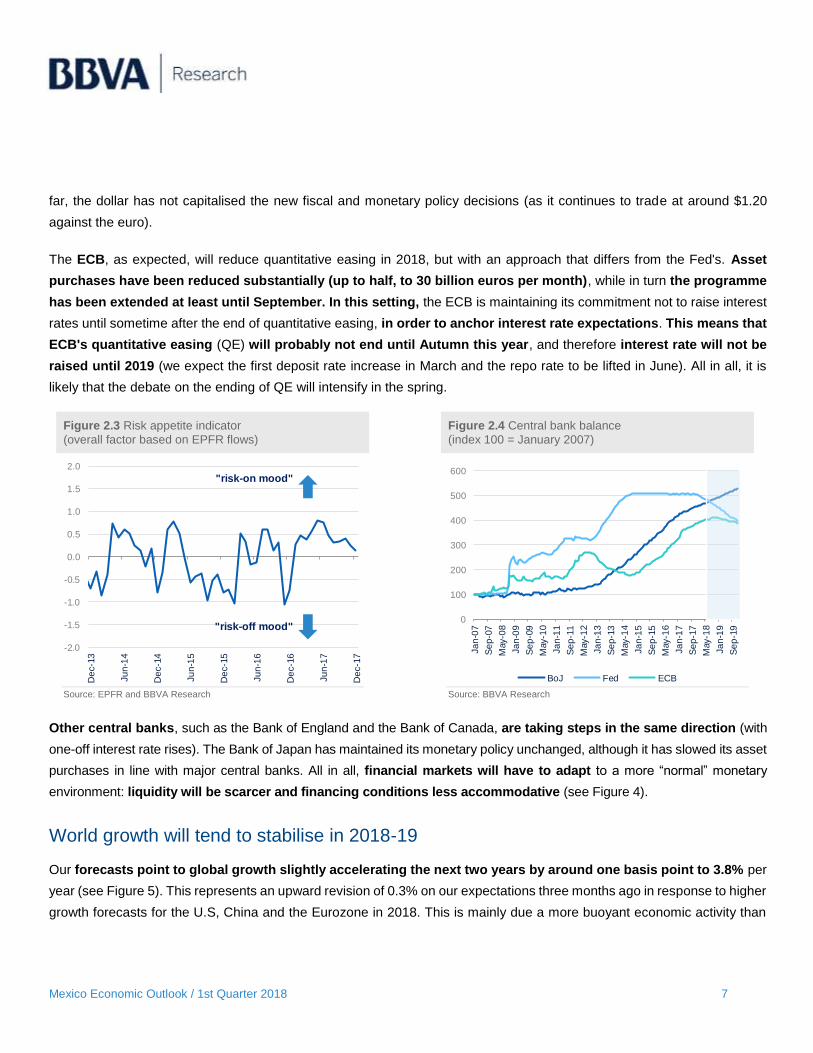
The ECB, as expected, will reduce quantitative easing in 2018, but with an approach that differs from the Fed's. Asset
purchases have been reduced substantially (up to half, to 30 billion euros per month), while in turn the programme
has been extended at least until September. In this setting, the ECB is maintaining its commitment not to raise interest
rates until sometime after the end of quantitative easing, in order to anchor interest rate expectations. This means that
ECB's quantitative easing (QE) will probably not end until Autumn this year, and therefore interest rate will not be
raised until 2019 (we expect the first deposit rate increase in March and the repo rate to be lifted in June). All in all, it is
likely that the debate on the ending of QE will intensify in the spring.
Figure 2.3 Risk appetite indicator
(overall factor based on EPFR flows) Figure 2.4 Central bank balance
(index 100 = January 2007)
Source: EPFR and BBVA Research
Source: BBVA Research
Other central banks, such as the Bank of England and the Bank of Canada, are taking steps in the same direction (with
one-off interest rate rises). The Bank of Japan has maintained its monetary policy unchanged, although it has slowed its asset
purchases in line with major central banks. All in all, financial markets will have to adapt to a more “normal” monetary
environment: liquidity will be scarcer and financing conditions less accommodative (see Figure 4).
World growth will tend to stabilise in 2018-19
Our forecasts point to global growth slightly accelerating the next two years by around one basis point to 3.8% per
year (see Figure 5). This represents an upward revision of 0.3% on our expectations three months ago in response to higher
growth forecasts for the U.S, China and the Eurozone in 2018. This is mainly due a more buoyant economic activity than
-2.0
-1.5
-1.0
-0.5
0.0
0.5
1.0
1.5
2.0
De
c-1
3
Ju
n-1
4
De
c-1
4
Ju
n-1
5
De
c-1
5
Ju
n-1
6
De
c-1
6
Ju
n-1
7
De
c-1
7
"risk-on mood"
"risk-off mood"0
100
200
300
400
500
600Ja
n-0
7
Se
p-0
7
May-0
8
Ja
n-0
9
Se
p-0
9
May-1
0
Ja
n-1
1
Se
p-1
1
May-1
2
Ja
n-1
3
Se
p-1
3
May-1
4
Ja
n-1
5
Se
p-1
5
May-1
6
Ja
n-1
7
Se
p-1
7
May-1
8
Ja
n-1
9
Se
p-1
9
BoJ Fed ECB

Mexico Economic Outlook / 1st Quarter 2018 8
expected in past quarters, but also thanks to the aforementioned economic measures adopted in the first two key areas. In
Latin American economies we now expect a somewhat stronger recovery this year, due to the upward revision of global
demand and higher commodity prices. Despite the expected stability of world growth, we still expect a mild moderation
in developed economies in 2019, while emerging economies will continue consolidating their recovery. On top of this,
there are still a number of political risks that could drag economic confidence and impact financial markets. These
uncertainties are however less significant than three months ago.
U.S: higher economic growth in the short term
Economic activity surged once again by slightly over an annual pace of 3% in the third quarter of 2017. Although the
most recent indicators suggest a certain slowdown over 4Q17, this appears to be transitory, and the consequence of
rebuilding works after recent hurricanes and delays to investment pending the implementation of certain fiscal measures.
Various factors have bolstered the recent strengthening of the economy. Higher oil prices and the depreciation of the
US dollar have supported investment, while greater global demand favoured a further rebound in global exports. Consumer
spending has also increased at a relatively stable and solid pace, in contrast to the more gradual recovery of the labour
market, higher inflation and a slight tightening of financial conditions. Public expenditure made a very positive contribution
to growth, despite Congress agreeing to increase caps over discretionary expenditure. As a result of all the above, GDP
increased by around 2.2% in 2017.
Figure 2.5 World GDP forecasts, area by area (%) Figure 2.6 Impact of U.S. tax reforms on GDP (%)
Source: IMF and BBVA Research
Source: BBVA Research
0
1
2
3
4
5
6
2010 2011 2012 2013 2014 2015 2016 2017 2018 2019
Advanced Ec. Emerging Ec. World, Oct-17
0
0.1
0.2
0.3
0.4
0.5
0.6
0.7
0.8
0.9
2018 2020 2022 2024

Mexico Economic Outlook / 1st Quarter 2018 9
Improved domestic and global fundamentals could lift 2018 growth by around 0.2pp. We also estimate the tax reform
to further add another 0.2pp, increasing our 2018 GDP growth forecast to 2.6% (see Figure 6). The impact of lower taxes
on personal income will not be too pronounced, as they will mainly affect those with the highest earnings –who are less
inclined to consume-. The greatest impact will stem from cuts to corporate taxes, although here again, we expect that this
will be relatively limited given the temporary nature of some provisions, the higher financing costs and a possible increase
of savings -not investment. Taking into account all these factors, we estimate that the accumulated effect of the tax reform
on GDP could be around 0.6% up to 2024. Although monetary policy will remain accommodative, the improved economic
outlook will strengthen the process of normalisation started by the Fed. As a result, we expect growth to moderate 2.5% in
2019. Despite a reduction of risks, these remain high, given the considerable amount of political tension and the threat
of a pronounced shift towards protectionism, while some assets could be showing signs of overvaluation.
China: a more moderate slowdown
The most recent figures suggest that economic growth remained stable over the second half of last year, showing some
resilience to measures adopted by the authorities to tackle financial vulnerabilities and to move towards an ordered
deleveraging of the economy. As a result, growth could have stabilised at 6.7% in 2017, with a slight slowdown in both
consumer spending and investment, compensated with positive net exports figures. Despite the good economic
performance, we still expect a growth moderation moving forward, albeit to a lesser extent than in our previous
forecasts due to an improved international outlook and the economic policy strategy presented at the 19th Communist Party
Congress.
The factors underpinning this scenario remain unchanged: less support from economic policies, with a more prudent
monetary policy, the regulatory tightening, the end to industrial over-capacity and a less expansive fiscal policy.
Nevertheless, the withdrawal from a strict growth target suggests a greater focus on the reduction of structural
imbalances, while the measures aimed at opening up the economy and the introduction of structural reforms could
help to improve potential growth. We now forecast that GDP to slow to 6.3% in 2018 (0.3% higher than three months
ago) and to around 6% in 2019. Higher commodity prices will lead to an upward pressure on inflation, which had been
subdued at the end of last year. However, this effect will be offset by a stronger currency and a stricter regulatory framework.
As a result, we expect to see inflation pick up to 2.3% during 2018 (from 1.7% last year), rising to 2.5% in 2019. The central
bank is expected to keep benchmark interest rates at the current level all through this year, discharging the
precautionary approach of monetary policy to macro-prudential and regulatory tools.
The strategy put forward by the authorities and the more gradual slowdown of growth have reduced domestic risks in the
short term. They nevertheless remain at high levels in the medium term, which adds to external risks related to increased
protectionism.

Mexico Economic Outlook / 1st Quarter 2018 10
Eurozone: upward revision of growth but slowing in 2018-19
The recovery of the eurozone economy stepped up over 2017 to a surprising extent, with GDP growth at a relatively
stable rate of around 0.6% per quarter. There was a greater balance in terms of components, with growth more evenly
spread across the member states. The strength of internal demand and the positive contribution stemming from net
exports have allowed a growth acceleration of 0.6 percent points to 2.4% in 2017.
Moving forward, the favourable economic sentiment could be prolonged, though it will be difficult to maintain current growth
pace - clearly above potential- all through the forecast horizon. Recent figures, along with an increase in global demand
and less uncertainty, have led us to revise up our GDP growth forecasts for 2018 by 0.4pp to 2.2%, while we estimate
growth at 1.8% for 2019.
The lower level of uncertainty after election results last year together with increased corporate profits should bolster a
recovery of investment, which will moderate somewhat in 2018-19 after the strong growth seen over the past two and
a half years. The eurozone will also benefit from a significant export growth momentum, although these may experience
a slowdown given the currency appreciation and the stabilisation of global growth. Job creation will lose some traction (down
to 1% in 2018-19 from 1.6% in 2017), but will be sufficient to sustain household income and a strong growth in private
consumption.
Inflation moderated towards the end of the year due to the base effect of energy prices. This trend is set to continue entering
2018, taking general inflation to around 1%. Nevertheless, we now expect the price of Brent crude oil to increase by
around 16% more than in our previous forecast, meaning that the aforementioned base effect will fade from March
onward. As a result, we are increasing our headline inflation forecast by 3pp to 1.5% for 2018 and to 1.6% for 2019.
Regarding core inflation, we continue to forecast a gradual increase to 1.3% in 2018 and to 1.6% in 2019, driven by
strong domestic demand, a healthier labour market and the reduction of spare capacity.
Domestic risks for the eurozone as a whole are still downward biased, although they have diminished and are
moderated. Despite the fact that the political outlook partially cleared in 2017, there are still latent risks, such as Italian
elections in March and difficulties in strengthening the European project. Brexit negotiations have moved forward, although
we are still far from ensuring that this will not be a disruptive event if a trade agreement is not reached by early 2019.

Mexico Economic Outlook / 1st Quarter 2018 11
3. In 2017 the economy grew by 2.3% with seasonally
adjusted figures
In 2017, the economy grew by 2.3% (annual change, SWDA), as a result of outstanding growth in the fourth quarter, of
0.8% (QoQ, SWDA) driven by the tertiary sector, which showed a rapid recovery after the earthquakes in September, and
primary activities, which registered greater dynamism in 4Q17 (Figures 3.1 and 3.2). Although the manufacturing sector
showed a weak performance throughout the year, the November and December activity indicators registered positive results
that point towards a recovery in 2018 in line with an expectation of greater growth of the industrial sector in the US, especially
in manufacturing activities.
Figure 3.1. GDP. Change % YoY (SWDA) Figure 3.2. GDP. QoQ % (SWDA)
Source: BBVA Research / INEGI (National Statistics Institute) Source: BBVA Research / INEGI
In the fourth quarter of 2017, the tertiary sector (63% of GDP) showed the recovery that was anticipated after the
earthquakes that shook the economy in September (Figure 3.3). Within tertiary activities, the education sector together with
the health and social assistance services made up the segment that suffered the greatest effects derived from the
earthquakes. Nevertheless, the data from the IGAE (Global Economic Activity Index) for October and November already
indicate the recovery of the sector. In October and November, the percentage variation (MoM, SWDA) of the IGAE in this
segment exceeded the figure recorded in September by 8.1 pp, and the same behaviour is recorded by the activity indicators
for wholesale trade, professional, scientific and technical services, as well as for temporary accommodation and food
preparation services. As a whole, in 4Q17 the GDP of the tertiary sector grew by 1.0% (QoQ, SWDA), a figure 1.0 pp higher
2.7%
2.3%
2.0%e
2016 2017 2018
0.6%
0.2%
-0.2%
0.8%
2017/01 2017/02 2017/03 2017/04

Mexico Economic Outlook / 1st Quarter 2018 12
than that registered in the previous quarter. In annual terms, the GDP of the services and commerce sector grew by 3.2%
(SWDA), which represents a fall of 0.5 pp relative to 2016.
Figure 3.3 GDP by economic sector. QoQ % (SWDA) Figure 3.4 IGAE (Jan 2017 = 100)
Source: BBVA Research / INEGI Source: BBVA Research / INEGI
Regarding secondary activities (30% of GDP), the latest activity data began to show positive signs, with a -0.1% growth in
4Q17 (GDP, QoQ, SWDA), which represented an increase of 0.3 pp relative to that observed in the previous quarter (Figure
3.3). With this figure, the industrial sector has already had two consecutive quarters with greater dynamism, after registering
growth of -0.5% in 2Q17 (QoQ, SWDA). By components, activity indicators of the mining sector (5% of GDP) point towards
the stabilisation of oil production after the hurricanes that hit the coasts of Mexico and the US in September. The growth of
9.9% (vs. -10.4% the previous month) of crude oil production in October pointed to the temporary effect of the hurricanes,
although the fragile growth in November (-1.9%, MoM) and December (0.3%, MoM) corroborated the weak performance
that this sector has shown for several years now (Figure 3.5). In October and November, the percentage variation (MoM,
SWDA) of the IGAE for this segment was 9.0 pp higher than that registered in September (Figure 3.6). In 4Q17, the GDP
of the mining sector grew -1.1% (QoQ, SWDA), 3.6 pp above what was observed in the previous quarter. In annual terms,
the GDP of this activity registered a variation of -9.8% (SWDA), 5.6 pp below that observed in 2016.
0.8%
0.2%
0.7%
-0.4%-0.5%
0.6%
1.5%
-0.4%
0.0%
2.1%
-0.1%
1.0%
Primary sector Industry Trade and services
2017/01 2017/02 2017/03 2017/04
80
85
90
95
100
105
96
97
98
99
100
101
102
103
20
17
/01
20
17
/02
20
17
/03
20
17
/04
20
17
/05
20
17
/06
20
17
/07
20
17
/08
20
17
/09
20
17
/10
20
17
/11
IGAE Secondary activities
Tertiary activities Primary activities

Mexico Economic Outlook / 1st Quarter 2018 13
Figure 3.5 Production of crude oil. MoM % Figure 3.6 IGAE. MoM % (SWDA)
Source: BBVA Research / INEGI * Generation, transport and distribution of electricity, water and gas supply Source: BBVA Research / INEGI
With regard to manufacturing industries (16% of GDP), the IGAE figures pointed to a better performance by the sector after
the fall recorded in September, a month in which this activity registered a growth of -0.6% (IGAE, MoM, SWDA). The positive
data for November (IGAE 0.6%, MoM, SWDA) and December (IGAE 0.1%, MoM, SWDA) were in line with the higher growth
observed in the US manufacturing sector, which in 4Q17 averaged 0.5% (MoM, % SWDA), 0.6 pp above the 3Q17 average
(Figures 3.3 and 3.4). We expect to see this sector consolidate in 2018 as a result of improved performance by the industrial
sector in the USA. (Figure 3.7). In 4Q17, manufacturing GDP grew by 0.7%, 0.2 pp more than in the previous quarter. In
annual terms, the GDP of this sector grew by 3.4% (SWDA), 2.1 pp more than in 2016.
Like the mining sector and manufacturing activities, the construction sector showed signs of recovery in 4Q17, with growth
of 0.4% (GDP, QoQ, SWDA), 0.7 pp higher than that registered in the previous quarter. In particular, the month of December
showed an extraordinary performance, with growth of 3.7% (IGAE, MoM, SWDA), 4.0 pp higher than that observed in
October and 4.8 pp higher than that registered in November (Figure 3.6), most likely derived from the reconstruction work
in the wake of the September earthquakes. In December, the Industrial Activity Indicator for this sector recorded growth of
3.7% (MoM, SWDA), 4.4 pp above the October and November average (Figure 3.8), with the construction segment reporting
the highest percentage variation at 4.4% (MoM, SWDA). In annual terms, construction GDP grew by -1.1% (SWDA), 3.1 pp
below what was observed in 2016.
Finally, the activities related to the generation, transmission and distribution of electricity, water supply and gas (1.5% of
GDP) showed a growth of -0.2% (GDP, QoQ, SWDA) in 4Q17, after a figure of -0.4% (GDP, QoQ, SWDA) recorded in the
previous quarter, possibly related to the interruption and/or intermittent provision of services as a result of the earthquakes.
With respect to the evolution of the primary sector (3.2% of GDP), growth in 4Q17 was 2.1% (GDP, QoQ, SWDA), 0.6 pp
-0.8 -0.2
0.1
-0.3
0.4
-0.6 -1.1-2.8
-10.4
9.9
-1.9
0.3
Ja
n-1
7
Feb
-17
Mar-
17
Ap
r-1
7
May-1
7
Ju
n-1
7
Ju
l-17
Au
g-1
7
Se
p-1
7
Oct-
17
No
v-1
7
De
c-1
7
-8.0
-6.0
-4.0
-2.0
0.0
2.0
4.0
6.0
8.0
Mining Energy* Construction Manufacturing
2017/07 2017/08 2017/09 2017/10 2017/11 2017/12

Mexico Economic Outlook / 1st Quarter 2018 14
above that observed in the previous quarter. In particular, the global activity indicator for the month of November surprised
on the upside with growth of 6.2% (IGAE, MoM, SWDA), the highest growth since January.
Figure 3.7 Manufacturing production index of US and
Mexico. 12-month moving average, MoM % (SWDA)* Figure 3.8 Indicator of Industrial Activity. Construction
Sector. MoM % (SWDA)
*The 12-month moving average of the IGAE is shown with an advance of 3 months Source: BBVA Research / INEGI
Source: BBVA Research / INEGI
With regard to economic activity on the demand side, the main driver of growth continued to be private consumption (68%
of GDP) (Figure 3.9), which, according to the latest data published by INEGI, grew by 0.7% in 3Q17 (QoQ, SWDA). In line
with the recovery that the different economic sectors showed in 4Q17, we anticipate that the growth of private consumption
in this period will be close to that very figure, and that it will continue showing strength throughout 2018 as a result of the
recovery of real income in an environment of lower inflation. In annual terms, the variation in private consumption
(cumulative 1Q17-3Q17, SWDA) amounted to 3.5%, unchanged from what was observed the previous year.
Like private consumption, exports (34% of GDP) maintained their momentum (Figure 3.10), recording an annual variation
of 4.3% (cumulative 1Q17-3Q17, pesos, SWDA), 1.5 pp above that observed the previous year. In dollars, total exports in
2017 grew by 9.8% in annual terms (SWDA), 11.7 pp above the growth reported the previous year, and the highest figure
since 2011. By component, 2017 was a year of recovery for both the oil and non-oil sectors; the former segment (8% of
total exports) grew by 26.4% (vs. -19.1% in 2016), while the latter (92% of total exports) grew by 8.9% (vs. -0.8% in 2016).
Within non-oil exports, manufacturers showed the best performance; in 2017 this segment (94% of non-oil exports) grew
by 8.7% (vs. -1.3% in 2016). Although exports of extractive activities registered growth of 24.5% (vs. -2.6% in 2016), they
accounted for only 1.4% of total non-oil exports. We anticipate that exports will consolidate throughout 2018 in line with
increased growth in the US industrial sector, especially in manufacturing (Figure 3.11).
-0.2
0
0.2
0.4
0.6
0.8
1
1.2
1.4
-0.2
-0.1
0
0.1
0.2
0.3
0.4
0.5
0.6
0.7
0.8
0.9
20
10
/01
20
10
/06
20
10
/11
20
11
/04
20
11
/09
20
12
/02
20
12
/07
20
12
/12
20
13
/05
20
13
/10
20
14
/03
20
14
/08
20
15
/01
20
15
/06
20
15
/11
20
16
/04
20
16
/09
20
17
/02
20
17
/07
Industrial production index - U.S. manufacturing
IGAE - manufacturing (rhs)
80
85
90
95
100
105
20
17
/01
20
17
/02
20
17
/03
20
17
/04
20
17
/05
20
17
/06
20
17
/07
20
17
/08
20
17
/09
20
17
/10
20
17
/11
20
17
/12
ConstructionBuildingBuildingSpecialized works for construction

Mexico Economic Outlook / 1st Quarter 2018 15
Figure 3.9 Private consumption.
2010 Index = 100 (SWDA) Figure 3.10 Manufacturing Exports in USD
2010 Index = 100 (SWDA)
Source: BBVA Research / INEGI Source: BBVA Research / INEGI
Unlike private consumption and exports, investment slowed in 2017, and we expect the slower pace to be maintained in
2018 as a result of a context of greater uncertainty associated with the renegotiation of NAFTA (Figure 3.12); although the
possibility of breakdown seems to have diminished recently, there is no convergence of positions regarding the issues put
on the table by the US, which guarantees that the uncertainty will continue. To this we should also add the period of
presidential elections. In 2017, investment registered an annual variation of -1.4% (cumulative 1Q17-3Q17, SWDA), 2.5 pp
below what was observed in 2016. By components, private investment fell by -0.1% in the same period (vs. 2.6% growth in
2016), while public investment fell by -7.6% (vs. a fall of -5.6% the previous year).
Figure 3.11 Manufacturing production index of US and
manufacturing exports. 12-month moving average, MoM % (SWDA)
Figure 3.12 Private investment.
2010 Index = 100 (SWDA)
Source: BBVA Research / INEGI Source: BBVA Research / INEGI
80
85
90
95
100
105
110
115
120
125
2010 2011 2012 2013 2014 2015 2016 2017
80
90
100
110
120
130
140
150
160
2010 2011 2012 2013 2014 2015 2016 2017
-1
-0.5
0
0.5
1
1.5
2
2.5
3
3.5
-0.2
-0.1
0
0.1
0.2
0.3
0.4
0.5
0.6
0.7
0.8
0.9
20
10/0
1
20
10/0
6
20
10/1
1
20
11/0
4
20
11/0
9
20
12/0
2
20
12/0
7
20
12/1
2
20
13/0
5
20
13/1
0
20
14/0
3
20
14/0
8
20
15/0
1
20
15/0
6
20
15/1
1
20
16/0
4
20
16/0
9
20
17/0
2
20
17/0
7
20
17/1
2
Industrial production index - U.S. manufacturing
Manufacturing exports (rhs)80
90
100
110
120
130
140
150
2010 2011 2012 2013 2014 2015 2016 2017

Mexico Economic Outlook / 1st Quarter 2018 16
Our growth forecast for 2018 remains unchanged, at 2.0% (SWDA), driven by private consumption and a consolidation of
exports. In the first case, the consumption of households and companies is being strengthened by a recovery in their real
purchasing power, in a scenario of lower inflation. On the other hand, we estimate that exports will receive more stimulus
from the industrial sector in the US, which will allow this sector to consolidate its growth throughout 2018. By contrast,
private investment will maintain a slow dynamism as a result of the risks and uncertainty associated with the renegotiation
of NAFTA and the presidential elections to be held in July.
Figure 3.13 Components of GDP. Demand.
Change annual % 2016 vs 2017 (cumulative 1Q-3Q, SWDA)
Figure 3.14 Components of GDP. Supply.
Change annual % 2016 vs 2017 (SWDA)
Source: BBVA Research / INEGI Source: BBVA Research / INEGI
Current account: the current account deficit decreased in 2017 in response to a swing
to a significant surplus in the balance of trade for non-oil goods
After exceeding US$30 billion in 2013, the current account deficit has gradually shrunk to US$18.8 billion at the end of 2017
(Figure 3.15). In GDP terms, the current account deficit went from 2.4% to 1.9% over the same period (Figure 3.16). For
2018 we forecast that this deficit will be 1.6% of GDP.
Imports
Privateconsumption
Govmt.expend..
Investment
Exports
-4.0
-2.0
0.0
2.0
4.0
6.0
8.0
10.0
0.0 1.0 2.0 3.0 4.0 5.0
An
nu
al %
c
ha
ng
e 2
01
7
Annual % change 2016
Primarysector
Industry
Services & trade
-1.5
-1.0
-0.5
0.0
0.5
1.0
1.5
2.0
2.5
3.0
3.5
4.0
-1.0 0.0 1.0 2.0 3.0 4.0 5.0
An
nu
al %
c
ha
ng
e 2
01
7
Annual % change 2016

Mexico Economic Outlook / 1st Quarter 2018 17
Figure 3.15 Current account
(US$ million) Figure 3.16 Current account
(% of GDP)
Source: BBVA Research based on data from Mexico’s central bank Source: BBVA Research based on data from Mexico’s central bank
On analysing the behaviour of the current account deficit in the fourth quarter of 2017, we see that it declined relative to
the figure from the third quarter of 2017 (Table 3.1). This was mainly explained by the swing into surplus of the balance of
non-oil goods and, to a lesser extent, by a smaller deficit in the balance of services.
When we compare the behaviour of the current account deficit in 2017 vs. 2016, we can see that the US4.0 billion decline
in this deficit was due mainly to the significant reversal of the balance of trade in non-oil goods, which went from a deficit of
US$377 million to a surplus of US$7.5 billion (Table 3.2). This was due largely to the greater external impetus coming from
the recovery of manufacturing production in the US during 2017.
-35,000
-30,000
-25,000
-20,000
-15,000
-10,000
-5,000
0
20
06
20
07
20
08
20
09
20
10
20
11
20
12
20
13
20
14
20
15
20
16
20
17
-3
-2.5
-2
-1.5
-1
-0.5
0
20
06
20
07
20
08
20
09
20
10
20
11
20
12
20
13
20
14
20
15
20
16
20
17

Mexico Economic Outlook / 1st Quarter 2018 18
Table 3.1 Current account and its components in the third
and fourth quarters of 2017 (US$ millions) Table 3.2 Current account and its components in 2016
and 2017 (US$ millions)
Bal. = Balance Source: BBVA Research based on data from Mexico’s central bank
Bal. = Balance Source: BBVA Research based on data from Mexico’s central bank
With regard to the balance of trade, the deficit went from US$13.1 billion in 2016 to US$10.9 billion in 2017. This lower
deficit was mainly explained by the substantial reduction in the deficit of the manufacturing trade balance, which fell from
US$6.8 billion to US$0.3 billion between 2016 and 2017 (Figure 3.17). For 2018 we estimate that the trade deficit will stand
at US$13.2 billion.
Figure 3.17 Balance of trade and main components (US$
millions) Figure 3.18 Trade balances in the oil sector
(US$ millions)
Source: BBVA Research based on INEGI (National Statistics Institute) data
mm = Mexican export mix Source: BBVA Research based on INEGI (National Statistics Institute) data
Jul-Sep 17 Oct-Dec 17 Difference
(A) (B) (B-A)
Current account -5,173 -3,207 1,966
Trade bal. goods &
services-9,556 -3,882 5,674
Trade bal. goods -6,170 -1,851 4,319
Trade bal. oil goods -5,115 -5,087 27
Trade bal. non-oil
goods-1,027 3,264 4,290
Bal. of goods acquired
in ports by carriers-28 -27 1
Trade bal. services -3,387 -2,031 1,356
Bal. of primary revenues -2,767 -6,587 -3,820
Bal. of secondary
revenues7,150 7,262 112
2016 2017 Difference
(A) (B) (B-A)
Current account -22,828 -18,831 3,997
Trade bal. goods &
services-22,025 -20,693 1,332
Trade bal. goods -13,073 -10,897 2,176
Trade bal. oil goods -12,748 -18,402 -5,654
Trade bal. non-oil
goods-377 7,527 7,904
Bal. of goods acquired
in ports by carriers52 -22 -74
Trade bal. services -8,952 -9,796 -844
Bal. of primary revenues -27,330 -26,233 1,097
Bal. of secondary
revenues26,527 28,095 1,568
-25,000
-20,000
-15,000
-10,000
-5,000
0
5,000
10,000
15,000
20,000
2010 2011 2012 2013 2014 2015 2016 2017
Manufacturing Oil sector
Rest Trade balance
0
20
40
60
80
100
120
-50,000
-40,000
-30,000
-20,000
-10,000
0
10,000
20,000
30,000
40,000
50,000
60,000
2010 2011 2012 2013 2014 2015 2016 2017
Oil Natural gas
Oil derivatives Petrochemicals
Oil sector Price MM (USD, rhs)

Mexico Economic Outlook / 1st Quarter 2018 19
It is worth noting that the balance of trade in crude oil, natural gas and petroleum products has been in deficit since 2015
(historically, this balance had been in surplus). Despite the yearly increase in crude oil exports in 2017, the balance of trade
of the oil industry as a whole increased its deficit relative to 2016 (Figure 3.18). This was mainly due to the increase in the
trade deficit of petroleum products resulting from higher levels of petrol (gasoline) and diesel imports.
Public finances: the primary balance of the public sector in 2017 was positive for the
first time since 2008, while the historical balance of the financial requirements of the
public sector (SHRFSP) stood at 46.2% of GDP, thus registering its first reduction in 10
years
Total public sector budget revenue showed a real annual decrease of 3.7% in the period from January to December 2017.
It is important to mention that this year-on-year comparison includes the amount of 321.7 billion pesos from the Banco de
México operating surplus. If we excluded this component from budget revenue for the period, the real annual rate would
have been a fall of 10.0%.
If we break down total budgetary revenues into components, non-tax income (including the federal government’s petroleum
revenues) showed real annual growth of 8.3% in the period from January to December 2017. Excluding the central bank’s
operating surplus would imply a decrease of 27.1% in this component in real annual terms. There was a 0.9% real annual
decrease in tax revenues in this period. Although income tax contributed 2.1 percentage points to the real annual variation
of tax revenues, this positive contribution was more than offset by the negative contribution of the IEPS excise tax on petrol
(gasoline) and diesel of 2.5 pp to the dynamism of tax revenues. For its part, VAT also showed a negative contribution of
0.8 percentage points to this dynamism.
Income tax is an important component of tax revenues due to its weight in their overall structure (55.0% share in the period
January to December 2017). It showed a real annual variation of 4.3% in that period, which compares unfavourably with
the real annual growth of 13.5% observed in the period January to December 2016.
Public sector oil revenues accounted for 16.7% of total budget revenues in the period January to December 2017 (16.3%
during the same period in 2016). It is important to note that this revenue item fell in annual terms, with a real growth rate of
-1.1% in 2017.

Mexico Economic Outlook / 1st Quarter 2018 20
Table 3.3 Total public sector budgetary revenues from
January to December (billions of pesos) Table 3.4 Net public sector spending in January to
December (billions of pesos)
Source: BBVA Research based on SHCP (Secretariat of Finance and Public Credit) data
* Adefas: Debts from prior fiscal years Source: BBVA Research based on SHCP (Secretariat of Finance and Public Credit) data
As far as net public sector spending in the period January to December 2017 is concerned, it registered a real annual decrease
of 8.7%. This was mainly due to programmable spending (accounting for 74.4% of total net public sector spending in 2017),
with a real annual contraction of 12.7% in the period. Within programmable expenditure, capital expenditure showed a real
annual decline of 36.7%. Current expenditure meanwhile recorded a reduction of 3.1% in real annual terms in the same period.
It is important to acknowledge that federal payments, public pensions, and the financial cost of public debt continued to
place pressure on public finances in the period January-December 2017. Our own calculations show that without financial
investment and the expenditure items referred to, other spending was kept in check to a greater extent, with a real YoY
reduction of 9.9% over the period.
The real annualised reductions in this more limited expenditure item show the federal government’s efforts to maintain some
measure of financial discipline in the items more directly under its control. The federal government will have to redouble its
efforts in terms of cost containment during 2018 to achieve the goal of 0.8% of GDP for the primary surplus, especially since
public finances this time will not include the operating surplus of the Bank of Mexico due to the appreciation of the peso
observed between the end of 2016 and the end of 2017.
In 2017, the primary balance of the public sector was positive for the first time since 2008, registering an amount of 310.2
billion pesos vs. -25.0 billion pesos in 2016. The increase in the primary surplus was largely due to the federal government
balance and, to a lesser extent, the balances of the CFE (Federal Electricity Commission), ISSSTE (Institute for Security
and Social Services for State Employees) and the IMSS (Mexican Social Security Institute). If this disciplined management
of the finances of the federal government and other state bodies and enterprises continues for the rest of 2018, the target
of 0.8% of GDP will be attained for the primary surplus of the entire public sector.
2016 2017
Real %
change
Struc.
%
Total 4,845.5 4,947.2 -3.7 100.0
Federal Government 3,571.3 3,837.6 1.4 77.6
Tax 2,716.0 2,854.8 -0.9 57.7
Income tax 1,420.5 1,571.2 4.3 31.8
VAT 791.7 816.0 -2.8 16.5
Non-tax 855.3 982.8 8.3 19.9
Agencies & companies budget 328.9 361.9 3.8 7.3
State enterprises 945.3 747.7 -25.4 15.1
Pemex 481.0 389.9 -23.6 7.9
CFE 464.3 357.8 -27.3 7.2
Total 4,845.5 4,947.2 -3.7 100.0
Oil revenues 789.1 827.3 -1.1 16.7
Non-oil revenues 4,056.4 4,119.9 -4.2 83.3
2016 2017
Real %
change
Struc.
%
Total 5,347.8 5,177.6 -8.7 100.0
Programmable expenditure 4,159.3 3,852.3 -12.7 74.4
Current expenditure 2,977.3 3,059.5 -3.1 59.1
Capital expenditure 1,182.0 792.8 -36.7 15.3
Non-programmable 1,188.4 1,325.3 5.2 25.6
Contributions to states 693.8 772.1 5.0 14.9
Financial cost 473.0 533.4 6.3 10.3
Adefas* and others 21.6 19.8 -13.7 0.4

Mexico Economic Outlook / 1st Quarter 2018 21
Table 3.5 Public expenditure indicators
(Billions of pesos) Table 3.6 Financial situation of the public sector
(Billions of pesos)
Source: BBVA Research based on SHCP (Secretariat of Finance and Public Credit) data
n.s. = not significant Source: BBVA Research based on SHCP (Secretariat of Finance and Public Credit) data
How did the recovery of oil prices in 2017 contribute to the improvement in the public balance? The cumulative flow data
for January-December 2017 show that the reduction in the public deficit was mainly due to the yearly reduction in public
sector spending, and, to a lesser extent, the strong performance of both oil and non-oil revenues (including the operating
surplus of the Bank of Mexico).
Figure 3.19 Public balance and oil revenues
(Millions of pesos) Figure 3.20 Public balance and main components
(Millions of pesos)
Source: BBVA Research with data from SHCP (Secretariat of Finance and Public Credit) and Bloomberg
Change = Annual variations Source: BBVA Research based on SHCP (Secretariat of Finance and Public Credit) data
2016
Nominal Nominal Real
Real %
change
Total net
expenditure5,347.8 5,177.6 4,882.6 -8.7
Without financial
investment4,894.2 4,954.0 4,671.8 -4.5
Without financial
investment and
state funding
4,200.4 4,181.9 3,943.6 -6.1
Without financial
investment, state
funding and
pensions
3,551.8 3,475.7 3,277.7 -7.7
Without financial
investment, state
funding, pensions
and financial cost
3,078.7 2,942.4 2,774.8 -9.9
2017 2016 2017 Real % chg.
Public balance -503.8 -238.5 -55.4
Public bal. w/o prod. Investment -4.7 99.9 n.s.
Budgetary balance -502.2 -230.4 -56.7
Budgetary revenues 4,845.5 4,947.2 -3.7
Net expenditure paid 5,347.8 5,177.6 -8.7
Federal Government balance -608.8 -226.4 -64.9
Agencies & companies bal. 106.6 -4.0 n.s.
Primary balance -25.0 310.2 n.s.
Budgetary balance -29.2 302.9 n.s.
Federal Government -238.7 183.5 n.s.
Agencies and companies 209.5 119.4 -46.2
Pemex -14.7 7.5 n.s.
Other entities 224.3 111.9 -52.9
Entities under indirect control 4.2 7.2 61.8
0
20
40
60
80
100
120
-1,000,000
-500,000
0
500,000
1,000,000
1,500,000
2010 2011 2012 2013 2014 2015 2016 2017
Public balance
Oil revenues
Price of Mexican Mix (USD, rhs)
-1,000,000
-500,000
0
500,000
1,000,000
2016 2017
Non-budget bal. chge. (-) chge. net expen. paid
Non-oil revenues change Oil revenues change
Public bal. change Public balance
Mexico Economic Outlook / 1st Quarter 2018 22
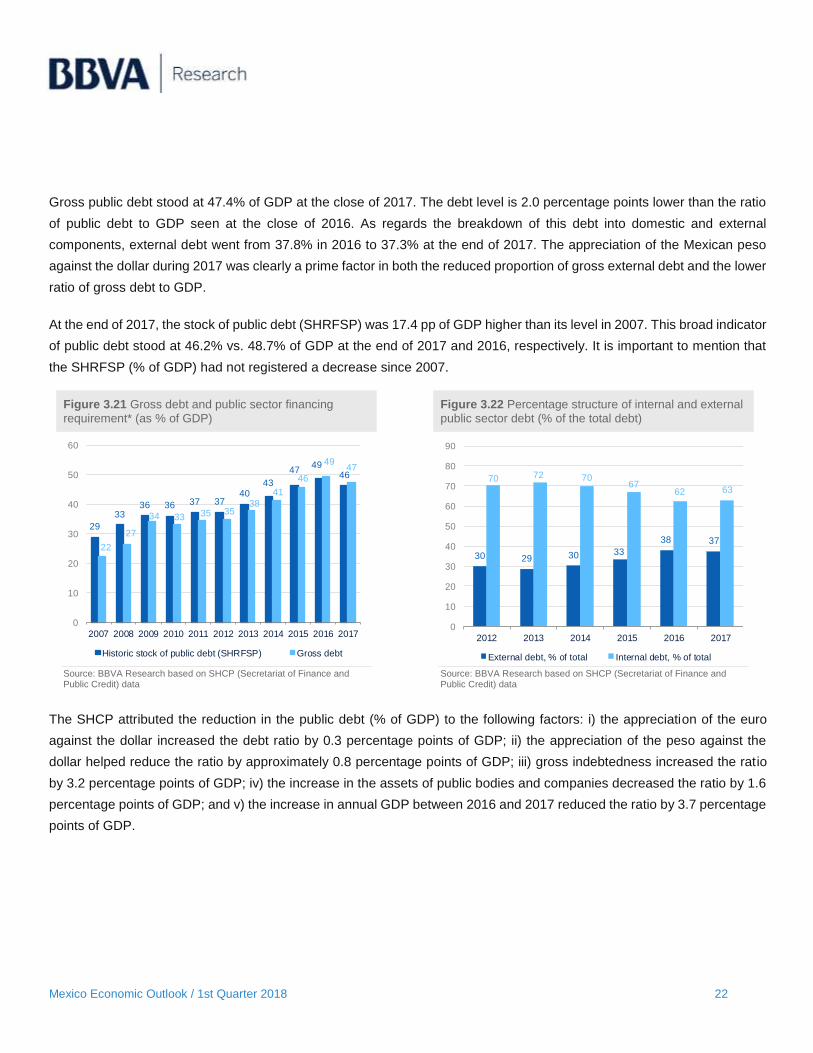
Gross public debt stood at 47.4% of GDP at the close of 2017. The debt level is 2.0 percentage points lower than the ratio
of public debt to GDP seen at the close of 2016. As regards the breakdown of this debt into domestic and external
components, external debt went from 37.8% in 2016 to 37.3% at the end of 2017. The appreciation of the Mexican peso
against the dollar during 2017 was clearly a prime factor in both the reduced proportion of gross external debt and the lower
ratio of gross debt to GDP.
At the end of 2017, the stock of public debt (SHRFSP) was 17.4 pp of GDP higher than its level in 2007. This broad indicator
of public debt stood at 46.2% vs. 48.7% of GDP at the end of 2017 and 2016, respectively. It is important to mention that
the SHRFSP (% of GDP) had not registered a decrease since 2007.
Figure 3.21 Gross debt and public sector financing
requirement* (as % of GDP) Figure 3.22 Percentage structure of internal and external
public sector debt (% of the total debt)
Source: BBVA Research based on SHCP (Secretariat of Finance and Public Credit) data
Source: BBVA Research based on SHCP (Secretariat of Finance and Public Credit) data
The SHCP attributed the reduction in the public debt (% of GDP) to the following factors: i) the appreciation of the euro
against the dollar increased the debt ratio by 0.3 percentage points of GDP; ii) the appreciation of the peso against the
dollar helped reduce the ratio by approximately 0.8 percentage points of GDP; iii) gross indebtedness increased the ratio
by 3.2 percentage points of GDP; iv) the increase in the assets of public bodies and companies decreased the ratio by 1.6
percentage points of GDP; and v) the increase in annual GDP between 2016 and 2017 reduced the ratio by 3.7 percentage
points of GDP.
29
3336 36 37 37
4043
4749
46
22
27
34 33 35 3538
41
46
4947
0
10
20
30
40
50
60
2007 2008 2009 2010 2011 2012 2013 2014 2015 2016 2017
Historic stock of public debt (SHRFSP) Gross debt
30 29 30 33
38 37
70 72 7067
62 63
0
10
20
30
40
50
60
70
80
90
2012 2013 2014 2015 2016 2017
External debt, % of total Internal debt, % of total
Mexico Economic Outlook / 1st Quarter 2018 23
4. After the temporary increase in 4Q17, inflation has
resumed its downward trend in 1Q18 as we forecast
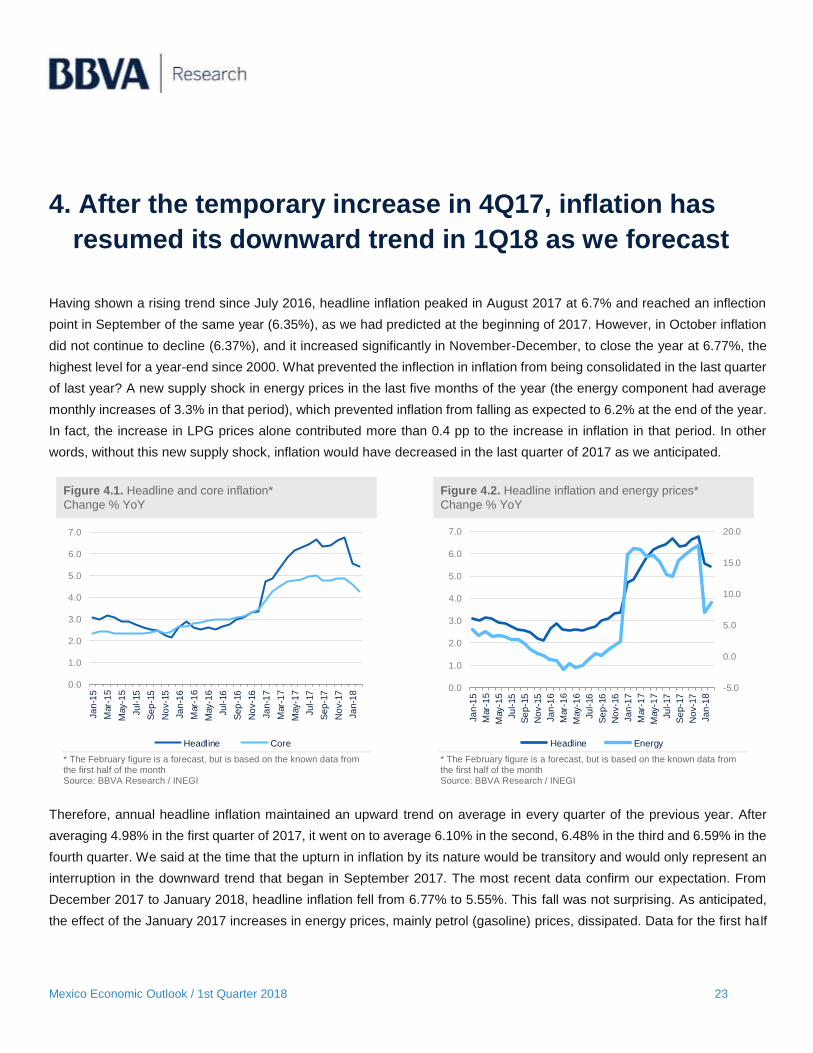
Having shown a rising trend since July 2016, headline inflation peaked in August 2017 at 6.7% and reached an inflection
point in September of the same year (6.35%), as we had predicted at the beginning of 2017. However, in October inflation
did not continue to decline (6.37%), and it increased significantly in November-December, to close the year at 6.77%, the
highest level for a year-end since 2000. What prevented the inflection in inflation from being consolidated in the last quarter
of last year? A new supply shock in energy prices in the last five months of the year (the energy component had average
monthly increases of 3.3% in that period), which prevented inflation from falling as expected to 6.2% at the end of the year.
In fact, the increase in LPG prices alone contributed more than 0.4 pp to the increase in inflation in that period. In other
words, without this new supply shock, inflation would have decreased in the last quarter of 2017 as we anticipated.
Figure 4.1. Headline and core inflation*
Change % YoY Figure 4.2. Headline inflation and energy prices*
Change % YoY
* The February figure is a forecast, but is based on the known data from the first half of the month Source: BBVA Research / INEGI
* The February figure is a forecast, but is based on the known data from the first half of the month Source: BBVA Research / INEGI
Therefore, annual headline inflation maintained an upward trend on average in every quarter of the previous year. After
averaging 4.98% in the first quarter of 2017, it went on to average 6.10% in the second, 6.48% in the third and 6.59% in the
fourth quarter. We said at the time that the upturn in inflation by its nature would be transitory and would only represent an
interruption in the downward trend that began in September 2017. The most recent data confirm our expectation. From
December 2017 to January 2018, headline inflation fell from 6.77% to 5.55%. This fall was not surprising. As anticipated,
the effect of the January 2017 increases in energy prices, mainly petrol (gasoline) prices, dissipated. Data for the first half
0.0
1.0
2.0
3.0
4.0
5.0
6.0
7.0
Ja
n-1
5
Mar-
15
May-1
5
Ju
l-15
Se
p-1
5
No
v-1
5
Ja
n-1
6
Mar-
16
May-1
6
Ju
l-16
Se
p-1
6
No
v-1
6
Ja
n-1
7
Mar-
17
May-1
7
Ju
l-17
Se
p-1
7
No
v-1
7
Ja
n-1
8
Headline Core
-5.0
0.0
5.0
10.0
15.0
20.0
0.0
1.0
2.0
3.0
4.0
5.0
6.0
7.0
Ja
n-1
5
Mar-
15
May-1
5
Ju
l-15
Se
p-1
5
No
v-1
5
Ja
n-1
6
Mar-
16
May-1
6
Ju
l-16
Se
p-1
6
No
v-1
6
Ja
n-1
7
Mar-
17
May-1
7
Ju
l-17
Se
p-1
7
No
v-1
7
Ja
n-1
8
Headline Energy
Mexico Economic Outlook / 1st Quarter 2018 24
of February seem to confirm that this trend of moderation is continuing. Annual headline inflation decreased to 5.45% in the
first half of February, and with this figure our forecast is that it will be at 5.42% at the end of the month.
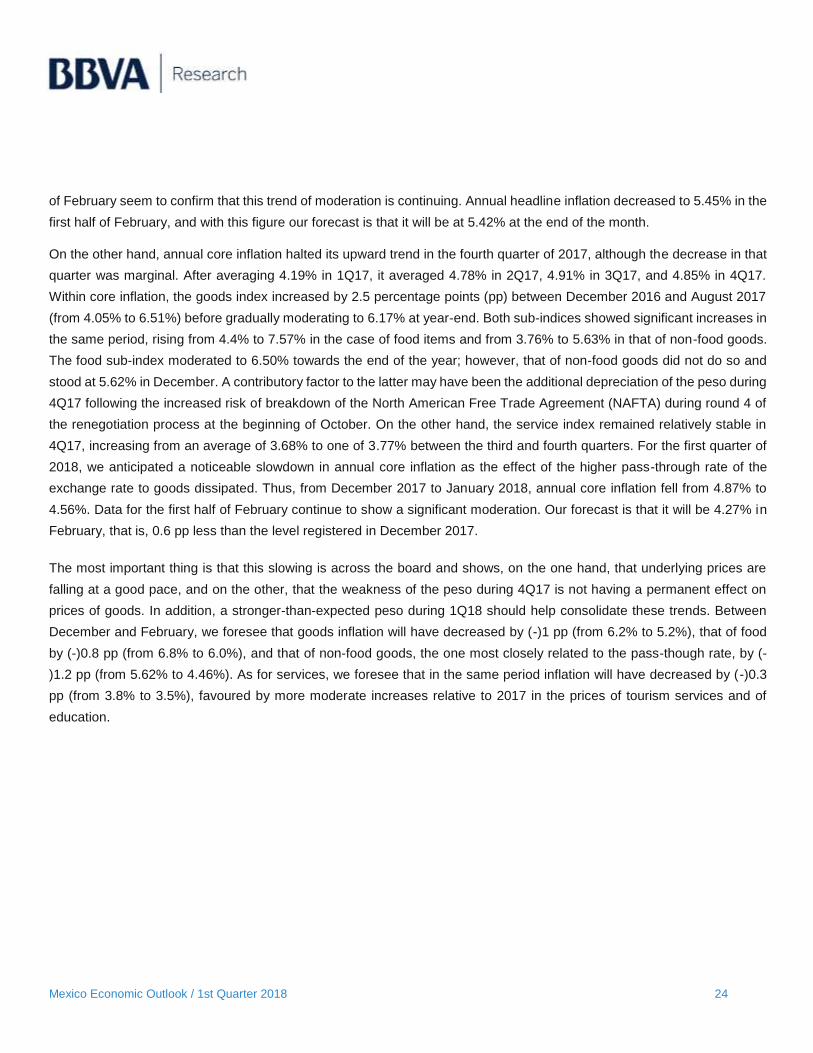
On the other hand, annual core inflation halted its upward trend in the fourth quarter of 2017, although the decrease in that
quarter was marginal. After averaging 4.19% in 1Q17, it averaged 4.78% in 2Q17, 4.91% in 3Q17, and 4.85% in 4Q17.
Within core inflation, the goods index increased by 2.5 percentage points (pp) between December 2016 and August 2017
(from 4.05% to 6.51%) before gradually moderating to 6.17% at year-end. Both sub-indices showed significant increases in
the same period, rising from 4.4% to 7.57% in the case of food items and from 3.76% to 5.63% in that of non-food goods.
The food sub-index moderated to 6.50% towards the end of the year; however, that of non-food goods did not do so and
stood at 5.62% in December. A contributory factor to the latter may have been the additional depreciation of the peso during
4Q17 following the increased risk of breakdown of the North American Free Trade Agreement (NAFTA) during round 4 of
the renegotiation process at the beginning of October. On the other hand, the service index remained relatively stable in
4Q17, increasing from an average of 3.68% to one of 3.77% between the third and fourth quarters. For the first quarter of
2018, we anticipated a noticeable slowdown in annual core inflation as the effect of the higher pass-through rate of the
exchange rate to goods dissipated. Thus, from December 2017 to January 2018, annual core inflation fell from 4.87% to
4.56%. Data for the first half of February continue to show a significant moderation. Our forecast is that it will be 4.27% in
February, that is, 0.6 pp less than the level registered in December 2017.
The most important thing is that this slowing is across the board and shows, on the one hand, that underlying prices are
falling at a good pace, and on the other, that the weakness of the peso during 4Q17 is not having a permanent effect on
prices of goods. In addition, a stronger-than-expected peso during 1Q18 should help consolidate these trends. Between
December and February, we foresee that goods inflation will have decreased by (-)1 pp (from 6.2% to 5.2%), that of food
by (-)0.8 pp (from 6.8% to 6.0%), and that of non-food goods, the one most closely related to the pass-though rate, by (-
)1.2 pp (from 5.62% to 4.46%). As for services, we foresee that in the same period inflation will have decreased by (-)0.3
pp (from 3.8% to 3.5%), favoured by more moderate increases relative to 2017 in the prices of tourism services and of
education.

Mexico Economic Outlook / 1st Quarter 2018 25
Figure 4.3. Core inflation and components*
Change % YoY Figure 4.4. Core inflation of goods and components.*
Change % YoY
* The February figure is a forecast, but is based on the known data from the first half of the month Source: BBVA Research / INEGI
* The February figure is a forecast, but is based on the known data from the first half of the month Source: BBVA Research / INEGI
Summing up, data for the first one-and-a-half months of the year (to mid-February) clearly indicate that both headline and
core inflation are moderating briskly, and suggest that, as we anticipated, the interruption in the downward trend in inflation
during 4Q17 will only be transitory. The change in the trend of inflation in 1Q18 is mainly due to the gradual fading of the
two main shocks to which it was exposed, namely the increase in energy prices in January 2017 and the considerable
additional depreciation of the peso as a result of the elections in the USA which caused an increase in the rate of pass-
through to goods, mainly during 1Q and 2Q17. In fact both the seasonality of inflation and base effects prevented us from
appreciating the moderating trend in inflation that the data were already anticipating. Figure 4.5 shows how the data already
anticipated the moderation we are now observing. As shown in Figure 4.5, after the rebound both in the series observed
and in the calculated trend, annual inflation has resumed a downward trend, which we expect will be consolidated in the
coming months.
0.0
1.0
2.0
3.0
4.0
5.0
6.0
7.0
Ja
n-1
5
Mar-
15
May-1
5
Ju
l-15
Se
p-1
5
No
v-1
5
Ja
n-1
6
Mar-
16
May-1
6
Ju
l-16
Se
p-1
6
No
v-1
6
Ja
n-1
7
Mar-
17
May-1
7
Ju
l-17
Se
p-1
7
No
v-1
7
Ja
n-1
8
Core Goods Services
0.0
1.0
2.0
3.0
4.0
5.0
6.0
7.0
8.0
Ja
n-1
5
Mar-
15
May-1
5
Ju
l-15
Se
p-1
5
No
v-1
5
Ja
n-1
6
Mar-
16
May-1
6
Ju
l-16
Se
p-1
6
No
v-1
6
Ja
n-1
7
Mar-
17
May-1
7
Ju
l-17
Se
p-1
7
No
v-1
7
Ja
n-1
8
Goods Non-food Food

Mexico Economic Outlook / 1st Quarter 2018 26
Figure 4.5 Headline inflation: observed and trend*
Change Annual % and chg. % 3m/3m annualised Figure 4.6 Inflation outlook, BBVA Research
Change % YoY
* Own calculations based on the deseasonalisation of the headline inflation index. The February figure is a forecast, it is based on the known data from the first half of the month Source: BBVA Research / INEGI
Source: BBVA Research / INEGI
The notable change of trend in inflation in the latter half of 2017 in a context of additional supply shocks to prices was
possible thanks partly to the stability of medium- and long-term inflationary expectations, which have remained at around
3.5%. Short-term (12-month) expectations barely increased, going from a fairly stable average of 3.9% between April and
November of 2017 to one of 4.0% in the past few months. This in turn has been possible thanks to the recovery of the peso
(which gave rise to the expectation that the rate of pass-through would tend to diminish, an expectation which has
materialised, as pointed out previously), the monetary policy actions of Banco de México (namely the increase in the
monetary policy rate from 3.0% to 7.5% between December 2015 and February 2018) which reinforced the prospect of the
increase in inflation being temporary and avoided inflationary expectations slipping their anchor and leading to secondary
effects on the price formation process, and to the rigidity of nominal wages which translates into contractions of real wages
avoiding generalised pressure on prices. Thus, although inflation faced supply shocks over the course of last year, a low
rate of pass-through to headline inflation, deriving mainly from the absence of second order effects, and the end of the pass-
through to core inflation will continue to be translated into a downward trend in inflation. It is important to note that both the
pass-through and the supply shocks have only translated into changes in relative prices and have not led to second-order
effects.
0
1
2
3
4
5
6
7
8
9
10
Ja
n-1
6F
eb
-16
Mar-
16
Ap
r-1
6M
ay-1
6Ju
n-1
6Ju
l-16
Au
g-1
6S
ep
-16
Oct-
16
No
v-1
6D
ec-1
6Ja
n-1
7F
eb
-17
Mar-
17
Ap
r-1
7M
ay-1
7Ju
n-1
7Ju
l-17
Au
g-1
7S
ep
-17
Oct-
17
No
v-1
7D
ec-1
7Ja
n-1
8F
eb
-18e
Observed Trend*
1.0
2.0
3.0
4.0
5.0
6.0
7.0
Ja
n-1
3
May-1
3
Se
p-1
3
Ja
n-1
4
May-1
4
Se
p-1
4
Ja
n-1
5
May-1
5
Se
p-1
5
Ja
n-1
6
May-1
6
Se
p-1
6
Ja
n-1
7
May-1
7
Se
p-1
7
Ja
n-1
8
May-1
8
Se
p-1
8
Headline Core
Forecast Forecast

Mexico Economic Outlook / 1st Quarter 2018 27
Inflation will continue to decline at a good pace; the risks to inflation continue to be biased upwards, but have moderated
Prices of goods are moderating, while inflation in services continues to be stable. At the same time, the effects of the supply
shocks on fruit and vegetable prices during 2017 will continue to gradually dissipate, as will those of the second one on
energy prices from September 2017. Thus, we expect both headline and core inflation to continue to decline at a brisk pace
throughout 2018. We expect that headline and core inflation will be below 5.0% and 4.0%, respectively, in April, and below
4.0% (at 3.8%) and 3.5% (at 3.3%), respectively, at the end of the year, below the upper limit of variability of the central
bank target.
Our forecasts are subject to both downside and upside risks, and after the deterioration in the balance of risks during 4Q17
due to the new energy price supply shock and the renewed depreciation of the peso, these moderated as the shock gradually
dissipated and after the peso strengthened at the beginning of 2018 and remained stronger than was expected for this date
in the year. In addition, inflation expectations remain anchored and Banxico is maintaining a restrictive stance for the
monetary rate. Nonetheless, we consider that the current level of the exchange rate (19.0 pesos per dollar) already factors
in most of the risks associated with a possible collapse of NAFTA, so that the additional depreciation if it should materialise
would be moderate (around 5%). This depreciation should not lead to significant pass-through to goods if we consider that
the most intense rate of pass-through was seen when the exchange rate reached 22.0 pesos per dollar and that there was
no moderation in prices after the appreciation of the peso observed in the subsequent months. All in all, the risk of a
depreciation of the peso remains, derived either from the NAFTA renegotiation process, from a possible faster-than-
expected rise in the federal funds rate with effects on the valuation of risk assets, and/or a possible upswing due to the
electoral process in Mexico. Thus, the main upward risks are associated with a possible negative evolution of the exchange
rate, although there could also be new supply shocks from an increase in the international benchmarks of energy prices
(and/or the exchange rate). Among the downside risks, the main one is again related to the exchange rate and the possibility
that the peso will experience a quick and significant appreciation if NAFTA 2.0 is reached, but there could also be a
favourable supply shock in fruit and vegetable prices (after a bad year for agricultural prices, the next one is usually
favourable). Likewise, a lower dynamism than anticipated in the rate of economic growth would favour the deceleration of
inflation, particularly in a context of contraction of real wages and with the possible effects on credit (and therefore,
consumption) of the recent additional increases in interest rates.
Mexico Economic Outlook / 1st Quarter 2018 28
The end of the rate increase cycle is approaching
After the Bank of Mexico (Banxico) announced the end of the cycle of rate hikes last June, it was expected that the inflection
of inflation would result in a prolonged pause, and that the next movement in rates would be downwards, although it would
not occur until the risks that might impact the exchange rate had dissipated. What changed? Banxico has increased the
monetary rate by 25 bps in each of the last two meetings (December and February), bringing it to a level of 7.50%. Not only
that, it has made clear in its communications that it will consider additional increases in the next meetings. Were these
increases justified? While we agree with Banxico that the balance of risks for inflation deteriorated during 4Q17, we believe
that Banxico’s approach has been excessively pre-emptive and that rates have increased more than necessary.
Although it is true that after peaking last August and starting to decline in September, annual inflation rebounded in the last
two months of the year instead of consolidating this inflection, the increase was mainly due to a shock in energy prices
(LPG) and bigger-than-expected increases in prices of fruit and vegetables. In other words it was foreseeable that such
increases would be transitory and, in fact, as we discussed in the previous section, the latest data confirm this expectation.
In addition, although inflation expectations for the end of 2018 and at 12 months increased marginally, the most important
ones for price formation and the application of monetary policy, those in the medium and long term, remained stable. Despite
the supply shocks that caused a temporary increase in inflation, our expectation and that of Banxico, the consensus of
analysts, and the market, continued at all times to be that inflation would evolve favourably. In our opinion, despite the high
levels of inflation reached at the end of 2017, with the expectation of a sharp drop at the beginning of 2018, the risks of
observing second-order effects remained limited and would continue to decrease when the fall in inflation that we are now
seeing materialised.
In addition, in our opinion, for the December meeting, the first of the last two in which Banxico increased the monetary rate,
a restrictive communication strategy was needed to make it clear that Banxico would act as soon as it became clear that
the expected decrease in inflation had not materialised. A pause with a restrictive tone seemed to us the best strategy in a
context of limited space for a more restrictive stance (with the monetary rate at that time already around 3.0%). We expected
Banxico to open the door to a possible pre-emptive increase. We were mistaken. Banxico not only increased the monetary
rate, it showed that it was very likely that it would also do so at the next meeting in February. It did so and kept a very
restrictive tone that leaves the door open for further increases, possibly one at the next meeting on 12 April.
The minutes of the meeting of 8 February suggest that Banxico remains focused on avoiding second-round effects on
inflation. The decrease in core inflation observed in January and the strengthening of the peso at the beginning of the year
due to the lower risk of collapse of NAFTA did not lead them to consider that the balance of inflation risks had improved. In
fact, in its opinion, it simply did not deteriorate further. The restrictive tone of both the press statement and the minutes
clearly indicates that Banxico is maintaining a pre-emptive approach, that it does not feel entirely comfortable with the
current relative position between Mexico and the US, given that the Federal Reserve is going to increase its reference rate

Mexico Economic Outlook / 1st Quarter 2018 29
between three and four times this year, and that it remains focused on avoiding second-order effects. While a central bank
can do little to accelerate the convergence of inflation with its target when the downward trend is temporarily interrupted by
supply shocks, Banxico decided to increase the rate twice and is considering doing so once again.
Going forward, Banxico will maintain this pre-emptive approach in the short term, particularly with possible pressures on
the MXN after the Fed increases its benchmark rate in March and/or the electoral cycle in Mexico. Despite this, the tone of
the minutes is in our opinion somewhat less restrictive than would have been expected after the tone of the press statement,
which suggests that we are close to the end of the cycle of increases. We believe that Banxico will consider increasing the
monetary rate only one more time and that after doing so it will feel more comfortable with inflation falling at a good pace,
with anchored medium- and long-term expectations, those at 12 months moderating, and year-end expectations possibly
decreasing marginally. In addition, the increases in rates already observed have brought the benchmark rate to a restrictive
level. In February, the ex ante real interest rate is already above 3.5%, a restrictive level. As time goes by, 12-month
expectations will gradually move away from 4% and approach 3.5%, which will translate into an additional rebound of the
ex ante real interest rate to levels of 4.0%. If it increases the funding rate again in April, Banxico will bring the ex ante real
interest rate to levels above 4.0% in the second half of the year (see Figure 4.7).
Figure 4.7 Ex ante real interest rate*
% Figure 4.8 BBVA Research outlook for the monetary rate.
Nominal, %
* Own calculations based on 12-month inflation expectations from the Banxico analysts’ survey and using our inflation expectations for projected data Source: BBVA Research / INEGI / Banxico
Source: BBVA Research / Banxico
Thus, once it becomes clear that inflation is evolving as anticipated by the central bank, we believe that Banxico will feel
more comfortable both with the (restrictive) level of the monetary rate and with the differential between Mexican and US
rates, so we would expect a prolonged pause, possibly extending throughout the rest of the year after reaching 7.75% in
April. In 2019, with inflation at levels below 4.0% and gradually converging with the target, Banxico will be able to calmly
0.00
1.00
2.00
3.00
4.00
5.00
6.00
7.00
8.00
9.00
Ja
n-1
5
Ap
r-1
5
Ju
l-15
Oct-
15
Ja
n-1
6
Ap
r-1
6
Ju
l-16
Oct-
16
Ja
n-1
7
Ap
r-1
7
Ju
l-17
Oct-
17
Ja
n-1
8
Ap
r-1
8
Ju
l-18
Oct-
18
Ja
n-1
9
Ap
r-1
9
Ju
l-19
Oct-
19
Observed Expected
-1.0
-0.5
0.0
0.5
1.0
1.5
2.0
2.5
3.0
3.5
4.0
4.5
Ja
n-1
5
Ap
r-1
5
Ju
l-15
Oct-
15
Ja
n-1
6
Ap
r-1
6
Ju
l-16
Oct-
16
Ja
n-1
7
Ap
r-1
7
Ju
l-17
Oct-
17
Ja
n-1
8
Ap
r-1
8
Ju
l-18
Oct-
18
Observed Expected

Mexico Economic Outlook / 1st Quarter 2018 30
consider a gradual convergence of the monetary rate with its neutral level (around 5.5%). Thus, for 2019 we continue to
forecast a 100 bps reduction in the monetary rate, but given the level at which we expect it to close 2018 (7.75%), we
anticipate that it will be at 6.75% at the end of 2019. This scenario is based not only on our forecasts for inflation, but also
on the assumption that NAFTA will not collapse, which remains the main risk for our scenario.
Domestic assets influenced recently by global factors, while idiosyncratic risks remain
latent
The economic environment is maintaining a favourable tone given the data showing increased and more balanced global
growth, the expectations of a gradual withdrawal of monetary support measures and the introduction of fiscal stimulus
measures in the US. The main question and one of the factors that is attracting the most attention among market participants
is the behaviour of US inflation, which remains at low levels considering the recovery of the labour market, which is close
to full employment. The Mexican economy is developing in this environment, which is also influenced by the renegotiation
of NAFTA and the electoral process, risk factors that have affected economic indicators in a variable manner and which
could predominate over the global environment in the coming months.
After almost ten years of the crisis triggered by the fall of Lehman Brothers, global economic growth is not only showing
clear recovery, but is more balanced between regions. The International Monetary Fund (IMF) recently revised its global
growth figures upwards from 3.7% to 3.9%, a rate that practically has not been observed since 2011, and those of most of
the world’s regions, most notably Europe and the USA, the latter driven by the recently approved tax reform. While this
extended economic growth has been the main influence behind the increased demand for risky assets, this demand has
also been underpinned by the monetary stimulus provided by the main central banks, especially the Federal Reserve. And
even though monetary normalisation by the US central bank is under way, the gradual rate at which it is expected to continue
has given certainty to market participants that the recovery will not be at risk. However, in the face of this normalisation
process, low levels of inflation in a full employment environment continue to be the main question mark among FOMC
members and, consequently, have attracted the attention of the markets due to the implications this has for the interest rate.
Proof of this could be seen in the recent bout of increased volatility in the equity markets that was triggered by an increase
in wages (See Figure 4.9). Indeed, the employment report for January in the US showed a 2.9% YoY growth in wages, a
figure above what was expected and at its highest level since the 2008 financial crisis. Given these data, there was
speculation about a possible increase in inflation and, therefore, of faster increases in interest rates by the Federal Reserve.
The effects of this episode spread rapidly to global stock markets, as well as to government bond curves. Between 1 and 5
February the VIX index went from 13% to 37%, which was reflected in a 6.1% retreat of the S&P 500, a steeper fall than
the 4.92% of the global equities benchmark (MSCI World) and the 3.15% of the emerging markets benchmark (MSCI EM).
With this movement the US markets practically wiped out the gains obtained during 2018. On the Mexican stock market,
the fall up to 6 February was 2.5%. The significant magnitude of these falls was influenced more by technical market issues
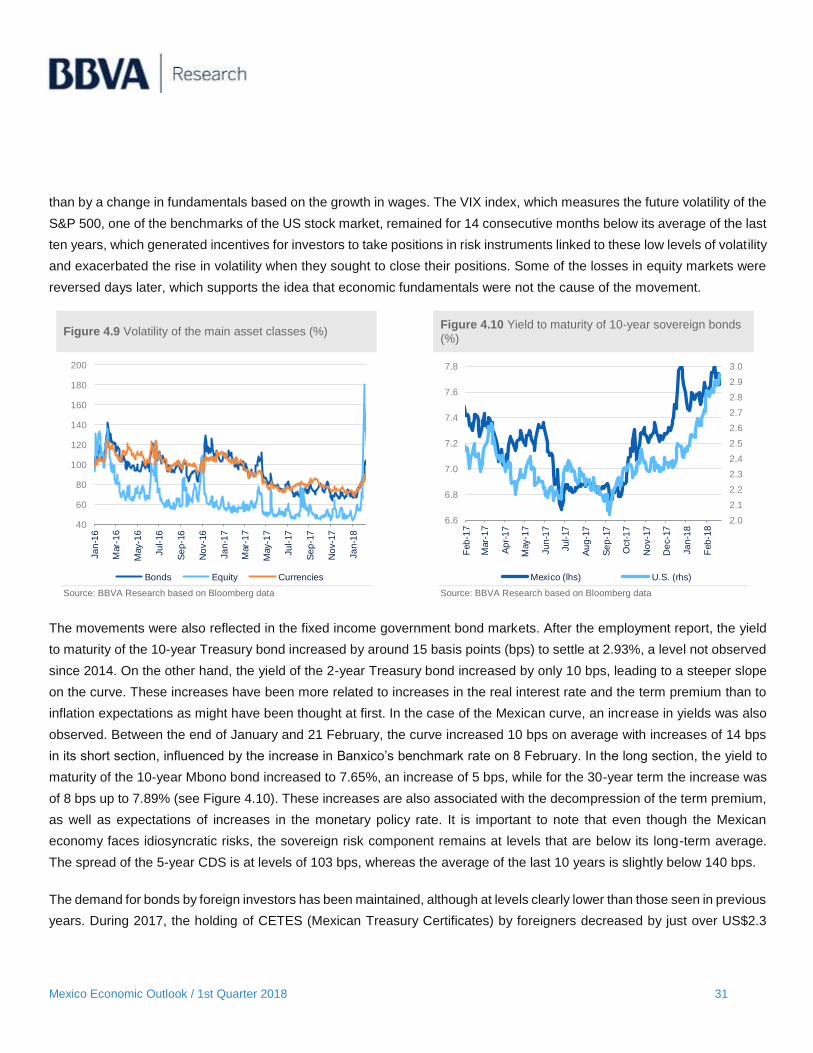
Mexico Economic Outlook / 1st Quarter 2018 31
than by a change in fundamentals based on the growth in wages. The VIX index, which measures the future volatility of the
S&P 500, one of the benchmarks of the US stock market, remained for 14 consecutive months below its average of the last
ten years, which generated incentives for investors to take positions in risk instruments linked to these low levels of volatility
and exacerbated the rise in volatility when they sought to close their positions. Some of the losses in equity markets were
reversed days later, which supports the idea that economic fundamentals were not the cause of the movement.
Figure 4.9 Volatility of the main asset classes (%) Figure 4.10 Yield to maturity of 10-year sovereign bonds
(%)
Source: BBVA Research based on Bloomberg data Source: BBVA Research based on Bloomberg data
The movements were also reflected in the fixed income government bond markets. After the employment report, the yield
to maturity of the 10-year Treasury bond increased by around 15 basis points (bps) to settle at 2.93%, a level not observed
since 2014. On the other hand, the yield of the 2-year Treasury bond increased by only 10 bps, leading to a steeper slope
on the curve. These increases have been more related to increases in the real interest rate and the term premium than to
inflation expectations as might have been thought at first. In the case of the Mexican curve, an increase in yields was also
observed. Between the end of January and 21 February, the curve increased 10 bps on average with increases of 14 bps
in its short section, influenced by the increase in Banxico’s benchmark rate on 8 February. In the long section, the yield to
maturity of the 10-year Mbono bond increased to 7.65%, an increase of 5 bps, while for the 30-year term the increase was
of 8 bps up to 7.89% (see Figure 4.10). These increases are also associated with the decompression of the term premium,
as well as expectations of increases in the monetary policy rate. It is important to note that even though the Mexican
economy faces idiosyncratic risks, the sovereign risk component remains at levels that are below its long-term average.
The spread of the 5-year CDS is at levels of 103 bps, whereas the average of the last 10 years is slightly below 140 bps.
The demand for bonds by foreign investors has been maintained, although at levels clearly lower than those seen in previous
years. During 2017, the holding of CETES (Mexican Treasury Certificates) by foreigners decreased by just over US$2.3
40
60
80
100
120
140
160
180
200
Ja
n-1
6
Mar-
16
May-1
6
Ju
l-16
Se
p-1
6
No
v-1
6
Ja
n-1
7
Mar-
17
May-1
7
Ju
l-17
Se
p-1
7
No
v-1
7
Ja
n-1
8
Bonds Equity Currencies
2.0
2.1
2.2
2.3
2.4
2.5
2.6
2.7
2.8
2.9
3.0
6.6
6.8
7.0
7.2
7.4
7.6
7.8
Feb
-17
Mar-
17
Ap
r-1
7
May-1
7
Ju
n-1
7
Ju
l-17
Au
g-1
7
Se
p-1
7
Oct-
17
No
v-1
7
De
c-1
7
Ja
n-1
8
Feb
-18
Mexico (lhs) U.S. (rhs)
Mexico Economic Outlook / 1st Quarter 2018 32
billion, influenced by the fewer arbitrage opportunities that have been registered since the beginning of the Fed's monetary
normalisation cycle. Regarding bonds, foreigners' holdings increased by around US$5.5 billion, with a significant fall during
the last two months of the year in line with the higher interest rates. Thus, in 2017, holdings of nominal fixed rate instruments
by foreigners grew by around US$3.17 billion, a positive figure, but a long way below the levels of over US$30 billion reached
in 2013.
The currency market was the least affected by the recent bout of volatility. Between 1 and 6 February, there was a slight
increase in demand for safe haven currencies, but this quickly faded with the communication by the main central banks in
which they reiterated their position of gradual increases in interest rates. In fact, the implied probabilities in the futures
market of observing a rise of 75 or 100 bps in the federal funds rate during 2018 remained at around 35% and 15%
respectively.
In the particular case of the Mexican peso, it has been more influenced recently by an environment of weakness in the
dollar than by idiosyncratic risks. The NAFTA renegotiation process is showing little progress on the most controversial
issues such as rules of origin for the automotive sector, the termination clause and dispute resolution mechanisms, and this
has increased the chances of the process being delayed relative to the initial calendar which allowed for seven rounds of
negotiations to be concluded next March. It should be noted that although the possibility of a NAFTA 2.0 has diminished,
so too has the possibility of a US withdrawal from the agreement. Indeed, President Trump's stance has moderated recently
in view of the costs that a collapse of NAFTA could have among Republican voters in primarily agricultural states, above all
given the proximity of the upcoming mid-term elections in November. Thus, unlike last October when the fourth round of
negotiations took place, there has been little news regarding NAFTA and, as a result, few movements in the exchange rate
(See Figure 4.11). On the other hand, it still seems early for the level of the exchange rate to incorporate the electoral
element. To judge from what we saw in 2006 and 2012, volatility increases clearly around two months before election day,
which in this case will be on 1 July. This assertion is further supported by the implied volatility indicator, which shows a clear
upswing in the 3-month forward node, which coincides with the election date (see Figure 4.12). Thus, with the expectation
of an impasse in the renegotiation of NAFTA and an electoral process that has not yet been incorporated into prices, the
exchange rate has been favoured by an environment of weakness of the dollar, which has lost 2.3% and 2.6% respectively
compared to the emerging and developed country currency benchmarks so far in 2018. In fact, the Mexican currency is the
second most appreciated currency so far this year (5.5%), exceeded only by the South African rand (6.0%).

Mexico Economic Outlook / 1st Quarter 2018 33
Figure 4.11 Index of searches for "NAFTA" against the
exchange rate* (index, pesos to the dollar) Figure 4.12 Implied volatility of the exchange rate
(%)
* The index corresponds to the four-week moving average of worldwide Google searches for the word "NAFTA" Source: BBVA Research based on data from Google Trends and Bloomberg
Source: BBVA Research based on Bloomberg data
In summary, Mexican assets have been influenced more in recent times by the global environment than by the evolution of
idiosyncratic risks. Nevertheless, these risks remain latent and it is expected that in the coming months they will explain to
a greater extent the volatility of domestic financial variables, particularly as regards the electoral process. We believe that
in a scenario in which the NAFTA negotiations are postponed it will be difficult for the peso to appreciate consistently and
bring the dollar to levels below 18 pesos towards the end of the year. This scenario is very different from the signing of a
new and favourable agreement, which could take the dollar down below 17.5 pesos. On the other hand, interest rates will
maintain an upward trend, which could also be exacerbated closer to the election. In particular, the yield to maturity of the
10-year sovereign bond is expected to close 2019 at around 7.6% on average.
16.5
17.0
17.5
18.0
18.5
19.0
19.5
20.0
20
25
30
35
40
45
50
55
60
65
Mar-
17
Ap
r-1
7
Ap
r-1
7
May-1
7
Ju
n-1
7
Ju
n-1
7
Ju
l-17
Au
g-1
7
Au
g-1
7
Se
p-1
7
Oct-
17
Oct-
17
No
v-1
7
De
c-1
7
De
c-1
7
Ja
n-1
8
Feb
-18
NAFTA index (lhs) MXN (rhs)
4thround
5thround
Lack of liquidity
11.0
11.5
12.0
12.5
13.0
13.5
14.0
14.5
15.0
15.5
1M 3M 6M 9M 1Y
January February

Mexico Economic Outlook / 1st Quarter 2018 34
5. Indicators and forecasts
Table 5.1 Macroeconomic forecasts: Gross Domestic Product
(YoY growth rate, %) 2015 2016 2017 2018 2019
United States 2.9 1.5 2.3 2.6 2.5
EMU 2.0 1.8 2.4 2.2 1.8
Germany 1.5 1.9 2.6 2.4 1.8
France 1.0 1.1 1.9 1.9 1.6
Italy 0.9 1.1 1.6 1.5 1.3
Spain 3.4 3.3 3.1 2.5 2.3
UK 2.3 1.9 1.4 1.2 1.4
Latin America* -0.1 -1.0 1.1 1.7 2.5
Mexico 3.3 2.9 1.9 2.0 2.2
Brazil -3.5 -3.4 1.0 2.1 3.0
Eagles** 4.8 5.2 5.4 5.4 5.5
Turkey 6.1 3.2 7.0 4.5 4.3
Asia-Pacific 5.6 5.6 5.6 5.5 5.5
Japan 1.4 0.9 1.4 1.0 1.2
China 6.9 6.7 6.7 6.3 6.0
Asia (exc. China) 4.6 4.7 4.6 4.7 5.0
World 3.4 3.3 3.7 3.8 3.8
* Argentina, Brazil, Chile, Colombia, Mexico, Peru and Venezuela. ** Saudi Arabia, Bangladesh, Brazil, China, Philippines, India, Indonesia, Irak, Mexico, Nigeria, Pakistan, Russia, Thailand and Turkey. Forecasts closing date: 12 January 2018. Source: BBVA Research & IMF

Mexico Economic Outlook / 1st Quarter 2018 35
Table 5.2 United States indicators and forecasts
1: Residential investment 2: Fiscal balance (% of GDP) Note: Bold figues are forecast
Source: BBVA Research
Table 5.3 Mexico indicators and forecasts
3: Accumulated, last 12 months bd: billions of dollars dpb: dollars per barrel *FRPS: Financial Requirements of the Public Sector na: not available Note: Bold figures are forecast Source: BBVA Research with Census Bureau, Federal Reserve, Bureau of Labor Statistics, Banxico, INEGI & SHCP data
Macroeconomic Indicators 2016 2017 2018 2019 1H17 2H17 3H17 4H17 1H18 2H18 3H18 4H18
GDP (real % change) 1.5 2.3 2.6 2.5 1.2 3.1 3.2 2.6 2.9 2.4 2.0 2.0
Personal consumption (real % change) 2.7 2.7 2.7 2.4 1.9 3.3 2.2 3.8 2.6 2.5 2.2 2.4
Government consumption (real % change) 0.8 0.1 0.8 0.7 -0.6 -0.2 0.7 2.9 0.2 0.5 0.4 0.6
Gross fixed investment (real % change) -1.6 3.2 4.3 4.8 -1.2 3.9 7.3 3.6 3.1 5.4 4.3 3.5
Construction1 5.5 1.7 2.7 2.1 11.1 -7.3 -4.7 11.7 2.6 3.9 2.2 1.6
Industrial production (real annual % change) -1.2 1.8 2.8 2.5 1.6 5.6 -1.0 5.7 2.1 2.5 3.0 2.1
Current account balance (% of GDP) -2.4 -2.3 -2.5 -2.6 -2.4 -2.6 -2.1 -2.4 -2.4 -2.5 -2.5 -2.6
Final annual inflation 2.1 2.1 2.6 2.1 0.5 3.9 2.5 4.5 1.7 2.1 2.0 2.1
Average annual inflation 1.3 2.1 2.8 2.1 0.1 2.1 3.3 4.4 2.1 2.1 2.0 2.1
Primary fiscal balance2 (% of GDP) -3.1 -3.6 -3.6 -5.2 -4.2 -4.2 -2.8 -3.3 -2.6 -3.7 -4.0 -4.4
2016 2017 2018 2019 1H17 2H17 3H17 4H17 1H18 2H18 3H18 4H18
Economic Activity
GDP (seasonally-adjusted series)
Real annual % change 2.7 2.3 2.0 2.2 2.9 3.1 1.7 1.5 1.5 2.0 2.7 2.5
Per inhabitant (US dollars) 8,782 9,413 9,932 11,082 8,752 9,443 9,877 9,581 9,618 9,147 10,225 10,737
US$ billions 1,073 1,162 1,239 1,395 1,075 1,166 1,222 1,187 1,193 1,141 1,277 1,343
Inflation (average, %)
Headline 2.82 6.04 4.62 3.58 4.98 6.10 6.48 6.59 5.39 4.71 4.35 4.04
Core 2.97 4.68 3.84 3.24 4.19 4.78 4.91 4.85 4.32 3.86 3.72 3.46
Financial Markets (eop, %)
Interest rates
Bank funding 4.29 6.75 7.67 7.29 6.17 6.75 7.00 7.08 7.42 7.75 7.75 7.75
28-day Cetes 4.33 6.69 7.63 7.25 6.07 6.63 6.97 7.07 7.39 7.71 7.71 7.71
28-day TIIE 4.58 7.06 8.01 7.64 6.40 7.02 7.38 7.42 7.75 8.09 8.09 8.09
10-year Bond (%, average) 6.22 7.18 7.56 7.38 7.26 7.11 6.85 7.30 7.55 7.80 7.45 7.50
Exchange rate (average)
Pesos per dollar 18.7 18.8 18.9 17.8 19.9 18.6 17.8 18.8 19.2 20.2 18.3 17.8
Public Finances
*FRPS (% of GDP) -2.8 -1.1 -2.5 -2.5 -1.1 -2.5
External Sector3
Trade balance (US$ billions) -13.1 -10.9 -13.2 -14.4 -2.8 -0.1 -6.1 -1.8 -2.2 -1.3 -5.5 -4.2
Current account (US$ billions) -22.7 -18.8 -20.3 -21.2 -10.2 -0.2 -5.2 -3.2 -4.9 -1.5 -6.5 -7.4
Current account (% of GDP) -2.2 -1.9 -1.6 -1.5 -3.9 -0.1 -1.7 -1.1 -1.6 -0.5 -2.0 -2.2
Employment
Formal Private (annual % change) 3.8 4.4 4.1 4.0 4.3 4.3 4.4 4.4 4.3 4.2 4.1 4.0
Open Unemployment Rate(% active pop.) 3.9 3.4 3.5 3.6 3.4 3.4 3.5 3.4 3.4 3.5 3.5 3.5
Mexico Economic Outlook / 1st Quarter 2018 36
DISCLAIMER
This document and the information, opinions, estimates and recommendations expressed herein, have been prepared by Banco Bilbao Vizcaya Argentaria,
S.A. (hereinafter called “BBVA”) to provide its customers with general information regarding the date of issue of the report and are subject to changes
without prior notice. BBVA is not liable for giving notice of such changes or for updating the contents hereof.
This document and its contents do not constitute an offer, invitation or solicitation to purchase or subscribe to any securities or other instruments, or to
undertake or divest investments. Neither shall this document nor its contents form the basis of any contract, commitment or decision of any kind.
Investors who have access to this document should be aware that the securities, instruments or investments to which it refers may not be
appropriate for them due to their specific investment goals, financial positions or risk profiles, as these have not been taken into account to
prepare this report. Therefore, investors should make their own investment decisions considering the said circumstances and obtaining such specialized
advice as may be necessary. The contents of this document is based upon information available to the public that has been obtained from sources
considered to be reliable. However, such information has not been independently verified by BBVA and therefore no warranty, either express or implicit,
is given regarding its accuracy, integrity or correctness. BBVA accepts no liability of any type for any direct or indirect losses arising from the use of the
document or its contents. Investors should note that the past performance of securities or instruments or the historical results of investments do not
guarantee future performance.
The market prices of securities or instruments or the results of investments could fluctuate against the interests of investors. Investors should
be aware that they could even face a loss of their investment. Transactions in futures, options and securities or high-yield securities can involve
high risks and are not appropriate for every investor. Indeed, in the case of some investments, the potential losses may exceed the amount of
initial investment and, in such circumstances, investors may be required to pay more money to support those losses. Thus, before undertaking
any transaction with these instruments, investors should be aware of their operation, as well as the rights, liabilities and risks implied by the
same and the underlying stocks. Investors should also be aware that secondary markets for the said instruments may be limited or even not
exist.
BBVA or any of its affiliates, as well as their respective executives and employees, may have a position in any of the securities or instruments referred to,
directly or indirectly, in this document, or in any other related thereto; they may trade for their own account or for third-party account in those securities,
provide consulting or other services to the issuer of the aforementioned securities or instruments or to companies related thereto or to their shareholders,
executives or employees, or may have interests or perform transactions in those securities or instruments or related investments before or after the
publication of this report, to the extent permitted by the applicable law.
BBVA or any of its affiliates´ salespeople, traders, and other professionals may provide oral or written market commentary or trading strategies to its clients
that reflect opinions that are contrary to the opinions expressed herein. Furthermore, BBVA or any of its affiliates’ proprietary trading and investing
businesses may make investment decisions that are inconsistent with the recommendations expressed herein. No part of this document may be (i) copied,
photocopied or duplicated by any other form or means (ii) redistributed or (iii) quoted, without the prior written consent of BBVA. No part of this report may
be copied, conveyed, distributed or furnished to any person or entity in any country (or persons or entities in the same) in which its distribution is prohibited
by law. Failure to comply with these restrictions may breach the laws of the relevant jurisdiction.
This document is provided in the United Kingdom solely to those persons to whom it may be addressed according to the Financial Services and Markets
Act 2000 (Financial Promotion) Order 2001 and it is not to be directly or indirectly delivered to or distributed among any other type of persons or entities.
In particular, this document is only aimed at and can be delivered to the following persons or entities (i) those outside the United Kingdom, (ii) those with
expertise regarding investments as mentioned under Section 19(5) of Order 2001, (iii) high net worth entities and any other person or entity under Section
49(1) of Order 2001 to whom the contents hereof can be legally revealed.
The remuneration system concerning the analyst/s author/s of this report is based on multiple criteria, including the revenues obtained by BBVA and,
indirectly, the results of BBVA Group in the fiscal year, which, in turn, include the results generated by the investment banking business; nevertheless,
they do not receive any remuneration based on revenues from any specific transaction in investment banking.
BBVA Bancomer and the rest of BBVA Group who are not members of FINRA (Financial Industry Regulatory Authority), are not subject to the rules of
disclosure for these members.
“BBVA Bancomer, BBVA and its subsidiaries, among which is BBVA Global Markets Research, are subject to the Corporate Policy Group in
the field of BBVA Securities Markets. In each jurisdiction in which BBVA is active in the Securities Markets, the policy is complemented by an
Internal Code of Conduct which complements the policy and guidelines in conjunction with other established guidelines to prevent and avoid
conflicts of interest with respect to recommendations issued by analysts among which is the separation of areas. Corporate Policy is available
at: www.bbva.com / Corporate Governance / Conduct in Securities Markets”.
Mexico Economic Outlook / 1st Quarter 2018 37
This report has been produced by the macroeconomic unit of Mexico:
Chief Economist Carlos Serrano [email protected]
Javier Amador [email protected]
Iván Martínez [email protected]
Arnulfo Rodríguez [email protected]
Saidé A. Salazar [email protected]
BBVA Research
Group Chief Economist Jorge Sicilia Serrano
Macroeconomic Analysis Rafael Doménech [email protected]
Global Macroeconomic Scenarios Miguel Jiménez [email protected]
Global Financial Markets Sonsoles Castillo [email protected]
Long Term Global Modelling and Analysis
Julián Cubero [email protected]
Innovation and Processes Oscar de las Peñas [email protected]
Financial Systems and Regulation Santiago Fernández de Lis [email protected]
Digital Regulation and Trends Álvaro Martín [email protected]
Regulation María Abascal [email protected]
Financial Systems Olga Cerqueira [email protected]
Spain and Portugal Miguel Cardoso [email protected]
United States Nathaniel Karp [email protected]
Mexico
Carlos Serrano [email protected]
Middle East, Asia and Big Data Álvaro Ortiz [email protected]
Turkey Álvaro Ortiz [email protected]
Asia Le Xia [email protected]
South America Juan Manuel Ruiz [email protected]
Argentina Gloria Sorensen [email protected]
Chile Jorge Selaive [email protected]
Colombia Juana Téllez [email protected]
Peru Hugo Perea [email protected]
Venezuela Julio Pineda [email protected]
CONTACT DETAILS: BBVA Research – BBVA Bancomer: Paseo de la Reforma 510, Colonia Juárez, C.P. 06600 México D.F., México
e-mail: [email protected] - [email protected] www.bbvaresearch.com