mexican apple production comes back, pear imports … gain publications/fresh deciduous... ·...
TRANSCRIPT

THIS REPORT CONTAINS ASSESSMENTS OF COMMODITY AND TRADE ISSUES MADE BY
USDA STAFF AND NOT NECESSARILY STATEMENTS OF OFFICIAL U.S. GOVERNMENT
POLICY
Date:
GAIN Report Number:
Approved By:
Prepared By:
Report Highlights:
Apple production in Mexico for MY 2013/14 (August/July) is forecast at 605,000 metric tons (MT), a
record crop due to better weather. Total pear imports are forecast to increase 11% for MY 2013/14
(July/June). Total Mexican table grape production for MY 2013/14 (May/April) is forecast lower at
261,000 MT, due to a cooler winter and spring in Sonora. Grape exports are expected to decline due to
a delay in the start of harvest. The United States remains the major supplier of deciduous fruits to
Mexico.
Commodities:
Grapes, Table, Fresh
Pears, Fresh
Apples, Fresh
Dulce Flores
Dan Berman
Mexican Apple Production Comes Back, Pear Imports Rise,
Grape Exports Decline
Fresh Deciduous Fruit Annual
MX3082
11/25/2013
Required Report - public distribution
MX3082 Mexico Fresh Deciduous Fruit Annual Page 2
FRESH APPLES
PRODUCTION
Apple production in Mexico for MY 2013/14 (August/July) is forecast at 605,000 metric tons (MT), a
record crop compared to last year due to better weather and higher yields. Average yields are forecast at
about 10.34 MT/hectare (Ha). The state of Chihuahua, the main apple producer, recovered from last
year’s low of 10.4 million 20 kilograms boxes to an expectedly high production of 20 million boxes or
about 400,000 MT. Yields in Chihuahua are usually the highest in the country and average between 15-
19 MT/ha. The state of Durango, the second largest production state, also recovered and production is
estimated at 71,200 MT. The state of Coahuila, the third ranked apple producer, had hail damage during
July 2013 and production is estimated at about 32,000 MT. The state of Puebla, the fourth largest apple
producing state is expected to have 35,000 MT of apple production.
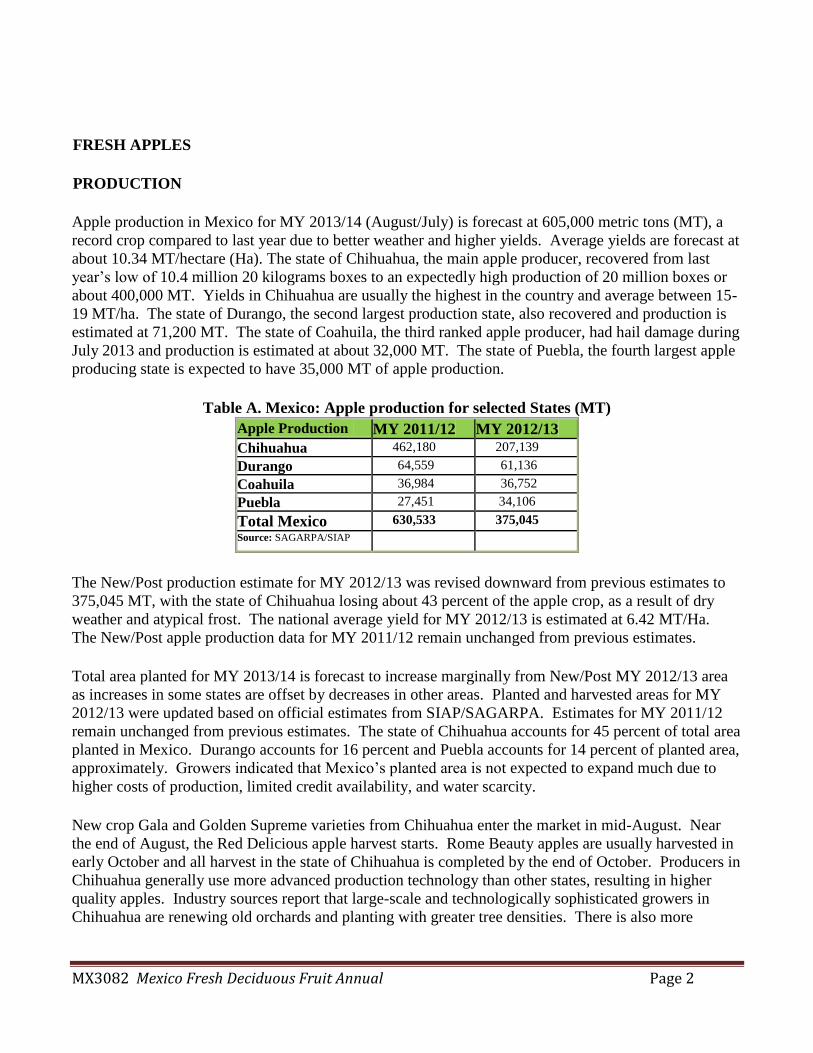
Table A. Mexico: Apple production for selected States (MT)
Apple Production MY 2011/12 MY 2012/13 Chihuahua 462,180 207,139
Durango 64,559 61,136
Coahuila 36,984 36,752
Puebla 27,451 34,106
Total Mexico 630,533 375,045 Source: SAGARPA/SIAP
The New/Post production estimate for MY 2012/13 was revised downward from previous estimates to
375,045 MT, with the state of Chihuahua losing about 43 percent of the apple crop, as a result of dry
weather and atypical frost. The national average yield for MY 2012/13 is estimated at 6.42 MT/Ha.
The New/Post apple production data for MY 2011/12 remain unchanged from previous estimates.
Total area planted for MY 2013/14 is forecast to increase marginally from New/Post MY 2012/13 area
as increases in some states are offset by decreases in other areas. Planted and harvested areas for MY
2012/13 were updated based on official estimates from SIAP/SAGARPA. Estimates for MY 2011/12
remain unchanged from previous estimates. The state of Chihuahua accounts for 45 percent of total area
planted in Mexico. Durango accounts for 16 percent and Puebla accounts for 14 percent of planted area,
approximately. Growers indicated that Mexico’s planted area is not expected to expand much due to
higher costs of production, limited credit availability, and water scarcity.
New crop Gala and Golden Supreme varieties from Chihuahua enter the market in mid-August. Near
the end of August, the Red Delicious apple harvest starts. Rome Beauty apples are usually harvested in
early October and all harvest in the state of Chihuahua is completed by the end of October. Producers in
Chihuahua generally use more advanced production technology than other states, resulting in higher
quality apples. Industry sources report that large-scale and technologically sophisticated growers in
Chihuahua are renewing old orchards and planting with greater tree densities. There is also more

MX3082 Mexico Fresh Deciduous Fruit Annual Page 3
investment in cold storage facilities using controlled atmosphere technology and hail protection.
According to growers, about 40 percent of the apple area in Chihuahua utilizes advanced technology.
In order to remain competitive, producers in Chihuahua continue replacing a number of older orchards
with higher yielding (about 80 MT/ha) and higher density apple trees (1,000 trees/ha or more). In
addition, they are using advanced technology and newer irrigation systems. According to data, almost
43 percent of the area in Mexico is planted with the Golden Delicious variety and 34 percent with the
Red Delicious variety. For the state of Chihuahua, almost 58 percent of the area is planted with the
Golden Delicious variety and 34 percent with the Red Delicious variety. The Gala variety comprises
about five percent of the total Chihuahua planted area but continues to gain ground. High-density
varieties account for approximately 30 percent of Chihuahua’s planted area. The remainder of the apple
producing area is planted at more traditional spacing of 350-400 trees per hectare. Most areas in
Chihuahua and Durango are irrigated.
Costs of production typically range from U.S. $2,350 to $3,460 per hectare. Production costs will tend
towards the higher end of the estimate (or surpass it) if growers have frost protection equipment and
new irrigation systems. According to producers, electricity, fuel, and packing costs (the last of which
depend on foreign inputs like imported boxes and wax cartons), continue to rise compared to previous
years.
According to the National Service of Market Information (SNIIM), wholesale prices during September
2013 were lower compared to prices in 2012. Domestic Golden Delicious apples were 24.8 percent
lower in peso terms in September 2013 or about US$1.56 per kg (MX$20.54/kg), while in September
2012 prices were on average US$2.11 per kg (MX$27.44/kg). Domestic Red Delicious apple
producers’ prices were 33.4 percent lower in peso terms in September 2013 or about US$1.34 per kg
(MX$17.73/kg) while in September 2012 prices were on average US$2.05 (MX$26.63/kg). Lower
prices are a result of a higher production of apples of smaller sizes.
CONSUMPTION
Apple consumption for MY 2013/14 is forecast to increase compared to New/Post estimates for MY
2012/13 due to expected higher domestic supplies at lower prices which will increase demand.
New/Post apple consumption estimates for MY 2012/13 were revised downward from previous
estimates as domestic and imported apple prices were higher than expected, thus reducing demand.
Apple consumption for MY 2011/12 remains unchanged.
TRADE
New/Post estimates for apple imports for MY 2013/14 are forecast to be lower compared to MY
2012/13 as there are more apples from the domestic crop at lower prices. However, prices for imported
apples are expected to also be low as there are more apples in the international market compared to the
previous year. Traders indicate that demand will still be strong as end consumers are used to having
apples year round. As usual, most imports will come from the U.S. west coast.
New/Post estimates for apple imports for MY 2012/13 were revised downward from previous estimates
to 265,490 MT but still represent a record in apple imports. Despite higher prices for apples, demand

MX3082 Mexico Fresh Deciduous Fruit Annual Page 4
was strong as the domestic crop was down due to drought and frost. Apple imports for MY 2011/12
remain unchanged from previous estimates.
More than 90 percent of Mexico’s apple imports originate from the United States and it is expected that
this trend will continue. Washington-origin apples account for 85% of U.S. exports with California,
Michigan, and Virginia supplying the remainder. California increased apple exports from 21,750 boxes
in MY 2011/12 to 38,340 boxes in MY 2012/13. U.S. Red and Golden Delicious varieties continue to
account for the bulk of U.S. apples exported to Mexico, however the Gala variety is also becoming
important. Apple varieties like Rome Beauty, Jonagold, and Pink Lady are being imported at much
smaller quantities, based on consumer preferences. While Mexican consumers like the size and color of
U.S. apples, Mexican apples are considered sweeter. The U.S. apple industry will continue to face
strong competition in Mexico from other countries such as Chile and Canada.
Mexican apple exports are almost residual and Belize has been the main importer for the last few years.
Belize imported 257 MT during MY 2010/11 and 316 MT during MY 2011/12, however, for MY
2012/13 imports were lower as Mexican production was also low. Mexican apple exports to the U.S.
would have to come from certain fruit fly free counties recognized by APHIS in the state of Chihuahua.
POLICY
The NAFTA tariffs for U.S. and Canadian apples were completely lifted on January 1, 2003, bringing
the duty to zero. Retaliatory duties imposed on imported U.S. apples of 10 percent were removed on
October 14, 2011, which resulted in demand growth. Under the Chile-Mexico Free Trade Agreement,
imported Chilean apples began to enter duty free as of January 1, 2006. Apples from other countries are
subject to a 20-percent duty. The Mexican government has established protocols and agreements with
the Chinese government and initial test shipments have begun. Among the products to be imported from
China are fruits and vegetables, including apples. The domestic industry does not anticipate significant
competition since the apple variety from China, Fuji, is still not widely accepted by domestic consumers.
MARKETING
The U.S. remains the leading provider of deciduous fruit in Mexico, such as apples, pears and grapes, as
local production is not sufficient to address the domestic demand. The U.S. apple industry’s continued
marketing and promotional efforts have significantly contributed to the dominant position that U.S.
apples have in Mexico. Strong U.S. apple import months are from January to May, although the United
States starts shipping in smaller volumes in November and continues to have a presence from June
through October. The retail market remains the primary channel of distribution for fresh apples in
Mexico, representing around 95% of fresh apples consumed in the country. The food processing
industry in Mexico is likely to increase consumption for apples as healthy trends lead to higher demand
for naturally flavored fruit juices and cocktails. During the 2012-2013 season, four varieties continued
to dominate the market with 94% of the total volume: 43% Red Delicious, 33% Golden Delicious, 18%
Gala, 3% Granny Smith, 1% Fuji and 2% other varieties.
Mexican consumers still prefer the Red and Golden Delicious varieties, and have developed a strong
preference for the Gala variety positioning it as the third preferred variety. Another variety which has
forged itself a market niche is Granny Smith, which has been positioned as an ideal apple to be

MX3082 Mexico Fresh Deciduous Fruit Annual Page 5
consumed as a snack with chili powder and is highly recognized by its unique green color. Other
varieties are used by retailers to create excitement in their shelves as an in and out item. The varietal
mix offered by retail stores has proven to add value to the apple category. By growing the size of apple
displays, retailers can accommodate larger volumes of product while implementing better care and
handling techniques such as effective use of color breaks, rotation and proper handling.
The U.S. Fresh Fruits Promotional Campaign, a USDA Global Based Initiative (GBI) program, ran its
3rd
and final year starting in October of 2012, and ending in March 2014. The Washington Apple
Commission, Pear Bureau Northwest, and California Table Grape Commission, in collaboration with
Lazy Town Entertainment, several major retail chains and wholesale groups in Mexico, and with the
backing of the Mexican Secretariat of Health, carried out a 2 month-long point of sale promotion. There
will be public relations and in-store demos campaign throughout Mexico in November 2013 and March
2014. The U.S. Apple Export Council also carried out promotions in Mexico City, Guadalajara,
Tijuana, Mexicali and Veracruz increasing apple sales in those areas.
Canadian apples are imported from November to January and Chilean apples are typically imported
from March to June. Chilean apples do not compete directly with Mexican apples since they do not
enter the market at the height of Mexico’s marketing year. Mexican apples are marketed from
September through December, but many are kept in cold storage to be used during the early months of
the year thus competing more directly with U.S. apples.
Mexican producers continue to increase market promotions. Chilean producers have also been working
aggressively to penetrate the Mexican market, introducing several varietal characteristics in an effort to
target different population groups. The Chilean promotion strategy focuses more on price than on
quality. Chilean producers are also marketing the Royal Gala variety in Mexico.
Mexico continues to be the number one export market for Washington Apples. The 2012-13 marketing
season finished with Mexico importing a total of 13,665,209 cartons, 33.4% above the 2011/12 season
and a new export record for Mexico. This is a strong finish considering that worldwide, Washington
Apple exports grew by 10.5%.
FRESH PEARS
PRODUCTION
Mexico’s pear production is relatively low so SAGARPA only publishes pear production data on an
annual basis. Total pear production is forecast at 25,000 MT for MY 2013/14 (July/June) - a 16 percent
increase from MY 2012/13 due to expected better weather conditions. Pear production is not expected
to show significant increases in the near future, as growers are not heavily investing in this crop due to
the high cost of production. Pear yields for MY 2012/13 were revised downward from previous

MX3082 Mexico Fresh Deciduous Fruit Annual Page 6
estimates as yields decreased to 5.2 MT/Ha from 6.38 MT/Ha that prevailed in MY 2011/12. Pear
production for MY 2010/11 remains unchanged.
Approximately 87 percent of the pear planted area is rain fed. Michoacan, Puebla, and Morelos are
Mexico’s major pear producing states and account for 84 percent of total Mexican production. Lack of
investment, high costs of production, scarce water supplies in pear producing regions, and disease
problems have limited domestic production growth. However, some growers have started to experiment
with planting more disease-resistant and longer shelf-life varieties. Area planted and harvested for MY
2013/14 is not expected to change much from the previous year. Planted area for MY 2012/13 was
revised downward according to official data from SAGARPA. Planted and harvested area for MY
2011/12 remains unchanged from previous estimates.
CONSUMPTION
Domestic demand is satisfied mainly by imports from the United States which represent about 90
percent of total supply. Pear consumption for MY 2013/14 is forecast to increase due to higher demand,
as imported pear prices are expected to be less expensive compared to the previous marketing year due
to an expected larger U.S. harvest. Pear consumption for MY 2012/13 was revised downward due to
higher consumer prices based on the tight supply situation in the U.S. Pear consumption for MY
2011/12 remains unchanged from previous estimates.
TRADE
Pear imports for MY 2013/14 are forecast to increase about 11 percent compared to New/Post MY
2012/13 import estimates as U.S. supplies are expected to be higher and at better prices. New/Post pear
import estimates for MY 2012/13 were revised downward about 13.4 percent compared to MY 2011/12
imports, as the U.S. harvest was lower than expected, and prices were high. Average prices for MY
2012/13 were about $1,346.92 dollars per MT while average prices for MY 2011/12 were $898.57
dollars per MT. Pear imports for MY 2011/12 remain unchanged. As in apples, pear imports increased
as the retaliation tariff of 10 percent on U.S. imported pears was cancelled on October 14, 2011.
U.S. Anjou pear import season is from September to July, though cold storage facilities in Mexico
provide year-round availability. U.S. Bartlett pear import season is from August through February,
again with cold storage facilitating year-round availability. The presence of Chilean and Argentinean
pears is limited in the Mexican market and they are of fair to good quality and are usually priced lower
than U.S. pears. Under different trade agreements, the import duty on pears from the United States,
Chile, and Argentina is zero. China has been exporting pears to the Mexican market but volumes are
not significant.
Mexican pear exports are residual and Belize has been the principle importer for the last few years.
Belize imported 35 MT during MY 2011/12 and 27 MT during MY 2012/13.
MARKETING

MX3082 Mexico Fresh Deciduous Fruit Annual Page 7
As Mexico’s main pear supplier, market promotion efforts for U.S. pears continue in several Mexican
cities, supermarkets, and street markets. With intensive promotional efforts every season, the United
States has been successful in turning Mexico into the largest export market through campaigns that
include a wide mix of activities targeting both the trade and consumers.
Consumer focused-activities in Mexican supermarkets strengthen and increase the demand for U.S.
pears by educating consumers in:
wide pear variety and assortment available
sweet and delicious tastes
providing consumers usage/cooking ideas
pears’ nutritious values
This was achieved by promoting these messages at different levels and through an integrated mix of
activities, all targeting the retail sector where 95% of fresh pears are consumed in Mexico.
In addition, technical activities continue to be very important in the overall program. Because staff
rotation is high in supermarket chains, the need for training is a reality which the US must continue
addressing in order to insure that pears from the U.S. are being handled correctly. Through training, the
United States makes the trade aware of the importance of correct handling and exhibition techniques,
which is translated into a trade’s higher confidence for managing larger volumes and more pear
varieties. Also, in food service and processed foods, pears are increasingly popular for use in juices,
jams, cereals, breakfast bars, baby food, and baked goods. U.S.-origin pears are from Washington,
Oregon, and California.
Due to limited scales of production, Mexican pears are sold, almost exclusively, through local markets
with very few sold in supermarkets. The most popular Mexican pear varieties among Mexican
consumers are the Kiefer variety - better known as Pera Piña, and the Paraiso variety.
The United States is by far the largest and most important supplier of imported pears in Mexico, with a
market share of 98.9%, followed by China with 0.5% of the market, Chile with 0.47% of the market and
Argentina with the remaining 0.13. For 2012 per capita consumption was about 1.86lb.
U.S. Anjou pears were priced ranging from U.S. $22.82 in April and U.S. $32.94 in September 2013 per
18-kg box. Prices were lower in 2013 compared to prices in 2012 of U.S. $38.02 in August 2012 and
about U.S. $37.83 18-kg box in October 2012. Anjou pears continue to be the most sought after variety
in the market followed by Bosc, Bartlett, and the Red Anjou varieties.
In 2012-13, Anjou exports to Mexico reached 2.59 million boxes, followed by Bosc with 224,796
boxes, Bartlett with 176,630 boxes, Red Anjou with 42,459 boxes, Comice with 16,866 boxes, and
other Reds, Seckel and Concorde varieties with 14,462 boxes, highlighting Mexico as a multi-variety
market. The suspension of the retaliation import duty has benefited volume imports for USA Pears.
In-store promotions for pears have always been popular with the trade, helping them to increase sales
and teaching consumers about important aspects of the fruit, such as origin and the main characteristics
of the different pear varieties.

MX3082 Mexico Fresh Deciduous Fruit Annual Page 8
FRESH TABLE GRAPES
PRODUCTION
Total Mexican table grape production for MY 2013/14 (May/April) is forecast at 263,000 MT, slightly
lower compared to our revised estimate for MY 2012/13, as a cooler winter and spring delayed crop
development in Sonora. Zacatecas was also affected by cool temperatures and/or hail. Harvesting
began in May and typically ends in July for Sonora. Baja California and others harvest from June to
August. Total production is sometimes difficult to determine since price relationships among table
grapes, raisin grapes, and industrial grapes attract more grapes into or out of each market. New/Post
production estimates for MY 2012/13 were revised upward from USDA/Official estimates as cold hours
and temperature were good during the growing season. Table grape production for MY 2011/12
remains unchanged.
Table B. Mexico: Table grape production for selected states (MT)
Grape Production MY 2011/12 MY 2012/13 Sonora 182,643 260,904
Zacatecas 8,603 12,198
Baja California 4,773 3,929
Queretaro 2,037 1,829
Total Mexico 198,307 279,966 Source: SAGARPA/SIAP
Area planted for MY 2013/14 is forecast to increase only marginally from the Post/New MY 2012/13
estimated area. Growth in planted area is limited as production costs are high and water is scarce.
Sonora has been losing vineyards due to higher costs of production as well as unfavorable weather;
however planted area has been fluctuating between 14,100 and 15,000 hectares. Sonora growers have
increased technological innovations and have higher density planting, achieving higher yields,
compared to other growing regions. According to growers, there are 2,500 plants per hectare on
average, producing an 8.2 kg/ box per plant. These yields change depending on the plant variety and
cultivation methods. Baja California, on the other hand, has increased planted area as producers
consider this region to have better weather conditions. Baja California is the third most important
growing area and exports substantially all of its production. Most of the table grape production from the
states of Zacatecas and Queretaro are destined for local markets.
New/Post planted area for MY 2012/13 was revised upward while harvested area was revised
downward from previous USDA/Official estimates based on SAGARPA estimates. Sonora seems to
have planted slightly more area due to expected good revenues. Area planted and harvested for MY
2011/12 remain unchanged. Area harvested was down due to cutbacks in other states. The state of
Sonora accounts for approximately 90 percent of total table grape production in Mexico and 86 percent
of the total planted area. Market and growing conditions are favorable but water scarcity continues to
limit aggressive expansion in Sonora as all table grape area is irrigated. The national average yield for
MY 2012/13 was high at 17.35 MT/ha, and yields for MY 21013/14 are expected at about 16.5 MT/ha.

MX3082 Mexico Fresh Deciduous Fruit Annual Page 9
Some of the main grape varieties that Mexico produces include Perlette, Flame, Sugraone, and Red
Globe.
Costs of production in Mexico have been increasing in recent years. According to producers, average
costs for 2013 were between U.S. $13,900/ha and U.S. $16,000/ha depending on the variety of grapes,
use of fertilizers, and pest control systems. Producers indicate that expansion is limited mainly because
of water scarcity in Sonora aquifers. As a result, producers are trying to increase yields and become
more efficient rather than increase acreage. High interest rates for credit lines also limit table grape
expansion. Producers’ report that the only credit to which they have access comes from U.S. brokers
and distributors who give advance payments for harvesting and packing of table grapes.
CONSUMPTION
The volume of Mexican grapes on the local market depends on export volumes, as producers tend to
supply the international market before the domestic market. Therefore, table grape consumption for
MY 2013/14 is forecast at 165,000 MT as local demand is expected to be strong and at good prices.
However, less imported product from Chile is expected. New/Post consumption estimates for MY
2012/13 were revised upward due to stronger demand than expected. Consumption for MY 2011/12
remains unchanged.
TRADE
Table grape imports for MY 2013/14 are forecast to decrease slightly to 54,000 MT compared to MY
2012/13 due to less imports from Chile as fruit in that country was affected by frost. U.S. supplies are
expected to be similar to those of MY 2012/13. However, as in other imported fruit, the swings in the
peso/dollar exchange rate makes importers very cautious and trade can always slow down if the
exchange rate increases price. New/Post table grape imports for MY 2012/13 were revised downward
from USDA/Official estimates based on trade data. Table grape imports for MY 2011/12 remain
unchanged.
Not only does Mexico grow grapes that compete in the early part of California’s season, Mexico also
imports from Chile. These grapes represent about 30 percent of total imports. Chile’s grape production
is primarily counter-seasonal but Chilean grapes are also available during California’s early and late
season. However, for MY 2013/14 Chilean fruit was affected by frost and imports are expected to be
low. Under different trade agreements, the import duty on grapes from the United States and Chile is
zero, and both the United States and Chile continue to increase exports to the Mexican market.
According to traders, U.S. promotional efforts to export table grape varieties to Mexico, other than Red
Globe or Thompson, show good results. U.S. table grapes may only be imported from California due to
phytosanitary restrictions that prohibit imports from other U.S. states.
Mexican table grape exports in MY 2013/14 are forecast to decrease compared to New/Post MY
2012/13 due to the weather related delayed start to the season, including harvesting, and stronger
expected domestic demand. However, international demand is expected to be strong. Exports for MY
2012/13 were revised downward but still represent strong international demand and good international
prices. Exports for MY 2011/12 remain unchanged.

MX3082 Mexico Fresh Deciduous Fruit Annual Page 10
Most of Mexico’s table grapes are exported to the United States. Growers indicated that free on board
(FOB) export prices late in May 2013 began at prices of about U.S. $40 to $45 per 8-kg box of Perlettes
and then fell to an average of U.S. $18 to $20 per 8-kg box in mid June 2013. Flame seedless grapes
began in May 2013 at a high of U.S. $32 to $33 per 8-kg box and then fell to an average of U.S. $20 to
$22 per 8-kg box in mid June. Mexican export prices usually range between U.S. $14-16/ box,
confirming that 2013 prices were very good.
Although there is a little cross-over, there is no significant direct competition in Mexico between U.S.
and Chilean table grapes. U.S. suppliers export to Mexico from August to December and from January
to February—before and after the Mexican season. Chile usually exports from January to April and
from June to July.
The Mexico–European Union (EU) Trade Agreement, signed in 2000, allows Mexican table grapes to
be exported duty free, beginning in 2008. Mexico has not taken full advantage of this agreement since
most of its grapes are being exported to the United States—said to be a more profitable market.
MARKETING
The United States remains the leading exporter of fresh grapes to Mexico with more than 66 percent of
total imports coming from the U.S. The marketing and promotional programs continue to focus on the
retail sector as well as in the wholesale markets, which also serve as a major channel for U.S. grape
distribution.
The Mexican market continues to see increased consumption of California table grapes, with exports to
Mexico increasing by 24 percent between 2008 and 2012. This volume growth was matched by an
increase in export value of 32 percent during the same time period. Programs focused on consumers
help motivate the trade to handle California grapes at the start of the season and to build more volume
throughout the season (which is May through January each year).
The goal with consumers is to continue to build origin recognition, awareness of the health benefits,
freshness and convenience of grapes from California, while at the same time creating impulse sales at
retail. In 2013, the targeted cities are Mexico City, Monterrey, Guadalajara and Puebla. Approximately
4,500 demo days for the whole season are planned with 100 percent aimed at the retail chains: Wal-
Mart, Comex, Soriana, Chedraui, HEB, S-MART and COSTCO. The program is supported by point-of-
sale (POS) materials, indicating the origin, health and freshness message. Additionally, a themed
promotional program for the Christmas/New Year period is being implemented for the first time in
December 2013 to motivate larger displays in retail chains at this important grape consumption time of
the year. These in-store activities are being implemented throughout the targeted retail chains through
December 31st.
U.S. Globe and Thompson varieties remain among the most popular in Mexico and importers base their
purchases on the variety which is offered at the best price while still containing good sugar levels.
MX3082 Mexico Fresh Deciduous Fruit Annual Page 11
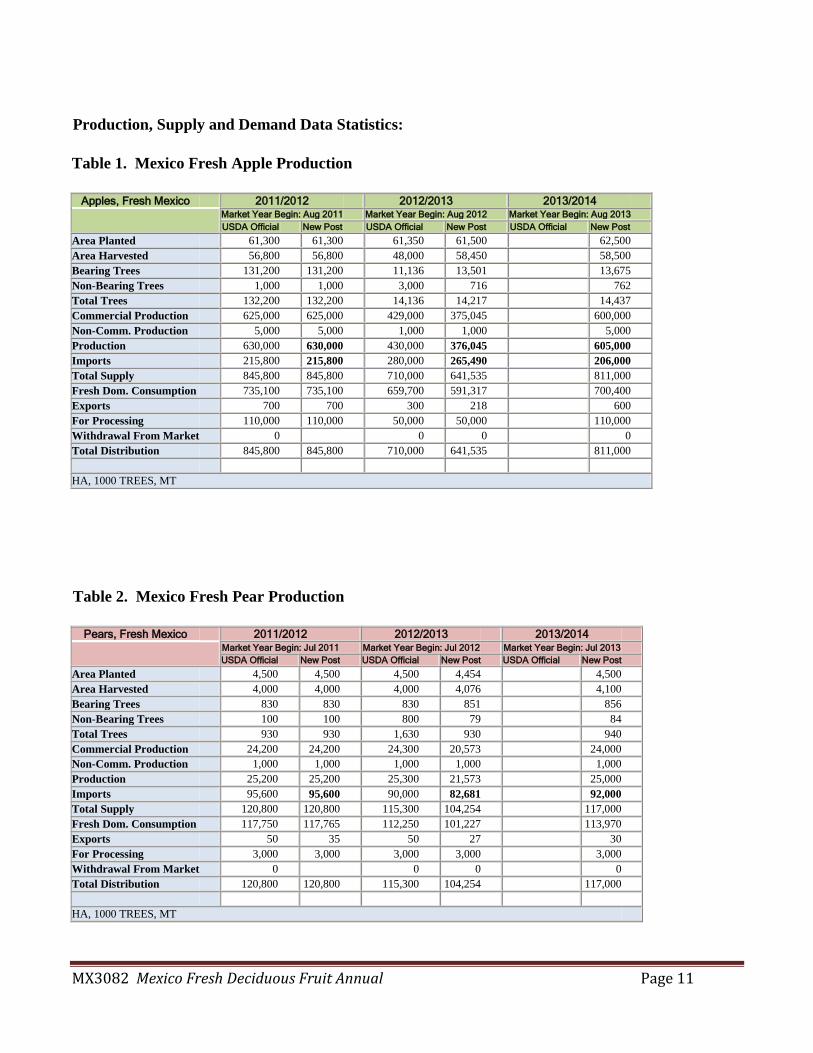
Production, Supply and Demand Data Statistics:
Table 1. Mexico Fresh Apple Production
Apples, Fresh Mexico 2011/2012 2012/2013 2013/2014
Market Year Begin: Aug 2011 Market Year Begin: Aug 2012 Market Year Begin: Aug 2013
USDA Official New Post USDA Official New Post USDA Official New Post
Area Planted 61,300 61,300 61,350 61,500 62,500
Area Harvested 56,800 56,800 48,000 58,450 58,500
Bearing Trees 131,200 131,200 11,136 13,501 13,675
Non-Bearing Trees 1,000 1,000 3,000 716 762
Total Trees 132,200 132,200 14,136 14,217 14,437
Commercial Production 625,000 625,000 429,000 375,045 600,000
Non-Comm. Production 5,000 5,000 1,000 1,000 5,000
Production 630,000 630,000 430,000 376,045 605,000
Imports 215,800 215,800 280,000 265,490 206,000
Total Supply 845,800 845,800 710,000 641,535 811,000
Fresh Dom. Consumption 735,100 735,100 659,700 591,317 700,400
Exports 700 700 300 218 600
For Processing 110,000 110,000 50,000 50,000 110,000
Withdrawal From Market 0 0 0 0
Total Distribution 845,800 845,800 710,000 641,535 811,000
HA, 1000 TREES, MT
Table 2. Mexico Fresh Pear Production
Pears, Fresh Mexico 2011/2012 2012/2013 2013/2014
Market Year Begin: Jul 2011 Market Year Begin: Jul 2012 Market Year Begin: Jul 2013
USDA Official New Post USDA Official New Post USDA Official New Post
Area Planted 4,500 4,500 4,500 4,454 4,500
Area Harvested 4,000 4,000 4,000 4,076 4,100
Bearing Trees 830 830 830 851 856
Non-Bearing Trees 100 100 800 79 84
Total Trees 930 930 1,630 930 940
Commercial Production 24,200 24,200 24,300 20,573 24,000
Non-Comm. Production 1,000 1,000 1,000 1,000 1,000
Production 25,200 25,200 25,300 21,573 25,000
Imports 95,600 95,600 90,000 82,681 92,000
Total Supply 120,800 120,800 115,300 104,254 117,000
Fresh Dom. Consumption 117,750 117,765 112,250 101,227 113,970
Exports 50 35 50 27 30
For Processing 3,000 3,000 3,000 3,000 3,000
Withdrawal From Market 0 0 0 0
Total Distribution 120,800 120,800 115,300 104,254 117,000
HA, 1000 TREES, MT

MX3082 Mexico Fresh Deciduous Fruit Annual Page 12
Table 3. Mexico Grape Production
Grapes, Fresh Mexico 2011/2012 2012/2013 2013/2014
Market Year Begin: May 2011 Market Year Begin: May 2012 Market Year Begin: May 2013
USDA Official New Post USDA Official New Post USDA Official New Post
Area Planted 16,541 16,541 16,700 17,716 17,720
Area Harvested 16,430 16,430 16,600 16,139 16,000
Commercial Production 197,307 197,307 214,000 278,966 260,000
Non-Comm. Production 1,000 1,000 1,000 1,000 1,000
Production 198,307 198,307 215,000 279,966 261,000
Imports 75,000 75,000 65,000 58,888 54,000
Total Supply 273,307 273,307 280,000 338,854 315,000
Fresh Dom. Consumption 135,707 135,707 110,000 171,042 165,000
Exports 137,600 137,600 170,000 167,812 150,000
For Processing 0 0 0 0 0
Withdrawal From Market 0 0 0 0 0
Total Distribution 273,307 273,307 280,000 338,854 315,000
HA, MT

MX3082 Mexico Fresh Deciduous Fruit Annual Page 13
Table 4. Mexico -Average Monthly Wholesale Apple Import Prices
Red Delicious Pesos/kilogram Month 2012 2013 Change percent
January 27.20 February 25.93 March 23.52 April 21.76 21.17 (2.71)
May 24.72 20.58 (16.74)
June 27.79 21.82 (21.48)
July 27.36 22.35 (18.31)
August 28.02 21.95 (21.66)
September 30.00 21.05 (29.83)
October 34.35 20.58* (40.08)
November 27.03 December 27.36
CIF-Mexico City Source: Sevicio Nacional de Informacion de Mercados
2012 Exchange Rate Avg.: U.S.$1.00 = 13.15 Pesos October 3, 2013 Exchange Rate: U.S.$1.00 = 13.15 Pesos
*October 4, 2012
Table 5: Mexico -Average Monthly Wholesale Apple Domestic Prices
Red Delicious Pesos/kilogram Month 2012 2013 Change percent
January 19.72 26.63 35.04
February 19.00 25.54 34.42
March 19.12 23.57 23.27
April 18.83 24.80 31.70
May 24.00
June
July
August
September 26.63 17.73 (33.42)
October 27.36 17.36* (36.54)
November 26.40
December 26.84 CIF-Mexico City
Source: Sevicio Nacional de Informacion de Mercados 2012 Exchange Rate Avg.: U.S.$1.00 = 13.15 Pesos
October 3, 2012 Exchange Rate: U.S.$1.00 = 13.15 Pesos *October 4, 2013

MX3082 Mexico Fresh Deciduous Fruit Annual Page 14
Table 6: Mexico -Average Monthly Wholesale Pear Import Prices
D’ANJOU Pesos/kilogram Month 2012 2013 Change percent
January 20.42 25.75 26.10
February 19.04 24.44 28.36
March 18.44 25.53 38.44
April 19.04 25.69 34.92
May 19.81 25.47 28.57
June 23.51 28.47 21.09
July 27.24 31.20 14.53
August 27.84 32.67 17.34
September 29.06 29.49 1.47
October 26.06 25.56* (19.18)
November 23.98 December 25.96
CIF-Mexico City Source: Sevicio Nacional de Informacion de Mercados
2012 Exchange Rate Avg.: U.S.$1.00 = 13.15 Pesos October 3, 2012 Exchange Rate: U.S.$1.00 = 13.15 Pesos
*October 4, 2013
Table 7: Mexico -Average Monthly Wholesale
Grape Import Prices Globe Pesos/kilogram
Month 2012 2013 Change percent
January 36.25 38.27 5.57
February 35.68 38.88 8.96
March 34.95 34.97 0.05
April 30.12 33.85 12.38
May 29.80 31.55 5.87
June 31.35 31.41 0.19
July
August 40.00
September 36.13 32.50 (10.04)
October 29.52 30.00* 1.62
November 37.69
December 42.69
CIF-Mexico City Source: Sevicio Nacional de Informacion de Mercados
2012 Exchange Rate Avg.: U.S.$1.00 = 13.15 Pesos October 3, 2012 Exchange Rate: U.S.$1.00 = 13.15 Pesos
*October 4, 2013
MX3082 Mexico Fresh Deciduous Fruit Annual Page 15
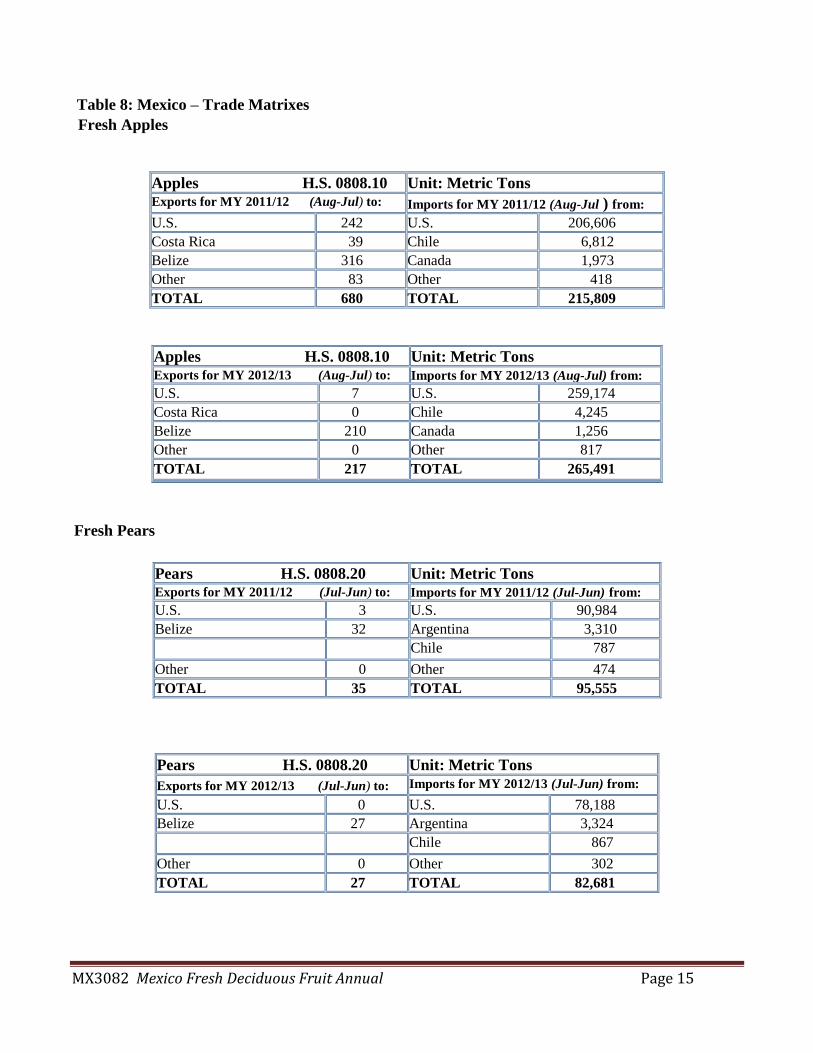
Table 8: Mexico – Trade Matrixes
Fresh Apples
Apples H.S. 0808.10 Unit: Metric Tons Exports for MY 2011/12 (Aug-Jul) to: Imports for MY 2011/12 (Aug-Jul ) from: U.S. 242 U.S. 206,606 Costa Rica 39 Chile 6,812 Belize 316 Canada 1,973 Other 83 Other 418 TOTAL 680 TOTAL 215,809
Apples H.S. 0808.10 Unit: Metric Tons Exports for MY 2012/13 (Aug-Jul) to: Imports for MY 2012/13 (Aug-Jul) from: U.S. 7 U.S. 259,174
Costa Rica 0 Chile 4,245
Belize 210 Canada 1,256
Other 0 Other 817
TOTAL 217 TOTAL 265,491
Fresh Pears
Pears H.S. 0808.20 Unit: Metric Tons Exports for MY 2011/12 (Jul-Jun) to: Imports for MY 2011/12 (Jul-Jun) from: U.S. 3 U.S. 90,984 Belize 32 Argentina 3,310
Chile 787
Other 0 Other 474 TOTAL 35 TOTAL 95,555
Pears H.S. 0808.20 Unit: Metric Tons
Exports for MY 2012/13 (Jul-Jun) to: Imports for MY 2012/13 (Jul-Jun) from:
U.S. 0 U.S. 78,188 Belize 27 Argentina 3,324
Chile 867
Other 0 Other 302 TOTAL 27 TOTAL 82,681

MX3082 Mexico Fresh Deciduous Fruit Annual Page 16
Table Grapes
Table Grapes H.S. 0806.10 Unit: Metric Tons Exports for MY 2011/12 (May-Apr) to: Imports for MY 2011/12 (May-Apr) from: U.S. 135,666 U.S. 52,692
Costa Rica 309 Chile 22,454 Other 1,607 Other 0 TOTAL 137,582 TOTAL 75,146 Source: Global Trade Atlas August 2013
Table Grapes H.S. 0806.10 Unit: Metric Tons Exports for MY 2012/13 (May-Apr) to: Imports for MY 2012/13 (May-Apr)from: U.S. 166,059 U.S. 41,558
Costa Rica 477 Chile 17,330 Other 1,276 Other 0 TOTAL 167,812 TOTAL 58,888
Table 9. Mexico: Monthly Exchange Rate
Averages for 2010-2013 MX Pesos per U.S. $1.00
2010 2011 2012 2013
January 12.80 12.13 13.46 12.71 February 12.95 12.06 12.79 12.69 March 12.59 12.00 12.75 12.54 April 12.23 11.73 13.05 12.21 May 12.71 11.64 13.60 12.95 June 12.72 11.80 13.94 12.94 July 12.65 11.67 13.37 12.77 August 13.15 12.22 13.18 12.89 September 12.84 12.97 12.95 13.08 October 12.44 13.49 12.88 13.15* November 12.33 13.67 13.08 December 12.39 13.73 12.86 Annual Avg
12.65 12.42 13.15
*As of 1st week of October 2013 Source: Mexican Federal Register Note: Monthly rates are averages of daily exchange rates from the Banco de Mexico