mevita: interactive visualizations to help older adults
TRANSCRIPT

MeViTa: Interactive Visualizations to HelpOlder Adults with Their Medication Intake
Using a Camera-Projector System
Robin De Croon(&), Bruno Cardoso, Joris Klerkx,Vero Vanden Abeele, and Katrien Verbert
Department of Computer Science, KU Leuven,Celestijnenlaan 200A, 3001 Leuven, Belgium
{robin.decroon,bruno.cardoso,joris.klerkx,
vero.vandenabeele,katrien.verbert}@kuleuven.be
Abstract. In this paper, we investigate whether augmented reality visualizationtechniques can empower older adults to explore and understand medicationinformation in an effective and timely manner. Through a user-centered designprocess involving older adults and health professionals we developed an inter-active camera-projector system called MeViTa (Medication Visualization Table)that projects medication information surrounding medication boxes laid on atable. Six designs were iteratively developed. In total 26 older adults, with amean age of 71 (±7), participated in the user studies. Although no time benefitswere observed, participants perceived MeViTa as an effective means to exploreand understand medication information, and as more engaging than the tradi-tional patient information leaflet. Furthermore, by visualizing medicationinformation, our approach provides qualitative findings of the relative ease anddifficulty for older adults to learn more about medication information.
Keywords: Medication � Camera-projector � Older adults � User-centered
1 Introduction
Research shows that health literacy - the degree to which people have the capacity toobtain, process, and understand health information - decreases with age [25]. This isproblematic as a large part of the older population is dependent on medication. Forexample, in the United States, more than half of the older population of 65 + needs totake more than five medications per week [41]. Furthermore, accidental medicationmisuse is also more common with older adults [32]. This misuse is generally related tothe fact that medication information can be cumbersome to understand [5]. The workthat is presented in this paper attempts to use innovative technology to make it easierfor older adults to process medication information. This is an exploratory study focusedon the user experience of older adults interacting with our proposed solution.
Several approaches have been proposed to help older adults with technology. Besidestypical app-based solutions, the HCI community has shown the potential of using moretangible, interactive technologies to assist people with various deficits and disorders
© IFIP International Federation for Information Processing 2017Published by Springer International Publishing AG 2017. All Rights ReservedR. Bernhaupt et al. (Eds.): INTERACT 2017, Part I, LNCS 10513, pp. 132–152, 2017.DOI: 10.1007/978-3-319-67744-6_9

[3, 24, 44]. In this paper, we extend this body of research with a proof-of-concept thataugments older adults in their capability to understand personal medication schemes.Through a user-centered design process involving older adults and health domain pro-fessionals (two medical software experts, two legal experts, and two medical researchers)we developed an interactive camera-projector system called MeViTa (Medication Visu-alization Table). MeViTa makes users’ data visible through an augmented reality datavisualization and visualizes (1) possible interactions between medication, (2) the user’spersonalized dosage regimen, and (3) the probability of side-effects. Users can explore,interpret and engage with diverse kinds of information by putting medication boxes on thetable, as presented in Fig. 1. Note that our design tries to complement existing systems,such as medication reminders [10], not to replace them. This raises the key questionwhether allowing older adults to interact with augmented reality visualization techniquesempowers them to explore, understand, and recall medication information.
We make the following contributions: first, we present the design and implemen-tation of an open-source camera-projector system that visualizes medication informa-tion around medication boxes on a table. Second, we present evaluation results of theperceived usefulness with in total 26 older participants and we describe both weak-nesses and benefits for the HCI community working with augmented tools for olderpersons. Finally, we discuss issues older persons can experience during evaluationswith a camera-projector system.
2 Background and Related-Work
To give insight into the challenges posed by medication intake, we provide a shortbackground and briefly discuss the challenges people can experience with medicationintake and the effects of medication misuse. We then position our work within relatedwork on camera-projector systems and assistive technologies.
Fig. 1. Interaction View of the Final Design. The medication boxes on the table are recognizedand medication information is projected surrounding the boxes.
MeViTa: Interactive Visualizations to Help Older Adults 133

2.1 Medication Use
Correctly taking medication involves of a multitude of tasks: getting the right pre-scription, buying the medication, reading the leaflet1 and searching for possibleinteractions between medications, allergies, and even food. One of the problems withmedication use is that people can find it difficult to understand the traditional leaflets[23, 30]. According to Liu et al. [30] leaflets “are inappropriate for use by older adultsto manage their medications effectively, which could adversely affect patient safety andadherence to drug therapy.” Furthermore, Ng et al. [33] found users often struggled tomake sense of the provided data in its default form and suggest the use of pictograms.
Another problem is medication adherence. People often forget, or refuse, to taketheir medication for distinct reasons [19]. For example, they have a false idea about theinner workings of medication and feel they are unhealthy and unnecessary [38]. Fur-thermore, people are often interested [11] in, or overestimate [7], potential side-effects.For example, people who intensively sport, might not want to take a medication thathas fatigue as a side-effect. However, a general practitioner (GP) might discouragepeople to lookup side-effects in fear of the nocebo phenomenon [4].
MeViTa aims to empower users by providing transparent and open medicationinformation. Interactive visualizations encourage people to interact with the data. Ithelps users explore medication information and make the data more meaningful aspeople may understand and become more interested in medication schemes in thecontext of their own lives [11]. A combination of augmented reality and informationvisualization information techniques may also help them to understand the rationale fortaking their medication correctly by visualizing the (often small) chance of side-effectsin an unambiguous matter. As such, it may support decision-making and adherence tomedication. We elaborate on technologies to support medication use for older adults inthe next section.
2.2 Health Technologies that Support Older Adults
Several HCI researchers have explored opportunities to use technology to support theolder adults. Medication reminders/helpers are well known assistive technologies in themedical domain. While medication adherence is a problem for all age groups, researchsuggests it is more common among older adults [31]. It is shown that dosage simpli-fication, counseling, reminders, follow-up, supervised self-monitoring, and feedbackhave the largest positive effect [27, 34]. Medication apps represent a possible strategyto assist non-adherent people [10]. However, older adults are sometimes digitalimmigrants [48] who might miss prior experience with mobile and other touch enableddevices or prefer not to use them. Another approach are sensor-augmented pillboxeswhich were developed for older adults [29] or Personal Health Applications [40].
In this paper, we target self-supporting older persons who want to take ownership oftheir medication. A pill box is sub-optimal as it does not show the rationale and islimited to the medication regime. The overall goal is to empower older adults to explore
1 Also known as: patient information leaflet (PIL) or patient insert.
134 R. De Croon et al.

and understand medication information to address the risks and challenges, such asaccidental medication misuse [32], medication interactions [16] and compliance [21].
In our prior work [11], we initially proposed the use of camera-projector tech-nologies as a collaborative tool for improving communication between a GP and apatient. In this paper, we focus on how such technologies might assist older personswith their medication intake. We designed, implemented and evaluated views thatrepresent the interplay between medications, dosage regimen and side-effects.
2.3 Camera-Projector Systems
In this work, we use a stationary camera-projector system. We based our approach onthe work of Gugenheimer et al. [15] who “envision a future where such devices[camera-projector systems] will be sold in hardware stores. They could be available indifferent form factors, either as a replacement for light bulbs or a simple small boxwhich can be placed in several ways inside the users’ environments to be able to blendinto the household.” Evidence of this vision can already be seen in industrial projects.For example, IKEA’s kitchen concept 2025 [20] shows an example of an augmentedkitchen table. ActiveCues developed a similar system for people with dementia. Resultsfrom their initial studies are promising: “we saw an increase of positive emotions andsocial activity and a significant increase in their physical activity.” [1] Such systemscan also be used to augment medication information.
The research community has also been exploring the topic. LightSpace [49] forinstance explores a variety of interactions between camera-projector surfaces andmetaDESK [46] is an important example of interaction techniques using a tangible userinterface. Other applications can be devised for this technology. As Jones et al. [22]mentioned, “[m]any new and exciting possibilities remain to be explored.” Byenabling the projection of interactive visualizations around medication boxes thesesystems can also be used to augment medication information, and this is in line withour requirement of empowering older persons with actionable knowledge about theirmedication.
3 Design of MeViTa
A main consideration for the design of MeViTa was the selection of the displayedinformation. In this section, we give an overview of the final design of MeViTa, shownin Fig. 1, and its technical details. The rationale and major design decisions are pre-sented in Sect. 4.
3.1 Visualizations
The Final Design evolved through five intermediate designs as described in Sect. 4.Finally, as a result from this design process three different views remained to displayrelevant information to users: first, the Interaction View (Fig. 1) represents medicationinteractions, medication-induced allergies and warnings like alcohol and pregnancy.Second, the Dosage Regimen View (Fig. 2) depicts dosage schemes. Finally,
MeViTa: Interactive Visualizations to Help Older Adults 135

the Side-Effects View (Fig. 3) shows potential side-effects. To switch between theseviews, users should move all the boxes on the table to specific areas of the projectedinterface. No touch interface elements were added to prevent older users from unin-tentionally activating a function [17]. Thus, only by using tangible objects on the table,users can switch between views.
To start using MeViTa, users are required to put all their medication boxes on thetable. The system then recognizes these boxes and displays the Interaction View. Redto green colored circles surrounding the boxes indicate whether users can take themedication, or how long they should wait until it is safe to take the medication again.The rationale for taking each medication is described at the bottom of the table(headache/insomnia/etc.). Allergies are listed at the table’s top right corner. Warningsare represented as icons around the boxes’ surrounding circles. Grey dotted lines aredrawn between the medication boxes and their respective rationales. Red lines con-necting two boxes represent potential medication interactions. Finally, orange dottedlines connecting boxes with allergies or warning icons represent risk associations toalcohol, pregnancy, breast-feeding, driving, and food (e.g. grapefruit). For example, inFig. 1 the upper left box shows a warning for alcohol consumption.
To access the Dosage Regimen View, users should put the boxes in a designatedarea on the left side of the table. This view uses a table layout and is a personalizedmedication scheme based on the system used in the national health platform [47]. Itdisplays the number of pills and the times of each dose.
Finally, to see the Side-Effects View, users should put the boxes in the lowerdesignated region of the table. This view also uses a table layout, projecting the list ofall known side-effects on the table’s first column and the association (probability) thateach medication has with each side-effect on the remaining columns. These proba-bilities are projected above each medication using icon displays: blue-colored iconsrepresent the likelihood of each side-effect.
3.2 Technical Design
The visualizations are implemented using the D3.js (4.2.1) [8] JavaScript library, incombination with Underscore (1.8.3) for data calculations, and SAT.js (0.6.0) forcollision detection. Both the patient record and medication information is stored inJSON files. The recognition of medication boxes is done using a slightly modifiedversion of Labbé’s find-object (0.6.0) tool [28], which uses OpenCV (3.1). TheSpeeded Up Robust Features (SURF) [6] algorithm is used for keypoint detection anddescription. It took the system approximately 0.2 s per medication box to determine thelocation in the scene. The visualization itself updated every 0.5 s to adapt for changedlocations within trial-and-error determined thresholds.
MeViTa consists of a standard webcam, i.e. Logitech c930e camera, with a1920 � 1080 resolution and a 90 degrees’ field, a short throw Acer H6517ST projectorwith a 1920 � 1080 resolution and 3000 lm, and a MacBookPro12.1, which is astandard setup for a camera-projector system [51]. Since the essential part of theinformation is projected around the medication boxes, the system is mounted on theceiling with both the projector and the camera pointing down towards the table. Cal-ibration is done manually for each new location by registering the outer areas of the
136 R. De Croon et al.

Fig. 3. Side-Effects View, this view is shown when all boxes are put on the bottom. For example,in this fictive scenario Strepfen has a very high chance (60%) of headache and a 30% chance ofcausing high blood pressure. Percentages are not displayed in number but by coloring humanfigures proportionally.
Fig. 2. Dosage Regimen View, this view is shown when all boxes are put on the left side of thetable. For example, the user should orally take 3 pills during breakfast, and 1 during lunch ofStrepfen.
MeViTa: Interactive Visualizations to Help Older Adults 137

field of view. More sophisticated calibration is possible, but would go beyond the scopeof this work. No configuration screen was provided as this was not part of theproof-of-concept.
4 Iterative User-Centered Design Process
To design the visualizations, a user-centered methodology was applied to graduallyimprove the initial design of the visualizations. After every evaluation, qualitativefeedback was addressed in the next design, which was then again evaluated. Partici-pation was voluntary and not compensated. Furthermore, each participant could onlyparticipate once. An overview of the different studies is presented in Fig. 4.
4.1 Study 1: Concept
The Initial Design of MeViTa is inspired by prior research on medication visualizations[12] and barriers of communicating health information [36]. It was designed in Pow-erPoint. Guidelines from the Visualizing Health [45] project were also considered.Their summary table, for example, is “suitable for use in decision aids or medicationpackaging.” This initial design was discussed with a consortium of health domainprofessionals, including two medical software experts, two legal experts, and twomedical researchers. The role of the legal experts was to validate compliance with theGeneral Data Protection Regulation (GDPR) (Regulation (EU) 2016/679).
All consortium members attended a presentation introducing the topic of disclosingmedication information to older adults using a camera projector system before theInitial Design was shown. The design primarily served as an exploration of the domainand formed the basis for Low-Fidelity Design 1. Two major attention points wereraised: Problem (1) the overview was too crowded: too much information was dis-played at once which can be confusing to older adults since the ability to suppressirrelevant representations or response tendencies is known to degrade with age [18];and Problem (2) absolute percentages to visualize changes of side-effects are hard tograsp [13].
4.2 Study 2: Usability
The Initial Design helped to design the Low-Fidelity Design 1 as shown in Fig. 5. Theinformation was divided into four different projections to address Problem 1:
Fig. 4. Timeline that shows the studies and the participants in each iteration. Keywords from themost important problems identified in each intermediate study are numbered in bold. The designused in each study is shown on the arrows.
138 R. De Croon et al.

1. interactions and reasons (Figure 5A) ! Interaction View,2. dosage regimen (Figure 5B) ! Dosage Regimen View,3. side-effects (Figure 5C) ! Side-Effects View,4. schedule (Figure 5D) ! Schedule View.
The circles were not used for the dosage regimen anymore and were now used tovisualize the half-life, which is the time the medication remains in the blood. Fur-thermore, the side-effects were now visualized based on [43] instead of percentages(Problem 2). Users could switch between modes by putting their medication boxes in arespective region. To make this design more realistic, it was developed in PowerPointso that it could be projected on a table during the expert user evaluation. Five HCIexperts were asked to perform a list of typical user tasks to expose usability issues. Twokey issues were exposed: Problem (3) all information in the schedule was redundantlyvisualized in the Dosage Regimen View (3/5), and Problem (4) it is cognitively hard toremember the four regions to put medication (4/5).
4.3 Study 3: Medical Validity
An attempt was made to solve these issues in Low-Fidelity Design 2. The Sched-ule View was removed (Problem 3), thus there are only three main regions to put themedication boxes (Problem 4). This updated design was evaluated with an expert GPfrom the academic center for general practice to test medical relevance. Two problemswere identified: Problem (5) the thickness of an interaction line showed the severity,and an orange-to-red hue indicated the probability of a possible interaction. However,
Fig. 5. Overview of the Low-Fidelity Design 1. The view projected depends on the location ofthe boxes. When they are divided over the table the user sees the (A) Interaction View; when theyare on the left side the (B) Dosage Regimen View, at the top the (C) Side-Effects View, and on theright side the (D) Schedule View.
MeViTa: Interactive Visualizations to Help Older Adults 139
this information is often not available in real patient records; and Problem (6) theseverity of a side-effect is a very personal experience and an impersonal, independentlydetermined severity level is thus best not shown.
4.4 Study 4: Explorative Evaluation with Older Adults
Based on previous feedback a fully working High Fidelity Design was built as pre-sented in Fig. 6. To cope with earlier remarks, we only showed one type of connectionbetween medications from the start (Problem 5): once there was the chance of aninteraction a line was drawn between the two medications, hence the severity, andprobability were not shown. Furthermore, the severity of side-effects was not shown(Problem 6), only the occurrence.
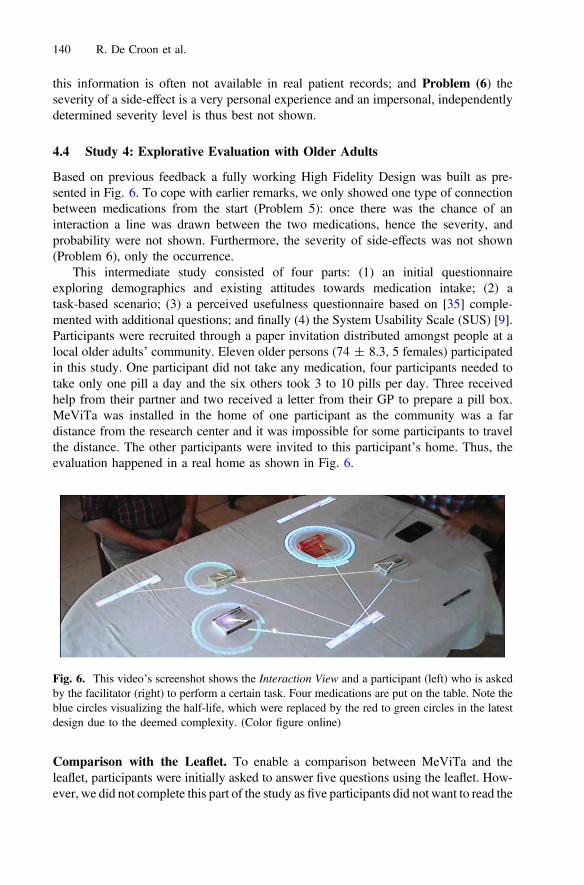
This intermediate study consisted of four parts: (1) an initial questionnaireexploring demographics and existing attitudes towards medication intake; (2) atask-based scenario; (3) a perceived usefulness questionnaire based on [35] comple-mented with additional questions; and finally (4) the System Usability Scale (SUS) [9].Participants were recruited through a paper invitation distributed amongst people at alocal older adults’ community. Eleven older persons (74 ± 8.3, 5 females) participatedin this study. One participant did not take any medication, four participants needed totake only one pill a day and the six others took 3 to 10 pills per day. Three receivedhelp from their partner and two received a letter from their GP to prepare a pill box.MeViTa was installed in the home of one participant as the community was a fardistance from the research center and it was impossible for some participants to travelthe distance. The other participants were invited to this participant’s home. Thus, theevaluation happened in a real home as shown in Fig. 6.
Comparison with the Leaflet. To enable a comparison between MeViTa and theleaflet, participants were initially asked to answer five questions using the leaflet. How-ever, we did not complete this part of the study as five participants did not want to read the
Fig. 6. This video’s screenshot shows the Interaction View and a participant (left) who is askedby the facilitator (right) to perform a certain task. Four medications are put on the table. Note theblue circles visualizing the half-life, which were replaced by the red to green circles in the latestdesign due to the deemed complexity. (Color figure online)
140 R. De Croon et al.
leaflet (Problem 7) because their doctor, who might consider the nocebo phenomenon[4], advised them to not read leaflets. Moreover, two participants mentioned their partnerread it. Three other participants could either not find (2/11) or read (1/11) the information.Hence, only 1 out of 11 participants could successfully read the traditional leaflet.
Task-Based Scenario. During the task-based scenario participants were asked toanswer seven questions. All participants had to answer the same questions on themedication scheme which was based on a real medication scheme. This scheme con-tained of four medications and served as a simple use case of medication intake.However, it was discussed at the Academic Center for General Practice in Leuven torepresent a realistic use case. To avoid that participants could answer questions frommemory and not look at the table to complete their task, fictional medication boxeswere used with altered medication names. Unfortunately, most participants wereconfused by the medication they did not recognize (Problem 8). For example, whenasked to answer why Cymbolto was used two participants said without looking at thetable: “I don’t know, I don’t take this medication.” In total five out of 11 participantsdid not look at the table and immediately indicated they did not know the answer.Similar observations were made during the other tasks.
The question about the medication’s half-life did not interest our participants(Problem 9). A participant summarized it perfectly: “I don’t care; my doctor shouldknow this.” It is interesting to note that although participants were told that they couldtouch and move medication boxes on the table, none of the participants touched theboxes, unless explicitly asked to do so. However, when they needed to move the boxesto switch views we observed some difficulties reaching the upper part of the table(Problem 10).
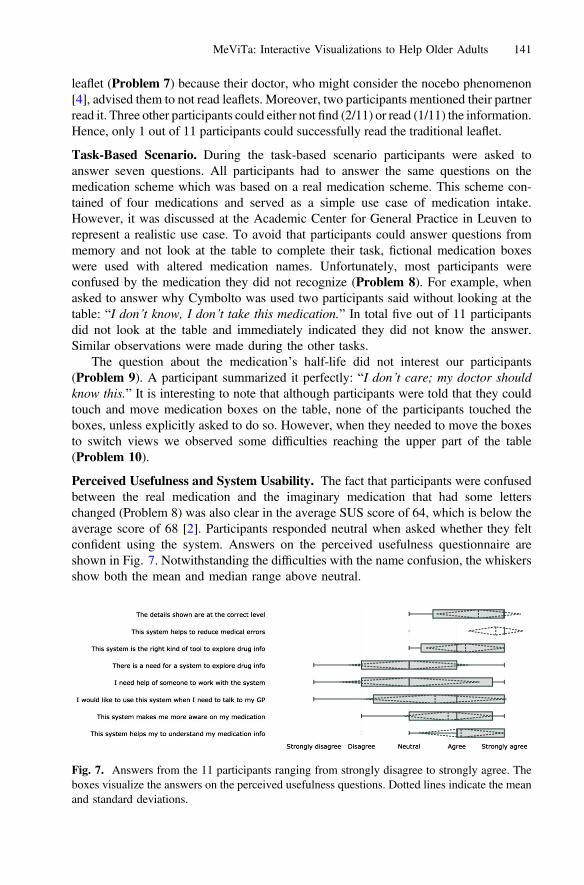
Perceived Usefulness and System Usability. The fact that participants were confusedbetween the real medication and the imaginary medication that had some letterschanged (Problem 8) was also clear in the average SUS score of 64, which is below theaverage score of 68 [2]. Participants responded neutral when asked whether they feltconfident using the system. Answers on the perceived usefulness questionnaire areshown in Fig. 7. Notwithstanding the difficulties with the name confusion, the whiskersshow both the mean and median range above neutral.
Fig. 7. Answers from the 11 participants ranging from strongly disagree to strongly agree. Theboxes visualize the answers on the perceived usefulness questions. Dotted lines indicate the meanand standard deviations.
MeViTa: Interactive Visualizations to Help Older Adults 141

4.5 Study 5: Evaluation Setup Validation
Before conducting the final user study, the updated design setup was evaluated in ashort intermediate study. To address Problem 9, the circles visualizing the medication’shalf-life were replaced by simpler circles that show whether it is OK to take themedication. Furthermore, to enhance reachability (Problem 10) the area for side-effectswas moved to the bottom of the table. This time, participants received a 1-minutedemonstration of MeViTa using a box of iron staples to show that the meaning of theboxes was not important. We deliberately chose not to show a legend to evaluatewhether the visualizations were clear without it. In contrast to Study 4: ElderlyCommunity (Sect. 4.4), it was strongly emphasized they were not looking at their ownmedication but at the medication scheme of Julie Janssens, a fictive woman of 73 yearsold weighing 76 kg. Furthermore, only the colors of the boxes were mentioned by themain researcher to address Problem 8.
We tested this High-Fidelity Design 2 with three participants that were initiallyrecruited for the final evaluation (Sect. 5). Only one minor usability issue was dis-covered and optimized in the Final Design: a grey area was added to the bottom toindicate more clearly the area for side-effects. Another grey area was added on the leftof the table to indicate the area for the medicine schedule.
5 Final Evaluation
This section describes the final user evaluation of the Final Design resulting from thefive prior studies as described in Sect. 4. This evaluation explores whether allowingolder adults to interact with augmented reality visualization techniques empowers themto explore, understand, and recall medication information in an effective and timelymanner.
5.1 Participants
Participants were found using a call for participation published in a major healthinsurance members’ magazine. We did not impose an age limit and all self-identifiedseniors could participate. These self-supporting older adults are the actual target groupof MeViTa. In total, 45 people responded to the call and were contacted by the mainresearcher explaining the research and planned evaluation in more detail. Each par-ticipant was asked to attend an evaluation session of maximum one hour at the nursinghome or at the university’s computer science department. A mileage allowance wasoffered in return. In total 22 participants were willing and able to attend an evaluationsession, of which seven canceled last minute due to personal reasons. The first threeparticipants were used to validate the updated evaluation setup (Sect. 4.5). Hence, intotal 12 older adults (3 females) participated in the final evaluation. They were onaverage 67.5 (±5.5) years old and took on average 9 (±5.5) pills every day.
142 R. De Croon et al.

5.2 Experimental Setup and Measurements
At the start, each participant received an information sheet and was asked to sign aninformed consent. Like Studies 4 and 5 the evaluation started with an initial demo-graphic questionnaire. After a tutorial, similar to Study 5: Evaluation Setup Validation(Sect. 4.5), participants were asked (1) to find two side-effects, and (2) the dosageregimen of Motilium using a leaflet. Next, using MeViTa, the same two tasks and fiveadditional tasks were asked in random order. The same approach as in Study 5:Evaluation Setup Validation was applied. It was emphasized they were not looking attheir own medication but at the medication scheme of a fictive woman. Participantswere asked to think aloud. The following parameters were measured:
– Time. How much time does a participant need to complete a given task from thescenario? These timings are extracted from the recorded video files and compared tothe time needed to find information in a traditional leaflet.
– Interaction strategies. Based on the recordings each interaction performed waslogged and analyzed to detect potential strategies participants applied.
– Memorability. We wanted to learn if participants recalled more information whenthey visually saw the information instead of reading the information from leaflets.Participants were asked to recall information from two tasks they performed usingboth the leaflet and MeViTa.
After this task-based scenario seven perceived usefulness questions based onO’Leary et al. [35] and ten SUS [9] questions were asked.
5.3 Traditional Leaflet and Task-Based Scenario
Table 1 provides an overview of each task and the average completion time. To avoidthe pitfalls of Study 4: Elderly Community (Problem 7), participants were asked toperform only two tasks using the leaflet. To account for GPs’ nocebo phenomenonconcerns [4] the leaflet of an off-the-market medication Motilium was provided.
Task (1) “Can you tell me the side-effects of Motilium” or for MeViTa “Can you tellme the side-effects of the white/red box?” was successfully completed by nine out of 12participants using the leaflet (69 s ± 37 s). However, three participants were not ableto list the side-effects. To solve this task using MeViTa, participants had to move allboxes on the table to the bottom to switch to the Side-Effects View. Compared to theleaflet, it took participants longer to answer the question (107 s ± 55 s) because theyinitially moved just one box. On the other hand, all participants could successfully findall side-effects.
Task (2) “On which times during the day can Julie use Motilium” and “On whichtimes during the day can Julie use the red box” was answered correctly by all 12participants both by using the leaflet (29 s ± 19 s) and by using MeViTa(45 s ± 33 s). With MeViTa, participants first had to move all boxes to the left side ofthe table to switch to the Dosage Regimen View. Then a table with the dosage regimenis projected on the table. Each row is the regimen for the corresponding medication. Incontrast to the prior task, only four participants initially moved only one box.
MeViTa: Interactive Visualizations to Help Older Adults 143

This indicated they remembered how to switch modes using the boxes: “Then I have toget to that other screen for sure?”
To alleviate potential resistance to reading the leaflet, participants were asked onlytwo questions using the leaflet. Therefore, the following tasks were only performedusing MeViTa. Task (3) “Why do you think Julie should take this blue box?” couldeasily be solved using the Interaction View. A grey dotted line connected the blue boxwith ‘fibromyalgia’. This task was completed swiftly (5 s ± 2 s) and correctly by all12 participants.
Task (4) “How do you rate the chance Julie will get a dry throat?” could be solvedby moving all boxes to the bottom of the table and thus switch to the Side-Effects View.There, a medication’s side-effects are shown in a column above the medication box (seeFig. 3). As the tasks were given in random order, some participants already startedfrom the Side-Effects View while others first needed to move all boxes. However, all 12participants completed the task correctly 10 s ± 10 s. Interestingly, participants ratedthe likelihood of side-effects lower than prescribed in the leaflet. When there were tenor less out of hundred person icons colored, participants rated the likelihood asuncommon, while the leaflet would list them as common.
Task (5) “Do you think Julie can drink alcohol while taking these medications?”could be solved using the Interaction View. As shown in Fig. 1 orange dotted lines aredrawn from the medication box to an alcohol symbol when an interaction is possible.However, this task created confusion with our participants as they were always taughtnot to drink any alcohol when on medication: “Of course, I assume that you do notdrink alcohol, that is obvious.” Five participants therefore first moved all boxes to thebottom of the table to spot the side-effects, which also weights on the average time(20 s ± 21 s).
Task (6) “Can Julie combine these two blue boxes” could be solved using theInteraction View. One of the primary features of the Interaction View is the opportunityto check for medication-medication interactions. When two medications harmfullyinteract with each other a red line is drawn between the two boxes. However, three outof 12 participants switched to the Side-Effects View thinking that two similarside-effects might strengthen each other. Eventually, all 12 participants spotted the redline between two boxes and could finish this task successfully (53 s ± 66 s). More-over, participants remembered to divide the boxes over the table for a better overview:“but you [I] should not put the boxes too close to each other.”
Task (7) “How much longer before Julie can take a pain killer for her headache?”could be solved using two different approaches. The Interaction View shows a greencircle surrounding a medication box when the user can take that medication now. Userscan also use the Dosage Regimen View to see if enough time has passed since the lastdose. Ten out of 12 participants completed the task (30 s ± 27 s): four participantsused the Dosage Regimen View to complete this task, while six other participants usedthe Interaction View. Two participants were unable to complete this task: “How shouldI know this?” and “I don’t know, it depends on what the doctor says.”
144 R. De Croon et al.

5.4 Results on the Perceived Usefulness and Usability Questionnaire
As illustrated in Fig. 8, answers to Likert scale questions scored consistently high.When participants were asked whether MeViTa increased their comprehension ofmedication schemes 10 out of 12 participants agreed. The two participants that wereless positive argued they first needed to get acquainted with the system. All participantsagreed that the design can create medication awareness. Ten participants answered theywould like to use the system when they would need to talk to their GP. One participantwho responded neutral indicated her doctor “is 82 years old, and doesn’t like com-puters.” The strongest benefit mentioned is that both the user and the GP would havethe same overview which makes it is easier to signal a certain problem to their care-giver. Participants also liked the fact that a general overview of all their medication isgenerated. This could be particularly useful when they need to go a different specialist.Participants agreed that there is a need for a system to interact with medication as“young caregivers need to search too much information, anciens [older, more expe-rienced caregivers] already know all of that.” Participants agreed MeViTa is ‘a’ rightkind of tool, yet seven participants responded neutral as it is not necessarily ‘the’ rightkind of tool. Eight out of 12 participants strongly agreed and 4 agreed that the systemcan prevent medical mistakes, such as for example medication-medication interactions.Finally, the details are at the right level for 11 out of 12 participants. The scores on theSUS questionnaire was on average 81.5, ranking MeViTa with an A grade [37]. Thequestion on whether they would like to use the system frequently scored lowest. Twoout of 12 participants who answered negatively mentioned they would only like to useit when they were prescribed new medication, or when they have a question. In contrastto prior evaluation, both questions: “I felt very confident using the system” and “I think
Table 1. Average time needed to perform each task and the view needed.
Task Leaflet MeViTa Δ View
1. Can you tell me theside-effects of that white/redbox?
69 s ± 37 s 107 s ± 55 s +70 s Side-effects
2. On which times during the daycan Julie use the red box?
29 s ± 19 s 45 s ± 33 s +16 s Dosageregimen
3. Why do you think Julie shouldtake this blue box?
/ 5 s ± 2 s / Interaction
4. How do you rate the chanceJulie will get a dry throat?
/ 10 s ± 10 s / Side-effects
5. Do you think Julie can drinkalcohol while taking thesemedications?
/ 20 s ± 21 s / Interaction
6. Can Julie combine these twoblue boxes?
/ 53 s ± 66 s / Interaction
7. How much longer before Juliecan take a pain killer for herheadache?
/ 30 s ± 27 s / Interactionor dosageregimen
MeViTa: Interactive Visualizations to Help Older Adults 145

that I would need the support of a technical person to be able to use this system.”scored positive suggesting an improvement over the previous setup.
5.5 Interaction Strategies
In Study 4: Elderly Community (Sect. 4.4) participants only touched the medicationboxes when they explicitly needed to move them to alternate between views. In thisevaluation, however, other interaction strategies were observed. We observed two kindof actions. The first kind of actions we call ‘better overview’: some participants movedthe boxes in such a way to eliminate line intersections or moved boxes further apart tocreate more distance between the visualization elements for a better overview. Thesecond type of interactions we classify as ‘remove’: some participants tooknon-relevant boxes from the table to simplify the visualization. Initially, we also loggedwhen participants touched the boxes to confirm they were answering the questions ofthe right box and when they, unintentionally, held something above the boxes so thecamera lost track of the box. All actions were logged using the video recordings andmanually extracted. Table 2 shows a summary of all actions logged.
No relation, nor trend was found between the amount of times a participant per-formed an interaction and how he or she performed on a task. Nor was there any trendobserved between the amount of interactions and the answers on the questionnaires.However, as explained above, two strategies were observed for obtaining a better
Fig. 8. Answers from the 12 participants ranging from strongly disagree to strongly agree. Thebox plots visualize the answers on the perceived usefulness questions. Dotted lines indicate themean and standard deviations.
Table 2. Overview of the number of times participants interacted with the medication boxesranked per task.
Task 1 Task 2 Task 3 Task 4 Task 5 Task 6 Task 7 Total
Better overview 2 6 0 2 1 1 0 12Remove 0 6 2 0 0 6 0 14switch between views 0 14 2 1 9 9 1 36Touch to confirm box 2 6 0 5 1 2 2 18Block From camera 0 3 0 2 1 1 0 7Total 4 35 4 10 12 19 3
146 R. De Croon et al.

overview: moving boxes or removing them. The latter strategy was mostly used whenparticipants needed to move boxes to switch between views. They moved the box theywere interested in to the right location and took the other boxes away. Finally, the viewfrom the camera was blocked seven times of which three occurrences are related to oneparticipant. This was not an issue as this primarily occurred while participants weremoving other boxes around so they did not even notice this occurrence.
5.6 Memorability
After each evaluation participants were asked (1) if they could still name theside-effects of Motilium and the side-effects of the white/red box, and (2) if they couldsay the dosage regimen of both Motilium and the red box. Question 1 and 2 wereanswered correctly by respectively five and eight participants who used the leaflet.
Using MeViTa, correct responses were lower: question 1 and 2 were answeredcorrectly by two and five participants respectively. From these results, we cannot showMeViTa helps participants recall medication information more effectively.
6 Discussion
6.1 MeViTa as a Tool to Explore Medication Information
In this paper, we proposed MeViTa to empower older adults to explore medicationinformation. MeViTa is designed using a user-centered methodology. Thus, changesmade to each intermediate design improved general usability and functionality.Suggestions raised during the five iterative studies were incorporated in each updatedversion as described in Sect. 4.
It is important to optimize and minimize the information shown to the user. On theother hand, Shneiderman’s mantra [39] advocates to first show an overview andafterwards let the user find the details on demand. However, our initial design wasdeemed too complex by our expert consortium members (Problem 1). Furthermore, itshowed redundant (Problem 3) or non-interesting information (Problem 9), such as themedication’s half-life, which could make it harder to remember how to switch betweenviews (Problem 4). In Study 3: Medical Validity we learned which medication infor-mation is locally available (Problem 5) and that health-related issues are a personalexperience (Problem 6). Finally, especially when working with an older audience,reachability should be considered (Problem 10), as they can experience issues reachingthe far end of a table.
Although none of our participants had interacted with a camera-projector systembefore, most remarks concerned the visualization’s learning curve and not the use of acamera-projector system. We thus argue that the technical choice was appropriate totest our visualizations. Alternative solutions include a tabletop that can recognizetangibles or a tablet. All participants mentioned they liked this approach as they did notneed to learn any new interaction paradigms. The positive perception is also reflected inthe average SUS score of 81.5.
MeViTa: Interactive Visualizations to Help Older Adults 147

Finally, we observed that by showing the little colored people icons to showuncertainty [43] people were generally less concerned with the likelihood of aside-effect. When they visually saw 1 in 100 people, they realized the likelihood issmaller than they initially thought when just reading 1% or ‘uncommon’. As oursample size is small, we cannot draw strong conclusions from this observation, but theobservation is interesting for further research.
6.2 Lessons Learned with Older Participants
Important lessons were learned by analyzing the qualitative evaluation data and byobserving our participants performing each task. Foremost, like Kobayashi et al. [26]our participants in Study 4: Elderly Community were easily confused. In the suc-ceeding studies participants were therefore better informed about the medication on thetable not being their own medication for evaluation purposes. Furthermore, the name ofJulie was always mentioned as a reminder and colors were used to refer to medication.
Like Wrede-Sach et al. [50], we also learned older adults place a lot of trust in theirGP. Some participants were not willing to read an unknown leaflet as their doctor toldthem not to read their leaflets. Moreover, in Study 4: Elderly Community only oneparticipant could successfully read the leaflet. Therefore, in the final evaluation, weonly asked participants to do two tasks using the leaflet and used an off-the-marketmedication to consider their doctors’ concern. Even then, we could sometimes noticesome frustration when they were asked a second question using the leaflet. Althoughwe observed faster timings when participants were asked to perform a similar task, thischosen methodology limited us to ask the participant to perform similar tasks toeliminate learning effects.
6.3 Evaluation Results
Answers on the perceived usefulness questions improved compared to Study 4: ElderlyCommunity. Reasons can be twofold. First, both the issues with the non-interestinghalf-life and the reachability were addressed and consequently participants received abetter experience. Second, the participants in the first iteration were on average sevenyears older and were recruited through a community, whereas participants in the finalevaluation were recruited using a public call in a health magazine and were asked toregister online.
Only basic interaction strategies were discovered. Participants moved boxes for abetter overview, took boxes from the table to simplify the visualization and sometimestouched the box to ask for confirmation. Given our limited number of participants, nostatistically relevant results could be discovered. However, in contrast to Harada et al.[17], we did not discover any unintentional interactions by using objects as an inputmechanism to control the views [14].
6.4 Limitations
The number of participants (in total 26) and the absence of a control condition can beseen as a limitation of our current work. However, like Sonne et al. [42] “we argue […]
148 R. De Croon et al.

that it is more important to first uncover potential problems and understand the use ofthe technology, than to conduct longer and larger efficacy studies.” Furthermore, toallow for a comparison between participants we used a non-personal realistic medi-cation regimen instead of asking each participant to bring their own medication.Moreover, we should first discover potential issues and get medical clearance beforeshowing real, personal medication information.
7 Conclusion
In this study, we made the following contributions: first, we presented the design andimplementation of an open-source camera-projector system that visualizes medicationinformation around medication boxes on a table. Second, we presented the results ofthe evaluation of the perceived usefulness of our design with in total 26 older adultsparticipants, and we described both weaknesses and benefits for the HCI communityworking with technology for older adults. Finally, we also discussed the issues olderadults can experience during evaluations with a camera-projector system. To furthervalidate MeViTa, we already made a tentative agreement with the country’s largestmedication database provider to use their medically validated data in MeViTa.
We believe that with five intermediate studies as described in Sect. 4, and the finalevaluation we could to show the perceived usefulness of MeViTa. Qualitative feedbackgathered in the different studies shows that MeViTa can empower older adults byvisualizing medication information. Although not everybody agreed MeViTa is theonly kind of tool that could help them, they do strongly agree there is a need for anapplication that helps them explore medication info. Unfortunately, we were not able toproof that MeViTa can augment people’s ability to recall medication information betteror has a time benefit. However, participants indicated that MeViTa helps to understandmedication information and increases awareness, that it helps to reduce medical errorsand that they would like to use MeViTa in sessions with their GP.
Acknowledgments. MyHealthData is a project co-funded by imec, a digital research institutefounded by the Flemish Government. Project partners are EBMPracticeNet, CEBAM,HealthConnect, CM, and MindBytes with project support from Agentschap Innoveren &Ondernemen. The authors would also like to thank all participants and the anonymous reviewersfor their extensive feedback to improve the quality of the paper.
References
1. ActiveCues: Tovertafel original. https://dutchgamesassociation.nl/thoughts/517. Accessed 5May 2017
2. Bangor, A., Kortum, P., Miller, J.: Determining what individual SUS scores mean: adding anadjective rating scale. J. Usability Stud. 4(3), 114–123 (2009)
3. Bardram, J.E., Frost, M., Szántó, K., Faurholt-Jepsen, M., Vinberg, M., Kessing, L.V.:Designing mobile health technology for bipolar disorder: a field trial of the monarca system.In: Proceedings of the SIGCHI Conference on Human Factors in Computing Systems,pp. 2627–2636. ACM, New York, April 2013
MeViTa: Interactive Visualizations to Help Older Adults 149
4. Barsky, A.J., Saintfort, R., Rogers, M.P., Borus, J.F.: Nonspecific medication side effectsand the nocebo phenomenon. JAMA 287(5), 622–627 (2002)
5. Basen, M.M.: The elderly and drugs–problem overview and program strategy. Public HealthRep. 92(1), 43–48 (1997)
6. Bay, H., Ess, A., Tuytelaars, T., Van Gool, L.: Speeded-Up robust features (SURF).Comput. Vis. Image Underst. 110(3), 346–359 (2008)
7. Berry, D.C., Knapp, P., Raynor, D.K.: Provision of information about drug sideeffects topatients. Lancet 359(9309), 853–854 (2002)
8. Bostock, M., Ogievetsky, V., Heer, J.: D3: data-driven documents. IEEE Trans. Vis.Comput. Graph. 17(12), 2301–2309 (2011)
9. Brooke, J.: SUS-a quick and dirty usability scale. Usability Eval. Ind. 189(194), 4–7 (1996)10. Dayer, L., Heldenbrand, S., Anderson, P., Gubbins, P.O., Martin, B.C.: Smartphone
medication adherence apps: potential benefits to patients and providers. J. Am. Pharm.Assoc. 53(2), 172–181 (2013)
11. De Croon, R., Klerkx, J., Duval, E.: A Proof-of-Concept visualization to increasecomprehension of personal medication schemes. In: Proceedings of the 10th EAIInternational Conference on Pervasive Computing Technologies for Healthcare, pp. 25–32. ICST, Cancun, June 2016
12. Duke, J., Faiola, A., Kharrazi, H.: A novel visualization tool for evaluating medicationside-effects in multi-drug regimens. In: Jacko, J.A. (ed.) HCI 2009. LNCS, vol. 5613,pp. 478–487. Springer, Heidelberg (2009). doi:10.1007/978-3-642-02583-9_52
13. Fischoff, B., Brewer, N., Downs, J.: Communicating risks and benefits: an evidencebaseduser’s guide. Technical report, Food and Drug Administration, New Hampshire Ave, SilverSpring (2011)
14. Fitzmaurice, G.W.: Graspable user interfaces. Ph.D. thesis, University of Toronto (1996)15. Gugenheimer, J., Knierim, P., Winkler, C., Seifert, J., Rukzio, E.: UbiBeam: exploring the
interaction space for home deployed projector-camera systems. In: Abascal, J., Barbosa, S.,Fetter, M., Gross, T., Palanque, P., Winckler, M. (eds.) INTERACT 2015. LNCS, vol. 9298,pp. 350–366. Springer, Cham (2015). doi:10.1007/978-3-319-22698-9_23
16. Haider, S.I., Johnell, K., Weitoft, G.R., Thorslund, M., Fastbom, J.: The influence ofeducational level on polypharmacy and inappropriate drug use: a register-based study ofmore than 600,000 older people. J. Am. Geriatr. Soc. 57(1), 62–69 (2009)
17. Harada, S., Sato, D., Takagi, H., Asakawa, C.: Characteristics of elderly user behavior onmobile multi-touch devices. In: Kotzé, P., Marsden, G., Lindgaard, G., Wesson, J.,Winckler, M. (eds.) INTERACT 2013. LNCS, vol. 8120, pp. 323–341. Springer, Heidelberg(2013). doi:10.1007/978-3-642-40498-6_25
18. Hasher, L.: Zacks, R.T., May, C.P.: Inhibitory control, circadian arousal, and age. In:Attention and Performance XVII, Cognitive Regulation of Performance: Interaction ofTheory and Application, pp. 653–675 (1999)
19. Hugtenburg, J.G., Timmers, L., Elders, P.J., Vervloet, M., van Dijk, L.: Definitions, variants,and causes of nonadherence with medication: a challenge for tailored interventions. PatientPrefer. Adherence 7, 675–682 (2013)
20. Ikea: Concept kitchen 2025. http://conceptkitchen2025.ideo.london/. Accessed 5 May 201721. Jimmy, B., Jose, J.: Patient medication adherence: measures in daily practice. Oman Med.
J. 26(3), 155–159 (2011)22. Jones, B., Sodhi, R., Murdock, M., Mehra, R., Benko, H., Wilson, A., Ofek, E., MacIntyre,
B., Raghuvanshi, N., Shapira, L.: RoomAlive: magical experiences enabled by scalable,adaptive projector-camera units. In: Proceedings of the 27th Annual ACM Symposium onUser Interface Software and Technology, pp. 637–644. ACM, Honolulu, October 2014
150 R. De Croon et al.

23. Katz, M.G., Kripalani, S., Weiss, B.D.: Use of pictorial aids in medication instructions: areview of the literature. Am. J. Health Syst. Pharm. 63(23), 2391–2397 (2006)
24. Kientz, J.A., Goodwin, M.S., Hayes, G.R., Abowd, G.D.: Interactive technologies forautism. Synth. Lect. Assistive Rehabilitative Health-Preserving Technol. 2(2), 1–177 (2013)
25. Kobayashi, L.C., Wardle, J., Wolf, M.S., Wagner, C.: Aging and functional health literacy: asystematic review and meta-analysis. J. Gerontol. B Psychol. Sci. Soc. Sci. 71(3), 10–1093(2014)
26. Kobayashi, M., Hiyama, A., Miura, T., Asakawa, C., Hirose, M., Ifukube, T.: Elderly userevaluation of mobile touchscreen interactions. In: Campos, P., Graham, N., Jorge, J., Nunes,N., Palanque, P., Winckler, M. (eds.) INTERACT 2011. LNCS, vol. 6946, pp. 83–99.Springer, Heidelberg (2011). doi:10.1007/978-3-642-23774-4_9
27. Kripalani, S., Yao, X., Haynes, R.B.: Interventions to enhance medication adherence inchronic medical conditions: a systematic review. Arch. Intern. Med. 167(6), 540–550 (2007)
28. Labbé, M.: Find-object (2011). http://introlab.github.io/find-object29. Lee, M.L., Dey, A.K.: Real-time feedback for improving medication taking. In: Proceedings
of the 32nd Annual ACM Conference on Human Factors in Computing Systems, pp. 2259–2268. CHI 2014. ACM, New York (2014)
30. Liu, F., Abdul-Hussain, S., Mahboob, S., Rai, V., Kostrzewski, A.: How useful aremedication patient information leaflets to older adults? a content, readability and layoutanalysis. Int. J. Clin. Pharm. 36(4), 827–834 (2014)
31. MacLaughlin, E.J., Raehl, C.L., Treadway, A.K., Sterling, T.L., Zoller, D.P., Bond, C.A.:Assessing medication adherence in the elderly: which tools to use in clinical practice? DrugsAging 22(3), 231–255 (2005)
32. Montamat, S.C., Cusack, B.: Overcoming problems with polypharmacy and drug misuse inthe elderly. Clin. Geriatr. Med. 8(1), 143–158 (1992)
33. Ng, A.W.Y., Chan, A.H.S., Ho, V.W.S.: Comprehension by older people of medicationinformation with or without supplementary pharmaceutical pictograms. Appl. Ergon. 58,167–175 (2017)
34. Nieuwlaat, R., Wilczynski, N., Navarro, T., Hobson, N., Jeffery, R., Keepanasseril, A.,Agoritsas, T., Mistry, N., Iorio, A., Jack, S., Sivaramalingam, B., Iserman, E., Mustafa, R.A.,Jedraszewski, D., Cotoi, C., Haynes, R.B.: Interventions for enhancing medicationadherence. Cochrane Database Syst. Rev. (11), CD000011 (2014)
35. O’Leary, P., Carroll, N., Richardson, I.: The practitioner’s perspective on clinical pathwaysupport systems. In: 2014 IEEE International Conference on Healthcare Informatics,pp. 194–201. IEEE, Verona (2014)
36. Rothman, A.J., Kiviniemi, M.T.: Treating people with information: an analysis and reviewof approaches to communicating health risk information. J. Natl. Cancer Inst. Monogr.Monogr. 25, 44–51 (1999)
37. Sauro, J.: A Practical Guide to the System Usability Scale: Background, Benchmarks & BestPractices. CreateSpace Independent Publishing Platform, North Charleston (2011)
38. Schüz, B., Marx, C., Wurm, S., Warner, L.M., Ziegelmann, J.P., Schwarzer, R.,Tesch-Römer, C.: Medication beliefs predict medication adherence in older adults withmultiple illnesses. J. Psychosom. Res. 70(2), 179–187 (2011)
39. Shneiderman, B.: The eyes have it: a task by data type taxonomy for informationvisualizations. In: Proceedings 1996 IEEE Symposium on Visual Languages, pp. 336–343.IEEE Computer Society Press, Boulder, September 1996
40. Siek, K.A., Khan, D.U., Ross, S.E., Haverhals, L.M., Meyers, J., Cali, S.R.: Designing apersonal health application for older adults to manage medications: a comprehensive casestudy. J. Med. Syst. 35(5), 1099–1121 (2011)
MeViTa: Interactive Visualizations to Help Older Adults 151

41. Slone Epidemiology Center: Patterns of medication use in the united states 2006. Technicalreport, Epidemiology Center at Boston University, Boston (2006)
42. Sonne, T., Müller, J., Marshall, P., Obel, C., Grønbæk, K.: Changing family practices withassistive technology: MOBERO improves morning and bedtime routines for children withADHD. In: Proceedings of the 2016 CHI Conference on Human Factors in ComputingSystems, pp. 152–164. ACM, New York, May 2016
43. Spiegelhalter, D., Pearson, M., Short, I.: Visualizing uncertainty about the future. Science333(6048), 1393–1400 (2011)
44. Tanuwidjaja, E., Huynh, D., Koa, K., Nguyen, C., Shao, C., Torbett, P., Emmenegger, C.,Weibel, N.: Chroma: a wearable augmented-reality solution for color blindness. In:Proceedings of the 2014 ACM International Joint Conference on Pervasive and UbiquitousComputing, UbiComp 2014, pp. 799–810. ACM, New York (2014)
45. The Regents of the University of Michigan and the Robert Wood Johnson Foundation:Visualizing health. http://www.vizhealth.org/. Accessed 5 May 2017
46. Ullmer, B., Ishii, H.: The metaDESK: models and prototypes for tangible user interfaces. In:Proceedings of the 10th Annual ACM Symposium on User Interface Software andTechnology, UIST 1997, pp. 223–232. ACM, New York (1997)
47. vitalink: Medicatiegegevens delen. http://www.vitalink.be/medicatiegegevens-delen.Accessed 5 MAy 2017
48. Waycott, J., Vetere, F., Pedell, S., Morgans, A., Ozanne, E., Kulik, L.: Not for me: olderadults choosing not to participate in a social isolation intervention. In: Proceedings of the2016 CHI Conference on Human Factors in Computing Systems, CHI 2016, pp. 745–757.ACM, New York (2016)
49. Wilson, A.D., Benko, H.: Combining multiple depth cameras and projectors for interactionson, above and between surfaces. In: Proceedings of the 23nd annual ACM Symposium onUser Interface Software and Technology, pp. 273–282. ACM, New York, October 2010
50. Wrede-Sach, J., Voigt, I., Diederichs-Egidi, H., Hummers-Pradier, E., Dierks, M.L.,Junius-Walker, U.: Decision-making of older patients in context of the doctorpatientrelationship: a typology ranging from “self-determined” to “doctor-trusting” patients. Int.J. Family Med. 2013, 478498 (2013)
51. Yamamoto, G., Hyry, J., Krichenbauer, M., Taketomi, T., Sandor, C., Kato, H., Pulli, P.: Auser interface design for the elderly using a projection tabletop system. In: 2015 3rdIEEE VR International Workshop on Virtual and Augmented Assistive Technology(VAAT), vol. 51, pp. 29–32. IEEE, March 2015
152 R. De Croon et al.