metsä board q1 2016 interim report presentation
TRANSCRIPT
Metsä BoardInterim report Q1/2016

• Stable market situation
• Paperboard deliveries were at all-time-high
level
• Operating result remained on the same level
as in Q4/2015
• Increase in working capital weakened
operative cash flow
• Balance sheet remained strong
• After the review period, Metsä Board
announced to iniatiate efficiency improvement
programme at Husum integrate
Q1 20162
Key points in Q1/2016

• Slight delay in the start-up
• Required quality targets have already been
reached
• First deliveries to US have arrived
• Target is to sell 200 000 tonnes of new folding
boxboard in 2016
• Total capacity, 400 000 tonnes, is expected to be
reached by end of this year
• Change from a paper mill to a paperboard mill is
completed
Q1 20163
New folding boxboard
machine in Husum
started in February

Q1 20164
Paper deliveries decreased as planned and
reduced sales
36 28 35 37 43 47 55 35 35
7%
6%7%
7%8%
9%
11%
8% 8%
0%
5%
10%
15%
0
10
20
30
40
50
Q1/14 Q2/14 Q3/14 Q4/14 Q1/15 Q2/15 Q3/15 Q4/15 Q1/16
Operating result*EUR million and % of sales
21 20 27 32 32 40 48 30 30
4% 4%5%
6% 6%
8%
10%
7% 7%
0%
5%
10%
15%
0
10
20
30
40
50
Q1/14 Q2/14 Q3/14 Q4/14 Q1/15 Q2/15 Q3/15 Q4/15 Q1/16
Pre-tax result* EUR million and % of sales
501 494 514 499 526 522 498 462 436200
300
400
500
600
Q1/14 Q2/14 Q3/14 Q4/14 Q1/15 Q2/15 Q3/15 Q4/15 Q1/16
SalesEUR million
*) excluding non-recurring items

• Low production volumes in Husum
due to the start-up of new folding
boxboard machine (↓)
• Lower market pulp prices (↓)
• Decrease in unprofitable paper
production (↑)
• Fixed costs and depreciation were
reallocated from non-core operations
to paperboard-segment (↑) (↓)
Q1 20165
Main result drivers in Q1 were Husum investment
programme and decreased paper production
0
10
20
30
40
Q4/2015 Paperboard Non-coreoperations
Otheroperations
Q1/2016
EBIT bridge Q4/15 vs. Q1/16excl. non-recurring items
EU
R m
illio
n
35 35
-9
+9

Q1 20166
Growing paperboard deliveriesCAGR% in 2011–2015 has been 9%
191 197 210 203 204 213 224 224 227
112 110120
111130
141 137 131 142
0
60
120
180
240
300
360
Q1/14 Q2/14 Q3/14 Q4/14 Q1/15 Q2/15 Q3/15 Q4/15 Q1/16
Folding boxboard Fresh forest fibre linerboard1,000 tonnes
Note! Figures exclude wallpaper deliveries

Profitability impacted by Husum investment
programme
ROCE-%, excl. non-recurring items
Q1 20167
EBIT-%, excl. non-recurring items
4,8
6,4
9,1
11,3
8,3
0
2
4
6
8
10
12
2012 2013 2014 2015 Q1/2016
3,6
5,2
6,8
9,0
8,0
0
2
4
6
8
10
2012 2013 2014 2015 Q1/2016
Target over 12% from 2017

61 60 6551
42
16% 15% 16%13%
11%
-2%
1%
4%
7%
10%
13%
16%
0
20
40
60
Q1/15 Q2/15 Q3/15 Q4/15 Q1/16
0
100
200
300
400
Q1/15 Q2/15 Q3/15 Q4/15 Q1/16
• Stable sales development
• Operating result was negatively impacted by
– Low production volumes in pulp and folding boxboard in Husum
– Decrease in market pulp prices
– Increased depreciation
– Fixed costs reallocations from non-core segment
• Pulp trading to Sappi Ltd discontinued. Impact on 2016 sales is approximately EUR 60 million. No impact on 2016 result.
Q1 20168
Paperboard segment in Q1/2016
Operating result, EUR millionexcl. non-recurring items
Sales, EUR million
EU
R m
illio
nE
UR
mill
ion
Operating result
Operating result,
EBIT-%

0
50
100
150
Q1/15 Q2/15 Q3/15 Q4/15 Q1/16
• Paper deliveries decreased to
15 000 tonnes (Q4/2015: 65 000 and
Q1/2015: 156 000)
• Sales down to EUR 18 million
• Decreased depreciation and fixed
costs improved the segment’s result
• Metsä Board estimates, that remaining
paper production will be fully
discontinued by end of 2016
Q1 20169
Non-core operations segment in Q1/2016
-3,2 -3,4
-1,3
-8,4
0,2
-3% -3%-2%
-17%
1%
-18%-16%-14%-12%-10%-8%-6%-4%-2%0%2%
-18
-14
-10
-6
-2
2
Q1/15 Q2/15 Q3/15 Q4/15 Q1/16
Sales, EUR million
Operating result, EUR millionexcl. non-recurring items
EU
R m
illio
nE
UR
mill
ion
Operating result, EUR million
Operating result, EUR million
EBIT-%

• FX rate changes had only a slight negative impact on EBIT in Q1/2016
• Hedging duration of the main foreign currency flows is 3–5 months
Q1 201610
FX exposure and sensitivities
63 %27 %
7 % 3 % USD
SEK
GBP
Othercurrencies
FX exposure by currency
Annual gross amount EUR 1.1 billionAnnual FX sensitivities
to Group EBIT before hedges
10 % strengthening of foreign currency vs. EUR
will have an impact on Metsä Board’s annual EBIT of
Currency 2016 (est.)
USD, $ EUR +60 million
GBP, £ EUR +10 million
Swedish krona EUR -30 million

Q1 201611
Growing working capital and investments had a
negative impact on cash flows
-19
92
51 74 33 56 93 66
-22
-24
78
46 56 9 8 45 8
-76
19
114
157
198
250
214
256 247
193
-37
57
110155
188
119 118
70
-15
-100
-50
0
50
100
150
200
250
300
Q1/14 Q2/14 Q3/14 Q4/14 Q1/15 Q2/15 Q3/15 Q4/15 Q1/16
Cash flow from operations, quarterly Free cash flow, quarterly
Cash flow from operations, rolling 12 months Free cash flow, rolling 12 months
EUR million

Q1 201612
Strong balance sheet
Equity ratio, %
33%
41%39%
47%44%
0%
10%
20%
30%
40%
50%
2012 2013 2014 2015 3/16
73%70%
51%
32%
42%
0%
10%
20%
30%
40%
50%
60%
70%
80%
2012 2013 2014 2015 3/16
Net gearing, %
625 597 427 333 412
3.4
2.9
1.81.2
1.5
0
1
2
3
4
0
200
400
600
2012 2013 2014 2015 3/16
Net debt, EUR million
Net debt/EBITDA (rolling 12m)
Net debt, EUR million and
Net debt/EBITDA

• In Q1/2016 the gross
investments were EUR 54 million
(Q1/15: 24) and depreciation
EUR 23 million (Q1/15: 26).
• Annual maintenance capex is
EUR 40–60 million
• Main growth capexes in 2016:
– Husum investment programme:
EUR 40 million (total EUR 170
mil.)
– Extrusion line:
EUR 23 million (total EUR 38
mil.)
– Metsä Fibre’s bioproduct mill:
EUR 25 million*
Q1 201613
Capital expenditure
0
30
60
90
120
150
180
2010 2011 2012 2013 2014 2015 2016E
Capex Growth capex Depreciation
EUR million
*) investment in equity

• Total investment value is EUR 170 million
• Total annual EBIT impact EUR 50 million, full
impact in 2018
• Low production volumes in pulp and folding
boxboard in H1 2016
Q1 201614
Impacts of Husum investment
programme

• Healthy demand in fresh forest fibre paperboards
expected to continue
• Total delivery volumes in paperboard expected to
grow compared to Q1/2016
• Q2 profitability will be impacted by
– Start-up phase including low average price of new folding
boxboard from Husum
– Higher number of maintenance shutdowns vs. Q1
• Total production costs are expected to remain
stable
Q1 201615
Outlook for Q2

Metsä Board’s operating result
excluding non-recurring items
in Q2/2016 is expected to
remain roughly on the same
level as in Q1/2016
Q1 201616
Profit guidance
for Q2/2016

• Q1 result remained on the same level as in Q4
• Sales expected to grow from Q2 onwards
• All-time-high delivery volumes in paperboard
• Finnish paperboard mills were operating at full
speed
• New folding boxboard machine in Husum started
in February, quality targets have been reached
• Market situation expected to remain stable
Q1 201617
Summary

Appendix

Q1 201619
Financials in Q1/2016
Q1/16 Q4/15Change
Q1/16
vs. Q4/15Q1/15
Change
Q1/16
vs. Q1/15FY 2015
Sales EUR million 436 462 ↓ 526 ↓ 2 008
EBITDA, excl. NRIs EUR million 58 60 ↓ 70 ↓ 283
% of sales % 13 13 13 14
Operating result, excl. NRIs EUR million 35 35 43 ↓ 180
% of sales % 8 8 8 9
Result before taxes, excl. NRIs EUR million 30 30 32 ↓ 150
Earnings per share EUR million 0.07 0.07 0.09 ↓ 0.39
ROCE, excl. NRIs % 8 8 11 ↓ 11
Gross investments EUR million 54 61 ↓ 24 ↓ 178
Cash flow from operations EUR million -22 66 ↓ 33 ↓ 247

Q1 201620
Price development in folding boxboard and
white-top kraftliner in 2009 – Q1/2016
Sources: Pöyry Management Consulting ja FOEX Indexes Ltd
EUR/ ton
Folding boxboard White-top kraftliner

Q1 201621
Pulp price development (PIX)
2010 – Q1/2016
350
400
450
500
550
600
650
700
750
800
850
900
950
1000
1050
'10 '11 '12 '13 '14 '15 '16
350
400
450
500
550
600
650
700
750
800
850
900
950
1000
1050
Source: Foex Indexes Ltd
Softwood, USD
Softwood, EUR
Hardwood, EUR
Hardwood, USD
USDEUR
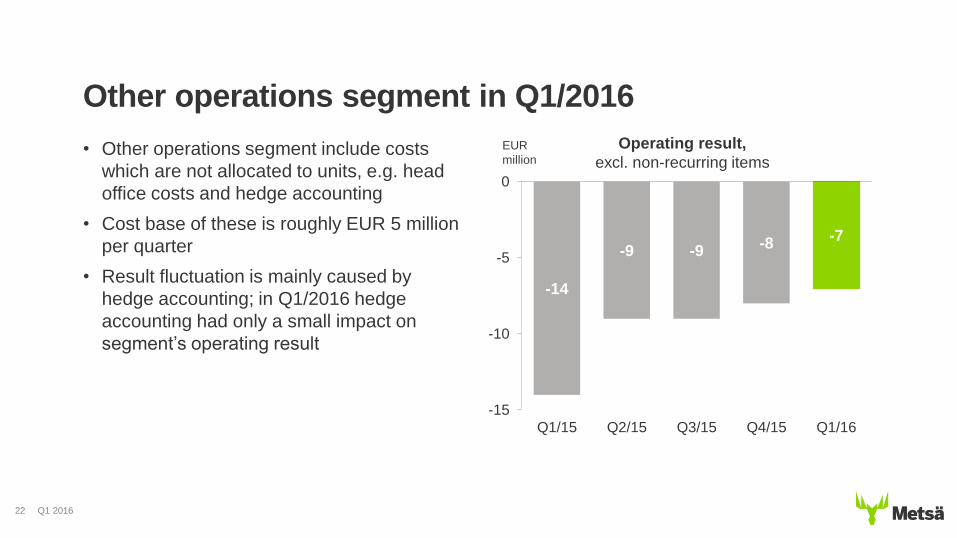
• Other operations segment include costs
which are not allocated to units, e.g. head
office costs and hedge accounting
• Cost base of these is roughly EUR 5 million
per quarter
• Result fluctuation is mainly caused by
hedge accounting; in Q1/2016 hedge
accounting had only a small impact on
segment’s operating result
Q1 201622
Other operations segment in Q1/2016
-14
-9 -9-8
-7
-15
-10
-5
0
Q1/15 Q2/15 Q3/15 Q4/15 Q1/16
Operating result,
excl. non-recurring itemsEUR
million

Q1 201623
EBITDA development,excl. non-recurring items
6252
62 6170 73
81
60 58
12%
11%
12% 12%
13%
14%
16%
13% 13%
0%
2%
4%
6%
8%
10%
12%
14%
16%
18%
0
10
20
30
40
50
60
70
80
90
100
Q1/14 Q2/14 Q3/14 Q4/14 Q1/15 Q2/15 Q3/15 Q4/15 Q1/16
EU
R m
illio
n

Q1 201624
Net financial costs are declining steadily
47 56 39 32 5 3,0
3,5
4,0
4,5
5,0
5,5
0
20
40
60
2012 2013 2014 2015 Q1/16
Net financial costs, EUR million
Average interest rate, %
EUR million Q1/16 Q1/15 FY2015
Financial income and
expenses-6.5 -7.2 -28.6
Net FX gains and
losses1.6 -3.8 -3.4
Total net financials -4.9 -11.0 -32.0
Avg. interest
rate, %3.7% 3.8%
EUR million %

Q1 201625
Debt structure and liquidity31 March 2016
32 %
29 %
23 %
11 %5 %
Bonds
Loans fromfinancialinstitutions
Pension loans
Finance leasesand other loans
Other short-termloans
63 %22 %
15 %Cash and cashequivalents
Revolving creditfacility
Unraised pensionloans
Debt structure,
total EUR 694 million
Available liquidity,
total EUR 447 million
Average repayment time of long-term borrowing at 31 March in 2016 was 2.3 years.

2005 2006 2007 2008 2009 2010 2011 2012 2013 2014 2015 Q1/2016
Q1 201626
Standard & Poor’s raised Metsä Board 's credit rating
to BB+ and outlook to positive
Moody’s
Standard & Poor’s
BB+ | Ba1
Stable
Positive
BB | Ba2
BB- | Ba3
B+ | B1
B | B2
B- | B3
CCC+ | Caa1
CCC | Caa2
Q1 201627
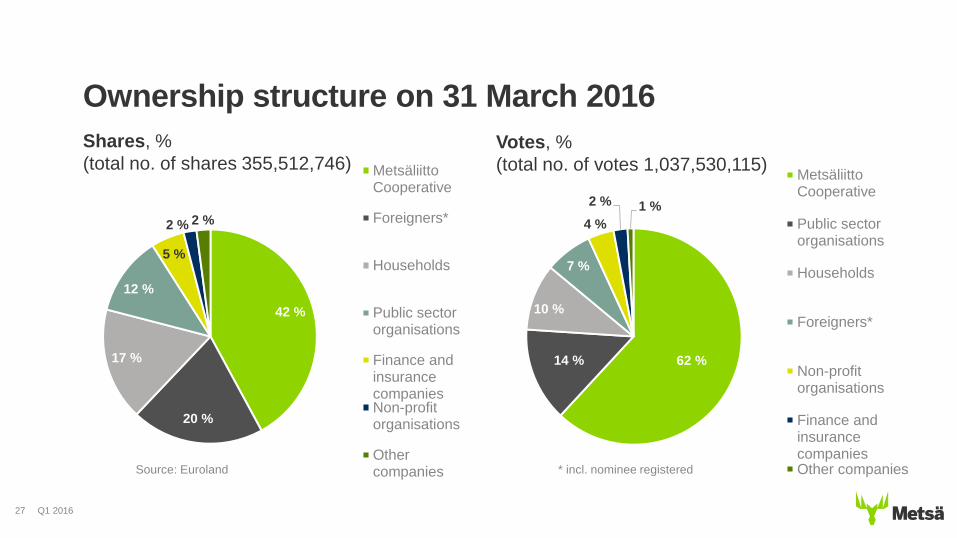
Ownership structure on 31 March 2016
42 %
20 %
17 %
12 %
5 %
2 % 2 %
MetsäliittoCooperative
Foreigners*
Households
Public sectororganisations
Finance andinsurancecompaniesNon-profitorganisations
Othercompanies
62 %14 %
10 %
7 %
4 %
2 % 1 %
MetsäliittoCooperative
Public sectororganisations
Households
Foreigners*
Non-profitorganisations
Finance andinsurancecompaniesOther companies
Shares, %
(total no. of shares 355,512,746)Votes, %
(total no. of votes 1,037,530,115)
* incl. nominee registeredSource: Euroland
