metsä board annual report 2020
TRANSCRIPT

Metsä BoardAnnual Report 2020
ME
TSÄ
GR
OU
P S
US
TAIN
AB
ILITY
RE
PO
RT
20
20
Metsä GroupSustainability Report 2020
METSÄ BOARD ANNUAL REPORT 2020
The cover of this annual report is MetsäBoard Prime FBB Bright folding boxboard. The pure fresh fibre used in our lightweight premium paperboards is a renewable raw material, fully traceable to sustainably managed northern forests.
PUBLISHER Metsä Board Corporation, [email protected]
Metsä Board’s Annual Report is published in English and in Finnish. Metsä Board publishes also a Remuneration Report. Reports are available in pdf format at www.metsaboard.com
Metsä Group Brochure 2020
Metsä Group Annual Review 2020
Metsä Board Annual Report2020
Metsä Board is a leading European producer of premium fresh fibre
paperboards and a forerunner in sustainability. Metsä Board is part of
Metsä Group.
Contents
Business operations and value creation
2 This is Metsä Board
4 CEO’s review
6 Highlights of the year
8 Strategy and targets
10 Creating value
12 Operating environment
16 Product and service development
18 Circular economy
Sustainability
20 Sustainability targets
24 We bring the forest to you
26 We offer sustainable choices
30 We work for a better climate and environment
34 We create well-being
40 Mill-specific information
Governance
134 Corporate governance statement
140 Metsä Board Corporation’s Board of Directors
142 Metsä Board Corporation’s Corporate Management Team
144 Investor relations and investor information
Financial development
44 Report of the Board of Directors
57 Consolidated financial statements
61 Notes to the consolidated financial statements
107 Parent company financial statements
110 Notes to the parent company financial statements
123 Auditor’s report
126 Shares and shareholders
132 Key figures and taxes
FUTURE GROWTH IS ENSURED THROUGH R&D AND INNOVATION WORK
The new state-of-the-art Excellence Centre
accelerates paperboard and packaging innovation.
16
METSÄ BOARD CREATES VALUE FOR ITS STAKEHOLDERS
We are continuously looking for opportu-
nities to grow profitably and sustainably
and generate value for all of our stake-
holders through our operations.
Combating climate change and resource scarcity require sustainable solutions. Recyclable packaging materials made from certified wood fibre and carbon-neutral production are strong competitive advantages. Through collaboration we can create new packaging solutions for the future.
The role of sustainable and safe packaging is more important than ever
10
ME
TSÄ
BO
AR
D A
NN
UA
L RE
PO
RT
20
20
Metsä Group Annual Review 2020
Metsä BoardAnnual Report 2020
ME
TSÄ
BO
AR
D A
NN
UA
L RE
PO
RT
20
20
Metsä GroupBrochure 2020
1
Metsä Group Sustainability Report 2020
METSÄ BOARD Annual Report 2020
Business operations and value creation
2 This is Metsä Board
4 CEO’s review
6 Highlights of the year
8 Strategy and targets
10 Creating value
12 Operating environment
16 Product and service development
18 Circular economy
Sustainability
20 Sustainability targets
24 We bring the forest to you
26 We offer sustainable choices
30 We work for a better climate and environment
34 We create well-being
40 Mill-specific information
Financial development
44 Report of the Board of Directors
57 Consolidated financial statements
61 Notes to the consolidated financial statements
107 Parent company financial statements
110 Notes to the parent company financial statements
123 Auditor’s report
126 Shares and shareholders
132 Key figures and taxes
Governance
134 Corporate governance statement
140 Metsä Board Corporation’s Board of Directors
142 Metsä Board Corporation’s Corporate Management Team
144 Investor relations and investor information

SUSTAINABILITYFINANCIAL DEVELOPMENT GOVERNANCE
METSÄ BOARD ANNUAL REPORT 2020
BUSINESS OPERATIONS AND VALUE CREATION
Metsä Board is a leading European producer of premium fresh fibre paperboards and a forerunner in sustainability.
* excluding PE-coated paperboards
This is Metsä Board
Metsä Board is part of Metsä Group, whose parent company is Metsäliitto Cooperative. Metsäliitto Cooperative owns 48% of Metsä Board’s shares and 67% of the voting rights. Metsä Board owns 24.9 per cent of its associated company Metsä Fibre. Taking this holding into account, Metsä Board’s annual pulp surplus is approximately 400,000 tonnes from 2021 onwards. Metsä Group’s wood procurement is operated centrally through Metsä Forest from Finland, Sweden, the Baltic countries and Russia.
Metsä Board’s total annual paperboard capacity is 2 million tonnes.
Sales split
SALES SPLIT BY PRODUCT% of sales
SALES SPLIT BY REGION% of sales
Folding boxboard 59
White kraftliner 25
Market pulp 12
Other 5
EMEA 68
Americas 23
APAC 9
2020 key figures
Source: Metsä Board’s estimates
Paperboard end-uses
END-USES OF FOLDING BOXBOARDS%
END-USES OF WHITE KRAFTLINERS%
Food and food service packaging
Other consumer products (pharma and cosmetics packaging among others)
Graphic end-uses
Shelf-ready packaging and point-of-sale solutions
Other consumer products
E-commerce
METSÄ GROUP
METSÄ FOREST
Wood supply and forest services
METSÄ WOOD
Wood products
METSÄ FIBRE
Pulp and sawn timber
METSÄ BOARD
Paperboard
METSÄ TISSUE
Tissue and greaseproof papers
Metsäliitto Cooperative 100% Metsäliitto Cooperative 100% Metsäliitto Cooperative 50.1%
Metsä Board 24.9%
Itochu Corporation 25.0%
Metsäliitto Cooperative 48%
Metsä Board is listed on Nasdaq Helsinki
Metsäliitto Cooperative 100%
Parent company Metsäliitto Cooperative, formed by 100,000 forest owners in Finland
Sales EUR
5.1 billion
Personnel
9,200
1,890SALESEUR million
221
OPERATING RESULT, COMPARABLEEUR million
12.2
COMPARABLE ROCE%
166INVESTMENTSEUR million
80
SHARE OF CERTIFIED WOOD FIBRE %
83
SHARE OF FOSSIL FREE ENERGY %, of total energy use
2,370PERSONNEL
8PRODUCTION UNITSIN FINLAND AND SWEDEN
# 1Our customers include brand owners, con-
verters, corrugated box manufacturers and
merchants.
We are a leading producer of folding boxboard
and white kraftliners in Europe, and globally in
coated white kraftliners.
Strong market position Long-term customers
METSÄ SPRING Innovation company
Focus on sustainable fresh fibre paperboards
We focus on recyclable, premium fresh fibre paperboards used primarily in
consumer goods packaging as well as in various retail packaging solu-
tions. The demand for these products is stable, regardless of economic
cycles. Our main products include folding boxboards and food service
boards as well as white kraftliners.
Strong position in a growing market
We are Europe’s leading producer of folding boxboard and white kraftlin-
ers, and globally the biggest producer of coated white kraftliners. In the
United States, we are the largest supplier of folding boxboard. We estimate
the global demand for our main products will grow by an annual rate of
roughly 2–3% in the long term.
We are part of Metsä Group
Metsä Board is part of Metsä Group, and benefits from the good availabil-
ity of the main raw material, northern wood. Our self-sufficiency in pulp
guarantees the consistent and high quality of the fibre and enables the
growth of our paperboard business. Metsä Group’s value chain from the
forest to the end products and further to the customer operates according
to the principles of sustainability and is a circular economy at its best.
Aiming for a fossil free future
We want to be a forerunner in sustainability. Our products support the
circular economy and provide alternatives to plastic: they are light, recy-
clable and compostable*. We aim for fossil free production and products
by 2030. This requires investments and the exploration of alternative raw
materials in cooperation with our partners.
HOLDING
32
METSÄ BOARD Annual Report 2020
Business operations and value creation
2 This is Metsä Board
4 CEO’s review
6 Highlights of the year
8 Strategy and targets
10 Creating value
12 Operating environment
16 Product and service development
18 Circular economy
Sustainability
20 Sustainability targets
24 We bring the forest to you
26 We offer sustainable choices
30 We work for a better climate and environment
34 We create well-being
40 Mill-specific information
Financial development
44 Report of the Board of Directors
57 Consolidated financial statements
61 Notes to the consolidated financial statements
107 Parent company financial statements
110 Notes to the parent company financial statements
123 Auditor’s report
126 Shares and shareholders
132 Key figures and taxes
Governance
134 Corporate governance statement
140 Metsä Board Corporation’s Board of Directors
142 Metsä Board Corporation’s Corporate Management Team
144 Investor relations and investor information

SUSTAINABILITYFINANCIAL DEVELOPMENT GOVERNANCE
CEO’S REvIEW | METSÄ BOARD ANNUAL REPORT 2020
BUSINESS OPERATIONS AND VALUE CREATION
The past year has been exceptional. In spring, the effects of the coronavirus pandemic, which are still present, shook the whole world. The top priority in our operations has been to ensure the safety of our employees, prevent the virus from spreading and secure the continuity of our business. I think we have succeeded well in achieving these aims. We have avoided cluster infections and our deliveries have continued without disruption during the pandemic. The annual maintenance shutdowns at our mills were also carried out successfully. The production efficiency of our mills was at a high level and we achieved new production records. I have seen positive attitudes, great teamwork and commitment in daily work – in line with precautionary measures and safety instructions. I would like to express my sincere thanks to our personnel for their excellent performance during these difficult times.
The coronavirus pandemic has increased the demand for pure and safe packaging materials, particularly in the food, beverage and pharmaceutical industries. Our product portfolio responds well to this demand, and our efficient supply chain has ensured continuous and reliable deliveries to our customers. Our paperboard deliveries in 2020, totalling 1,810,000 tonnes, were at a higher level than in the previous year. This is an excellent achievement considering that our business, and particularly our results early in the year, were burdened the paper industry strike in Finland, which lasted for more than two weeks. Our comparable operating result in 2020 was EUR 221 million and the return on capital employed was 12.2%. Cash flow from operations was strong, EUR 308 million. In accordance with our dividend policy, the Board of Directors proposes a distribution of EUR 0.26 per share.
WE GAIN A COMPETITIVE ADVANTAGE BY BEING A FORERUNNER IN SUSTAINABILITY AND COLLABORATING IN INNOVATIONS
We aim to be a forerunner in sustainability. For us, this means investing in resource efficiency and combating climate change, in sustainable products and the supply chain, and in the sustainable use of forests. We aim for entirely fossil free production and products by 2030. Our sustainability targets have been approved by the Science Based Targets initiative, and they meet the strictest requirements of the Paris Agreement, aiming to limit global warming to 1.5 degrees Celsius. In recognition of the control of greenhouse gas emissions and the sustainable use of water resources, Metsä Board was again accepted on to the CDP’s respected Climate A and Water A lists in 2020. In the CDP’s forest programme, we achieved level A-.
Growing consumption and the increased demand for sustainable packaging solutions are accelerating the need for innovations and close cooperation with customers and technology partners. The new state-of-the-art Excellence Centre in the bioeconomy ecosystem of Äänekoski, which we opened in September,
The paperboard market has been strong and the operational efficiency of our mills has been high, even in the challenging year of the coronavirus pandemic. Our strategy to focus on profitable growth in fresh fibre paperboards has proven to work and we are now in an even stronger position to develop our core business.
A strong year for Metsä Board
provides an excellent platform for development collaboration. As part of Metsä Group, we participate in large-scale collaboration projects which aim to develop high-volume bioproducts with a significantly lower carbon footprint compared to products currently on the market. An example of this is the 3D fibre product presently under development.
OUR STRATEGY EMPHASISES CLEAR CHOICES WHICH ENABLE OUR SUSTAINABLE GROWTH
Our strategy to focus on premium and recyclable fresh fibre paperboards has proven correct, and we will continue to implement it. Customers value our services and the high and consistent quality of our products, based on the excellence of our mills and tailor-made high-quality pulp. Late last year, we announced a cooperation arrangement with the Swedish forest owners’ cooperative Norra Skog, which will enable us to allocate more capital to the
The new state-of-the-art Excellence Centre in the bioeconomy ecosystem of Äänekoski provides an excellent platform for development collaboration.
development of the paperboard business in the coming years. Self-sufficiency in pulp and the stable market situation in the paperboard business support our future investment plans.
Population growth, urbanisation and climate change continuously set more requirements for packaging in terms of sustainability, recyclability and product safety. I see these as excellent opportunities to develop our business operations, grow profitably and create value for our shareholders.
Finally, I would like to thank our customers, employees and other partners for their trust and cooperation in 2020. We have a good starting point for 2021 – a favourable market situation, a strong financial position, and safe and sustainable products that meet growing global consumer demand. I am positive and confident about the future.
Mika Joukio
CEO
CEO’s review
54
METSÄ BOARD Annual Report 2020
Business operations and value creation
2 This is Metsä Board
4 CEO’s review
6 Highlights of the year
8 Strategy and targets
10 Creating value
12 Operating environment
16 Product and service development
18 Circular economy
Sustainability
20 Sustainability targets
24 We bring the forest to you
26 We offer sustainable choices
30 We work for a better climate and environment
34 We create well-being
40 Mill-specific information
Financial development
44 Report of the Board of Directors
57 Consolidated financial statements
61 Notes to the consolidated financial statements
107 Parent company financial statements
110 Notes to the parent company financial statements
123 Auditor’s report
126 Shares and shareholders
132 Key figures and taxes
Governance
134 Corporate governance statement
140 Metsä Board Corporation’s Board of Directors
142 Metsä Board Corporation’s Corporate Management Team
144 Investor relations and investor information

SUSTAINABILITYFINANCIAL DEVELOPMENT GOVERNANCE
BUSINESS OPERATIONS AND VALUE CREATION
BUSINESS OPERATIONS AND vALUE CREATION | METSÄ BOARD ANNUAL REPORT 2020
Highlightsin 2020
During the exceptional year marked by the coronavirus pandemic, we adopted strict operating methods, updated to meet the requirements of the new situation, to secure the health of our personnel and avoid chains of infection. The year highlighted the importance of the uninterrupted operation of the supply chains for food and pharmaceuticals. Keeping these supply chains as smooth as possible has required reliable paperboard deliveries and good cooperation with our customers.
In December, we announced our intention to sell 30% of the Husum pulp mill to Norra Skog. The transaction will increase Husum’s share of certified wood procured from Sweden. It will also enable a significant reallocation of the company’s development investments to paperboard. We also made a final investment decision on the first phase of the renewal of the Husum pulp mill. The first phase includes a new recovery boiler and turbine.
Our ambitious targets for reducing greenhouse gas emissions were approved by the Science Based Targets initiative in February. Our targets meet the strictest requirements of the Paris Agreement, which aims to limit global warming to 1.5 degrees.
In recognition of the management of greenhouse gas emissions and the sustainable use of water resources, Metsä Board was again accepted on to the CDP’s respected Climate A and Water A lists in 2020. In the CDP’s forest programme, the company achieved the level A-. In addition, Metsä Board was selected on CDP’s Supplier Engagement Rating Leaderboard for supply chain engagement on climate issues. In the spring, we achieved the highest level, Platinum, in EcoVadis’ corporate social responsibility assessment.
Metsä Group’s innovation company Metsä Spring and Valmet are building a pilot plant in Äänekoski for a 3D fibre product, which could replace packaging made from fossil-based raw materials. The project is part of the larger ExpandFibre programme, which is an approximately EUR 50 million R&D programme promoting the circular bioeconomy. The programme, in which Metsä Board participates, was established by Metsä Group and Fortum.
New targets promote equalityAs part of Metsä Group, Metsä Board is committed to the development of a culture of equal opportunities. To develop equality, we have set targets of increasing the share of women in management to 25% by 2025 and ensuring equal pay between genders. To promote these targets, we carried out equality training and an equal pay survey in 2020.
In September, Metsä Board opened a state-of-the-art Excellence Centre in the unique bioeconomy ecosystem of Äänekoski. The Excellence Centre aims to accelerate material and packaging innovations by making use of cutting-edge technology in research and development. It provides a collaboration platform for customers and technology partners globally.
The coronavirus pandemic increased the demand for our pure and safe paperboards, particularly in the food, beverage and pharmaceutical packaging sectors. We succeeded in maintaining our customer service at an excellent level and increasing our paperboard sales in both Europe and North America. Our mills performed excellently during the pandemic by adhering to strict safety measures. In April–June, the total production volume of our paperboards reached an all-time high.
We performed well during the coronavirus pandemic
Cooperation with Norra Skog releases capital for growth in paperboard
Recognition for our sustainability work
The state-of-the-art Excellence Centre accelerates paperboard and packaging innovations
R&D programme pursues technologies and concepts of the future
Business operations and value creation
76
METSÄ BOARD Annual Report 2020
Business operations and value creation
2 This is Metsä Board
4 CEO’s review
6 Highlights of the year
8 Strategy and targets
10 Creating value
12 Operating environment
16 Product and service development
18 Circular economy
Sustainability
20 Sustainability targets
24 We bring the forest to you
26 We offer sustainable choices
30 We work for a better climate and environment
34 We create well-being
40 Mill-specific information
Financial development
44 Report of the Board of Directors
57 Consolidated financial statements
61 Notes to the consolidated financial statements
107 Parent company financial statements
110 Notes to the parent company financial statements
123 Auditor’s report
126 Shares and shareholders
132 Key figures and taxes
Governance
134 Corporate governance statement
140 Metsä Board Corporation’s Board of Directors
142 Metsä Board Corporation’s Corporate Management Team
144 Investor relations and investor information
SUSTAINABILITYFINANCIAL DEVELOPMENT GOVERNANCE
BUSINESS OPERATIONS AND VALUE CREATION
BUSINESS OPERATIONS AND vALUE CREATION | METSÄ BOARD ANNUAL REPORT 2020
GrowthWe grow globally together with
our existing and new customers
by offering sustainable, safe and
high-performing products. Our
growth is based on skilled people,
industry-leading products and
new, innovative, packaging
solutions.
ProfitabilityOur profitability is based on the
efficiency of our operations and
the prioritisation of businesses
that benefit from the high
performance of our products
and services.
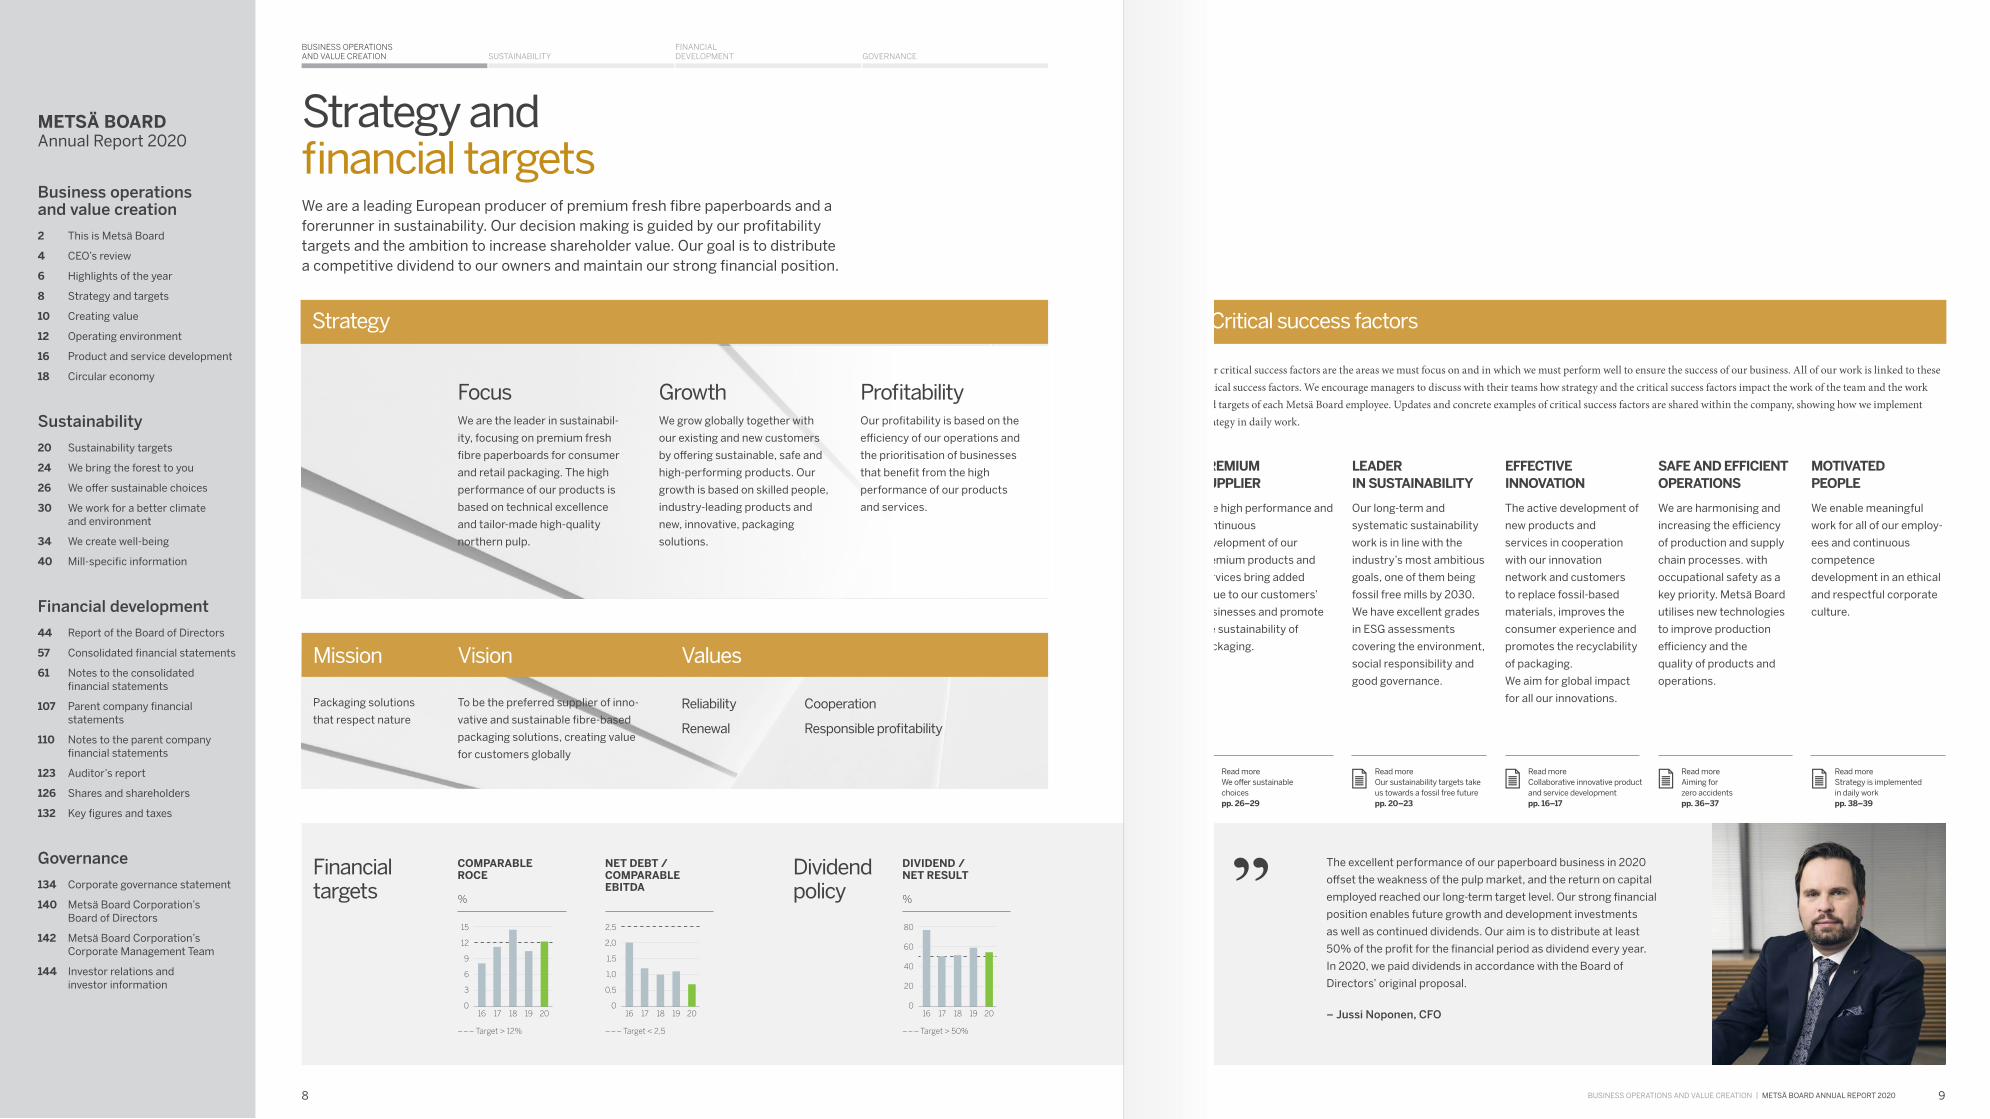
Financial targets
Dividend policy
Strategy and financial targetsWe are a leading European producer of premium fresh fibre paperboards and a forerunner in sustainability. Our decision making is guided by our profitability targets and the ambition to increase shareholder value. Our goal is to distribute a competitive dividend to our owners and maintain our strong financial position.
The excellent performance of our paperboard business in 2020
offset the weakness of the pulp market, and the return on capital
employed reached our long-term target level. Our strong financial
position enables future growth and development investments
as well as continued dividends. Our aim is to distribute at least
50% of the profit for the financial period as dividend every year.
In 2020, we paid dividends in accordance with the Board of
Directors’ original proposal.
PREMIUM SUPPLIER
The high performance and
continuous
development of our
premium products and
services bring added
value to our customers’
businesses and promote
the sustainability of
packaging.
LEADER IN SUSTAINABILITY
Our long-term and
systematic sustainability
work is in line with the
industry’s most ambitious
goals, one of them being
fossil free mills by 2030.
We have excellent grades
in ESG assessments
covering the environment,
social responsibility and
good governance.
EFFECTIVE INNOVATION
The active development of
new products and
services in cooperation
with our innovation
network and customers
to replace fossil-based
materials, improves the
consumer experience and
promotes the recyclability
of packaging.
We aim for global impact
for all our innovations.
SAFE AND EFFICIENT OPERATIONS
We are harmonising and
increasing the efficiency
of production and supply
chain processes. with
occupational safety as a
key priority. Metsä Board
utilises new technologies
to improve production
efficiency and the
quality of products and
operations.
MOTIVATED PEOPLE
We enable meaningful
work for all of our employ-
ees and continuous
competence
development in an ethical
and respectful corporate
culture.
– Jussi Noponen, CFO
FocusWe are the leader in sustainabil-
ity, focusing on premium fresh
fibre paperboards for consumer
and retail packaging. The high
performance of our products is
based on technical excellence
and tailor-made high-quality
northern pulp.
Strategy
Mission vision
Reliability
Renewal
Critical success factors
Our critical success factors are the areas we must focus on and in which we must perform well to ensure the success of our business. All of our work is linked to these critical success factors. We encourage managers to discuss with their teams how strategy and the critical success factors impact the work of the team and the work and targets of each Metsä Board employee. Updates and concrete examples of critical success factors are shared within the company, showing how we implement strategy in daily work.
Packaging solutions
that respect nature
To be the preferred supplier of inno-
vative and sustainable fibre-based
packaging solutions, creating value
for customers globally
values
––– Target < 2,5
2,5
2,0
1,5
1,0
0,5
0
NET DEBT / COMPARABLE EBITDA
––– Target > 50%
DIVIDEND / NET RESULT
%
––– Target > 12%
COMPARABLEROCE
%
Cooperation
Responsible profitability
Read more We offer sustainable choicespp. 26–29
Read more Our sustainability targets take us towards a fossil free futurepp. 20–23
Read more Collaborative innovative product and service development pp. 16–17
Read more Aiming for zero accidentspp. 36–37
Read more Strategy is implemented in daily workpp. 38–39
98
16 17 18 19 20
80
60
40
20
016 17 18 19 20
15
12
9
6
3
016 17 18 19 20
METSÄ BOARD Annual Report 2020
Business operations and value creation
2 This is Metsä Board
4 CEO’s review
6 Highlights of the year
8 Strategy and targets
10 Creating value
12 Operating environment
16 Product and service development
18 Circular economy
Sustainability
20 Sustainability targets
24 We bring the forest to you
26 We offer sustainable choices
30 We work for a better climate and environment
34 We create well-being
40 Mill-specific information
Financial development
44 Report of the Board of Directors
57 Consolidated financial statements
61 Notes to the consolidated financial statements
107 Parent company financial statements
110 Notes to the parent company financial statements
123 Auditor’s report
126 Shares and shareholders
132 Key figures and taxes
Governance
134 Corporate governance statement
140 Metsä Board Corporation’s Board of Directors
142 Metsä Board Corporation’s Corporate Management Team
144 Investor relations and investor information

SUSTAINABILITYFINANCIAL DEVELOPMENT GOVERNANCE
BUSINESS OPERATIONS AND VALUE CREATION
BUSINESS OPERATIONS AND vALUE CREATION | METSÄ BOARD ANNUAL REPORT 2020
We create value and well-being with respect for natureMetsä Board is part of Metsä Group and benefits from Metsä Group’s unique value chain,
from pure northern fibre to high-quality end products. We are continuously looking
for opportunities to grow profitably and sustainably, and to create value for all of our
stakeholders through our operations. All figures are from 2020 or as per 31 December 2020.
RESOURCES VALUE CREATIONBUSINESS MODEL
Social
• 2,370 employees in 18 countries
• Apprenticeship training programmes
(58 apprentices)
• Active cooperation with local communities and
educational institutes
• Nearly 4,000 suppliers
• Deliveries to approximately 100 countries
Environmental
• 8.2 million cubic metres of purchased wood,
of which 80% is from certified and 20%
from controlled, sustainably managed forests
• 483,000 dry tonnes of purchased pigments,
adhesives and other raw materials
• Total energy consumption as primary energy
11.8 TWh, of which 83% is fossil free
• Water intake 114 million cubic metres,
of which 62 million cubic metres is process water
Economic
• 8 production units in Finland and Sweden
• Capital employed EUR 1,836 million
• 55,000 shareholders, includes shareholders in
both A and B series
• Research and development expenditure
EUR 8.6 million
EUR 47 million of paid income and
property taxes
EUR 92 million
of dividends and capital
distribution to shareholders
EUR 1,353 million
in payments to suppliers
Consumers daily use
approximately
160 million
packages made of Metsä
Board’s folding boxboard
By reducing paperboard
weight by 1%, material
savings equivalent to
1.6 million
packages per day
can be achieved
EUR 197 million
in employees’ salaries
and benefits
12.2%
return on capital employed
40 customer satisfaction
NPS (Net Promoter Score)
99%
of personnel have completed
training on the Code
of Conduct
and
96%
of suppliers have committed
themselves to the Supplier
Code of Conduct
Our capacity is practically at full utilisation
In 2020, we produced 1.8 million tonnes of premium fresh fibre
paperboard and 1.4 million tonnes of pulp and BCTMP.
Our production emissions in 2020
• Our emissions into air include, for example, 512,151 tonnes
of fossil-based carbon dioxide emissions (Scope 1 and 2,
market-based)
• Approximately 99% of the water we use is returned to
waterways. Process waters are always carefully purified
• 99% of production side streams are utilised as materials
or energy. Side streams consist of production waste and
by-products, such as ash used in fertilisers
Fast and efficient supply chain
An efficient and global supply chain is a prerequisite for a profitable
business. We develop our supply services continuously,
thereby improving our customers’ competitiveness. We work
closely with international brand owners, converters, corrugated
box manufacturers and merchants globally.
We create value with our services
We accelerate material and packaging innovations by making use of
cutting-edge technology in research and development and packaging
design, and by improving the functionality of packaging. We engage in
continuous cooperation with our customers and technology partners
globally.
As part of Metsä Group, we are self-sufficient in pulp and we have good availability of raw material
Our production is located near our most important raw material,
high-quality northern fibre. The high performance of our products is
based on our tailor-made pulps and technical excellence.
We focus on high-quality, ecological fresh fibre paperboards
and sustainable packaging solutions.
OTHER
5% of sales
MARKET PULP
12% of sales
FOLDING BOXBOARD
59% of sales
WHITE KRAFTLINER
25% of sales
Our sales in 2020:
EUR 1,890 million
1110
METSÄ BOARD Annual Report 2020
Business operations and value creation
2 This is Metsä Board
4 CEO’s review
6 Highlights of the year
8 Strategy and targets
10 Creating value
12 Operating environment
16 Product and service development
18 Circular economy
Sustainability
20 Sustainability targets
24 We bring the forest to you
26 We offer sustainable choices
30 We work for a better climate and environment
34 We create well-being
40 Mill-specific information
Financial development
44 Report of the Board of Directors
57 Consolidated financial statements
61 Notes to the consolidated financial statements
107 Parent company financial statements
110 Notes to the parent company financial statements
123 Auditor’s report
126 Shares and shareholders
132 Key figures and taxes
Governance
134 Corporate governance statement
140 Metsä Board Corporation’s Board of Directors
142 Metsä Board Corporation’s Corporate Management Team
144 Investor relations and investor information

2016 2017 2018 2019 2020
12
10
8
6
4
2
0
-2
-4
SUSTAINABILITYFINANCIAL DEVELOPMENT GOVERNANCE
BUSINESS OPERATIONS AND VALUE CREATION
BUSINESS OPERATIONS AND vALUE CREATION | METSÄ BOARD ANNUAL REPORT 2020
Basic growth rate
2–3%/year
IN THE LONG TERM, GLOBAL DEMAND FOR FRESH FIBRE PAPERBOARDS IS SUPPORTED BY TRENDS ACCELERATED BY THE PANDEMIC
Megatrends create the basis for long-term business developmentGlobal megatrends influence companies’ actions, and set safety, quality, sustainability and recyclability
requirements for packaging. The changing operating environment creates challenges, but also opportunities,
for business growth and long-term development.
Population growthand higher average income
increase consumption
• Modern retail and increased
consumption of packaged
consumer goods
• Resource efficiency
• Minimisation of packaging waste
and optimisation of recycling
Globalisation
Creates world-wide markets and tightens
competition
• Global brands
• New markets
• Sturdy and lightweight packaging
• Trade disputes, protectionism
• Long and complex supply chains
require good protection properties
from packaging, but over-packaging
should be avoided
UrbanisationOver half of the world’s population lives in
cities, covering only 2% of the globe’s land
area, but creating 70% of world GDP, waste
and greenhouse gases
• Packaging solutions for different kinds of
consumers and for a variety of occasions
• Solutions to ease everyday life, such as
e-commerce, take-away food and meal
kits
• Recyclable and compostable packaging
• Restrictions for single-use packaging
• Consumers are confused about
different kinds of recycling schemes
and sorting instructions
Climate changeAffects all geographical areas, states,
businesses and individuals. Limiting climate
change and moving to a low-carbon econo-
my requires adaptation
• Packaging helps to reduce food waste
and other product waste
• Resource-efficient packaging:
renewable raw materials, light weight,
well established recycling infrastructure
• Well managed and growing forests act as
an efficient carbon sink
• Requires new investments in new
technology
• Weather-related disruptions
in production and wood fibre
availability
• Changing consumer habits to slow
down climate change
• Forests as a carbon sink rather than
as a raw material
DigitalisationOffers solutions for challenges
created by other megatrends
• Utilisation of artificial intelligence in
production quality, efficiency and
environmental aspects
• Development of services
• Demand for e-commerce packaging
• Data protection
• vulnerability of data networks
Metsä Board follows closely the development of sustainability and packaging related regulation, such as the EU Green Deal, including the Circular
Economy Action Plan as well as the Single Use Plastics Directive.
THE CORONAVIRUS PANDEMIC INFLUENCED METSÄ BOARD’S OPERATING ENVIRONMENT IN 2020
The coronavirus pandemic has increased demand for clean and safe packaging materials, especially in food and healthcare end uses. At the same time, demand for luxury packaging and graphic end uses has fallen. Food service packaging has decreased due to less movement of people in public places.
THE PANDEMIC SLOWS DOWN GLOBAL ECONOMY BUT CREATES NEW BUSINESS OPPORTUNITIES
The broad-based restrictions to hinder the pandemic around the world have muted economic activity. Growing unemployment decreases consumers’ purchasing power, while weakening confidence in the economy increases savings rates. Decreasing consumption has a negative impact on demand for packaging materials, including fresh fibre paperboards. Demand for high quality fresh fibre paperboards might temporarily drop below the anticipated long term growth rate, which has been 2–3% per year. At the same time, the pandemic boosts and changes consumer and corporate behaviour in a way that could have a significant positive impact on fresh fibre paperboards demand in the future.
Online shopping has grown during the pandemic and this development is expected to continue. High quality white kraftliners support sales promotion and differentiation in the growing e-commerce segment, where durability and light weight are key requirements for packaging.
During the pandemic, safety and hygiene requirements have also grown, supporting the use of pure and ecological packaging materials. Consumers prefer packaged food instead of loose produce.
The downward trend in printing and writing paper demand has accelerated during the pandemic and this has tightened the availability of high quality
MEGATREND OPPORTUNITIES CHALLENGES
Megatrends’ effect on Metsä Board business
Ready meals
Breakfast cereals
Frozen processed meat
Frozen processed seafood
Rice, pasta and noodles
YEAR-ON-YEAR SALES GROWTH IN PACKAGED FOOD GLOBALLY%
Source: Euromonitor from trade sources/national statistics
Growth in global
e-commerce
increases packaging
quality and strength
requirements.
In the short term, weakening purchasing power caused by the pandemic might slow down the demand for fresh fibre paperboards.
Safety and hygiene
concerns increase
the demand for
packaging.
Rapid decline in
graphic paper
consumption and
growth in e-
commerce reduce
the availability of
recycled fibre.
Securing supply chains
and automation might
partly move production
and packaging demand
back to Europe and North
America.
recycled fibres. This creates an increasing need for fresh fibre based packaging materials. After their use, high-quality paperboards are a valuable raw material for recycled fibre based packaging where quality and hygiene requirements are less strict.
The pandemic has caused disruptions in supply chains of products and raw materials, forcing companies to re-evaluate their continuity management plans, especially regarding so-called critical products. As automation diminishes the benefits of moving operations into low-cost countries, it is possible that we will see production reshoring back to Europe and North America.
1312
12
10
8
6
4
2
0
-2
-4
METSÄ BOARD Annual Report 2020
Business operations and value creation
2 This is Metsä Board
4 CEO’s review
6 Highlights of the year
8 Strategy and targets
10 Creating value
12 Operating environment
16 Product and service development
18 Circular economy
Sustainability
20 Sustainability targets
24 We bring the forest to you
26 We offer sustainable choices
30 We work for a better climate and environment
34 We create well-being
40 Mill-specific information
Financial development
44 Report of the Board of Directors
57 Consolidated financial statements
61 Notes to the consolidated financial statements
107 Parent company financial statements
110 Notes to the parent company financial statements
123 Auditor’s report
126 Shares and shareholders
132 Key figures and taxes
Governance
134 Corporate governance statement
140 Metsä Board Corporation’s Board of Directors
142 Metsä Board Corporation’s Corporate Management Team
144 Investor relations and investor information

2016 2017 2018 2019 2020
SUSTAINABILITYFINANCIAL DEVELOPMENT GOVERNANCE
BUSINESS OPERATIONS AND VALUE CREATION
BUSINESS OPERATIONS AND vALUE CREATION | METSÄ BOARD ANNUAL REPORT 2020
PAPERBOARD MARKET
Paperboard and pulp market
AMERICAS EMEA APAC
Share of Metsä Board’s paperboard deliveries in 2020
27% 68% 5%
Delivery volumes in 2020
• 274,000 tonnes of folding boxboard
• 210,000 tonnes of white kraftliner
• 866,000 tonnes of folding boxboard
• 369,000 tonnes of white kraftliner
• 83,000 tonnes of folding boxboard
• 9,000 tonnes of white kraftliner
Regional focus • Continued growth in North America • Maintaining strong market position in Europe
• Focus on high quality packaging in selected end use segments
Demand outlook for folding boxboard
• Limited local availability of high-quality lightweight cartonboard, such as folding boxboard
• Growth in ecological packaging for food and food service
• Environmental awareness and regulatory requirements support demand for recyclable packaging materials
• Food safety requirements favour pure fresh fibre-based cartonboards
• Middle class growth increases purchasing power and demand for packaged consumer goods
Demand outlook for white kraftliners
• Limited local availability of high-quality coated white kraftliners
• A growing demand for retail-ready packaging
• Product brand promotion and differentiation in growing e-commerce
• Continued growth of retail-ready packaging
• Growing e-commerce
Geographical split of Metsä Board’s paperboard deliveries and demand outlook
Metsä Board has a leading market position in Europe Metsä Board’s annual pulp surplus is approximately 400,000 tonnes as of 2021
The global packaging market value is nearly 800 billion euros, of which paperboard packaging accounts for roughly a third. Depending on the packaging end use, paperboard can be produced either from fresh or recycled fibre. The decision is based on quality, product safety and hygiene requirements.
Metsä Board uses only fresh fibre for the production of paperboard. Global demand for high-quality fresh fibre paperboards has been growing by 2–3% annually. In Metsä Board’s main markets, Europe and North America, the market situation for folding boxboard and white kraftliners is expected to remain stable.
Metsä Board’s annual pulp surplus consists of:• own pulp production +1.4 million tonnes• own pulp consumption -1.6 million tonnes • 24.9% share of Metsä Fibre +0.8 million tonnes• Norra Skog’s 30% share of Husum’s pulp mill -0.2 million tonnes
Approximately half of Metsä Board’s pulp production is bleached chemo-ther-momechanical pulp (BCTMP), of which the majority is integrated into our own folding boxboard production. Thanks to BCTMP, folding boxboard is light but stiff. Compared to chemical pulp the yield is high; less raw wood is needed in the pulp production.
Metsä Board’s associated company Metsä Fibre is a leading global supplier of softwood market pulp (NBSK).
Metsä Fibre’s annual pulp capacity is approximately 3.25 million tonnes, of which 80% is softwood pulp (NBSK) and 20% hardwood pulp (BHKP).
Roughly 25% of Metsä Fibre’s pulp production is used internally within Metsä Group and the rest is sold as market pulp in Europe, Middle East, Africa and Asia.
In 2020, the end uses of Metsä Fibre’s pulp were: 35% tissue papers, 31% printing and writing papers, 26% paperboards and 8% specialty papers.
Globally, some 181 million tonnes of virgin pulp is consumed, of which 112 million tonnes is integrated, for example, in paper and paperboard production. The rest, approximately 69 million tonnes, is sold as market pulp, mainly bleached softwood and hardwood pulp. The length and strength of fibres vary depending on the wood spe-cies. Therefore, pulp grades have properties suitable for different end uses. Softwood pulp consists of long fibres, giving strength, while hardwood pulp consisting of short fibres, gives excellent surface properties. Different pulp grades are often mixed, particularly in the production of paperboards.
Source: Metsä Fibre estimates based on several sources
OTHERS
6 million tonnes
SOFTWOOD
26 million tonnes
MARKET PULP
69 million tonnes
VIRGIN WOOD FIBRE CONSUMP-TION
181 million tonnes
INTEGRATED PULP
112 million tonnes
HARDWOOD
37 million tonnes
Global annual demand for market pulp is approximately 69 million tonnes
PULP MARKET
WHITE KRAFTLINER PRODUCERS IN EUROPE Total capacity 2.4 million tonnes
FOLDING BOXBOARD PRODUCERS IN EUROPE Total capacity 3.9 million tonnes
Metsä Board 28%
Competitor 1 23%
Competitor 2 15%
Competitor 3 13%
Competitor 4 8%
Others 12%
Metsä Board 35%
Competitor 1 21%
Competitor 2 10%
Competitor 3 9%
Competitor 4 6%
Others 19%
Sources: RISI, Metsä Board, companies’ websites
Competitor #3 has announced acquisitions of competitors #2 and #4.
GLOBAL DEMAND OF PULP BY END USE %
GLOBAL DEMAND OF PULP BY AREA %
PULP PRICE DEVELOPMENT (PIX) IN EUROPE AND CHINA USD/tonnes
Tissue paper 39
Printing and writing papers 26
Packaging 9
Specialty papers 16
Fluff 10
China 39
Europe 25
North America 11
Latin America 6
Japan 3
Others 16
Europe
China (net)
1,400
1,200
1,000
800
600
400
UNBLEACHED PULP
2 million tonnes
CHEMI-THERMO-MECHANICAL PULP (CTMP)
4 million tonnes
Metsä Board is globally the largest producer of coated white kraftliners
Source: PPPC Source: Hawkins Wright, 2019
In the long term, market pulp demand is supported by the rapid consumption growth of tissue paper, particularly in China, and the global demand for packaging materials made from renewable raw materials.
Source: Fastmarkets Foex
1514
METSÄ BOARD Annual Report 2020
Business operations and value creation
2 This is Metsä Board
4 CEO’s review
6 Highlights of the year
8 Strategy and targets
10 Creating value
12 Operating environment
16 Product and service development
18 Circular economy
Sustainability
20 Sustainability targets
24 We bring the forest to you
26 We offer sustainable choices
30 We work for a better climate and environment
34 We create well-being
40 Mill-specific information
Financial development
44 Report of the Board of Directors
57 Consolidated financial statements
61 Notes to the consolidated financial statements
107 Parent company financial statements
110 Notes to the parent company financial statements
123 Auditor’s report
126 Shares and shareholders
132 Key figures and taxes
Governance
134 Corporate governance statement
140 Metsä Board Corporation’s Board of Directors
142 Metsä Board Corporation’s Corporate Management Team
144 Investor relations and investor information
SUSTAINABILITYFINANCIAL DEVELOPMENT GOVERNANCE
BUSINESS OPERATIONS AND VALUE CREATION
BUSINESS OPERATIONS AND vALUE CREATION | METSÄ BOARD ANNUAL REPORT 2020
Collaborative innovativeproduct and service development
For consumer packaging board, we continue to develop increasingly lightweight paperboard, without compromising on the paperboard’s strength or converting properties. Our lightweight paperboards are material efficient and help reduce the carbon footprint of packaging. Consumers use approximately 160 million packages made of Metsä Board folding boxboard every day. By reducing the weight of the paperboard by 1%, we can achieve material savings equivalent to approximately 1.6 million packages every day.
We continue to develop barrier solutions and investigate the utilisation of dispersion coating and bio-based coating solutions as well as their commercial potential in food packaging and food service uses. We estimate the global market size of PE-coated food and food service packaging, in which the coating could be replaced with bio-based materials, to be more than 10 million tonnes a year. Roughly half of the paperboards we produce are used for food packaging, which is generally the biggest single end-use for packaging.
As the volume of packaging grows, the world needs new, sustainable solutions that can replace fossil-based materials and improve the recyclability of packaging. We aim for large scale innovations to give them global significance.
The key product qualities of our white kraftliners are high strength, converting efficiency and good printing surface. We continue to develop these qualities to boost the performance of high-volume, retail-ready packaging and e-commerce packaging made from corrugated board.
EXCELLENCE CENTRE ACCELERATES DEVELOPMENT WORK IN COOPERATION WITH OUR CUSTOMERS
In September 2020, we opened an Excellence Centre in the unique bioeconomy ecosystem of Äänekoski. The Excellence Centre helps us to deepen our collaboration with customers and helps us further focus development work to meet customers’ needs. The Excellence Centre brings together our experts’ in-depth knowledge in fibre-based packaging solutions, and the competence of our partners, such as material and technology suppliers, start-up companies, universities and research companies.
By optimising the materials and structure of packaging, we can provide our customers with even more sustainable and high performing packaging solutions. The Excellence Centre offers an efficient development platform for our research and development facilities, a packaging design studio, a customer feed-back centre and a state-of-the-art laboratory offering more than 100 different analysis methods. The Centre’s services also include a virtual store environment and a computer-based simulation tool (CAE), which enables us to analyse and model the performance of packaging.
Metsä Board and the Finnish start-up
company Esbottle jointly develop an ecologi-
cal paperboard flute cup concept that meets
the need to reduce the use of plastic.
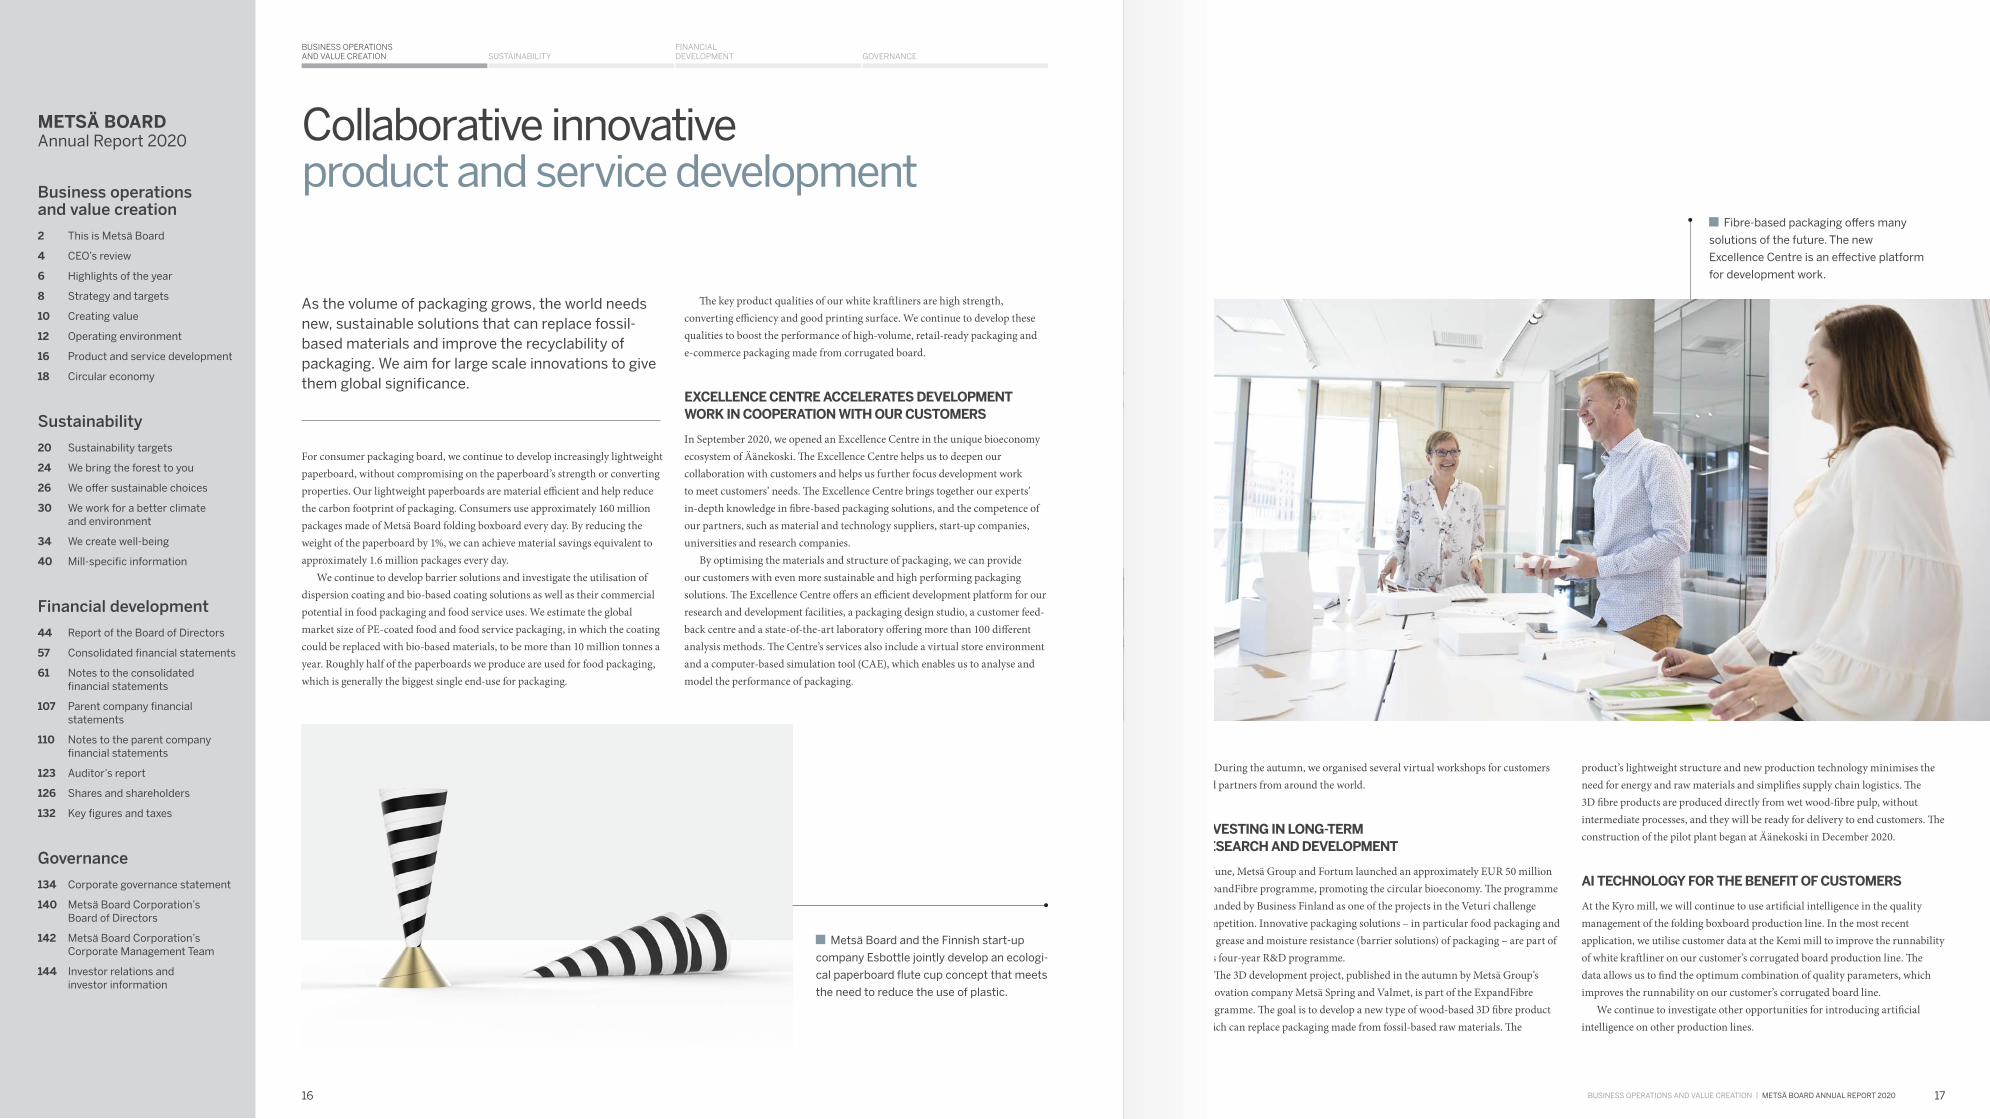
Fibre-based packaging offers many
solutions of the future. The new
Excellence Centre is an effective platform
for development work.
During the autumn, we organised several virtual workshops for customers and partners from around the world.
INVESTING IN LONG-TERM RESEARCH AND DEVELOPMENT
In June, Metsä Group and Fortum launched an approximately EUR 50 million ExpandFibre programme, promoting the circular bioeconomy. The programme is funded by Business Finland as one of the projects in the Veturi challenge competition. Innovative packaging solutions – in particular food packaging and the grease and moisture resistance (barrier solutions) of packaging – are part of this four-year R&D programme.
The 3D development project, published in the autumn by Metsä Group’s innovation company Metsä Spring and Valmet, is part of the ExpandFibre programme. The goal is to develop a new type of wood-based 3D fibre product which can replace packaging made from fossil-based raw materials. The
product’s lightweight structure and new production technology minimises the need for energy and raw materials and simplifies supply chain logistics. The 3D fibre products are produced directly from wet wood-fibre pulp, without intermediate processes, and they will be ready for delivery to end customers. The construction of the pilot plant began at Äänekoski in December 2020.
AI TECHNOLOGY FOR THE BENEFIT OF CUSTOMERS
At the Kyro mill, we will continue to use artificial intelligence in the quality management of the folding boxboard production line. In the most recent application, we utilise customer data at the Kemi mill to improve the runnability of white kraftliner on our customer’s corrugated board production line. The data allows us to find the optimum combination of quality parameters, which improves the runnability on our customer’s corrugated board line.
We continue to investigate other opportunities for introducing artificial intelligence on other production lines.
1716
METSÄ BOARD Annual Report 2020
Business operations and value creation
2 This is Metsä Board
4 CEO’s review
6 Highlights of the year
8 Strategy and targets
10 Creating value
12 Operating environment
16 Product and service development
18 Circular economy
Sustainability
20 Sustainability targets
24 We bring the forest to you
26 We offer sustainable choices
30 We work for a better climate and environment
34 We create well-being
40 Mill-specific information
Financial development
44 Report of the Board of Directors
57 Consolidated financial statements
61 Notes to the consolidated financial statements
107 Parent company financial statements
110 Notes to the parent company financial statements
123 Auditor’s report
126 Shares and shareholders
132 Key figures and taxes
Governance
134 Corporate governance statement
140 Metsä Board Corporation’s Board of Directors
142 Metsä Board Corporation’s Corporate Management Team
144 Investor relations and investor information

SUSTAINABILITYFINANCIAL DEVELOPMENT GOVERNANCE
BUSINESS OPERATIONS AND VALUE CREATION
BUSINESS OPERATIONS AND vALUE CREATION | METSÄ BOARD ANNUAL REPORT 2020
Sustainable packaging promotes the circular economy
High quality and strong fresh fibre is an important raw material for making packaging light in weight, sustainable and safe. The fresh fibre provides a good starting point for the recycling of packaging materials. To keep recycling loops ongoing, new, pure fibre is also needed for recycling.
• We source fibre raw material from sustainably managed northern
forests that grow more than they are used, and which act as
carbon sinks. In Finland, the annual growth of forests is 108 million
cubic metres and harvesting of roundwood amounts to 73 million
cubic metres. The other annual drain is 15 million cubic metres
(Natural Resources Institute Finland, 2019).
• In Finland, four new saplings are planted for every tree felled by
Metsä Forest during the regeneration felling phase. Metsä Forest
is responsible for Metsä Board’s wood supply.
• We use PEFC™ and FSC® Chain of Custody to ensure that the
wood always comes from certified or controlled forest which take
care of, for example, maintaining biodiversity.
• 80% of the wood raw material used by Metsä Board is certified,
while on average 10% of forests globally are certified.
• All our paperboards are recyclable and/or compostable depend-
ing on local recycling infrastructure.
• The recycling rate of paper and paperboard packaging is high,
83% in the European Union (Eurostat).
• Fresh fibre is essential in keeping the recycling loop of materials
ongoing. Wood fibre is estimated to circulate, on average, 3.6
times in a year (CEPI), but it deteriorates with each recycling
round.
• Metsä Board participates actively in 4evergreen and European
Paper Packaging Alliance communities, which promote the
recyclability of fibre-based packaging and food and food service
packaging.
• At its best, the carbon footprint of packaging made from our fresh
fibre paperboard is more than 50% smaller than packaging with
an equivalent stiffness made from recycled fibre or solid bleached
board (Ecoinvent database).
• Paperboard provides alternatives to fossil-based materials.
• Fresh fibre paperboard is a sustainable and safe option:
only the origin of the fresh fibres can be traced back to the forest,
and the fresh fibres are naturally pure and do not contain unknown
chemicals.
• We reduce the environmental impact through considered
packaging design, for example, by optimising the use of the mate-
rial, ensuring that the packaging is fit for purpose, and designing
the packaging for recycling after use.
• 83% of the energy and 99% of the raw materials we use are fossil
free. Our target is completely fossil free production in 2030. In
addition, we are continuously improving our energy efficiency.
• We recycle water in our paperboard mills on average 12 to 14 times
and in our BCTMP mills as many times as 30. We continue to
further improve water efficiency.
• We already utilise 99% of our production side streams as material
or energy. The aim is to completely avoid landfill waste.
• Already two of our mills utilise artificial intelligence, which enables
us to increase, for example, the consistency of paperboard and to
improve production efficiency by reducing the amount of waste
generated and the consumption of energy and raw materials.
Read moreCollaborative innovative product and service development, pp. 16–17We work for a better climate and environment, pp. 30–34
Read moreCollaborative innovative product and service development, pp. 16–17We offer sustainable choices, pp. 26–29
Read moreWe offer sustainable choices, pp. 26–29
Read moreWe bring the forest to you, pp. 24–25
Sustainable and renewable wood raw material
Resource-efficient production
Eco-friendly and safe products
High recycling rate
1918
METSÄ BOARD Annual Report 2020
Business operations and value creation
2 This is Metsä Board
4 CEO’s review
6 Highlights of the year
8 Strategy and targets
10 Creating value
12 Operating environment
16 Product and service development
18 Circular economy
Sustainability
20 Sustainability targets
24 We bring the forest to you
26 We offer sustainable choices
30 We work for a better climate and environment
34 We create well-being
40 Mill-specific information
Financial development
44 Report of the Board of Directors
57 Consolidated financial statements
61 Notes to the consolidated financial statements
107 Parent company financial statements
110 Notes to the parent company financial statements
123 Auditor’s report
126 Shares and shareholders
132 Key figures and taxes
Governance
134 Corporate governance statement
140 Metsä Board Corporation’s Board of Directors
142 Metsä Board Corporation’s Corporate Management Team
144 Investor relations and investor information
BUSINESS OPERATIONS AND VALUE CREATION
FINANCIAL DEVELOPMENT GOVERNANCESUSTAINABILITY
SUSTAINABILITy | METSÄ BOARD ANNUAL REPORT 2020
For us, being a leader in sustainability means investing in resource efficiency and the fight against climate change, in sustainable products and a sustainable supply chain as well as the sustainable use of forests. We want to achieve these targets by complying with ethical operating methods and safe operating condi-tions. We also expect the same high level of sustainability from all our partners.
OUR TARGETS MEET THE STRICTEST OF REQUIREMENTS
One of Metsä Board’s most important sustainability goals is to ensure that, after 2030, our mills no longer use any fossil fuels nor purchase any fossil-based energy. At this point, our production will no longer generate any fossil-based carbon dioxide emissions (Scope 1 and 2). We are also looking for alternatives to fossil-oil-based raw materials and packaging materials with the target of all materials used by the company being fossil free also by the end of 2030.
Our ambitious targets for reducing greenhouse gas emissions are endorsed by the Science Based Targets initiative. Our targets (Scope 1 and 2) meet the strictest requirements of the Paris Agreement, which aim to limit global warming to 1.5 degrees. Metsä Board’s reduction targets for the emissions of the company’s value chain (Scope 3) also meet the SBTi’s most stringent criteria and are in line with current best practices. In terms of the value chain, our aim is for 70% of our non-fibre suppliers and downstream transportation suppliers measured by spend to set themselves targets according to SBTi by 2024.
Our targets support the UN’s Sustainable Development Goals (SDGs). We are also committed to the UN Global Compact and its CEO Water Mandate initiative. Our sustainability targets are summarised on pages 22–23. *) Scope 1 includes direct greenhouse gas emissions from own operations. Scope 2 includes indirect greenhouse gas emissions from generation of purchased energy.
Our sustainability targets take us towards a fossil free future
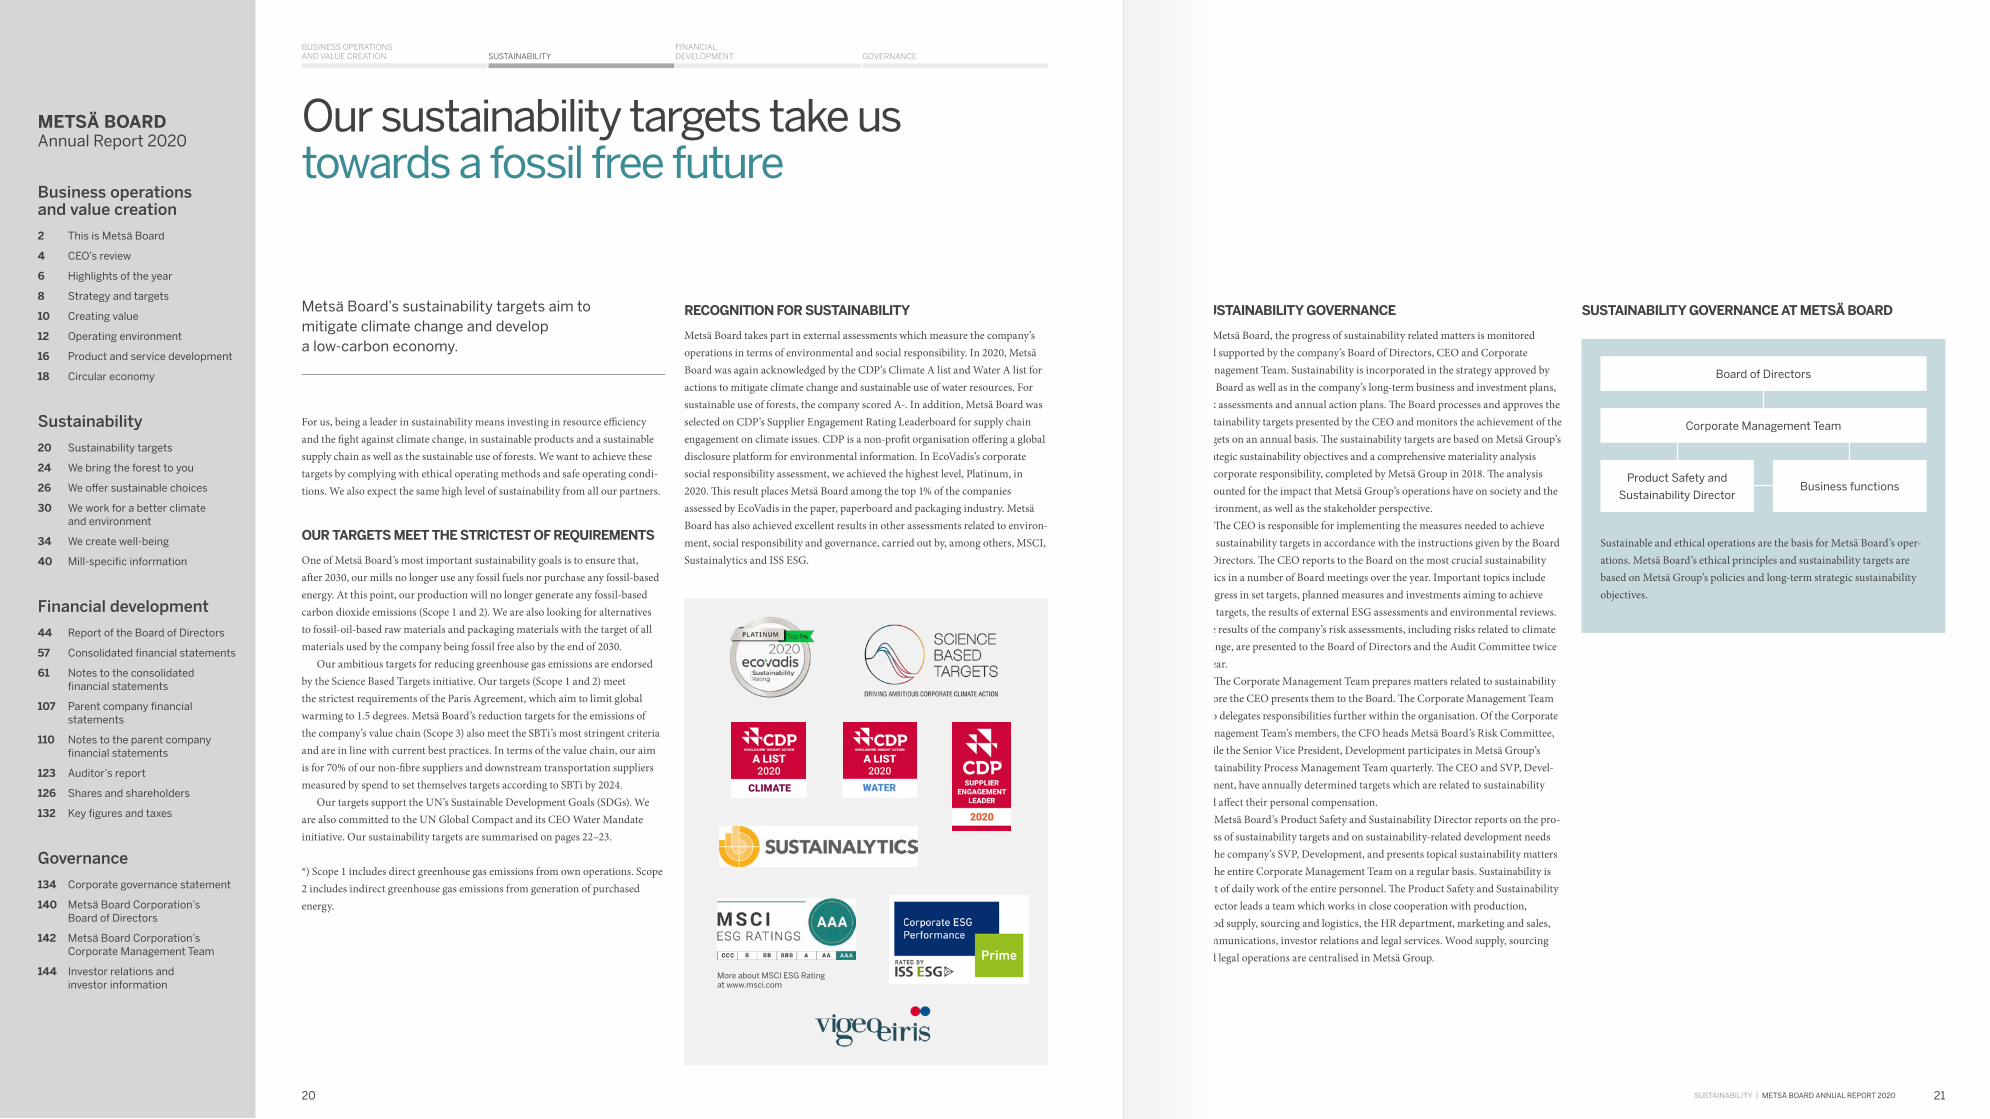
RECOGNITION FOR SUSTAINABILITY
Metsä Board takes part in external assessments which measure the company’s operations in terms of environmental and social responsibility. In 2020, Metsä Board was again acknowledged by the CDP’s Climate A list and Water A list for actions to mitigate climate change and sustainable use of water resources. For sustainable use of forests, the company scored A-. In addition, Metsä Board was selected on CDP’s Supplier Engagement Rating Leaderboard for supply chain engagement on climate issues. CDP is a non-profit organisation offering a global disclosure platform for environmental information. In EcoVadis’s corporate social responsibility assessment, we achieved the highest level, Platinum, in 2020. This result places Metsä Board among the top 1% of the companies assessed by EcoVadis in the paper, paperboard and packaging industry. Metsä Board has also achieved excellent results in other assessments related to environ-ment, social responsibility and governance, carried out by, among others, MSCI, Sustainalytics and ISS ESG.
Metsä Board’s sustainability targets aim to mitigate climate change and develop a low-carbon economy.
SUSTAINABILITY GOVERNANCE
At Metsä Board, the progress of sustainability related matters is monitored and supported by the company’s Board of Directors, CEO and Corporate Management Team. Sustainability is incorporated in the strategy approved by the Board as well as in the company’s long-term business and investment plans, risk assessments and annual action plans. The Board processes and approves the sustainability targets presented by the CEO and monitors the achievement of the targets on an annual basis. The sustainability targets are based on Metsä Group’s strategic sustainability objectives and a comprehensive materiality analysis on corporate responsibility, completed by Metsä Group in 2018. The analysis accounted for the impact that Metsä Group’s operations have on society and the environment, as well as the stakeholder perspective.
The CEO is responsible for implementing the measures needed to achieve the sustainability targets in accordance with the instructions given by the Board of Directors. The CEO reports to the Board on the most crucial sustainability topics in a number of Board meetings over the year. Important topics include progress in set targets, planned measures and investments aiming to achieve the targets, the results of external ESG assessments and environmental reviews. The results of the company’s risk assessments, including risks related to climate change, are presented to the Board of Directors and the Audit Committee twice a year.
The Corporate Management Team prepares matters related to sustainability before the CEO presents them to the Board. The Corporate Management Team also delegates responsibilities further within the organisation. Of the Corporate Management Team’s members, the CFO heads Metsä Board’s Risk Committee, while the Senior Vice President, Development participates in Metsä Group’s Sustainability Process Management Team quarterly. The CEO and SVP, Devel-opment, have annually determined targets which are related to sustainability and affect their personal compensation.
Metsä Board’s Product Safety and Sustainability Director reports on the pro-gress of sustainability targets and on sustainability-related development needs to the company’s SVP, Development, and presents topical sustainability matters to the entire Corporate Management Team on a regular basis. Sustainability is part of daily work of the entire personnel. The Product Safety and Sustainability Director leads a team which works in close cooperation with production, wood supply, sourcing and logistics, the HR department, marketing and sales, communications, investor relations and legal services. Wood supply, sourcing and legal operations are centralised in Metsä Group.
SUSTAINABILITY GOVERNANCE AT METSÄ BOARD
Sustainable and ethical operations are the basis for Metsä Board’s oper-ations. Metsä Board’s ethical principles and sustainability targets are based on Metsä Group’s policies and long-term strategic sustainability objectives.
Board of Directors
Corporate Management Team
Product Safety and
Sustainability DirectorBusiness functions
Sustainability
More about MSCI ESG Rating at www.msci.com
2120
METSÄ BOARD Annual Report 2020
Business operations and value creation
2 This is Metsä Board
4 CEO’s review
6 Highlights of the year
8 Strategy and targets
10 Creating value
12 Operating environment
16 Product and service development
18 Circular economy
Sustainability
20 Sustainability targets
24 We bring the forest to you
26 We offer sustainable choices
30 We work for a better climate and environment
34 We create well-being
40 Mill-specific information
Financial development
44 Report of the Board of Directors
57 Consolidated financial statements
61 Notes to the consolidated financial statements
107 Parent company financial statements
110 Notes to the parent company financial statements
123 Auditor’s report
126 Shares and shareholders
132 Key figures and taxes
Governance
134 Corporate governance statement
140 Metsä Board Corporation’s Board of Directors
142 Metsä Board Corporation’s Corporate Management Team
144 Investor relations and investor information

BUSINESS OPERATIONS AND VALUE CREATION
FINANCIAL DEVELOPMENT GOVERNANCESUSTAINABILITY
SUSTAINABILITy | METSÄ BOARD ANNUAL REPORT 2020
Our sustainability targets for 2030 Our ambitious sustainability targets focus on four themes: we bring the forest to you, we offer sustainable choices, we work for a better climate and environment, and we create well-being. The targets support the achievement of the UN’s Sustainable Development Goals (SDGs). From a total of 17 SDGs set by the UN, we focus on seven goals to which we can contribute the most through our operations.
UN SUSTAINABLE DEVELOPMENT GOALS OUR OPERATIONS OUR TARGETS
GOAL 6Clean water and sanitation
Metsä Board’s mills are located in areas with ample water resources. Our water use does not impair other parties’ access to water.
We work for a better climate and environment
We use only surface water in our production. Groundwater is only used as drinking water and for hygiene purposes (roughly 0.01% of our total water use).
We use water sustainably and resource-efficiently. The aim is to reduce the use of process water by 30% per tonne produced during 2018–2030.
Approximately 99% of the water we use is returned to the waterways. Before this, process waters are treated using the best available technology.
GOAL 7Affordable and clean energy
Metsä Board is an important producer and user of bioenergy. Around half of the energy used by our mills is renewable.
We work for a better climate and environment
We aim to improve our energy efficiency by a minimum of 10% during 2018–2030.
GOAL 8Decent work and economic growth
Metsä Board provides a job for some 2,400 people, and our indirect employment effect is much greater.
We create well-beingWe offer sustainable choices
We pay special attention to safety at work. We aim for zero occupational accidents.
We operate ethically and expect the same from our partners.
GOAL 9Industry, innovation and infrastructure
Metsä Board continues to improve resource efficiency and its processes, and invests in new sustainable industrial concepts and technologies and in renewable energy. We aim at fossil free production in terms of both energy consumption and raw materials.
We work for a better climate and environment We offer sustainable choices
We are actively involved in research, development and innovation networks.
GOAL 12Responsible consumption and production
Metsä Board promotes the circular economy throughout the value chain: We bring the forest to you We offer sustainable choicesWe work for a better climate and environment We create well-being
Our paperboard is produced from entirely traceable wood fibre which comes from sustainably managed forests.
The fresh fibre we use is a renewable resource which provides an alternative to fossil-based packaging materials. Our goal is for all our raw materials and packaging materials to be fossil free by the end of 2030.
We also aim to utilise 100% of our production side streams in the recycling of materials or in energy production so that we will not generate any landfill waste in the end of 2030.
Our paperboards are light in weight and their production consumes less raw materials, energy and water than the production of heavier paperboard grades. Lightness is also an advantage in transportation. After use, light paperboards produce less waste than heavier packaging materials.
All our paperboards are designed for recycling after use. Alternatively, they can be composted, excluding the PE-coated grades.
We prioritise the safety of both our employees and consumers. We comply with practices which exceed the requirements provided in legislation.
GOAL 13Climate action
Metsä Board advances the low-carbon economy by improving its energy efficiency and aiming for fossil free production.
We bring the forest to youWe offer sustainable choicesWe work for a better climate and environment
Our goal is for all our mills to use only fossil free energy by the end of 2030. We also aim for fossil free raw materials and packaging materials.
By purchasing wood from sustainably managed forests only, we ensure that the forests grow more than they are used and that the forests act as carbon sinks.
GOAL 15Life on land
All of the wood raw material used by Metsä Board is traceable and comes from sustainably managed forests, which are either certified (PEFC™, FSC®) or meet the criteria for controlled origin.
We bring the forest to you
Our goal is for at least 90% of the wood fibre we use to be certified no later than by 2030.
Sustainable forest management does not result in deforestation. Rather, it supports biodiversity. In felling sites, biodiversity is promoted by leaving groups of retention trees and high biodiversity stumps, for example, and by increasing the share of mixed forests.
TARGETTARGET FOR
2030PERFORMANCE
IN 2020PERFORMANCE
IN 2019PERFORMANCE
IN 2018 STATUS
WE BRING THE FOREST TO YOU
Certified wood fibre
Share of certified fibre > 90% 80% 76% 79%
WE OFFER SUSTAINABLE CHOICES
Fossil free raw materials
Share of fossil free raw materials and packaging materials, % of dry tonnes 100% 99.3% 99.4% 99.4%
Sustainable supply chain
Traceability of raw materials, share of total purchasing (in euros) 100% 97% 93% -
Commitment to Supplier Code of Conduct, share of total purchasing (in euros) 1) 100% 96% 95% 94%
Know your supplier check completed, share of total purchasing (in euros) 1) 100% 84% 77% -
Sustainability evaluation completed, share of total purchasing (in euros) 1) 100% 54% 49% 41%
WE WORK FOR A BETTER CLIMATE AND ENVIRONMENT
Fossil free mills and fossil free purchased energy
Share of fossil free energy (0 t CO2 Scope 1 and 2) 100% 83% 83% 82%
Share of fossil free energy, own generation (0 t CO2 Scope 1) 100% 83% 82% 82%
Share of purchased fossil free energy (0 t CO2 Scope 2) 100% 83% 85% 81%
Resource-efficient production
Improvement in energy efficiency compared to 2018 2) > +10% +2.1% -0.7% -
Process water use per product tonne compared to 2018 -30% -7.7% -11% -
Utilisation of side streams 100% 99.3% 99.4% 99.4%
WE CREATE WELL-BEING
Responsible corporate culture
Ethics barometer, % 100% 85% - -
Accident-free work environment
Total Recordable Injury Frequency (TRIF) per million hours worked 0 8.4 10.2 12.6
The base year for the sustainability targets is 2018. In departure from this, the base year for the traceability of raw materials and the completion of the Know your supplier check is 2019, and the base year for the Ethics Barometer is 2020.
There are also Metsä Group-level targets for safeguarding the biodiversity of forests and for increasing the amount of carbon stored in forests and products. Further information on them is available in Metsä Group’s Sustainability Report.
The share of fossil free purchased energy decreased in 2020 compared to 2019, because the share of purchased fossil-based electricity increased and because the calculation method was updated to comply with the GHG Protocol.
Process water use per product tonne decreased from 2018 but increased compared to 2019. This was caused by the strike in pulp and paper industry affecting the Finnish mills, and by increased water use in Husum mill.
In 2020, the target for accident free work environment was switched from LTA1 to TRIF, which measures the total recordable incident frequency. The calculation method of TRIF was updated in 2020 to comply with the OHSA standards.
1) The calculation method has been updated, which is why the figures depart from the previously reported figures. The previously reported figures concerned the situation at the end of the year. The new calculation method accounts for monthly averages weighted with total purchasing.
2) The calculation method for the Husum mill has been updated, which is why the 2019 figure departs from the previously reported figure.
Good progress
Some progress
To be developed
Sustainability
2322
METSÄ BOARD Annual Report 2020
Business operations and value creation
2 This is Metsä Board
4 CEO’s review
6 Highlights of the year
8 Strategy and targets
10 Creating value
12 Operating environment
16 Product and service development
18 Circular economy
Sustainability
20 Sustainability targets
24 We bring the forest to you
26 We offer sustainable choices
30 We work for a better climate and environment
34 We create well-being
40 Mill-specific information
Financial development
44 Report of the Board of Directors
57 Consolidated financial statements
61 Notes to the consolidated financial statements
107 Parent company financial statements
110 Notes to the parent company financial statements
123 Auditor’s report
126 Shares and shareholders
132 Key figures and taxes
Governance
134 Corporate governance statement
140 Metsä Board Corporation’s Board of Directors
142 Metsä Board Corporation’s Corporate Management Team
144 Investor relations and investor information

100
80
60
40
20
016 17 18 19 20
Fibren sellun kustannusrakenteeseen luvut: puu 57%, muut 18%, kemikaalit 11%, logistiikka 9%henkilöstö 5
BUSINESS OPERATIONS AND VALUE CREATION
FINANCIAL DEVELOPMENT GOVERNANCESUSTAINABILITY
SUSTAINABILITy | METSÄ BOARD ANNUAL REPORT 2020
Wood from sustainably managed forests
Seven of Metsä Board’s eight mills are located in Finland, Europe’s most forested country. Forests cover roughly 75% of Finland’s land area. Finland’s forest reserve increases continuously, given that the annual growth of its forests (108 million m3) surpasses the volume of harvested roundwood (73 million m3) and other annual drain (15 million m3; Natural Resources Institute Finland, 2019). Strictly protected forests account for 9% of Finland’s forest area, and according to a study by the European Union, more than half of Europe’s strictly protected forests are in Finland.
All the wood used by Metsä Board comes from sustainably managed north-ern forests. In 2020, 51% of the wood came from Finland, 28% from Sweden and the rest from the Baltic countries and Russia. Our wood use totalled 8.2 million cubic metres (2019: 8.2 million m3). This use includes the wood used in Metsä Board’s own production of pulp and high-yield pulp as well as the wood used in the pulp purchased from Metsä Fibre.
All the wood we use is traceable and comes from sustainably managed northern forests.
WE KNOW THE ORIGIN OF ALL THE WOOD FIBRE WE USE
Metsä Group’s internal value chain helps us ensure the origin and quality of the wood fibre we use. Our wood supply is managed by Metsä Forest, also part of Metsä Group. The pulp used for paperboard production is manufactured in Metsä Board’s own BCTMP and pulp mills or in the pulp mills of our associated company Metsä Fibre. The self-sufficiency in pulp and the full control of chem-icals used in production secures the supply of fibre and guarantees consistent high quality and an unbroken product safety chain.
The wood used by Metsä Board always meets the criteria for at least PEFC™ Controlled Sources and FSC® Controlled Wood. In 2020, 80% (76%) of this wood originated from certified forests, and 20% (24%) came from controlled forest sources. Given that all parties involved in the processing of wood and fibre within our value chain comply with the requirements of the PEFC™ and FSC® Chain of Custody systems, all the wood fibre we use can be traced back to the forest.
SUSTAINABILITY IS MONITORED THROUGH AUDITS
The operations of wood suppliers and harvesting contractors, and the traceability of wood fibre within our own processes, are monitored through Chain of Custody systems and related Metsä Group and third-party audits. The
ALL THE WOOD FIBRE WE USE CAN BE TRACKED BACK TO THE FOREST
All parties in our value chain involved in the processing of the
wood and fibre comply with the requirements of PEFC™ and
FSC® Chain of Custody. Therefore, the wood fibre we use is
100% traceable to the forest. In addition to sustainable forest
sites, we also choose our partners responsibly. Our monitoring
system is audited annually.
Wood 17
Pulp 17
Logistics 16
Personnel 13
Chemicals 11
Energy 9
Other 17
METSÄ BOARD’S COST SPLIT IN 2020EUR 1.6 billion, %
Finland 51
Sweden 28
Baltic countries 11
Russia 10
METSÄ BOARD’S WOOD SUPPLY AREAS IN 2020%
forest owners from whom the wood is purchased are responsible for their forests meeting the requirements of the Chain of Custody systems.
The audits serve to ensure a number of matters related to sustainability, such as the preservation of valuable natural habitats, the legal origin of wood, the rights of indigenous peoples, safety at work, and the tracing and calculation practices for wood fibre pursuant to certification standards. This guarantees wood with a legal and sustainable origin, and the share of certified wood used in production.
SUSTAINABLE FOREST MANAGEMENT ACCOUNTS FOR BIODIVERSITY
Preserving biodiversity is part of sustainable forest management. Biodiversity is fostered by, for example, leaving broad-leaved trees and groups of retention trees untouched and by creating high stumps during thinning and in regeneration fellings. Biodiversity is also increased by protecting important habitats from harvesting and by the buffer zones of waterways, which also prevent the run-off of soil and nutrients. Forest certifications define precise criteria for elements safeguarding biodiversity, such as groups of retention trees.
Retention trees diversify the age structure of forests and generate decaying wood, which is vital for many species including birds, insects and fungi. Metsä Group also encourages forest owners to leave high stumps at felling sites, and 84% of forest owners already do so during thinning and regeneration fellings.
CUSTOMERPAPERBOARD, PULP AND BCTMP MILLS
WOOD PROCUREMENT FOREST OWNERS
Target > 90%
SHARE OF CERTIFIED WOOD FIBRE IN METSÄ BOARD%
Approximately
10% of the world’s forests being certified
Forest certification and our Chain of Custody system enable
our customers to inform their own customers about the
responsibility of the product. Certification and 100% trace-
ability ensures that the wood used in the product comes from
sustainably managed forests.
Metsä Board and Metsä Fibre
The mill records the quantity, origin and certification of the
wood it procures, and ensures, by calculation, that certified
products are sold in accordance with the incoming certified
quantity. The certification information can be seen on the
order and accompanying documents.
Metsä Forest
All the trees within our supply chain can be traced all the way back to
the forest with the help of maps, data recorded in information sys-
tems and various documents. Metsä Forest, which is responsible for
Metsä Group’s wood procurement, calculates the certification share
of purchased wood and sells a corresponding amount of certified
wood to mills. We also require sustainable origin for non-certified
wood, and that the wood always meets at least the requirements for
PEFC™ Controlled Sources and FSC® Controlled Wood.
Most of the wood we use comes from certified northern forests
(PEFC™ or FSC®). The forest owners are committed to the
requirements of forest certification and wood origin systems.
Metsä Group, external auditors and authorities verify sustainable
forest management by, among other things, audits of logging
sites.
WE BRING THE FOREST TO YOU
METSÄ FIBRE’S* PULP COST STRUCTURE IN 2020
%
* Pulp is purchased from the associated
company Metsä Fibre, of which Metsä Board
owns 24.9%
2524
PEFC™/02–31–92
FSC®-C001580
METSÄ BOARD Annual Report 2020
Business operations and value creation
2 This is Metsä Board
4 CEO’s review
6 Highlights of the year
8 Strategy and targets
10 Creating value
12 Operating environment
16 Product and service development
18 Circular economy
Sustainability
20 Sustainability targets
24 We bring the forest to you
26 We offer sustainable choices
30 We work for a better climate and environment
34 We create well-being
40 Mill-specific information
Financial development
44 Report of the Board of Directors
57 Consolidated financial statements
61 Notes to the consolidated financial statements
107 Parent company financial statements
110 Notes to the parent company financial statements
123 Auditor’s report
126 Shares and shareholders
132 Key figures and taxes
Governance
134 Corporate governance statement
140 Metsä Board Corporation’s Board of Directors
142 Metsä Board Corporation’s Corporate Management Team
144 Investor relations and investor information

BUSINESS OPERATIONS AND VALUE CREATION
FINANCIAL DEVELOPMENT GOVERNANCESUSTAINABILITY
SUSTAINABILITy | METSÄ BOARD ANNUAL REPORT 2020
The sustainability of our supply chain is ensured in terms of the wood and fibre (pp. 24–25) as well as the other raw materials and services involved. We use local suppliers whenever possible. In 2020, 75% of all our purchases (2019: 76%) came from Finland and Sweden, where our production units are located.
INDICATORS FOR ASSESSING SUPPLIERS’ SUSTAINABILITY
The sustainability of suppliers delivering something other than wood or fibre is ensured centrally within Metsä Group’s sourcing process. These include the suppliers of chemicals, machinery, equipment, transport and other services. Our selection process for suppliers includes a risk analysis where we review the suppliers’ country and category risks and their compliance with legislation.
In our targets extending to 2030, we use three indicators for monitoring and developing the sustainability of our supply chain: the suppliers’ commitment
We ensure the sustainability of our supply chain and our products
to a Code of Conduct, the completion of Know your supplier check and a sustainability evaluation.
By the end of 2020, suppliers accounting for 96% (2019: 95%) of our total purchasing were committed to Metsä Group’s Supplier Code of Conduct or had a corresponding Code of Conduct themselves. In addition to the Supplier Code of Conduct, agreements often contain further sustainability requirements. By the end of 2020, Know your supplier check had been conducted for suppliers representing 84% (77%) of total purchasing. The sustainability evaluation, which includes a supplier self-assessment questionnaire and the required development actions when necessary, was conducted for 54% (49%) of suppliers, calculated by spend.
The sustainability of suppliers is also monitored through audits carried out at supplier premises. These audits include questions related to environmental and social responsibility. In 2020, Metsä Group conducted 12 (14) on-site audits and an external party 9 (15) such audits at Metsä Board’s suppliers.
In our Science Based Targets, we are committed to 70% of our non-fibre-based suppliers and the logistics operators related to our customer deliveries – measured as a share of purchasing costs – setting themselves targets in line with the SBTi by 2024. The achievement of this target is supported by webinars aimed at suppliers and with supplier-specific meetings, both set to begin in 2021. By the end of 2020, 5% of our suppliers within the target group, had set targets in line with the SBTi, while 4% had committed to setting such targets within the next few years.
MORE ECOLOGICAL TRANSPORT
Given that most of our products are sold outside Finland and Sweden, transport distances are often long. The environmental impact of logistics is minimised with careful route planning and by developing more efficient operating methods. This reduces both costs and emissions. The alternative generating the least emissions is given priority, and this is why we favour sea and rail deliveries over trucks, insofar as possible. In 2020, 38% of transports were conducted as sea transports, 36% on road, 7% on rail, and 19% were related on port and warehouse logistics, measured by spend. We will be increasing the volume of maritime transport significantly as of 2021, when we will begin transporting with environmentally friendly LNG-powered ships directly from Kemi to Cen-tral Europe, close to our customers. This will reduce the need for road transport and lessen carbon dioxide emissions arising from transport.
WE TRACE THE ORIGIN OF RAW MATERIALS
We will continue to improve the traceability of chemicals, other raw materials and the packaging materials of our products. This is why we ask our suppliers
The sustainability of a package is the sum of many things, such as its raw materials and their sourcing as well as the manufacturing process and the safety, functionality and recyclability of the finished product.
to detail the manufacturing location of the raw material we purchase in our product safety questionnaires.
Our goal is to know the manufacturing country of all our raw materials and packaging materials by 2030 and, for some raw materials, we will aim to trace details of their origin even further. In 2020, we knew the origin – at minimum the manufacturing country – of 97% (93%) of the total purchases of raw materi-als and packaging materials.
AIMING FOR ENTIRELY FOSSIL FREE PRODUCTS
Our products are already produced primarily from a renewable raw material. Our main raw material – wood fibre – accounts for 93% of all our raw materials. In addition, our paperboards contain raw materials based on minerals, such as kaolin, and fossil-oil-based materials, such as latex. PE coating is also used, particularly in some food service packaging. We are looking for alternatives to fossil-oil-based raw materials, and we aim to use only fossil free raw materials and packaging materials by the end of 2030. In 2020, fossil free raw materials and packaging materials represented 99% (99%) of the volume per dry tonne.
ENVIRONMENTAL IMPACT IS THE RESULT OF MANY THINGS
The environmental impact of a product is generated over its entire life cycle: it is affected by the raw materials, the production process and transport, and by how the product is used, recycled and disposed of. Our lightweight products,
PERFORMANCE IN 2020
Share of fossil free raw materials
99%Traceability of raw materials
97%Commitment to the Supplier Code of Conduct
96%Know your supplier check completed
84%Suppliers’ sustainability evaluation completed
54%
produced resource-efficiently and principally out of a renewable raw material, respond well to the needs of the circular economy. All our paperboards are recyclable, and with good packaging design, and by participating in initiatives promoting recycling, our goal is for our products to be recycled after use (pp. 16–19).
We follow the environmental impact of our paperboards with life-cycle analyses prepared in accordance with the ISO 14040 and ISO 14044 standards. From the perspective of paperboard’s climate impact and carbon footprint, the energy used in the production carries the most relevance. As we move on to the use of entirely fossil free energy in our production, the carbon footprint of the products will become even smaller. In the best case scenario, the carbon footprint of packaging made from our fresh fibre paperboard is currently more than 50% smaller than that of packaging of an equivalent stiffness made from recycled fibre or solid bleached board (Ecoinvent database).
The carbon footprint of packaging made from our fresh fibre paper-board is currently more than 50% lighter that of packaging of an equiv-alent stiffness made from recycled fibre or solid bleached board. (Ecoinvent database)
White kraftliner enables eye-
catching e-commerce packaging
and is a lightweight, recyclable
and ecological material choice.
WE OFFER SUSTAINABLE CHOICES
2726
METSÄ BOARD Annual Report 2020
Business operations and value creation
2 This is Metsä Board
4 CEO’s review
6 Highlights of the year
8 Strategy and targets
10 Creating value
12 Operating environment
16 Product and service development
18 Circular economy
Sustainability
20 Sustainability targets
24 We bring the forest to you
26 We offer sustainable choices
30 We work for a better climate and environment
34 We create well-being
40 Mill-specific information
Financial development
44 Report of the Board of Directors
57 Consolidated financial statements
61 Notes to the consolidated financial statements
107 Parent company financial statements
110 Notes to the parent company financial statements
123 Auditor’s report
126 Shares and shareholders
132 Key figures and taxes
Governance
134 Corporate governance statement
140 Metsä Board Corporation’s Board of Directors
142 Metsä Board Corporation’s Corporate Management Team
144 Investor relations and investor information

BUSINESS OPERATIONS AND VALUE CREATION
FINANCIAL DEVELOPMENT GOVERNANCESUSTAINABILITY
SUSTAINABILITy | METSÄ BOARD ANNUAL REPORT 2020
All Metsä Board paperboards, excluding PE-coated
grades, have been certified for industrial compostability
complying with DIN EN 13432 and ASTM D6400 stand-
ards. In addition, five paperboard grades also hold a home
compostability certificate according to standard NF T
51–800. “In order to enhance the circular economy, our
main aim is that our paperboards are recycled after use.
But recycling is not always possible – the paperboard
may become contaminated due to its contents and can-
not be recycled. In this instance compostability is a good
alternative.”
– Helena Moring-Vepsäläinen, Product Safety Manager
Our paperboards have certificates on compostability
The most important function of packaging is to keep the consumer safe. Our products are manufactured from renewable fresh fibres that are naturally pure, traceable and recyclable. Fresh fibre paperboards are the safest choice of fibre packaging for sensitive end uses like direct food contact, where the packaged goods will retain the taste and smell intended.
WE KNOW OUR RAW MATERIALS
One of the advantages for Metsä Board is that the whole chain of wood raw material from forest, via pulp mill, to board mill, is managed by business areas of Metsä Group. This is how we know exactly what our paperboards are made of. The use of fresh fibres, and the unique chain from the forest to products,
Fresh fibre paperboard is a safe choice
We do not compromise on product safety. Therefore we follow product safety principles as strict as those used by the food industry.
guarantees that no unknown chemicals end up in our paperboards. For exam-ple, recycled fibres contain traces of ink and other impurities that may end up in the packaged product and be harmful to human health.
Only safe and carefully selected chemicals are used in our paperboard production. Each of them is observed carefully; they are required to comply with relevant global legislation, for example, food contact regulations. Health, safety and environmental aspects are also carefully reviewed.
MANUFACTURING HYGIENIC AND SAFE PAPERBOARD
As a leading fresh fibre paperboard manufacturer Metsä Board wants to ensure that its product safety practices are equivalent to the standards in the food industry. Metsä Board production sites work according to good manufacturing practice (GMP), which is a basic requirement in Europe. In addition, all Metsä Board mills have a certified ISO 22000 Food Safety Management System, and the mills that are producing paperboards for food contact are also certified according to FSSC 22000 requirements.
Metsä Board mills have evaluated their food safety hazards with a HACCP (Hazard analysis and critical control points) tool, which is widely used in the food industry. To prevent the product safety risks caused by recognised hazards in advance, Metsä Board mills have defined preventive programmes that com-prise the whole production chain. In addition to our own operations, a proper hygiene level is also required from Metsä Board’s suppliers and subcontractors to ensure that paperboards are protected against contamination in every phase of the supply chain. We regularly audit our partners to ensure that risks are managed throughout the supply chain.
EXCEEDING THE REGULATORY REQUIREMENTS
Packaging materials intended for direct contact with food are subject to several global and local regulations and recommendations. Metsä Board ensures food safety by strict compliance with regulatory requirements that are applicable in relevant market areas, for example, in Europe, the US and Asia. Our global team of experts continuously addresses the evolving regulations and emerging product safety concerns to ensure that we fulfil, and even exceed, these requirements today and in the future.
To ensure the quality and safety of Metsä Board products, regular testing of the chemical properties and microbiological purity of the products is con-ducted. Metsä Board paperboards are also subject to sensorial examination of organoleptic properties. All products are tested according to global legislation in accredited external laboratories. The analysis, together with a detailed internal risk assessment, forms the basis for a Product Safety Statement, which covers all relevant product safety related issues for each Metsä Board product.
RAW MATERIALS
All wood raw material used by Metsä
Board comes from controlled or certified
sources and is traceable to the forest. Only
safe and carefully selected chemicals are
used in production. Chemical suppliers
are expected to fulfil our product safety
questionnaires annually.
PRODUCTION
Metsä Board products are manufactured
in accordance with good manufacturing
practice (GMP) and all Metsä Board
mills work according to a certified ISO/
FSSC 22000 Food Safety Management
System.
SAFE PRODUCTS
All products are tested and evaluated
according to global legislation to ensure the
safety of the products for different end uses,
for example, direct contact with foodstuffs.
LOGISTICS
With careful packaging and
requirements for logistics chain
we ensure the purity and safety
of our products throughout the
storage and transportation.
CONVERTING
High quality products elimi-
nate disruption and enable a
smooth converting process.
CONSUMER SAFETY AND END USE
The most important function of food pack-
aging is to keep the contents and consumers
safe. All Metsä Board paperboards are recy-
clable, depending on local recycling services.
They are also compostable and biodegradable,
excluding PE-coated products.
PRODUCT SAFETY IS IMPORTANT THROUGHOUT A PRODUCT’S LIFE CYCLE: FROM THE RAW MATERIALS ALL THE WAY UP TO THE RECYCLING OF THE FINISHED PRODUCT.
WE OFFER SUSTAINABLE CHOICES
2928
METSÄ BOARD Annual Report 2020
Business operations and value creation
2 This is Metsä Board
4 CEO’s review
6 Highlights of the year
8 Strategy and targets
10 Creating value
12 Operating environment
16 Product and service development
18 Circular economy
Sustainability
20 Sustainability targets
24 We bring the forest to you
26 We offer sustainable choices
30 We work for a better climate and environment
34 We create well-being
40 Mill-specific information
Financial development
44 Report of the Board of Directors
57 Consolidated financial statements
61 Notes to the consolidated financial statements
107 Parent company financial statements
110 Notes to the parent company financial statements
123 Auditor’s report
126 Shares and shareholders
132 Key figures and taxes
Governance
134 Corporate governance statement
140 Metsä Board Corporation’s Board of Directors
142 Metsä Board Corporation’s Corporate Management Team
144 Investor relations and investor information
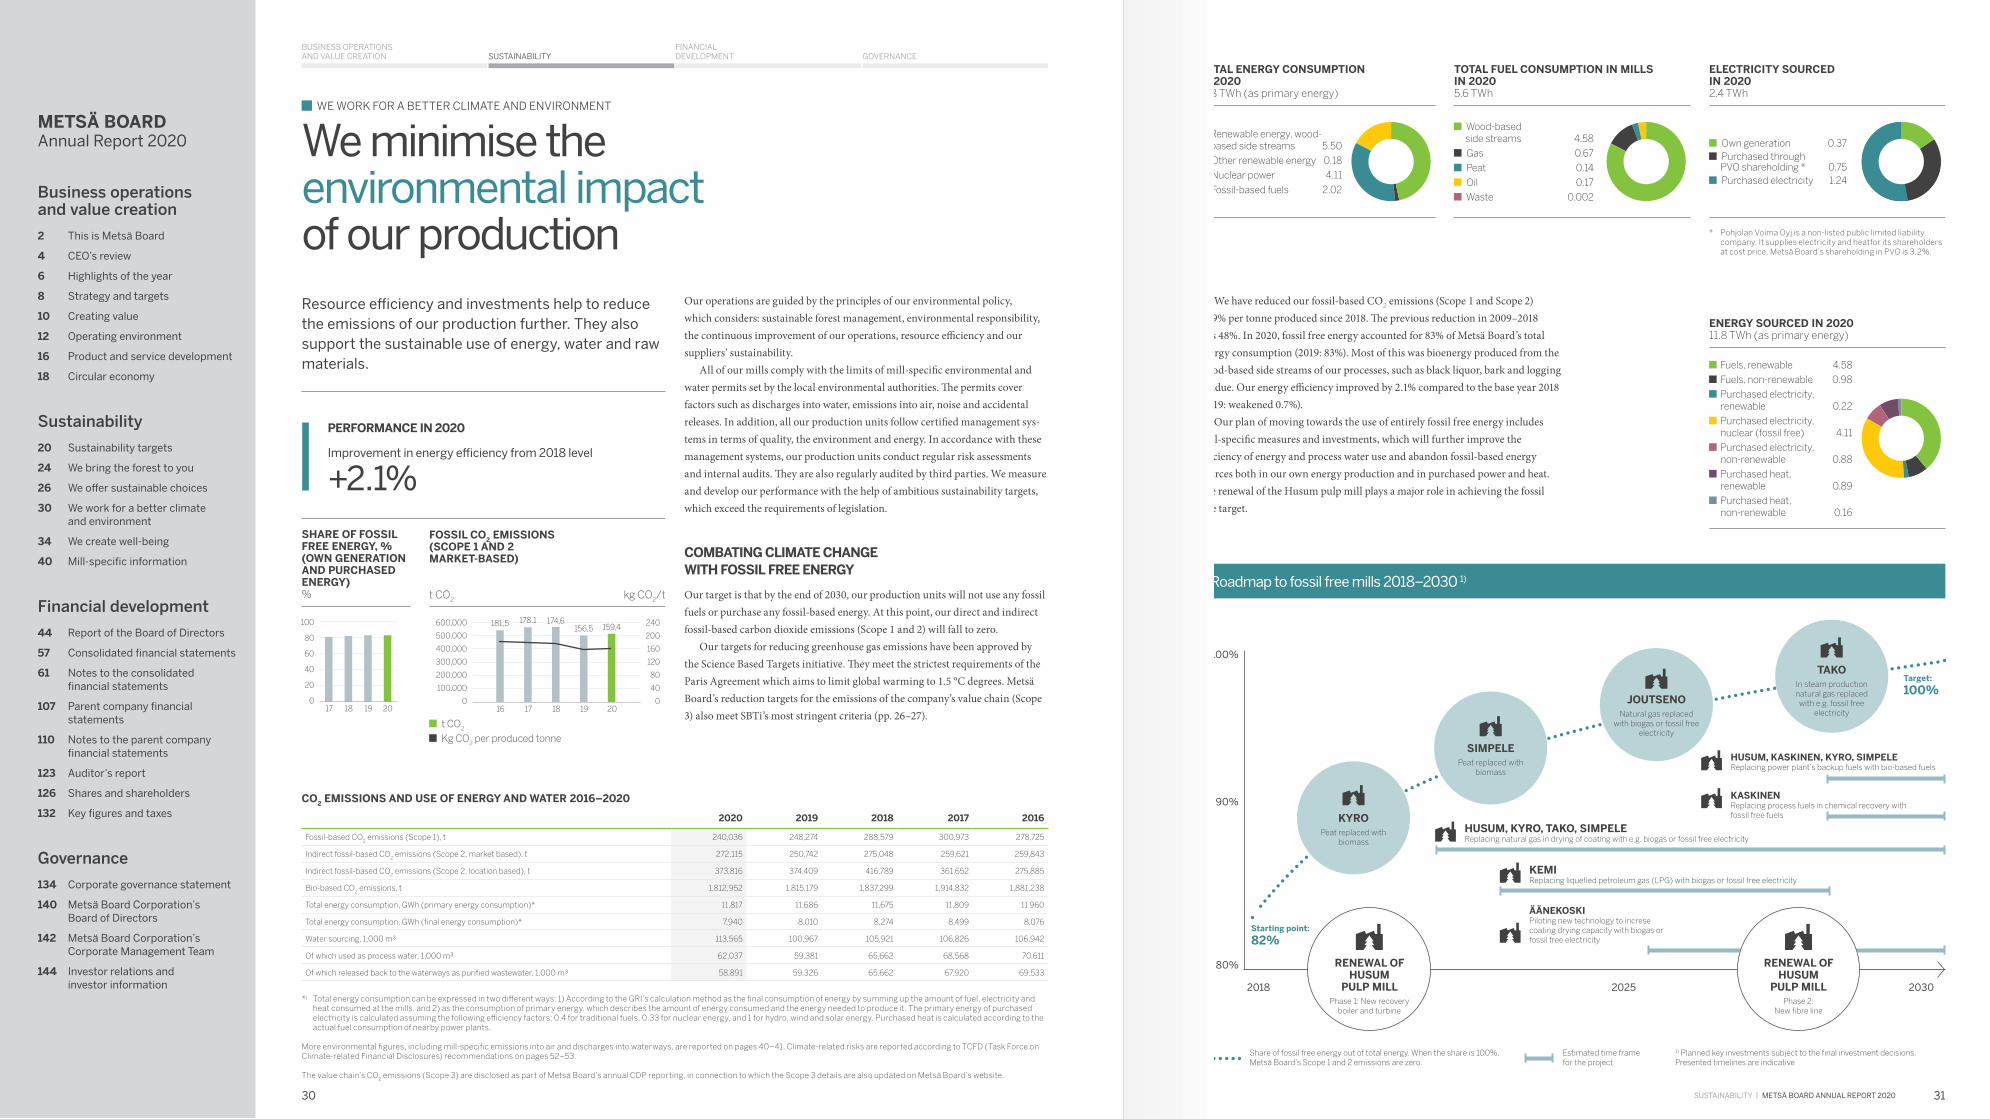
100
80
60
40
20
017 18 19 20
240
200
160
120
80
40
016 17 18 19 20
BUSINESS OPERATIONS AND VALUE CREATION
FINANCIAL DEVELOPMENT GOVERNANCESUSTAINABILITY
SUSTAINABILITy | METSÄ BOARD ANNUAL REPORT 2020
We minimise the environmental impact of our productionResource efficiency and investments help to reduce the emissions of our production further. They also support the sustainable use of energy, water and raw materials.
SHARE OF FOSSIL FREE ENERGY, % (OWN GENERATION AND PURCHASED ENERGY)%
CO2 EMISSIONS AND USE OF ENERGY AND WATER 2016–2020
2020 2019 2018 2017 2016
Fossil-based CO2 emissions (Scope 1), t 240,036 248,274 288,579 300,973 278,725
Indirect fossil-based CO2 emissions (Scope 2, market based), t 272,115 250,742 275,048 259,621 259,843
Indirect fossil-based CO2 emissions (Scope 2, location based), t 373,816 374,409 416,789 361,652 275,885
Bio-based CO2 emissions, t 1,812,952 1,815,179 1,837,299 1,914,832 1,881,238
Total energy consumption, GWh (primary energy consumption)* 11,817 11,686 11,675 11,809 11 960
Total energy consumption, GWh (final energy consumption)* 7,940 8,010 8,274 8,499 8,076
Water sourcing, 1,000 m³ 113,565 100,967 105,921 106,826 106,942
Of which used as process water, 1,000 m³ 62,037 59,381 65,662 68,568 70,611
Of which released back to the waterways as purified wastewater, 1,000 m³ 58,891 59,326 65,662 67,920 69,533
*) Total energy consumption can be expressed in two different ways: 1) According to the GRI’s calculation method as the final consumption of energy by summing up the amount of fuel, electricity and heat consumed at the mills, and 2) as the consumption of primary energy, which describes the amount of energy consumed and the energy needed to produce it. The primary energy of purchased electricity is calculated assuming the following efficiency factors: 0.4 for traditional fuels, 0.33 for nuclear energy, and 1 for hydro, wind and solar energy. Purchased heat is calculated according to the actual fuel consumption of nearby power plants.
More environmental figures, including mill-specific emissions into air and discharges into waterways, are reported on pages 40–41. Climate-related risks are reported according to TCFD (Task Force on Climate-related Financial Disclosures) recommendations on pages 52–53.
The value chain’s CO2 emissions (Scope 3) are disclosed as part of Metsä Board’s annual CDP reporting, in connection to which the Scope 3 details are also updated on Metsä Board’s website.
2018
Share of fossil free energy out of total energy. When the share is 100%, Metsä Board’s Scope 1 and 2 emissions are zero.
Sha
re o
f fos
sil f
ree
ener
gy (
out o
f tot
al e
nerg
y)
1) Planned key investments subject to the final investment decisions. Presented timelines are indicative
80%
Starting point:
82%
Target:
100%
90%
100%
2025 2030
KYROPeat replaced with
biomass
HUSUM, KYRO, TAKO, SIMPELEReplacing natural gas in drying of coating with e.g. biogas or fossil free electricity
KEMIReplacing liquefied petroleum gas (LPG) with biogas or fossil free electricity
ÄÄNEKOSKIPiloting new technology to increse coating drying capacity with biogas or fossil free electricity
HUSUM, KASKINEN, KYRO, SIMPELEReplacing power plant’s backup fuels with bio-based fuels
KASKINENReplacing process fuels in chemical recovery with fossil free fuels
RENEWAL OF HUSUM
PULP MILLPhase 1: New recovery
boiler and turbine
RENEWAL OF HUSUM
PULP MILLPhase 2:
New fibre line
Estimated time frame for the project
SIMPELEPeat replaced with
biomass
JOUTSENONatural gas replaced
with biogas or fossil free electricity
TAKOIn steam production natural gas replaced
with e.g. fossil free electricity
600,000
500,000
400,000
300,000
200,000
100,000
0
181,5 178,1 174,6156,5 159,4
FOSSIL CO2 EMISSIONS (SCOPE 1 AND 2 MARKET-BASED)
t CO2 kg CO2/t
t CO2
Kg CO2 per produced tonne
Our operations are guided by the principles of our environmental policy, which considers: sustainable forest management, environmental responsibility, the continuous improvement of our operations, resource efficiency and our suppliers’ sustainability.
All of our mills comply with the limits of mill-specific environmental and water permits set by the local environmental authorities. The permits cover factors such as discharges into water, emissions into air, noise and accidental releases. In addition, all our production units follow certified management sys-tems in terms of quality, the environment and energy. In accordance with these management systems, our production units conduct regular risk assessments and internal audits. They are also regularly audited by third parties. We measure and develop our performance with the help of ambitious sustainability targets, which exceed the requirements of legislation.
COMBATING CLIMATE CHANGE WITH FOSSIL FREE ENERGY
Our target is that by the end of 2030, our production units will not use any fossil fuels or purchase any fossil-based energy. At this point, our direct and indirect fossil-based carbon dioxide emissions (Scope 1 and 2) will fall to zero.
Our targets for reducing greenhouse gas emissions have been approved by the Science Based Targets initiative. They meet the strictest requirements of the Paris Agreement which aims to limit global warming to 1.5 °C degrees. Metsä Board’s reduction targets for the emissions of the company’s value chain (Scope 3) also meet SBTi’s most stringent criteria (pp. 26–27).
Roadmap to fossil free mills 2018–2030 1)
We have reduced our fossil-based CO2 emissions (Scope 1 and Scope 2) by 9% per tonne produced since 2018. The previous reduction in 2009–2018 was 48%. In 2020, fossil free energy accounted for 83% of Metsä Board’s total energy consumption (2019: 83%). Most of this was bioenergy produced from the wood-based side streams of our processes, such as black liquor, bark and logging residue. Our energy efficiency improved by 2.1% compared to the base year 2018 (2019: weakened 0.7%).
Our plan of moving towards the use of entirely fossil free energy includes mill-specific measures and investments, which will further improve the efficiency of energy and process water use and abandon fossil-based energy sources both in our own energy production and in purchased power and heat. The renewal of the Husum pulp mill plays a major role in achieving the fossil free target.
Fuels, renewable 4.58
Fuels, non-renewable 0.98
Purchased electricity, renewable 0.22
Purchased electricity, nuclear (fossil free) 4.11
Purchased electricity, non-renewable 0.88
Purchased heat, renewable 0.89
Purchased heat, non-renewable 0.16
ENERGY SOURCED IN 202011.8 TWh (as primary energy)
Wood-based side streams 4.58
Gas 0.67
Peat 0.14
Oil 0.17
Waste 0.002
TOTAL FUEL CONSUMPTION IN MILLS IN 2020 5.6 TWh
Renewable energy, wood-based side streams 5.50
Other renewable energy 0.18
Nuclear power 4.11
Fossil-based fuels 2.02
TOTAL ENERGY CONSUMPTION IN 202011.8 TWh (as primary energy)
Own generation 0.37 Purchased through PVO shareholding * 0.75
Purchased electricity 1.24
ELECTRICITY SOURCED IN 20202.4 TWh
* Pohjolan Voima Oyj is a non-listed public limited liability company. It supplies electricity and heatfor its shareholders at cost price. Metsä Board’s shareholding in PVO is 3.2%.
PERFORMANCE IN 2020
Improvement in energy efficiency from 2018 level
+2.1%
WE WORK FOR A BETTER CLIMATE AND ENVIRONMENT
3130
METSÄ BOARD Annual Report 2020
Business operations and value creation
2 This is Metsä Board
4 CEO’s review
6 Highlights of the year
8 Strategy and targets
10 Creating value
12 Operating environment
16 Product and service development
18 Circular economy
Sustainability
20 Sustainability targets
24 We bring the forest to you
26 We offer sustainable choices
30 We work for a better climate and environment
34 We create well-being
40 Mill-specific information
Financial development
44 Report of the Board of Directors
57 Consolidated financial statements
61 Notes to the consolidated financial statements
107 Parent company financial statements
110 Notes to the parent company financial statements
123 Auditor’s report
126 Shares and shareholders
132 Key figures and taxes
Governance
134 Corporate governance statement
140 Metsä Board Corporation’s Board of Directors
142 Metsä Board Corporation’s Corporate Management Team
144 Investor relations and investor information

2018 2019 2020 2021 2022 2023 2024 2025 2026 2027 2028 2029 2030
BUSINESS OPERATIONS AND VALUE CREATION
FINANCIAL DEVELOPMENT GOVERNANCESUSTAINABILITY
SUSTAINABILITy | METSÄ BOARD ANNUAL REPORT 2020
EMISSIONS INTO AIR AND DISCHARGES INTO WATER ARE MONITORED CLOSELY
The majority of our emissions into air are caused by the energy production needed for the manufacturing of pulp, BCTMP and paperboard. Alongside carbon dioxide emissions and the climate impact, our most notable emissions into the air are sulphur and nitrogen oxides, which cause acidification. Locally significant effects can arise from noise, emissions of particulate matter and the malodorous sulphur compounds generated in the production of chemical pulp.
With regard to waterways, the key indicators to be monitored are the volume of nutrient emissions with an impact on eutrophication (phosphorus and nitrogen), the volume of suspended solids, the biological and chemical oxygen demand (BOD, COD) attributable to organic material and the chlorine-con-taining AOX compounds arising from bleaching of chemical pulp. Our mills’ impact on waterways is typically low compared to the diffuse pollution caused by agriculture, forestry and scattered settlements. In Finland, for example, only about 3–4% of nutrient discharges are attributable to the pulp and paper industry (Finnish Forest Industries Federation).
Our production relies on the best available technology and we continuously ensure that all our mills operate within the limits of the environmental and water permits issued by the authorities. If deviations occur, we always report them to the authorities. No deviations resulting in significant environmental impact occurred in Metsä Board’s production units in 2020. Some cases in which permit conditions were exceeded on a monthly level were nevertheless recorded. Our mill-specific emissions and all environmental permit limit violations are reported on pages 40–41 of this Annual Report.
AIMING TO UTILISE ALL SIDE STREAMS
As part of Metsä Group, we are able to use every part of our wood raw material. Metsä Group’s production units use the most valuable parts – thick logs – to manufacture wood products used in construction, for example. The thinner parts of tree trunks and the younger trees harvested during thinning operations are the main raw material of pulp and paperboard products. Bark and branches are utilised in the production of bioenergy.
We continuously improve recovery processes to avoid waste in pulp and paperboard production. By increasing the recycling of process water, for example, we can reduce fibre material losses. We are also looking for new ways to reuse residues, and we use organic fractions for energy production. Our goal is to make use of all production side streams so that no landfill waste will be generated after 2030. Our greatest challenge is finding applications for the green liquor dregs generated in the pulp process, and we are currently investigating potential solutions.
In 2020, we utilised 99% of the side streams (2019: 99%). Side streams consist of production waste and by-products, such as ash used in fertilisers.
Some 35% of the waste generated in production was reused as materials, while 63% of it was incinerated to produce energy. Approximately 2% of the waste was delivered to landfill or treated as hazardous waste.
WE IMPROVE THE EFFICIENCY OF WATER USE
We aim to continuously optimise water use within our processes and to increase our efficiency in recycling process water in the production process to reduce the need for abstracting new raw water. This minimises our wastewater discharges and saves energy, thereby also reducing the impact on the climate.
All the process and cooling waters we use are taken from nearby surface waters such as rivers and lakes. Given that all our mills are located in water rich areas in Finland and Sweden, no water is abstracted from areas with high water stress (WRI Aqueduct Water Risk Atlas). After use, process water is purified thoroughly before it is returned to waterways. Since the cooling water flows within its own closed cycle, it remains clean at all times. Our water consumption is very low compared to the volume of water we use: 99% is returned to the waterways after use and 1%, evaporates into the air during the process or is bound to our products.
In 2020, Metsä Board’s freshwater intake totalled 114 million cubic metres (101 million m3), of which approximately half was used in the process and half for the cooling of machinery. To continue our efforts in reducing water use (-20% per tonne produced in 2010–2018), our new aim is to reduce the use of process water by 30% per tonne produced in 2018–2030. The reduction in 2020 was 7.7% compared to 2018 (2019: -11%). To achieve this target, we have defined mill-specific measures which improve water recycling and reduce the abstraction of raw water from waterways. The Husum integrated mill’s share of our water use is around 40%, which is why the renewal of the Husum pulp mill will reduce Metsä Board’s water use by a significant degree.
25.0
20.0
15.0
10.0
5.0
0
PROCESS WATER USE, m3/tonneBase year 2018 and target year 2030
Reduction target 2018–2030
Target level in 2030: 14,4 m3/t
Metsä Board participates in the restoration of fish stocks
PERFORMANCE IN 2020
Reduction in process water use per product tonne from 2018 level
-7.7%Utilisation of side streams
99%
Metsä Board participated in the restoration of the Mämmenkoski fishery, located in
Äänekoski. The restoration was focused on enabling the fish to move upstream, from one
lake area to another, and on the lake trout’s natural regeneration in the rapids. Other partic-
ipants in the project included WWF Finland, the North Savo Centre for Economic Develop-
ment, Transport and the Environment, and the water body’s local participants’ association.
Practical measures in the restoration effort included opening two damns blocking the
trout’s way upstream, shaping the bed of the river into a natural fishway with the help of a
stone pavement, and building spawning areas for the trout and habitats for the juvenile fish.
The work was finished in the summer of 2020.
“Metsä Board is happy to participate in collaborative projects involving waterways and
fisheries. We hope that the trout will return to Mämmenkoski as soon as possible.”
– Mika Leino, Environmental Director at Metsä Group
3332
METSÄ BOARD Annual Report 2020
Business operations and value creation
2 This is Metsä Board
4 CEO’s review
6 Highlights of the year
8 Strategy and targets
10 Creating value
12 Operating environment
16 Product and service development
18 Circular economy
Sustainability
20 Sustainability targets
24 We bring the forest to you
26 We offer sustainable choices
30 We work for a better climate and environment
34 We create well-being
40 Mill-specific information
Financial development
44 Report of the Board of Directors
57 Consolidated financial statements
61 Notes to the consolidated financial statements
107 Parent company financial statements
110 Notes to the parent company financial statements
123 Auditor’s report
126 Shares and shareholders
132 Key figures and taxes
Governance
134 Corporate governance statement
140 Metsä Board Corporation’s Board of Directors
142 Metsä Board Corporation’s Corporate Management Team
144 Investor relations and investor information
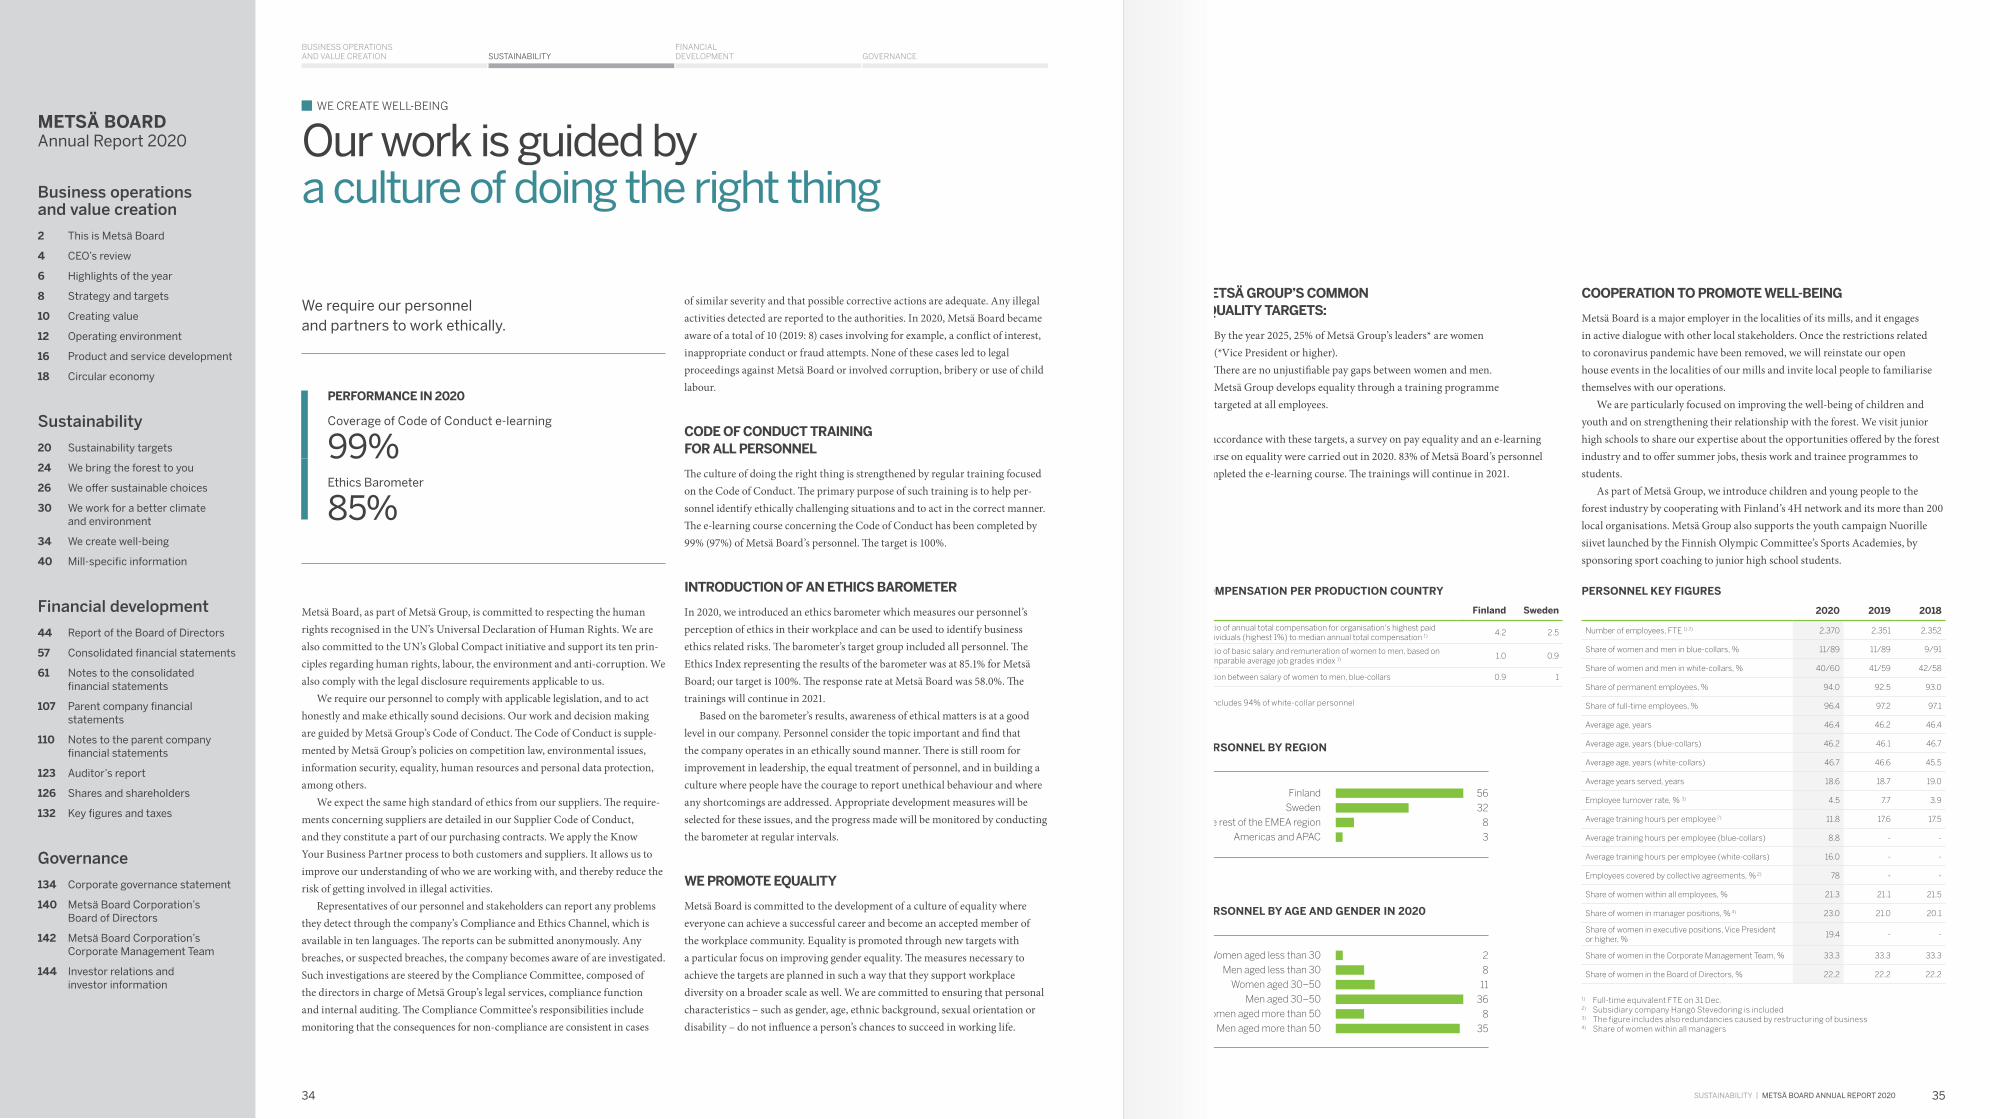
BUSINESS OPERATIONS AND VALUE CREATION
FINANCIAL DEVELOPMENT GOVERNANCESUSTAINABILITY
SUSTAINABILITy | METSÄ BOARD ANNUAL REPORT 2020
Metsä Board, as part of Metsä Group, is committed to respecting the human rights recognised in the UN’s Universal Declaration of Human Rights. We are also committed to the UN’s Global Compact initiative and support its ten prin-ciples regarding human rights, labour, the environment and anti-corruption. We also comply with the legal disclosure requirements applicable to us.
We require our personnel to comply with applicable legislation, and to act honestly and make ethically sound decisions. Our work and decision making are guided by Metsä Group’s Code of Conduct. The Code of Conduct is supple-mented by Metsä Group’s policies on competition law, environmental issues, information security, equality, human resources and personal data protection, among others.
We expect the same high standard of ethics from our suppliers. The require-ments concerning suppliers are detailed in our Supplier Code of Conduct, and they constitute a part of our purchasing contracts. We apply the Know Your Business Partner process to both customers and suppliers. It allows us to improve our understanding of who we are working with, and thereby reduce the risk of getting involved in illegal activities.
Representatives of our personnel and stakeholders can report any problems they detect through the company’s Compliance and Ethics Channel, which is available in ten languages. The reports can be submitted anonymously. Any breaches, or suspected breaches, the company becomes aware of are investigated. Such investigations are steered by the Compliance Committee, composed of the directors in charge of Metsä Group’s legal services, compliance function and internal auditing. The Compliance Committee’s responsibilities include monitoring that the consequences for non-compliance are consistent in cases
Our work is guided by a culture of doing the right thing
of similar severity and that possible corrective actions are adequate. Any illegal activities detected are reported to the authorities. In 2020, Metsä Board became aware of a total of 10 (2019: 8) cases involving for example, a conflict of interest, inappropriate conduct or fraud attempts. None of these cases led to legal proceedings against Metsä Board or involved corruption, bribery or use of child labour.
CODE OF CONDUCT TRAINING FOR ALL PERSONNEL
The culture of doing the right thing is strengthened by regular training focused on the Code of Conduct. The primary purpose of such training is to help per-sonnel identify ethically challenging situations and to act in the correct manner. The e-learning course concerning the Code of Conduct has been completed by 99% (97%) of Metsä Board’s personnel. The target is 100%.
INTRODUCTION OF AN ETHICS BAROMETER
In 2020, we introduced an ethics barometer which measures our personnel’s perception of ethics in their workplace and can be used to identify business ethics related risks. The barometer’s target group included all personnel. The Ethics Index representing the results of the barometer was at 85.1% for Metsä Board; our target is 100%. The response rate at Metsä Board was 58.0%. The trainings will continue in 2021.
Based on the barometer’s results, awareness of ethical matters is at a good level in our company. Personnel consider the topic important and find that the company operates in an ethically sound manner. There is still room for improvement in leadership, the equal treatment of personnel, and in building a culture where people have the courage to report unethical behaviour and where any shortcomings are addressed. Appropriate development measures will be selected for these issues, and the progress made will be monitored by conducting the barometer at regular intervals.
WE PROMOTE EQUALITY
Metsä Board is committed to the development of a culture of equality where everyone can achieve a successful career and become an accepted member of the workplace community. Equality is promoted through new targets with a particular focus on improving gender equality. The measures necessary to achieve the targets are planned in such a way that they support workplace diversity on a broader scale as well. We are committed to ensuring that personal characteristics – such as gender, age, ethnic background, sexual orientation or disability – do not influence a person’s chances to succeed in working life.
We require our personnel and partners to work ethically.
METSÄ GROUP’S COMMON EQUALITY TARGETS:
• By the year 2025, 25% of Metsä Group’s leaders* are women (*Vice President or higher).
• There are no unjustifiable pay gaps between women and men.• Metsä Group develops equality through a training programme
targeted at all employees.
In accordance with these targets, a survey on pay equality and an e-learning course on equality were carried out in 2020. 83% of Metsä Board’s personnel completed the e-learning course. The trainings will continue in 2021.
PERFORMANCE IN 2020
Coverage of Code of Conduct e-learning
99%Ethics Barometer
85%
Women aged less than 30
Men aged less than 30
Women aged 30–50
Men aged 30–50
Women aged more than 50
Men aged more than 50
PERSONNEL BY AGE AND GENDER IN 2020 %
PERSONNEL KEY FIGURES
2020 2019 2018
Number of employees, FTE 1) 2) 2,370 2,351 2,352
Share of women and men in blue-collars, % 11/89 11/89 9/91
Share of women and men in white-collars, % 40/60 41/59 42/58
Share of permanent employees, % 94.0 92.5 93.0
Share of full-time employees, % 96.4 97.2 97.1
Average age, years 46.4 46.2 46.4
Average age, years (blue-collars) 46.2 46.1 46.7
Average age, years (white-collars) 46.7 46.6 45.5
Average years served, years 18.6 18.7 19.0
Employee turnover rate, % 3) 4.5 7.7 3.9
Average training hours per employee 2) 11.8 17.6 17.5
Average training hours per employee (blue-collars) 8.8 - -
Average training hours per employee (white-collars) 16.0 - -
Employees covered by collective agreements, % 2) 78 - -
Share of women within all employees, % 21.3 21.1 21.5
Share of women in manager positions, % 4) 23.0 21.0 20.1
Share of women in executive positions, Vice President or higher, %
19.4 - -
Share of women in the Corporate Management Team, % 33.3 33.3 33.3
Share of women in the Board of Directors, % 22.2 22.2 22.2
1) Full-time equivalent FTE on 31 Dec.2) Subsidiary company Hangö Stevedoring is included 3) The figure includes also redundancies caused by restructuring of business4) Share of women within all managers
COMPENSATION PER PRODUCTION COUNTRY
Finland Sweden
Ratio of annual total compensation for organisation's highest paid individuals (highest 1%) to median annual total compensation 1) 4.2 2.5
Ratio of basic salary and remuneration of women to men, based on comparable average job grades index 1) 1.0 0.9
Ration between salary of women to men, blue-collars 0.9 1
1) Includes 94% of white-collar personnel
Finland
Sweden
The rest of the EMEA region
Americas and APAC
56
32
8
3
2
8
11
36
8
35
PERSONNEL BY REGION%
COOPERATION TO PROMOTE WELL-BEING
Metsä Board is a major employer in the localities of its mills, and it engages in active dialogue with other local stakeholders. Once the restrictions related to coronavirus pandemic have been removed, we will reinstate our open house events in the localities of our mills and invite local people to familiarise themselves with our operations.
We are particularly focused on improving the well-being of children and youth and on strengthening their relationship with the forest. We visit junior high schools to share our expertise about the opportunities offered by the forest industry and to offer summer jobs, thesis work and trainee programmes to students.
As part of Metsä Group, we introduce children and young people to the forest industry by cooperating with Finland’s 4H network and its more than 200 local organisations. Metsä Group also supports the youth campaign Nuorille siivet launched by the Finnish Olympic Committee’s Sports Academies, by sponsoring sport coaching to junior high school students.
WE CREATE WELL-BEING
3534
METSÄ BOARD Annual Report 2020
Business operations and value creation
2 This is Metsä Board
4 CEO’s review
6 Highlights of the year
8 Strategy and targets
10 Creating value
12 Operating environment
16 Product and service development
18 Circular economy
Sustainability
20 Sustainability targets
24 We bring the forest to you
26 We offer sustainable choices
30 We work for a better climate and environment
34 We create well-being
40 Mill-specific information
Financial development
44 Report of the Board of Directors
57 Consolidated financial statements
61 Notes to the consolidated financial statements
107 Parent company financial statements
110 Notes to the parent company financial statements
123 Auditor’s report
126 Shares and shareholders
132 Key figures and taxes
Governance
134 Corporate governance statement
140 Metsä Board Corporation’s Board of Directors
142 Metsä Board Corporation’s Corporate Management Team
144 Investor relations and investor information

10
8
6
4
2
016 17 18 19 20
18
15
12
9
6
3
016 17 18 19 20
BUSINESS OPERATIONS AND VALUE CREATION
FINANCIAL DEVELOPMENT GOVERNANCESUSTAINABILITY
SUSTAINABILITy | METSÄ BOARD ANNUAL REPORT 2020
The safety of employees is of primary importance to Metsä Board. All our mills comply with the ISO 45001 occupational health and safety management system, which replaced the previous OHSAS 18001 system in 2020.
During the year, safety at work has been improved through a programme covering the entire Metsä Group. The programme aims to create common safety management principles, daily management processes, safety-at-work standards and more detailed safety instructions. The resulting operating models will be adopted throughout the Group. Metsä Board will adopt the operating models in all its operations by the end of 2021. The safety programme’s principles support operations in line with the ISO standard at our mills and comply with our company’s Code of Conduct and safety policy. The safety principles cover our entire personnel and partners.
The common safety management processes steer daily management and carry us towards our goal of a safe working environment. By following the common processes, we can make best practices available to everyone. The implementation of the processes at the mills will be monitored through annual internal audits. Annual external audits will be carried out in accordance with the ISO 45001 standard.
INDICATORS FOR MONITORING SAFETY AT WORK
Metsä Group’s common safety performance indicators are an important tool for developing occupational safety. Key indicators include TRIF, which measures the total recordable incident frequency, and LTA1, which measures the frequency of accidents leading to absences.
In 2020, TRIF was 8.4 (2019: 10.2), while the LTA1 rate was 5.7 (5.5). Safety at our mills has improved, but the incident frequency in our port operations in Hangö Stevedoring increased from the previous year. Slips, as well as injuries to hands and feet, accounted for the most typical accidents.
We also monitor the achievement of the internal targets of proactive safety work on a continuous basis. The proactive measures include safety observations, safety walk-throughs and safety trainings.
TRAINING SUPPORTS THE ACHIEVEMENT OF TARGETS
The adoption of common safety practices has been supported through training programmes aimed at all employees working at mills. In addition, maintenance personnel have been provided with training on the mills’ maintenance processes. Due to precautionary measures attributable to the coronavirus situation, some of the training has been organised remotely. Thanks to electronic training materials, the training of new employees and the retraining of current employees can be implemented flexibly and efficiently.
Aiming for zero accidents
SAFETY INCREASES PRODUCTIVITY
Metsä Board’s mills continued to roll out the 5S method, aiming to improve productivity, safety at work and well-being at work. The method is in use at all our mills and at our headquarters. Among other things, 5S has reduced trips and slips and the resulting accidents. The continuous use of the method is ensured through 5S audits, which also draws attention to any deviations detected during the audit rounds.
In 2020, all production units adopted a criticality classification process for maintenance operations. The process defines the maintenance needs of functions and equipment. This supports the achievement of the production units’ production targets and improves the operational reliability of machines and equipment.
We develop safety at work through proactive measures, a common way of working and by complying with a standardised management system. Our long-term objective is zero accidents.
SAFETY KEY FIGURES
2020 2019 2018
Sickness absences, % of theoretical working hours 3.9 4.0 3.5
Total Recordable Injury Frequency (TRIF ) per million hours worked
8.4 10.2 12.6
Lost-time accident frequency (LTA1) per million hours worked
5.7 5.5 7.5
Number of lost-time accidents (LTA1), external service providers
7 13 8
Accident severity rate 9.2 18.6 13.8
Accident severity rate, external service providers 12.1 10.3 7.8
Number of fatal occupational accidents 0 0 0
Subsidiary company Hangö Stevedoring is included in all figures.
5S is the cornerstone of a safe and efficient supply chain
LOST-TIME ACCIDENT FREQUENCY (LTA1) per million hours worked
TOTAL RECORDABLE INJURY FREQUENCY (TRIF)per million hours worked
Unified processes help us to effectively
develop maintenance practices and compe-
tences. With harmonised working practices
we can improve collaboration with our other
mills and support each other better.
– Jonas Mörnsjö, Maintenance Manager
Clean mills where well-labelled equipment and tools
are organised and easily accessible create conditions for a
high level of safety and production. Cleanliness and order
have a major impact on everyday well-being at work. At
Metsä Board, 5S is used in all mills as part of
day-to-day work and operation. The activities are
monitored by production line and each mill has a
system to systematically monitor 5S.
WE CREATE WELL-BEING
Kuvan sävyt korjataan.
3736
METSÄ BOARD Annual Report 2020
Business operations and value creation
2 This is Metsä Board
4 CEO’s review
6 Highlights of the year
8 Strategy and targets
10 Creating value
12 Operating environment
16 Product and service development
18 Circular economy
Sustainability
20 Sustainability targets
24 We bring the forest to you
26 We offer sustainable choices
30 We work for a better climate and environment
34 We create well-being
40 Mill-specific information
Financial development
44 Report of the Board of Directors
57 Consolidated financial statements
61 Notes to the consolidated financial statements
107 Parent company financial statements
110 Notes to the parent company financial statements
123 Auditor’s report
126 Shares and shareholders
132 Key figures and taxes
Governance
134 Corporate governance statement
140 Metsä Board Corporation’s Board of Directors
142 Metsä Board Corporation’s Corporate Management Team
144 Investor relations and investor information

BUSINESS OPERATIONS AND VALUE CREATION
FINANCIAL DEVELOPMENT GOVERNANCESUSTAINABILITY
SUSTAINABILITy | METSÄ BOARD ANNUAL REPORT 2020
Strategy is implemented in daily work
Motivated people are one of our critical success factors. We want each Metsä Board employee to have meaningful work and continuous competence development. We ensure that our common goals are clear, and that each of our employees knows the importance of their work and their role as an implementer of our strategy. Our remuneration systems support the implementation of the strategy and incentivises employees to achieve the set goals.
As an employer, we are guided by company-wide policies which we require every employee to know and comply with. Among other things, these policies concern ethical operating methods, equality, well-being at work, safety and sustainability.
Proactiveness plays a key role in promoting and maintaining well-being at work and the capacity for work. Important tools in the early support model include an assessment of working capacity and personal working capacity plans, which are drawn up in cooperation with supervisors, occupational healthcare and HR.
We encourage our employees to anticipate and assess their own coping needs and health, and we provide monetary support for fitness and cultural hobbies. Everyone is entitled to free occupational healthcare. Benefits related to well-being at work are equal for both permanent and fixed-term employees.
Our goal is for everyone in our workplace community to know the meaning of their work and their role as an implementer of our strategy. We believe that a motivating and inspiring workplace attracts the best talents.
GOAL-ORIENTED COMPETENCE DEVELOPMENT
Metsä Board is known for the high quality of its products and services. We employ many professionals who have committed to their work for years and possess deep insights into how the work should be developed. Their professional skills constitute important knowledge capital. Making use of the skills of specialists in induction and the development of work is important for us to be able to ensure our operational efficiency and the high quality of our products in the future.
Our production relies on the industry’s latest and utilises best technology. A forerunner position in technology increases the competence requirement level and provides opportunities for continuous competence development. A high level of competence ensures production process consistency and reliability in all circumstances. Each of our employees has a performance and development appraisal (PDA) twice a year for the purpose of setting goals and development targets and assessing the progress made in them, together with their supervisors. In 2020, Metsä Board adopted a competence assessment model based on business processes, which was used to prepare a development plan based on competence development needs for every employee.
We arrange apprenticeship training at our mills with the aim of recruiting future production and maintenance professionals with multiple skills. A personal training plan is drawn up for each student, and the aim is for them to complete a basic degree in process engineering, mechanical engineering or in a similar field and to be employed by one of our production units once the apprenticeship is completed. In 2020, our mills in Simpele, Tampere, Äänekoski, Kaskinen and Kyröskoski began training a total of 31 apprentices.
Despite the exceptional circumstances, Metsä Board provided summer jobs for 280 summer employees. The inductions were conducted safely with the help of various arrangements.
Metsä Board is an international and continuously
developing company, and we can offer diverse
opportunities for job rotation and for continuous
personal competence development and career
advancement. Our strengths include an ethical and
respectful corporate culture, management through
clear objectives, allocation of responsibilities and
fast decision making.
– Camilla Wikström, Senior Vice President, Human Resources
During the exceptional year of the coronavirus pandemic,
we introduced strict precautionary measures that were in
line with the situation and exceeded the measures required
by the authorities. The aim of the extensive precautionary
measures was to ensure the health, safety and wellbeing of
employees, prevent chains of transmission and to ensure the
continuity of our business.
During the pandemic, we have worked remotely when-
ever the nature of the work has allowed for it. However, the
majority of our work takes place at production units where
remote working is not possible. We have used a variety of
means to minimise close contacts within our offices and
mills. We take care of hygiene and have detailed instructions
for the use of face masks. We have minimised infections by
applying special arrangements in canteens and staff facilities
Safety at work during exceptional times
and on routes from one place to another and by reducing the number
of workstations.
We have permitted only the most important visits to our locations,
such as visits related to maintenance and investment work. We regu-
larly test our personnel in mills located within areas where the infection
is spreading.
The coronavirus pandemic added extensive special arrangements
to our maintenance shutdowns this year. Nearly 2,000 tests were
conducted in Metsä Group during the shutdowns. No infection chains
arose and to prevent them, department-specific routes and separate
staff facilities for employees in charge of maintenance were organised
in the mill areas for the duration of shutdowns. All our mills completed
their annual maintenance shutdowns successfully.
For the challenges that the exceptional situation causes in daily
work, we have provided employees and supervisors with information
on how to operate under high workloads and how to ensure the flow of
information under all circumstances. We have organised video meet-
ings for the entire staff, and we also encourage supervisors to hold reg-
ular bilateral discussions with each of their team members to support
time management, work ergonomics and the taking of breaks.
Our resource situation has remained normal during the pandemic.
Thanks to the strict safety measures, we have not seen any chains of
transmission at our workplaces. We have been able to continue our
business and development projects according to plans.
Metsä Board’s new Excellence Centre in
Äänekoski, Finland, employs professionals
in research and development and packaging
design services. Operations at the Excellence
Centre were started up in September with
strict safety measures.
As we use the latest and industry’s best technology, the level of competency requirements increases. During apprenticeship training, students do versatile production or maintenance work. For our current professionals, the programmes offer the opportunity for further training and development of competencies.
WE CREATE WELL-BEING
3938
METSÄ BOARD Annual Report 2020
Business operations and value creation
2 This is Metsä Board
4 CEO’s review
6 Highlights of the year
8 Strategy and targets
10 Creating value
12 Operating environment
16 Product and service development
18 Circular economy
Sustainability
20 Sustainability targets
24 We bring the forest to you
26 We offer sustainable choices
30 We work for a better climate and environment
34 We create well-being
40 Mill-specific information
Financial development
44 Report of the Board of Directors
57 Consolidated financial statements
61 Notes to the consolidated financial statements
107 Parent company financial statements
110 Notes to the parent company financial statements
123 Auditor’s report
126 Shares and shareholders
132 Key figures and taxes
Governance
134 Corporate governance statement
140 Metsä Board Corporation’s Board of Directors
142 Metsä Board Corporation’s Corporate Management Team
144 Investor relations and investor information

BUSINESS OPERATIONS AND VALUE CREATION
FINANCIAL DEVELOPMENT GOVERNANCESUSTAINABILITY
SUSTAINABILITy | METSÄ BOARD ANNUAL REPORT 2020
MILL-SPECIFIC INFORMATION PRODUCTION CAPACITIES PER MILL
Mills Joutseno Kaskinen Kemi Kyro Simpele Tako Äänekoski Husum Others 5) Total
COUNTRIES FINLAND FINLAND FINLAND FINLAND FINLAND FINLAND FINLAND SWEDEN
PERSONNEL
Number of employees, FTE 1) 56 82 118 152 269 213 196 674 610 2,370
Lost-time accident frequency (TRIF) 2) 0.0 0.0 5.0 3.9 8.6 14.1 3.1 6.0 - 8.4
Lost-time accident frequency (LTA1) 3) 0.0 0.0 5.0 3.9 2.2 2.8 0.0 4.3 - 5.7
Sickness absences, % 4) 3.5 3.2 4.3 3.3 3.0 4.9 4.4 4.4 - 3.9
MANAGEMENT SYSTEMS
ISO 9001 x x x x x x x x
ISO 14001 x x x x x x x x
ISO 50001 x x x x x x x x
OHSAS 18001 x x x x x x x x
ISO 22000 x x x x x x x x
FSSC 22000 x x x x x
CHAIN OF CUSTODY
PEFC™ x x x x x x x x
FSC® x x x x x x x x
EMISSIONS TO AIR (t)
CO2 bio 0 170,874 0 0 151,577 0 0 1,490,500 1,812,952
CO2 fossil 31,275 5,874 5,935 4,509 63,146 74,044 0 55,253 240,036
Sulphur as SO2 0 16 0 0 76 0.038 0.00 263 356
TRS compounds 0 0 0 0 0 0 0 79 79
Nitrogen oxides as NO2 16 167 2.5 0.0 133 45 0 805 1,168
Particles 11 8 0 0 1.3 0 0 289 309
DISCHARGES TO WATER (t)
AOX 0 0 0 0 0 0 0 52 52
COD 588 1,358 260 163 442 178 451 7,425 10,864
BOD 6) 4.8 45 38 37 41 64 203 0 433
Total phosphorus 0.23 2.4 1.5 0.87 1.4 1.2 0.24 13.9 22
Total nitrogen 4.2 22 29 18 12 0.77 8 101 195
Total suspended solids 25 77 129 76 53 32 87 803 1,283
WATER USE (1,000 m3)
Water sourcing 6,503 15,155 9,757 4,206 27,546 3,927 4,439 42,101 113,633
Waste waterflow 607 4,096 7,481 3,310 4,733 2,571 2,090 34,003 58,891
WASTE (t)
Utilised 10,716 21,379 4,778 14,681 31,771 3,967 2,374 14,379 104,045
Landfill 0 759 329 2.6 34 0 0 0 1,124
Hazardous 13 53 0.5 8.5 52 42 33 481 685
1) Full-time equivalent on 31 December 20202) Total recordable incident frequency per million worked hours.3) Lost-time accident 1 frequency rate. Accidents at work resulting to at least one day sickleave per million worked hours. 4) % of theoretical working time5) Includes personnel from sales and logistics operations, management and subsidiaries. Production, emissions and waste originate from Äänevoima’s production of energy sold for external use. Personnel figures of Others are included in Metsä Board’s total figures.6) Husum mill’s BOD not measured.
An independent external assurance has been performed for the data in the table as part of Metsä Group’s Sustainability Report (limited assurance).
BOARD MILLS
Tonnes Country Machines Folding boxboard White kraftliner Total
Tampere (Tako) Finland 2 210,000 210,000
Kyröskoski (Kyro) Finland 1 190,000 190,000
Äänekoski Finland 1 260,000 260,000
Simpele Finland 1 290,000 290,000
Kemi Finland 1 425,000 425,000
Husum Sweden 2 400,000 250,000 650,000
Total 8 1,350,000 675,000 2,025,000
PULP AND BCTMP MILLS
Tonnes Country Chemical pulp BCTMP Total
Husum Sweden 730,000 730,000
Joutseno Finland 330,000 330,000
Kaskinen Finland 380,000 380,000
Total 730,000 700,000 1,440,000
METSÄ FIBRE PULP MILLS 1)
Tonnes Country Chemical pulp Total
Äänekoski Finland 1,300,000 1,300,000
Kemi Finland 610,000 610,000
Rauma Finland 650,000 650,000
Joutseno Finland 690,000 690,000
Total 3,250,000 3,250,000
1) Metsä Board owns 24.9% of Metsä Fibre.
ENVIRONMENTAL PERMIT LIMIT VIOLATIONS
In 2020, there were no incidents at Metsä Board’s mills that would have caused significant environmental impacts, and that would have been followed by claims, com-pensations or significant media coverage. All incidents that have caused violations of monthly, quarterly or annual permit limit values are detailed with description and corrective actions in the table below. The authorities have been informed and corrective actions have been taken in all cases.
Unit Incident Corrective actions
Kyro Monthly permit limit for total nitrogen emissions to water was exceeded in January due to operative problems concerning nutrient dosing to effluent treatment plant.
Nitrogen dosage level was corrected and operation of the treatment plant returned to normal.
Kyro Monthly permit limit of phosphorous was exceeded in March. Balanced dosing of ferric sulphate and phosphorus acid.
Kyro Monthly waste water permit limit exceedings in September. Suspended solids and phosphorus were at high level because of treatment plant failure.
Balanced dosing of nutrients and optimized process parameters.
Kaskinen The permit limit for total phosphorus emissions to water was exceeded in July due to evaporation plant washing chemical and low consistency of aeration basin in the waste water plant.
Treatment of used evaporation plant chemical was changed and sludge removal of aeration was turned to lower level.
4140
METSÄ BOARD Annual Report 2020
Business operations and value creation
2 This is Metsä Board
4 CEO’s review
6 Highlights of the year
8 Strategy and targets
10 Creating value
12 Operating environment
16 Product and service development
18 Circular economy
Sustainability
20 Sustainability targets
24 We bring the forest to you
26 We offer sustainable choices
30 We work for a better climate and environment
34 We create well-being
40 Mill-specific information
Financial development
44 Report of the Board of Directors
57 Consolidated financial statements
61 Notes to the consolidated financial statements
107 Parent company financial statements
110 Notes to the parent company financial statements
123 Auditor’s report
126 Shares and shareholders
132 Key figures and taxes
Governance
134 Corporate governance statement
140 Metsä Board Corporation’s Board of Directors
142 Metsä Board Corporation’s Corporate Management Team
144 Investor relations and investor information

350300250200150100
500
500
400
300
200
100
0
350300250200150100
500
200
160
120
80
40
0
20
16
12
8
4
0
300
250
200
150
100
50
0
100
80
60
40
20
0
100
80
60
40
20
0
211815129630
80
60
40
20
0
18
15
12
9
6
3
0
20
16
12
8
4
0
16 17 18 19 20
16 17 18 19 20
16 17 18 19 20
16 17 18 19 20
16 17 18 19 20 16 17 18 19 20
16 17 18 19 20
16 17 18 19 20 16 17 18 19 20
17 18 19 20 16 17 18 19 20
16 17 18 19 20 16 17 18 19 20
16 17 18 19 2016 17 18 19 20
SUSTAINABILITYBUSINESS OPERATIONS AND VALUE CREATION GOVERNANCE
METSÄ BOARD ANNUAL REPORT 2020
FINANCIAL DEVELOPMENT
KEY FIGURES KEY FIGURESCONTENTS
44 Report of the Board of Directors
CONSOLIDATED FINANCIAL STATEMENTS
57 Consolidated statement of
comprehensive income
58 Consolidated balance sheet
59 Statement of changes in shareholders’
equity
60 Consolidated cash flow statement
NOTES TO THE CONSOLIDATED
FINANCIAL STATEMENTS
61 1. Accounting policies
63 2. Profitability
63 2.1 Segment information
64 2.2 Sales
65 2.3 Other operating income
65 2.4 Operating expenses
66 3. Remuneration
66 3.1 Employee costs
66 3.2 Remuneration paid to the key
management
67 3.3 Shared based payment
71 3.4 Retirement benefit obligations
73 4. Capital employed
73 4.1 Intangible assets
76 4.2 Tangible assets
79 4.3 Other investments
80 4.4 Inventories
80 4.5 Accounts receivable and other
receivables
81 4.6 Other non-current liabilities
81 4.7 Accounts payable and other
liabilities
82 4.8 Provisions
83 5. Capital structure and financial risks
83 5.1 Shareholders’ equity
85 5.2 Financial income and expenses
85 5.3 Other non-current financial assets
86 5.4 Cash and cash equivalents
86 5.5 Borrowings
88 5.6 Management of financial risks
94 5.7 Fair value of financial assets and
liabilities
99 6. Income taxes
101 7. Group structure
101 7.1 Holdings in other companies
104 7.2 Acquisitions and disposed
operations and non-current assets held
for sale
105 7.3 Related party transactions
106 8. Other notes
106 8.1 Contingent liabilities, assets and
commitments
106 8.2 Events after the financial period
PARENT COMPANY
FINANCIAL STATEMENTS
107 Parent company income statement
108 Parent company balance sheet
109 Parent company cash flow statement
NOTES TO THE PARENT COMPANY
FINANCIAL STATEMENTS
110 1. Accounting policies
111 2. Sales
111 3. Exceptional items
111 4. Other operating income
111 5. Operating expenses
112 6. Depreciation and impairment charges
112 7. Financial income and expenses
112 8. Income taxes
113 9. Intangible and tangible assets
115 10. Investments
116 11. Receivables
117 12. Shareholders’ equity
118 13. Mandatory provisions
118 14. Deferred tax assets and liabilities
118 15. Non-current liabilities
119 16. Current liabilities
120 17. Financial instruments
121 18. Disputes, legal proceedings and
commitments
121 19. Shares and holdings
122 The Board’s proposal for the
distribution of funds
123 Auditor’s report
126 Shares and shareholders
130 Calculation of key ratios
131 Comparable performance measures
126 Key figures and taxes
134 Corporate governance statement
140 Metsä Board Corporation’s
Board of Directors
142 Metsä Board Corporation’s
Corporate Management team
144 Investor relations and investor
information
SALES EUR million
2,500
2,000
1,500
1,000
500
0
PAPERBOARD DELIVERIES 1,000 tonnes
METSÄ BOARD’S MARKET PULP DELIVERIES 1) 1,000 tonnes
EBITDA, COMPARABLEEUR million, % of sales
CASH FLOW FROM OPERATIONSEUR million
OPERATING RESULT COMPARABLEEUR million, % of sales
CAPITAL EMPLOYED, EUR million RETURN ON CAPITAL EMPLOYED, %
SHARE OF FOSSIL FREE ENERGY (OWN GENERATION AND PURCHASED ENERGY)%
SHARE OF CERTIFIED WOOD FIBRE IN METSÄ BOARD%
NET DEBT, EUR millionNET DEBT / EBITDA, COMPARABLE
DISTRIBUTION PER SHARE, EURPAYOUT RATIO, %
TOTAL INVESTMENTSEUR million
LOST-TIME ACCIDENT FREQUENCY (TRIF) per million hours worked
2,000
1,600
1,200
800
400
0
2.5
2.0
1.5
1.0
0.5
0
0.40
0.30
0.20
0.10
0
PERSONNEL AT THE END OF PERIODEARNINGS PER SHAREEUR
3,000
2,500
2,000
1,500
1,000
500
0
2,000
1,500
1,000
500
0
600
500
400
300
200
100
0
Folding boxboard
White kraftliner1) includes chemical pulp and
high-yield pulp (BCTMP)
0.60
0.50
0.40
0.30
0.20
0.10
0
4342
METSÄ BOARD Annual Report 2020
Business operations and value creation
2 This is Metsä Board
4 CEO’s review
6 Highlights of the year
8 Strategy and targets
10 Creating value
12 Operating environment
16 Product and service development
18 Circular economy
Sustainability
20 Sustainability targets
24 We bring the forest to you
26 We offer sustainable choices
30 We work for a better climate and environment
34 We create well-being
40 Mill-specific information
Financial development
44 Report of the Board of Directors
57 Consolidated financial statements
61 Notes to the consolidated financial statements
107 Parent company financial statements
110 Notes to the parent company financial statements
123 Auditor’s report
126 Shares and shareholders
132 Key figures and taxes
Governance
134 Corporate governance statement
140 Metsä Board Corporation’s Board of Directors
142 Metsä Board Corporation’s Corporate Management Team
144 Investor relations and investor information
This is voluntary published pdf report, so it does not fulfill the disclosure obligation pursuant to Section 7:5§ of the Securities Markets Act.
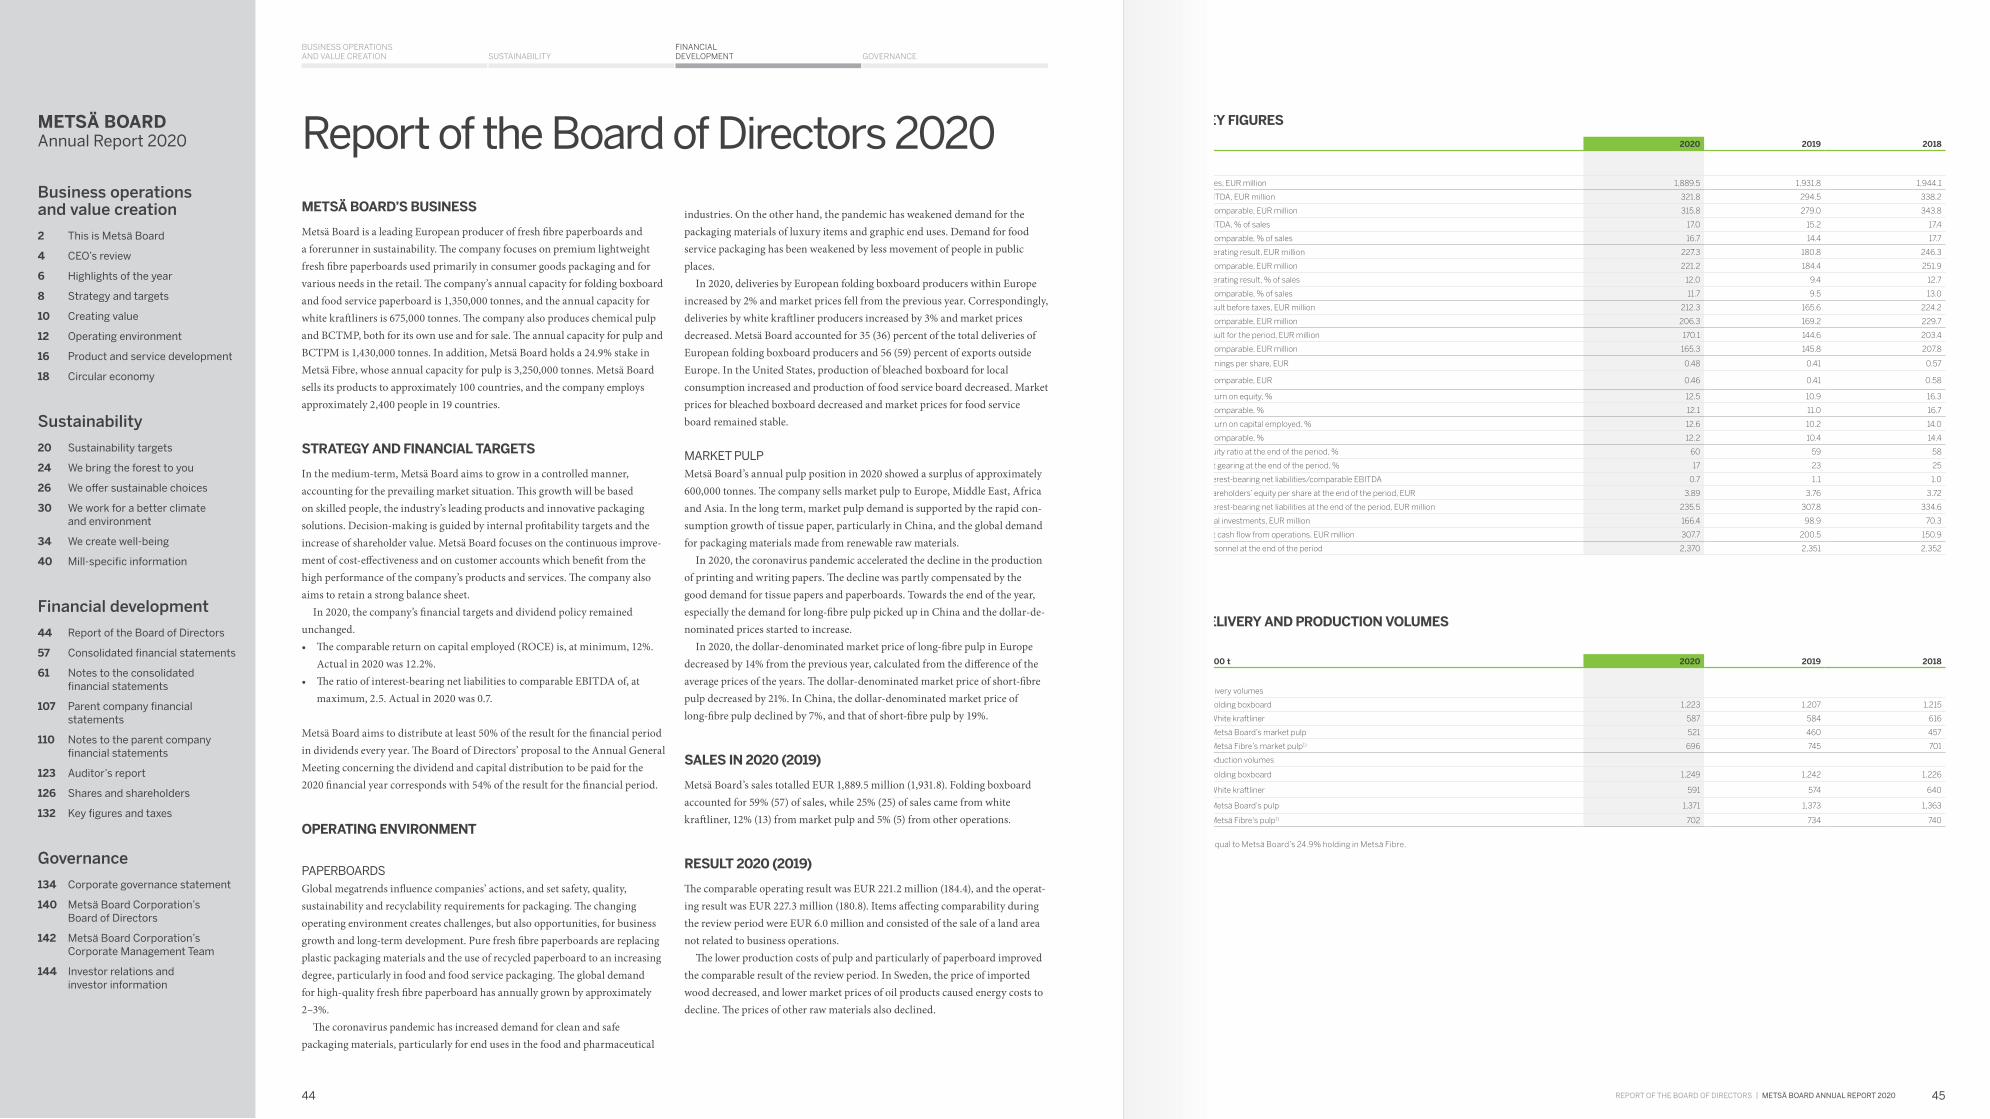
SUSTAINABILITYBUSINESS OPERATIONS AND VALUE CREATION GOVERNANCE
FINANCIAL DEVELOPMENT
REPORT OF THE BOARD OF DIRECTORS | METSÄ BOARD ANNUAL REPORT 2020
Report of the Board of Directors 2020
industries. On the other hand, the pandemic has weakened demand for the packaging materials of luxury items and graphic end uses. Demand for food service packaging has been weakened by less movement of people in public places.
In 2020, deliveries by European folding boxboard producers within Europe increased by 2% and market prices fell from the previous year. Correspondingly, deliveries by white kraftliner producers increased by 3% and market prices decreased. Metsä Board accounted for 35 (36) percent of the total deliveries of European folding boxboard producers and 56 (59) percent of exports outside Europe. In the United States, production of bleached boxboard for local consumption increased and production of food service board decreased. Market prices for bleached boxboard decreased and market prices for food service board remained stable.
MARKET PULPMetsä Board’s annual pulp position in 2020 showed a surplus of approximately 600,000 tonnes. The company sells market pulp to Europe, Middle East, Africa and Asia. In the long term, market pulp demand is supported by the rapid con-sumption growth of tissue paper, particularly in China, and the global demand for packaging materials made from renewable raw materials.
In 2020, the coronavirus pandemic accelerated the decline in the production of printing and writing papers. The decline was partly compensated by the good demand for tissue papers and paperboards. Towards the end of the year, especially the demand for long-fibre pulp picked up in China and the dollar-de-nominated prices started to increase.
In 2020, the dollar-denominated market price of long-fibre pulp in Europe decreased by 14% from the previous year, calculated from the difference of the average prices of the years. The dollar-denominated market price of short-fibre pulp decreased by 21%. In China, the dollar-denominated market price of long-fibre pulp declined by 7%, and that of short-fibre pulp by 19%.
SALES IN 2020 (2019)
Metsä Board’s sales totalled EUR 1,889.5 million (1,931.8). Folding boxboard accounted for 59% (57) of sales, while 25% (25) of sales came from white kraftliner, 12% (13) from market pulp and 5% (5) from other operations.
RESULT 2020 (2019)
The comparable operating result was EUR 221.2 million (184.4), and the operat-ing result was EUR 227.3 million (180.8). Items affecting comparability during the review period were EUR 6.0 million and consisted of the sale of a land area not related to business operations.
The lower production costs of pulp and particularly of paperboard improved the comparable result of the review period. In Sweden, the price of imported wood decreased, and lower market prices of oil products caused energy costs to decline. The prices of other raw materials also declined.
METSÄ BOARD’S BUSINESS
Metsä Board is a leading European producer of fresh fibre paperboards and a forerunner in sustainability. The company focuses on premium lightweight fresh fibre paperboards used primarily in consumer goods packaging and for various needs in the retail. The company’s annual capacity for folding boxboard and food service paperboard is 1,350,000 tonnes, and the annual capacity for white kraftliners is 675,000 tonnes. The company also produces chemical pulp and BCTMP, both for its own use and for sale. The annual capacity for pulp and BCTPM is 1,430,000 tonnes. In addition, Metsä Board holds a 24.9% stake in Metsä Fibre, whose annual capacity for pulp is 3,250,000 tonnes. Metsä Board sells its products to approximately 100 countries, and the company employs approximately 2,400 people in 19 countries.
STRATEGY AND FINANCIAL TARGETS
In the medium-term, Metsä Board aims to grow in a controlled manner, accounting for the prevailing market situation. This growth will be based on skilled people, the industry’s leading products and innovative packaging solutions. Decision-making is guided by internal profitability targets and the increase of shareholder value. Metsä Board focuses on the continuous improve-ment of cost-effectiveness and on customer accounts which benefit from the high performance of the company’s products and services. The company also aims to retain a strong balance sheet.
In 2020, the company’s financial targets and dividend policy remained unchanged. • The comparable return on capital employed (ROCE) is, at minimum, 12%.
Actual in 2020 was 12.2%. • The ratio of interest-bearing net liabilities to comparable EBITDA of, at
maximum, 2.5. Actual in 2020 was 0.7.
Metsä Board aims to distribute at least 50% of the result for the financial period in dividends every year. The Board of Directors’ proposal to the Annual General Meeting concerning the dividend and capital distribution to be paid for the 2020 financial year corresponds with 54% of the result for the financial period.
OPERATING ENVIRONMENT
PAPERBOARDSGlobal megatrends influence companies’ actions, and set safety, quality, sustainability and recyclability requirements for packaging. The changing operating environment creates challenges, but also opportunities, for business growth and long-term development. Pure fresh fibre paperboards are replacing plastic packaging materials and the use of recycled paperboard to an increasing degree, particularly in food and food service packaging. The global demand for high-quality fresh fibre paperboard has annually grown by approximately 2–3%.
The coronavirus pandemic has increased demand for clean and safe packaging materials, particularly for end uses in the food and pharmaceutical
DELIVERY AND PRODUCTION VOLUMES
1,000 t 2020 2019 2018
Delivery volumes
Folding boxboard 1,223 1,207 1,215
White kraftliner 587 584 616
Metsä Board’s market pulp 521 460 457
Metsä Fibre’s market pulp1) 696 745 701
Production volumes
Folding boxboard 1,249 1,242 1,226
White kraftliner 591 574 640
Metsä Board’s pulp 1,371 1,373 1,363
Metsä Fibre's pulp1) 702 734 740
1) equal to Metsä Board’s 24.9% holding in Metsä Fibre.
Report of the Board of Directors
KEY FIGURES
2020 2019 2018
Sales, EUR million 1,889.5 1,931.8 1,944.1
EBITDA, EUR million 321.8 294.5 338.2
comparable, EUR million 315.8 279.0 343.8
EBITDA, % of sales 17.0 15.2 17.4
comparable, % of sales 16.7 14.4 17.7
Operating result, EUR million 227.3 180.8 246.3
comparable, EUR million 221.2 184.4 251.9
Operating result, % of sales 12.0 9.4 12.7
comparable, % of sales 11.7 9.5 13.0
Result before taxes, EUR million 212.3 165.6 224.2
comparable, EUR million 206.3 169.2 229.7
Result for the period, EUR million 170.1 144.6 203.4
comparable, EUR million 165.3 145.8 207.8
Earnings per share, EUR 0.48 0.41 0.57
comparable, EUR 0.46 0.41 0.58
Return on equity, % 12.5 10.9 16.3
comparable, % 12.1 11.0 16.7
Return on capital employed, % 12.6 10.2 14.0
comparable, % 12.2 10.4 14.4
Equity ratio at the end of the period, % 60 59 58
Net gearing at the end of the period, % 17 23 25
Interest-bearing net liabilities/comparable EBITDA 0.7 1.1 1.0
Shareholders’ equity per share at the end of the period, EUR 3.89 3.76 3.72
Interest-bearing net liabilities at the end of the period, EUR million 235.5 307.8 334.6
Total investments, EUR million 166.4 98.9 70.3
Net cash flow from operations, EUR million 307.7 200.5 150.9
Personnel at the end of the period 2,370 2,351 2,352
4544
METSÄ BOARD Annual Report 2020
Business operations and value creation
2 This is Metsä Board
4 CEO’s review
6 Highlights of the year
8 Strategy and targets
10 Creating value
12 Operating environment
16 Product and service development
18 Circular economy
Sustainability
20 Sustainability targets
24 We bring the forest to you
26 We offer sustainable choices
30 We work for a better climate and environment
34 We create well-being
40 Mill-specific information
Financial development
44 Report of the Board of Directors
57 Consolidated financial statements
61 Notes to the consolidated financial statements
107 Parent company financial statements
110 Notes to the parent company financial statements
123 Auditor’s report
126 Shares and shareholders
132 Key figures and taxes
Governance
134 Corporate governance statement
140 Metsä Board Corporation’s Board of Directors
142 Metsä Board Corporation’s Corporate Management Team
144 Investor relations and investor information

100
80
60
40
20
0
100
80
60
40
20
0 18 19 20 18 19 20
SUSTAINABILITYBUSINESS OPERATIONS AND VALUE CREATION GOVERNANCE
FINANCIAL DEVELOPMENT
REPORT OF THE BOARD OF DIRECTORS | METSÄ BOARD ANNUAL REPORT 2020
The cheaper pulp improved the profitability of the paperboard business. However, accounting for the surplus in Metsä Board’s pulp position, pulp’s total impact on the comparable operating result was neutral.
Exchange rate fluctuations, including hedges, had a positive impact of around EUR 31 million on the operating result compared to the comparison period.
The associated company Metsä Fibre’s share of Metsä Board’s comparable operating result in January–December was EUR -2.4 million (45.3). In addition to the decline in market pulp prices, Metsä Fibre’s profitability was burdened by lower delivery volumes than in the previous year. The decline in delivery volumes was attributable to the paper industry strike early in the year and the negative impact that the coronavirus pandemic had on the global demand for pulp.
484,000 tonnes (432,000). The dollar-denominated average prices of paperboard remained stable.
In the APAC region, paperboard deliveries declined from the previous year.
MARKET PULP SALES IN 2020 (2019)In 2020, Metsä Board’s market pulp deliveries increased and were 521,000 (460,000) tonnes. The paper industry strike early in the year did not concern Metsä Board’s Husum pulp mill in Sweden.
The associated company Metsä Fibre’s total pulp deliveries declined and totalled 2,796,000 (2,994,000) tonnes. Around 50% of Metsä Fibre’s market pulp is sold in the EMEA region and 50% in the APAC region, where China accounts for a significant share.
The dollar-denominated prices of long-fibre pulp in Europe and China were at a lower level compared to the previous year. Prices in China nevertheless began to rise during the second half of the year. In Europe, this happened during the fourth quarter.
While the worldwide increase in the demand for tissue paper has supported demand for pulp and high-yield pulp (BCTMP), the coronavirus pandemic has accelerated the decline in the production of printing papers. In China, demand for pulp in the second half of the year was strengthened by paper and paper-board production, which increased from the first half of the year. Late in the year, a shortage of containers in the traffic between Europe and Asia strained the situation in the pulp market. Globally, the second half of the year saw a decline in the supply of long-fibre market pulp because of the maintenance and market shutdowns of several pulp producers.
PRODUCTION IN 2020 (2019)The production volume of Metsä Board’s paperboards during the review period totalled 1,840,000 tonnes (1,816,000), while the combined production volume of pulp and high-yield pulp amounted to 1,371,000 tonnes (1,373,000).
Production in the first half of the year was limited by the paper industry’s strike, which lasted for more than two weeks and concerned all of Metsä Board’s paperboard and BCTMP mills in Finland. The loss in paperboard production was roughly 65,000 tonnes and the loss in BCTMP production some 34,000 tonnes. Despite the production losses, the full-year production volumes of paperboards and BCTMP grew from the year before.
During the second quarter, the total production volume of paperboards was record high. Correspondingly, the production volumes of white kraftliners and pulps reached record highs during the fourth quarter.
Production at Metsä Board’s mills and the mills’ annual maintenance works have proceeded normally during the coronavirus pandemic.
CASH FLOW
Net cash flow from operations in 2020 was strong at EUR 307.7 million (1‒12/2019: 200.5). Working capital decreased by EUR 37.9 million (increased by 43.0). The lower price of pulp has increased the share of Metsä Board’s paper-board business in the cash flow from operating activities. Correspondingly, the associated company Metsä Fibre’s impact on cash flow has decreased. In the fourth quarter, the cash flow was reduced by the payment of EUR 35 million in corporate income taxes.
BALANCE SHEET AND FINANCING
Metsä Board’s equity ratio at the end of the review period was 60% (31 December 2019: 59%) and the net gearing ratio was 17% (23%). The ratio of interest-bearing net liabilities to comparable EBITDA in the previous 12 months was 0.7 (1.1).
At the end of the review period, interest-bearing liabilities totalled EUR 452.4 million (31 December 2019: 444.9). Non-euro-denominated loans accounted for 1.9% of loans and floating-rate loans for 12.5%, with the rest being fixed-rate loans. The average interest rate on liabilities was 2.3% (2.5%), and the average maturity of non-current liabilities was 5.7 years (6.4). The interest rate maturity of loans was 52.0 months (56.0).
At the end of the review period, net interest-bearing liabilities totalled EUR 235.5 million (31 December 2019: 307.8).
Metsä Board’s liquidity has remained strong. At the end of the review period, the available liquidity was EUR 605.8 million (31 December 2019: 334.2), consisting of the following items: liquid assets and investments of EUR 214.0 million, a syndicated credit facility (revolving credit facility) of EUR 200.0 million, and other committed credit facilities of EUR 191.8 million. As of 2020, the company will no longer include undrawn pension premium (TyEL) funds in available liquidity. Of the liquid assets, EUR 204.7 million consisted of short-term deposits with Metsä Group Treasury, and EUR 9.3 million were cash funds and investments. Other interest-bearing receivables amounted to EUR 2.9 million. In addition, Metsä Board’s liquidity reserve is complemented by Metsä Group’s internal undrawn short-term credit facility of EUR 150.0 million and undrawn pension premium (TyEL) funds of EUR 212.3 million
The fair value of long-term investments was EUR 186.9 million at the end of the review period (31 December 2019: 255.1). The change in the fair value is related to the decrease in the fair value of Pohjolan Voima Oyj’s shares. The greater-than-usual change in the fair value was mainly attributable to changes made to the valuation model during the second quarter. Metsä Board discontinued the use of previous benchmark transactions in Pohjolan Voima Oyj’s shares as a valuation basis and increased the discount rates used in the valuation model based on projected cash flows.
At the end of the review period, an average of 7.9 months of the net foreign currency exposure was hedged, including the hedging of the balance sheet position of trade receivables and trade payables (31 December 2019: 7.8). The degree of hedging during the period varied between seven and nine months, on average. In addition to the balance sheet position, half of the projected annual net foreign currency exposure at the normal level is hedged. The amount of hedging may deviate from the normal level by 40% in either direction. When hedging is at the normal level, the aim is to allocate the hedges primarily to the following two quarters.
Metsä Board has investment grade credit ratings by S&P Global and Moody’s Investor Service. The company’s rating by S&P Global is BBB-, with a stable outlook. The company’s rating by Moody’s is Baa3, with a stable outlook.
DIVESTMENT OF A MINORITY STAKE IN THE HUSUM PULP MILL
On 1 December 2020 Metsä Board signed an agreement with which it agreed to sell a 30% holding in the Husum pulp mill in Sweden to the forest owner cooperative Norra Skog. At the same time, Metsä Forest Sverige, responsible for Metsä Board’s wood supply in Sweden, made a long-term wood delivery agreement with Norra Skog. The transaction was closed on 4 January 2021.
Folding boxboard
White kraftliner
Market pulp
Others
EMEA
Americas
APAC
SALES SPLIT BY PRODUCT %
SALES SPLIT BY REGION %
The paper industry strike, which concerned Metsä Board’s mills in Finland and all of Metsä Fibre’s pulp mills, had a negative impact of around EUR 20 million on the comparable operating result of the review period.
Financial income and expenses totalled EUR -14.9 million (-15.4), including foreign exchange rate differences from trade receivables, trade payables, financial items and the valuation of currency hedging instruments, totalling EUR -3.4 million (-1.6).
The result before taxes was EUR 212.3 million (165.6). The comparable result before taxes was EUR 206.3 million (169.2). Income taxes amounted to EUR 42.2 million (21.0).
Earnings per share were EUR 0.48 (0.41). The comparable earnings per share were EUR 0.46 (0.41). The return on equity was 12.5% (10.9%), and the comparable return on equity was 12.1% (11.0%). The return on capital employed was 12.6% (10.2%), and the comparable return on capital employed was 12.2% (10.4%).
BUSINESS DEVELOPMENT
Metsä Board produces high-quality, ecological fresh fibre paperboards, and is Europe’s largest producer of folding boxboard and white kraftliners. Metsä Board’s folding boxboard is mainly used in consumer product packaging, such as food and pharmaceutical packaging. Correspondingly, the end uses of white kraftliners are mainly related to the various packaging needs of the retail sector. More than half of the white kraftliners produced by Metsä Board are coated.
Metsä Board’s annual pulp position in 2020 showed a surplus of approxi-mately 600,000 tonnes, and consists mostly of long-fibre pulp. The company’s total pulp position is composed of the difference between its own production and consumption of pulp, and its 24.9% holding in Metsä Fibre. In 2021 Metsä Board’s annual pulp surplus will be approximately 400,000 tonnes, as the company sold a 30% stake in its Husum pulp mill to the forest owner cooperative Norra Skog.
PAPERBOARD SALES IN 2020 (2019) The paper industry strike at Finnish mills early in the year and the peak in the demand for packaging materials resulting from the coronavirus outbreak accel-erated the order inflows for paperboards, particularly in March–April. During the pandemic, the demand for food and pharmaceutical packaging in particular has remained good. At the same time, the pandemic has weakened demand in graphic end uses and the packaging materials for luxury items. Demand for coated white kraftliners has been supported by the brisk retail sector and the growth in e-commerce.
In 2020, Metsä Board’s deliveries of folding boxboard were 1,223,000 (1,207,000) tonnes, of which 71% (71%) was delivered to the EMEA region, 22% (20%) to the Americas, and 7% (9%) to the APAC region. Deliveries of white kraftliner were 587,000 (584,000) tonnes, of which 63% (66%) was delivered to the EMEA region, 36% (33%) to the Americas, and 2% (1%) to the APAC region.
Deliveries of both folding boxboard and white kraftliners to the EMEA region grew from the previous year. Europe, the main market of uncoated white kraftliner, experienced occasional oversupply during the summer, but demand picked up towards the end of the year. The average prices of paperboards declined slightly.
Demand for Metsä Board’s paperboards in the Americas region, and particu-larly in in the United States, remained strong. The total delivery volume was
DELIVERIES OF FOLDING BOXBOARD BY REGION IN 2020 (2019)1,000 tonnes
DELIVERIES OF WHITE KRAFTLINER BY REGION IN 2020 (2019) 1,000 tonnes
EMEA region 866 (859)
Americas region 274 (242)
APAC region 83 (105)
EMEA region 369 (385)
Americas region 210 (190)
APAC region 9 (9)
4746
METSÄ BOARD Annual Report 2020
Business operations and value creation
2 This is Metsä Board
4 CEO’s review
6 Highlights of the year
8 Strategy and targets
10 Creating value
12 Operating environment
16 Product and service development
18 Circular economy
Sustainability
20 Sustainability targets
24 We bring the forest to you
26 We offer sustainable choices
30 We work for a better climate and environment
34 We create well-being
40 Mill-specific information
Financial development
44 Report of the Board of Directors
57 Consolidated financial statements
61 Notes to the consolidated financial statements
107 Parent company financial statements
110 Notes to the parent company financial statements
123 Auditor’s report
126 Shares and shareholders
132 Key figures and taxes
Governance
134 Corporate governance statement
140 Metsä Board Corporation’s Board of Directors
142 Metsä Board Corporation’s Corporate Management Team
144 Investor relations and investor information
SUSTAINABILITYBUSINESS OPERATIONS AND VALUE CREATION GOVERNANCE
FINANCIAL DEVELOPMENT
REPORT OF THE BOARD OF DIRECTORS | METSÄ BOARD ANNUAL REPORT 2020
The transaction reduces Metsä Board’s net debt by approximately EUR 260 million. It also reduces Metsä Board’s share of financing the pulp mill’s renewal during the second phase by about EUR 100 million. The transaction will not result in capital gain to be reported in the income statement; rather, its positive effects are shown directly in equity.
Metsä Board will continue to consolidate the Husum pulp mill as a subsidiary in the consolidated financial statements, so the operating result’s sensitivity to changes in the market prices of pulp will remain unchanged. The arrangement reduces Metsä Board’s annual net surplus in pulp by approxi-mately 210,000 tonnes.
The long-term wood delivery agreement made between the parties increases the share of certified wood purchased from Sweden and will clearly reduce the volume of wood imported from the Baltic countries. The increase in the share of wood purchased from Sweden will reduce the mill’s cost volatility.
The cash released by the arrangement together with avoided investments in the coming years, totalling more than EUR 350 million, allow the company to allocate a significant portion of its development investments in paperboard.
INVESTMENTS
Total investments during the review period were EUR 166.4 million (98.9), of which investments in own property, plant and equipment were EUR 159.4 million (94.9) and investments in leased property, plant and equipment were EUR 7.0 million (4.1). Maintenance investments and development investments account for approximately 32% and 68%, respectively, of the total investments. The share of the first phase of the Husum’s pulp mill investment was around EUR 103 million in 2020.
RENEWAL OF THE HUSUM PULP MILLIn the fourth quarter of the year, Metsä Board obtained an approval for an amendment to the environmental permit of the Husum mill and made the final investment decision on the first phase of the pulp mill’s renewal. The invest-ment’s pre-engineering phase began in 2019 and the preparatory construction work got underway in the first quarter of 2020.
The first phase of the investment will include the renewal of the pulp mill’s recovery boiler and turbine. The total value of the first phase is roughly EUR 320 million, and the start-up of the new recovery boiler and turbine is estimated in the first half of 2022. It is planned that in the second phase of the investment, during the 2020s, the current fibre lines will be replaced with a new fibre line.
The pulp mill’s renewal will enable the long-term development and growth of competitive paperboard business operations at the Husum integrated mill over the coming years. In addition, the investment aims to develop Metsä Board’s pulp and energy production and promote a shift towards fossil free mills.
DEvELOPMENT PROGRAMME OF KEMI PAPERBOARD MILLAfter the review period, on 11 February 2021, Metsä Board started a devel-opment programme for its Kemi paperboard mill, which produces white-top kraftliner. The investment value of the programme is approximately EUR 67 million and the mill’s annual paperboard capacity will increase by approx-imately 40,000 tonnes. The programme includes a series of modernisation and bottleneck investments in the paperboard production line and as part of the programme, Metsä Board will purchase the modernised unbleached pulp production line with annual capacity of approximately 180,000 tonnes from Metsä Fibre. The investments are scheduled for 2021–2023, and mainly for
2023. The development programme is a significant step towards the company’s sustainability targets for 2030.
ASSOCIATED COMPANy METSÄ FIBRE’S KEMI BIOPRODUCT MILL AND RAUMA PINE SAWMILLMetsä Fibre’s Kemi bioproduct mill received an environmental permit in December 2020 and the investment decision was made after the review period on 11 February 2021.
The investment value is approximately EUR 1.6 billion and the construction of the mill will take about two and a half years. The bioproduct mill will produce approximately 1.5 million tons of softwood and hardwood pulp and other bioproducts annually. The pulp production capacity includes the current unbleached pulp production line, used in the production of white-top kraftliner, with an annual capacity of approximately 180,000 tonnes. The bioproduct mill does not use fossil fuels at all and has a high electricity self-sufficiency of 250%. The new mill will replace the current pulp mill in Kemi with an annual capacity of approximately 620,000 tonnes. Financing for Metsä Fibre’s bioproduct mill consists of funds generated from operations, and debt. Metsä Board will not invest equity in Metsä Fibre to finance the project.
At the beginning of 2020, Metsä Fibre made an investment decision to build a pine sawmill in connection with the Rauma pulp mill. Construction work began in spring 2020 and production is scheduled to start in the third quarter of 2022. The value of the investment is approximately EUR 200 million. Metsä Board owns 24.9% of Metsä Fibre.
R&D, INNOVATIONS AND NEW PRODUCTS
As the volume of packaging grows, the world needs new, sustainable solutions that can replace fossil-based materials and improve the recyclability of packaging. The main objectives of Metsä Board’s research and development activities in terms of consumer packaging boards are the production of increasingly lightweight folding boxboards with a smaller carbon footprint and the development of new products for the food and food service packaging segment. The objective in terms of white kraftliners is to maintain and develop the competitiveness of the strength and printing properties. Metsä Board’s R&D costs in 2020 totalled EUR 8.6 million (8.7), or 0.5% (0.4%) of net sales. In 2020, the disclosure of research and development costs has been specified and the figures of the comparison year have been adjusted accordingly. The research and development costs include direct costs before depreciations and the investments of the operations.
In September 2020, Metsä Board opened an Excellence Centre in Äänekoski, Finland. The Excellence Centre enables Metsä Board to deepen the collaboration with customers and helps to focus the development work to better meet customers’ needs. During the autumn, several virtual workshops were organised for customers and partners around the world. The Centre’s operations bring together Metsä Board’s own experts’ in-depth expertise in fibre-based packaging solutions and the competence of Metsä Board’s partners, such as material and technology suppliers, start-up companies, universities and research companies.
In 2020, Metsä Board developed a number of different packaging solutions in cooperation with packaging producers and brand owners. As an indication of the success of this collaboration model, the company achieved success in, for instance, the AIMCAL competition in the United States and the Nordic Scanstar packaging competition.
Metsä Group’s innovation company Metsä Spring and Valmet are building a pilot plant in Äänekoski for the development of a 3D fibre product, which could replace packaging made from fossil-based raw materials, for example. The plant will produce finished 3D fibre products directly from wet wood-fibre pulp, without intermediate phases, and the products will be ready for delivery to end customers as is. The project’s total value is approximately EUR 20 million, and it is part of the world class ExpandFibre programme. The four-year ExpandFibre programme is a roughly EUR 50 million R&D programme promoting the circular bioeconomy. Established jointly by Metsä Group and Fortum, the programme focuses on wood fibre from renewable and sustainable sources.
Metsä Board joined the 4evergreen alliance aiming to ensure and develop the circular economy of fibre-based packaging. The alliance includes a number of businesses, research institutions and organisations representing the entire packaging value chain from materials to brand owners and the industry’s technology companies.
Metsä Board continues to explore the possibility of using artificial intelli-gence on its production lines. The latest application at the Kemi mill involves using artificial intelligence to enhance the runnability of white kraftliner with the help of data gathered from the customer’s corrugated board line. The data allows us to find the optimum combination of quality parameters which improves the runnability of our customer’s corrugated board line.
NON-FINANCIAL INFORMATION
BUSINESS MODELMetsä Board is part of Metsä Group and benefits from Metsä Group’s unique value chain – from pure northern wood fibre to high-quality end products. The company produces high-quality recyclable fresh fibre paperboards, used primarily in consumer product packaging. Sustainable and profitable growth as well as the value creation for all stakeholders are at the core of Metsä Board’s business model. Cooperating with its customers and technology partners on a global scale, Metsä Board engages in product and service development with an emphasis on innovation and sustainability.
The company’s eight production units are located in Finland and Sweden, close to its main raw material: high-quality northern wood fibre. Metsä Board’s wood supply is carried out centrally through Metsä Forest, with wood supplied from Finland, Sweden, the Baltic countries and Russia. The majority of the wood purchased in Finland comes from forests owned by Metsäliitto Coopera-tive’s owner-members.
Metsä Board is part of Metsä Group, which parent company is Metsäliitto Cooperative. Metsäliitto Cooperative holds 48.2% of Metsä Board’s shares and 67.4% of the voting rights conferred by shares. Metsä Board, on the other hand, holds 24.9% of its associated company, Metsä Fibre. Metsä Board’s own pulp production together with the holding in Metsä Fibre secure Metsä Board’s self-sufficiency in pulp and guarantee a premium and consistent quality of pulp.
SUSTAINABILITy PRINCIPLESIn accordance with its strategy, Metsä Board aims to be a forerunner in sustainability and create packaging solutions that respect nature. Climate change mitigation and the efficient use of resources are strong drivers of the company’s operations. The promotion of sustainability includes complying with good corporate governance, bearing social and environmental responsibility, respecting business ethics and human rights, and the continuous improvement
of operations in terms of all of the above. In addition to its own operations, Metsä Board requires sustainability throughout its supply chain.
The company’s sustainability targets focus on four themes: (i) wellbeing, (ii) sustainable raw materials, products and supply chain, (iii) climate and the environment, and (iv) forest. The targets are based on Metsä Board’s business strategy and Metsä Group’s strategic sustainability objectives. Further informa-tion on Metsä Board’s sustainability work is available in Metsä Board’s Annual Report and Metsä Group’s Sustainability Report at https://www.metsagroup.com/en/Sustainability/Pages/default.aspx.
POLICIES, MANAGEMENT SySTEMS AND SUSTAINABILITy GOvERNANCEWork and decision-making at Metsä Board are guided by the Metsä Group Code of Conduct, which is complemented by policies pertaining to matters such as anti-trust legislation, personnel, equality, environmental matters and infor-mation security. Suppliers are also expected to commit to the Supplier Code of Conduct. All of Metsä Board’s mills apply quality, occupational health and safety, environmental and energy efficiency management systems (ISO 9001, ISO 45001, ISO 14001, ISO 50001) as well as the management and monitoring system ISO 22000 required for food safety. The mills producing paperboard for food packaging also apply the FSSC 22000 food safety system.
At Metsä Board, the achievement of sustainability targets is supported and monitored by the company’s Board of Directors, CEO and Corporate Management Team. Sustainability is incorporated in the strategy approved by the Board as well as in the company’s long-term business and investment plans, risk assessments and annual action plans.
The Board processes and approves the sustainability targets presented by the CEO and monitors their achievement. The CEO is responsible for the implementation of the sustainability targets in accordance with the Board’s instructions. Sustainability-related reviews are processed by Metsä Board’s Corporate Management Team and the Board of Directors regularly during the year.
INTERNATIONAL COMMITMENTSMetsä Board respects internationally recognised human rights in accordance with the UN’s Universal Declaration of Human Rights and the ILO Declaration on Fundamental Principles and Rights at Work. The company is committed to operating according to the UN’s principles concerning business operations and human rights, and expects the same from its business partners. The company also supports the UN’s Global Compact initiative and its principles on human rights, labour, the environment and anti-corruption. Metsä Board’s sustain-ability targets, which extend to 2030, further the achievement of the UN’s Sustainable Development Goals (SDGs). The company’s targets in reducing greenhouse gas emissions have been approved by the Science Based Targets initiative (SBTi) and accord with the Business Ambition for 1.5 °C commitment: Metsä Board’s targets for reducing emissions meet the strictest requirements of the Paris Agreement, which aim to limit global warming to 1.5 °C degrees.
4948
METSÄ BOARD Annual Report 2020
Business operations and value creation
2 This is Metsä Board
4 CEO’s review
6 Highlights of the year
8 Strategy and targets
10 Creating value
12 Operating environment
16 Product and service development
18 Circular economy
Sustainability
20 Sustainability targets
24 We bring the forest to you
26 We offer sustainable choices
30 We work for a better climate and environment
34 We create well-being
40 Mill-specific information
Financial development
44 Report of the Board of Directors
57 Consolidated financial statements
61 Notes to the consolidated financial statements
107 Parent company financial statements
110 Notes to the parent company financial statements
123 Auditor’s report
126 Shares and shareholders
132 Key figures and taxes
Governance
134 Corporate governance statement
140 Metsä Board Corporation’s Board of Directors
142 Metsä Board Corporation’s Corporate Management Team
144 Investor relations and investor information

SUSTAINABILITYBUSINESS OPERATIONS AND VALUE CREATION GOVERNANCE
FINANCIAL DEVELOPMENT
REPORT OF THE BOARD OF DIRECTORS | METSÄ BOARD ANNUAL REPORT 2020
NON-FINANCIAL KEy FIGURES
2020 2019Target for
2030
Personnel
Coverage of Code of Conduct training, % 991) 97 100
Personnel’s Ethics Barometer, % 85 - 100
Total Recordable Incident Frequency (TRIF) per million hours worked
8.4 10.2 0
Lost-time accident frequency (LTA1) per million hours worked
5.7 5.5 0
Raw materials and supply chain
Share of certified wood fibres, % 80 76 > 90
Commitment to the Supplier Code of Conduct, % of total purchases2) 96 95 100
Know your supplier check completed, % of total purchases2) 84 77 100
Sustainability evaluation completed, % of total purchases2) 54 49 100
Traceability of raw materials, % of total purchases 97 93 100
Share of fossil free raw materials and packaging materials, % of dry tonnes
99.3 99.4 100
The environment
Fossil-based CO2 emissions (Scope 1), t 240,036 248,274 0
Indirect fossil-based CO2 emissions (Scope 2, market based), t
272,115 250,742 0
Indirect fossil-based CO2 emissions (Scope 2, location based), t
373,816 374,409 0
Share of fossil free energy (Scope 1+2), % 83 83 100
Share of fossil free energy, own generation (Scope 1), %
83 82 100
Share of fossil free energy, purchased (Scope 2), % 83 85 100
Improvement in energy efficiency from 2018 level, %2) +2.1 -0.7 +10
Reduction in process water use per tonne produced, compared to 2018 level, %
-7.7 -10.8 -30
Utilisation of production side streams, % 99.3 99.4 100
1) The figure includes also Hangö Stevedoring for the first time.2) The calculation method has been updated, which is why the figures can depart from the previously
reported figures.
PERSONNEL AND SOCIAL RESPONSIBILITy At the end of the financial period, Metsä Board’s personnel totalled 2,370 (31 December 2019: 2,351), of whom 1,422 (1,414) were based in Finland. In 2020, the average number of employees was 2,455 (1–12/2019: 2,433). Personnel expenses in January–December totalled EUR 196.9 million (194.9).
Metsä Board aims to ensure the availability and retention of skilled personnel by investing in its employer image and by making use of development programmes and successor planning. The company prepares for future retirements by drafting retirement forecasts, and resource plans are drawn up based on these. The company also arranges apprenticeship training, aiming to recruit future personnel, and the mill units invest in on-the-job learning and the sharing of know-how. Risk anticipation relies on early support discussions and solutions between supervisors and employees, the anticipation of possible working capacity risks, and on guidance and support targeted at risk groups.
Metsä Board is committed to the development of a culture of equality where everyone can achieve a successful career and become an accepted member of the workplace community. Personal characteristics such as gender, age, ethnic background, sexual orientation or disability do not influence a person’s chances to succeed in their workplace community. Metsä Board promotes the equality of its personnel with the help of targets set in 2020, which focus particularly on improving gender equality.
Metsä Board aims for zero accidents. During the review period, total record-able incident frequency (TRIF) stood at 8.4 (10.2), while the lost-time accident frequency (LTA1) was 5.7 (5.5). Safety at the mills has improved, but incident frequency in the port operations of Hangö Stevedoring increased from the pre-vious year. The most typical accidents were slips and injuries to hands and feet. Accidents are prevented with anticipatory measures such as safety observations, safety walk-throughs and safety training. In 2020, safety at work was improved through a programme covering the entire Metsä Group. The programme aims to create common safety management principles, daily management processes, safety-at-work standards and more detailed safety instructions. All of Metsä Board’s mills and its head office have adopted the 5S method, which aims to increase productivity and improve wellbeing and safety at work.
OPERATIONS DURING THE CORONAvIRUS PANDEMIC Metsä Board is following precautionary measures appropriate for the situation, some of which exceed the measures required by the authorities. The company’s priorities include ensuring the health and safety of employees, preventing the virus from spreading, and securing business continuity. Metsä Board’s production and deliveries have continued without disruption during the pan-demic, and the annual maintenance shutdowns at the mills were also carried out successfully. All in all, Metsä Group performed nearly 2,000 coronavirus tests in connection with the annual maintenance shutdowns. At the onset of the pandemic, the company shifted to remote working in all jobs that allowed for it. The mills and offices have followed strict special arrangements which minimise close contact along passageways, in cafeterias and staff facilities and at workstations. Employees have been provided with detailed instructions on hygiene and the use of masks. The special arrangements also apply to suppliers visiting the mills.
RESPECTING HUMAN RIGHTS AND THE COMPANy’S ANTI-CORRUPTION AND ANTI-BRIBERy ACTIvITIES Metsä Board requires its personnel to comply with applicable legislation, and to act honestly and make ethically sound decisions. The Code of Conduct and the related training programme seek to strengthen the culture of doing the right thing, help personnel to identify ethically challenging situations and encourage them to report any shortcomings they observe.
99% (97%) of the company’s personnel have completed the training related to the Code of Conduct. Among other things, the Code of Conduct commits to a respect for human rights and to measures against corruption and bribery. Human rights issues are also discussed in the equality training provided to the entire personnel and in the KYC (Know Your Customer) training organised for sales representatives. The company’s partners are also expected to comply with the Code of Conduct. Based on the human rights risk assessment launched in 2017, the company has continued to develop its processes to prevent human rights risks linked to its operations and supply chain.
The company’s first Ethics Barometer, aimed at the entire personnel, was carried out in 2020. The barometer measures the personnel’s perception of ethics in their workplace and can be used to identify risks related to the ethics of Metsä Board’s business. The “ethics index” yielded by the results of the barometer was at 85.1% at Metsä Board, with the goal being 100%. In the future, the Ethics Barometer and the Organisation Functionality Survey will be organised in alternate years.
Metsä Group has a joint compliance and ethics channel through which personnel and stakeholder representatives can anonymously report any
short-comings they detect. All breaches and suspected breaches brought to the attention of the company are investigated, and the most significant of them are dealt with by the Compliance Committee. In 2020, Metsä Board was informed of a total of 10 (8) incidents involving matters such as conflicts of interest, inappropriate conduct or irregularities. None of the incidents led to legal proceedings or related to corruption, bribery, the use of child labour or other human rights violations.
RAW MATERIALS AND SUPPLy CHAINThe sustainability of Metsä Board’s raw materials and supply chain is ensured within separate processes in terms of i) wood fibre and ii) other raw materials and services.
Metsä Board’s wood supply is managed by Metsä Forest, part of Metsä Group, and the wood fibre’s sustainability and traceability are ensured with practices that meet the criteria of the PEFC™ Chain-of-Custody and FSC® Chain-of-Custody. All the wood raw material used by the company is traceable and comes from either certified or controlled and sustainably managed northern forests in which biodiversity is safeguarded. Metsä Board aims for certified wood fibre to account for at least 90% of all the wood used by the company by 2030. During the review period, 80% (76%) of the wood fibres came from certified forests.
The sourcing of other raw materials and services has been centralised in Metsä Group, where the Group-wide purchasing process ensures that the partners operating in the Group’s supply chain comply with principles that support ethical and sustainable business operations. This aims to minimise risks related to the environment, health, corruption, the use of child labour and human rights violations in the supply chain. Metsä Group’s Supplier Code of Conduct was updated in 2020 to respond to the Group’s goals and stakeholders’ stricter requirements. The review period saw the further development of the supplier assessment and auditing process. The company also organised several sustainability-related training sessions to personnel working in sourcing and logistics.
The selection process for suppliers includes the performance of a risk analysis which reviews suppliers’ country and category risks and their compliance with legislation. Metsä Board also employs three key indicators to monitor and develop the supply chain’s sustainability: suppliers’ commitment to the Supplier Code of Conduct as well as the completion of a Know your supplier check and sustainability evaluation. The Know your supplier check inspects a supplier’s background in terms of trade sanctions, money laundering, corruption, human rights violations and other key risks. Metsä Board also has a corresponding process applicable to customers. Every year, Metsä Group and external auditors audit some of Metsä Board’s suppliers. In 2020, Metsä Group conducted 12 (14) onsite audits and an external party 9 (15) onsite audits at Metsä Board’s suppliers.
In 2020, the company knew the origin – at a minimum the manufacturing country – of 97% (93%) of the total purchases of raw materials and packaging materials. The systematic collection of origin data is being developed further.
The proportion of fossil free raw materials, including the packaging materials of the company’s own products, was 99% (99%).
According to our targets approved by the Science Based Targets initiative, we are committed to 70% of our non-fibre-based suppliers and the logistics oper-ators related to our customer deliveries, measured by purchasing costs, setting themselves targets in line with the SBTi by 2024. In 2020, 5% of our suppliers had done so. In addition, 4% had committed to setting themselves targets in line with the SBTi.
CLIMATE AND THE ENvIRONMENTMetsä Board aims to use only fossil free energy by the end of 2030. In essence, this refers to a situation where the company’s mills do not use fossil fuels or pur-chase energy generated with fossil fuels. Accordingly, the target for fossil-based CO2 emissions (Scope 1 and 2) is zero. In 2020, 83% (83%) of the energy used by Metsä Board was fossil free. The company has reduced its fossil-based CO2 emissions (Scope 1 and 2) by 9% per tonne produced in 2018–2020.
In terms of energy efficiency, Metsä Board aims for a minimum improvement of 10% in 2018–2030. In 2020, energy efficiency improved by 2.1% compared to 2018.
Metsä Board’s process water use in 2020 was 62,0 million cubic metres (59.4), 100% of which was surface water. Metsä Board does not abstract any water from areas with high water stress (WRI Aqueduct Water Risk Atlas). Of all the water we use, some 99% is returned to the waterways after use. The aim is to reduce the use of process water by 30% per tonne produced in 2018–2030. In 2020, the reduction was 7.7% (10.8%) compared to 2018. Approximately 99% (99%) of production side streams were used as materials or energy.
EXTERNAL RECOGNITIONSIn 2020, Metsä Board was again acknowledged by the CDP’s global environmental assessment’s Climate A and Water A lists for actions related to climate change mitigation and the sustainable use of water resources. For the sustainable use of forests, the company received the high rating of A-. In EcoVadis’s corporate social responsibility assessment, Metsä Board achieved the highest Platinum level. Metsä Board has also achieved excellent results in other assessments related to the environment, social responsibility and governance, carried out by MSCI, Sustainalytics and ISS ESG, among others.
ENvIRONMENTAL LIABILITIES AND OBLIGATIONSMetsä Board has environmental liabilities related to former operations at sites that have since been closed, sold or leased, as well as at decommissioned landfill sites. Financial provisions for the cost of land rehabilitation work have been made in cases where it has been possible to measure the company’s liability for land contamination. Metsä Board’s environmental liabilities in 2020 totalled EUR 3.4 million (3.5) and the environmental expenses amounted to EUR 16.3 million (14.4). The environmental expenses consist mainly of expenses related to the use and maintenance of environmental protection equipment, expenses related to waste management and environmental insurance, and the depreciation of capitalised environmental expenses. No deviations resulting in significant environmental impact occurred in Metsä Board’s production units in 2020. Short-term deviations from permit conditions were nevertheless recorded and reported to the authorities, in accordance with regulations.
5150
METSÄ BOARD Annual Report 2020
Business operations and value creation
2 This is Metsä Board
4 CEO’s review
6 Highlights of the year
8 Strategy and targets
10 Creating value
12 Operating environment
16 Product and service development
18 Circular economy
Sustainability
20 Sustainability targets
24 We bring the forest to you
26 We offer sustainable choices
30 We work for a better climate and environment
34 We create well-being
40 Mill-specific information
Financial development
44 Report of the Board of Directors
57 Consolidated financial statements
61 Notes to the consolidated financial statements
107 Parent company financial statements
110 Notes to the parent company financial statements
123 Auditor’s report
126 Shares and shareholders
132 Key figures and taxes
Governance
134 Corporate governance statement
140 Metsä Board Corporation’s Board of Directors
142 Metsä Board Corporation’s Corporate Management Team
144 Investor relations and investor information

SUSTAINABILITYBUSINESS OPERATIONS AND VALUE CREATION GOVERNANCE
FINANCIAL DEVELOPMENT
REPORT OF THE BOARD OF DIRECTORS | METSÄ BOARD ANNUAL REPORT 2020
RELATED RISKSThe risks related to the environmental, human and social issues, respect for human rights as well as the anti-corruption and anti-bribery activities reviewed above are described in more detail in this Board of Directors’ Report under the section “Main risks and uncertainties”.
DISCLOSURE ACCORDING TO TCFD RECOMMENDATIONSMetsä Board’s disclosures on climate-related risks and opportunities, according to the recommendations of TCFD (Task Force on Climate-related Financial Disclosures), have been summarised in the table below.
The references to more detailed information are indicated with abbreviations: (AR) Annual Report, (BoD) Board of Directors’ Report, (CG) Corporate Governance Statement.
Governance
Disclose the organisation’s governance around climate-related risks and opportunities.
a) Describe the Board’s oversight of climate-related risks and opportunities.
AR: Sustainability governance, p. 21 CG: Risk management, pp. 138–139
b) Describe management’s role in assessing and managing climate-re-lated risks and opportunities.
AR: Sustainability governance, p. 21 CG: Risk management, pp. 138–139
Strategy
Disclose the actual and potential impacts of climate-related risks and opportunities on the organisation’s business operations, strategy and financial planning where such information is material.
a) Describe the climate-related risks and opportunities the organisation has identified over the short, medium, and long term.
The identified climate risks and opportunities may occur in the medium term (1–5 years) and the long term (more than 5 years). Weather-related risks such as dry summers and rainy winters which are expected to become more common as climate change progresses may occur in the short term (0–1 years).
AR: Strategy, pp. 8–9 BoD: Main risks and uncertainties, pp. 53–55 CG: Risk management, pp. 138–139 Opportunities: AR: Megatrends and operating environment, pp. 12–15 AR: Product and service development, pp. 16–17 AR: Sustainable products, pp. 26–29
b) Describe the impact of climate-related risks and opportunities on the organization’s businesses, strategy, and financial planning.
AR: Strategy, pp. 8–9 AR: Megatrends and operating environment, pp. 12–15 AR: Sustainability targets and governance, pp. 20–23 BoD: Main risks and uncertainties, pp. 53–55 CG: Risk management, pp. 138–139
c) Describe the resilience of the organisation’s strategy, taking into consideration different climate-related scenarios, including a 2°C or lower scenario.
While Metsä Board still has room for improvement in utilising climate-related scenarios, the company is already adapting its operations to a low-carbon economy and is committed to the target of limiting global warming to 1.5 °C compared to the pre-industrial era. Metsä Board’s targets for reducing greenhouse gas emissions have been approved by the Science Based Targets initiative. The company aims for zero carbon dioxide emissions (Scope 1 and 2) by the end of 2030. With respect to the impact climate change will have on forest management and wood supply, Metsä Board makes use of analyses based on the RCP 2.6 and RCP 4.5 scenarios. AR: Megatrends and operating environment, pp. 12–15 AR: Product and service development, pp. 16–17 AR: Sustainability, pp. 18–32 BoD: Main risks and uncertainties, pp. 53–55
Risk management
Disclose how the organisation identifies, assesses and manages climate-related risks.
a) Describe the organisation’s processes for identifying and assessing climate-related risks.
Climate-related risks have been integrated into Metsä Board’s general risk management: AR: Sustainability governance, p. 21 BoD: Main risks and uncertainties, pp. 53–55 CG: Risk management, pp. 138–139
b) Describe the organisation’s processes for managing climate-related risks.
BoD: Main risks and uncertainties, pp. 53–55 CG: Risk management, pp. 138–139
c) Describe how the processes for identifying, assessing and managing climate-related risks are integrated into the organisation’s overall risk management.
Climate-related risks have been integrated into Metsä Board’s general risk management: AR: Sustainability governance, p. 21 BoD: Main risks and uncertainties, pp. 53–55 CG: Risk management, pp. 138–139 Climate risks are assessed as part of Metsä Board’s overall risk assessment process. Risks are assessed with the help of a risk matrix which accounts for the magnitude of a risk’s potential financial impact and the likelihood of the risk’s materialisation.
Metrics and targets
Disclose the metrics and targets used to assess and manage relevant climate-related risks and opportunities where such information is material.
a) Disclose the metrics used by the organisation to assess climate-re-lated risks and opportunities in line with its strategy and risk manage-ment process.
AR: Sustainability targets and governance, pp. 20–23 AR: Sustainable products, pp. 18–19, 26–27AR: Climate and the environment, pp. 30–32AR: Product and service development, pp. 16–17
b) Disclose Scope 1, Scope 2, and, if appropriate, Scope 3 greenhouse gas emissions and the related risks.
Scope 1 and 2 emissions: AR: Climate and the environment, pp. 30–31 Metsä Board discloses Scope 3 emissions as part of its annual CDP reporting, in connection to which Scope 3 emissions are also disclosed on Metsä Board’s website (https://www.metsaboard.com/Sustainability).
c) Describe the targets used by the organisation to manage climate- related risks and opportunities and performance against targets.
AR: Sustainability targets, pp. 22–23 AR: Climate and the environment, pp. 30–32
MAIN RISKS AND UNCERTAINTIES
Metsä Board’s risk management is systematic and proactive work, allowing for the assessment and management of opportunities, risks and threats related to the business. As part of continuous operations, the company systematically assesses strategic, operational, financial and damage risks and conducts risk assessments in connection with annual planning and strategy processes. The risk assessment of the annual planning process reviews sales, cost, operating environment, development project, and liability and damage risks related to profitability. The risk assessment of the strategy process reviews risks related to the implementation of the company’s business strategy.
Risks that exceed Metsä Board’s risk-bearing capacity have been transferred to insurance companies, banks and other counterparties with insurance con-tracts, derivative instruments and other agreements. Substantial damage risks are covered by property and business interruption, liability loss, transport loss, cyber and credit insurance policies. Any identified risks and their management are reported to the Board of Directors and the Board’s Audit Committee at least twice a year. The company’s Corporate Management Team reviews the most significant risks as part of its work.
The risk assessments carried out in 2020 identified the following risks and uncertainties that may have an impact on Metsä Board’s business operations and profitability:
MARKET RISKS
UNCERTAINTy IN THE WORLD ECONOMy CAUSED By THE CORONAvIRUS PANDEMIC The coronavirus pandemic will continue to cause considerable uncertainty in the world economy and Metsä Board’s business environment in 2021. This is influenced by the increase in the number of infections in many countries, the restrictions imposed by governments, and uncertainty about the effectiveness of the vaccine and the duration of the pandemic. Prolonged pandemic caused by Covid-19 may subdue the economic recovery or even further weaken the world economy and consumers’ purchasing power in all of Metsä Board’s market areas, thereby reducing demand for the company’s products. In addition, any impairment in customers’ cash position or slower payment behaviour may have an impact on Metsä Board’s cash flow and result in credit losses. The pandemic may also incur additional costs for the company, should the availability of transportation capacity grow weaker, for example.
UNCERTAINTy IN THE DEvELOPMENT OF THE ECONOMyConsiderable uncertainties still exist in the global economy. If realised, they may result in weakened demand and reduced prices for end products. Any changes in the industrial and trade policies of leading industrialised nations may lead to more extensive trade restrictions, slowing down the recovery of the world economy after the pandemic and reducing global trade flows. Increased protectionism and negative developments in international trade would, if realised, have a weakening impact on Metsä Board’s result.
In 2021, factors that cause uncertainty include the trade relations of the United States, China and Europe, tensions in the domestic affairs of the United States following the country’s presidential elections and any changes to the accommodative monetary policies of central banks. In addition, the new trade deal between the UK and the EU may affect global trade flows.
CHANGES IN THE OPERATING ENvIRONMENTMetsä Board operates in an industry where the balance between supply and demand affects the demand and price level of end products. New players enter-ing the market, alternative products or changes in consumer behaviour may have a negative impact on the demand for Metsä Board’s paperboards. Capacity increases or growth in the product portfolios of competitors could lower the price level of end products and have a negative impact on Metsä Board’s prof-itability. Significant changes in exchange rates may also influence the market balance of products and companies’ competitiveness.
Changes in regulations, such as the EU’s climate and environmental policies, and increasing new requirements aiming to limit carbon dioxide, sulphur or other emissions, may increase production costs and weaken the profitability of business. Restrictions imposed on products that contain single-use plastics guide Metsä Board’s product portfolio. The acceptability of plastic-free single used products also involves risks. The acceptability and taxation of various packaging materials involves regulatory risks.
MARKET SITUATION OF PULPStructural changes in customer’s pulp consumption, increasing competition, and new production capacity in the global pulp market may have a negative effect on pulp’s delivery volumes and market prices, and thereby on Metsä Board’s profitability. From 2021 onwards, Metsä Board’s market pulp position, accounting for its holding in Metsä Fibre, shows a surplus of approxi-mately 400,000 tonnes. A 10% strengthening (weakening) in the market price of pulp would have a positive (negative) impact of roughly EUR 30 million on the company’s operating result.
5352
METSÄ BOARD Annual Report 2020
Business operations and value creation
2 This is Metsä Board
4 CEO’s review
6 Highlights of the year
8 Strategy and targets
10 Creating value
12 Operating environment
16 Product and service development
18 Circular economy
Sustainability
20 Sustainability targets
24 We bring the forest to you
26 We offer sustainable choices
30 We work for a better climate and environment
34 We create well-being
40 Mill-specific information
Financial development
44 Report of the Board of Directors
57 Consolidated financial statements
61 Notes to the consolidated financial statements
107 Parent company financial statements
110 Notes to the parent company financial statements
123 Auditor’s report
126 Shares and shareholders
132 Key figures and taxes
Governance
134 Corporate governance statement
140 Metsä Board Corporation’s Board of Directors
142 Metsä Board Corporation’s Corporate Management Team
144 Investor relations and investor information

SUSTAINABILITYBUSINESS OPERATIONS AND VALUE CREATION GOVERNANCE
FINANCIAL DEVELOPMENT
REPORT OF THE BOARD OF DIRECTORS | METSÄ BOARD ANNUAL REPORT 2020
GEOPOLITICAL RISKSThe impact of existing inter-related geopolitical risks and crises in the world may manifest as changes in regional security situations and living conditions, and also in the global economy. These include regional conflicts, the repercus-sions of which are visible as the migration of people and in terrorism stemming from extremism. The predictability of these risks is poor, and their impact may also emerge either very rapidly or over a long period of time. The international sanctions related to the management of international crises may have a direct or indirect impact on the demand for Metsä Board’s products and on its profitability.
OPERATIONAL RISKS
SUSTAINABILITy AND CLIMATE RISKSWhile the promotion of sustainability supports Metsä Board’s business and its development, particularly climate change and the loss of biodiversity also involve risks. Climate risks are divided into 1) transition risks, i.e. risks arising from the transition to a low-carbon economy, and 2) physical risks, which con-cern changes in temperatures and precipitation, for example. At Metsä Board, these climate risks particularly concern forests and the use of energy and water. Should they materialise, climate risks could have a negative impact on Metsä Board’s profitability. The supply and demand of products in a low-carbon economy may also differ from what it currently is.
The most important transition risks include increasing regulation, requirements for new technology as well as a market and reputation risk, if the company fails to respond to the changed market environment in an effective manner. Regulation aiming to mitigate climate change and reduce greenhouse gas emissions may, furthermore, increase costs and result in substantial change requirements applicable to production technology. Securing the biodiversity of forests by means of increasing regulation will also result in risks for the use of forests. All wood purchased by Metsä Group comes from sustainably managed forests. This is verified by certification or otherwise controlled. In 2020, Metsä Group furthermore initiated a new programme on the ecological sustainability of forestry which supports the preservation of biodiversity and the protection of waters.
Physical climate risks can be further divided into acute weather phenomena and more permanent, long-term changes. Extreme weather phenomena may weaken the availability of the process water needed by mills and result in production breaks. This risk is mitigated by the fact that all of Metsä Board’s mills are located in northern areas with ample water. As the climate grows warmer, the most significant risks influencing forests and the availability of the wood raw material are the weakening of harvesting conditions as winters grow shorter and the increase of various kinds of damage caused by insects.
Climate change mitigation and the transition to a low-carbon economy are strongly visible in Metsä Board’s sustainability targets for 2030. The core of these goals consists of a transition to the use of entirely fossil free energy in pro-duction, abandoning the use of raw materials based on fossil oil and increasing the efficiency of energy and water consumption. The measures related to these goals help Metsä Board manage climate risks. At the same time, they open up new opportunities for Metsä Board in the changed operating environment.
Metsä Board’s disclosures on climate-related risks and opportunities, according with the recommendations of TCFD (Task Force on Climate-related Financial Disclosures), are presented in the Non-financial information -section.
inputs. Metsä Board works to hedge against this risk by entering into long-term delivery agreements and goods-related derivative instruments. In addition, a steep increase in transportation and other logistics costs, or the weak availability of transport capacity, may have a negative effect on Metsä Board’s profitability. Moreover, any amendments to legislation, regulations or taxation related to the most important production inputs may result in significantly increased costs.
LIABILITy RISKSMetsä Board’s business involves liability risks, such as contractual, environ-mental and product liability risks. Liability risks are managed by way of efficient business processes, contract training, management practices, quality control and transparent operations. Some of the operational liability risks have been hedged with insurance policies.
CORPORATE SECURITy RISKSRisks that may compromise corporate security include shortcomings and negligence in personal safety and security and occupational safety or in the management of financial irregularities. They also include negative information operations and cyber threats, threats concerning delivery chains and the adequacy of internal controls. The operating processes of corporate security as well as the guidelines, training and internal controls related the management of risks are developed continuously, and exercises related to the management of crisis situations are organised regularly.
PERSONNEL AvAILABILITy AND RETENTIONMetsä Board pays attention to ensuring the availability and retention of competent personnel by means of various personnel development programmes and successor plans, and by investing in its employer image. Metsä Board also prepares for retirements and other personnel risks through the promotion of multiple skills and work ability as well as through job rotation.
FINANCIAL RISKS
FINANCIAL AND EXCHANGE RATE RISKSAs a result of increasing regulation in the financial market, the operations of credit and bond markets may become more difficult, which may impact the company’s ability to acquire long-term debt financing at a competitive price. The financial risks are managed in accordance with the treasury policy approved by Metsä Board’s Board of Directors. The purpose is to hedge against considerable financial risks, balance cash flow and give the business enough time to adjust to changing conditions.
Metsä Board sells its products in several countries and is therefore susceptible to fluctuations in exchange rates. The US dollar strengthening by 10% against the euro would have a positive impact of approximately EUR 62 million on Metsä Board’s annual operating result. Correspondingly, the Swedish krona strengthening by 10% would have a negative impact of approximately EUR 42 million. The British pound strengthening by 10% would have a positive impact of approximately EUR 9 million. The impact of weakened exchange rates would be the opposite. The sensitivities do not include the impact of hedging.
CONCENTRATION OF OPERATIONS IN A LIMITED GEOGRAPHICAL AREASeven of Metsä Board’s eight production units are located in Finland, and one of them is located in Sweden. Finland has a history of labour disputes in both the forest industry and in the distribution chain of forest industry products. These may have a negative impact on production volumes and customer deliveries, and weaken the company’s competitiveness and profitability. Labour disputes in Sweden may also damage Metsä Board’s production and customer deliveries and have a negative impact on the company’s business operations.
CONTINUITy RISKSThe continuity of mills’ production can be influenced by, among other things, large-scale fires, major equipment malfunctions, extreme weather phenomena and environmental damage. In addition, employees falling ill as a result of infectious diseases, any long-term disruptions in IT systems, labour market disputes, availability problems in key raw materials and disruptions in the logistics chain may interrupt business operations either in part or in full.
With respect to property and continuity damage risks, the company engages in active risk management work with insurance companies, including risk assessments conducted at mills and in the delivery chain at regular intervals.
Interruptions in production or the delivery chain may have an impact on the continuity and delivery reliability of customer services. Should such interruptions draw out, the financial losses can be very substantial and lead to the permanent loss of customer accounts. The company has prepared continuity and recovery plans in preparation for the materialisation of these risks.
BUSINESS DEvELOPMENTThe development and growth of Metsä Board’s business requires strategic choices that involve risks. The uncertainties in question involve the selection and timing of growth investments, for example, as well as the development of sales and the customer portfolio. The growth of the paperboard business and the introduction of new production to the market are dependent on successful sales. The commercialisation of new products involves uncertainties that, should they materialise, could have a negative impact on the demand for Metsä Board’s products and the company’s profitability. Increasing sales on a global scale also involves cost and exchange rate risks.
BUSINESS ETHICSBusiness ethics in general and the prevention of human rights violations, conflicts of interest, fraud, bribery and money laundering have been identified as areas requiring continuous development. In 2020, the company conducted its first ethics barometer aimed at the entire personnel. An anonymous whistle-blowing channel and the functionality of the related investigation process are also key tools in the identification and management of compliance-related risks. As part of Metsä Board’s continuous actions in sustainability, the company is developing processes related to the identification of its suppliers and customers. This will enable the increasingly efficient identification and management of risks related to the sustainability of the supply chain.
PRICE RISKS OF PRODUCTION AND LOGISTICS COSTSAn unforeseen rise in the price of production inputs important for Metsä Board’s operations (such as wood, energy and chemicals), or availability problems, may weaken profitability and threaten the continuity of operations. Changes in exchange rates may also influence the costs of some production
CREDIT RISKS The management of credit risks related to commercial operations is the respon-sibility of Metsä Board’s executive management and Metsä Group’s centralised credit control. Metsä Board’s management determines the limits on credit extended to customers and the applicable terms of payment in cooperation with the centralised credit control. Nearly all credit risks are transferred by means of credit insurance contracts. Metsä Board’s customer credit risk was at a normal level in 2020. The main principles of credit control are defined in the credit guidelines of the risk management policy approved by the company’s Board of Directors.
Metsä Board’s financial risks and their management are described in more detail in the 2020 Annual Report - Notes to the Consolidated Financial Statements – 5.6. Management of financial risks.
LEGAL PROCEEDINGS
In the autumn of 2015, the Finnish Tax Administration, in its assessment of the 2014 taxation, refused the deductibility of certain losses related to the cross-border merger of a French subsidiary in Metsä Board Corporation’s 2014 taxation. Metsä Board believes the losses to be deductible and has appealed the Tax Administration’s decision. The Board of Adjustment dismissed the company’s appeal in March 2018. The company has appealed the decision to the Administrative Court of Helsinki.
CORPORATE GOVERNANCE
The Company’s statutory bodies include the General Meeting of Shareholders, the Board of Directors and the CEO. In addition, a Corporate Management Team assists the CEO in the operative management of the Company and in coordinating its operations. Members of the management team are not mem-bers of the Board of Directors. The tasks and responsibilities of the different corporate bodies are specified in the Finnish Companies Act.
Metsä Board’s Board of Directors has nine members, two of whom two are women. A majority of Board members (six of nine) are independent of both the company and its biggest shareholders. Three members of the Board of Directors are not independent of Metsäliitto Cooperative. During the 2020 financial period, the Board of Directors held a total of 17 meetings, at which the attendance rate of Board members was 100% (2019: 97%).
Metsä Board’s Board of Directors has determined the principles applicable to the diversity of the Board. The realisation of the principles is reported on yearly, in the Board’s Corporate Governance Statement.
RESOLUTIONS OF THE 2020 ANNUAL GENERAL MEETING
The Annual General Meeting held on 11 June 2020 adopted the company’s financial statements for the financial year 2019, and decided to distribute a dividend of EUR 0.10 per share and capital in the amount of EUR 0.14 per share from the reserve for invested non-restricted equity, totalling EUR 0.24 per share.
The Annual General Meeting decided to keep the Board of Directors’ annual remuneration unchanged in such a way that the Chair of the Board of Directors is paid annual remuneration of EUR 95,000, the Deputy Chair is paid EUR 80,000 and each member of the Board is paid EUR 62,500, and that a meeting fee of EUR 700 is paid for each meeting of the Board and committees
5554
METSÄ BOARD Annual Report 2020
Business operations and value creation
2 This is Metsä Board
4 CEO’s review
6 Highlights of the year
8 Strategy and targets
10 Creating value
12 Operating environment
16 Product and service development
18 Circular economy
Sustainability
20 Sustainability targets
24 We bring the forest to you
26 We offer sustainable choices
30 We work for a better climate and environment
34 We create well-being
40 Mill-specific information
Financial development
44 Report of the Board of Directors
57 Consolidated financial statements
61 Notes to the consolidated financial statements
107 Parent company financial statements
110 Notes to the parent company financial statements
123 Auditor’s report
126 Shares and shareholders
132 Key figures and taxes
Governance
134 Corporate governance statement
140 Metsä Board Corporation’s Board of Directors
142 Metsä Board Corporation’s Corporate Management Team
144 Investor relations and investor information

SUSTAINABILITYBUSINESS OPERATIONS AND VALUE CREATION GOVERNANCE
FINANCIAL DEVELOPMENT
CONSOLIDATED FINANCIAL STATEMENTS | METSÄ BOARD ANNUAL REPORT 2020
of the Board that a member attends. The Annual General Meeting decided to pay roughly half of the remuneration in the form of the company’s B shares acquired through public trading. Furthermore, the Annual General Meeting decided to pay the Chair of the Audit Committee monthly remuneration of EUR 800.
The Annual General Meeting confirmed the number of Board members as nine (9) and elected the following persons as members of the Board of Directors: Hannu Anttila, M.Sc. (Economics); Ilkka Hämälä, M.Sc. (Technology); Kirsi Komi, LL.M.; Kai Korhonen, M.Sc. (Technology); Liisa Leino, M. Ed.; Jussi Linnaranta, M.Sc. (Agriculture); Jukka Moisio M.Sc. (Economics); Timo Saukkonen M.Sc. (Agriculture); and Veli Sundbäck, LL.M. The Board members’ term of office expires at the end of the next Annual General Meeting.
More information about the decisions made by the Annual General Meeting and materials related to the meeting are available on the company’s website at www.metsaboard.com/Investors/General-Meeting/General-Meeting-2020/.
SHARES
At the end of the financial period, the price for Metsä Board’s B share on the Nasdaq Helsinki was EUR 8.62. The share’s highest and lowest prices in 2020 were EUR 8.79 and EUR 4.47, respectively. At the end of the financial period, the price for Metsä Board’s A share on the Nasdaq Helsinki was EUR 8.64. The share’s highest and lowest prices in 2020 were EUR 8.80 and EUR 4.80, respectively.
In 2020, the average daily trading volumes of the B and A shares on the Nasdaq Helsinki were 616,002 shares and 6,980 shares, respectively. The total trading volumes of the B and A shares were EUR 950 million and EUR 12 million, respectively.
In addition to the Nasdaq Helsinki, Metsä Board’s shares are also traded on other marketplaces. The Nasdaq Helsinki’s share of total trading during the review period was around 82%.
During the review period, a total of 200,496 of Metsä Board Corporation’s A shares were converted to B shares. At the end of the review period, the total number of Metsä Board shares was 355,512,746, of which 32,887,151 were A shares and 322,625,595 were B shares.
At the end of the review period, the market value of all Metsä Board shares was EUR 3.1 billion, of which the market value of the B shares and the A shares accounted for EUR 2.8 billion and EUR 0.3 billion, respectively.
During the review period, Metsä Board received a notification of major holdings according to which Metsäliitto Cooperative’s combined share of votes in Metsä Board Corporation exceeded the limit of two-thirds (2/3).
At the end of the review period, Metsäliitto Cooperative held 48% (31 December 2019: 46%) of all shares, and the votes conferred by these shares was 67% (66%). International and nominee-registered investors held approximately 16% (15%) of all shares. The company does not hold any treasury shares.
NEAR-TERM OUTLOOK
The duration of the coronavirus pandemic and the scope of its negative impact on the world economy and on Metsä Board’s business operations continue to be difficult to estimate.
Metsä Board’s paperboard deliveries in January–March 2021 are expected to grow from the delivery volumes of October–December 2020 (441,000 tonnes).
The prices of white kraftliner in local currencies are expected to increase slightly, while the prices of folding boxboard are expected to remain stable.
No significant annual maintenance shutdowns at mills are set to take place in January–March 2021.
Demand for long-fibre pulp will be supported by increased economic activity, particularly in Asia. Supply has recently reduced due to producers’ annual maintenance shutdowns, the production curtailments announced by some parties and a shortage of containers in the traffic between Europe and Asia. The improved market situation in Asia has reflected to Europe and market pulp prices are increasing.
Exchange rates, accounting for the effect of hedging, in January–March 2021 will have a negative impact on results compared to October–December 2020 and a negative impact on results compared to January–March 2020.
Energy costs are expected to increase in January–March. The other produc-tion costs of paperboard and pulp are expected to remain fairly stable.
EVENTS AFTER THE REVIEW PERIOD
The sale of a 30% share in the Husum pulp mill to Norra Skog was completed on 4 January 2021, and its impact will be included in Metsä Board’s financial reporting as of the interim report concerning January–March 2021. The trans-action will decrease Metsä Board’s net debt by approximately EUR 260 million, and in addition it will reduce Metsä Board’s financial contribution in the second phase of the Husum pulp mill renewal by approximately EUR 100 million.
Metsä Board announced on 22 January 2021, that it has started pre-engineer-ing for increasing the annual production capacity of folding boxboard at the Husum mill in Sweden by approximately 200,000 tonnes. The pre-engineering phase includes also an evaluation of the mill’s port capacity for increased volumes of raw materials and finished goods. The readiness to make the final investment decision is expected to be achieved in the summer of 2021 and the ramp-up of the additional capacity would start in 2023.
On 11 February 2021, Metsä Board’s associated company Metsä Fibre made an investment decision on the construction of a new bioproduct mill in Kemi, Finland.
On 11 February 2021, Metsä Board made an investment decision on the development programme for its Kemi paperboard mill.
BOARD OF DIRECTORS’ PROPOSAL FOR DIVIDEND AND CAPITAL DISTRIBUTION
The distributable funds of the parent company on 31 December 2020 were EUR 640.2 million, of which the retained earnings for the financial year are EUR 372.7 million.
The Board of Directors proposes to the Annual General Meeting to be held on 25 March 2021 that a dividend of EUR 0.10 per share and a capital distribu-tion from the reserve for invested non-restricted equity of EUR 0.16 per share, totalling EUR 0.26, be paid for the 2020 financial period.
The proposed dividend and capital distribution, totalling EUR 0.26 per share, corresponds to 54% of the result per share for 2020. The amount of dividend and capital distribution totals EUR 92.4 million.
The dividend and capital distribution will be paid to shareholders who are registered in the company’s shareholders register held by Euroclear Finland on the dividend payment and capital distribution record date of 29 March 2021. The Board of Directors proposes 7 April 2021 as the dividend payment and capital distribution date.
EUR million Note 1–12/2020 1–12/2019
Sales 2.1, 2.2, 7.3 1,889.5 1,931.8
Change in stocks of finished goods and work in progress -38.7 3.8
Other operating income 2.3, 7.3 33.3 51.7
Materials and services 2.4, 7.3 -1,225.4 -1,389.8
Employee costs 3 -196.9 -194.9
Share of result of associated company 7.2, 7.3 -2.4 43.1
Depreciation, amortisation and impairment charges 4.1, 4.2 -94.5 -113.7
Other operating expenses 2.4 -137.5 -151.1
Operating result 227.3 180.8
Share of profit from associated companies and joint ventures 7.2 -0.1 0.1
Net exchange gains/losses 5.2 -3.4 -1.6
Other financial income 5.2, 7.3 0.4 0.8
Interest and other financial expenses 5.2, 7.3 -11.9 -14.6
Result before tax 212.3 165.6
Income taxes 6 -42.2 -21.0
Result for the period 170.1 144.6
Other comprehensive income
Items that will not be reclassified to profit or loss 5.1
Actuarial gains/losses on defined benefit pension plans 3.4 -3.7 -3.5
Financial assets at fair value through other comprehensive income 4.3 -70.3 -14.7
Share of profit from other comprehensive income of associated company 0.4 0.2
Income tax relating to items that will not be reclassified 15.0 2.8
Total -58.6 -15.1
Items that may be reclassified to profit or loss 5.1
Cash flow hedges 17.6 -10.1
Translation differences 6.2 -3.4
Share of profit from other comprehensive income of associated company 0.7 1.7
Income tax relating to items that may be reclassified -3.4 2.2
Total 21.1 -9.6
Other comprehensive income, net of tax -37.5 -24.8
Total comprehensive income for the period 132.6 119.8
Result for the period attributable to
Shareholders of parent company 170.1 144.6
Non-controlling interest
170.1 144.6
Total comprehensive income for the period attributable to
Shareholders of parent company 132.6 119.8
Non-controlling interest
132.6 119.8
Adjusted average number of shares, thousands 355,513 355,513
Basic and diluted earnings per share for result for the period attributable to the shareholders of parent company, EUR
0.48 0.41
The notes are an integral part of these financial statements.
CONSOLIDATED STATEMENT OF COMPREHENSIVE INCOME
Consolidated financial statements
5756
METSÄ BOARD Annual Report 2020
Business operations and value creation
2 This is Metsä Board
4 CEO’s review
6 Highlights of the year
8 Strategy and targets
10 Creating value
12 Operating environment
16 Product and service development
18 Circular economy
Sustainability
20 Sustainability targets
24 We bring the forest to you
26 We offer sustainable choices
30 We work for a better climate and environment
34 We create well-being
40 Mill-specific information
Financial development
44 Report of the Board of Directors
57 Consolidated financial statements
61 Notes to the consolidated financial statements
107 Parent company financial statements
110 Notes to the parent company financial statements
123 Auditor’s report
126 Shares and shareholders
132 Key figures and taxes
Governance
134 Corporate governance statement
140 Metsä Board Corporation’s Board of Directors
142 Metsä Board Corporation’s Corporate Management Team
144 Investor relations and investor information
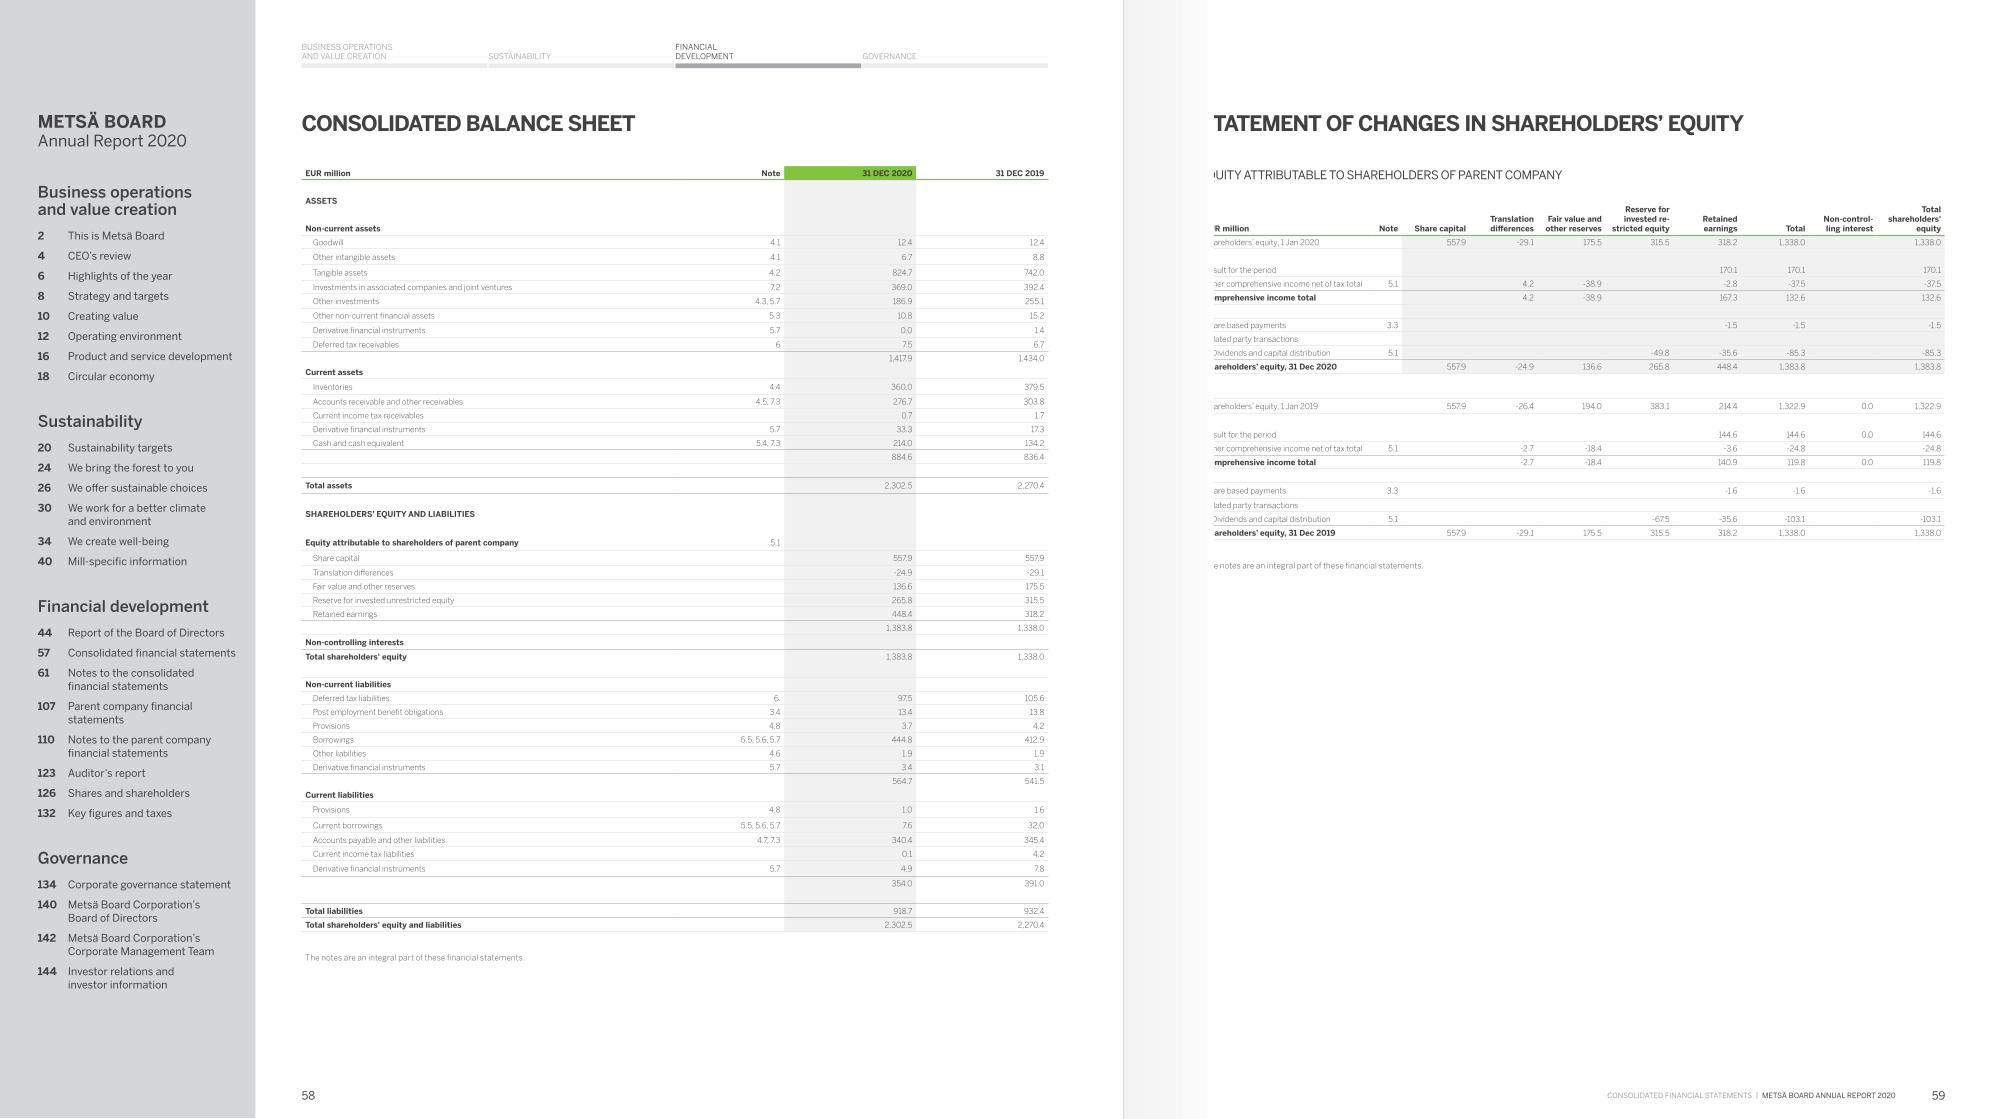
SUSTAINABILITYBUSINESS OPERATIONS AND VALUE CREATION GOVERNANCE
FINANCIAL DEVELOPMENT
CONSOLIDATED FINANCIAL STATEMENTS | METSÄ BOARD ANNUAL REPORT 2020
EUR million Note 31 DEC 2020 31 DEC 2019
ASSETS
Non-current assets
Goodwill 4.1 12.4 12.4
Other intangible assets 4.1 6.7 8.8
Tangible assets 4.2 824.7 742.0
Investments in associated companies and joint ventures 7.2 369.0 392.4
Other investments 4.3, 5.7 186.9 255.1
Other non-current financial assets 5.3 10.8 15.2
Derivative financial instruments 5.7 0.0 1.4
Deferred tax receivables 6 7.5 6.7
1,417.9 1,434.0
Current assets
Inventories 4.4 360.0 379.5
Accounts receivable and other receivables 4.5, 7.3 276.7 303.8
Current income tax receivables 0.7 1.7
Derivative financial instruments 5.7 33.3 17.3
Cash and cash equivalent 5.4, 7.3 214.0 134.2
884.6 836.4
Total assets 2,302.5 2,270.4
SHAREHOLDERS’ EQUITY AND LIABILITIES
Equity attributable to shareholders of parent company 5.1
Share capital 557.9 557.9
Translation differences -24.9 -29.1
Fair value and other reserves 136.6 175.5
Reserve for invested unrestricted equity 265.8 315.5
Retained earnings 448.4 318.2
1,383.8 1,338.0
Non-controlling interests
Total shareholders' equity 1,383.8 1,338.0
Non-current liabilities
Deferred tax liabilities 6. 97.5 105.6
Post employment benefit obligations 3.4 13.4 13.8
Provisions 4.8 3.7 4.2
Borrowings 5.5, 5.6, 5.7 444.8 412.9
Other liabilities 4.6 1.9 1.9
Derivative financial instruments 5.7 3.4 3.1
564.7 541.5
Current liabilities
Provisions 4.8 1.0 1.6
Current borrowings 5.5, 5.6, 5.7 7.6 32.0
Accounts payable and other liabilities 4.7, 7.3 340.4 345.4
Current income tax liabilities 0.1 4.2
Derivative financial instruments 5.7 4.9 7.8
354.0 391.0
Total liabilities 918.7 932.4
Total shareholders' equity and liabilities 2,302.5 2,270.4
The notes are an integral part of these financial statements.
CONSOLIDATED BALANCE SHEET
EQUITy ATTRIBUTABLE TO SHAREHOLDERS OF PARENT COMPANy
EUR million Note Share capitalTranslation differences
Fair value and other reserves
Reserve for invested re-
stricted equityRetained earnings Total
Non-control-ling interest
Total share holders'
equity
Shareholders’ equity, 1 Jan 2020 557.9 -29.1 175.5 315.5 318.2 1,338.0 1,338.0
Result for the period 170.1 170.1 170.1
Other comprehensive income net of tax total 5.1 4.2 -38.9 -2.8 -37.5 -37.5
Comprehensive income total 4.2 -38.9 167.3 132.6 132.6
Share based payments 3.3 -1.5 -1.5 -1.5
Related party transactions
Dividends and capital distribution 5.1 -49.8 -35.6 -85.3 -85.3
Shareholders’ equity, 31 Dec 2020 557.9 -24.9 136.6 265.8 448.4 1,383.8 1,383.8
Shareholders’ equity, 1 Jan 2019 557.9 -26.4 194.0 383.1 214.4 1,322.9 0.0 1,322.9
Result for the period 144.6 144.6 0.0 144.6
Other comprehensive income net of tax total 5.1 -2.7 -18.4 -3.6 -24.8 -24.8
Comprehensive income total -2.7 -18.4 140.9 119.8 0.0 119.8
Share based payments 3.3 -1.6 -1.6 -1.6
Related party transactions
Dividends and capital distribution 5.1 -67.5 -35.6 -103.1 -103.1
Shareholders’ equity, 31 Dec 2019 557.9 -29.1 175.5 315.5 318.2 1,338.0 1,338.0
The notes are an integral part of these financial statements.
STATEMENT OF CHANGES IN SHAREHOLDERS’ EQUITY
5958
METSÄ BOARD Annual Report 2020
Business operations and value creation
2 This is Metsä Board
4 CEO’s review
6 Highlights of the year
8 Strategy and targets
10 Creating value
12 Operating environment
16 Product and service development
18 Circular economy
Sustainability
20 Sustainability targets
24 We bring the forest to you
26 We offer sustainable choices
30 We work for a better climate and environment
34 We create well-being
40 Mill-specific information
Financial development
44 Report of the Board of Directors
57 Consolidated financial statements
61 Notes to the consolidated financial statements
107 Parent company financial statements
110 Notes to the parent company financial statements
123 Auditor’s report
126 Shares and shareholders
132 Key figures and taxes
Governance
134 Corporate governance statement
140 Metsä Board Corporation’s Board of Directors
142 Metsä Board Corporation’s Corporate Management Team
144 Investor relations and investor information

SUSTAINABILITYBUSINESS OPERATIONS AND VALUE CREATION GOVERNANCE
FINANCIAL DEVELOPMENT
CONSOLIDATED FINANCIAL STATEMENTS | METSÄ BOARD ANNUAL REPORT 2020
1–12/2019EUR million Note 1–12/2020
Cash flow from operating activities
Result for the period 170.1 144.6
Adjustments to the result, total 140.6 70.6
Interest received 0.1 0.3
Interest paid -11.4 -16.3
Dividends received 21.9 63.3
Other financial items, net -6.3 -0.9
Income tax paid -45.2 -18.1
Change in working capital 37.9 -43.0
Net cash flow from operations 307.7 200.5
Cash flow from investing activities
Acquisition of other shares -2.2 0.0
Capital expenditure -154.2 -94.3
Proceeds from disposal of shares in subsidiary, net of cash 7.1 4.2
Proceeds from disposal of other shares 0.1 3.7
Proceeds from sale of tangible and intangible assets 14.5 20.1
Change in non-current receivables, net -0.2 0.1
Net cash flow from investing -142.0 -66.3
Cash flow from financing activities
Proceeds from non-current interest bearing liabilities 33.2 150.0
Payment of non-current interest bearing liabilities -32.0 -155.7
Change in current liabilities 5.5 -0.3 -1.7
Change in non-current non-interest bearing liabilities, net -0.1 -0.2
Dividend paid and capital distribution -85.3 -103.1
Net cash flow from financing -84.4 -110.6
Change in cash and cash equivalents 81.3 23.6
Cash and cash equivalents at beginning of period 134.2 109.7
Translation adjustments -1.5 0.9
Change in cash and cash equivalents 81.3 23.6
Cash and cash equivalents at end of period 5.4 214.0 134.2
Adjustments to the result, total
Taxes 42.2 21.0
Depreciation, amortisation and impairment charges 94.5 113.7
Share of result from associated companies and joint ventures 2.5 -43.2
Gains and losses on sale of non-current assets -14.0 -33.3
Finance costs, net 14.9 15.5
Post-employment benefit obligations and provisions -1.0 -3.5
Other adjustments 1.5 0.5
Adjustments to the result, total 140.6 70.6
Change in working capital
Inventories 17.7 -15.1
Accounts receivables and other receivables 26.1 -2.5
Accounts payable and other liabilities -5.8 -25.4
Change in working capital 37.9 -43.0
The notes are an integral part of these financial statements.
CONSOLIDATED CASH FLOW STATEMENT Notes to the consolidated financial statements1. ACCOUNTING PRINCIPLES
METSÄ BOARD GROUP
Metsä Board Corporation and its subsidiaries comprise a forest industry group (”Metsä Board” or ”the Group”). Metsä Board’s business operations consist solely of folding boxboard, fresh fibre linerboard and market pulp businesses. Metsä Board reports on its financial performance in one reporting segment.
Metsä Board Corporation is Group’s parent company, which is domiciled in Helsinki. The registered address of the company is Revontulenpuisto 2, 02100 Espoo Finland. The parent company is listed on Nasdaq Helsinki Ltd. At the end of 2020 Metsäliitto Cooperative owned 48.2 per cent of the shares, and the voting rights conferred by these shares were 67.4 per cent.
A copy of the annual report can be obtained from Metsä Board’s website www.metsaboard.com or parent company’s head office at Revontulenpuisto 2, 02100 Espoo Finland.
The Group consolidated financial statements were authorised for issue by the Board of Directors on 10 February 2021. According to Finnish Companies Act shareholders can accept or reject the financial statements in General Meeting of shareholders after date of publication. General Meeting of shareholders also have possibility to decide to change financial statements.
ACCOUNTING PRINCIPLES
Metsä Board Corporation’s consolidated financial statements have been prepared in accordance with the International Financial Reporting Standards (IFRS), applying the IAS and IFRS standards and SIC and IFRIC interpretations that were effective and approved by the EU at the date of the financial statements 31 December 2020. International Financial Reporting Standards refer to the standards and their interpretations approved for use in the EU by the Finnish Accounting Act and the regulations set out pursuant to it in accordance with the procedure defined in the EU regulation (EC) no. 1606/2002. The notes to the consolidated financial statements also comply with the requirements of Finnish accounting and company legislation supplement-ing the IFRS regulations.
The consolidated financial statements are presented in millions of euros, unless otherwise noted.
The consolidated financial statements have been prepared based on original acquisition costs, excluding financial assets recognised at fair value, hedged items in fair value hedging, biological assets, assets and obligations related to defined benefit plans and share-based payments measured at fair value.
CORONAVIRUS PANDEMIC
The impact of the coronavirus pandemic on business has been discussed in the Report of the Board of Directors. The impacts of the coronavirus pandemic on determining the impairment of sales receivables as well as cash and cash equiv-alents are discussed in Note 5.6, Management of financial risks, counterparty risk.
AMENDMENTS TO STANDARDS APPLIED DURING THE 2020 FINANCIAL PERIOD
The amendments to standards that entered into force at the beginning of 2020 have no material impacts on the consolidated financial statements.
NEW AND AMENDED STANDARDS TO BE APPLIED DURING FUTURE FINANCIAL PERIODS
Amendments to IAS 16, Property, Plant and Equipment - Proceeds before Intended Use* (to be applied during the financial periods beginning on 1 January 2022 or thereafter). The amendment prohibits deducting from the cost of an item of property, plant and equipment any proceeds from selling items produced while bringing that asset to the location and condition necessary for it to be capable of operating in the manner intended by management. Instead, the proceeds from selling such items, and the cost of producing those items, are recognised in profit or loss. The amendments will impact the definition of the acquisition cost of the Group’s tangible assets and the notes to be presented.
* Amendment has not been approved to be applied by the EU by 31.12.2020.
Other standard amendments will not have a material impact on the consolidated financial statements.
6160
METSÄ BOARD Annual Report 2020
Business operations and value creation
2 This is Metsä Board
4 CEO’s review
6 Highlights of the year
8 Strategy and targets
10 Creating value
12 Operating environment
16 Product and service development
18 Circular economy
Sustainability
20 Sustainability targets
24 We bring the forest to you
26 We offer sustainable choices
30 We work for a better climate and environment
34 We create well-being
40 Mill-specific information
Financial development
44 Report of the Board of Directors
57 Consolidated financial statements
61 Notes to the consolidated financial statements
107 Parent company financial statements
110 Notes to the parent company financial statements
123 Auditor’s report
126 Shares and shareholders
132 Key figures and taxes
Governance
134 Corporate governance statement
140 Metsä Board Corporation’s Board of Directors
142 Metsä Board Corporation’s Corporate Management Team
144 Investor relations and investor information
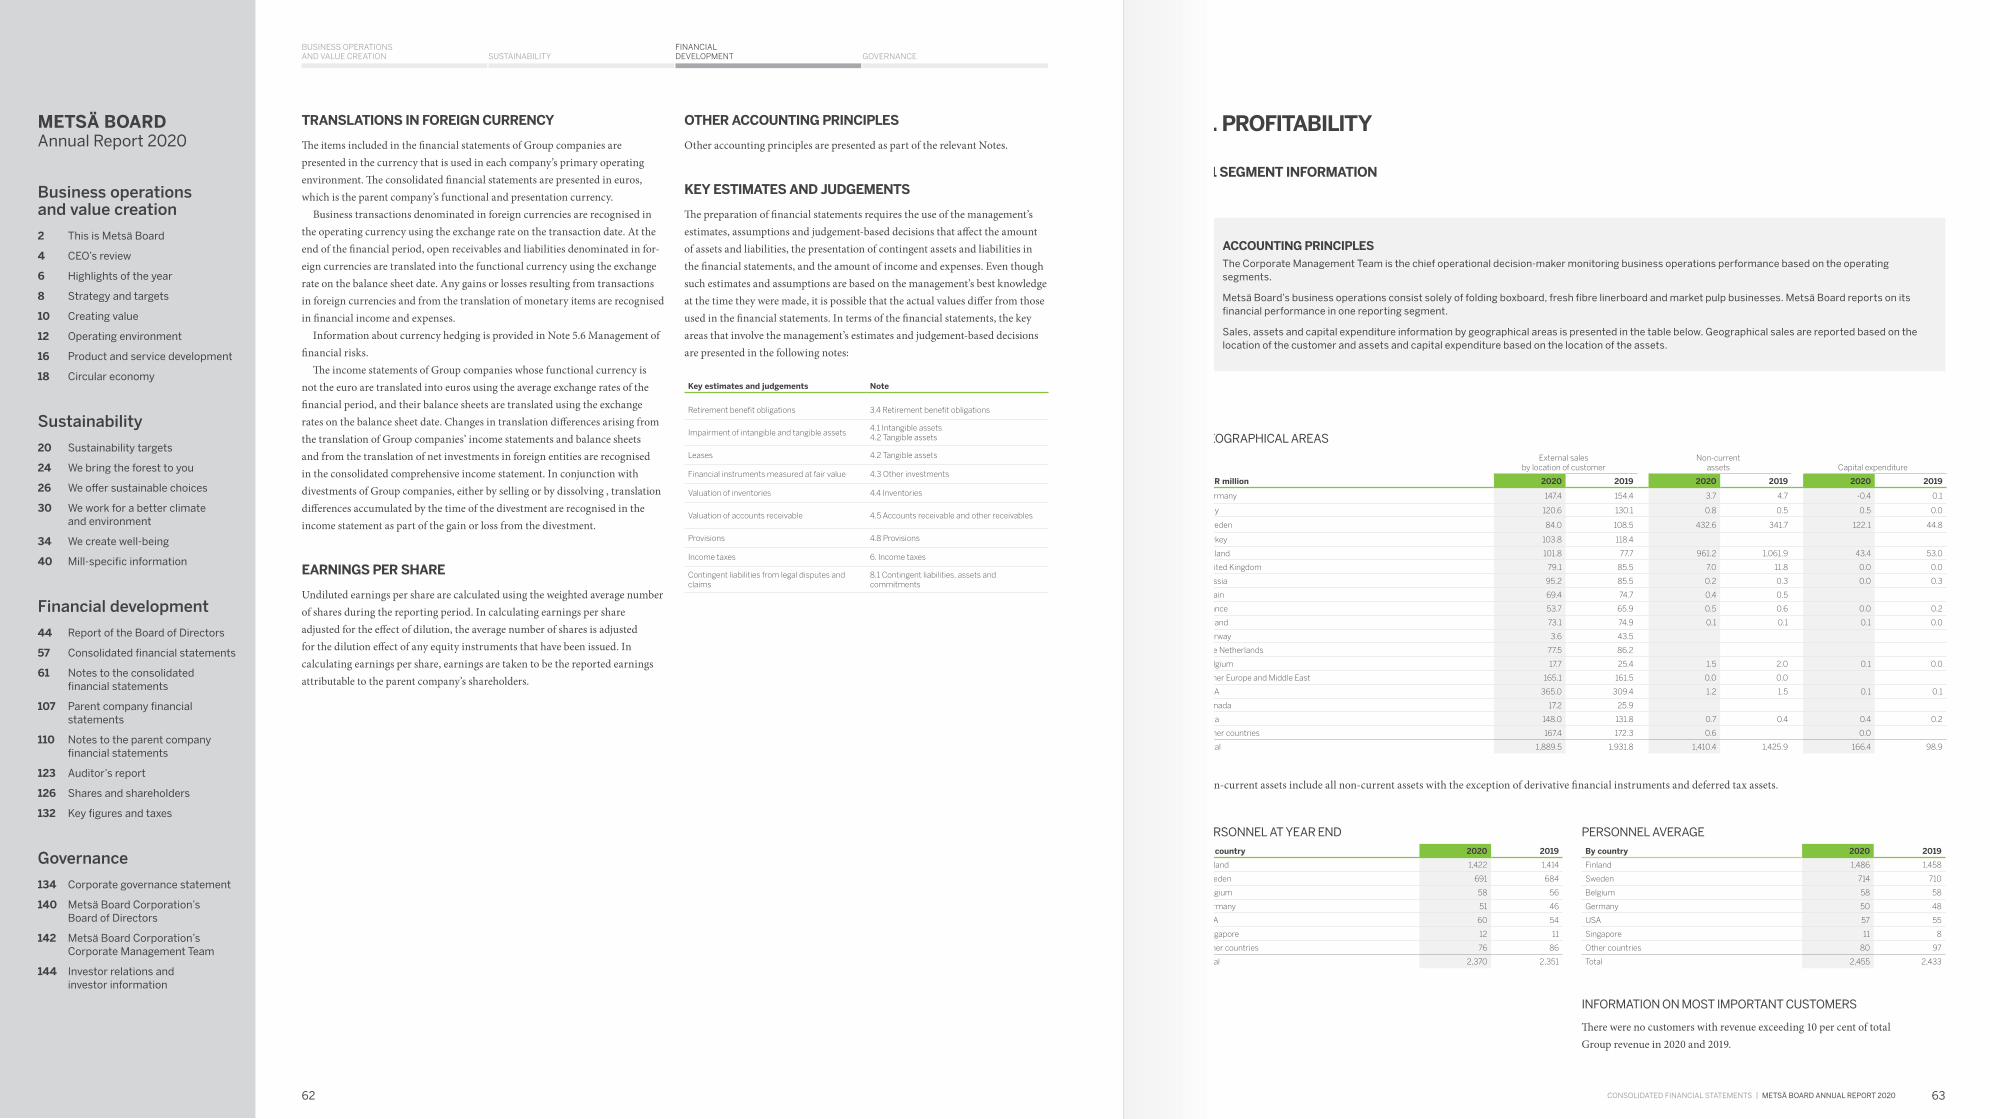
SUSTAINABILITYBUSINESS OPERATIONS AND VALUE CREATION GOVERNANCE
FINANCIAL DEVELOPMENT
CONSOLIDATED FINANCIAL STATEMENTS | METSÄ BOARD ANNUAL REPORT 2020
TRANSLATIONS IN FOREIGN CURRENCY
The items included in the financial statements of Group companies are presented in the currency that is used in each company’s primary operating environment. The consolidated financial statements are presented in euros, which is the parent company’s functional and presentation currency.
Business transactions denominated in foreign currencies are recognised in the operating currency using the exchange rate on the transaction date. At the end of the financial period, open receivables and liabilities denominated in for-eign currencies are translated into the functional currency using the exchange rate on the balance sheet date. Any gains or losses resulting from transactions in foreign currencies and from the translation of monetary items are recognised in financial income and expenses.
Information about currency hedging is provided in Note 5.6 Management of financial risks.
The income statements of Group companies whose functional currency is not the euro are translated into euros using the average exchange rates of the financial period, and their balance sheets are translated using the exchange rates on the balance sheet date. Changes in translation differences arising from the translation of Group companies’ income statements and balance sheets and from the translation of net investments in foreign entities are recognised in the consolidated comprehensive income statement. In conjunction with divestments of Group companies, either by selling or by dissolving , translation differences accumulated by the time of the divestment are recognised in the income statement as part of the gain or loss from the divestment.
EARNINGS PER SHARE
Undiluted earnings per share are calculated using the weighted average number of shares during the reporting period. In calculating earnings per share adjusted for the effect of dilution, the average number of shares is adjusted for the dilution effect of any equity instruments that have been issued. In calculating earnings per share, earnings are taken to be the reported earnings attributable to the parent company’s shareholders.
OTHER ACCOUNTING PRINCIPLES
Other accounting principles are presented as part of the relevant Notes.
KEY ESTIMATES AND JUDGEMENTS
The preparation of financial statements requires the use of the management’s estimates, assumptions and judgement-based decisions that affect the amount of assets and liabilities, the presentation of contingent assets and liabilities in the financial statements, and the amount of income and expenses. Even though such estimates and assumptions are based on the management’s best knowledge at the time they were made, it is possible that the actual values differ from those used in the financial statements. In terms of the financial statements, the key areas that involve the management’s estimates and judgement-based decisions are presented in the following notes:
Key estimates and judgements Note
Retirement benefit obligations 3.4 Retirement benefit obligations
Impairment of intangible and tangible assets4.1 Intangible assets4.2 Tangible assets
Leases 4.2 Tangible assets
Financial instruments measured at fair value 4.3 Other investments
Valuation of inventories 4.4 Inventories
Valuation of accounts receivable 4.5 Accounts receivable and other receivables
Provisions 4.8 Provisions
Income taxes 6. Income taxes
Contingent liabilities from legal disputes and claims
8.1 Contingent liabilities, assets and commitments
2. PROFITABILITY
2.1 SEGMENT INFORMATION
ACCOUNTING PRINCIPLESThe Corporate Management Team is the chief operational decision-maker monitoring business operations performance based on the operating segments.
Metsä Board’s business operations consist solely of folding boxboard, fresh fibre linerboard and market pulp businesses. Metsä Board reports on its financial performance in one reporting segment.
Sales, assets and capital expenditure information by geographical areas is presented in the table below. Geographical sales are reported based on the location of the customer and assets and capital expenditure based on the location of the assets.
PERSONNEL AT yEAR END
By country 2020 2019
Finland 1,422 1,414
Sweden 691 684
Belgium 58 56
Germany 51 46
USA 60 54
Singapore 12 11
Other countries 76 86
Total 2,370 2,351
PERSONNEL AvERAGE
By country 2020 2019
Finland 1,486 1,458
Sweden 714 710
Belgium 58 58
Germany 50 48
USA 57 55
Singapore 11 8
Other countries 80 97
Total 2,455 2,433
INFORMATION ON MOST IMPORTANT CUSTOMERS
There were no customers with revenue exceeding 10 per cent of total Group revenue in 2020 and 2019.
GEOGRAPHICAL AREAS
External sales by location of customer
Non-currentassets Capital expenditure
EUR million 2020 2019 2020 2019 2020 2019
Germany 147.4 154.4 3.7 4.7 -0.4 0.1
Italy 120.6 130.1 0.8 0.5 0.5 0.0
Sweden 84.0 108.5 432.6 341.7 122.1 44.8
Turkey 103.8 118.4
Finland 101.8 77.7 961.2 1,061.9 43.4 53.0
United Kingdom 79.1 85.5 7.0 11.8 0.0 0.0
Russia 95.2 85.5 0.2 0.3 0.0 0.3
Spain 69.4 74.7 0.4 0.5
France 53.7 65.9 0.5 0.6 0.0 0.2
Poland 73.1 74.9 0.1 0.1 0.1 0.0
Norway 3.6 43.5
The Netherlands 77.5 86.2
Belgium 17.7 25.4 1.5 2.0 0.1 0.0
Other Europe and Middle East 165.1 161.5 0.0 0.0
USA 365.0 309.4 1.2 1.5 0.1 0.1
Canada 17.2 25.9
Asia 148.0 131.8 0.7 0.4 0.4 0.2
Other countries 167.4 172.3 0.6 0.0
Total 1,889.5 1,931.8 1,410.4 1,425.9 166.4 98.9
Non-current assets include all non-current assets with the exception of derivative financial instruments and deferred tax assets.
6362
METSÄ BOARD Annual Report 2020
Business operations and value creation
2 This is Metsä Board
4 CEO’s review
6 Highlights of the year
8 Strategy and targets
10 Creating value
12 Operating environment
16 Product and service development
18 Circular economy
Sustainability
20 Sustainability targets
24 We bring the forest to you
26 We offer sustainable choices
30 We work for a better climate and environment
34 We create well-being
40 Mill-specific information
Financial development
44 Report of the Board of Directors
57 Consolidated financial statements
61 Notes to the consolidated financial statements
107 Parent company financial statements
110 Notes to the parent company financial statements
123 Auditor’s report
126 Shares and shareholders
132 Key figures and taxes
Governance
134 Corporate governance statement
140 Metsä Board Corporation’s Board of Directors
142 Metsä Board Corporation’s Corporate Management Team
144 Investor relations and investor information
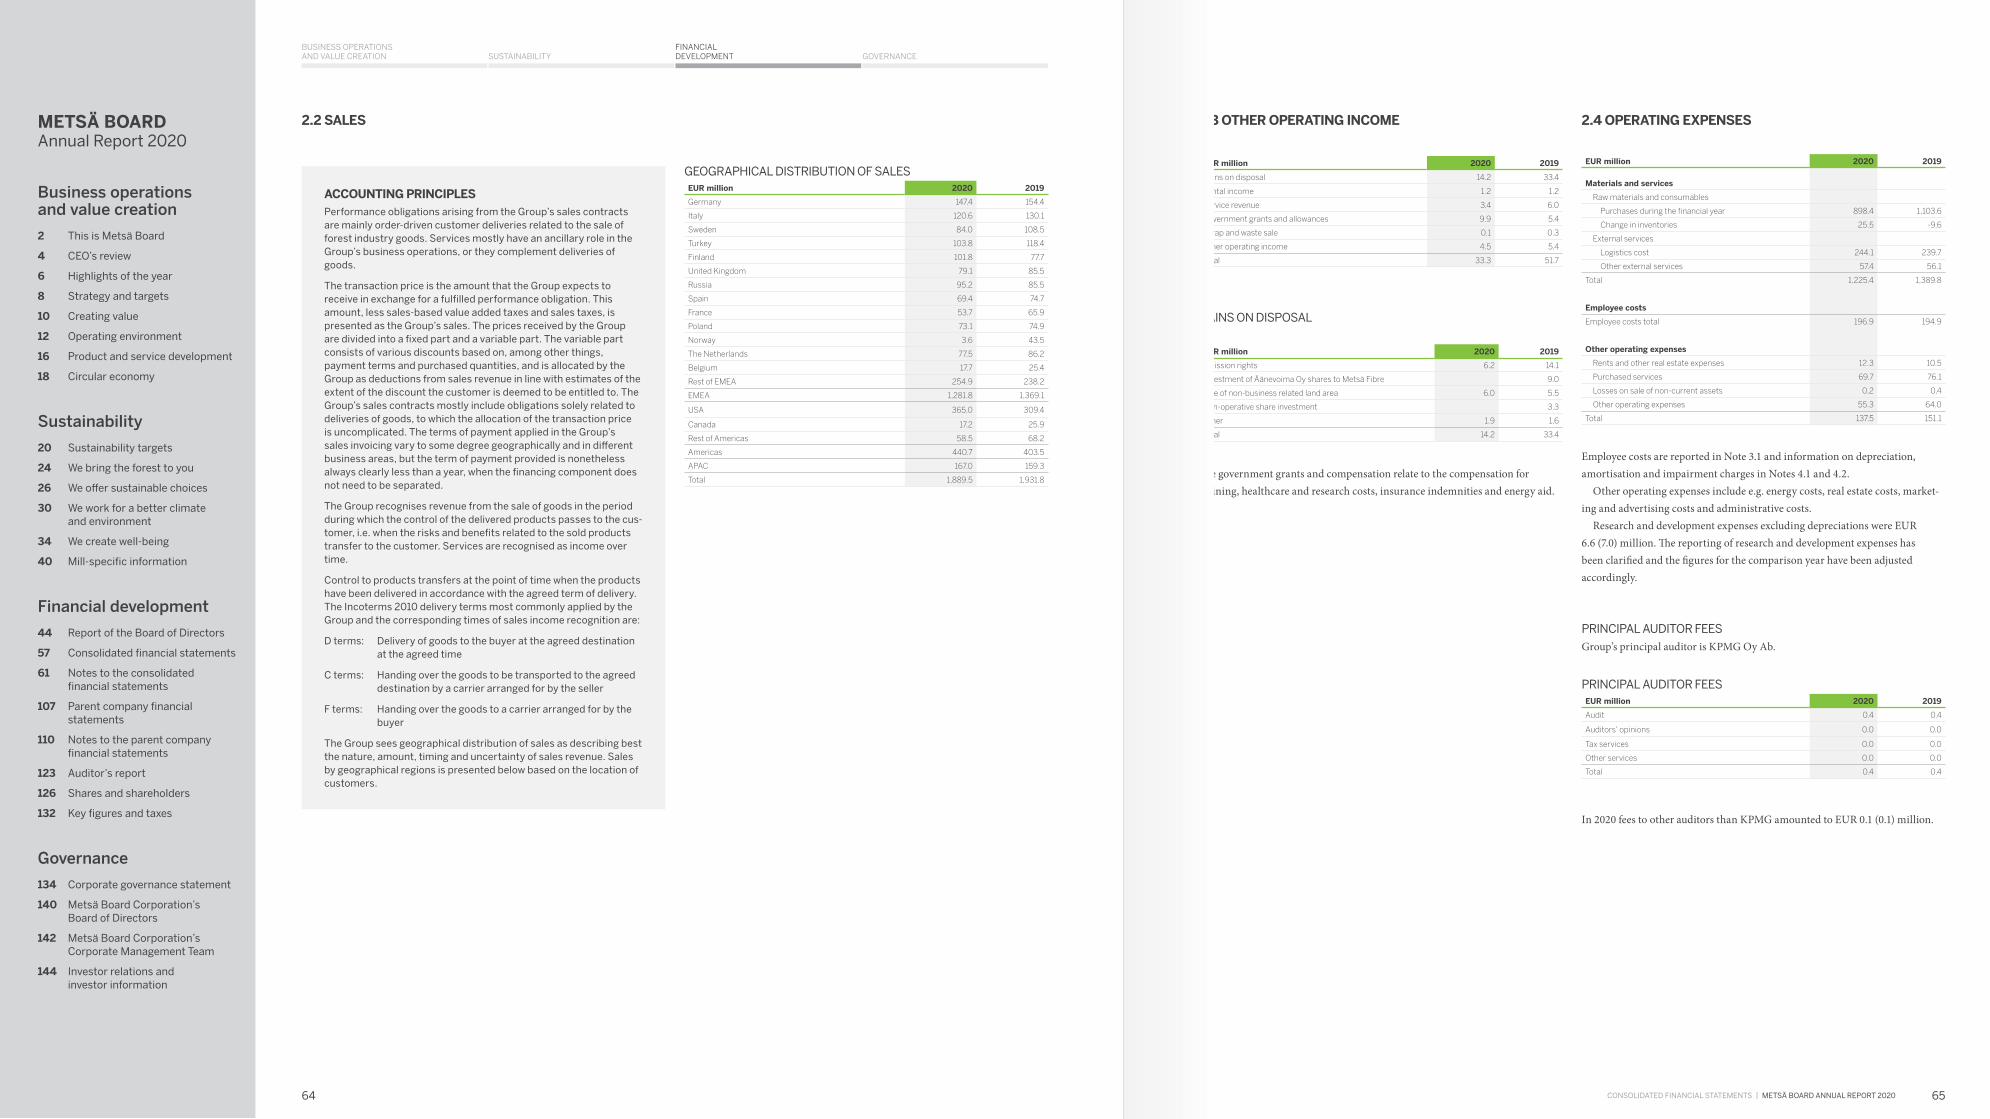
SUSTAINABILITYBUSINESS OPERATIONS AND VALUE CREATION GOVERNANCE
FINANCIAL DEVELOPMENT
CONSOLIDATED FINANCIAL STATEMENTS | METSÄ BOARD ANNUAL REPORT 2020
2.2 SALES
ACCOUNTING PRINCIPLESPerformance obligations arising from the Group’s sales contracts are mainly order-driven customer deliveries related to the sale of forest industry goods. Services mostly have an ancillary role in the Group’s business operations, or they complement deliveries of goods.
The transaction price is the amount that the Group expects to receive in exchange for a fulfilled performance obligation. This amount, less sales-based value added taxes and sales taxes, is presented as the Group’s sales. The prices received by the Group are divided into a fixed part and a variable part. The variable part consists of various discounts based on, among other things, payment terms and purchased quantities, and is allocated by the Group as deductions from sales revenue in line with estimates of the extent of the discount the customer is deemed to be entitled to. The Group’s sales contracts mostly include obligations solely related to deliveries of goods, to which the allocation of the transaction price is uncomplicated. The terms of payment applied in the Group’s sales invoicing vary to some degree geographically and in different business areas, but the term of payment provided is nonetheless always clearly less than a year, when the financing component does not need to be separated.
The Group recognises revenue from the sale of goods in the period during which the control of the delivered products passes to the cus-tomer, i.e. when the risks and benefits related to the sold products transfer to the customer. Services are recognised as income over time.
Control to products transfers at the point of time when the products have been delivered in accordance with the agreed term of delivery. The Incoterms 2010 delivery terms most commonly applied by the Group and the corresponding times of sales income recognition are:
D terms: Delivery of goods to the buyer at the agreed destination at the agreed time
C terms: Handing over the goods to be transported to the agreed destination by a carrier arranged for by the seller
F terms: Handing over the goods to a carrier arranged for by the buyer
The Group sees geographical distribution of sales as describing best the nature, amount, timing and uncertainty of sales revenue. Sales by geographical regions is presented below based on the location of customers.
GEOGRAPHICAL DISTRIBUTION OF SALESEUR million 2020 2019
Germany 147.4 154.4
Italy 120.6 130.1
Sweden 84.0 108.5
Turkey 103.8 118.4
Finland 101.8 77.7
United Kingdom 79.1 85.5
Russia 95.2 85.5
Spain 69.4 74.7
France 53.7 65.9
Poland 73.1 74.9
Norway 3.6 43.5
The Netherlands 77.5 86.2
Belgium 17.7 25.4
Rest of EMEA 254.9 238.2
EMEA 1,281.8 1,369.1
USA 365.0 309.4
Canada 17.2 25.9
Rest of Americas 58.5 68.2
Americas 440.7 403.5
APAC 167.0 159.3
Total 1,889.5 1,931.8
2.3 OTHER OPERATING INCOME
EUR million 2020 2019
Gains on disposal 14.2 33.4
Rental income 1.2 1.2
Service revenue 3.4 6.0
Government grants and allowances 9.9 5.4
Scrap and waste sale 0.1 0.3
Other operating income 4.5 5.4
Total 33.3 51.7
GAINS ON DISPOSAL
EUR million 2020 2019
Emission rights 6.2 14.1
Divestment of Äänevoima Oy shares to Metsä Fibre 9.0
Sale of non-business related land area 6.0 5.5
Non-operative share investment 3.3
Other 1.9 1.6
Total 14.2 33.4
The government grants and compensation relate to the compensation for training, healthcare and research costs, insurance indemnities and energy aid.
2.4 OPERATING EXPENSES
EUR million 2020 2019
Materials and services
Raw materials and consumables
Purchases during the financial year 898.4 1,103.6
Change in inventories 25.5 -9.6
External services
Logistics cost 244.1 239.7
Other external services 57.4 56.1
Total 1,225.4 1,389.8
Employee costs
Employee costs total 196.9 194.9
Other operating expenses
Rents and other real estate expenses 12.3 10.5
Purchased services 69.7 76.1
Losses on sale of non-current assets 0.2 0.4
Other operating expenses 55.3 64.0
Total 137.5 151.1
Employee costs are reported in Note 3.1 and information on depreciation, amortisation and impairment charges in Notes 4.1 and 4.2.
Other operating expenses include e.g. energy costs, real estate costs, market-ing and advertising costs and administrative costs.
Research and development expenses excluding depreciations were EUR 6.6 (7.0) million. The reporting of research and development expenses has been clarified and the figures for the comparison year have been adjusted accordingly.
PRINCIPAL AUDITOR FEESGroup’s principal auditor is KPMG Oy Ab.
PRINCIPAL AUDITOR FEESEUR million 2020 2019
Audit 0.4 0.4
Auditors' opinions 0.0 0.0
Tax services 0.0 0.0
Other services 0.0 0.0
Total 0.4 0.4
In 2020 fees to other auditors than KPMG amounted to EUR 0.1 (0.1) million.
6564
METSÄ BOARD Annual Report 2020
Business operations and value creation
2 This is Metsä Board
4 CEO’s review
6 Highlights of the year
8 Strategy and targets
10 Creating value
12 Operating environment
16 Product and service development
18 Circular economy
Sustainability
20 Sustainability targets
24 We bring the forest to you
26 We offer sustainable choices
30 We work for a better climate and environment
34 We create well-being
40 Mill-specific information
Financial development
44 Report of the Board of Directors
57 Consolidated financial statements
61 Notes to the consolidated financial statements
107 Parent company financial statements
110 Notes to the parent company financial statements
123 Auditor’s report
126 Shares and shareholders
132 Key figures and taxes
Governance
134 Corporate governance statement
140 Metsä Board Corporation’s Board of Directors
142 Metsä Board Corporation’s Corporate Management Team
144 Investor relations and investor information

SUSTAINABILITYBUSINESS OPERATIONS AND VALUE CREATION GOVERNANCE
FINANCIAL DEVELOPMENT
CONSOLIDATED FINANCIAL STATEMENTS | METSÄ BOARD ANNUAL REPORT 2020
3. REMUNERATION
3.1 EMPLOYEE COSTS
EUR million 2020 2019
Wages and salaries 123.1 123.4
Share-based payments 1.4 1.7
Social security costs
Pension costs
Defined benefit plans 0.3 0.4
Defined contribution plans 18.7 24.6
Other social security costs 53.5 44.9
Social security costs total 72.5 69.8
Employee costs total 196.9 194.9
3.2 THE MANAGEMENT’S SALARIES, REMUNERATION AND PENSION EXPENSES
Key management includes members of the Board of Directors as well as Corporate Management Team.
THE MANAGEMENT’S SALARIES, REMUNERATION AND PENSION EXPENSESEUR 2020 2019
Salaries and other remuneration 1,820,308.99 2,208,039.91
Share-based payments (long-term remuneration) 2,449,410.62 2,398,896.71
Pension costs
Defined benefit plans 476,611.79 538,994.91
Defined contribution plans 191,951.86 262,578.06
Total 4,938,283.26 5,408,509.59
REMUNERATION PAID TO THE MEMBERS OF THE BOARD OF DIRECTORS OF THE PARENT COMPANy AND THEIR SHAREHOLDING
Shareholding shares
2020 Renumeration
EUR
2019 Renumeration
EUR
2020 Defined
contributionEUR
2019 Defined
contribution EUR
Ilkka Hämälä, chairman 337,648 109,060 106,260 14,784 17,249
Martti Asunta, Vice chairman (until 11 June 2020) 7,700 91,140 1,268 16,154
Jussi Linnaranta, Vice chairman (from 11 June 2020) 20,939 93,940 73,500 14,151 13,031
Hannu Anttila 140,619 77,000 74,200 11,622 13,155
Kirsi Komi 78,287 77,000 74,200 10,475 12,050
Kai Korhonen 215,057 86,600 83,800 14,869
Liisa Leino 182,932 76,300 73,500 10,380 11,936
Jukka Moisio (from 11 June 2020) 5,275 68,600 9,228
Juha Niemelä (until 11 June 2020) 7,700 73,500
Timo Saukkonen (from 11 June 2020) 9,875 68,600 9,228
Veli Sundbäck 67,952 76,300 74,200
Total 1,058,584 748,800 724,300 81,135 98,444
Metsä Board’s Annual General Meeting 2020 decided, that about one half of the remuneration will be paid in cash while the other half is paid in company’s B shares. Remuneration of Corporate Management Team consists of fixed monthly salary, annual bonus determined by each Team member position pension benefits and
share based incentive schemes. In addition the CEO has a pension benefit.The monthly salary of CEO Mika Joukio is EUR 40,576. The salary includes car and phone benefits and extended insurance cover for travel and accidents. Until
2018, the CEO could, based on a decision by the Board and overall performance, be paid an annual bonus equal to a maximum of 58,33 % of fixed annual salary. In 2019, the remuneration possibility of the CEO’s short-term remuneration scheme was, at the target level, 30%, and at the maximum level, 75% of the fixed annual salary.
Until 2018, the members of Corporate Management Team could, based on a decision by the Board and overall performance, be paid an annual bonus equal to a maximum of 50 % of fixed annual salary. In 2019, the remuneration possibility of the Corporate Management Team’s short-term remuneration scheme was, at the target level, 20% or 25%, and at the maximum level, 50% or 62,5% of the fixed annual salary.
The Board approves the forms and basis of the compensation systems as well as the measures and targets applied. The potential rewards are based on the achievement of the company’s financial and strategic goals as well as personal goals.
Share based incentive schemes and the shareholding programme for Corpo-rate Management Team are presented in Note 3.3.
The CEO’s mutual term of notice is six months. In case the CEO contract is terminated by the Board of Directors, the CEO is entitled to receive discharge compensation equal to his 12-month salary.
The period of notice for other members of Corporate Management Team is six months. Corporate Management Team members are entitled to additional severance compensation of six month salary in case of employment termination on grounds not related to the affected Management Team member.
The CEO is covered by statutory employee pension scheme. This offers pen-sion benefits based on term of service and renumeration earned as prescribed in applicable legislation. Through supplementary pension arrangements, the CEO is entitled to retire at the age of 62 years. His pension will be equal to 60 per cent of his salary at the time of retirement calculated in accordance with Finnish pension legislation and based on the calculation period of five years immediately preceding retirement. In case the CEO’s contract is terminated prior to retirement, the pension earned by the CEO becomes vested.
Excluding the CEO, the Corporate Management Team members have no pension arrangements differing from statutory pensions. Corporate Manage-ment Team members are covered by statutory employee pension scheme. This offers pension benefits based on term of service and renumeration earned as
1) Basic salary includes a company phone and car benefit, extended healthcare, travel and accident insurance.2) The 2020 payment concerns performance in 2019; the 2019 payment concerns performance in 2018.3) 2020: earning period 2017–2019; 2019: earning period 2016–2018.4) Delayed long-term rewards were paid EUR 658 981 in accordance with the conditions of payment in 2020 and total of EUR 625 703 in 2019. The payment 2019 also includes long-term rewards delayed
in 2017. 5) Delayed long-term rewards were paid EUR 445 620 in accordance with the conditions of payment in 2020 and total of EUR 527 526 in 2019. The payment 2019 also includes long-term rewards
delayed in 2017.
SALARIES AND REMUNERATION PAID TO THE CEO AND OTHER MEMBERS OF THE CORPORATE MANAGEMENT TEAM
EUR2020CEO
2019CEO
2020 Other
Management Team
2019 Other
Management Team
Salaries and remuneration
Basic salary including fringe benefits 1) 511,158 511,552 1,119,875 1,116,592
Short-term performance bonus 2) 64,903 218,168 124,372 361,728
Long-term share-based incentive 3) 572,876 604,104 771,934 641,564
Deferred long-term share-based incentive 4) 5) 658,981 625,703 445,620 527,526
Total 1,807,918 1,959,527 2,461,802 2,647,410
Pension Costs
Supplemental defined benefit pension plan 476,612 538,995
Contribution-based statutory arrangement 52,856 77,496 139,095 185,082
Total 529,468 616,491 139,095 185,082
Salaries and remuneration as well as pension costs in total 2,337,386 2,576,018 2,600,897 2,832,492
prescribed in applicable legislation. The Group has no off balance sheet pension liabilities on behalf of management.
Key management had any loans outstanding from the company or its subsid-iares and there were no guarantees given on behalf of key management.
3.3 SHARE-BASED PAYMENTS
ACCOUNTING PRINCIPLESShare-based incentive programmes in which the payments are made with equity instruments and cash have been established for the company’s top executives. The Group’s share-based incentive schemes have been treated in full as arrangements settled in shares. The incentives granted are measured at fair value on the grant date, and recognised as expenses in the income statement and equity evenly over the vesting period.
The effect on profit of the incentive programmes is presented under employee costs.
During the review period, Metsä Board had four active share-based incentive schemes: Share incentive scheme 2014, which company Board of Directors decided to adopt on 6 February 2014, Performance based share incentive scheme 2017–2021 and Retentive share incentive scheme, both of which the company Board of Directors decided to adopt on 10 January 2017 and Performance based share incentive scheme 2020–2024 which the company Board of Directors decided to adopt on 12 December 2019, as part of company’s incentive and key personnel retention programme.
6766
METSÄ BOARD Annual Report 2020
Business operations and value creation
2 This is Metsä Board
4 CEO’s review
6 Highlights of the year
8 Strategy and targets
10 Creating value
12 Operating environment
16 Product and service development
18 Circular economy
Sustainability
20 Sustainability targets
24 We bring the forest to you
26 We offer sustainable choices
30 We work for a better climate and environment
34 We create well-being
40 Mill-specific information
Financial development
44 Report of the Board of Directors
57 Consolidated financial statements
61 Notes to the consolidated financial statements
107 Parent company financial statements
110 Notes to the parent company financial statements
123 Auditor’s report
126 Shares and shareholders
132 Key figures and taxes
Governance
134 Corporate governance statement
140 Metsä Board Corporation’s Board of Directors
142 Metsä Board Corporation’s Corporate Management Team
144 Investor relations and investor information

SUSTAINABILITYBUSINESS OPERATIONS AND VALUE CREATION GOVERNANCE
FINANCIAL DEVELOPMENT
CONSOLIDATED FINANCIAL STATEMENTS | METSÄ BOARD ANNUAL REPORT 2020
31 Dec 2020 2014–2016 2015–2017 2016–2018 Total
Key characteristics
Shares allocated to the scheme, shares 427,500 427,500 266,250 1,121,250
Grant date(s)17.3.2014, 10.6.2014,
1.11.2016
27.2.2015, 1.11.2016
18.4.2016, 1.11.2016,
7.9.2017
CriteriaEquity ratio, ROCE, EBIT
multiplierEquity ratio, ROCE, EBIT
multiplierEquity ratio, ROCE, EBIT
Personnel (31 December 2020) 2
Factors used to determine fair value (EUR) 1)
Share price at grant date 3.37 5.85 5.60
Share fair value at grant date 2.90 5.12 4.94
Annual dividend assumption in fair value measurement 0.10 0.14 0.22
Share price at payment date / balance sheet date 6.31 7.46 5.98
Fair value on balance sheet date 0
Effect on result and financial position (EUR)
Expense in 2020, share-based payments settled as equity 0 0 302,391 302,391
Share-based payments settled in cash, unpaid part, estimate 0 308,801 0 308,801
Number of shares 1 January 2020 2)
Outstanding at the beginning of the period 0 0 131,792 131,792
Changes during the year
Shares granted 0 0 0 0
Shares forfeited 0 0 0 0
Shares exercised 0 0 0 0
Shares expired 0 0 131,792 131,792
Number of shares 31 December 2020
Outstanding at the end of the period 0 0 0 0
and tax-like payments arising from the reward at the time of the transfer of the shares.
The company changed the terms of the scheme during 2016 so that for incen-tive periods 2014–2016 and 2015–2017 a cap was set for total employee com-pensation, including the share incentive paid, based on each plan participant’s salary. The part of earned incentive exceeding the cap is deferred and paid in full in cash in coming years when allowed by the cap. Starting from vesting period 2016–2018, a salary based cap was set with the effect of cutting the part of share incentive exceeding the cap and resulting in the forfeiture of the excess part of the incentive. On balance sheet date, the deferred compensation for periods 2014–2016 and 2015–2017 reflects the value of deferred compensation and interest accrued thereon to be paid later when the employment criterion is fulfilled
RETENTIvE SHARE INCENTIvE SCHEME 2017–2021The scheme offers the participants the possibility to be awarded Metsä Board Corporation’s B shares, provided that the participant’s employment contract remains in force and continues to do so until the end of the retention period. The scheme has retention periods of 12–36 months. As a rule, the incentive is forfeited, if the participant’s employment is terminated during the retention period.
Key characteristics of Share incentive scheme 2014 are summarised in the table below:
Key characteristics of Performance based share incentive scheme and Retentive share incentive scheme 2017–2021 are summarised in the table below:
Performance based share incentive scheme
2017–2021
Retentive share incentive scheme
2017–2021
31 Dec 2020 2017–2019 2018–2020 2019–2021 2018–2020 Total
Key characteristics
Shares allocated to the scheme, shares 269,167 275,278 280,694 10,000 835,139
Grant date(s)
6.4.2017, 7.9.2017
9.4.2018, 25.9.2018
2.4.2019, 13.6.2019, 12.8.2019
25.9.2018
CriteriaEquity ratio,
ROCE ja EBITEquity ratio,
ROCE ja EBITEquity ratio,
ROCE ja EBITEmployment requirement
Personnel (31 December 2020) 26
Factors used to determine fair value (EUR) 1)
Share price at grant date 6.37 8.64 5.82 8.65
Share fair value at grant date 5.92 7.84 5.20 8.12
Annual dividend assumption in fair value measurement 0.23 0.27 0.31 0.27
Share price at payment date / balance sheet date 4.86 8.62 8.62 7.14
Fair value on balance sheet date 2,285,099 2,295,909 429 336 5,010,344
Effect on result and financial position (EUR)
Expense in 2020, share-based payments settled as equity 494,236 329,838 95,199 81,587 1,000,859
Share-based payments settled in cash, unpaid part, estimate 1,193,440 338,742 1,532,181
Number of shares 1 January 2020 2)
Outstanding at the beginning of the period 244,724 256,389 280,694 10,000 791,807
Changes during the year
Shares granted
Shares forfeited
Shares exercised 10,000 10,000
Shares expired 61,037 61,037
Number of shares 31 December 2020
Outstanding at the end of the period 183,687 256,389 280,694 720,770
The effect on consolidated income statement of share-based incentive schemes amounted to EUR 1,404,744 in 2020 (2019: EUR 1,719,419).
SHARE INCENTIvE SCHEME 2014, PERFORMANCE BASED SHARE INCENTIvE SCHEME 2017–2021 AND PERFORMANCE BASED SHARE INCENTIvE SCHEME 2020-2024The schemes offer the participants the possibility to be awarded Metsä Board Corporation’s B shares for achieving set goals for three-year periods. Incentive periods are the calendar years 2014–2016, 2015–2017, 2016–2018, 2017–2019, 2018–2020, 2019–2021, 2020-2022, 2021-2023 and 2022-2024. The bonus awarded under the share incentive scheme 2014 and performance based share incentive plan 2017-2021 is determined by achievement of the set goals and paid in March following the incentive period. In addition to shares, the bonus includes a cash component, which is used to cover taxes and tax-like charges incurred by plan participants due to the bonus. The number of shares allocated under the performance share plan 2020-2024 includes both the share and the cash portion. Accordingly, the reward is paid partly in shares and partly in cash and the cash portion is intended to cover taxes and tax-like payments. The bonus is not paid if the person’s employment ends before the end of the earning period. In addition, the scheme includes a two-year commitment period. If the key employee’s employment ends during the commitment period, the key per-son must, as a rule, return the delivered shares to the Company free of charge.
Based on the fulfillment of the criteria for the earning period 2017-2019, 183 687 Metsä Board Oyj B shares and a cash contribution were paid to cover taxes
6968
METSÄ BOARD Annual Report 2020
Business operations and value creation
2 This is Metsä Board
4 CEO’s review
6 Highlights of the year
8 Strategy and targets
10 Creating value
12 Operating environment
16 Product and service development
18 Circular economy
Sustainability
20 Sustainability targets
24 We bring the forest to you
26 We offer sustainable choices
30 We work for a better climate and environment
34 We create well-being
40 Mill-specific information
Financial development
44 Report of the Board of Directors
57 Consolidated financial statements
61 Notes to the consolidated financial statements
107 Parent company financial statements
110 Notes to the parent company financial statements
123 Auditor’s report
126 Shares and shareholders
132 Key figures and taxes
Governance
134 Corporate governance statement
140 Metsä Board Corporation’s Board of Directors
142 Metsä Board Corporation’s Corporate Management Team
144 Investor relations and investor information
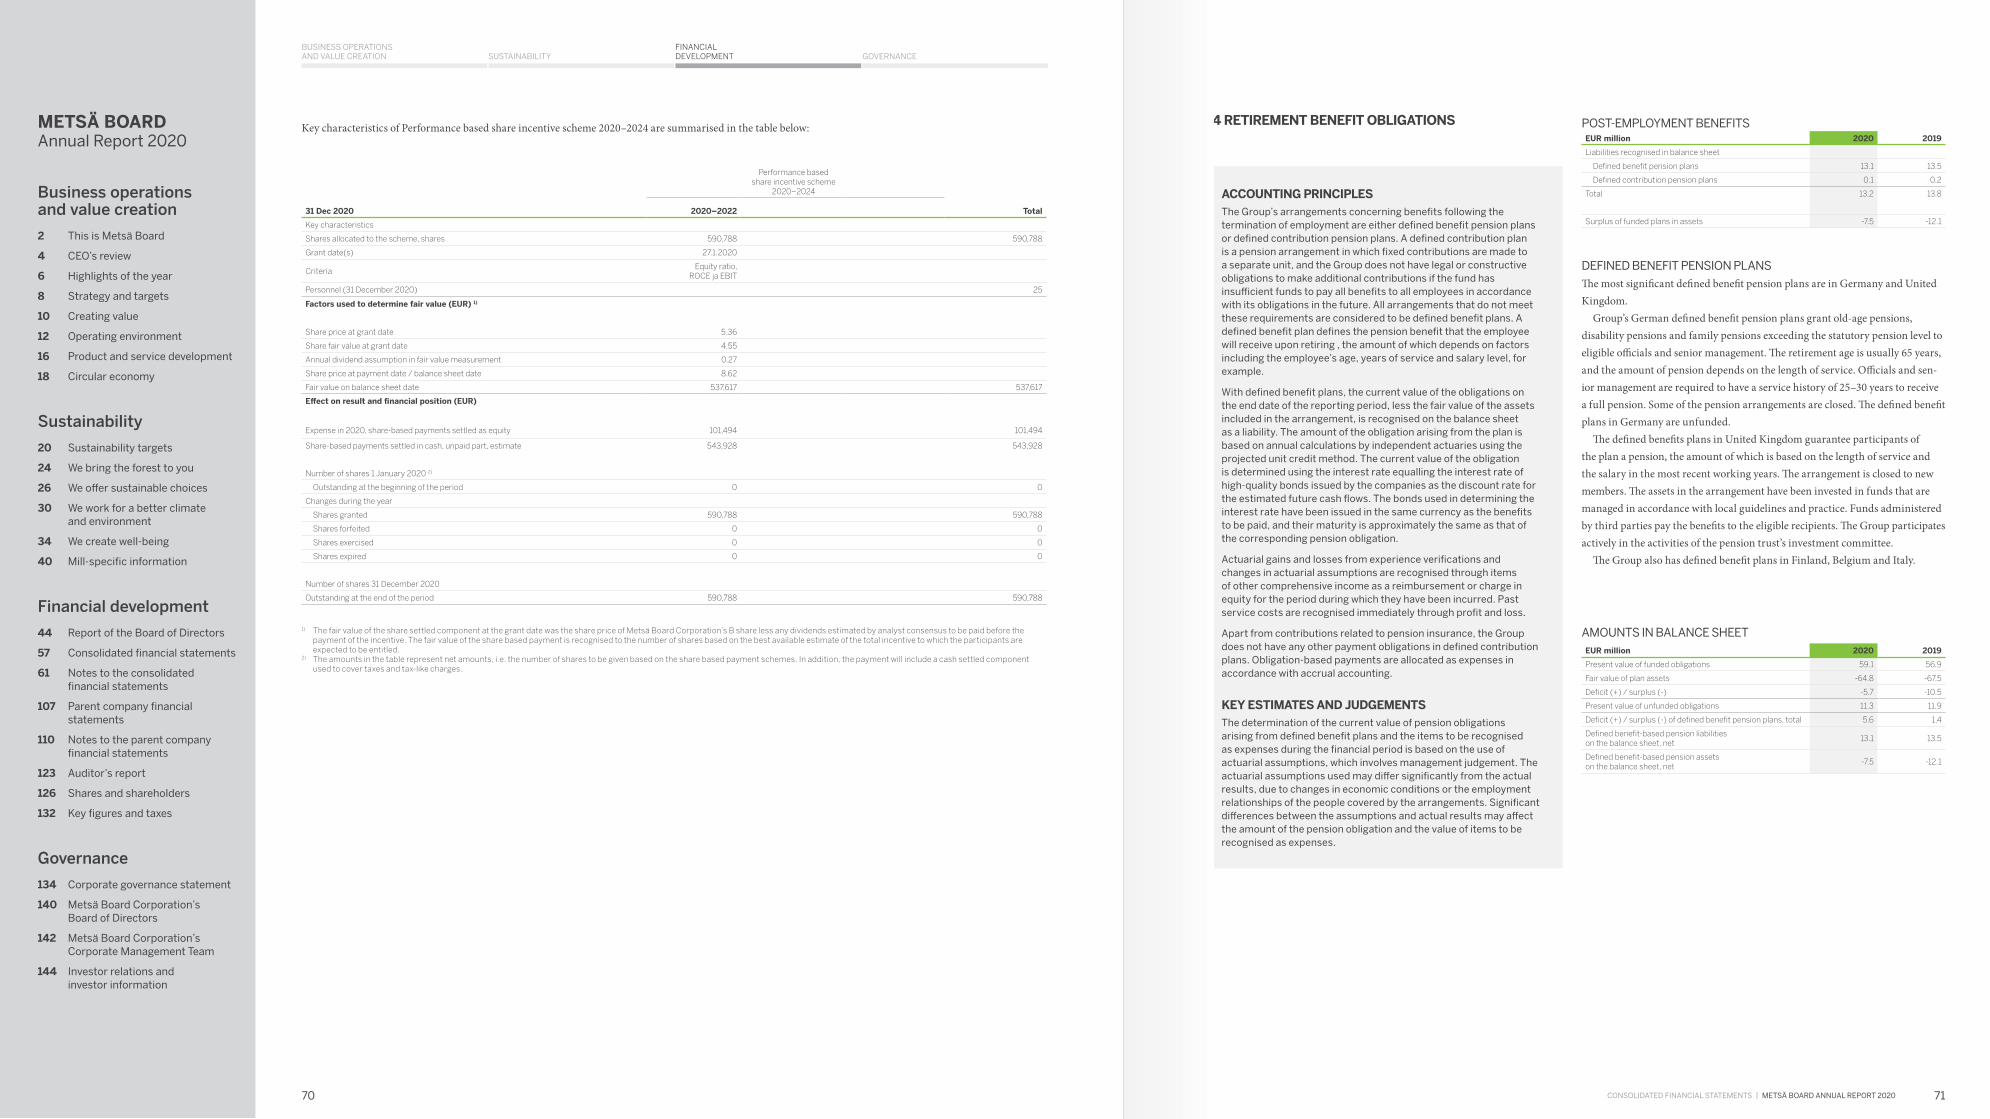
SUSTAINABILITYBUSINESS OPERATIONS AND VALUE CREATION GOVERNANCE
FINANCIAL DEVELOPMENT
CONSOLIDATED FINANCIAL STATEMENTS | METSÄ BOARD ANNUAL REPORT 2020
Key characteristics of Performance based share incentive scheme 2020–2024 are summarised in the table below:
Performance based share incentive scheme
2020–2024
31 Dec 2020 2020–2022 Total
Key characteristics
Shares allocated to the scheme, shares 590,788 590,788
Grant date(s) 27.1.2020
CriteriaEquity ratio,
ROCE ja EBIT
Personnel (31 December 2020) 25
Factors used to determine fair value (EUR) 1)
Share price at grant date 5.36
Share fair value at grant date 4.55
Annual dividend assumption in fair value measurement 0.27
Share price at payment date / balance sheet date 8.62
Fair value on balance sheet date 537,617 537,617
Effect on result and financial position (EUR)
Expense in 2020, share-based payments settled as equity 101,494 101,494
Share-based payments settled in cash, unpaid part, estimate 543,928 543,928
Number of shares 1 January 2020 2)
Outstanding at the beginning of the period 0 0
Changes during the year
Shares granted 590,788 590,788
Shares forfeited 0 0
Shares exercised 0 0
Shares expired 0 0
Number of shares 31 December 2020
Outstanding at the end of the period 590,788 590,788
1) The fair value of the share settled component at the grant date was the share price of Metsä Board Corporation’s B share less any dividends estimated by analyst consensus to be paid before the payment of the incentive. The fair value of the share based payment is recognised to the number of shares based on the best available estimate of the total incentive to which the participants are expected to be entitled.
2) The amounts in the table represent net amounts, i.e. the number of shares to be given based on the share based payment schemes. In addition, the payment will include a cash settled component used to cover taxes and tax-like charges.
3.4 RETIREMENT BENEFIT OBLIGATIONS
ACCOUNTING PRINCIPLESThe Group’s arrangements concerning benefits following the termination of employment are either defined benefit pension plans or defined contribution pension plans. A defined contribution plan is a pension arrangement in which fixed contributions are made to a separate unit, and the Group does not have legal or constructive obligations to make additional contributions if the fund has insufficient funds to pay all benefits to all employees in accordance with its obligations in the future. All arrangements that do not meet these requirements are considered to be defined benefit plans. A defined benefit plan defines the pension benefit that the employee will receive upon retiring , the amount of which depends on factors including the employee’s age, years of service and salary level, for example.
With defined benefit plans, the current value of the obligations on the end date of the reporting period, less the fair value of the assets included in the arrangement, is recognised on the balance sheet as a liability. The amount of the obligation arising from the plan is based on annual calculations by independent actuaries using the projected unit credit method. The current value of the obligation is determined using the interest rate equalling the interest rate of high-quality bonds issued by the companies as the discount rate for the estimated future cash flows. The bonds used in determining the interest rate have been issued in the same currency as the benefits to be paid, and their maturity is approximately the same as that of the corresponding pension obligation.
Actuarial gains and losses from experience verifications and changes in actuarial assumptions are recognised through items of other comprehensive income as a reimbursement or charge in equity for the period during which they have been incurred. Past service costs are recognised immediately through profit and loss.
Apart from contributions related to pension insurance, the Group does not have any other payment obligations in defined contribution plans. Obligation-based payments are allocated as expenses in accordance with accrual accounting.
KEY ESTIMATES AND JUDGEMENTSThe determination of the current value of pension obligations arising from defined benefit plans and the items to be recognised as expenses during the financial period is based on the use of actuarial assumptions, which involves management judgement. The actuarial assumptions used may differ significantly from the actual results, due to changes in economic conditions or the employment relationships of the people covered by the arrangements. Significant differences between the assumptions and actual results may affect the amount of the pension obligation and the value of items to be recognised as expenses.
POST-EMPLOyMENT BENEFITSEUR million 2020 2019
Liabilities recognised in balance sheet
Defined benefit pension plans 13.1 13.5
Defined contribution pension plans 0.1 0.2
Total 13.2 13.8
Surplus of funded plans in assets -7.5 -12.1
DEFINED BENEFIT PENSION PLANSThe most significant defined benefit pension plans are in Germany and United Kingdom.
Group’s German defined benefit pension plans grant old-age pensions, disability pensions and family pensions exceeding the statutory pension level to eligible officials and senior management. The retirement age is usually 65 years, and the amount of pension depends on the length of service. Officials and sen-ior management are required to have a service history of 25–30 years to receive a full pension. Some of the pension arrangements are closed. The defined benefit plans in Germany are unfunded.
The defined benefits plans in United Kingdom guarantee participants of the plan a pension, the amount of which is based on the length of service and the salary in the most recent working years. The arrangement is closed to new members. The assets in the arrangement have been invested in funds that are managed in accordance with local guidelines and practice. Funds administered by third parties pay the benefits to the eligible recipients. The Group participates actively in the activities of the pension trust’s investment committee.
The Group also has defined benefit plans in Finland, Belgium and Italy.
AMOUNTS IN BALANCE SHEETEUR million 2020 2019
Present value of funded obligations 59.1 56.9
Fair value of plan assets -64.8 -67.5
Deficit (+) / surplus (-) -5.7 -10.5
Present value of unfunded obligations 11.3 11.9
Deficit (+) / surplus (-) of defined benefit pension plans, total 5.6 1.4
Defined benefit-based pension liabilities on the balance sheet, net
13.1 13.5
Defined benefit-based pension assets on the balance sheet, net
-7.5 -12.1
7170
METSÄ BOARD Annual Report 2020
Business operations and value creation
2 This is Metsä Board
4 CEO’s review
6 Highlights of the year
8 Strategy and targets
10 Creating value
12 Operating environment
16 Product and service development
18 Circular economy
Sustainability
20 Sustainability targets
24 We bring the forest to you
26 We offer sustainable choices
30 We work for a better climate and environment
34 We create well-being
40 Mill-specific information
Financial development
44 Report of the Board of Directors
57 Consolidated financial statements
61 Notes to the consolidated financial statements
107 Parent company financial statements
110 Notes to the parent company financial statements
123 Auditor’s report
126 Shares and shareholders
132 Key figures and taxes
Governance
134 Corporate governance statement
140 Metsä Board Corporation’s Board of Directors
142 Metsä Board Corporation’s Corporate Management Team
144 Investor relations and investor information

SUSTAINABILITYBUSINESS OPERATIONS AND VALUE CREATION GOVERNANCE
FINANCIAL DEVELOPMENT
CONSOLIDATED FINANCIAL STATEMENTS | METSÄ BOARD ANNUAL REPORT 2020
CHANGE IN DEFINED BENEFIT PENSION OBLIGATIONS IN 2019
EUR million
Present value of
obligationFair value of plan assets Total
1 Jan 2019 57.4 -60.8 -3.3
Current service cost 0.4 0.4
Administrative costs 0.0 0.0
Interest expense (+) or interest income (-) 1.4 -1.7 -0.3
Past service cost
Total amount recognised in profit and loss 1.8 -1.7 0.1
Remeasurements in other comprehensive income
Return on plan assets, excluding amounts included in interest income or expense
-7.2 -7.2
Gains (-) and losses (+) from change in demographic assumptions
-0.8 -0.8
Gains (-) and losses (+) from change in financial assumptions
9.4 9.4
Experience gains (-) and losses (+) 2.3 2.3
Total remeasurements in other comprehensive income 10.9 -7.2 3.7
Translation differences 1.7 -2.3 -0.7
Contributions
Employers 2.2 2.2
Plan participants 0.0 0.0 0.0
Payments from plans
Benefit payments -2.9 2.3 -0.6
Settlements
31 Dec 2019 68.9 -67.5 1.4
CHANGE IN DEFINED BENEFIT PENSION OBLIGATIONS IN 2020
EUR million
Present value of
obligationFair value of plan assets Total
1 Jan 2020 68.9 -67.5 1.4
Current service cost 0.3 0.3
Administrative costs
Interest expense (+) or interest income (-) 1.0 -1.1 -0.1
Past service cost
Total amount recognised in profit and loss 1.4 -1.1 0.2
Remeasurements in other comprehensive income
Return on plan assets, excluding amounts included in interest income or expense
-0.6 -0.6
Gains (-) and losses (+) from change in demographic assumptions
0.2 0.2
Gains (-) and losses (+) from change in financial assumptions
6.9 6.9
Experience gains (-) and losses (+) -2.3 -2.3
Total remeasurements in other comprehensive income 4.7 -0.6 4.2
Translation differences -2.3 2.9 0.6
Contributions
Employers -0.3 -0.3
Plan participants 0.0 0.0 0.0
Payments from plans
Benefit payments -2.3 1.8 -0.6
Settlements
31 Dec 2020 70.4 -64.8 5.6
DEFINED BENEFIT PENSION OBLIGATION AND PLAN ASSETS By COUNTRy IN 2020EUR million Germany United Kingdom Finland Other countries Total
Present value of obligation 10.4 44.5 11.4 4.1 70.4
Fair value of plan assets -51.5 -11.3 -2.1 -64.8
Total 10.4 -6.9 0.2 1.9 5.6
DEFINED BENEFIT PENSION OBLIGATION AND PLAN ASSETS By COUNTRy IN 2019EUR million Germany United Kingdom Finland Other countries Total
Present value of obligation 11.0 42.0 12.4 3.5 68.9
Fair value of plan assets -53.7 -11.9 -1.9 -67.5
Total 11.0 -11.7 0.5 1.6 1.4
SIGNIFICANT ACTUARIAL ASSUMPTIONS 2020Germany United Kingdom Finland Belgium
Discount rate, % 0.74 1.20 0.38 0.30
Salary growth rate, % 3.00 2.30 0.00 1.00
Pension growth rate, % 1.74 3.10 1.40 1.70
SIGNIFICANT ACTUARIAL ASSUMPTIONS 2019Germany United Kingdom Finland Belgium
Discount rate, % 0.82 2.00 0.56 1.50
Salary growth rate, % 3.00 2.10 0.00 1.00
Pension growth rate, % 1.75 3.10 1.37 1.50
SENSITIvITy OF BENEFIT OBLIGATION TO CHANGES IN ESSENTIAL WEIGHTED ASSUMPTIONS 2020
Impact on benefit obligation
Change of assumption Increase Decrease
Discount rate 0.5%-points 6.9% decrease 7.2% increase
Salary growth rate 0.5%-points 0.2% increase 0.2% decrease
Pension growth rate 0.5%-points 5.7% increase 5.5% decrease
One year increase in assumption
One year decrease in assumption
Life expectancy 3.6% increase 3.6% decrease
The aforementioned sensitivity analyses are based on a situation where all other assumptions remain unchanged when one assumption changes. The sensitivity of a defined benefit obligation to changes in significant actuarial assumptions has been calculated using the same method as is used in calculating the pension obligation entered in the balance sheet.
PLAN ASSETS ARE COMPRISED AS FOLLOWS:2020
EUR million2020
%2019
EUR million2019
%
Qualifying insurance policies 2.1 3% 1.9 3%
Cash and cash equivalents 0.2 0% 0.1 0%
Investment funds 51.3 79% 53.6 79%
Funds held by Insurance company 11.3 17% 11.9 18%
Total 64.8 100% 67.5 100%
The most considerable risks related to Defined benefit plans are as follows:
vOLATILITy OF ASSETSThe Group works to reduce investment risk by diversifying the assets in the arrangement to different asset types such as property, government bonds as well as corporate bonds.
CHANGES IN THE RETURN ON BONDSLiabilities arising from the arrangements have been calculated using a discount rate based on the return on high-quality corporate bonds. A decline in the discount rate increases the arrangements’ liabilities.
INFLATION RISKThe plan’s benefit obligations are linked to inflation and a higher inflation will lead to increased obligation.
LIFE EXPECTANCyThe majority of the arrangement obligations arises from generating lifetime benefits for members, so the expected increase in life expectancy will increase the arrangement obligations.
The contribution made to post-employment defined benefit plans is expected to be EUR 0.8 million in 2021. The weighted average duration of the defined benefit obligation is 15.1 years (15.7).
4. CAPITAL EMPLOYED 4.1 INTANGIBLE ASSETS
ACCOUNTING PRINCIPLES
GOODWILLGoodwill arising from the merging of business operations is recog-nised as the amount by which the sum of the consideration paid, the non-controlling interests’ share in the object of the acquisition and the previous holding exceed the fair value of the acquired net assets.
Goodwill is not amortised. Instead, it is tested for impairment annually and always when there is an indication of a decrease in value. Goodwill is therefore allocated to cash-generating units for impairment testing. Goodwill is recognised at original acquisition cost less accumulated impairment losses.
OTHER INTANGIBLE ASSETSIntangible assets are initially recognised at their original acquisition cost on the balance sheet if the acquisition cost can be determined reliably and it is probable that the expected financial benefit from the asset will be to the benefit of the Group.
Intangible assets with limited useful lives are recognised as expenses over their known or estimated useful lives, using the straight-line depreciation method.
The residual value of an asset, the useful life and depreciation method are reviewed at least annually, at the end of each financial period, and adjustments are made when necessary to reflect changes in the expected financial benefit of the asset.
RESEARCH AND DEVELOPMENT COSTSResearch costs are recognised as expenses at the time they are incurred. Development costs are capitalised and amortised over their useful lives if the research project is likely to generate financial benefits and the costs can be measured reliably. Metsä Board has not capitalised development costs.
COMPUTER SOFTWARECosts arising from developing and building of significant new com-puter software are recognised as intangible assets on the balance sheet and depreciated on a straight-line basis over its estimated useful life, which is not to exceed seven years. Maintenance and operating costs related to computer software are recorded as expenses in the reporting period during which they have been incurred.
OTHERThe cost of patents, licences and trademarks with finite useful lives are capitalised on the balance sheet under intangible assets and depreciated on a straight-line basis over their useful lives of 5–10 years.
7372
METSÄ BOARD Annual Report 2020
Business operations and value creation
2 This is Metsä Board
4 CEO’s review
6 Highlights of the year
8 Strategy and targets
10 Creating value
12 Operating environment
16 Product and service development
18 Circular economy
Sustainability
20 Sustainability targets
24 We bring the forest to you
26 We offer sustainable choices
30 We work for a better climate and environment
34 We create well-being
40 Mill-specific information
Financial development
44 Report of the Board of Directors
57 Consolidated financial statements
61 Notes to the consolidated financial statements
107 Parent company financial statements
110 Notes to the parent company financial statements
123 Auditor’s report
126 Shares and shareholders
132 Key figures and taxes
Governance
134 Corporate governance statement
140 Metsä Board Corporation’s Board of Directors
142 Metsä Board Corporation’s Corporate Management Team
144 Investor relations and investor information

SUSTAINABILITYBUSINESS OPERATIONS AND VALUE CREATION GOVERNANCE
FINANCIAL DEVELOPMENT
CONSOLIDATED FINANCIAL STATEMENTS | METSÄ BOARD ANNUAL REPORT 2020
EUR million Goodwill Other intangible assets Construction in progress Total
Acquisition cost, 1 Jan 2020 12.4 130.5 1.4 144.3
Translation differences 0.3 0.3
Increases 0.7 0.0 0.7
Decreases -8.1 0.0 -8.1
Transfers between asset categories 0.0 -0.8 -0.8
Acquisition cost, 31 Dec 2020 12.4 123.4 0.6 136.4
Accumulated amortisation and impairment charges, 1 Jan 2020 -123.1 -123.1
Translation differences -0.2 -0.2
Accumulated amortisation on decreases and transfers 8.1 8.1
Amortisation for the period -2.2 -2.2
Impairment charges for the period
Accumulated amortisation and impairment charges, 31 Dec 2020 -117.4 -117.4
Book value, 1 Jan 2020 12.4 7.4 1.4 21.2
Book value, 31 Dec 2020 12.4 6.1 0.6 19.1
EUR million Goodwill Other intangible assets Construction in progress Total
Acquisition cost, 1 Jan 2019 12.4 136.6 0.9 149.9
Translation differences -0.1 -0.1
Increases 1.0 0.5 1.5
Decreases -6.9 -6.9
Transfers between asset categories 0.0 0.0
Acquisition cost, 31 Dec 2019 12.4 130.5 1.4 144.3
Accumulated amortisation and impairment charges, 1 Jan 2019 -127.4 -127.4
Translation differences 0.1 0.1
Accumulated amortisation on decreases and transfers 6.8 6.8
Amortisation for the period -2.5 -2.5
Impairment charges for the period
Accumulated amortisation and impairment charges, 31 Dec 2019 -123.1 -123.1
Book value, 1 Jan 2019 12.4 9.2 0.9 22.5
Book value, 31 Dec 2019 12.4 7.4 1.4 21.2
No impairments were recorded for intangible assets during the current or previous financial year.Other intangible assets include among other things computer software, patents and licenses. Metsä Board has not capitalised development expenditure.
IMPAIRMENT TESTINGDepreciation is not recognised for assets with indefinite useful lives. Instead, such assets are tested for impairment annually. Assets that are subject to depreciation are always tested for impairment when events or changes in conditions indicate that it is possible that the monetary amount corresponding to the book value of the assets might not be recoverable.
Cash-generating units are reporting segments or smaller units for which a utility value can be defined.
The recoverable amount is the higher of the fair value of an asset less the cost of sale, and its value in use. value in use is the estimated future net cash flows, discounted to their present value, expected to be derived from said asset or cash-generating unit.
An impairment loss is recognised if the carrying amount of the asset is higher than its recoverable amount. If the impairment loss concerns a cash-generating unit, it is first allocated to decrease the goodwill of the cash-generating unit, and thereafter to decrease the other assets of the unit on pro-rata basis. In connection with the recognition of the impairment loss, the useful life of the depreciated asset is re-evaluated. An impairment loss recognised for an asset other than goodwill is reversed if a change has taken place in the estimates used to determine
the recoverable amount of the asset. However, the maximum reversal of an impairment loss amounts to no more than the carrying amount of the asset if no impairment loss had been recognised. An impairment loss recognised on goodwill is not reversed under any circumstances.
KEY ESTIMATES AND JUDGEMENTS
FUTURE CASH FLOWSThe recoverable amounts of cash-generating units are based on calcula-tions of value in use. The management’s key estimates in the calculations concern the product price developments, delivery volumes, currency exchange rates, capacity utilisation rates, and the development of costs related to key raw material costs and other costs, as well as the discount rate.
DISCOUNT RATEThe discount rate used is the weighted average cost of capital (WACC). When calculating the WACC, the cost of debt takes into account the mar-ket-based view of the credit risk premium. Both future cash flows and the discount rate are calculated after tax, which means that the established discounted cash flows and values in use are before tax.
IMPAIRMENT TESTING 2020Metsä Board carries out impairment testing at least once a year, during the fourth quarter and based on the situation as of 30 September. Additionally, a sensitivity analysis is performed quarterly. Full impairment test is initiated if sensitivity analysis indicates possible impairment. At the turn of 2020, there were no indications of impairment.
In 2020, the Group did not recognise impairments based on impairment testing.
In 2020 testing , the cash-generating units are Folding boxboard, Liner, and Market Pulp. The cash generating units are the same as in 2019 testing. The recoverable cash flows for the cash-generating units under testing are based on value in use and five-year forecasts with subsequent cash flows expected to grow at a constant rate. The key factors affecting estimates are similar to those used in 2019 testing.
Metsä Board’s share of Metsä Fibre’s recoverable amounts, carrying amount and goodwill included in “Investment in associated companies and joint ven-tures” (EUR 45.2 million) and other assets with indefinite useful life (brands), which are not amortised (EUR 5.6 million) is allocated to cash generating units in the proportion of their pulp purchases.
For the situation on 30 September 2020 and for previous goodwill impair-ment tests, the cash flows subsequent to the 5-year projected cash flows are based on a 1.5 (2019: 1.5) per cent fixed annual growth rate. Average values for the key assumptions (price, variable costs) during the projection period have been used as initial point for the cash flows following the forecast period. The fixed costs are based on the projected costs for the fifth year.
The discount rate used is Metsä Board’s Weighted Average Cost of Capital (WACC). When calculating WACC, the cost of debt takes into account market
based view of Metsä Board’s risk premium. For testing carried out based on status at 30 September 2020, the WACC after taxes was 5.41 per cent (2019: 5.56) and for Metsä Fibre 5,49 per cent (5.54). Management’s view is that the risk factors regarding future cash flows do not differ materially from one cash-generating unit to another.
The goodwill impairment test results are evaluated by comparing the recoverable amount with the carrying amount of the cash-generating unit. The most important cash-generating units of Metsä Board Group, the goodwill and brands allocated to them as of 30 September 2020.
Cash-generating unitGoodwill
EUR millionBrand
EUR million
Folding boxboard 1) 29.7 2.5
Liner 1) 27.9 3.0
Market pulp 1)
Total 57.6 5.6
1) Goodwill includes the goodwill from Metsä Board’s holding in Metsä Fibre (EUR 45.2 million). Goodwill from the holding as well as other assets with indefinite useful life (EUR 5.6 million) are shown under ”Investments in associated companies and joint ventures” in balance sheet.
In the 2020 tests, a somewhat possible change in any single key assumption will not result in the carrying amount exceeding the recoverable amount for any cash-generating unit.
ACCOUNTING PRINCIPLESThe Group has received emission allowances in accordance with the European Union Emissions Trading System. Allowances are treated as intangible assets and are measured at acquisition cost. The acquisition cost of emission allowances received without consideration is zero. Emission allowances are used simultaneously with the carbon dioxide emissions generated during their validity period. Earnings from emission allowances sold are recognised in other operating income. If the emission allowances received without consideration are not sufficient to cover the amount of the actual emissions, the Group purchases additional allowances from the market.
The allowances purchased are recognised in intangible rights at the fair value on the acquisition date. The provision to fulfil the obligation to return the emission allowances is recognised at fair value on the closing date of the reporting period if the emission allowances received without consideration and purchased are not sufficient to cover the amount of the actual emissions.
In 2020 the Group received 606 thousand tonnes of emission allowances free of charge (2019: 846). In addition the Group has sold 217 thousand tonnes to the market (563). At balance closing date the group had emission allowances of 1,060 thousand tonnes (922). Emissions during the reporting period fell below the amount of emission allowances received free of charge and consequently emissions during the year did not have an impact on income statement or balance sheet.
In 2020, the Group sold emission allowances for EUR 6.2 million (14.1). On the balance sheet date, the fair market value of an emission right was EUR 32.04 per tonne (24.93) and total value of owned rights approximately EUR 34.0 million (23.0).
EMISSION ALLOWANCES
7574
METSÄ BOARD Annual Report 2020
Business operations and value creation
2 This is Metsä Board
4 CEO’s review
6 Highlights of the year
8 Strategy and targets
10 Creating value
12 Operating environment
16 Product and service development
18 Circular economy
Sustainability
20 Sustainability targets
24 We bring the forest to you
26 We offer sustainable choices
30 We work for a better climate and environment
34 We create well-being
40 Mill-specific information
Financial development
44 Report of the Board of Directors
57 Consolidated financial statements
61 Notes to the consolidated financial statements
107 Parent company financial statements
110 Notes to the parent company financial statements
123 Auditor’s report
126 Shares and shareholders
132 Key figures and taxes
Governance
134 Corporate governance statement
140 Metsä Board Corporation’s Board of Directors
142 Metsä Board Corporation’s Corporate Management Team
144 Investor relations and investor information

SUSTAINABILITYBUSINESS OPERATIONS AND VALUE CREATION GOVERNANCE
FINANCIAL DEVELOPMENT
CONSOLIDATED FINANCIAL STATEMENTS | METSÄ BOARD ANNUAL REPORT 2020
ACCOUNTING PRINCIPLESProperty, plant and equipment are measured at acquisition cost less accumulated depreciation and impairment losses.
The acquisition cost includes costs that are directly incurred in the acquisition of an item of property, plant or equipment. Qualifying external borrowing costs resulting directly from the acquisition, construction or manufacture of an item of property, plant or equipment are capitalised as part of the acquisition cost of property, plant and equipment.
If a piece of property, plant or equipment consists of several components with differing useful lives, each component is handled as a separate item. In that case, the expenses related to replacing the component are capitalised, and any book value remaining at the time of replacement is derecognised on the balance sheet.
Spare parts, spare equipment and maintenance supplies are recognised in property, plant and equipment when they fulfill the criteria for recogni-tion of property, plant and equipment. Otherwise, such commodities are classified as inventories.
Significant investments in refurbishments and improvements are capital-ised on the balance sheet and depreciated over the remaining useful life of the main asset related to such investments.
Repair and maintenance costs are recognised as expenses when they are incurred.
Property, plant and equipment is depreciated on a straight-line basis over the estimated useful lives. Depreciation is not recognised for owned land and water.
Estimated useful lives Buildings and constructions 20–40 years
Machinery and equipment
Heavy power plant machinery 20–40 years
Other heavy machinery 15–20 years
Lightweight machinery and equipment 5–15 years
Other tangible assets 5–20 years
The residual value of an asset, the financial useful life and depreciation method are reviewed at least annually, at the end of each financial period, and adjustments are made when necessary to reflect changes in the expected financial benefit of the asset.
Gains and losses arising from the sale and decommissioning of items of property, plant and equipment are recognised in other operating income and expenses. Sales gains or losses are calculated as the difference between the sales price and the remaining acquisition cost.
Government grants related to the acquisition of assets are presented as adjustments of the acquisition cost on the balance sheet and recognised
as income in the form of lower depreciation during the useful life of the asset.
LEASESThe Group has leased various land areas, properties, equipment and vehicles. When the leased asset is available for the Group’s use, A fixed asset item and a corresponding liability of the lease is recognised. Paid rents are divided into liabilities and finance costs. The finance cost is included in profit or loss over the lease term in such a way that the interest rate of the remaining debt balance is the same during each period. The leased fixed asset is subject to straight-line depreciations over the asset’s economic life or the lease term, depending on which of them is shorter.
Assets and liabilities arising from leases are initially measured at the present value. Lease liabilities include fixed payments, less any lease incentives receivable; amounts expected to be payable by the lessee under residual value guarantees; the exercise price of a purchase option if the lessee is reasonably certain to exercise that option; and payments of penalties for terminating the lease, if the lease term reflects the lessee exercising an option to terminate the lease. The lease payments are discounted using the interest rate implicit in the lease, if that rate can be readily determined, or the Group’s incremental borrowing rate. The leased fixed assets are measured at cost, which includes the amount of the initial measurement of the lease liability; any lease payments made at or before the commencement date, less any lease incentives received; any initial direct costs incurred; and any costs incurred by restoring the site on which it is located.
Some of the leases include options to extend or terminate, which are largely available only for the Group, not the lessor.
Payments related to short-term leases or leases where the value of the underlying asset is low are recognised as costs on a straight-line basis. A lease with a lease term of 12 months or less is considered a short-term lease. Assets of a low value include mainly ICT and office equipment.
KEY ESTIMATES AND JUDGMENTS
LEASES
When determining the lease term, the management accounts for all relevant facts and circumstances that create an economic incentive to exercise the option to extend the lease, or not to exercise the option to terminate the lease. Options to extend the lease (or the time subsequent to an option to terminate) are accounted for in the lease term only if the extension of the lease (or the decision not to terminate the lease) is reasonably certain. The possible future cash flows of EUR 1.9 million have not been included in the lease liability because the extension of the lease (or the decision not to terminate it) is not reasonably certain. The Group will conduct a reassessment upon the occurrence of either a significant event or a significant change in circumstances that is within the control of the lessee and affects the assessment.
4.2 TANGIBLE ASSETSLand and water areas Buildings and constructions Machinery and equipment
EUR million Owned Leased Owned Leased Owned Leased
Acquisition cost, 1 Jan. 2020 14.6 2.5 391.8 10.9 2,416.9 16.2
Translation differences 0.0 4.8 -0.2 50.9 0.5
Additions 4.9 0.3 4.9 0.0 28.0 6.6
Decrease -2.6 -0.6 2.9 0.1 43.8 -1.1
Transfers between items 6.4 18.2 -0.3
Acquisition cost, 31 Dec. 2020 17.0 2.3 410.7 10.8 2,557.8 21.9
Accumulated depreciation and impairment charges 1 Jan. 2020 -0.5 -0.3 -267.3 -2.3 -1,906.2 -5.1
Translation differences 0.0 -3.8 0.1 -40.8 -0.2
Accumulated depreciation on deductions and transfers 0.4 -2.9 -0.1 -44.3 0.9
Depreciation for the period -0.3 -8.1 -2.4 -75.1 -5.3
Impairments
Accumulated depreciation and impairment charges 31 Dec. 2020 -0.5 -0.2 -282.1 -4.8 -2,066.3 -9.7
Book value, 1 Jan. 2020 14.2 2.2 124.5 8.5 510.7 11.1
Book value, 31 Dec. 2020 16.5 2.1 128.7 6.0 491.4 12.2
Other tangible assets
Construction in progress Total Total
EUR million Owned Owned Owned Leased Total
Acquisition cost, 1 Jan. 2020 24.6 60.9 2,908.9 29.6 2,938.5
Translation differences 0.4 5.8 61.9 0.3 62.2
Additions 0.4 120.5 158.6 7.0 165.6
Decrease -1.2 -4.6 38.2 -1.6 36.6
Transfers between items 0.6 -24.1 1.1 -0.3 0.8
Acquisition cost, 31 Dec. 2020 24.8 158.4 3,168.7 35.0 3,203.7
Accumulated depreciation and impairment charges 1 Jan. 2020 -14.8 -2,188.8 -7.7 -2,196.5
Translation differences -0.3 -44.9 -0.2 -45.1
Accumulated depreciation on deduction and transfers 0.9 -46.2 1.2 -45.1
Depreciation for the period -1.2 -84.4 -8.0 -92.4
Impairments
Accumulated depreciation and impairment charges 31 Dec. 2020 -15.4 -2,364.3 -14.7 -2,379.0
Book value, 1 Jan. 2020 9.8 60.9 720.1 21.8 742.0
Book value, 31 Dec. 2020 9.4 158.4 804.4 20.2 824.7
7776
METSÄ BOARD Annual Report 2020
Business operations and value creation
2 This is Metsä Board
4 CEO’s review
6 Highlights of the year
8 Strategy and targets
10 Creating value
12 Operating environment
16 Product and service development
18 Circular economy
Sustainability
20 Sustainability targets
24 We bring the forest to you
26 We offer sustainable choices
30 We work for a better climate and environment
34 We create well-being
40 Mill-specific information
Financial development
44 Report of the Board of Directors
57 Consolidated financial statements
61 Notes to the consolidated financial statements
107 Parent company financial statements
110 Notes to the parent company financial statements
123 Auditor’s report
126 Shares and shareholders
132 Key figures and taxes
Governance
134 Corporate governance statement
140 Metsä Board Corporation’s Board of Directors
142 Metsä Board Corporation’s Corporate Management Team
144 Investor relations and investor information

SUSTAINABILITYBUSINESS OPERATIONS AND VALUE CREATION GOVERNANCE
FINANCIAL DEVELOPMENT
CONSOLIDATED FINANCIAL STATEMENTS | METSÄ BOARD ANNUAL REPORT 2020
Land and water areas Buildings and constructions Machinery and equipment
EUR million Owned Leased Owned Leased Owned Leased
Acquisition cost, 1 Jan. 2019 12.7 396.1 2,528.1
Translation differences 0.0 0.0 -2.2 -23.2 0.0
Adoption of IFRS 16 standard 2.5 10.4 4.0
Additions 2.3 0.0 6.2 0.4 29.8 3.6
Decrease -0.4 -9.3 -126.6 -0.5
Transfers between items 0.0 1.0 8.8 9.1
Acquisition cost, 31 Dec. 2019 14.6 2.5 391.8 10.9 2,416.9 16.2
Accumulated depreciation and impairment charges 1 Jan. 2019 -0.5 -267.4 -1,950.3
Translation differences 0.0 1.6 0.0 16.2 0.0
Accumulated depreciation on deductions and transfers 7.8 120.9 0.0
Depreciation for the period -0.3 -7.0 -2.3 -76.1 -5.1
Impairments -2.3 -16.8
Accumulated depreciation and impairment charges 31 Dec. 2019 -0.5 -0.3 -267.3 -2.3 -1,906.2 -5.1
Book value, 1 Jan. 2019 12.2 128.7 577.8
Book value, 31 Dec. 2019 14.2 2.2 124.5 8.5 510.7 11.1
Other tangible assets
Construction in progress Total Total
EUR million Owned Owned Owned Leased Total
Acquisition cost, 1 Jan. 2019 22.1 26.2 2,985.2 2,985.2
Translation differences -0.2 0.4 -25.2 0.0 -25.2
Adoption of IFRS 16 standard 16.9 16.9
Additions 1.4 53.7 93.4 4.1 97.4
Decrease -0.1 0.0 -136.3 -0.5 -136.8
Transfers between items 1.4 -19.4 -8.2 9.1 0.9
Acquisition cost, 31 Dec. 2019 24.6 60.9 2,908.9 29.6 2,938.5
Accumulated depreciation and impairment charges 1 Jan. 2019 -13.8 -2,232.0 -2,232.0
Translation differences 0.1 18.0 0.0 17.9
Accumulated depreciation on deduction and transfers 0.1 128.7 0.0 128.7
Depreciation for the period -1.2 -84.4 -7.7 -92.1
Impairments -19.1 -19.1
Accumulated depreciation and impairment charges 31 Dec. 2019 -14.8 -2,188.8 -7.7 -2,196.5
Book value, 1 Jan. 2019 8.3 26.2 753.2 753.2
Book value, 31 Dec. 2019 9.8 60.9 720.1 21.8 742.0
LEASES
EUR million 2020 2019
Costs related to short-term leases 0.3 1.2
Costs of leases in which the underlying asset is of low value 1.3 1.3
Interest expenses 0.6 0.6
Cash outflow for leases 8.4 7.7
Disclosures on lease liabilities are presented in Note 5.5 (Financial liabilities) and 5.6 (Management of financial risks) and disclosures on lease obligations in Note 8.1 (Commitments and contingencies).
ACCOUNTING PRINCIPLESOther investments consist of listed and unlisted equity investments. The most significant of these is the Group’s holding in Pohjolan voima. This investment is unlisted and strategic in nature, serving the Group’s long-term energy sourcing needs. This being the case, the Group classifies its shares in Pohjolan voima as financial assets at fair value recognised under other items of comprehensive income. Changes in their fair value are presented in the fair value reserve, accounting for the tax effect. Changes in fair value are never transferred from equity to profit and loss.
The Group classifies its other equity financial assets as financial assets at fair value to be recognised as financial assets through profit and loss.
The fair values of publicly listed shares are based on the share price on the balance sheet date. The fair values of shares other than listed shares are determined using various valuation models, such as the price levels of recent transactions and valuation methods based on the present value of discounted cash flows. As far as possible, the
valuation methods are founded on market-based valuation factors.
KEY ESTIMATES AND JUDGEMENTS
FAIR VALUE MEASUREMENTThe application of valuation models to measuring fair value requires judgement concerning the selection of the method to be applied, as well as valuation factors required by the chosen method that are based on the price and interest levels prevailing in the market on the end date of each reporting period. The most significant item of other investments that has been valued by using a valuation model is the Group’s investment in the shares of Pohjolan voima Oyj. The price of these shares is determined based on the present value of discounted cash flows. Key factors affecting cash flows include the price of electricity, inflation expectations and the discount rate. The 12-month moving average of electricity futures prices has been used as the energy price for the first six years. Subsequent prices are based on a long-term market price forecast. In 2020 Group dis-continued the use of previous bench-mark transactions in Pohjolan voima Oyj’s shares as a valuation basis and increased the discount rates used in the valuation model based on projected cash flows to reflect prevailing circumstances.
The carrying amount of the Group’s shares in Pohjolan voima was EUR 183.4 million on the balance sheet on 31 December 2020. The carrying value of other investments is estimated to change by EUR -8.6 million and EUR 9.3 million should the rate used for dis-counting the cash flows change by 0.5 percentage points from the rate estimated by the management. The carrying value of other investments is estimated to change by EUR 79.1 million should the energy prices used in calculating the fair value differ by 10% from the prices estimated by the management.
EUR million 2020 2019
Pohjolan Voima Oyj 183.4 251.4
Other unlisted shareholdings 3.5 3.7
Other investments total 186.9 255.1
The most important unlisted shareholding under other investments consists of a 3.2 per cent stake in Finnish energy company Pohjolan Voima Oyj, which produces electricity and heat for its shareholders in Finland. Pohjolan Voima trades with its shareholders at prices based on production costs, which gener-ally are lower than market prices. The Group is entitled to about:• 5.2 per cent of the energy produced by Olkiluoto nuclear power plants (OL1
and OL2) through its ownership of Pohjolan Voima B-shares,• 1.5 per cent of the energy produced by Olkiluoto 3 nuclear power plant
under construction through its ownership of Pohjolan Voima B2-shares, and• 84 per cent of the energy produced by Hämeenkyrön Voima Oy through
Pohjolan Voiman G10-shares.
In November 2020, Metsä Board participated in the shareholder loan of Pohjolan Voima Oyj with EUR 2.2 million, corresponding to its holding, to fund the comple-tion of the Olkiluoto 3 project. The loan retains the cur-rent level of Metsä Board’s portion of OL3 power. The unsecured loan does not have a maturity date, its re-payment and interest payments depend on a decision of the debtor company’s Board of Directors, and the loan capital can be converted into 40,011 new B2 series shares in Pohjolan Voima Oyj. The loan capital is re-payable in the event of bankruptcy only with a priority poorer than that of all other creditors.
The ownership is measured quarterly at fair value on share series basis by using the average of discounted cash flow method and valuation based on earlier transactions. The weighted average cost of capital used was 2.87 (2019: 1.37) per cent and 3.87 per cent (2.37) for the Olkiluoto 3 currently under construction.
The acquisition cost of shares in Pohjolan Voima Oy is EUR 40.2 million (38.0) and the fair value EUR 183.4 million (251.3), which can be allocated to different shares as follows: The fair value of nuclear power shares totals EUR 171.3 million (239.4) and G10 shares have a fair value of EUR 12.0 million (12.0).
Shareholder agreement restricts sale of shares of Pohjolan Voima to buyers that are not existing shareholders.
4.3 OTHER INVESTMENTS
IMPAIRMENTSMetsä Board investments in modernisation of the Husum pulp mill in Sweden. The investment includes a new recovery boiler and turbine. In Financial Statements 2019 Metsä Board recognised a EUR 19.1 million impairment in the assets taken out of service.
BORROWING COSTSBorrowing costs capitalised in 2020 totalled to EUR 0.2 million (0.0).
7978
METSÄ BOARD Annual Report 2020
Business operations and value creation
2 This is Metsä Board
4 CEO’s review
6 Highlights of the year
8 Strategy and targets
10 Creating value
12 Operating environment
16 Product and service development
18 Circular economy
Sustainability
20 Sustainability targets
24 We bring the forest to you
26 We offer sustainable choices
30 We work for a better climate and environment
34 We create well-being
40 Mill-specific information
Financial development
44 Report of the Board of Directors
57 Consolidated financial statements
61 Notes to the consolidated financial statements
107 Parent company financial statements
110 Notes to the parent company financial statements
123 Auditor’s report
126 Shares and shareholders
132 Key figures and taxes
Governance
134 Corporate governance statement
140 Metsä Board Corporation’s Board of Directors
142 Metsä Board Corporation’s Corporate Management Team
144 Investor relations and investor information

SUSTAINABILITYBUSINESS OPERATIONS AND VALUE CREATION GOVERNANCE
FINANCIAL DEVELOPMENT
CONSOLIDATED FINANCIAL STATEMENTS | METSÄ BOARD ANNUAL REPORT 2020
ACCOUNTING PRINCIPLESInventories are measured at the lower of acquisition cost or net realisable value. In measuring inventories, the FIFO principle is observed or, alternatively, the weighted average price method, depending on the nature of the inventories. The acquisition cost of finished products acquired comprises all purchase costs, including direct transport, handling and other expenses. The acquisition cost of finished and semi-finished products of own manufacture includes raw materials, direct production costs, and the systematically allocated portion of variable manufacturing overheads and fixed overheads at the normal level of operation. Borrowing cost is not included in the acquisition cost.
Net realisable value is the estimated sales price in ordinary business operations less the estimated cost of completion and the necessary sales costs.
KEY ESTIMATES AND JUDGEMENTSThe Group regularly reviews its inventories for situations where the inventories contain non-marketable items or items with net realisable value below the acquisition cost. When necessary, the Group reduces the book value of the inventories accordingly. This review requires the management’s estimates of the sales prices of products, the cost of completion and the costs necessary to make the sale. Any changes in these estimates might lead to an adjustment in the book value of the inventories in future periods.
ACCOUNTING PRINCIPLESTrade receivables are measured at the expected net realisable value, which is the original invoicing value less estimated impairment provisions on the receivables. The Group applies a model based on expected credit losses to the determination of the impairment of trade receivables. Provisions are furthermore set up on a case-by-case basis when there is a justifiable reason to assume that the Group will not receive payment for the invoiced amount according to the original terms.
KEY ESTIMATES AND JUDGEMENTSThe evaluation of the recognition criteria and the amount of impair-ment losses requires the management’s judgement. If customers’ financial position weakens so that it affects their solvency, further impairment losses may need to be recognised in future periods. The impacts of the corona pandemic on determining the impairment of sales receivables is discussed in Note 5.6, Management of financial risks, counterparty risk.
EUR million 2020 2019
Raw materials and consumables 147.5 156.7
Finished goods 201.1 211.5
Advance payments 11.4 11.3
Inventories total 360.0 379.5
The value of Metsä Board inventories was not reduced through write-downs in 2020 or in 2019.
ACCOUNTS RECEIvABLE AND OTHER NON-INTEREST BEARING RECEIvABLES
EUR million 2020 2019
From Group companies
Accounts receivable 17.0 13.4
Other receivables 0.8
Prepayments and accrued income 0.0 0.0
Total 17.0 14.2
From associated companies and joint ventures
Accounts receivable 0.2 0.4
From others
Accounts receivable 208.4 229.6
Impairment -3.0 -2.1
Total 205.4 227.5
Other receivables 26.5 37.1
Prepayments and accrued income 27.7 24.7
From others total 259.6 289.2
Accounts receivable and other receivables total 276.7 303.8
Receivables from Group companies are receivables from parent company Metsäliitto Cooperative and from other subsidiaries of the parent company. Derivative receivables are from Metsä Group Treasury Oy, a wholly owned subsidiary of Metsäliitto Cooperative.
4.4 INVENTORIES 4.5 ACCOUNTS RECEIVABLE AND OTHER RECEIVABLES DOUBTFUL ACCOUNTS RECEIvABLECase-specific impairments and impairments determined by applying the model based on expected credit losses deducted from accounts receivable are as follows:
EUR million 2020 2019
Value 1 Jan 2.1 1.0
Increase 4.6 1.5
Decrease -3.7 -0.4
Value 31 Dec 3.0 2.1
EUR 0.3 million of credit losses were recognised during 2020 (EUR 0.8 million in 2019).
AGE DISTRIBUTION OF ACCOUNTS RECEIvABLE LESS IMPAIRMENTS
EUR million 2020 2019
Not overdue 195.6 207.7
Overdue
Less than 30 days 10.1 17.8
Between 31 and 60 days 0.4 0.8
Between 61 and 90 days 0.0 0.1
Between 91 and 180 days -0.4 0.4
Over 180 days -0.2 0.7
Total 205.4 227.5
4.6 OTHER NON-CURRENT LIABILITIES
EUR million 2020 2019
Non-interest bearing non-current liabilities to Group companies
Non-interest bearing non-current liabilities to others
Advance payments received 1.5 1.5
Accruals and deferred income 0.4 0.3
Total 1.9 1.9
4.7 ACCOUNTS PAYABLE AND OTHER LIABILITIES
EUR million 2020 2019
Advance payments received 4.5 4.1
Accounts payable, Supply Chain Finance schemes 55.3 63.4
Other accounts payable 172.0 170.2
Other liabilities 12.8 10.2
Accruals and deferred income
Customer discounts 20.6 23.6
Purchase-related items 23.4 27.8
Employee costs 29.9 25.9
Other accrued expenses 21.8 20.2
Total 340.4 345.4
With financing banks, Metsä Group has established Supply Chain Finance (SCF) schemes aimed at a few key suppliers. In the schemes, the suppliers are offered the option of selling their Metsä Group receivables to a bank providing the SCF scheme. The SCF schemes partly replace the earlier advance payment arrangements, and their aim is not to cause a significant deviation from Metsä Group’s normal payment terms.
8180
METSÄ BOARD Annual Report 2020
Business operations and value creation
2 This is Metsä Board
4 CEO’s review
6 Highlights of the year
8 Strategy and targets
10 Creating value
12 Operating environment
16 Product and service development
18 Circular economy
Sustainability
20 Sustainability targets
24 We bring the forest to you
26 We offer sustainable choices
30 We work for a better climate and environment
34 We create well-being
40 Mill-specific information
Financial development
44 Report of the Board of Directors
57 Consolidated financial statements
61 Notes to the consolidated financial statements
107 Parent company financial statements
110 Notes to the parent company financial statements
123 Auditor’s report
126 Shares and shareholders
132 Key figures and taxes
Governance
134 Corporate governance statement
140 Metsä Board Corporation’s Board of Directors
142 Metsä Board Corporation’s Corporate Management Team
144 Investor relations and investor information

SUSTAINABILITYBUSINESS OPERATIONS AND VALUE CREATION GOVERNANCE
FINANCIAL DEVELOPMENT
CONSOLIDATED FINANCIAL STATEMENTS | METSÄ BOARD ANNUAL REPORT 2020
4.8 PROVISIONS
ACCOUNTING PRINCIPLESA provision is recognised when, as a result of an earlier event, the Group has a legal or actual obligation, the realisation of a payment obligation is likely, and the amount of the obligation can be reliably estimated. Any reimbursement from a third party is presented as an asset separate from the provision if it is practically certain that reimbursement will be received.
RESTRUCTURINGA restructuring provision is recorded when the Group has incurred a legal or constructive obligation to make a payment. Termination payments are recorded when a detailed plan has been made for the restructuring and the Group has raised valid expectations in those affected that it will carry out the restructuring by starting to implement that plan or announcing its main features to those affected by it. If the Group makes an offer to employees concerning voluntary resignation against benefits determined
in the offer, the liability arising from this is recorded when the Group can no longer withdraw its offer. The liability arising from such an offer is based on the number of employees that the Group expects to accept the offer. Benefits falling due in twelve months’ time or later are measured at their present value.
ENVIRONMENTAL OBLIGATIONSCosts arising from environmental remediation that do not increase pres-ent or future revenue are recorded as expenses. Environmental liabilities are measured at current value in accordance with current environmental protection regulations when it is probable that an obligation has arisen and its amount can be estimated reasonably.
OTHER PROVISIONSOther provisions mainly consist of provisions arising from estimated cost of future restoration of leased sites.
PROvISIONS
EUR million Restructuring Environmental Other Total
1 Jan 2020 1.2 3.5 1.2 5.8
Translation differences 0.0 0.0 0.1
Increases 0.0 0.0
Utilised during the year -1.0 -0.2 -1.2
Unused amounts reversed -0.1 -0.1
31 Dec 2020 0.2 3.4 1.0 4.7
1 Jan 2019 4.0 5.5 1.7 11.2
Translation differences -0.1 0.0 -0.1
Increases 0.0 0.0 0.0
Utilised during the year -2.7 -0.1 -0.5 -3.3
Unused amounts reversed -2.0 -2.0
31 Dec 2019 1.2 3.5 1.2 5.8
2020 2019
Non-current 3.7 4.2
Current 1.0 1.6
Total 4.7 5.8
Half of non-current provisions are estimated to be utilised by the end of 2025 and the rest in 2030s. The decrease in restructuring provision in 2019 relates to usage of Husum plant efficiency improvement programme 2018 provision. Decrease in environmental obligations in 2019 is mainly due to updated estimate of fair value of environmental provision.
5. CAPITAL STRUCTURE AND FINANCIAL RISKS
5.1 SHAREHOLDERS’ EQUITY
CHANGES IN SHARE CAPITALShare capital
EUR million Series A Series B Total
1 Jan 2019 55.5 502.4 557.9
Conversion of A shares into B shares -3.6 3.6
31 Dec 2019 51.9 506.0 557.9
Conversion of A shares into B shares -0.3 0.3
31 Dec 2020 51.6 506.3 557.9
Each series A share confers to its holder twenty (20) votes at the General Meet-ing of Shareholders, and each series B share confers to the holder one (1) vote. All shares carry the same right to receive a dividend. Metsä Board’s A shares can be converted to B shares if shareholder or representative of the nominee registered shares makes a written request for the conversion to the company. No monetary consideration is paid for the conversion.
NUMBER OF SHARESShare capital
shares Series A Series B Total
1 Jan 2019 35,358,794 320,153,952 355,512,746
Conversion of A shares into B shares -2,271,147 2,271,147
31 Dec 2019 33,087,647 322,425,099 355,512,746
Conversion of A shares into B shares -200,496 200,496
31 Dec 2020 32,887,151 322,625,595 355,512,746
The share has no nominal value. All shares have been paid in full.
TRANSLATION DIFFERENCESTranslation differences include translation differences arising from translation of subsidiaries in other currencies than euro and gains and losses arising on hedging of net investments in these subsidiaries less deferred tax, when requirements of hedge accounting have been fulfilled. Net investments were not hedged in Metsä Board Group in 2020 or in 2019.
Cumulative translationTranslation differences in other
comprehensive income
EUR million 2020 2019 2020 2019
SEK -17.6 -31.7 14.1 -5.5
RUB * -7.7 -5.4 -2.3 0.9
USD 0.4 6.3 -5.9 1.2
CNY 0.9 -0.9 0.0
GBP -0.7 -0.3 -0.4 0.4
Others 0.7 1.0 -0.3 0.3
Total -24.9 -29.1 4.2 -2.7
* RUB denominated translation difference arises mostly from associate company Metsä Fibre.
FAIR vALUE AND OTHER RESERvESEUR million 2020 2019
Fair value reserve 135.0 173.8
Legal reserve and reserves stipulated by the Articles of Association
1.7 1.7
Total 136.6 175.5
FAIR vALUE RESERvEFair value changes in derivatives designated as cash flow hedges are recorded to fair value reserve deducted by deferred tax effect. Additionally, the fair value change of Pohjolan Voima Oyj shares recognised by the Group as other investments is moved to the reserve with deferred tax effect deducted.
LEGAL RESERvE AND RESERvES STIPULATED By THE ARTICLES OF ASSOCIATIONLegal reserve and reserves stipulated by the Articles of Association have been created and accumulated on resolutions by the General Meeting of Shareholders.
RESERvE FOR INvESTED UNRESTRICTED EQUITy
EUR million 2020 2019
Reserve for invested unrestricted equity 265.8 315.5
According to Finnish Limited Liability Companies Act, the reserve for invested unrestricted equity shall be credited with the part of the subscription price of the shares that according to the share issue decision is not to be credited to the share capital and that according to the Accounting Act is not to be credited to liabilities, as well as with other equity additions that are not to be credited to some other reserve.
DIvIDENDDividends payable by the company are recorded as deductions to equity in the period during which the shareholders in a general meeting have declared the dividend.
The Board of Directors has proposed that a dividend of EUR 0.10 per share be distributed for the 2020 financial year, and further that EUR 0.16 per share be distributed from the unrestricted equity reserve
8382
METSÄ BOARD Annual Report 2020
Business operations and value creation
2 This is Metsä Board
4 CEO’s review
6 Highlights of the year
8 Strategy and targets
10 Creating value
12 Operating environment
16 Product and service development
18 Circular economy
Sustainability
20 Sustainability targets
24 We bring the forest to you
26 We offer sustainable choices
30 We work for a better climate and environment
34 We create well-being
40 Mill-specific information
Financial development
44 Report of the Board of Directors
57 Consolidated financial statements
61 Notes to the consolidated financial statements
107 Parent company financial statements
110 Notes to the parent company financial statements
123 Auditor’s report
126 Shares and shareholders
132 Key figures and taxes
Governance
134 Corporate governance statement
140 Metsä Board Corporation’s Board of Directors
142 Metsä Board Corporation’s Corporate Management Team
144 Investor relations and investor information

SUSTAINABILITYBUSINESS OPERATIONS AND VALUE CREATION GOVERNANCE
FINANCIAL DEVELOPMENT
CONSOLIDATED FINANCIAL STATEMENTS | METSÄ BOARD ANNUAL REPORT 2020
OTHER COMPREHENSIvE INCOME AFTER TAXES 2020
EUR million Translation differencesFair value and
other reserves Retained earnings Total equity
Items that will not be reclassified to profit or loss
Actuarial gains/losses on defined benefit pension plans -3.7 -3.7
Financial assets at fair value through other comprehensive income -70.3 -70.3
Share of profit from other comprehensive income of associated company 0.4 0.4
Income tax relating to items that will not be reclassified 14.1 0.9 15.0
Total -55.8 -2.8 -58.6
Items that may be reclassified to profit or loss
Cash flow hedges
Currency hedges
Gains and losses recorded in equity 39.3 39.3
Transferred to adjust Sales -19.7 -19.7
Interest hedges
Gains and losses recorded in equity -0.7 -0.7
Transferred to adjust net financial items 0.0 0.0
Commodity hedges
Gains and losses recorded in equity -12.8 -12.8
Transferred to adjust purchases 11.5 11.5
Share of profit from other comprehensive income of associated company 2.7 2.7
Cahs flow hedges total 20.3 20.3
Translation differences 6.2 6.2
Share of profit from other comprehensive income of associated company -2.0 -2.0
Translation differences total 4.2 4.2
Income tax relating to items that may be reclassified -3.4 -3.4
Total 4.2 16.9 21.1
Other comprehensive income, net of tax 4.2 -38.9 -2.8 -37.5
OTHER COMPREHENSIvE INCOME AFTER TAXES 2019
EUR million Translation differencesFair value and
other reserves Retained earnings Total equity
Items that will not be reclassified to profit or loss
Actuarial gains/losses on defined benefit pension plans -3.5 -3.5
Financial assets at fair value through other comprehensive income -14.7 -14.7
Share of profit from other comprehensive income of associated company 0.2 0.2
Income tax relating to items that will not be reclassified 2.9 -0.1 2.8
Total -11.5 -3.6 -15.1
Items that may be reclassified to profit or loss
Cash flow hedges
Currency hedges
Gains and losses recorded in equity -25.0 -25.0
Transferred to adjust Sales 28.8 28.8
Interest hedges
Gains and losses recorded in equity -0.9 -0.9
Transferred to adjust net financial items 0.0 0.0
Commodity hedges
Gains and losses recorded in equity -5.8 -5.8
Transferred to adjust purchases -7.2 -7.2
Share of profit from other comprehensive income of associated company 1.0 1.0
Cash flow hedges total -9.1 -9.1
Translation differences -3.4 -3.4
Share of profit from other comprehensive income of associated company 0.7 0.7
Translation differences total -2.7 -2.7
Income tax relating to to items that may be reclassified 2.2 2.2
Total -2.7 -6.9 -9.6
Other comprehensive income, net of tax -2.7 -18.4 -3.6 -24.8
ACCOUNTING PRINCIPLESInterest income and expenses are recognised using the effective interest rate method.
Dividend income is recognised when the right to receive a payment is established.
Borrowing costs are generally recognised as an expense in the period in which they are incurred. When an item of property, plant or equipment is involved in a major and long-term investment project, the borrowing costs directly due to the acquisition, construction or production of the asset are included in the asset’s acquisition cost.
The Group presents net interest income and expenses related to defined benefit plans as financial income and expenses.
5.2 FINANCIAL INCOME AND EXPENSES 5.3 OTHER FINANCIAL ASSETS
EUR million 2020 2019
Exchange differences
Commercial items -7.0 2.1
Hedging, hedge accounting not applied 3.7 -3.6
Other items 0.0 -0.1
Exchange differences total -3.4 -1.6
Other financial income
Interest income on loans, other receivables and cash and cash equivalents
0.3 0.7
Dividend income 0.0 0.0
Other financial income total 0.4 0.8
Valuation of financial assets and liabilities
Impairment gains and losses from financial assets 0.0 0.8
Gains and losses on derivatives, hedge accounting not applied 0.7
Valuation total 0.0 1.4
Interest expenses on financial liabilities carried at amortised cost using the effective interest method
-11.1 -15.2
Other financial expenses -0.8 -0.8
Interest and other financial expenses, total -11.9 -16.0
Valuation of financial assets and liabilities and interest and other financial expenses, total
-11.9 -14.6
EUR million 2020 2019
Loan receivables 2.9 2.9
Defined benefit pension plans (Note 3.5) 7.5 12.1
Other receivables and accrued income 0.3 0.2
Total 10.8 12.3
8584
METSÄ BOARD Annual Report 2020
Business operations and value creation
2 This is Metsä Board
4 CEO’s review
6 Highlights of the year
8 Strategy and targets
10 Creating value
12 Operating environment
16 Product and service development
18 Circular economy
Sustainability
20 Sustainability targets
24 We bring the forest to you
26 We offer sustainable choices
30 We work for a better climate and environment
34 We create well-being
40 Mill-specific information
Financial development
44 Report of the Board of Directors
57 Consolidated financial statements
61 Notes to the consolidated financial statements
107 Parent company financial statements
110 Notes to the parent company financial statements
123 Auditor’s report
126 Shares and shareholders
132 Key figures and taxes
Governance
134 Corporate governance statement
140 Metsä Board Corporation’s Board of Directors
142 Metsä Board Corporation’s Corporate Management Team
144 Investor relations and investor information

SUSTAINABILITYBUSINESS OPERATIONS AND VALUE CREATION GOVERNANCE
FINANCIAL DEVELOPMENT
CONSOLIDATED FINANCIAL STATEMENTS | METSÄ BOARD ANNUAL REPORT 2020
ACCOUNTING PRINCIPLESCash and cash equivalents consist of cash and other short-term, highly liquid investments that can be easily converted into an amount of cash known in advance and that carry a minimal risk of value changes. Metsä Board has classified as cash and cash equivalents the short-term money market investments made in accordance with its treasury policy and interest-bearing receivables comparable to cash funds and available immediately from Metsä Group’s internal bank Metsä Group Treasury Oy. The expected credit losses are reviewed for the following 12 months. The impacts of the corona pandemic on determining the impairment of sales receivables is discussed in Note 5.6, Management of financial risks, counterparty risk.
ACCOUNTING PRINCIPLESFinancial liabilities are categorised initially recognised at fair value. The Group has classified all financial liabilities under “Other liabilities”. Transaction costs are included in the original book value of financial liabilities measured at amortised cost. Subsequently, all financial liabilities are measured at amortised cost using the effective interest method.
5.4 CASH AND CASH EQUIVALENTS
5.5 BORROWINGS JA NET DEBT
EUR million 2020 2019
Financial assets carried at amortized cost 1.0 1.0
Cash at hand and in bank 8.2 6.0
Deposits to Metsä Group Treasury Oy 204.7 127.1
Total 214.0 134.2
INTEREST-BEARING LIABILITIES
EUR million 2020 2019
Non-current interest-bearing financial liabilities
Bonds 248.6 248.5
Loans from financial institutions 182.1 148.8
Lease liabilities 14.1 15.6
Other liabilities 0.0
Total 444.8 412.9
Current interest-bearing financial liabilities
Current portion of non-current debt 6.2 30.4
Current liabilities to group companies 1.3 1.6
Total 7.6 32.0
Interest-bearing financial liabilities total 452.4 444.9
INTEREST-BEARING ASSETS
EUR million 2020 2019
Non-current interest-bearing financial assets
Loan receivables 2.9 2.9
Current interest-bearing financial assets
Current investments at amortised cost 1.0 1.0
Cash at hand and in bank 8.2 6.0
Deposits to Metsä Group Treasury Oy 204.7 127.1
Total 214.0 134.2
Interest-bearing financial assets total 216.9 137.1
Interest-bearing net debt 235.5 307.8
Metsä Board has classified interest-bearing receivables comparable to cash funds and available immediately from Metsä Group’s internal bank Metsä Group Treasury Oy as Cash and cash equivalents.
CASH AND NON-CASH CHANGES IN FINANCIAL LIABILITIES 2019 Non-cash changes
EUR million 1 Jan 2019 Cash flowsChanges in foreign
exchange rates New finance leases Other changes 31 Dec 2019
Non-current interest-bearing liabilities incl. Current portion
Bonds 308.6 -60.4 0.3 248.5
Loans from financial institutions 63.1 87.1 -1.4 148.8
Pension loans 62.6 -38.5 24.1
Finance lease liabilities 8.6 -6.9 -0.1 3.4 16.9 21.8
Other liabilities 1.1 -1.1 0.0
Total 443.9 -19.8 -0.1 3.4 15.9 443.3
Non-current non-interest bearing liabilities 1.9 -0.2 0.0 0.1 1.8
Current interest-bearing liabilities 3.3 -1.7 0.0 1.6
Current non-interest bearing receivables 0.0 0.0 0.0
Total 449.1 -21.7 -0.1 3.4 15.9 446.7
Other changes consist mostly of accrual of effective interest during the financial year on financial liabilities valued.
CASH AND NON-CASH CHANGES IN FINANCIAL LIABILITIES 2020 Non-cash changes
EUR million 1 Jan 2020 Cash flowsChanges in foreign
exchange rates New finance leases Other changes 31 Dec 2020
Non-current interest-bearing liabilities incl. Current portion
Bonds 248.5 0.0 0.1 248.6
Loans from financial institutions 148.8 33.2 0.0 182.1
Pension loans 24.1 -24.1
Finance lease liabilities 21.8 -7.8 0.1 6.3 0.0 20.4
Total 443.3 1.3 0.1 6.3 0.1 451.1
Non-current non-interest bearing liabilities 1.8 -0.1 0.1 0.0 1.9
Current interest-bearing liabilities 1.6 -0.3 0.0 1.3
Total 446.7 1.0 0.2 6.3 0.1 454.3
BONDS
EUR million Interest % 2020 2019
2014–2019 4.00
2017–2027 2.75 248.6 248.5
Total 248.6 248.5
Metsä Board Corporation issued in September 2017 a bond of EUR 250 million. The bond carries a fixed coupon rate of 2.75 per cent, and the maturity date is 29 September 2027. The bond ranks senior and is unsecured.
8786
METSÄ BOARD Annual Report 2020
Business operations and value creation
2 This is Metsä Board
4 CEO’s review
6 Highlights of the year
8 Strategy and targets
10 Creating value
12 Operating environment
16 Product and service development
18 Circular economy
Sustainability
20 Sustainability targets
24 We bring the forest to you
26 We offer sustainable choices
30 We work for a better climate and environment
34 We create well-being
40 Mill-specific information
Financial development
44 Report of the Board of Directors
57 Consolidated financial statements
61 Notes to the consolidated financial statements
107 Parent company financial statements
110 Notes to the parent company financial statements
123 Auditor’s report
126 Shares and shareholders
132 Key figures and taxes
Governance
134 Corporate governance statement
140 Metsä Board Corporation’s Board of Directors
142 Metsä Board Corporation’s Corporate Management Team
144 Investor relations and investor information

SUSTAINABILITYBUSINESS OPERATIONS AND VALUE CREATION GOVERNANCE
FINANCIAL DEVELOPMENT
CONSOLIDATED FINANCIAL STATEMENTS | METSÄ BOARD ANNUAL REPORT 2020
5.6 MANAGEMENT OF FINANCIAL RISKS
The financial risks associated with business operations are managed in accordance with the financial policy endorsed by the Board of Directors and the senior management of the company. The policy defines focal instructions on the management of foreign currency, interest rate, liquidity and counterparty risks, and for the use of derivative financial instruments. Correspondingly, commod-ity risks are managed according to the company’s commodity risk policy. The purpose is to protect the company against major financial and commodity risks, to balance the cash flow and to allow the business units time to adjust their operations to changing conditions.
Metsä Group Treasury Oy is specialized in finance and functions as the Group’s internal bank. Metsäliitto Cooperative s holding is 100 per cent of the company. Financial operations have been centralised to Metsä Group Treasury, which is in charge of managing the Group companies’ financial positions according to the strategy and financial policy, providing necessary financial services and acting as an advisor in financial matters.
FOREIGN CURRENCy RISKThe Group’s foreign currency exposure consists of the risks associated with for-eign currency flows, translation risk of net investments in foreign entities and economic currency exposure. Most of the Group’s costs are incurred in the euro zone and to some extent in Sweden, but a significant part of the sales is received or priced in other currencies. Sales may therefore vary because of changes in exchange rates, while production costs remain unchanged. The foreign currency transaction exposure is consisting of foreign currency denominated sales and costs. The exposure is including foreign currency denominated balance sheet exposure consisting of accounts receivable and accounts payable and 50 per cent share of the annual contracted or estimated net currency cash flow.
The main currencies of the Group’s foreign currency transaction exposure are the US dollar, the Swedish krona and the British pound. The share of dollar is 54 per cent, share of Swedish krona is 36 per cent and share of pound is 8 per cent. A strengthening of the dollar and the pound has a positive impact on the financial result and a weakening a negative impact. A weakening of the Swedish krona has a positive impact on the result of the Group. Other significant currencies are Australian dollar and Canadian dollar. The hedging policy is to keep the balance sheet exposure and 50 per cent of annual cash flow of contracted or estimated currency flows consist-ently hedged. The amount of hedging may deviate from the normal level by 40 per cent in either direction. The Board of Directors of Metsä Board is deciding on hedging levels significantly deviating from the norm set out in the financial policy. The amount of currency-specific hedging depends on current exchange rates and market expectations, on the interest rate differences between the currencies and the significance of the exchange rate risk for the financial result of the Group. The transaction exposure is mainly hedged by forward transactions but also by the use of foreign currency loans and currency options.
At the end of the reporting period, the foreign exchange transaction exposure had been hedged 7.9 months on average (2019: 7.8) being 112 per cent of the hedging norm (109). During the reporting period, the hedging level has varied between 7 and 9 months (7–8) being between 107 and 115 per cent of the norm (107–113). The dollar’s hedging level was 6.6 months (6.2) being 97 per cent of the norm (90). The Swedish krona’s hedging level was 10.0 months (10.6) being 139 per cent of the norm (140). The pound’s hedging level was
7.8 months (7.7) being 100 per cent of the norm (100). Hedge accounting in accordance with IFRS 9 has been applied to hedging of transaction exposure and forwards and options allocated to hedge accounting have been used to hedge the portion of highly probable forecast sales of the currency transaction exposure.
The translation risk of a net investment in a foreign entity is generated from the consolidation of the equity of subsidiaries and associated companies out-side the euro area into euros in the consolidated financial statements. Hedging of equity has been discontinued.
The Group applies the Value-at-Risk method to assess the risk of its open foreign currency positions. The VaR is calculated on the deviation from the balance sheet exposure plus 50 per cent of annual foreign currency exposure hedge norm defined in the financial policy. A 99% confidence level on one month period is applied to the VaR risk figure. The risk mandates regarding hedging decisions have been defined by restricting the company management’s powers by linking them to maximum currency-specific hedging level changes and to a VaR limit. Possible strategic decisions which exceed the policy risk limits are made by the Board of Directors. The limit set for the Metsä Board’s foreign currency risk is EUR 12.5 million (10.5) and the VaR is at the end of the reporting period EUR 3.9 million (3.8). Average during the period has been EUR 3.8 million (4.1).
INTEREST RATE RISKThe interest rate risk is related in the interest bearing receivables and loans, working capital financing and currency hedging. The most significant curren-cies in risk management are the euro, the US dollar, the British pound and the Swedish krona. The objective of the interest rate risk policy is to minimise the negative impact of interest rate changes on the Group s and group companies result and the financial position, and to optimise financing costs within the framework of risk limits. The effect of interest rate changes on financial costs depends on the average interest fixing time of interest bearing assets and liabil-ities, which is measured in the Group by duration. As duration is lengthening the rise of interest rates affects more slowly the interest expenses of financial liabilities. The maturity of the loan portfolio can be influenced by adjusting between floating-rate and fixed-rate loans and by using interest rate swaps.
The average interest duration norm based on the Group’s financial policy is twelve months. The duration can, however, deviate from the hedging pol-icy norm so that the decision of a deviation exceeding four months has to be made by the Board of Directors. The average duration of loans was high 52.0 months at the end of the year (56.0). During the reporting period duration has varied between 51 and 56 months (53–65). Duration is lengthened by the 10 year bond of EUR 250 million. Of interest-bearing liabilities 13 per cent (18) is subjected to variable rates and the rest to fixed rates and the average interest rate at the end of 2020 is 2.3 per cent (2.5). At the end of 2020, an increase of one per cent in interest rates would decrease net interest rate costs of the next 12 months by EUR 2.2 million (1.3).
The Group has applied cash flow hedge accounting in accordance with IFRS 9 to interest rate swaps by which floating-rate financing has been converted to fixed-rate financing. The gross nominal volume of interest rate derivatives at the time of financial statements is EUR 100.0 million (100.0) and the maturity of interest rate swap contracts varies between 1–5 years (1–6). The ongoing interest rate benchmark reform has not had any impact on effectiveness of interest rate hedging or financial costs.
COMMODITy RISKIn the hedging of commodity risks the Group applies risk management policies defined separately for each selected commodity. According to the policy, the management of commodity risks with regard to financial hedges is accom-plished centralized by Metsä Group Treasury based on the strategy approved by Board of Directors of Metsä Board. The commodity hedging policy is applied to the management of the price risks of electricity, natural gas, propane and fuel oil and also transactions related to Emission allowances are managed by Metsä Group Treasury. Hedge accounting in accordance with IFRS 9 has been applied to all commodity hedging. According to the commodity hedging policy an 80 per cent hedge level of the estimated net position during the first 12 month period has been set as a hedging norm and the hedge ratio can vary by 20 per cent in either direction. Hedges based on previous policy are gradually maturing. The Group Board of Directors makes significant strategic decisions.
Metsä Board’s target in managing the electricity price risk is to balance the effect of changes in the price of electricity on the Group’s result and financial position. The main principle is to hedge the electricity purchase exposure, which consists of the difference of factory-specific electricity consumption estimates and power plant production shares in the possession of the Group. The hedge strategy is implemented in cooperation with Metsä Group Energy service unit centralized through Metsä Group Treasury. Approximately a quarter of Metsä Board’s mills’ purchase of fuel is based on natural gas and and the company is hedging the price risk of natural gas and propane purchases by using financial hedges. Metsä Board is hedging also the gas oil, heavy fuel oil and 0.5 % fuel oil price risk related to logistics costs (sea freights) based on commodity risk policy by using financial hedges. Metsä Board is not hedging its pulp price risk.
LIQUIDITy RISKLiquidity risk is defined as the risk that funds and available funding become insufficient to meet business needs, or costs that are incurred in arranging the necessary financing are unreasonable high. Liquidity risk is monitored by estimating the need for liquidity needs 12 – 24 months ahead and ensuring that the total liquidity available will cover a main part of this need. According to the financial policy, the liquidity reserve must at all times cover 100 per cent of the Group’s liquidity requirement for the first 12 months and 50 – 100 per cent of the following 12 – 24 months liquidity requirement. The objective is that at the most 20 per cent of the Group’s loans, including committed credit facilities, are allowed to mature within the next 12 months and at least 25 per cent of the total debt must have a maturity in excess of four years. The target is to avoid keeping extra liquidity as liquid funds and instead maintain a liquidity reserve as committed credit facilities outside the balance sheet.
The cornerstone of liquidity risk management is to manage the Group’s operative decisions in such a way that targets concerning indebtedness and sufficient liquidity reserve can be secured in all economic conditions. Liquidity risk is also managed by diversifying the use of capital and money markets to decrease dependency on any single financing source and the optimisation of the maturity structure of loans is also emphasized in financial decisions. Metsä Board is using short-term working capital financing related to accounts receivables and accounts payables. During 2020 Metsä Board has signed Finnvera guaranteed loan of EUR 100 million and EIB loan of EUR 125 million for Husum investments.
Metsä Board’s liquidity has remained strong. At the end of the review period, available liquidity was EUR 605.8 million (334.2), consisting of following items: liquid assets and investments of EUR 214.0 million (134.2), a syndicated credit facility (revolving credit facility) of EUR 200.0 million (200.0), and other committed credit facilities of EUR 191.8 million (0.0). As of 2020, the company will no longer include undrawn pension premium (TyEL) funds in available liquidity. Of the liquid assets, EUR 204.7 million consisted of short-term depos-its with Metsä Group Treasury (127.1), and EUR 9.3 million were cash funds and investments (7.1). Other interest-bearing receivables amounted to EUR 2.9 million (2.9). In addition, Metsä Board’s liquidity reserve is complemented by Metsä Group’s internal undrawn short-term credit facility of EUR 150.0 million (150.0) and undrawn pension premium (TyEL) funds of EUR 212.3 million (190.1). At the end of 2020, the liquidity reserve covers fully the forecasted financing need of 2021–2022. 1 per cent (4) of long-term loans and committed facilities fall due in a 12 month period and 88 per cent (95) have a maturity of over four years. The average maturity of long-term loans is 5.7 years (6.4). The share of short-term financing of the Group’s interest bearing liabilities is 0.3 per cent (0.4).
COUNTERPARTy RISKFinancial instruments carry the risk that the Group may incur losses should the counterparty be unable to meet its commitments. The Group is managing this risk by entering into financial transactions only with most creditworthy counterparties and within pre-determined limits. Cash and cash equivalents, and other investments have been spread to several banks, commercial papers of several institutions and money market funds. During the reporting period, credit risks of financial instruments did not result in any losses. However corona pandemic had a negative effect on valuation of financial investments in Q1, but this was compensated later in 2020. Counterparty limits have been revised during the year by taking into account the needs of the company and the view on the financial position of the used counterparties. Derivatives trading is regulated by the standardised ISDA contracts made with the counterparties. Main part of financial credit risks are in the balance sheet of Metsä Group Treasury and not directly in the balance sheet of Metsä Board. The Group has applied expected credit loss model in accordance with IFRS 9 to calculate the impairment of financial assets.
The Group’s accounts receivable carry a counterparty risk that the Group may incur losses should the counterparty be unable to meet its commitments. Credit risk attached to accounts receivable is managed on the basis of the credit risk management policies approved by operative management. Accounts receiv-able performance is followed by Group Credit Risk Management Team and reported monthly to Customer Credit & Compliance Committee and operative management. Credit quality of customers is assessed at regular intervals based on the customers’ financial statements, payment behaviour, credit agencies and credit ratings agencies. Individual credit limits are reviewed at least annually. Letters of Credits, bank and parent company guarantees and Credit insurance are used to mitigate credit risk according to management decisions. Credit limits are approved according to credit risk management policy with approval limits of varying values across the Group. The Customer Credit & Compliance Committee reviews and sets all major credit limits which are not supported by credit insurance and/ or other security. In response to the corona pandemic, more regular reviews of customer credit risks have been undertaken, along with the credit insurance companies.
8988
METSÄ BOARD Annual Report 2020
Business operations and value creation
2 This is Metsä Board
4 CEO’s review
6 Highlights of the year
8 Strategy and targets
10 Creating value
12 Operating environment
16 Product and service development
18 Circular economy
Sustainability
20 Sustainability targets
24 We bring the forest to you
26 We offer sustainable choices
30 We work for a better climate and environment
34 We create well-being
40 Mill-specific information
Financial development
44 Report of the Board of Directors
57 Consolidated financial statements
61 Notes to the consolidated financial statements
107 Parent company financial statements
110 Notes to the parent company financial statements
123 Auditor’s report
126 Shares and shareholders
132 Key figures and taxes
Governance
134 Corporate governance statement
140 Metsä Board Corporation’s Board of Directors
142 Metsä Board Corporation’s Corporate Management Team
144 Investor relations and investor information

21 22 23 24 25 26-
300
250
200
150
100
50
0
SUSTAINABILITYBUSINESS OPERATIONS AND VALUE CREATION GOVERNANCE
FINANCIAL DEVELOPMENT
CONSOLIDATED FINANCIAL STATEMENTS | METSÄ BOARD ANNUAL REPORT 2020
Metsä Board implements regular impairment tests for customer accounts receivables. Credit loss impairment is booked when a customer enters legal bankruptcy or becomes past due for more than 6 months (180 days) without a valid payment plan or other acceptable reasons. New net credit loss provisions for the year were EUR 0.3 million (2019: 1.0). The portion of overdue client receivables of all accounts receivable is at the time of financial statements 3.8 per cent (7.5), of which 0.0 per cent (0.1) is overdue between 90–180 days and 0.9 per cent (0.1) over 180 days. The specification of doubtful receivables is in the Notes. Expected credit losses on accounts receivables in accordance with IFRS 9 are calculated by using a provision matrix. Expected credit loss expense is recognized by applying expected credit loss percentages based on five-year historic losses on accounts receivables from external debtors net of credit insurance outstanding at period end. The calculations were adjusted to take in to account the impact of corona pandemic. The expected credit loss percentage is 0.5 per cent of receivables (0.1).
The geographical structure of the accounts receivable is diversified and is reflecting the external sales structure presented in the Segment information. The top ten largest sources of credit risk exist in USA, Italy, United Kingdom, Turkey, Germany, Russian Federation, Poland, Spain, Finland and Australia (around 68 per cent of total external receivables (64)). The share of largest indi-vidual customer (individual companies or groups of companies under common ownership) credit risk exposure of Metsä Board at the end of 2020 represented 5 per cent (4) of total external accounts receivable. 31 per cent (30) of accounts receivable was owed by ten largest customer groups (individual companies or groups of companies under common ownership). At the end of 2020, there was around 1.0 per cent (1.4) shortfall of credit insurance limits beyond usual policy deductibles and exclusions.
MANAGING THE CAPITALTerms capital and capital structure are used to describe investments made in the company by its owners and retained earnings (together equity) and debt capital (liabilities) as well as the relation between them. In managing its capital structure, the Group aims at maintaining an efficient capital structure that ensures the Group’s operational conditions in financial and capital markets in
HEDGING OF FOREIGN EXCHANGE TRANSACTION EXPOSURE 31.12.2020 Annual transaction exposure
EUR million USD GBP SEK AUD CAD Other long Other short Total
Transaction exposure, net (mill. currency units) 761 80 -4,188 22 14
Transaction exposure, net (EUR million) 620 89 -417 14 9 3 0 1,152
Transaction exposure hedging (EUR million) -339 -58 347 -7 -4 0 0 -755
Hedging at the end of the year (months) 6.6 7.8 10.0 6.4 5.0 7.9
Average hedging in 2020 (months) 6.7 7.5 10.3 10.3 6.1 8.0
Average rate of hedging at the end of the year 1,1873 0,9066 10,5698
HEDGING OF FOREIGN EXCHANGE TRANSACTION EXPOSURE 31.12.2019 Annual transaction exposure
EUR million USD GBP SEK AUD CAD Other long Other short Total
Transaction exposure, net (mill. currency units) 709 72 -4,073 11 14
Transaction exposure, net (EUR million) 631 85 -390 7 10 3 0 1,125
Transaction exposure hedging (EUR million) -325 -54 345 -6 -5 0 0 -736
Hedging at the end of the year (months) 6.2 7.7 10.6 11.3 6.0 7.8
Average hedging in 2019 (months) 6.3 7.4 10.2 10.8 6.0 7.7
Average rate of hedging at the end of the year 1,1232 0,8777 10,7000
NET INvESTMENTS IN A FOREIGN ENTITy 31.12.2020 Equity exposure
EUR million USD GBP SEK Others Total
Equity exposure (mill. currency units) 93 6 4,084
Equity exposure (EUR million) 76 6 407 4 493
NET INvESTMENTS IN A FOREIGN ENTITy 31.12.2019 Equity exposure
EUR million USD GBP SEK Others Total
Equity exposure (mill. currency units) 91 9 4,051
Equity exposure (EUR million) 81 10 388 6 485
INTEREST RATE RISK / DURATION AND RE-PRICING STRUCTURE OF LOANS (INCL. INTEREST RATE DERIvATIvES) 31.12.2020
Loanamount
(EUR million)Duration(months)
Averageinterest rate
(%)
Interest ratesensitivity
(EUR million)
31 Dec 20Re-pricing structure of interest rates of loans
1–4/2021 5–8/2021 9–12/2021 2022 2023 2024 >2024
452 52,0 2,3 -2,2 -98 3 151 7 57 6 326
INTEREST RATE RISK / DURATION AND RE-PRICING STRUCTURE OF LOANS (INCL. INTEREST RATE DERIvATIvES) 31.12.2019
Loanamount
(EUR million)Duration(months)
Averageinterest rate
(%)
Interest ratesensitivity
(EUR million)
31 Dec 19Re-pricing structure of interest rates of loans
1–4/2020 5–8/2020 9–12/2020 2021 2022 2023 >2023
445 56.0 2.5 -1.3 -97 20 158 2 2 52 308
1) Interest rate sensitivity is an estimate of the effect of an interest rate change of one percent in one direction on net interest cost based on year end exposure
HEDGING OF ELECTRICITy PRICE RISK EXPOSURE
GWh 31 Dec 20 31 Dec 19
Electricity exposure, net 2021 850 773
Electricity hedging 2021 367 458
Hedging at the end of the year 2020 (%) 43 59
Average price of hedging at the end of the year 2020 (e/MWh) 24,10 21.38
Electricity price risk is hedged based on defined risk management policy by physical contracts or by financial contracts. The net electricity exposure has been calculated by taking into account the own and associated companies electricity production.
all circumstances despite the fluctuations typical to the sector. The company has a credit rating for its long-term financing. Certain central target values, which correspond to standard requirements set by financing and capital markets, have been defined for the capital structure. No target level has been defined for the credit rating. The Group’s capital structure is regularly assessed by the Group’s Board of Directors and its Audit Committee.
Metsä Board updated the company s long-term financial targets and decided on a new dividend policy in 2017. Metsä Board s target for the comparable return on capital employed is at least 12 per cent. According to the company s new target, the ratio of interest-bearing net liabilities to comparable EBITDA is a maximum of 2.5. This target level gives the company enough flexibility for potential growth in the future. In 2020 the long-term financial targets have been kept constant.
The key ratios describing the capital structure and the capital amounts used for the calculation of the key ratio were on 31.12.2020 and 31.12.2019 the following:
EUR million 2020 2019
Interest-bearing net liabilities/comparable EBITDA 0.7 1.1
Net gearing ratio, % 17 23
Interest-bearing borrowings 452.4 444.9
./. Liquid funds 214.0 134.2
./.Interest-bearing receivables 2.9 2.9
Net interest bearing liabilities 235.5 307.8
Equity attributable to shareholdersof parent company
1,383.8 1,338.0
+ Non-controlling interest
Total Equity 1,383.8 1,338.0
In Group s certain financial contracts financial covenants have been set regarding financial performance and capital structure. Other covenants in the Group’s loan agreements are customary terms and conditions including for example a negative pledge, restrictions on major asset disposals, limitations on subsidiary indebtedness, restrictions on changes of business and mandatory prepayment obligations upon a change of control of the Group. The Group has been in compliance with its covenants during the accounting periods 2020 and 2019. In case the company could not meet its obligations as defined in financial contracts and in order to avoid a breach of contract that could have an adverse effect on the company’s financial position, it would need to renegotiate its financial arrangements, payback its loans or get its debtors to give up their claims to meet these obligations.
Metsä Group has launched a Green Finance Framework, which integrates sustainability and climate change mitigation to the Group s investments and related financing activities. The framework is based on the Group s strategy and the strategic sustainability objectives for 2030.
Metsä Group has launched a Green Finance Framework, which integrates sustainability and climate change mitigation to the Group s investments and related financing activities. The framework is based on the Group s strategy and the strategic sustainability objectives for 2030.
REPAYMENT OFNON-CURRENTLOANSEUR million
BREAKDOWNOF CURRENCY EXPOSURE%
USD 54%
SEK 36%
GBP 8%
AUD 1%
CAD 1%
Others 0%
9190
METSÄ BOARD Annual Report 2020
Business operations and value creation
2 This is Metsä Board
4 CEO’s review
6 Highlights of the year
8 Strategy and targets
10 Creating value
12 Operating environment
16 Product and service development
18 Circular economy
Sustainability
20 Sustainability targets
24 We bring the forest to you
26 We offer sustainable choices
30 We work for a better climate and environment
34 We create well-being
40 Mill-specific information
Financial development
44 Report of the Board of Directors
57 Consolidated financial statements
61 Notes to the consolidated financial statements
107 Parent company financial statements
110 Notes to the parent company financial statements
123 Auditor’s report
126 Shares and shareholders
132 Key figures and taxes
Governance
134 Corporate governance statement
140 Metsä Board Corporation’s Board of Directors
142 Metsä Board Corporation’s Corporate Management Team
144 Investor relations and investor information

SUSTAINABILITYBUSINESS OPERATIONS AND VALUE CREATION GOVERNANCE
FINANCIAL DEVELOPMENT
CONSOLIDATED FINANCIAL STATEMENTS | METSÄ BOARD ANNUAL REPORT 2020
MARKET RISK SENSITIvITy 2020 31 Dec 20 Impact on equity exposure and annual transaction exposure
MEUR
Impact on financial assets
and liabilities
Impact onnet equity of
foreign entities
Impact on annualtransaction expo-
sure (cash flow)
Impact on annualtransaction expo-
sure (cash flow)incl. hedging
Interest rate risk (100 bp rise in interest rates)
Effect on profit 2.2 5.3
Effect on other change in equity 3.0
Commodity risk (electricity price + 20%)
Effect on profit -5.8 -3.7
Effect on other change in equity 2.0
FX risk (USD - 10%)
Effect on profit -0.5 -62.0 -28.1
Effect on other change in equity 29.7 -7.6
FX risk (GBP - 10%)
Effect on profit 0.1 -8.9 -3.1
Effect on other change in equity 4.4 -0.6
FX risk (SEK - 10%)
Effect on profit 0.2 41.7 7.0
Effect on other change in equity -30.7 -40.7
MARKET RISK SENSITIvITy 2019 31 Dec 19 Impact on equity exposure and annual transaction exposure
MEUR
Impact on financial assets
and liabilities
Impact onnet equity of
foreign entities
Impact on annualtransaction expo-
sure (cash flow)
Impact on annualtransaction expo-
sure (cash flow)incl. hedging
Interest rate risk (100 bp rise in interest rates)
Effect on profit 4.0 1.3 5.3
Effect on other change in equity
Commodity risk (electricity price + 20%)
Effect on profit -5.3 -1.5
Effect on other change in equity 3.9
FX risk (USD - 10%)
Effect on profit 0.0 -63.1 -30.6
Effect on other change in equity 31.4 -8.1
FX risk (GBP - 10%)
Effect on profit 0.0 -8.5 -3.0
Effect on other change in equity 4.2 -1.0
FX risk (SEK - 10%)
Effect on profit -0.3 39.0 4.5
Effect on other change in equity -29.2 -38.8
Items with + sign = positive effect = increase of assets / decrease of liabilities / increase of cash flow Items with - sign = negative effect = decrease of assets / increase of liabilities / decrease of cash flow
IFRS 7 requires an entity to disclose a sensitivity analysis for each type of market risk to which the entity is exposed at the reporting date, showing how profit or loss and equity would have been affected by changes in the relevant risk variable that were reasonably possible at that date. The Group has recognised interest rates, electricity prices and foreign exchange rates as its key market risks and has set 1 per cent interest rate rise, 20 per cent rise in electricity price and 10 per cent weakening of USD, GBP and SEK as reasonably possible risk variables. These currencies represent over 98 per cent of Group s annual transaction exposure. The nature of the market price risk is relatively linear so that the size of effects of opposite market price changes do not essentially differ from the presented figures. The scenarios have been calculated by using regular principles of calculating market values of financial instruments described in the Group Accounting policies. Figures at the reporting date reflect quite well the average market risk conditions throughout the reporting period.
Additionally the Group is presenting figures describing the effects of the risk variables to its equity exposure and annual transaction exposure (cash flow) to present a broader picture about market risks of interest rates, electricity prices and foreign exchange rates. Annual cash flows are based on estimates, but not existing commercial contracts. The weakening of USD and GBP has a negative impact on annual cash flow and the weakening of SEK has a positive impact. Hedges reduce this impact depending on hedging strategy. The impact on net equity of foreign entities is arising from the consolidation of subsidiaries to the Group consolidated accounts. The rise of electricity price has a negative impact on cash flow. As according to hedging policy the electricity price risk of the nearest year has mostly been hedged, the impact including hedges remains minor.
CASH FLOWS OF INSTALLMENTS AND INTEREST PAyMENTS OF FINANCIAL LIABILITIES 2020
EUR million 2021 2022 2023 2024 2025 2026– Total
Bonds 248.6 248.6
Loans from financial institutions 3.9 3.9 3.9 153.0 17.4 182.1
Finance lease liabilities 1) 6.7 5.3 3.9 2.4 1.2 2.9 22.3
Non-current interest-bearing liabilities total 6.7 9.2 7.8 6.3 154.2 268.9 453.1
Current interest-bearing liabilities 1.3
Total liabilities 8.0 9.2 7.8 6.3 154.2 268.9 454.4
Interest payments 8.6 8.6 8.5 8.5 7.5 14.2 55.9
Guarantee agreements 0.8 0.2 0.1 2.4 3.5
Derivatives
Currency derivative, liabilities 963.6 963.6
Currency derivative, receivables -988.0 -988.0
Interest rate swaps, liabilities 1.0 0.9 0.7 0.5 0.2 3.4
Commodity derivatives, liabilities 0.4 0.1 0.4
Commodity derivatives, receicables -4.3 0.0 -4.3
Derivatives, net -27.3 1.0 0.7 0.5 0.2 0.0 -24.9
CASH FLOWS OF INSTALLMENTS AND INTEREST PAyMENTS OF FINANCIAL LIABILITIES 2019
EUR million 2020 2021 2022 2023 2024 2025– Total
Bonds 248.5 248.5
Loans from financial institutions 148.8 148.8
Pension loans 24.1 24.1
Finance lease liabilities 1) 6.8 4.9 3.9 2.7 1.6 4.1 24.1
Non-current interest-bearing liabilities total 30.9 4.9 3.9 2.7 1.6 401.5 445.6
Current interest-bearing liabilities 1.6 1.6
Total liabilities 32.5 4.9 3.9 2.7 1.6 401.5 447.2
Interest payments 8.9 8.2 8.2 8.2 8.2 21.0 62.9
Guarantee agreements 6.4 0.2 0.2 2.4 9.1
Derivatives
Currency derivative, liabilities 964.7 964.7
Currency derivative, receivables -970.5 -970.5
Interest rate swaps, liabilities 0.9 0.7 0.7 0.4 0.3 0.1 3.1
Commodity derivatives, liabilities 3.0 0.0 0.0 3.0
Commodity derivatives, receicables -6.7 -1.1 -0.2 -8.1
Derivatives, net -8.7 -0.4 0.4 0.4 0.3 0.1 -7.8
1) Cash flows from lease liabilities include both debt repayment and financing expense.
The balance sheet value of lease liabilities on December 31, 2020 was EUR 20.4 million (21.8). The balance sheet value of currency derivative liabilities on 31 December 2020 was EUR 4.6 million (4.8) and the value of currency derivative receivables was EUR 29.0 million (10.6).
9392
METSÄ BOARD Annual Report 2020
Business operations and value creation
2 This is Metsä Board
4 CEO’s review
6 Highlights of the year
8 Strategy and targets
10 Creating value
12 Operating environment
16 Product and service development
18 Circular economy
Sustainability
20 Sustainability targets
24 We bring the forest to you
26 We offer sustainable choices
30 We work for a better climate and environment
34 We create well-being
40 Mill-specific information
Financial development
44 Report of the Board of Directors
57 Consolidated financial statements
61 Notes to the consolidated financial statements
107 Parent company financial statements
110 Notes to the parent company financial statements
123 Auditor’s report
126 Shares and shareholders
132 Key figures and taxes
Governance
134 Corporate governance statement
140 Metsä Board Corporation’s Board of Directors
142 Metsä Board Corporation’s Corporate Management Team
144 Investor relations and investor information

SUSTAINABILITYBUSINESS OPERATIONS AND VALUE CREATION GOVERNANCE
FINANCIAL DEVELOPMENT
CONSOLIDATED FINANCIAL STATEMENTS | METSÄ BOARD ANNUAL REPORT 2020
5.7 CLASSIFICATION AND FAIR VALUES OF FINANCIAL ASSETS AND LIABILITIES
CLASSIFICATION AND FAIR vALUES OF FINANCIAL ASSETS AND LIABILITIES 2020
EUR million NoteFair value through
profit and lossFair value through other comprehensive income Amortised cost Total carrying amount
Financial assets
Other non-current investments 4.3 3.5 183.4 186.9
Other non-current financial assets 5.3 10.8 10.8
Accounts receivable and other receivables 4.5 276.7 276.7
Cash and cash equivalents 5.4 214.0 214.0
Derivative financial instruments 5.7 0.6 32.6 33.3
Total carrying amount 4.1 216.0 501.5 721.6
Total fair value 4.1 216.0 501.5 721.6
Financial liabilities
Non-current interest-bearing financial liabilities 5.5 444.8 444.8
Other non-current financial liabilities 4.7 0.4 0.4
Current interest-bearing financial liabilities 5.5 7.6 7.6
Accounts payable and other liabilities 4.7 306.0 306.0
Derivative financial instruments 5.7 1.1 7.2 8.4
Total carrying amount 1.1 7.2 758.7 767.1
Total fair value 1.1 7.2 791.7 800.1
CLASSIFICATION AND FAIR vALUES OF FINANCIAL ASSETS AND LIABILITIES 2019
EUR million NoteFair value through
profit and lossFair value through other comprehensive income Amortised cost Total carrying amount
Financial assets
Other non-current investments 4.3 3.7 251.4 255.1
Other non-current financial assets 5.3 15.2 15.2
Accounts receivable and other receivables 4.5 303.8 303.8
Cash and cash equivalents 5.4 134.2 134.2
Derivative financial instruments 5.7 0.7 17.9 18.6
Total carrying amount 4.4 269.4 453.2 726.9
Total fair value 4.4 269.4 453.2 726.9
Financial liabilities
Non-current interest-bearing financial liabilities 5.5 412.9 412.9
Other non-current financial liabilities 4.7 0.3 0.3
Current interest-bearing financial liabilities 5.5 32.0 32.0
Accounts payable and other liabilities 4.7 315.4 315.4
Derivative financial instruments 5.7 0.3 10.6 10.9
Total carrying amount 0.3 10.6 760.6 771.4
Total fair value 0.3 10.6 789.4 800.3
Accounts receivable and other receivables do not include advance payments, accrued tax receivables and periodisations of employee costs (Note 4.5). Accounts payable and other financial liabilities do not include advance pay-ments, accrued tax liabilities and periodisations of employee costs (Note 4.7).
In Metsä Board, all interest-bearing liabilities are valued in the balance sheet at amortised cost based on effective interest method.
Fair values are based on present value of cash flow of each liability or assets calculated by market rate. The discount rates applied are between 0.3–1.5 per cent (31 December 2019: 0.3–2.1). The fair values of accounts and other receivables and accounts payable and other liabilities do not materially deviate from their carrying amounts in the balance sheet.
FAIR vALUE HIERARCHy OF FINANCIAL ASSETS AND LIABILITIES
ACCOUNTING PRINCIPLESFinancial assets and liabilities measured at fair value have been catego-rised as follows:
Level 1 Fair value is based on quoted prices in active markets.
Level 2 Fair value is determined by using valuation techniques that use observable price information from market.
Level 3 Fair value are not based on observa-ble market data, but on company’s own assumptions.
The fair value measurement of financial assets at fair value recognised under other items of comprehensive income is described in Note 4.3.
The fair values of electricity, natural gas and fuel oil derivatives are determined by using public price quotations in an active market (Level 1).
The fair values of currency forwards and options are determined by using the market prices of the closing date of the reporting period. The fair values of interest rate swaps are determined by using the present value of expected payments, discounted using a risk adjusted discount rate, supported by market interest rates and other market data of the closing date of the reporting period (Level 2).
For financial instruments not traded on an active market, the fair value is determined by valuation techniques. Judgment is used when choosing the different techniques and making assumptions, which are mainly based on circumstances prevailing in the markets on each closing date of the reporting period (Level 3).
FAIR vALUE HIERARCHy OF FINANCIAL ASSETS AND LIABILITIES 202031 Dec 2020
EUR million Note Level 1 Level 2 Level 3 Total
Financial assets at fair value
Other non-current investments 4.3 186.9 186.9
Derivative financial assets 5.7 2.3 30.9 33.3
Financial liabilities measured at fair value
Derivative financial liabilities 5.7 0.4 8.0 8.4
Financial assets not measured at fair value
Cash and cash equivalents 5.4 214.0 214.0
Financial liabilities not measured at fair value
Non-current interest-bearing financial liabilities 5.5 477.8 477.8
Current interest-bearing financial liabilities 5.5 7.6 7.6
FAIR vALUE HIERARCHy OF FINANCIAL ASSETS AND LIABILITIES 201931 Dec 2019
EUR million Note Level 1 Level 2 Level 3 Total
Financial assets at fair value
Other non-current investments 4.3 0.0 255.1 255.1
Derivative financial assets 5.7 8.1 10.6 18.6
Financial liabilities measured at fair value
Derivative financial liabilities 5.7 2.0 8.8 10.9
Financial assets not measured at fair value
Cash and cash equivalents 5.4 134.2 134.2
Financial liabilities not measured at fair value
Non-current interest-bearing financial liabilities 5.5 441.4 441.4
Current interest-bearing financial liabilities 5.5 32.3 32.3
OTHER NON-CURRENT INvESTMENTS MEASURED AT FAIR vALUE BASED ON LEvEL 3 vALUATION
EUR million 2020 2019
Value 1 Jan 255.1 270.1
Total gains and losses in profit and loss -0.1 3.2
Total gains and losses in other comprehensive income -70.3 -14.7
Purchases 2.2 0.0
Sales -0.1 -3.5
Value Dec 31. 186.9 255.1
9594
METSÄ BOARD Annual Report 2020
Business operations and value creation
2 This is Metsä Board
4 CEO’s review
6 Highlights of the year
8 Strategy and targets
10 Creating value
12 Operating environment
16 Product and service development
18 Circular economy
Sustainability
20 Sustainability targets
24 We bring the forest to you
26 We offer sustainable choices
30 We work for a better climate and environment
34 We create well-being
40 Mill-specific information
Financial development
44 Report of the Board of Directors
57 Consolidated financial statements
61 Notes to the consolidated financial statements
107 Parent company financial statements
110 Notes to the parent company financial statements
123 Auditor’s report
126 Shares and shareholders
132 Key figures and taxes
Governance
134 Corporate governance statement
140 Metsä Board Corporation’s Board of Directors
142 Metsä Board Corporation’s Corporate Management Team
144 Investor relations and investor information

SUSTAINABILITYBUSINESS OPERATIONS AND VALUE CREATION GOVERNANCE
FINANCIAL DEVELOPMENT
CONSOLIDATED FINANCIAL STATEMENTS | METSÄ BOARD ANNUAL REPORT 2020
FINANCIAL DERIvATIvES AND HEDGE ACCOUNTING
ACCOUNTING PRINCIPLESDerivative contracts are initially recognised on the balance sheet at fair value at cost, and thereafter during their term-to-maturity revalued at their fair value at each reporting date. The fair value of derivatives is presented in non-interest-bearing receivables or liabilities. Gains and losses resulting from recognition at fair value are treated in accounting as required with regard to the intended use of the derivative contract in question. Derivatives are initially classified as either
1. Hedges of the exposure to changes in the fair value of receivables, liabilities or firm commitments;
2. Hedges of the cash flow from a highly probable forecast transaction;
3. Hedges of a net investment in a foreign entity, or
4. Derivatives to which it has been decided not to apply hedge accounting.
Metsä Board currently applies hedge accounting only to cash flow hedging. When applying hedge accounting at the inception of a hedging relationship, the Group has documented the relationship between the hedged item and the hedging instruments, as well as the hedging strategy observed. To meet the requirements of hedge accounting, the Group has also continuously carried out effectiveness testing to verify that changes in the fair value of the hedging instrument for each hedging relationship cover any changes in the fair value of the hedged item effec-tively enough, with respect to the hedged risk. Changes in the fair value of the effective portion of derivative instruments that meet the criteria for cash flow hedging are recognised in other items of comprehensive income. The gains and losses recognised in equity are transferred to the income statement when the forecast sale or purchase is realised, and are recognised as an adjustment to the hedged item. If the forecast transaction is no longer expected to occur, the gain or loss accrued in equity is recognised immediately in the income statement.
Derivatives not subject to hedge accounting, as well as the ineffective portion of derivatives subject to hedge accounting, are measured at fair value, and changes in the value of interest rate and currency derivatives are recognised in financial items and changes in the value of commodity derivatives are recognised in other income and expenses.
Hedge accounting is applied as cash flow hedging to highly probable cash flows from sales denominated in foreign currencies and contractual cash flows from floating interest rates of loans. In the management of price risks related to commodities, hedge accounting is applied to cash flows from highly probable purchases of electricity, liquefied natural gas (LNG), natural gas, propane, light, heavy and 0.5% fuel oil. The fair values of forward foreign exchange contracts are based on the forward prices prevailing on the balance sheet date, and currency options are measured at fair value in accordance with the Black–Scholes model. Interest rate
swaps are measured at the current value of cash flows, with the calcula-tion being based on the market interest rate yield curve. The fair values of derivatives are measured on the basis of publicly quoted market prices.
MANAGEMENT OF FINANCIAL RISKS AND HEDGE EFFECTIVENESSThe management of the Group’s currency, interest rate and commodity risks is described in more detail in Note 5.6, Management of financial risks. Note 5.7., Fair values of financial assets and liabilities, includes the fair values and grouping of derivatives. Note 5.1, Equity, includes itemisations of hedge accounting entries in the fair value reserve.
The hedging of the currency flow position is effective, given that there is a direct financial relationship between the hedged sale and the hedging derivative. The spot rate component of a forward contract or the reference value component of a currency option has been determined as the hedged item, and the forward points or the option’s time value are treated as hedging costs subject to amortisation based on the period. Currency flow forecasts are fairly stable, invoicing steady within quarters and months, and forward deals are allocated to each month, due to which the ineffectiveness of hedging usually remains very low. Changes in pro-duction or the structure of sales may sometimes lead to ineffectiveness during the validity of a hedging relationship, in which case the hedging is adjusted accordingly.
The hedge accounting of the cash flow from interest rates is primarily effective, given that there is a direct financial relationship between the long-term loans subject to hedging and the hedging interest rate swaps. Ineffectiveness in the hedge relationship derives from any possible differences between the loans and the swaps’ interest rate periods as well as from differences in the reference rates of contract terms. The ineffective portion of interest rate hedging is recognised through profit and loss. Premature loan withdrawals or premature repayment of loans may result in a state of ineffectiveness, in which case the hedging interest rate swaps are reversed or derecognised from hedge accounting, and the change in fair value is recognised in financial items under income.
The hedging of commodity purchases is effective, given that, in lieu of the total purchase price, the hedged item is the same, identical risk component of pricing applied in the hedging derivative. In the hedging of the price risk of electricity, the hedged item is what is referred to as the portion of the system price and the hedging takes place with a system-priced electricity swap. Correspondingly, the price components of the purchases and the hedging derivative in the hedging of natural gas, propane and fuel oil are identical. Commodity purchases are fairly steady and hedges are allocated to each month, due to which the ineffectiveness of the hedging usually remains low. Changes in the use of various com-modities may sometimes lead to ineffectiveness during the validity of a hedging relationship, in which case the hedging is adjusted accordingly.
DERIvATIvES 2020Nominal value Fair value
EUR million Derivative assetsDerivative liabilities Fair value net
Fair value through profit and loss
Fair value through other
comprehensive income
Interest rate swaps 100.0 3.4 -3.4 -3.4
Interest rate derivatives 100.0 3.4 -3.4 -3.4
Currency forward contracts 959.1 29.0 4.6 24.4 -0.5 24.9
Currency derivatives 959.1 29.0 4.6 24.4 -0.5 24.9
Electricity derivatives 9.8 0.6 0.3 0.3 0.3
Oil derivatives 12.3 1.3 0.1 1.2 1.2
Other commodity derivatives 8.3 2.4 0.0 2.3 2.3
Commodity derivatives 30.4 4.3 0.4 3.9 3.9
Derivatives total 1,089.4 33.3 8.4 24.9 -0.5 25.4
DERIvATIvES 2019
Nominal value Fair value
EUR million Derivative assets Derivative liabilities Fair value netFair value through
profit and loss
Fair value through other
comprehensive income
Interest rate swaps 100.0 3.1 -3.1 -3.1
Interest rate derivatives 100.0 3.1 -3.1 -3.1
Currency forward contracts 959.9 10.3 4.7 5.6 0.4 5.2
Currency option contracts 480.3 0.2 0.1 0.1 0.1
Currency derivatives 1,440.2 10.6 4.8 5.8 0.4 5.3
Electricity derivatives 17.1 7.5 1.4 6.1 6.1
Oil derivatives 7.6 0.5 0.5 0.0 0.0
Other commodity derivatives 8.5 0.1 1.1 -1.0 -1.0
Commodity derivatives 33.2 8.1 3.0 5.1 0.0 5.1
Derivatives total 1,573.4 18.6 10.9 7.8 0.4 7.3
Changes in the value of hedge accounting and the effects on profit or loss are presented in Note 5.1 Equity
ECONOMIC EFFECT OF THE NET SETTLEMENT OF INSTRUMENTS UNDER MASTER NETTING AGREEMENTS EXECUTED
2020 2019
Financialderivatives
on-balance sheet
Assets and liabilities
related to master netting
agreements Net risk
Financialderivatives
on-balance sheet
Assets and liabilities
related to master netting
agreements Net risk
Derivative assets 33.3 33.3 18.6 18.6
Derivative liabilities -8.4 -8.4 -10.9 -10.9
Master netting agreements are used for derivative contracts entered into by the Group and its counterparties. In the event of unlikely credit events, all valid trans-actions based on the agreement will be cancelled, and only one net sum will be payable by each counterparty for all the transactions. The items are not netted on the balance sheet.
9796
METSÄ BOARD Annual Report 2020
Business operations and value creation
2 This is Metsä Board
4 CEO’s review
6 Highlights of the year
8 Strategy and targets
10 Creating value
12 Operating environment
16 Product and service development
18 Circular economy
Sustainability
20 Sustainability targets
24 We bring the forest to you
26 We offer sustainable choices
30 We work for a better climate and environment
34 We create well-being
40 Mill-specific information
Financial development
44 Report of the Board of Directors
57 Consolidated financial statements
61 Notes to the consolidated financial statements
107 Parent company financial statements
110 Notes to the parent company financial statements
123 Auditor’s report
126 Shares and shareholders
132 Key figures and taxes
Governance
134 Corporate governance statement
140 Metsä Board Corporation’s Board of Directors
142 Metsä Board Corporation’s Corporate Management Team
144 Investor relations and investor information

SUSTAINABILITYBUSINESS OPERATIONS AND VALUE CREATION GOVERNANCE
FINANCIAL DEVELOPMENT
CONSOLIDATED FINANCIAL STATEMENTS | METSÄ BOARD ANNUAL REPORT 2020
CASH FLOW HEDGE MATURITIES 2020
EUR million1–6
months6–12
months1–5
yearsover 5years
Hedged cash flow total
Interest rate derivatives, hedge accounting 100.0 100.0
Currency rate derivatives, hedge accounting 548.9 110.9 659.8
Currency derivatives, no hedge accounting 100.5 0.0 0.0 100.5
Commodity derivatives, hedge accounting 15.2 14.2 1.0 30.4
CASH FLOW HEDGE MATURITIES 2019
EUR million1–6
months6–12
months1–5
yearsover 5years
Hedged cash flow total
Interest rate derivatives, hedge accounting 50.0 50.0 100.0
Currency rate derivatives, hedge accounting 525.4 99.2 624.6
Currency derivatives, no hedge accounting 87.4 87.4
Commodity derivatives, hedge accounting 17.0 9.4 3.3 29.8
DERIvATIvES 2020Nominal value Fair value
EUR million Derivative assetsDerivative liabilities Fair value net
Fair value through profit and loss
Fair value through other
comprehensive income
Interest rate swaps XXX.X X.X -X.X -X.X
Interest rate derivatives XXX.X X.X -X.X -X.X
Currency forward contracts XXX.X XX.X X.X X.X X.X X.X
Currency option contracts XXX.X X.X X.X X.X X.X
Currency derivatives X.XXX.X XX.X X.X X.X X.X X.X
Electricity derivatives XX.X X.X X.X X.X X.X
Oil derivatives X.X X.X X.X -X.X -X.X
Other commodity derivatives X.X X.X X.X -X.X -X.X
Commodity derivatives XX.X X.X X.X X.X X.X X.X
Derivatives total X.XXX.X XX.X XX.X X.X X.X X.X
DERIvATIvES 2019
Nominal value Fair value
EUR million Derivative assets Derivative liabilities Fair value netFair value through
profit and loss
Fair value through other
comprehensive income
Interest rate swaps 100.0 3.1 -3.1 -3.1
Interest rate derivatives 100.0 3.1 -3.1 -3.1
Currency forward contracts 959.9 10.3 4.7 5.6 0.4 5.2
Currency option contracts 480.3 0.2 0.1 0.1 0.1
Currency derivatives 1.440.2 10.6 4.8 5.8 0.4 5.3
Electricity derivatives 17.1 7.5 1.4 6.1 6.1
Oil derivatives 7.6 0.5 0.5 -0.0 -0.0
Other commodity derivatives 8.5 0.1 1.1 -1.0 -1.0
Commodity derivatives 33.2 8.1 3.0 5.1 0.0 5.1
Derivatives total 1.573.4 18.6 10.9 7.8 0.4 7.3
6. INCOME TAXES
ACCOUNTING PRINCIPLESTax expenses in the income statement consist of taxes based on the taxable income for the period, taxes for previous periods, and deferred tax assets and liabilities. The tax effect related to the items recorded in the comprehensive income statement is recognised in the comprehensive income statement. Taxes based on the taxable income for the period are calculated based on taxable income in accordance with the tax rate as it stands in each country at that time. Deferred tax assets and liabilities are calculated on the tem-porary differences between the carrying amount and the tax base in accordance with the tax rates enacted as at the balance sheet date.
No deferred taxes are recognised for non-deductible goodwill, and no deferred taxes are recognised for subsidiaries’ undistributed profits to the extent that the difference will not likely realise in the predictable future. Deferred tax assets are recognised to the extent that it is probable that taxable profit will be available against which a deductible temporary difference can be utilised.
Deferred income tax assets and liabilities can be offset when there is a legally enforceable right to offset current tax assets against current tax liabilities and when the deferred taxes are related to the same taxation authority.
The most significant temporary differences arise from depreciation of property, plant and equipment; the measurement of other invest-ments and derivatives contracts at fair value; defined benefit plans; unused tax losses; and measurement at fair value in conjunction with acquisitions of business operations.
KEY ESTIMATES AND JUDGEMENTThe management’s judgement is required for determining the taxes based on the result for the period, deferred tax assets and liabilities, and the extent to which deferred tax assets are recorded. The Group is subject to income taxation in several countries, and the final amount of tax is uncertain for several business operations and calculations. The Group anticipates future tax audits and recognises liabilities based on estimates of whether further taxes will need to be paid. If the associated final tax differs from the originally recorded amounts, the difference has an effect on both the taxes based on the taxable income for the period, and on deferred tax receivables and liabilities.
EUR million 2020 2019
Income taxes for the financial period 41.8 16.9
Income taxes from previous periods 0.2 0.1
Change in deferred taxes 0.2 4.1
Income taxes total 42.2 21.0
INCOME TAX RECONCILIATION
EUR million 2020 2019
Result before tax 212.3 165.6
Calculated tax at Finnish statutory rate of 20.0% 42.5 33.1
Change in Swedish company tax rate from 21.4% to 20.6% -1.1
Effects of differences between Finnish and non-Finnish tax rates 0.2 0.8
Tax exempt income -0.4 -2.3
Non-deductible expenses 0.1 0.2
Previous years tax losses on which no deferred tax asset has been recognised used during period
0.7 -0.3
Adjustments to previously recognised deferred taxes -0.3 -2.0
Losses from subsidiaries, on which no deferred tax asset has been recognised
0.0 0.1
Share of result from associate companies and joint ventures 0.5 -8.6
Income taxes from previous periods 0.2 0.1
Other items -0.1 0.0
Income taxes total 42.2 21.0
Effective tax rate, % 19.9 12.7
In the autumn of 2015 as a part of Metsä Board Oyj’s 2014 tax assessment Finnish Tax Administration refused to accept the deductibility of a French sub-sidiary’s losses transferred in a cross-border merger. Metsä Board has appealed the decision issued by the Tax Administration, as the company believes the losses are deductible. The Board of Adjustment dismissed the company’s appeal in March 2018. The company will appeal the decision to the Administrative Court of Helsinki. Metsä Board has not recognised a deferred tax asset on the contested losses.
Taxes reported in other comprehensive income are specified in Note 5.1.
9998
METSÄ BOARD Annual Report 2020
Business operations and value creation
2 This is Metsä Board
4 CEO’s review
6 Highlights of the year
8 Strategy and targets
10 Creating value
12 Operating environment
16 Product and service development
18 Circular economy
Sustainability
20 Sustainability targets
24 We bring the forest to you
26 We offer sustainable choices
30 We work for a better climate and environment
34 We create well-being
40 Mill-specific information
Financial development
44 Report of the Board of Directors
57 Consolidated financial statements
61 Notes to the consolidated financial statements
107 Parent company financial statements
110 Notes to the parent company financial statements
123 Auditor’s report
126 Shares and shareholders
132 Key figures and taxes
Governance
134 Corporate governance statement
140 Metsä Board Corporation’s Board of Directors
142 Metsä Board Corporation’s Corporate Management Team
144 Investor relations and investor information

SUSTAINABILITYBUSINESS OPERATIONS AND VALUE CREATION GOVERNANCE
FINANCIAL DEVELOPMENT
CONSOLIDATED FINANCIAL STATEMENTS | METSÄ BOARD ANNUAL REPORT 2020
DEFERRED TAX ASSETS AND LIABILITIES 2020
EUR million 1 Jan 2020Charged to
income statement
Charged to other comprehensive
incomeTranslation differences Sold subsidiaries 31 Dec 2020
Deferred tax assets
Pension obligations and provisions 4.1 -0.2 0.4 0.0 4.2
Intercompany margins 3.8 0.9 -0.2 4.5
Unused tax loss carry-forwards 0.6 0.6
Other temporary differences 3.7 -0.7 -0.5 -0.1 2.4
Total 12.3 0.0 -0.2 -0.3 11.8
Netting against liabilities -5.5 2.2 0.0 -1.0 -4.3
Deferred tax assets in balance sheet 6.7 2.2 -0.2 -1.2 7.5
Deferred tax liabilities
Pension obligations 2.1 -0.1 -0.6 -0.1 1.3
Depreciation differences and appropriations 63.4 -3.4 0.0 1.2 61.2
Other investments recognised at fair value 42.5 -14.1 28.4
Financial instruments 2.9 0.3 3.4 0.1 6.7
Net investments in foreign operations -0.9 0.9
Other temporary differences 0.3 4.3 -0.5 0.1 4.2
Total 111.2 0.2 -11.8 2.2 101.8
Netting against receivables -5.5 2.2 0.0 -1.0 -4.3
Deferred tax liabilities in balance sheet 105.6 2.4 -11.8 1.2 97.5
DEFERRED TAX ASSETS AND LIABILITIES 2019
EUR million 1 Jan 2019Charged to
income statement
Charged to other comprehensive
incomeTranslation differences Sold subsidiaries 31 Dec 2019
Deferred tax assets
Pension obligations and provisions 5.3 -1.2 -0.1 0.0 4.1
Intercompany margins 2.7 1.1 0.0 3.8
Unused tax loss carry-forwards 8.4 -7.5 -0.3 0.6
Other temporary differences 2.7 2.9 0.0 0.0 -1.9 3.7
Total 19.2 -4.8 -0.1 -0.3 -1.9 12.3
Netting against liabilities -13.7 7.8 0.0 0.3 0.1 -5.5
Deferred tax assets in balance sheet 5.5 3.0 -0.1 0.1 -1.7 6.7
Deferred tax liabilities
Pension obligations 2.3 -0.4 -0.1 0.2 2.1
Depreciation differences and appropriations 66.3 -2.0 0.0 -0.8 -0.1 63.4
Other investments recognised at fair value 45.4 -2.9 42.5
Financial instruments 3.6 1.4 -2.1 0.0 2.9
Net investments in foreign operations 0.7 -0.7
Other temporary differences 0.6 -0.3 0.0 0.3
Total 118.2 -0.7 -5.0 -1.2 -0.1 111.2
Netting against receivables -13.7 7.8 0.0 0.3 0.1 -5.5
Deferred tax liabilities in balance sheet 104.5 7.1 -5.1 -0.9 105.6
The Group has recognised deferred tax assets related to operating loss carry-forwards for EUR 0.6 million in Germany. Management assesses that taxable profit will be available against which loss carry-forward can be utilised.
The taxable loss carry-forwards of business operations, for which deferred tax assets have not been recognised due to uncertainty of amount or utilisation possibilities, amounted approximately to EUR 506 million (505), mainly in Finland. The unrecognised deferred tax assets for these loss carry forwards is about EUR 113 million (113). Loss carry-forwards do not expire.
7. GROUP STRUCTURE7.1 HOLDINGS IN OTHER COMPANIES
SUBSIDIARIES AND JOINT OPERATIONS 31 DECEMBER 2020
METSÄ BOARD OYJ’S HOLDINGS IN GROUP COMPANIES
Country Holding, % Number of shares Book value
EUR
Holdings in parent company
Metsäliitto Cooperative Finland - 179,171 606,778.98
Subsidiary shares in Finland
Kotimaiset
Oy Hangö Stevedoring Ab Finland 100.00 150 1,000,000.00
Metsä Board International Oy Finland 100.00 10,000 23,347,464.13
in other countries
Metsa Board Americas Corporation 1) USA 99.00 17,820 12,209,018.39
Metsä Board Benelux n.v./s.a 1) Belgium 0.08 2 0.00
Metsa Board Hong Kong Ltd 1) Hong Kong 1.00 1 168.19
Metsä Board Deutschland GmbH Germany 100.00 1 0.00
Metsa Board Ibéria S.A. 1) Spain 1.00 100 1,561.63
Metsä Board NL Holding B.V. The Netherlands 100.00 15,350 4,492,764.02
Metsä Board Sverige Ab Sweden 100.00 10,000,000 493,721,059.95
Subsidiary shares total 534,772,036.31
Shares and holdings in Group companies 535,378,815.29
1)Total Group holding 100.0%
Subgroup in Finland
Metsä Board International Oy
Metsä Board Benelux n.v./s.a 1) Belgium 99.92 2,921 140,001.71
OOO Metsä Board Rus Russia 100.00 1 821,786.71
Metsä Board France SAS France 100.00 8,211 418,951.75
Metsa Board Hong Kong Ltd 1) Hong Kong 99.00 99 1,069.35
Metsa Board Ibéria S.A. 1) Spain 99.00 147,771 155,316.78
Metsa Board Italia S.r.l. Italy 100.00 100,000 50,691.84
Metsa Board (Middle East & Africa) Ltd Cyprus 100.00 742,105 214,000.00
Metsä Board Polska Sp. Z o.o. Poland 100.00 232 54,458.58
Metsa Board Singapore Pte Ltd Singapore 100.00 10,000 4,036.51
Metsa Board Singapore Pte Ltd Indian Branch India 100.00 - -
Metsa Board UK Ltd United Kingdom 100.00 2,400 264,172.02
Metsa Board Americas Corporation 1) USA 1.00 180 4,435.15
Metsa Board Australia and New Zealand Pty Ltd Australia 100.00 1 41,827.54
Metsa Board Middle East & Africa DMCC UAE 100.00 50 12,690.00
Total 2,183,437.94
Subgroup in other countries
Metsä Board Sverige Ab
Husum Pulp Ab Sweden 100.00 100,000 4,982.91
Total 4,982.91
ACCOUNTING PRINCIPLES
SUBSIDIARIESThe financial statements include all of the companies controlled by the Group. Intra-Group shareholding is eliminated using the acquisition method. Intra-Group business transactions, receivables, liabilities and unrealised gains, as well as internal distribution of profits, are eliminated on consolidation. Unrealised losses arising from impairment are not eliminated. When necessary, the accounting principles applied by subsid-iaries have been adjusted to comply with the Group’s principles.
The parent company’s owners’ and non-controlling interests’ shares of the result for the period and comprehensive income are presented in the
comprehensive income statement. The non-controlling interests’ share of equity is presented as a separate item under equity on the balance sheet.
JOINT OPERATIONSA joint operation is a joint arrangement in which parties who have joint control in the arrangement have rights concerning the assets related to the arrangement and obligations concerning liabilities. The Group consolidates its proportion of the assets, liabilities, income and expenses of the joint operation in its financial statements.
101100
METSÄ BOARD Annual Report 2020
Business operations and value creation
2 This is Metsä Board
4 CEO’s review
6 Highlights of the year
8 Strategy and targets
10 Creating value
12 Operating environment
16 Product and service development
18 Circular economy
Sustainability
20 Sustainability targets
24 We bring the forest to you
26 We offer sustainable choices
30 We work for a better climate and environment
34 We create well-being
40 Mill-specific information
Financial development
44 Report of the Board of Directors
57 Consolidated financial statements
61 Notes to the consolidated financial statements
107 Parent company financial statements
110 Notes to the parent company financial statements
123 Auditor’s report
126 Shares and shareholders
132 Key figures and taxes
Governance
134 Corporate governance statement
140 Metsä Board Corporation’s Board of Directors
142 Metsä Board Corporation’s Corporate Management Team
144 Investor relations and investor information

SUSTAINABILITYBUSINESS OPERATIONS AND VALUE CREATION GOVERNANCE
FINANCIAL DEVELOPMENT
CONSOLIDATED FINANCIAL STATEMENTS | METSÄ BOARD ANNUAL REPORT 2020
INvESTMENTS IN ASSOCIATE COMPANIES AND JOINT vENTURES
EUR million 2020 2019
Value 1 Jan 392.4 411.3
Share of results from associated companies and joint ventures
Share of result from Metsä Fibre -2.4 43.1
Share of results from other associated companies and joint ventures
-0.1 0.1
Dividends received -21.8 -63.3
Share of other comprehensive income from associated companies and joint ventures
Fair value reserve 3.1 1.2
Translation differences and other changes in equity -2.2 -0.1
Investments in associated companies and joint ventures 31 Dec
369.0 392.4
AMOUNTS RECOGNISED IN INCOME STATEMENT
EUR million 2020 2019
Associate companies -2.4 43.2
joint ventures -0.1 0.0
Amounts recognised in income statement total -2.5 43.2
AMOUNTS RECOGNISED IN BALANCE SHEET
EUR million 2020 2019
Associate companies 368.5 391.8
joint ventures 0.5 0.6
Amounts recognised in balance sheet total 369.0 392.4
The carrying amount of associated companies at 31 December 2020 includes goodwill of EUR 45.2 million (2019: 45.2). None of the associate companies or joint ventures are listed companies. Transactions with associate companies and joint ventures are detailed in Note 7.3.
FINANCIAL INFORMATION SUMMARy OF ESSENTIAL ASSOCIATED COMPANIES According to management’s view, the only essential associated company is Metsä Fibre Group, which produces chemical pulp and sawn timber. Metsä Board owns 24.9 per cent of Metsä Fibre. Metsä Board’s parent company, Metsäliitto Cooperative, owns 50.1 per cent, and Itochu Corporation from Japan owns 25.0 per cent. Metsä Fibre has operations primarily in Finland, and its production capacity is approximately 3.2 million tonnes of chemical pulp. In Addition Metsä Fibre has five sawmills in Finland and Metsä Svir sawmill in Russia.
SUMMARISED FINANCIAL INFORMATION FOR METSÄ FIBRE
METSÄ FIBRE GROUPEUR million 2020 2019
Sales 1,826.5 2,236.0
Result for the period -13.4 175.3
Other comprehensive income 4.5 7.9
Total comprehensive income for the period -8.9 183.2
Dividend received 21.8 63.3
Non-current assets 1,473.2 1,462.6
Current assets 838.4 964.7
Non-current liabilities 543.5 632.4
Current liabilities 486.1 415.2
Net assets 1,282.1 1,379.6
RECONCILIATION OF FINANCIAL INFORMATION FOR METSÄ FIBRE TO THE VALUE RECOGNISED IN CONSOLIDATED BALANCE SHEET EUR million 2020 2019
Group's share of net assets 319.2 343.5
Goodwill 45.2 45.2
Other purchase price allocations at acquisition 5.6 6.1
Other adjustments -1.7 -3.2
Carrying value of associated company in consolidated balance sheet
368.3 391.7
Metsä Fibre has been consolidated according to equity method based on its consolidated financial statements prepared under IFRS.
FINANCIAL INFORMATION SUMMARY OF OTHER THAN ESSENTIAL ASSOCIATED COMPANIES
EUR million 2020 2019
Share of result from other associated companies 0.0 0.1
Carrying value in consolidated balance sheet 0.1 0.1
JOINT vENTURESMetsä Board has one joint venture, Kemishipping Oy. Kemishipping Oy offers logistics services in Kemi, Finland. Parties have joint control of relevant activities. Kemishipping Oy has been consolidated according to equity method. Metsä Board’s ownership is 15 per cent.
EUR million 2020 2019
Sales 12.9 15.3
Result for the period -0.5 0.2
Result for the period includes the following items:
Depreciation, amortisation and impairment charges 1.4 1.3
Interest expenses 0.1 0.1
Income taxes 0.1 0.0
Dividends received from Joint Ventures
Non-current assets 6.1 6.2
Current assets 3.5 4.3
Non-current liabilities 2.3 2.6
Current liabilities 3.9 3.9
Net assets 3.4 4.0
Group's share of net assets 0.5 0.6
Joint venture carrying value in consolidated balance sheet 0.5 0.6
MATERIAL SUBSIDIARIESMetsä Board has two material subsidiaries:• Metsä Board Sverige ABMetsä Board Sverige AB is located in Örnsköldsvik, Sweden. Metsä Board Sverige AB produces folding boxboard and kraftliner. Metsä Board Sverige AB’s sales were EUR 601 million (2019: 610) in 2020. The company’s capacity is 250,000 tonnes of liner and 400,000 tonnes of folding boxboard.• Husum Pulp ABHusum Pulp Ab was established in 2020. The pulp business of Metsä Board Sverige Ab was transferred to the company on December 31, 2020. Husum Pulp AB produces pulp for Metsä Board Sverige Ab and to the market. The company’s capacity 730,000 tonnes of chemical pulp. A 30% minority stake in the company was sold to the Swedish forest owners’ cooperative Norra Skog and the transaction was completed on January 4, 2021
ACCOUNTING PRINCIPLESAssociated companies include all companies over which the Group has considerable influence but no control. Significant influence is usually based on a shareholding conferring 20–50 per cent of the voting rights. A joint venture is a joint arrangement in which the parties that have joint control of the arrangement have rights to its net assets. Investments in associates and joint ventures are accounted for using the equity method and are initially recognized at cost. The Group’s shares in associated companies and joint ventures also include the goodwill measured at the time of acquisition, less any impairment.
The Group’s share of the profits or losses of associated companies and joint ventures is recognised in the income statement as a separate line item above the operating result in case of associate company Metsä Fibre and below the operating result in case of other associate companies. Correspondingly, the Group’s share of other comprehensive income in associated companies and joint ventures is recognised in its items of other comprehensive income. A propor-tion corresponding to the Group’s shareholding is eliminated from unrealised profits between the Group and its associate companies and joint ventures. Unrealised losses arising from impairment are not eliminated. When necessary, the accounting principles applied by associated companies and joint ventures have been adjusted to comply with the Group’s principles.
103102
METSÄ BOARD Annual Report 2020
Business operations and value creation
2 This is Metsä Board
4 CEO’s review
6 Highlights of the year
8 Strategy and targets
10 Creating value
12 Operating environment
16 Product and service development
18 Circular economy
Sustainability
20 Sustainability targets
24 We bring the forest to you
26 We offer sustainable choices
30 We work for a better climate and environment
34 We create well-being
40 Mill-specific information
Financial development
44 Report of the Board of Directors
57 Consolidated financial statements
61 Notes to the consolidated financial statements
107 Parent company financial statements
110 Notes to the parent company financial statements
123 Auditor’s report
126 Shares and shareholders
132 Key figures and taxes
Governance
134 Corporate governance statement
140 Metsä Board Corporation’s Board of Directors
142 Metsä Board Corporation’s Corporate Management Team
144 Investor relations and investor information

SUSTAINABILITYBUSINESS OPERATIONS AND VALUE CREATION GOVERNANCE
FINANCIAL DEVELOPMENT
CONSOLIDATED FINANCIAL STATEMENTS | METSÄ BOARD ANNUAL REPORT 2020
7.3 RELATED PARTY TRANSACTIONS
Related parties include Metsä Board’s ultimate parent company Metsäliitto Cooperative, which owns 48 per cent of Metsä Board’s shares and 67 per cent of the voting rights, other subsidiaries of Metsäliitto, associated companies and joint ventures as well as Metsäliitto Employees’ Pension Foundation. The members of the Board of Directors, Metsä Group’s Executive Management Team and Metsä Board’s Corporate Management Team as well as their close family members are also included in related parties.
The most significant subsidiaries of Metsäliitto, with which Metsä Board has business transactions, are as follows:
Metsä Tissue GroupMetsä Fibre GroupMetsä Forest Sverige Ab
Metsä Fibre has been consolidated by using equity method according to Invest-ments in associates standard (IAS 28). Related party transactions with Metsä Fibre are presented as transactions with sister companies.
Financial operations of the Group have been centralised to Metsä Group Treasury Oy, which is a wholly-owned subsidiary of Metsäliitto Cooperative and in charge of managing the Group companies’ financial positions according to the strategy and financial policy defined by the Group, providing necessary financial services and acting as a competence center in financial matters. Financial transactions with Metsä Group Treasury Oy are carried out at market prices.
The value of wood purchases from Metsäliitto Cooperative was EUR 113.4 million (2019: 112.0) and pulp purchases from Metsä Fibre Oy EUR 249.1 million (327.3). The purchases were carried out at market prices.
Metsä Board is participating in the supplementary pension arrangement of Metsä Group executives. Payments to the arrangement amounted to EUR 0.5 million in 2020 (2019: 0.5).
Metsäliitto Employees’ Pension Foundation is a separate legal entity granting defined supplementary pension benefits to part of Metsä Board officials and manages foundation’s assets. Metsäliitto’s Office Operators’ Pension Fund’s insurance operations were transferred to OP Life Assurance Company Ltd on 31 December 2019.
TRANSACTIONS WITH PARENT COMPANy AND SISTER COMPANIES
Transactions with parent company
Transactions with sister companies
EUR million 2020 2019 2020 2019
Sales 6.8 8.1 68.6 93.0
Other operating income 2.9 2.9 1.0 11.3
Purchases 113.4 112.0 485.3 570.4
Share of result from associat-ed companies
-2.4 43.1
Dividend income 0.0 0.0
Interest income 0.1 0.1
Interest expense 0.9 1.9
Receivables
Accounts receivable and other receivables
0.9 1.7 49.3 31.1
Cash equivalents 204.7 127.1
Liabilities
Accounts payable and other liabilities
10.5 9.3 44.3 45.3
TRANSACTIONS WITH ASSOCIATED COMPANIES AND JOINT vENTURES
EUR million 2020 2019
Sales 0.5 0.5
Purchases 3.0 5.3
Interest income
Receivables
Other non-current financial assets
Accounts receivable and other receivables 0.2 0.4
Liabilities
Accounts payable and other liabilities 0.6 0.6
Metsä Board has classified interest-bearing receivables comparable to cash funds and available immediately from Metsä Group’s internal bank Metsä Group Treasury Oy as Cash and cash equivalents.
The receivables from group companies do not include doubtful receivables, and no bad debt was recognised during the period. No security or collateral has been provided for group liabilities.
7.2 ACQUIRED AND DISPOSED OPERATIONS AND NON-CURRENT ASSETS HELD FOR SALE
ACCOUNTING PRINCIPLESAcquired business operations are consolidated from the time when control is transferred to the Group, and divested operations are consolidated until the time when control is transferred away from the Group.
The consideration paid, including the contingent sales price and the identifiable assets and liabilities of the acquired business operations, are measured at fair value at the time of acquisition. Expenses related to acquisitions are recognised as costs. Depending on the acquisition, the non-controlling interests’ share in the object of the acquisition is recognised at fair value or at the amount that corresponds to the non-controlling interests’ proportion of the net assets of the object of the acquisition.
The amount by which the sum of the consideration paid, the fair value of the non-controlling interests’ share and the fair value of the assets previously owned in the object of the acquisition exceed the fair value of the identifiable net assets is recognised as goodwill.
There were no acquisitions and no assets were classified as held for sale in 2020 or 2019.
In February 2019, Metsä Board sold all 56.25% ownership in its partly owned subsidiary Äänevoima subgroup (Äänevoima Oy and Ääneverkko Oy) to associated company Metsä Fibre. Cash balance of the sold company amounted to EUR 2.5 million, and Metsä Board received EUR 6.7 million for the shares. The transaction had a cash flow effect of EUR 4.2 million and resulted in a divestment gain of EUR 6.8 million (net in operating profit).
DISPOSED ASSETS, 2019 ÄÄNEvOIMA SUBGROUP
EUR million 2020 2019
Intangible rights 0.2
Tangible assets 6.9
Other non-current non-interest bearing receivables 0.0
Inventories 0.7
Accounts receivable 2.9
Accrued income and other receivables 1.8
Cash and cash equivalents 2.5
Total assets 15.0
Non-current loan liabilities 14.0
Accounts payable 2.2
Accrued expenses and other liabilities 1.2
Total liabilities 17.4
Net assets disposed -2.4
Total -2.4
Proceeds from the sale 6.7
Less: associated company Fibre's internal margin -2.2
Divestment gain before tax 6.8
Income taxes 0.0
Divestment gain after tax 6.8
Divestment proceeds received 6.7
Cash and cash equivalents of divested subsidiary -2.5
Proceeds from disposal of shares in subsidiary, net of cash
4.2
105104
METSÄ BOARD Annual Report 2020
Business operations and value creation
2 This is Metsä Board
4 CEO’s review
6 Highlights of the year
8 Strategy and targets
10 Creating value
12 Operating environment
16 Product and service development
18 Circular economy
Sustainability
20 Sustainability targets
24 We bring the forest to you
26 We offer sustainable choices
30 We work for a better climate and environment
34 We create well-being
40 Mill-specific information
Financial development
44 Report of the Board of Directors
57 Consolidated financial statements
61 Notes to the consolidated financial statements
107 Parent company financial statements
110 Notes to the parent company financial statements
123 Auditor’s report
126 Shares and shareholders
132 Key figures and taxes
Governance
134 Corporate governance statement
140 Metsä Board Corporation’s Board of Directors
142 Metsä Board Corporation’s Corporate Management Team
144 Investor relations and investor information

SUSTAINABILITYBUSINESS OPERATIONS AND VALUE CREATION GOVERNANCE
FINANCIAL DEVELOPMENT
PARENT COMPANy FINANCIAL STATEMENTS | METSÄ BOARD ANNUAL REPORT 2020
8. OTHER NOTES
8.1 CONTINGENT LIABILITIES, ASSETS AND COMMITMENTS
DISPUTES AND CLAIMSIn the autumn of 2015 as a part of Metsä Board Oyj’s 2014 tax assessment Finnish Tax Administration refused to accept the deductibility of a French sub-sidiary’s losses transferred in a cross-border merger. Metsä Board has appealed the decision issued by the Tax Administration, as the company believes the losses are deductible. The Board of Adjustment dismissed the company’s appeal in March 2018. The company has appealed against the decision to the Administrative Court of Helsinki.
Metsä Board companies have been sellers in several share transactions in recent years. In these divestments, the companies have issued regular seller’s assurances. Claims presented against Metsä Board companies and costs incurred by the companies due to these assurances cannot be ruled out.
EUR million 2020 2019
Own liabilities for which collateral has been provided 24.1
Pledges granted 138.7
Floating charges 192.8 232.8
Real estate mortgages 192.8 371.5
Other commitments given on own behalf 2.8 9.1
Commitments given on the behalf of others 0.1 0.1
Total 195.7 380.8
Commitments include granted pledges, mortgages and floating charges as well as guarantees. Pledges granted are shares in associate company (Metsä Fibre).
INvESTMENT COMMITMENTSEUR million 2020 2019
Payments due in following 12 months 60.4 60.2
Payments due later
Total 60.4 60.2
Commitments related to property, plant and equipment concern the first phase of the modernisation of the Husum pulp mill.
OTHER INFORMATIONMetsä Board has investment grade credit ratings by S&P Global and Moody’s Investor Service. The company’s rating by S&P Global is BBB-, with a stable outlook. The company’s rating by Moody’s is Baa3, with a stable outlook.
8.2 EVENTS AFTER THE FINANCIAL PERIOD
The sale of a 30% share in the Husum pulp mill to Norra Skog was completed on 4 January 2021, and its impact will be included in Metsä Board’s financial reporting as of the interim report concerning January–March 2021. The trans-action will decrease Metsä Board’s net debt by approximately EUR 260 million, and in addition it will reduce Metsä Board’s financial contribution in the second phase of the Husum pulp mill re-newal by approximately EUR 100 million.
Metsä Board announced on 22 January 2021, that it has started pre-engineer-ing for increasing the annual production capacity of folding boxboard at the Husum mill in Sweden by approximately 200,000 tonnes. The pre-engineering phase includes also an evaluation of the mill’s port capacity for increased volumes of raw materials and finished goods. The readiness to make the final investment decision is expected to be achieved in the summer of 2021 and the ramp-up of the addition-al capacity would start in 2023.
On 11 February 2021, Metsä Board’s associated company Metsä Fibre made an investment decision on the construction of a new bioproduct mill in Kemi, Finland.
On 11 February 2021, Metsä Board made an invest-ment decision on the development programme for its Kemi paperboard mill.
EUR NOTE 1.1.–31.12.2020 1.1.–31.12.2019
Sales 2 1,262,298,497.02 1,298,912,836.71
Change in stocks of finished and unfinished products -3,581,989.63 -7,841,433.77
Other operating income 3.4 36,169,588.08 41,790,929.10
Materials and services
Materials, consumables and goods
Purchases during the financial period -655,650,971.36 -795,211,696.96
Changes in stocks 3,084,733.82 1,819,625.65
External services 5 -184,687,540.74 -191,026,632.56
Employee costs 5 -96,195,043.20 -93,166,366.22
Depreciations and impairment charges 3.6 -51,242,262.32 -49,425,058.98
Other operating expenses 3.5 -111,572,081.32 -119,924,845.71
-1,096,263,165.12 -1,246,934,974.78
Operating profit/loss 198,622,930.35 85,927,357.26
Financial income and expenses 7
Income from group companies 33,578,546.16 72,115,919.33
Income from investments in other non-current assets 1,980.00 1,432.32
Other interest and financial income 2,614.49 866.91
Exchange rate differences 6,263,249.69 -5,590,305.18
Interest expenses and other financial expenses -11,306,180.32 -15,124,245.07
28,540,210.02 51,403,668.31
Profit/loss before appropriations and taxes 227,163,140.37 137,331,025.57
Appropriations
Change in depreciation differences 6 -9,066,231.37 -6,020,879.19
Group contribution 1,160,000.00 1,050,000.00
-7,906,231.37 -4,970,879.19
Income taxes 8 -38,800,726.87 -14,427,786.37
Profit/loss for the financial period 180,456,182.13 117,932,360.01
Parent companyINCOME STATEMENT
Parent company financial statements
107106
METSÄ BOARD Annual Report 2020
Business operations and value creation
2 This is Metsä Board
4 CEO’s review
6 Highlights of the year
8 Strategy and targets
10 Creating value
12 Operating environment
16 Product and service development
18 Circular economy
Sustainability
20 Sustainability targets
24 We bring the forest to you
26 We offer sustainable choices
30 We work for a better climate and environment
34 We create well-being
40 Mill-specific information
Financial development
44 Report of the Board of Directors
57 Consolidated financial statements
61 Notes to the consolidated financial statements
107 Parent company financial statements
110 Notes to the parent company financial statements
123 Auditor’s report
126 Shares and shareholders
132 Key figures and taxes
Governance
134 Corporate governance statement
140 Metsä Board Corporation’s Board of Directors
142 Metsä Board Corporation’s Corporate Management Team
144 Investor relations and investor information

SUSTAINABILITYBUSINESS OPERATIONS AND VALUE CREATION GOVERNANCE
FINANCIAL DEVELOPMENT
PARENT COMPANy FINANCIAL STATEMENTS | METSÄ BOARD ANNUAL REPORT 2020
PARENT COMPANY
BALANCE SHEET
EUR Note 31.12.2020 31.12.2019
ASSETS
Intangible assets 9
Intangible assets 12,657,981.63 14,278,206.33
Other intangible assets 366,412.56 486,562.90
Advance payment and construction in progress
635,869.44 1,383,677.21
13,660,263.63 16,148,446.44
Tangible assets 9
Land and water areas 31,282,413.06 28,976,820.98
Buildings and constructions 128,739,857.83 126,429,353.21
Machinery and equipment 227,344,444.31 233,190,115.27
Other tangible assets 7,065,754.44 7,162,554.22
Advance payment and construction in progress
20,641,731.56 31,410,056.94
415,074,201.20 427,168,900.62
Investments 10
Shares in group companies 535,378,815.29 535,378,815.29
Receivables from group companies 306,190,496.80 301,618,572.70
Shares in associated companies 86,429,409.33 86,429,409.33
Other shares and holdings 184,224,295.61 252,435,976.80
Other receivables 35,222.52 35,222.52
1,112,258,239.55 1,175,897,996.64
Total non-current assets 1,540,992,704.38 1,619,215,343.70
CURRENT ASSETS
Inventories
Materials and consumables 48,604,835.96 45,520,102.14
Finished products 134,958,631.37 138,540,621.00
Advance payments 7,334,704.15 7,463,245.05
190,898,171.48 191,523,968.19
NON-CURRENT RECEIVABLES 11
Receivables from group companies
Receivables from group companies 79,726,537.97 76,578,473.79
79,726,537.97 76,578,473.79
Current receivables 11
Accounts receivables 118,264,583.91 138,926,647.98
Receivables from group companies 210,760,985.45 68,621,064.30
Receivables from associated companies 199,805.19 426,042.57
Other receivable 17,934,171.78 21,802,288.77
Prepayments and accrued income 24,299,436.72 20,579,735.64
371,458,983.05 250,355,779.26
Total receivables 451,185,521.02 326,934,253.05
Cash and cash equivalents 5,542,571.15 3,258,020.29
Total current assets 647,626,263.65 521,716,241.53
TOTAL ASSETS 2,188,618,968.03 2,140,931,585.23
EUR Note 31.12.2020 31.12.2019
EQUITY AND LIABILITIES
SHAREHOLDERS' EQUITY 12
Share capital 557,881,540.40 557,881,540.40
Other reserves
Reserve for invested unrestricted equity 267,521,521.17 317,293,305.61
Value adjustment reserve 134,374,020.36 171,598,515.80
Profit/loss for previous financial periods 192,268,464.93 109,887,379.52
Profit/loss for the financial period 180,456,182.13 117,932,360.01
1,332,501,728.99 1,274,593,101.34
APPROPRIATIONS
Accumulated depreciation difference 6 147,963,297.28 138,897,065.91
PROVISIONS 13 4,476,995.67 4,568,212.78
LIABILITIES
Non-current liabilities 15
Bonds 249,433,483.02 249,349,299.01
Loans from financial institutions 183,225,000.00 150,000,000.00
Advance payments 1,515,404.91 1,515,404.94
Deferred tax liability 8, 14 32,698,049.43 42,013,315.59
Liabilities to group companies 3,361,597.67 3,093,184.14
470,233,535.03 445,971,203.68
Current liabilities 16
Pension premium loans 0.00 23,348,214.32
Advance payments 1,756,007.02 2,870,361.05
Accounts payable 119,759,541.04 134,113,280.45
Liabilities to group companies 49,863,035.29 51,944,254.45
Liabilities to participating companies 379,727.97 415,389.81
Other liabilities 6,612,960.98 6,328,756.57
Accruals and deferred income 55,072,138.76 57,881,744.87
233,443,411.06 276,902,001.52
Total liabilities 703,676,946.09 722,873,205.20
Total shareholdes’ equity and liabilities
2,188,618,968.03 2,140,931,585.23
EUR 1.1.–31.12.2020 1.1.–31.12.2019
CASH FLOW FROM OPERATING ACTIVITIES
Profit/loss before appropriations and taxes 227,163,140.37 137,331,025.57
Adjustments to profit/loss a) 14,139,599.44 -17,853,757.10
Interest received 8,356,030.38 8,822,022.70
Interest paid -10,714,750.12 -14,084,523.72
Dividends received 25,226,848.20 63,295,885.58
Other financial items, net -1,478,801.92 -2,920,192.59
Income taxes paid -43,029,488.89 -14,438,004.48
Change in net working capital b) -4,921,666.18 -30,197,487.13
Net cash flow from operating activities 214,740,911.28 129,954,968.83
INVESTMENTS
Acquisition of shares in affiliated companies, 0.00 0.00
Acquisition of other shares -2,240,616.00 -32,697.47
Investments in tangible and intangible assets -43,947,568.55 -58,388,063.02
Proceeds from disposal of shares in affiliated companies, 0.00 1,338,919.46
Proceeds from disposal of participating interests 0.00 6,663,325.00
Proceeds from disposal of other shares 65,008.00 3,491,420.46
Proceeds from sale of tangible and intangible assets 14,718,563.46 19,940,902.58
Increase and decrease of non-current receivables, net -0.01 0.00
Total cash flow from investing activities -31,404,613.10 -26,986,192.99
CASH FLOW BEFORE FINANCIAL ACTIVITIES 183,336,298.18 102,968,775.84
Cash flow from financial activities
Dividend paid and other profit distribution -85,323,059.04 -103,098,696.34
Increase in non-current liabilities 33,225,000.00 150,000,000.00
Decrease in non-current liabilities -23,348,214.35 -148,289,588.83
Increase or decrease in interest bearing current liabilities, net 0.00 -7.12
Increase or decrease in interest bearing current receivables, net -105,605,473.93 -4,700,352.33
-181,051,747.32 -106,088,644.62
CHANGES IN CASH AND CASH EQUIVALENTS 2,284,550.86 -3,119,868.78
Cash and cash equivalents opening balance 3,258,020.29 6,377,889.07
Change in cash and cash equivalents 2,284,550.86 -3,119,868.78
Cash and cash equivalents closing balance 5,542,571.15 3,258,020.29
a) Adjustments to profit/loss
Depreciations and impairment charges 51,242,262.32 49,425,058.98
Financial income and expenses -28,540,210.02 -51,403,668.31
Gains or losses on sale of fixed assets -8,471,235.75 -13,380,996.64
Change in provisions -91,217.11 -2,494,151.13
Total 14,139,599.44 -17,853,757.10
b) Change in net working capital
Inventories 625,796.71 4,336,977.69
Change in current receivables, non-interest bearing 7,072,320.09 -8,315,945.23
Change in current liabilities, non-interest bearing -12,619,782.98 -26,218,519.59
Total -4,921,666.18 -30,197,487.13
PARENT COMPANY ACCOUNTS
CASH FLOW STATEMENT
109108
METSÄ BOARD Annual Report 2020
Business operations and value creation
2 This is Metsä Board
4 CEO’s review
6 Highlights of the year
8 Strategy and targets
10 Creating value
12 Operating environment
16 Product and service development
18 Circular economy
Sustainability
20 Sustainability targets
24 We bring the forest to you
26 We offer sustainable choices
30 We work for a better climate and environment
34 We create well-being
40 Mill-specific information
Financial development
44 Report of the Board of Directors
57 Consolidated financial statements
61 Notes to the consolidated financial statements
107 Parent company financial statements
110 Notes to the parent company financial statements
123 Auditor’s report
126 Shares and shareholders
132 Key figures and taxes
Governance
134 Corporate governance statement
140 Metsä Board Corporation’s Board of Directors
142 Metsä Board Corporation’s Corporate Management Team
144 Investor relations and investor information

SUSTAINABILITYBUSINESS OPERATIONS AND VALUE CREATION GOVERNANCE
FINANCIAL DEVELOPMENT
PARENT COMPANy FINANCIAL STATEMENTS | METSÄ BOARD ANNUAL REPORT 2020
PARENT COMPANY ACCOUNTING POLICIES
1. ACCOUNTING POLICIESMetsä Board Oyj belongs to Metsä Group, whose parent company is Metsäliitto Cooperative. Metsäliitto Cooperative’s registered office is in Helsinki. The Metsä Group prepares consolidated financial statements which are available at the Group’s main office at Revontulenpuisto 2 A, FIN-02100 Espoo, Finland.
Metsä Board Oyj’s financial statements have been prepared in accordance with Finnish Accounting Standards (FAS).
Metsä Board Plc has transactions with other companies in the Group. These are described in more detail in the notes to the consolidated financial statements in section 7.3. Transactions with related parties are based on market prices.
FOREIGN CURRENCY TRANSACTIONSForeign exchange gains and losses have been booked to exchange gains/losses under financial income and expense. Open and actual foreign exchange differ-ences hedging sales are recorded immediately to financial income and expenses in the income statement.
DERIVATIVE FINANCIAL INSTRUMENTSThe company uses derivatives only for hedging against currency, interest rate and commodity risks. Derivatives are valued at fair value in accordance with the alternative treatment permitted by Chapter 5, Section 2a of the Accounting Act.The management of financial risks and the principles applied to derivatives are explained in Notes 5.6 and 5.7 to the consolidated financial statements.
The unrealised fair value of cash flow hedges in hedge accounting is recognised in the fair value reserve of the balance sheet to the extent that they are effective. The unrealised fair value of derivatives not in hedge accounting is recognised in the income statement. In addition, the company has recognised deferred tax assets and liabilities as a separate item in the income statement and balance sheet during the financial year.
Metsä Board Oyj applies the fair value option under Chapter 5, Section 2a of the Accounting Act also to the other shares and holdings. Accordingly, the company has classified its shares in Pohjolan Voima Oyj as financial assets at fair value through equity in accordance with IFRS 9 and other equity instruments in financial assets valued at fair value through profit or loss. The principles applied in determining the fair value of shares and the sensitivity of fair value to various valuation factors are described in Note 4.3 to the consolidated financial statements.
SALESSales are calculated after deduction of indirect sales taxes, trade discounts and other items adjusting sales.
PENSIONS AND PENSION FUNDINGStatutory pension security is handled by pension insurance companies outside the Group. In addition to statutory pension security, some salaried employees have supplementary pension arrangements which are either insured at Pohjola or are an arranged through Metsäliitto Employees’ Pension Foundation or are
anMetsäliitto Employees’ Pension Foundation or are an unfunded liability of the company. Pension insurance premiums have been accrued to correspond to the accrual-based wages and salaries given in the financial statements.
LEASINGLease payments are treated as rental expenses.
INCOME TAXESTax expenses in the income statement consists of taxes based on the taxable income for the period, taxes for the previous periods and deferred tax assets and liabilities. Deferred tax assets and liabilities are calculated on the temporary differences between the carrying amount and the tax base in accordance with the tax rate issued as at the balance sheet date. Deferred taxes are calculated on the basis of the enacted tax rate.
PROPERTY, PLANT AND EQUIPMENT AND DEPRECIATIONThe carrying values of property, plant and equipment are based on original acquisition costs less depreciation according to plan and impairment losses.
Depreciation according to plan is based on the estimated useful life of the asset as follows:
Buildings and constructions 20–40 yearsHeavy machinery 20–40 yearsOther heavy machines 15–20 yearsLightweight machinery and equipment 5–15 yearsOther tangible assets 5–10 years
Depreciation is not recorded on the purchase cost of land and water.
INVENTORIESInventories are measured at the lower of cost or net realisable value. FIFO principle is observed in measuring inventories or, alternatively, the weighted average cost method. Value of finished and semi-finished goods comprises raw materials, direct wages and salaries, depreciation and amortisation and other direct cost as well as a reasonable share of variable and fixed production over-head cost calculated at normal level of production. Net realisable value is the estimated selling price less the estimated cost of completion and the estimated costs necessary to make the sale.
PROVISIONSContingent costs and losses that are no longer generate corresponding income and for which the parent company is obliged or committed and whose mone-tary value can be reasonably estimated are recognised in the income statement in line with the nature of the expense item and in the mandatory provisions of the balance sheet.
EUR 2020 2019
2. SALES By REGIONFinland 70,750,494.84 44,551,062.34
Other EU-countries 674,947,752.34 701,544,734.24
Other European countries 162,720,555.65 207,031,287.84
Other countries 353,879,694.19 345,785,752.29
Total 1,262,298,497.02 1,298,912,836.71
3. EXCEPTIONAL ITEMS Other operating income
Proceeds from liquidation of shares, 0.00 5,419,690.00
Proceeds from selling of land 6,039,731.85 5,456,174.34
6,039,731.85 10,875,864.34
Employee costs
Refund from pension -581,739.51 2,493,510.00
-581,739.51 2,493,510.00
Other operating expenses
Subsidiary merger loss 0.00 -6,109,684.85
0.00 -6,109,684.85
Exceptional items in income statement 5,457,992.34 7,259,689.49
4. OTHER OPERATING INCOMERental income 1,053,576.83 1,080,975.72
Service revenue 14,038,890.30 12,270,340.82
Gains on disposal 8,561,323.35 19,216,671.07
Government grants and allowances 9,884,268.49 5,388,743.69
Scrap and waste sale 93,693.78 289,697.26
Others 2,537,835.33 3,544,500.54
36,169,588.08 41,790,929.10
5. OPERATING EXPENSES
External services
Distribution costs 139,431,896.81 140,130,611.14
Other external services 45,255,643.93 50,896,021.42
184,687,540.74 191,026,632.56
Employee costs
Wages and salaries for working hours 59,481,772.98 57,849,024.96
Social security expenses
Pension expenses 14,935,467.02 11,307,166.51
Other social security expenses 21,777,803.20 24,010,174.75
96,195,043.20 93,166,366.22
Management’s salaries, wages and pension commitments are presented in Group’s Note 3.2. Management’s share-based payments are described in Group’s Note 3.3 and other long-term fees in Group’s Note 3.4.
The average number of personnel during the financial period in the parent company 1,218 1,177
Other operating expenses
Rental and other property costs 10,839,928.55 8,882,314.90
Purchases of services 79,978,131.97 81,868,726.97
Losses on disposal of non-current assets 90,087.60 6,199,408.43
Other expenses
Voluntary social costs 2,658,151.88 2,310,950.99
Fixed energy costs 9,367,338.76 9,220,062.19
Traveling expenses 345,627.91 1,652,292.34
Insurances 2,009,099.23 2,413,653.52
Advertising and marketing expenses 1,626,306.97 2,183,325.61
Others 4,657,408.45 5,194,110.76
111,572,081.32 119,924,845.71
Fees of principal auditor
Audit fees 196,064.00 196,064.00
Auditor's opinions 760.00 2,870.00
196,824.00 198,934.00
The principal auditor is KPMG Oy Ab.
111110
METSÄ BOARD Annual Report 2020
Business operations and value creation
2 This is Metsä Board
4 CEO’s review
6 Highlights of the year
8 Strategy and targets
10 Creating value
12 Operating environment
16 Product and service development
18 Circular economy
Sustainability
20 Sustainability targets
24 We bring the forest to you
26 We offer sustainable choices
30 We work for a better climate and environment
34 We create well-being
40 Mill-specific information
Financial development
44 Report of the Board of Directors
57 Consolidated financial statements
61 Notes to the consolidated financial statements
107 Parent company financial statements
110 Notes to the parent company financial statements
123 Auditor’s report
126 Shares and shareholders
132 Key figures and taxes
Governance
134 Corporate governance statement
140 Metsä Board Corporation’s Board of Directors
142 Metsä Board Corporation’s Corporate Management Team
144 Investor relations and investor information

SUSTAINABILITYBUSINESS OPERATIONS AND VALUE CREATION GOVERNANCE
FINANCIAL DEVELOPMENT
PARENT COMPANy FINANCIAL STATEMENTS | METSÄ BOARD ANNUAL REPORT 2020
EUR 2020 2019
6. DEPRECIATION AND IMPAIRMENT CHARGESPlanned depreciation
Intangible rights 1,641,719.87 1,852,262.64
Other intangible assets 120,150.34 225,347.22
Buildings and constructions 8,742,569.99 7,671,798.14
Machinery and equipment 39,975,101.43 38,968,190.12
Other tangible assets 762,720.69 707,460.86
Total 51,242,262.32 49,425,058.98
Change in depreciation difference 9,066,231.37 6,020,879.19
Total depreciation 60,308,493.69 55,445,938.17
Depreciation difference at the beginning of the financial year 138,897,065.91 113,793,981.38
Change in depreciation differences 9,066,231.37 6,020,879.19
Transfer in Merger 0.00 19,082,205.34
Depreciation difference at the end of the financial year 147,963,297.28 138,897,065.91
7. FINANCIAL INCOME AND EXPENSESIncome from investments in non-current assets
Dividend income
From Group companies 25,224,868.20 63,294,453.26
From others 1,980.00 1,432.32
25,226,848.20 63,295,885.58
Interest income on investments in non-current assets
From Group companies 6,331,028.39 6,905,069.36
6,331,028.39 6,905,069.36
Total income from non-current assets 31,557,876.59 70,200,954.94
Other interest and financial income
Interest income from Group companies 2,022,649.57 1,916,396.71
Other interest income 2,352.42 556.63
Other financial income 262.07 310.28
2,025,264.06 1,917,263.62
Exchange rate differences recognised in financial income and expenses
Exchange rate differences on sales -2,350,438.98 1,366,174.87
Exchange rate differences on purchases 358,683.24 -76,941.19
Exchange rate differences on financing 8,255,005.43 -6,879,538.86
6,263,249.69 -5,590,305.18
Impairment losses on investments in non-current assets 5,316.53 0.00
Interest and other financial expenses
Interest expenses for the same group companies -891,984.39 -1,781,249.49
Other interest expenses -9,387,119.08 -11,289,806.84
Other financial expenses -1,032,393.38 -2,053,188.74
Total interest expenses and other financial expenses -11,311,496.85 -15,124,245.07
Financial income and expenses total 28,540,210.02 51,403,668.31
8. INCOME TAXESTaxes for the financial year 38,781,516.74 13,928,522.19
Taxes for previous financial years 966.71 433.95
Deferred taxes 18,243.42 498,830.23
38,800,726.87 14,427,786.37
EUR 2020 2019
9. INTANGIBLE AND TANGIBLE ASSETS
Intangible rights
Acquisition costs 1.1. 117,255,065.98 114,519,881.98
Increases 9,946,350.49 9,293,523.18
Decreases -9,707,883.45 -6,579,639.18
Transfers between items 0.00 21,300.00
Acquisition costs 31.12. 117,493,533.02 117,255,065.98
Accumulated depreciation and impairment charges 1.1. -102,976,859.65 -101,124,597.01
Accumulated depreciation of deductions and transfers -216,971.87 0.00
Depreciation and write-downs for the financial period -1,641,719.87 -1,852,262.64
Accumulated depreciation and impairment 31.12. -104,835,551.39 -102,976,859.65
Book value 31.12. 12,657,981.63 14,278,206.33
Goodwill
Acquisition costs 1.1. 24,970,634.39 24,970,634.39
Acquisition costs 31.12. 24,970,634.39 24,970,634.39
Accumulated depreciation and impairment charges 1.1. -24,970,634.39 -24,970,634.39
Accumulated depreciation and impairment 31.12. -24,970,634.39 -24,970,634.39
Book value 31.12. 0.00 0.00
Other intangible assets
Acquisition costs 1.1. 15,724,698.18 15,852,998.18
Decreases -7,846,147.26 -128,300.00
Acquisition costs 31.12. 7,878,550.92 15,724,698.18
Accumulated depreciation and impairment charges 1.1. -15,238,135.28 -15,141,088.06
Accumulated depreciation of deductions and transfers 7,846,147.26 128,300.00
Depreciation and write-downs for the financial period -120,150.34 -225,347.22
Accumulated depreciation and impairment 31.12. -7,512,138.36 -15,238,135.28
Book value 31.12. 366,412.56 486,562.90
Advance payments and work in progress
Acquisition costs 1.1. 1,383,677.21 901,832.68
Increases 45,880.00 503,144.53
Transfers between items -793,687.77 -21,300.00
Acquisition costs 31.12. 635,869.44 1,383,677.21
Intangible assets total
Acquisition costs 1.1. 159,334,075.76 131,274,712.84
Increases 9,992,230.49 9,796,667.71
Decreases -17,554,030.71 -6,707,939.18
Transfers between items -793,687.77 0.00
Acquisition costs 31.12. 150,978,587.77 159,334,075.76
Accumulated depreciation and impairment charges 1.1. -143,185,629.32 -141,236,319.46
Accumulated depreciation of deductions and transfers 7,629,175.39 128,300.00
Depreciation and write-downs for the financial year -1,761,870.21 -2,077,609.86
Accumulated depreciation and impairment charges 31.12. -137,318,324.14 -143,185,629.32
Book value 31.12. 13,660,263.63 16,148,446.44
Land and water areas
Acquisition costs 1.1. 28,976,841.96 26,511,751.58
Increases 2,681,077.36 2,302,472.96
Increase from Kemi merger 0.00 520,077.00
Decreases -375,485.28 -357,459.58
Acquisition costs 31.12. 31,282,434.04 28,976,841.96
Accumulated depreciation and impairment charges 1.1. -20.98 -20.98
Accumulated depreciation and impairment charges 31.12. -20.98 -20.98
Book value 31.12. 31,282,413.06 28,976,820.98
113112
METSÄ BOARD Annual Report 2020
Business operations and value creation
2 This is Metsä Board
4 CEO’s review
6 Highlights of the year
8 Strategy and targets
10 Creating value
12 Operating environment
16 Product and service development
18 Circular economy
Sustainability
20 Sustainability targets
24 We bring the forest to you
26 We offer sustainable choices
30 We work for a better climate and environment
34 We create well-being
40 Mill-specific information
Financial development
44 Report of the Board of Directors
57 Consolidated financial statements
61 Notes to the consolidated financial statements
107 Parent company financial statements
110 Notes to the parent company financial statements
123 Auditor’s report
126 Shares and shareholders
132 Key figures and taxes
Governance
134 Corporate governance statement
140 Metsä Board Corporation’s Board of Directors
142 Metsä Board Corporation’s Corporate Management Team
144 Investor relations and investor information

SUSTAINABILITYBUSINESS OPERATIONS AND VALUE CREATION GOVERNANCE
FINANCIAL DEVELOPMENT
PARENT COMPANy FINANCIAL STATEMENTS | METSÄ BOARD ANNUAL REPORT 2020
EUR 2020 2019
Buildings and constructions
Acquisition costs 1.1. 295,270,714.76 282,902,966.42
Opening balance adjustment 6,458,935.50 0.00
Increases 4,690,025.74 6,061,728.59
Increase from Kemi merger 0.00 5,286,407.95
Decreases -4,550,431.22 0.00
Transfers between items 6,383,939.28 1,019,611.80
Acquisition costs 31.12. 308,253,184.06 295,270,714.76
Accumulated depreciation and impairment charges 1.1. -168,841,361.55 -161,169,563.41
Opening balance adjustment -6,458,935.50 0.00
Accumulated depreciation of deductions and transfers 4,529,540.81 0.00
Depreciation and write-downs for the financial year -8,742,569.99 -7,671,798.14
Accumulated depreciation and impairment 31.12. -179,513,326.23 -168,841,361.55
Book value 31.12. 128,739,857.83 126,429,353.21
Machinery and equipment
Acquisition costs 1.1. 1,155,859,703.19 1,085,857,469.61
Opening balance adjustment 87,438,189.37 0.00
Increases 15,911,955.47 14,471,064.30
Increase from Kemi merger 0.00 39,006,333.67
Decreases -37,256,639.55 -60,176.35
Transfers between items 18,217,475.00 16,585,011.96
Acquisition costs 31.12. 1,240,170,683.48 1,155,859,703.19
Accumulated depreciation and impairment charges 1.1. -922,669,587.92 -883,707,282.80
Opening balance adjustment -87,109,446.12 0.00
Accumulated depreciation of deductions and transfers 36,927,896.30 5,885.00
Depreciation and write-downs for the financial year -39,975,101.43 -38,968,190.12
Accumulated depreciation and impairment 31.12. -1,012,826,239.17 -922,669,587.92
Book value 31.12. 227,344,444.31 233,190,115.27
Other tangible assets
Acquisition costs 1.1. 13,752,403.75 10,955,016.63
Increases 346,120.38 1,373,597.54
Increase from Kemi merger 0.00 41,212.99
Decreases -555,452.57 0.00
Transfers between items 319,800.53 1,382,576.59
Acquisition costs 31.12. 13,862,872.09 13,752,403.75
Accumulated depreciation and impairment charges 1.1. -6,589,849.53 -5,882,388.67
Accumulated depreciation of deductions and transfers 555,452.57 0.00
Depreciation and write-downs for the financial year -762,720.69 -707,460.86
Accumulated depreciation and impairment 31.12. -6,797,117.65 -6,589,849.53
Book value 31.12. 7,065,754.44 7,162,554.22
Advance payments and work in progress
Acquisition costs 1.1. 31,410,056.94 23,167,806.23
Increases 13,359,201.66 24,382,531.92
Increase from Kemi merger 0.00 2,846,919.14
Transfers between items -24,127,527.04 -18,987,200.35
Acquisition costs 31.12. 20,641,731.56 31,410,056.94
Total tangible assets
Acquisition costs 1.1. 1,525,269,720.60 1,429,395,010.47
Opening balance adjustment 93,897,124.87 0.00
Increases 36,988,380.61 96,292,346.06
Decreases -42,738,008.62 -417,635.93
Transfers between items 793,687.77 0.00
Acquisition costs 31.12. 1,614,210,905.23 1,525,269,720.60
Accumulated depreciation and impairment charges 1.1. -1,098,100,819.98 -1,050,759,255.86
Opening balance adjustment -93,568,381.62 0.00
Accumulated depreciation of deductions and transfers 42,012,889.68 5,885.00
Depreciation and write-downs for the financial year -49,480,392.11 -47,347,449.12
Accumulated depreciation and impairment 31.12. -1,199,136,704.03 -1,098,100,819.98
Book value 31.12. 415,074,201.20 427,168,900.62
EUR 2020 2019
10. INvESTMENTSShares in Group companies
Acquisitions costs 1.1. 535,378,815.29 563,209,026.13
Addition from Kemi merger 0.00 168.19
Decreases 0.00 -27,830,379.03
Acquisitions costs 31.12. 535,378,815.29 535,378,815.29
Shares in participating companies
Acquisitions costs 1.1. 86,429,409.33 90,929,409.33
Decreases 0.00 -4,500,000.00
Acquisitions costs 31.12. 86,429,409.33 86,429,409.33
Other shares and holdings
Acquisitions costs 1.1. 252,435,976.80 267,411,629.23
Increases 2,240,616.00 32,697.47
Addition from Kemi merger 0.00 1,700.00
Decreases -70,452,297.19 -15,010,049.90
Acquisitions costs 31.12. 184,224,295.61 252,435,976.80
Total investments and holdings
Acquisitions costs 1.1. 874,244,201.42 921,550,064.69
Increases 2,240,616.00 34,565.66
Decreases -70,452,297.19 -47,340,428.93
Acquisitions costs 31.12. 806,032,520.23 874,244,201.42
Receivables from Group companies
Acquisitions costs 1.1. 301,618,572.70 304,923,645.95
Increases 4,571,924.10 0.00
Decreases 0.00 -3,305,073.25
Acquisitions costs 31.12. 306,190,496.80 301,618,572.70
Other receivables
Acquisitions costs 1.1. 35,222.52 35,222.52
Acquisitions costs 31.12. 35,222.52 35,222.52
Receivables total
Acquisitions costs 1.1. 301,653,795.22 304,958,868.47
Increases 4,571,924.10 0.00
Decreases 0.00 -3,305,073.25
Acquisitions costs 31.12. 306,225,719.32 301,653,795.22
Investments total
Acquisitions costs 1.1. 1,175,897,996.64 1,226,508,933.16
Increases 6,812,540.10 34,565.66
Decreases -70,452,297.19 -50,645,502.18
Acquisitions costs 31.12. 1,112,258,239.55 1,175,897,996.64
115114
METSÄ BOARD Annual Report 2020
Business operations and value creation
2 This is Metsä Board
4 CEO’s review
6 Highlights of the year
8 Strategy and targets
10 Creating value
12 Operating environment
16 Product and service development
18 Circular economy
Sustainability
20 Sustainability targets
24 We bring the forest to you
26 We offer sustainable choices
30 We work for a better climate and environment
34 We create well-being
40 Mill-specific information
Financial development
44 Report of the Board of Directors
57 Consolidated financial statements
61 Notes to the consolidated financial statements
107 Parent company financial statements
110 Notes to the parent company financial statements
123 Auditor’s report
126 Shares and shareholders
132 Key figures and taxes
Governance
134 Corporate governance statement
140 Metsä Board Corporation’s Board of Directors
142 Metsä Board Corporation’s Corporate Management Team
144 Investor relations and investor information

SUSTAINABILITYBUSINESS OPERATIONS AND VALUE CREATION GOVERNANCE
FINANCIAL DEVELOPMENT
PARENT COMPANy FINANCIAL STATEMENTS | METSÄ BOARD ANNUAL REPORT 2020
EUR 2020 2019
11. RECEIvABLES
Non-current receivables
Receivables from group companies
Loans receivables 79,726,537.97 76,578,473.79
79,726,537.97 76,578,473.79
Total non-current receivables 79,726,537.97 76,578,473.79
Current receivables
Receivables from group companies
Accounts receivable 43,898,813.17 27,941,695.10
Loans receivables 131,520,586.04 25,915,112.11
Other receivables 1,170,305.62 1,999,146.01
Prepayments and accrued income 34,171,280.62 12,765,111.08
210,760,985.45 68,621,064.30
Receivables from participating companies
Accounts receivable 199,805.19 426,042.57
199,805.19 426,042.57
Receivables from others
Accounts receivable 118,264,583.91 138,926,647.98
Other receivables 17,934,171.78 21,802,288.77
Prepayments and accrued income 24,299,436.72 20,579,735.64
160,498,192.41 181,308,672.39
Total current receivables 371,458,983.05 250,355,779.26
Accrued income from group companies, current, specification
Derivatives 32,539,914.86 11,251,348.16
Accrued interests 1,631,365.76 1,513,762.92
34,171,280.62 12,765,111.08
Accrued income from others, current, specification
Accrued personnel costs 6,471.75 846,121.00
Energy and other taxes 12,583,236.96 13,059,069.00
Others 11,709,728.01 6,674,545.64
24,299,436.72 20,579,735.64
Total receivables 451,185,521.02 326,934,253.05
EUR 2020 2019
12. SHAREHOLDERS’ EQUITy
Restricted equity
Share capital 1.1.
A-shares 51,922,153.80 55,486,107.56
B-shares 505,959,386.60 502,395,432.84
557,881,540.40 557,881,540.40
Conversion of A shares into B shares
A-shares -314,624.49 -3,563,953.76
B-shares 314,624.49 3,563,953.76
0.00 0.00
Share capital 31.12.
A-shares 51,607,529.31 51,922,153.80
B-shares 506,274,011.09 505,959,386.60
Total 557,881,540.40 557,881,540.40
Fair value reserve 1.1. 171,598,515.80 182,839,879.60
Changes -37,224,495.44 -11,241,363.80
Fair value reserve 31.12. 134,374,020.36 171,598,515.80
692,255,560.76 729,480,056.20
Unrestricted equity
Reserve for invested unrestricted equity 1.1. 317,293,305.61 384,840,727.35
Return of invested unrestricted equity -49,771,784.44 -67,547,421.74
Reserve for invested unrestricted equity 31.12. 267,521,521.17 317,293,305.61
Retained earnings 1.1. 227,819,739.53 145,438,654.12
Dividends -35,551,274.60 -35,551,274.60
Profit for the financial period 180,456,182.13 117,932,360.01
Retained earnings 31.12. 372,724,647.06 227,819,739.53
640,246,168.23 545,113,045.14
Equity total 31.12 1,332,501,728.99 1,274,593,101.34
Distributable funds
Reserve for invested unrestricted equity 267,521,521.17 317,293,305.61
Profit from previous financial periods 192,268,464.93 109,887,379.52
Profit for the financial period 180,456,182.13 117,932,360.01
Distributable funds 640,246,168.23 545,113,045.14
117116
METSÄ BOARD Annual Report 2020
Business operations and value creation
2 This is Metsä Board
4 CEO’s review
6 Highlights of the year
8 Strategy and targets
10 Creating value
12 Operating environment
16 Product and service development
18 Circular economy
Sustainability
20 Sustainability targets
24 We bring the forest to you
26 We offer sustainable choices
30 We work for a better climate and environment
34 We create well-being
40 Mill-specific information
Financial development
44 Report of the Board of Directors
57 Consolidated financial statements
61 Notes to the consolidated financial statements
107 Parent company financial statements
110 Notes to the parent company financial statements
123 Auditor’s report
126 Shares and shareholders
132 Key figures and taxes
Governance
134 Corporate governance statement
140 Metsä Board Corporation’s Board of Directors
142 Metsä Board Corporation’s Corporate Management Team
144 Investor relations and investor information

SUSTAINABILITYBUSINESS OPERATIONS AND VALUE CREATION GOVERNANCE
FINANCIAL DEVELOPMENT
PARENT COMPANy FINANCIAL STATEMENTS | METSÄ BOARD ANNUAL REPORT 2020
EUR 2020 2019
13. PROvISIONSProvisions for pension
1.1. 843,168.00 889,819.00
Decrease 0.00 -46,651.00
31.12. 843,168.00 843,168.00
Provisions for unemployment pension cost
1.1. 242,063.20 636,556.73
Decrease -45,977.11 -394,493.53
31.12. 196,086.09 242,063.20
Provisions for environmental obligations
1.1. 3,482,981.58 5,535,988.18
Increase 29,091.00 29,091.00
Decrease -74,331.00 -82,097.60
Cancellation of unused provision 0.00 -2,000,000.00
31.12. 3,437,741.58 3,482,981.58
Total provisions
1.1. 4,568,212.78 7,062,363.91
Increase 29,091.00 29,091.00
Decrease -120,308.11 -2,523,242.13
31.12. 4,476,995.67 4,568,212.78
14. DEFERRED TAX ASSETS AND LIABILITIESDeferred tax assets
Mandatory provisions 895,399.14 913,642.55
895,399.14 913,642.55
Deferred tax liabilities
Valuation of Pohjolan Voima Oyj shares at fair value 28,407,818.26 42,464,818.26
Financial instruments 5,185,630.30 462,139.88
33,593,448.56 42,926,958.14
Deferred tax assets (+) and liabilities (-), net -32,698,049.42 -42,013,315.59
The deferred tax liability for accrued depreciation in 2020 was EUR 29.6 million (27.8).
15. NON-CURRENT LIABILITIESLiabilities to group companies
Accrued liabilities
Derivatives 3,361,597.67 3,093,184.14
3,361,597.67 3,093,184.14
Other liabilities
Bonds 249,433,483.02 249,349,299.01
Loans from financial institutions 183,225,000.00 150,000,000.00
Deferred tax liabilities 32,698,049.43 42,013,315.59
Advance payments 1,515,404.91 1,515,404.94
466,871,937.36 442,878,019.54
Non-current liabilities total 470,233,535.03 445,971,203.68
BOND AND DEBENTURES
Bond Nominal value Interest % 2020 2019
2017–2027 250,000,000.00 2.75 249,433,483.02 249,349,299.01
250,000,000.00 249,433,483.02 249,349,299.01
In 2020, Metsä Board signed a EUR 100 million loan agreement guaranteed by Finnvera and a EUR 125 million loan agreement from the EIB for Husum’s investments.
NON-CURRENT LIABILITIES AND REPAYMENT
Liabilities to group companies Bonds
Loans fromfinancial
institutionsOther loans Total
2021 0.00
2022 0.00
2023 0.00
2024 0.00
2025 183,225,000.00 183,225,000.00
2026– 249,433,483.02 0.00 249,433,483.02
Total 0.00 249,433,483.02 183,225,000.00 0.00 432,658,483.02
EUR 2020 2019
16. CURRENT LIABILITIESLiabilities from Group companies
Accounts payable 44,124,848.19 44,212,846.86
Accruals and deferred income 5,738,187.10 7,731,407.59
49,863,035.29 51,944,254.45
Liabilities from participating interests
Accounts payable 379,727.97 415,389.81
379,727.97 415,389.81
Liabilities from other
Premium pension loans 0.00 23,348,214.32
Advance payment 1,756,007.02 2,870,361.05
Accounts payable 119,759,541.04 134,113,280.45
Other liabilities 6,612,960.98 6,328,756.57
Accruals and deferred income 55,072,138.76 57,881,744.87
183,200,647.80 224,542,357.26
Total current liabilities 233,443,411.06 276,902,001.52
Accruals and deferred income to group companies, current, specification
Derivatives 4,749,964.04 6,938,840.59
Others 988,223.06 792,567.00
5,738,187.10 7,731,407.59
Accruals and deferred income, current, external
Personnel expenses 24,385,420.58 23,730,052.16
Accruals of purchases 7,998,028.05 9,323,139.88
Discounts 15,023,668.87 16,229,184.80
Interests 2,093,172.00 2,127,990.43
Others 5,571,849.26 6,471,377.60
55,072,138.76 57,881,744.87
119118
METSÄ BOARD Annual Report 2020
Business operations and value creation
2 This is Metsä Board
4 CEO’s review
6 Highlights of the year
8 Strategy and targets
10 Creating value
12 Operating environment
16 Product and service development
18 Circular economy
Sustainability
20 Sustainability targets
24 We bring the forest to you
26 We offer sustainable choices
30 We work for a better climate and environment
34 We create well-being
40 Mill-specific information
Financial development
44 Report of the Board of Directors
57 Consolidated financial statements
61 Notes to the consolidated financial statements
107 Parent company financial statements
110 Notes to the parent company financial statements
123 Auditor’s report
126 Shares and shareholders
132 Key figures and taxes
Governance
134 Corporate governance statement
140 Metsä Board Corporation’s Board of Directors
142 Metsä Board Corporation’s Corporate Management Team
144 Investor relations and investor information

SUSTAINABILITYBUSINESS OPERATIONS AND VALUE CREATION GOVERNANCE
FINANCIAL DEVELOPMENT
PARENT COMPANy FINANCIAL STATEMENTS | METSÄ BOARD ANNUAL REPORT 2020
17. FINANCIAL INSTRUMENTS
FINANCIAL DERIVATIVES 2020Nominal value Fair value Fair value
EUR Derivative assets Derivative liabilities Total
Fair value through
profit and lossFair value through fair value reserve
Interest rate swaps 100,000,000.00 3,361,597.67 -3,361,597.67 0.00 -3,361,597.67
Total interest rate derivatives 100,000,000.00 3,361,597.67 -3,361,597.67 0.00 -3,361,597.67
Currency forward agreements 959,055,983.54 28,982,108.06 4,588,914.69 24,393,193.37 -479,508.43 24,872,701.80
Currency option agreements 0.00 0.00 0.00 0.00 0.00 0.00
Currency derivates total 959,055,983.54 28,982,108.06 4,588,914.69 24,393,193.37 -479,508.43 24,872,701.80
Electricity derivatives 1,010,304.05 29,500.95 39,025.00 -9,524.05 0.00 -9,524.05
Oil derivatives 12,278,325.00 1,322,834.33 122,024.35 1,200,809.98 0.00 1,200,809.98
Other commodity derivatives 7,181,221.20 2,205,471.52 0.00 2,205,471.52 0.00 2,205,471.52
Commodity derivatives 20,469,850.25 3,557,806.80 161,049.35 3,396,757.45 0.00 3,396,757.45
Derivatives total 1,079,525,833.79 32,539,914.86 8,111,561.71 24,428,353.15 -479,508.43 24,907,861.58
FINANCIAL DERIVATIVES 2019Nominal value Fair value Fair value
EUR Derivative assets Derivative liabilities TotalFair value through
profit and lossFair value through fair value reserve
Interest rate swaps 100,000,000.00 3,093,184.14 -3,093,184.14 0.00 -3,093,184.14
Total interest rate derivatives 100,000,000.00 3,093,184.14 -3,093,184.14 0.00 -3,093,184.14
Currency forward agreements 959,922,102.68 10,311,344.00 4,703,492.00 5,607,852.00 439,059.00 5,168,793.00
Currency option agreements 480,297,808.00 242,797.50 98,446.98 144,350.52 0.00 144,350.52
Currency derivates total 1,440,219,910.68 10,554,141.50 4,801,938.98 5,752,202.52 439,059.00 5,313,143.52
Electricity derivatives 4,172,392.45 170,926.48 639,485.50 -468,559.02 0.00 -468,559.02
Oil derivatives 7,611,085.00 457,860.61 489,733.51 -31,872.90 0.00 -31,872.90
Other commodity derivatives 7,396,908.00 68,419.57 1,007,682.60 -939,263.03 0.00 -939,263.03
Commodity derivatives 19,180,385.45 697,206.66 2,136,901.61 -1,439,694.95 0.00 -1,439,694.95
Derivatives total 1,559,400,296.13 11,251,348.16 10,032,024.73 1,219,323.43 439,059.00 780,264.43
All derivative agreements of Metsä Board Oyj have been entered into for hedging purpose, and cash flow hedge accounting according to IFRS 9 has been applied in major part of the agreements within IFRS financial statements. Only the part of currency derivatives designated as hedges of accounts receivables and accounts payables is not directed to hedge accounting. Interest rate derivatives are interest rate swaps maturing in 1–5 years and entered into to hedge the floating rate interest payments. Currency derivatives contracts concluded to hedge currency cash flows mature fully during 2021. Commodity derivatives are electricity forwards, natural gas forwards, propane forwards and gasoil and heavy fuel oil forwards concluded to hedge the cash flows arising from purchases of these commodities. Commodity forwards mature fully during 2021. A more detailed description of financial risk management and the principles applied to derivative contracts is included in note 5.6 and 5.7 of the consolidated Group accounts.
THE FAIR VALUE HIERARCHY OF FINANCIAL ASSETS AND LIABILITIES 2020
EUR Level 1 Level 2 Level 3 Total
Financial assets at fair value
Other shares and holdings 184,224,295.61 184,224,295.61
Derivative financial assets 2,234,972.47 30,304,942.39 32,539,914.86
Financial liabilities measured at fair value
Derivative financial liabilities 39,025.14 8,072,536.57 8,111,561.71
THE FAIR VALUE HIERARCHY OF FINANCIAL ASSETS AND LIABILITIES 2019
EUR Level 1 Level 2 Level 3 Total
Financial assets at fair value
Other shares and holdings 252,435,976.80 252,435,976.80
Derivative financial assets 697,206.66 10,554,141.50 11,251,348.16
Financial liabilities measured at fair value
Derivative financial liabilities 1,187,093.33 8,844,931.40 10,032,024.73
The principles applied to classification of financial assets and liabilities valued at fair value are described in Notes 5.6 and 5.7 of the Metsä Board consolidated financial statements.
18. DISPUTES, LEGAL PROCEEDINGS AND COMMITMENTS
DISPUTES AND LEGAL PROCEEDINGSDisputes are presented in Note 8.1 of the consolidated financial statements.
COMMITMENTS AND CONTINGENCIESEUR 2020 2019
For own liabilities
Liabilities secured by pledges
Pension premium loans 0.00 6,785,714.32
Pledges granted 0.00 30,615,259.99
Corporate mortgages
Liabilities secured by mortgages
Pension premium loans 0.00 17,312,500.00
Real estate mortgages 192,779,000.00 232,779,000.00
For affiliated companies
Guarantees 3,455,798.00 9,431,119.00
For associated and joint ventures
Guarantees 78,815.00 95,704.00
Leasing commitments
Payments due in following 12 months 1,579,013.73 1,286,910.48
Payments due later than 1 year 5,334,441.43 4,699,743.88
Total
Pledged assets 0.00 30,615,259.99
Real estate mortgages 192,779,000.00 232,779,000.00
Guarantees 3,534,613.00 9,526,823.00
Leasing commitments 6,913,455.16 5,986,654.36
Total commitments 203,227,068.16 278,907,737.35
19. SHARES AND HOLDINGS
Shares and holdings are presented in Note 7.2. of consolidated financial statements.
121120
METSÄ BOARD Annual Report 2020
Business operations and value creation
2 This is Metsä Board
4 CEO’s review
6 Highlights of the year
8 Strategy and targets
10 Creating value
12 Operating environment
16 Product and service development
18 Circular economy
Sustainability
20 Sustainability targets
24 We bring the forest to you
26 We offer sustainable choices
30 We work for a better climate and environment
34 We create well-being
40 Mill-specific information
Financial development
44 Report of the Board of Directors
57 Consolidated financial statements
61 Notes to the consolidated financial statements
107 Parent company financial statements
110 Notes to the parent company financial statements
123 Auditor’s report
126 Shares and shareholders
132 Key figures and taxes
Governance
134 Corporate governance statement
140 Metsä Board Corporation’s Board of Directors
142 Metsä Board Corporation’s Corporate Management Team
144 Investor relations and investor information

SUSTAINABILITYBUSINESS OPERATIONS AND VALUE CREATION GOVERNANCE
AUDITOR’S REPORT | METSÄ BOARD ANNUAL REPORT 2020
FINANCIAL DEVELOPMENT
THE BOARD’S PROPOSAL FOR THE DISTRIBUTION OF FUNDS
The distributable funds of the company are EUR 640,246,168.23 of which retained earnings constitute EUR 372,724,647.06 and profit for the period EUR 180,456,182.13. The Board of Directors proposes the following to the Annual General Meeting regarding the distribution of funds:
Dividend of EUR 0.10 per share be paid, or in total 35,551,274.60
Capital distribution of EUR 0.16 per share from the invested unrestricted equity fund be paid, or in total
56,882,039.36
To be left in the unrestricted shareholders' equity 547,812,854.27
Distributable funds of the company 640,246,168.23
The Board of Directors proposes that the dividend and equity repayment will be paid on 7th April, 2021.
No material changes have been taken place in respect of the company’s financial position after the balance sheet date.The liquidity of the company is good, and in the opinion of the Board of Directors, the proposed profit distribution would not compromise the liquidity of the company.
Espoo 10th February 2021
Ilkka Hämälä Hannu Anttila Kirsi Komi
Kai Korhonen Liisa Leino Jussi Linnaranta
Jukka Moisio Timo Saukkonen Veli Sundbäck
Mika Joukio CEO
AUDITOR’S REPORT
TO THE ANNUAL GENERAL MEETING OF METSÄ BOARD CORPORATION
REPORT ON THE AUDIT OF THE FINANCIAL STATEMENTS
OPINIONWe have audited the financial statements of Metsä Board Corporation (business identity code 0635366-7) for the year ended 31 December, 2020. The financial statements comprise the consolidated balance sheet, statement of comprehen-sive income, statement of changes in equity, statement of cash flows and notes, including a summary of significant accounting policies, as well as the parent company’s balance sheet, income statement, statement of cash flows and notes.
In our opinion• the consolidated financial statements give a true and fair view of the group’s
financial performance, financial position and cash flows in accordance with International Financial Reporting Standards (IFRS) as adopted by the EU
• the financial statements give a true and fair view of the parent company’s financial performance and financial position in accordance with the laws and regulations governing the preparation of financial statements in Finland and comply with statutory requirements.
Our opinion is consistent with the additional report submitted to the Audit Committee.
BASIS FOR OPINIONWe conducted our audit in accordance with good auditing practice in Finland. Our responsibilities under good auditing practice are further described in the Auditor’s Responsibilities for the Audit of the Financial Statements section of our report.
We are independent of the parent company and of the group companies in accordance with the ethical requirements that are applicable in Finland and are relevant to our audit, and we have fulfilled our other ethical responsibilities in accordance with these requirements.
In our best knowledge and understanding, the non-audit services that we have provided to the parent company and group companies are in compliance with laws and regulations applicable in Finland regarding these services, and we have not provided any prohibited non-audit services referred to in Article 5(1) of regulation (EU) 537/2014. The non-audit services that we have provided have been disclosed in note 2.4 to the consolidated financial statements.
We believe that the audit evidence we have obtained is sufficient and appro-priate to provide a basis for our opinion.
MATERIALITyThe scope of our audit was influenced by our application of materiality. The materiality is determined based on our professional judgement and is used to determine the nature, timing and extent of our audit procedures and to evaluate the effect of identified misstatements on the financial statements as a whole. The level of materiality we set is based on our assessment of the magnitude of misstatements that, individually or in aggregate, could reasonably be expected to have influence on the economic decisions of the users of the financial statements. We have also taken into account misstatements and/or possible misstatements that in our opinion are material for qualitative reasons for the users of the financial statements.
KEy AUDIT MATTERSKey audit matters are those matters that, in our professional judgment, were of most significance in our audit of the financial statements of the current period. These matters were addressed in the context of our audit of the financial statements as a whole, and in forming our opinion thereon, and we do not provide a separate opinion on these matters. The significant risks of material misstatement referred to in the EU Regulation No 537/2014 point (c) of Article 10(2) are included in the description of key audit matters below.
THE KEY AUDIT MATTER HOW THE MATTER WAS ADDRESSED IN THE AUDIT
vALUATION OF TANGIBLE AND INTANGIBLE ASSETS (REFER TO NOTES 4.1 AND 4.2 TO THE CONSOLIDATED FINANCIAL STATEMENTS)
Tangible and intangible assets total EUR 844 million and represent 37 percent of the consolidated total assets. Total investments amounted to EUR 166 million.
Tangible and intangible assets are allocated to cash-generating units and tested for impairment annually or more frequently should there be an indication of impairment.
Determining the key assumptions used in the cash flow forecasts underly-ing the impairment tests requires management judgment.
Due to the significant carrying values involved, valuation of tangible and intangible assets is determined a key audit matter.
Our audit procedures included evaluation of the appropriateness of the capitalization and depreciation principles applied.
We also assessed the key assumptions used in the impairment tests by ref-erence to the budgets approved by the parent company’s Board of Directors, data external to the Group and our own views. We involved KPMG valuation specialists when assessing the mathematical accuracy of the calculations, as well as comparing the assumptions to externally available market and industry data.
In addition, we considered the appropriateness of the disclosures regard-ing the tangible and intangible assets.
Auditor’s Report
123122
METSÄ BOARD Annual Report 2020
Business operations and value creation
2 This is Metsä Board
4 CEO’s review
6 Highlights of the year
8 Strategy and targets
10 Creating value
12 Operating environment
16 Product and service development
18 Circular economy
Sustainability
20 Sustainability targets
24 We bring the forest to you
26 We offer sustainable choices
30 We work for a better climate and environment
34 We create well-being
40 Mill-specific information
Financial development
44 Report of the Board of Directors
57 Consolidated financial statements
61 Notes to the consolidated financial statements
107 Parent company financial statements
110 Notes to the parent company financial statements
123 Auditor’s report
126 Shares and shareholders
132 Key figures and taxes
Governance
134 Corporate governance statement
140 Metsä Board Corporation’s Board of Directors
142 Metsä Board Corporation’s Corporate Management Team
144 Investor relations and investor information

SUSTAINABILITYBUSINESS OPERATIONS AND VALUE CREATION
FINANCIAL DEVELOPMENT GOVERNANCE
AUDITOR’S REPORT | METSÄ BOARD ANNUAL REPORT 2020
We have also addressed the risk of management override of internal controls. This includes consideration of whether there was evidence of management bias that represented a risk of material misstatement due to fraud.
RESPONSIBILITIES OF THE BOARD OF DIRECTORS AND THE MANAGING DIRECTOR FOR THE FINANCIAL STATEMENTSThe Board of Directors and the Managing Director are responsible for the preparation of consolidated financial statements that give a true and fair view in accordance with International Financial Reporting Standards (IFRS) as adopted by the EU, and of financial statements that give a true and fair view in accordance with the laws and regulations governing the preparation of financial statements in Finland and comply with statutory requirements. The Board of Directors and the Managing Director are also responsible for such internal control as they determine is necessary to enable the preparation of financial statements that are free from material misstatement, whether due to fraud or error.
In preparing the financial statements, the Board of Directors and the Manag-ing Director are responsible for assessing the parent company’s and the group’s ability to continue as a going concern, disclosing, as applicable, matters relating to the going concern and using the going concern basis of accounting. The financial statements are prepared using the going concern basis of accounting unless there is an intention to liquidate the parent company or the group or cease operations, or there is no realistic alternative but to do so.
AUDITOR’S RESPONSIBILITIES FOR THE AUDIT OF THE FINANCIAL STATEMENTSOur objectives are to obtain reasonable assurance on whether the financial statements as a whole are free from material misstatement, whether due to fraud or error, and to issue an auditor’s report that includes our opinion. Reasonable assurance is a high level of assurance but is not a guarantee that an audit con-ducted in accordance with good auditing practice will always detect a material misstatement when it exists. Misstatements can arise from fraud or error and
THE KEY AUDIT MATTER HOW THE MATTER WAS ADDRESSED IN THE AUDIT
vALUATION OF INvENTORIES (REFER TO NOTE 4.4 TO THE CONSOLIDATED FINANCIAL STATEMENTS)
Inventory management, stocktaking routines and pricing of inventories are key factors in the valuation of inventories. The Group’s carrying value of inventories was EUR 360 million at the end of the financial year.
The valuation of inventories involves management estimates in relation to potentially obsolete inventory, as well as to fluctuations in the market prices of finished goods.
The valuation of inventories has a significant impact on the profit and loss account and therefore it is determined as a key audit matter.
We evaluated the appropriateness of the accounting policies by reference to IFRS standards, as well as the functionality of the key IT systems of inventory management.
We tested the controls over inventory management, accuracy of inventory amounts and valuation of inventories, as well as performed substantive audit procedures relating to the valuation of inventories to test the accuracy of inventory valuation. We also followed the execution of certain stocktaking routines during the financial year.
FINANCIAL CONTRACTS AND HEDGING INSTRUMENTS (REFER TO NOTES 5.5, 5.6 AND 5.7 TO THE CONSOLIDATED FINANCIAL STATEMENTS)
The financial liabilities amount to EUR 452 million, accounting for 20 per-cent of the consolidated balance sheet. In addition, the Group has off-balance sheet committed credit facility agreements amounting to EUR 392 million.
The Group hedges financial risks with interest rate and foreign currency derivatives and their nominal values amounted to EUR 1 059 million at the end of the financial year.
Due to the significance of the financial and derivative contracts and large number of transactions, the financial contracts and hedging instruments are determined as a key audit matter.
Our audit procedures included evaluation of the recognition and meas-urement principles applied to financial instruments for appropriateness in relation to IFRS requirements, as well as testing of controls over the accuracy and valuation of financial instruments.
As part of our year-end audit procedures we tested the appropriateness of valuations by using various analysis, as well as selecting transactions for testing on a sample basis.
In addition, we evaluated the adequacy of the disclosures relating to financial instruments.
CONTROLS OvER FINANCIAL REPORTING AND RELATED IT SySTEMS
The IT control environment relating to the financial reporting process and the application controls of individual IT systems have an impact on the selected audit approach.
As the consolidated financial statements are based on extensive number of data flows from multiple IT systems, consequently the financial reporting control environment is determined as a key audit matter.
Our audit procedures included evaluation of the financial reporting process and related control environment, as well as testing of the effectiveness of controls including general IT controls. Our audit procedures focused on testing the reconciliation and approval controls as well as on evaluating the administration of access rights.
Our audit procedures extensively consisted of several substantive proce-dures as well as data analysis relating to the most significant balances on the income statement and on the balance sheet.
are considered material if, individually or in aggregate, they could reasonably be expected to influence the economic decisions of users taken on the basis of the financial statements.
As part of an audit in accordance with good auditing practice, we exercise professional judgment and maintain professional scepticism throughout the audit. We also:• Identify and assess the risks of material misstatement of the financial state-
ments, whether due to fraud or error, design and perform audit procedures responsive to those risks, and obtain audit evidence that is sufficient and appropriate to provide a basis for our opinion. The risk of not detecting a material misstatement resulting from fraud is higher than for one resulting from error, as fraud may involve collusion, forgery, intentional omissions, misrepresentations, or the override of internal control.
• Obtain an understanding of internal control relevant to the audit in order to design audit procedures that are appropriate in the circumstances, but not for the purpose of expressing an opinion on the effectiveness of the parent company’s or the group’s internal control.
• Evaluate the appropriateness of accounting policies used and the reasonable-ness of accounting estimates and related disclosures made by management.
• Conclude on the appropriateness of the Board of Directors’ and the Man-aging Director’s use of the going concern basis of accounting and based on the audit evidence obtained, whether a material uncertainty exists related to events or conditions that may cast significant doubt on the parent company’s or the group’s ability to continue as a going concern. If we conclude that a material uncertainty exists, we are required to draw attention in our auditor’s report to the related disclosures in the financial statements or, if such disclosures are inadequate, to modify our opinion. Our conclusions are based on the audit evidence obtained up to the date of our auditor’s report. However, future events or conditions may cause the parent company or the group to cease to continue as a going concern.
• Evaluate the overall presentation, structure and content of the financial statements, including the disclosures, and whether the financial statements represent the underlying transactions and events so that the financial statements give a true and fair view.
• Obtain sufficient appropriate audit evidence regarding the financial infor-mation of the entities or business activities within the group to express an opinion on the consolidated financial statements. We are responsible for the direction, supervision and performance of the group audit. We remain solely responsible for our audit opinion.
We communicate with those charged with governance regarding, among other matters, the planned scope and timing of the audit and significant audit find-ings, including any significant deficiencies in internal control that we identify during our audit.
We also provide those charged with governance with a statement that we have complied with relevant ethical requirements regarding independence and communicate with them all relationships and other matters that may reasonably be thought to bear on our independence, and where applicable, related safeguards.
From the matters communicated with those charged with governance, we determine those matters that were of most significance in the audit of the finan-cial statements of the current period and are therefore the key audit matters. We describe these matters in our auditor’s report unless law or regulation precludes public disclosure about the matter or when, in extremely rare circumstances, we
determine that a matter should not be communicated in our report because the adverse consequences of doing so would reasonably be expected to outweigh the public interest benefits of such communication.
OTHER REPORTING REQUIREMENTS
INFORMATION ON OUR AUDIT ENGAGEMENTWe were first appointed as auditors by the Annual General Meeting on 28 March 2012 and our appointment represents a total period of uninterrupted engagement of 9 years.
OTHER INFORMATIONThe Board of Directors and the Managing Director are responsible for the other information. The other information comprises the report of the Board of Direc-tors and the information included in the Annual Report but does not include the financial statements and our auditor’s report thereon. We have obtained the report of the Board of Directors prior to the date of this auditor’s report, and the Annual Report is expected to be made available to us after that date. Our opinion on the financial statements does not cover the other information.
In connection with our audit of the financial statements, our responsibility is to read the other information identified above and, in doing so, consider whether the other information is materially inconsistent with the financial statements or our knowledge obtained in the audit, or otherwise appears to be materially misstated. With respect to the report of the Board of Directors, our responsibility also includes considering whether the report of the Board of Directors has been prepared in accordance with the applicable laws and regulations.
In our opinion, the information in the report of the Board of Directors is consistent with the information in the financial statements and the report of the Board of Directors has been prepared in accordance with the applicable laws and regulations.
If, based on the work we have performed on the other information that we obtained prior to the date of this auditor’s report, we conclude that there is a material misstatement of this other information, we are required to report that fact. We have nothing to report in this regard.
OTHER OPINIONSWe support that the financial statements should be adopted. The proposal by the Board of Directors regarding the treatment of distributable funds is in compliance with the Limited Liability Companies Act. We support that the Board of Directors of the parent company and the Managing Director should be discharged from liability for the financial period audited by us.
Helsinki, February 11, 2021
KPMG Oy Ab
Kirsi Jantunen Authorized Public Accountant
125124
METSÄ BOARD Annual Report 2020
Business operations and value creation
2 This is Metsä Board
4 CEO’s review
6 Highlights of the year
8 Strategy and targets
10 Creating value
12 Operating environment
16 Product and service development
18 Circular economy
Sustainability
20 Sustainability targets
24 We bring the forest to you
26 We offer sustainable choices
30 We work for a better climate and environment
34 We create well-being
40 Mill-specific information
Financial development
44 Report of the Board of Directors
57 Consolidated financial statements
61 Notes to the consolidated financial statements
107 Parent company financial statements
110 Notes to the parent company financial statements
123 Auditor’s report
126 Shares and shareholders
132 Key figures and taxes
Governance
134 Corporate governance statement
140 Metsä Board Corporation’s Board of Directors
142 Metsä Board Corporation’s Corporate Management Team
144 Investor relations and investor information

1 2 3 4 5 6 7 8 9 10 11 12
80
60
40
20
016 17 18 19 2016 17 18 19 2016 17 18 19 20 16 17 18 19 20
SUSTAINABILITYBUSINESS OPERATIONS AND VALUE CREATION GOVERNANCE
FINANCIAL DEVELOPMENT
SHARES AND SHAREHOLDERS | METSÄ BOARD ANNUAL REPORT 2020
SHARES AND SHAREHOLDERS
METSÄ BOARD’S SHARESMetsä Board’s shares are listed on the Nasdaq Helsinki. On 31 December 2020, the company’s share capital was EUR 557,881,540.40.
Metsä Board has two series of shares. At the end of 2020, there were 32,887,151 A shares and 322,625,595 B shares.
Each A share entitles its holder to twenty (20) votes at a General Meeting of Shareholders, and each B share entitles the holder to one (1) vote. All shares carry the same right to receive a dividend. Metsä Board’s A shares can be converted to B shares if a shareholder or a representative of the nominee registered shares makes a written request for the conversion to the company. In 2020, a total of 200,496 Metsä Board Corporation’s A shares were converted to B shares.
TRADING OF SHARES IN 2020The shares of Metsä Board are listed on the Nasdaq Helsinki. The trading ID of the B share is METSB and the ISIN code FI0009000665. A share trading ID is METSA and ISIN code FI0009000640.
At the end of the financial year, the price for B share on Nasdaq Helsinki was EUR 8.62 (6.00). The highest price for the B share in 2020 was EUR 8.79 (6.65) and the lowest was EUR 4.47 (3.86). At the end of the period, the price for Metsä Board’s A share on Nasdaq Helsinki was EUR 8.64 (6.14). The highest price in 2020 was EUR 8.80 (7.98) and the lowest was EUR 4.80 (5.46).
In 2020, the average daily trading volumes of the B and A shares on the Nasdaq Helsinki were 616,002 shares and 6,980 shares, respectively. The total trading volumes of the B and A shares were EUR 950 million and EUR 12 million, respectively.
SHAREHOLDERS At the end of 2020, Metsä Board had 7,426 registered shareholders of A shares and 48,165 of B shares. During the review period, Metsä Board received a notification of major holdings according to which Metsäliitto Cooperative’s combined share of votes in Metsä Board Corporation exceeded the limit of two-thirds (2/3). At the end of 2020, Metsäliitto Cooperative owned 48% (46) of the shares, and the voting rights conferred by these shares totalled 67% (66). Foreign and nominee-reg-istered investors held 16% (15) of the shares. The company does not hold any treasury shares.
BASIC INFORMATION ON METSÄ BOARD’S SHARES
Metsä Board’s A share Metsä Board’s B share
Listing Nasdaq Helsinki Nasdaq Helsinki
Date of listing 2 January 1987 2 January 1987
Market cap segment Large Cap Large Cap
Ticker symbol METSA METSB
ISIN code FI0009000640 FI0009000665
Reuters code METSA.HE METSB.HE
Bloomberg code METSA FH METSB FH
Number of shares 31 Dec 2020 32,887,151 322,625,595
TRADING ON THE NASDAQ HELSINKI IN 2020 (2019)
Metsä Board’s A share Metsä Board’s B share
Closing price on 31 December, EUR 8.64 (6,14) 8.62 (6.00)
Lowest price, EUR 4.80 (5,46) 4.47 (3.86)
Highest price, EUR 8.80 (7,98) 8.79 (6.65)
Average price, EUR 6.88 (6.56) 6.12 (5.26)
Average daily trading volume, no. of shares 6,980 (2,778) 616,002 (880,683)
Total trading volume, no. of shares 1,758,863 (694,519) 155,232,570 (220,170,829)
Market capitalisation, EUR million 300 (203) 2,800 (1,934)
SHARE PRICE DEvELOPMENT 2020
Shares and shareholders
MAJOR SHAREHOLDERS 31 DEC 2020,1) A series B series Total shares Votes
Shareholders No. of shares No. of shares No. of shares % %
1 Metsäliitto Cooperative 25,767,605 145,452,320 171,219,925 48.16 67.40
2 Varma Mutual Pension Insurance Company 2,203,544 15,041,485 17,245,029 4.85 6.03
3 Ilmarinen Mutual Pension Insurance 1 250 000 8 677 409 9 927 409 2,79 3,44
4 Etola Erkki Olavi 0 6 500 000 6 500 000 1.83 0.66
5 Elo Mutual Pension Insurance Company 0 4,089,094 4,089,094 1.15 0.42
6 The State Pension Fund 0 3 215 617 3 215 617 0,90 0.33
7 Evli Finnish Small Cap Fund 0 2,464,00 2,464,00 0.69 0.25
8 OP-Finland 0 2,115,998 2,115,998 0.60 0.22
9 Danske Invest Finnish Equity Fund 0 1,188,295 1,188,295 0.33 0.12
10 Maa- ja Metsätaloustuottajain Keskusliitto MTK ry 619,743 491,581 1,111,324 0.31 1.31
11 OP-Finland Small Firms Fund 0 1,074,294 1,074,294 0.30 0.11
12 Veritas Pension Insurance Company Ltd. 0 892,555 892,555 0.25 0.09
13 Säästöpankki Kotimaa Mutual Fund 0 757,600 757,600 0.21 0.08
14 Aktia Capital Mutual Fund 0 754,841 754 841 0,21 0.08
15 OP-Henkivakuutus Ltd. 0 753,345 753,345 0.21 0.08
16 Etola Markus Eeriki 0 750,000 750,000 0.21 0.08
17 Etola Mikael Kristian 0 630,000 630,000 0.18 0.06
18 Nordea Pro Finland Fund 0 624,225 624,225 0.18 0.06
19 Kirkon Eläkerahasto 0 617,998 617,998 0.17 0.06
20 Seppälä Tommi Kalervo 0 600,000 600,000 0.17 0.06
1) Shareholders in the book entry system
METSÄ BOARD A SHARE
Number of sharesNumber of
Shareholders % Number of shares %
1–10 966 13.01 5354 0.02
11–100 2,845 38.31 152,339 0.46
101–1.000 3,067 41.30 1,177,086 3.58
1.001–10.000 522 7.03 1,233,608 3.75
10.001–100.000 21 0.28 370,182 1.13
100.001+ 5 0.07 29,948,582 91.07
Total 7,426 100 32,887,151 100
METSÄ BOARD B SHARE
Number of sharesNumber of
Shareholders % Number of shares %
1–10 3,025 6.28 20,097 0.01
11–100 13,408 27.04 706,483 0.22
101–1.000 21,740 45.14 87,22,648 2.70
1.001–10.000 9,002 18.69 25,224,724 7.82
10.001–100.000 882 1.83 20,440,660 6.34
100.001+ 108 0.22 267,510,983 82.92
Total 100 322,625,595 100
DIVIDENDEUR
Dividend yield, %
SHAREHOLDER’SEQUITY PER SHARE
EUR
EARNINGSPER SHARE
EUR
DIVIDEND/EARNINGS
%
0.30
0.25
0.20
0.15
0.10
0.05
0
4.0
3.0
2.0
1.0
0
0.6
0.5
0.4
0.3
0.2
0.1
0
Source: Euroland
9.0
8.0
7.0
6.0
5.0
4.0
5.0
4.0
3.0
2.0
1.0
0.0
EUR Million shares
Metsä Board A Metsä Board B OMX Helsinki Portfolio Index (scaled) Trading volume
DONEDONE
6.0
5.0
4.0
3.0
2.0
1.0
0
127126
METSÄ BOARD Annual Report 2020
Business operations and value creation
2 This is Metsä Board
4 CEO’s review
6 Highlights of the year
8 Strategy and targets
10 Creating value
12 Operating environment
16 Product and service development
18 Circular economy
Sustainability
20 Sustainability targets
24 We bring the forest to you
26 We offer sustainable choices
30 We work for a better climate and environment
34 We create well-being
40 Mill-specific information
Financial development
44 Report of the Board of Directors
57 Consolidated financial statements
61 Notes to the consolidated financial statements
107 Parent company financial statements
110 Notes to the parent company financial statements
123 Auditor’s report
126 Shares and shareholders
132 Key figures and taxes
Governance
134 Corporate governance statement
140 Metsä Board Corporation’s Board of Directors
142 Metsä Board Corporation’s Corporate Management Team
144 Investor relations and investor information

SUSTAINABILITYBUSINESS OPERATIONS AND VALUE CREATION GOVERNANCE
FINANCIAL DEVELOPMENT
SHARES AND SHAREHOLDERS | METSÄ BOARD ANNUAL REPORT 2020
SHAREHOLDINGS OF THE MEMBERS OF THE BOARD OF DIRECTORS AND CEO ON 31 DECEMBER 2020
Holding
Ilkka Hämälä Chairman of the Board of Directors 337,648 B shares
Jussi Linnaranta Vice Chairman of the Board of Directors 20,939 B shares
Hannu Anttila Member of the Board of Directors 140,619 B shares
Kirsi Komi Member of the Board of Directors 78,287 B shares
Kai Korhonen Member of the Board of Directors 215,057 B shares
Liisa Leino Member of the Board of Directors 182,932 B shares
Jukka Moisio Member of the Board of Directors 5,275 B shares
Timo Saukkonen Member of the Board of Directors 9,875 B shares
Veli Sundbäck Member of the Board of Directors 67,952 B shares
Mika Joukio CEO 354,025 B shares
Share holdings of the Corporate Management Team members are presented on page 137.
CHANGES IN SHARE CAPITAL AND NUMBER OF SHARES 1 JANURy 2004–31 DECEMBER 2020
Number of sharesShare capital,
EUR million
2003 Share capital 31 December 2003 178,999,425 304.3
2004 Rights issue 148,633,415 252.7
Rights issue 532,772 0.9
Share capital 31 December 2004 328,165,612 557.9
2005–2014 No changes
2015 Rights issue, no changes to share capital 27,347,134
Share capital 31 December 2015 355,512,746 557.9
2016–2020 No changes
Share capital 31 December 2020 355,512,746 557.9
PRICE DEvELOPMENT AND NUMBER OF SHARES2020 2019 2018 2017 2016
Adjusted share prices, EUR
A share high 8.80 7.98 10.10 7.28 6.93
low 4.80 5.46 6.00 5.43 4.80
closing 8.64 6.14 6.14 7.13 6.75
average 6.88 6.56 8.36 6.35 5.85
B share high 8.79 6.65 10.30 7.36 7.15
low 4.47 3.86 4.98 5.34 4.23
closing 8.62 6.00 5.12 7.15 6.80
average 6.12 5.26 7.95 6.37 5.34
Trading volume at Nasdaq Helsinki, number of shares
A share 1,758,683 694,519 2,227,788 1,491,973 776,677
% of total number of shares 5.3 2.1 6.3 4.2 2.2
B share 155,232,570 220,170,829 180,834,626 172,937,862 185,712,500
% of average number of shares 48.1 68.3 56.5 54.1 58.1
Number of shares at year end
A share 32,887,151 33,087,647 35,358,794 35,886,682 35,895,651
B share 322,625,595 322,425,099 320,153,952 319,626,064 319,617,095
Total 355,512,746 355,512,746 355,512,746 355,512,746 355,512,746
Number of shares at year end, adjusted for 2015 rights issue. 355,512,746 355,512,746 355,512,746 355,512,746 355,512,746
Market capitalisation at year end, EUR million 3,065.2 2,136.1 1,856.3 2,539.6 2,415.7
Number of shareholders, B shares 48,165 50,420 45,341 43,268 42,011
KEy FIGURESEUR million 2020 2019 2018 2017 2016
Earnings per share
Result before tax 212.3 165.6 224.2 170.8 101.6
– Income taxes -42.2 -21.0 -20.8 -20.3 -11.3
= Result for the period 170.1 144.6 203.4 150.5 90.4
– Average number of shares 355,512,746 355,512,746 355,512,746 355,512,746 355,512,746
Earnings per share, basic and diluted, EUR 0.48 0.41 0.57 0.42 0.25
Shareholders’ equity per share, EUR 3.89 3.76 3.72 3.28 2.96
Dividend per share, EUR 0.26,1) 0.24 0.29 0.21 0.19
Payout ratio, % 54.3 58.5 50.9 50.0 76.0
Metsä Board shares have no nominal value.
Dividend yield, % of closing price
A share 3.0,1) 3.9 4.7 2.9 2.8
B share 3.0,1) 4.0 5.7 2.9 2.8
Price/earning ratio (P/E ratio)
A share 18.1 15.0 10.8 17.0 27.0
B share 18.0 14.6 9.0 17.0 27.2
Price to book value (P/BV), %
A share 222.0 163.3 165.1 217.4 228.0
B share 221.5 159.6 137.6 217.8 229.7
1) The Board of Directors has proposed that a dividend of EUR 0.10 per share be distributed for the 2020 financial year, and further that EUR 0.16 per share be distributed from the unrestricted equity reserve.
IMPACT OF CHANGE IN CONTROLSome of Metsä Board’s shareholder agreements concerning resource and associated companies include provisions under which Metsä Board must offer its shares in an associated company for sale to the other shareholders in the case of a change of control of Metsä Board. Of these agreements, pursuant to the shareholders agreement of Metsä Fibre Oy, Metsä Fibre’s shareholders should offer their shares for sale to the other shareholders in the case of a change of control. A decrease in the voting rights of Metsäliitto Cooperative in Metsä Board to below 50% would not, however, obligate Metsä Board to offer its shares in Metsä Fibre Oy for sale.
BOARD OF DIRECTORS’ AUTHORITy TO ISSUE SHARESThe Board of Directors is authorised to decide on an issue of shares and any special rights with an entitlement to shares as referred to in Chapter 10, section 1 of the Limited Liability Companies Act as follows.
The maximum number of shares that can be issued on the basis of the authorisation is 35,000,000 B shares, which corresponds to approximately 10% of all shares in the company. The Board of Directors decides on all terms and conditions applicable to the issue of shares and the special rights with an entitlement to shares. The authorisation applies to both an issue of new shares and the assignment of own shares. The issue of shares and any special rights with an entitlement to shares may occur in departure from a shareholder’s subscription right (private placement).
The authorisation is valid until 23 March 2022. The authorisation was fully unused on 31 December 2020.
DIvIDEND POLICyMetsä Board aims to distribute at least 50% of the result for the financial period as dividend every year. The Board of Directors proposes that a dividend of EUR 0.10 per share and a capital distribution of EUR 0.16 per share be paid for the 2020 financial period. The proposed dividend and capital distribution, totalling EUR 0.26 per share, corresponds to 54% of the result per share for 2020.
SPLIT OF SHAREHOLDINGS AND vOTING RIGHTS, 31 DECEMBER 2020
SPLIT OFSHAREHOLDINGS%
SPLIT OFVOTING RIGHTS%
Metsäliitto Cooperative 48
Finnish institutions 18
Finnish private investors 16
Foreign owners 18
Metsäliitto Cooperative 67
Finnish institutions 12
Finnish private investors 15
Foreign owners 6
DONE
129128
METSÄ BOARD Annual Report 2020
Business operations and value creation
2 This is Metsä Board
4 CEO’s review
6 Highlights of the year
8 Strategy and targets
10 Creating value
12 Operating environment
16 Product and service development
18 Circular economy
Sustainability
20 Sustainability targets
24 We bring the forest to you
26 We offer sustainable choices
30 We work for a better climate and environment
34 We create well-being
40 Mill-specific information
Financial development
44 Report of the Board of Directors
57 Consolidated financial statements
61 Notes to the consolidated financial statements
107 Parent company financial statements
110 Notes to the parent company financial statements
123 Auditor’s report
126 Shares and shareholders
132 Key figures and taxes
Governance
134 Corporate governance statement
140 Metsä Board Corporation’s Board of Directors
142 Metsä Board Corporation’s Corporate Management Team
144 Investor relations and investor information
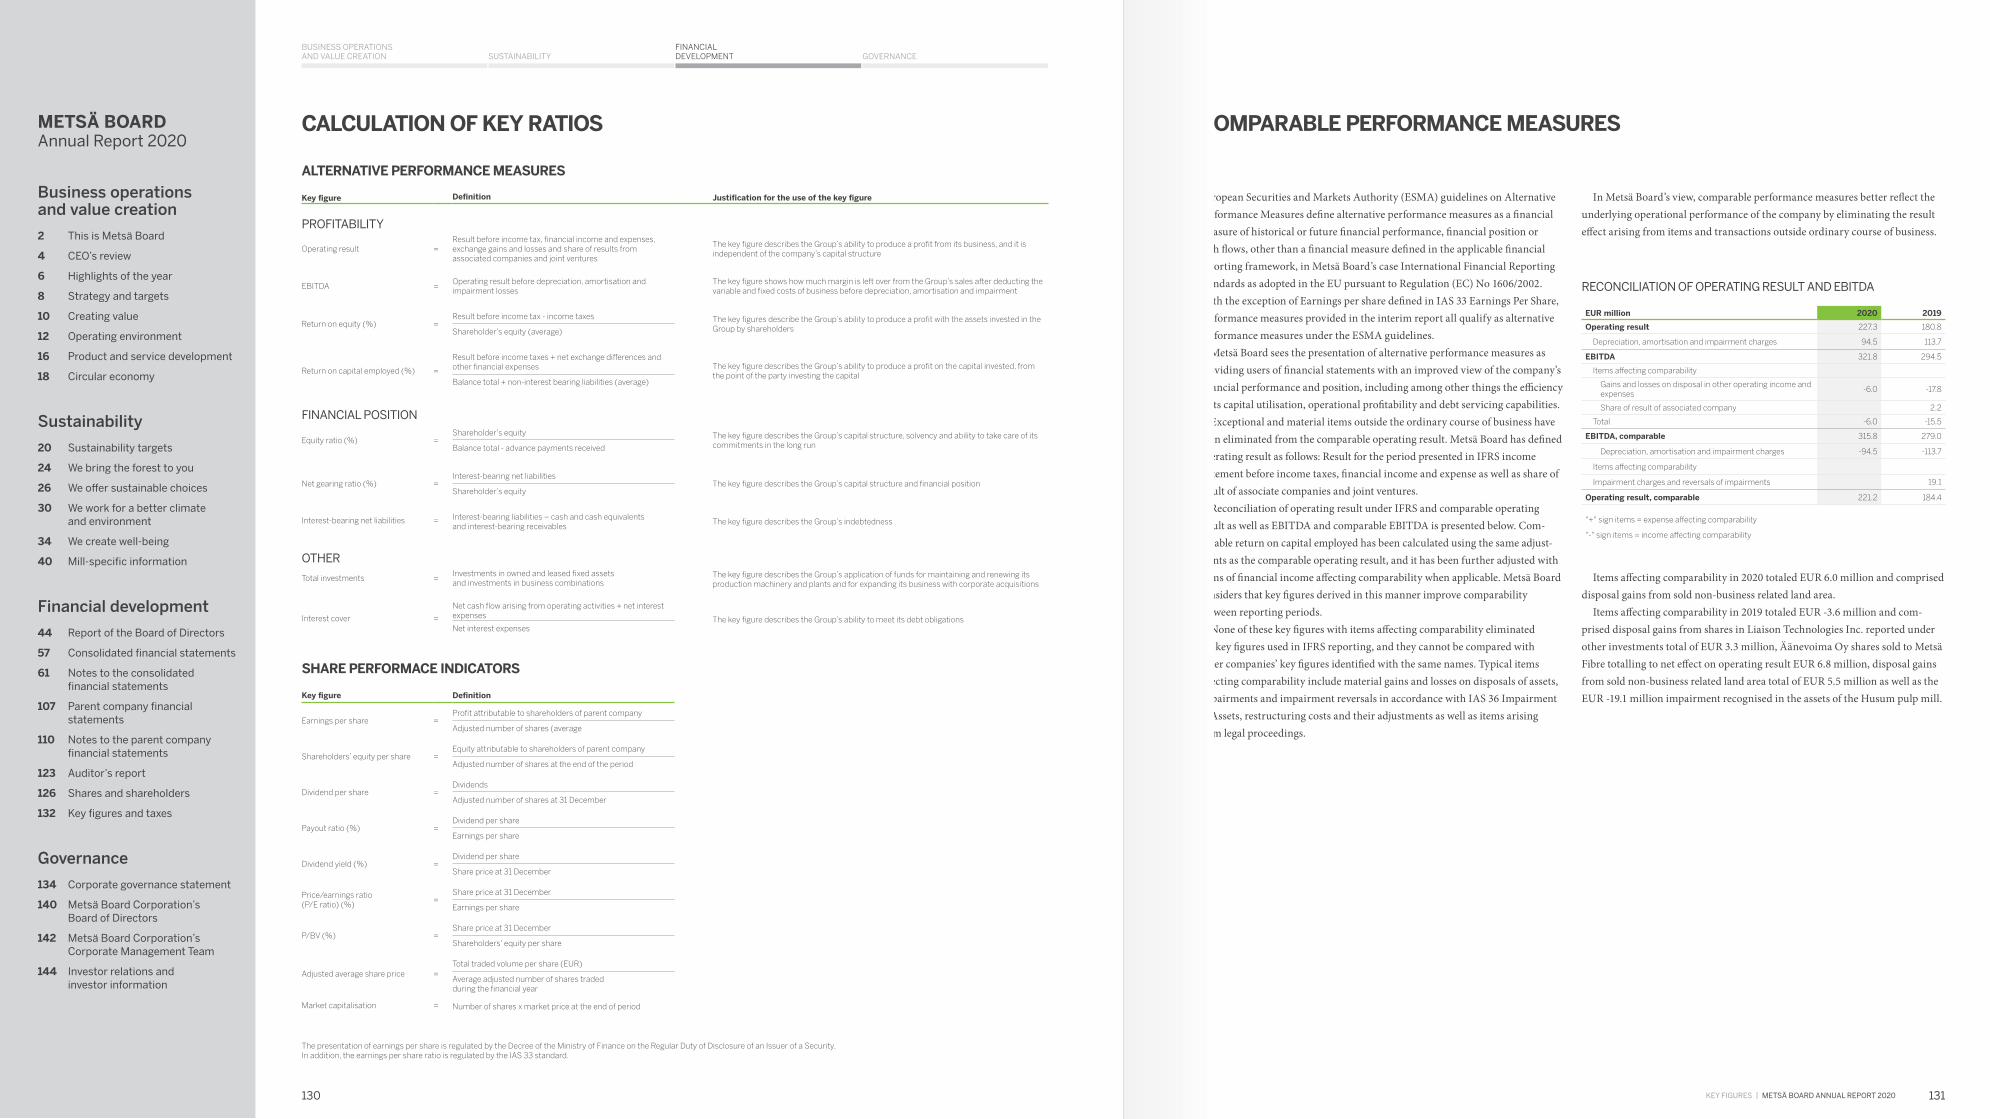
SUSTAINABILITYBUSINESS OPERATIONS AND VALUE CREATION GOVERNANCE
FINANCIAL DEVELOPMENT
KEy FIGURES | METSÄ BOARD ANNUAL REPORT 2020
CALCULATION OF KEY RATIOS
ALTERNATIVE PERFORMANCE MEASURES
Key figure Definition Justification for the use of the key figure
PROFITABILITy
Operating result =Result before income tax, financial income and expenses, exchange gains and losses and share of results from associated companies and joint ventures
The key figure describes the Group’s ability to produce a profit from its business, and it is independent of the company’s capital structure
EBITDA =Operating result before depreciation, amortisation and impairment losses
The key figure shows how much margin is left over from the Group’s sales after deducting the variable and fixed costs of business before depreciation, amortisation and impairment
Return on equity (%) =Result before income tax - income taxes The key figures describe the Group’s ability to produce a profit with the assets invested in the
Group by shareholdersShareholder’s equity (average)
Return on capital employed (%) =
Result before income taxes + net exchange differences and other financial expenses The key figure describes the Group’s ability to produce a profit on the capital invested, from
the point of the party investing the capitalBalance total + non-interest bearing liabilities (average)
FINANCIAL POSITION
Equity ratio (%) =Shareholder’s equity The key figure describes the Group’s capital structure, solvency and ability to take care of its
commitments in the long runBalance total - advance payments received
Net gearing ratio (%) =Interest-bearing net liabilities
The key figure describes the Group’s capital structure and financial positionShareholder’s equity
Interest-bearing net liabilities = Interest-bearing liabilities – cash and cash equivalents and interest-bearing receivables
The key figure describes the Group’s indebtedness
OTHER
Total investments =Investments in owned and leased fixed assets and investments in business combinations
The key figure describes the Group’s application of funds for maintaining and renewing its production machinery and plants and for expanding its business with corporate acquisitions
Interest cover =
Net cash flow arising from operating activities + net interest expenses The key figure describes the Group’s ability to meet its debt obligationsNet interest expenses
SHARE PERFORMACE INDICATORS
Key figure Definition
Earnings per share =Profit attributable to shareholders of parent company
Adjusted number of shares (average
Shareholders’ equity per share =Equity attributable to shareholders of parent company
Adjusted number of shares at the end of the period
Dividend per share =Dividends
Adjusted number of shares at 31 December
Payout ratio (%) =Dividend per share
Earnings per share
Dividend yield (%) =Dividend per share
Share price at 31 December
Price/earnings ratio (P/E ratio) (%)
=Share price at 31 December
Earnings per share
P/BV (%) =Share price at 31 December
Shareholders' equity per share
Adjusted average share price =Total traded volume per share (EUR)
Average adjusted number of shares traded during the financial year
Market capitalisation = Number of shares x market price at the end of period
The presentation of earnings per share is regulated by the Decree of the Ministry of Finance on the Regular Duty of Disclosure of an Issuer of a Security. In addition, the earnings per share ratio is regulated by the IAS 33 standard.
COMPARABLE PERFORMANCE MEASURES
European Securities and Markets Authority (ESMA) guidelines on Alternative Performance Measures define alternative performance measures as a financial measure of historical or future financial performance, financial position or cash flows, other than a financial measure defined in the applicable financial reporting framework, in Metsä Board’s case International Financial Reporting Standards as adopted in the EU pursuant to Regulation (EC) No 1606/2002. With the exception of Earnings per share defined in IAS 33 Earnings Per Share, performance measures provided in the interim report all qualify as alternative performance measures under the ESMA guidelines.
Metsä Board sees the presentation of alternative performance measures as providing users of financial statements with an improved view of the company’s financial performance and position, including among other things the efficiency of its capital utilisation, operational profitability and debt servicing capabilities.
Exceptional and material items outside the ordinary course of business have been eliminated from the comparable operating result. Metsä Board has defined operating result as follows: Result for the period presented in IFRS income statement before income taxes, financial income and expense as well as share of result of associate companies and joint ventures.
Reconciliation of operating result under IFRS and comparable operating result as well as EBITDA and comparable EBITDA is presented below. Com-parable return on capital employed has been calculated using the same adjust-ments as the comparable operating result, and it has been further adjusted with items of financial income affecting comparability when applicable. Metsä Board considers that key figures derived in this manner improve comparability between reporting periods.
None of these key figures with items affecting comparability eliminated are key figures used in IFRS reporting, and they cannot be compared with other companies’ key figures identified with the same names. Typical items affecting comparability include material gains and losses on disposals of assets, impairments and impairment reversals in accordance with IAS 36 Impairment of Assets, restructuring costs and their adjustments as well as items arising from legal proceedings.
In Metsä Board’s view, comparable performance measures better reflect the underlying operational performance of the company by eliminating the result effect arising from items and transactions outside ordinary course of business.
RECONCILIATION OF OPERATING RESULT AND EBITDA
EUR million 2020 2019
Operating result 227.3 180.8
Depreciation, amortisation and impairment charges 94.5 113.7
EBITDA 321.8 294.5
Items affecting comparability
Gains and losses on disposal in other operating income and expenses
-6.0 -17.8
Share of result of associated company 2.2
Total -6.0 -15.5
EBITDA, comparable 315.8 279.0
Depreciation, amortisation and impairment charges -94.5 -113.7
Items affecting comparability
Impairment charges and reversals of impairments 19.1
Operating result, comparable 221.2 184.4
"+" sign items = expense affecting comparability
"-" sign items = income affecting comparability
Items affecting comparability in 2020 totaled EUR 6.0 million and comprised disposal gains from sold non-business related land area.
Items affecting comparability in 2019 totaled EUR -3.6 million and com-prised disposal gains from shares in Liaison Technologies Inc. reported under other investments total of EUR 3.3 million, Äänevoima Oy shares sold to Metsä Fibre totalling to net effect on operating result EUR 6.8 million, disposal gains from sold non-business related land area total of EUR 5.5 million as well as the EUR -19.1 million impairment recognised in the assets of the Husum pulp mill.
Key figures
131130
METSÄ BOARD Annual Report 2020
Business operations and value creation
2 This is Metsä Board
4 CEO’s review
6 Highlights of the year
8 Strategy and targets
10 Creating value
12 Operating environment
16 Product and service development
18 Circular economy
Sustainability
20 Sustainability targets
24 We bring the forest to you
26 We offer sustainable choices
30 We work for a better climate and environment
34 We create well-being
40 Mill-specific information
Financial development
44 Report of the Board of Directors
57 Consolidated financial statements
61 Notes to the consolidated financial statements
107 Parent company financial statements
110 Notes to the parent company financial statements
123 Auditor’s report
126 Shares and shareholders
132 Key figures and taxes
Governance
134 Corporate governance statement
140 Metsä Board Corporation’s Board of Directors
142 Metsä Board Corporation’s Corporate Management Team
144 Investor relations and investor information
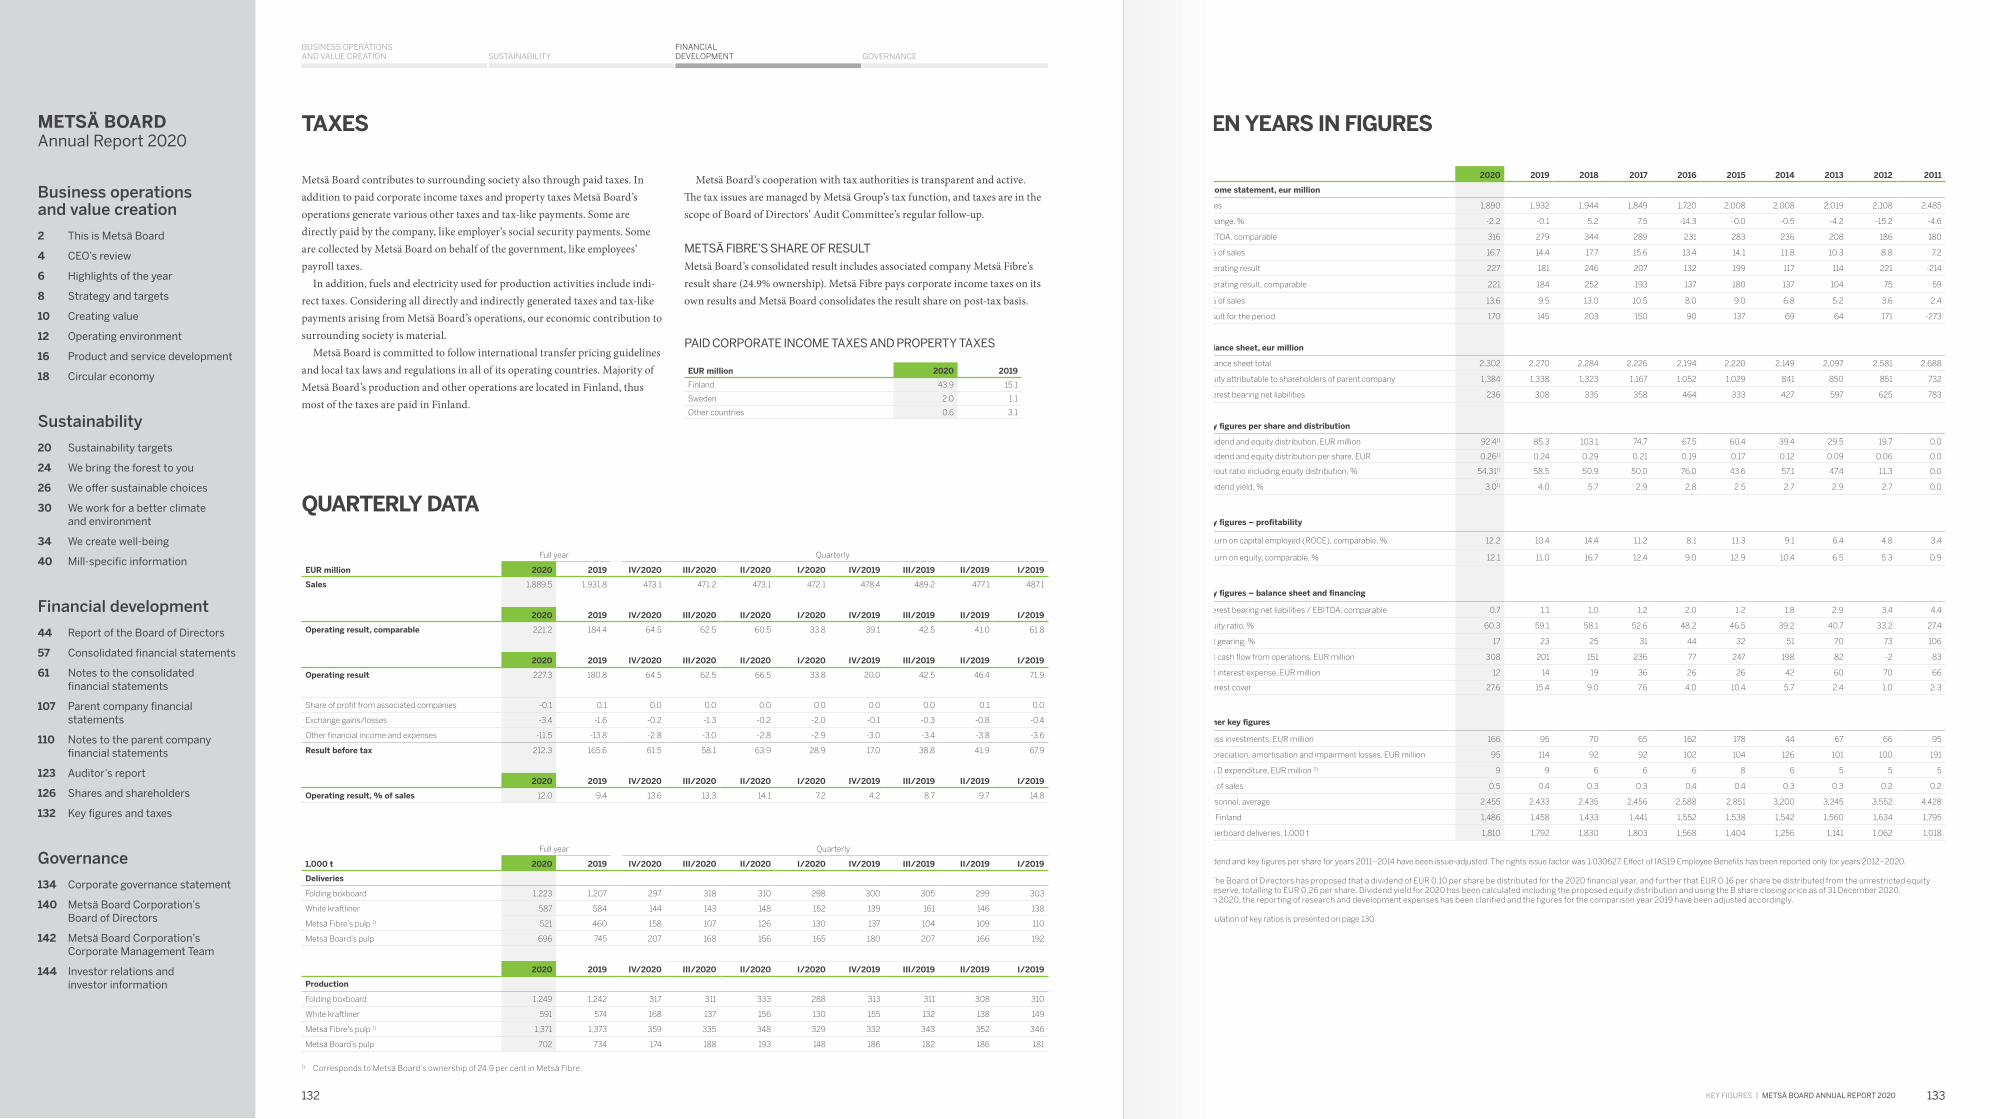
SUSTAINABILITYBUSINESS OPERATIONS AND VALUE CREATION GOVERNANCE
FINANCIAL DEVELOPMENT
KEy FIGURES | METSÄ BOARD ANNUAL REPORT 2020
QUARTERLY DATA
2020 2019 2018 2017 2016 2015 2014 2013 2012 2011
Income statement, eur million
Sales 1,890 1,932 1,944 1,849 1,720 2,008 2,008 2,019 2,108 2,485
- change, % -2.2 -0.1 5.2 7.5 -14.3 -0.0 -0.5 -4.2 -15.2 -4.6
EBITDA, comparable 316 279 344 289 231 283 236 208 186 180
- % of sales 16.7 14.4 17.7 15.6 13.4 14.1 11.8 10.3 8.8 7.2
Operating result 227 181 246 207 132 199 117 114 221 -214
Operating result, comparable 221 184 252 193 137 180 137 104 75 59
- % of sales 13.6 9.5 13.0 10.5 8.0 9.0 6.8 5.2 3.6 2.4
Result for the period 170 145 203 150 90 137 69 64 171 -273
Balance sheet, eur million
Balance sheet total 2,302 2,270 2,284 2,226 2,194 2,220 2,149 2,097 2,581 2,688
Equity attributable to shareholders of parent company 1,384 1,338 1,323 1,167 1,052 1,029 841 850 851 732
Interest bearing net liabilities 236 308 335 358 464 333 427 597 625 783
Key figures per share and distribution
Dividend and equity distribution, EUR million 92.41) 85.3 103.1 74.7 67.5 60.4 39.4 29.5 19.7 0.0
Dividend and equity distribution per share, EUR 0.261) 0.24 0.29 0.21 0.19 0.17 0.12 0.09 0.06 0.0
Payout ratio including equity distribution, % 54.311) 58.5 50.9 50.0 76.0 43.6 57.1 47.4 11.3 0.0
Dividend yield, % 3.01) 4.0 5.7 2.9 2.8 2.5 2.7 2.9 2.7 0.0
Key figures – profitability
Return on capital employed (ROCE), comparable, % 12.2 10.4 14.4 11.2 8.1 11.3 9.1 6.4 4.8 3.4
Return on equity, comparable, % 12.1 11.0 16.7 12.4 9.0 12.9 10.4 6.5 5.3 0.9
Key figures – balance sheet and financing
Interest bearing net liabilities / EBITDA, comparable 0.7 1.1 1.0 1.2 2.0 1.2 1.8 2.9 3.4 4.4
Equity ratio, % 60.3 59.1 58.1 52.6 48.2 46.5 39.2 40.7 33.2 27.4
Net gearing, % 17 23 25 31 44 32 51 70 73 106
Net cash flow from operations, EUR million 308 201 151 236 77 247 198 82 -2 83
Net interest expense, EUR million 12 14 19 36 26 26 42 60 70 66
Interest cover 27.6 15.4 9.0 7.6 4.0 10.4 5.7 2.4 1.0 2.3
Other key figures
Gross investments, EUR million 166 95 70 65 162 178 44 67 66 95
Depreciation, amortisation and impairment losses, EUR million 95 114 92 92 102 104 126 101 100 191
R & D expenditure, EUR million 2) 9 9 6 6 6 8 6 5 5 5
- % of sales 0.5 0.4 0.3 0.3 0.4 0.4 0.3 0.3 0.2 0.2
Personnel, average 2,455 2,433 2,435 2,456 2,588 2,851 3,200 3,245 3,552 4,428
- in Finland 1,486 1,458 1,433 1,441 1,552 1,538 1,542 1,560 1,634 1,795
Paperboard deliveries, 1,000 t 1,810 1,792 1,830 1,803 1,568 1,404 1,256 1,141 1,062 1,018
Dividend and key figures per share for years 2011–2014 have been issue-adjusted. The rights issue factor was 1.030627. Effect of IAS19 Employee Benefits has been reported only for years 2012–2020.
1) The Board of Directors has proposed that a dividend of EUR 0.10 per share be distributed for the 2020 financial year, and further that EUR 0.16 per share be distributed from the unrestricted equity reserve, totalling to EUR 0.26 per share. Dividend yield for 2020 has been calculated including the proposed equity distribution and using the B share closing price as of 31 December 2020.
2) In 2020, the reporting of research and development expenses has been clarified and the figures for the comparison year 2019 have been adjusted accordingly. Calculation of key ratios is presented on page 130.
TEN YEARS IN FIGURES
Full year Quarterly
EUR million 2020 2019 IV/2020 III/2020 II/2020 I/2020 IV/2019 III/2019 II/2019 I/2019
Sales 1,889.5 1,931.8 473.1 471.2 473.1 472.1 478.4 489.2 477.1 487.1
2020 2019 IV/2020 III/2020 II/2020 I/2020 IV/2019 III/2019 II/2019 I/2019
Operating result, comparable 221.2 184.4 64.5 62.5 60.5 33.8 39.1 42.5 41.0 61.8
2020 2019 IV/2020 III/2020 II/2020 I/2020 IV/2019 III/2019 II/2019 I/2019
Operating result 227.3 180.8 64.5 62.5 66.5 33.8 20.0 42.5 46.4 71.9
Share of profit from associated companies -0.1 0.1 0.0 0.0 0.0 0.0 0.0 0.0 0.1 0.0
Exchange gains/losses -3.4 -1.6 -0.2 -1.3 -0.2 -2.0 -0.1 -0.3 -0.8 -0.4
Other financial income and expenses -11.5 -13.8 -2.8 -3.0 -2.8 -2.9 -3.0 -3.4 -3.8 -3.6
Result before tax 212.3 165.6 61.5 58.1 63.9 28.9 17.0 38.8 41.9 67.9
2020 2019 IV/2020 III/2020 II/2020 I/2020 IV/2019 III/2019 II/2019 I/2019
Operating result, % of sales 12.0 9.4 13.6 13.3 14.1 7.2 4.2 8.7 9.7 14.8
Full year Quarterly
1,000 t 2020 2019 IV/2020 III/2020 II/2020 I/2020 IV/2019 III/2019 II/2019 I/2019
Deliveries
Folding boxboard 1,223 1,207 297 318 310 298 300 305 299 303
White kraftliner 587 584 144 143 148 152 139 161 146 138
Metsä Fibre’s pulp 1) 521 460 158 107 126 130 137 104 109 110
Metsä Board’s pulp 696 745 207 168 156 165 180 207 166 192
2020 2019 IV/2020 III/2020 II/2020 I/2020 IV/2019 III/2019 II/2019 I/2019
Production
Folding boxboard 1,249 1,242 317 311 333 288 313 311 308 310
White kraftliner 591 574 168 137 156 130 155 132 138 149
Metsä Fibre’s pulp 1) 1,371 1,373 359 335 348 329 332 343 352 346
Metsä Board’s pulp 702 734 174 188 193 148 186 182 186 181
1) Corresponds to Metsä Board’s ownership of 24.9 per cent in Metsä Fibre.
Metsä Board contributes to surrounding society also through paid taxes. In addition to paid corporate income taxes and property taxes Metsä Board’s operations generate various other taxes and tax-like payments. Some are directly paid by the company, like employer’s social security payments. Some are collected by Metsä Board on behalf of the government, like employees’ payroll taxes.
In addition, fuels and electricity used for production activities include indi-rect taxes. Considering all directly and indirectly generated taxes and tax-like payments arising from Metsä Board’s operations, our economic contribution to surrounding society is material.
Metsä Board is committed to follow international transfer pricing guidelines and local tax laws and regulations in all of its operating countries. Majority of Metsä Board’s production and other operations are located in Finland, thus most of the taxes are paid in Finland.
TAXES
Metsä Board’s cooperation with tax authorities is transparent and active. The tax issues are managed by Metsä Group’s tax function, and taxes are in the scope of Board of Directors’ Audit Committee’s regular follow-up.
METSÄ FIBRE’S SHARE OF RESULTMetsä Board’s consolidated result includes associated company Metsä Fibre’s result share (24.9% ownership). Metsä Fibre pays corporate income taxes on its own results and Metsä Board consolidates the result share on post-tax basis.
PAID CORPORATE INCOME TAXES AND PROPERTy TAXES
EUR million 2020 2019
Finland 43.9 15.1
Sweden 2.0 1.1
Other countries 0.6 3.1
133132
METSÄ BOARD Annual Report 2020
Business operations and value creation
2 This is Metsä Board
4 CEO’s review
6 Highlights of the year
8 Strategy and targets
10 Creating value
12 Operating environment
16 Product and service development
18 Circular economy
Sustainability
20 Sustainability targets
24 We bring the forest to you
26 We offer sustainable choices
30 We work for a better climate and environment
34 We create well-being
40 Mill-specific information
Financial development
44 Report of the Board of Directors
57 Consolidated financial statements
61 Notes to the consolidated financial statements
107 Parent company financial statements
110 Notes to the parent company financial statements
123 Auditor’s report
126 Shares and shareholders
132 Key figures and taxes
Governance
134 Corporate governance statement
140 Metsä Board Corporation’s Board of Directors
142 Metsä Board Corporation’s Corporate Management Team
144 Investor relations and investor information
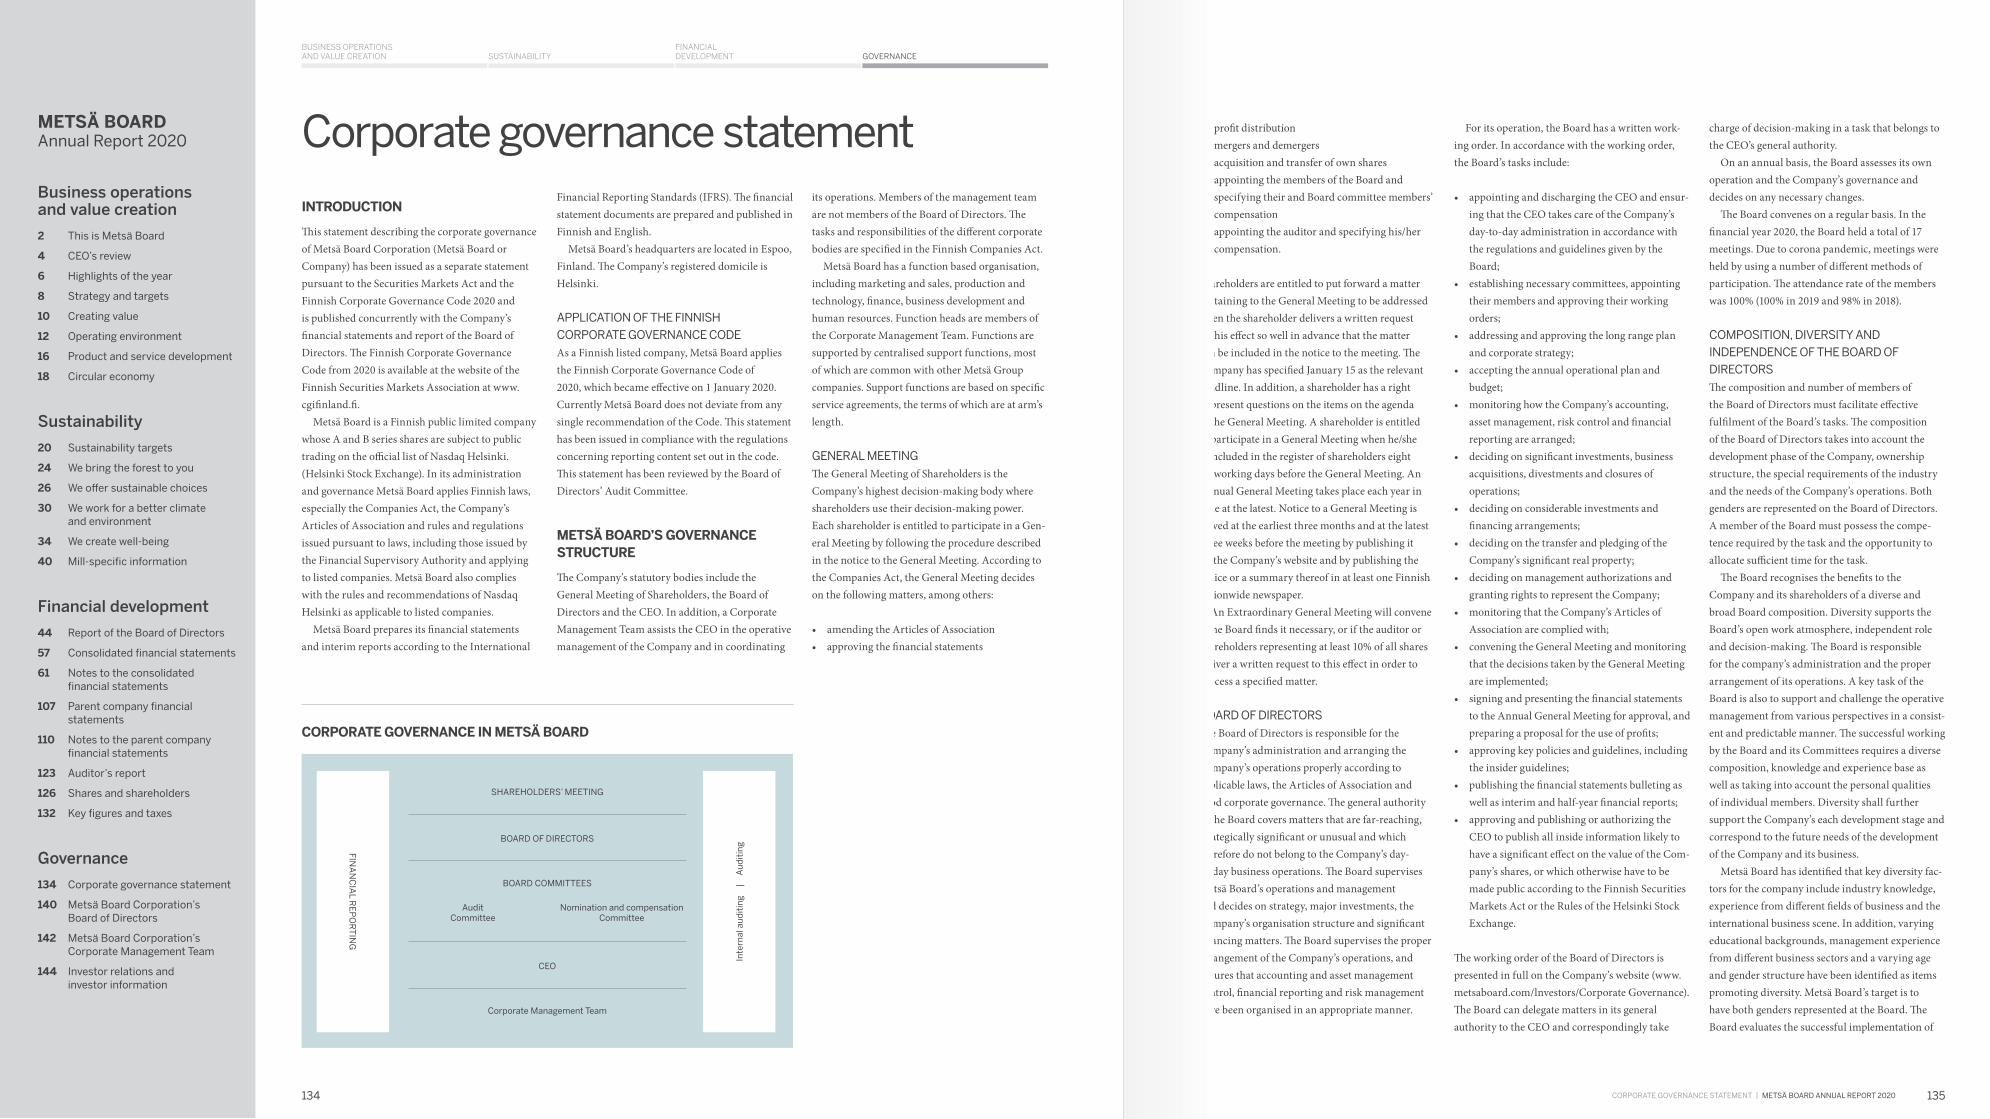
SUSTAINABILITYBUSINESS OPERATIONS AND VALUE CREATION
FINANCIAL DEVELOPMENT GOVERNANCE
CORPORATE GOvERNANCE STATEMENT | METSÄ BOARD ANNUAL REPORT 2020
Corporate governance statement
INTRODUCTION
This statement describing the corporate governance of Metsä Board Corporation (Metsä Board or Company) has been issued as a separate statement pursuant to the Securities Markets Act and the Finnish Corporate Governance Code 2020 and is published concurrently with the Company’s financial statements and report of the Board of Directors. The Finnish Corporate Governance Code from 2020 is available at the website of the Finnish Securities Markets Association at www.cgifinland.fi.
Metsä Board is a Finnish public limited company whose A and B series shares are subject to public trading on the official list of Nasdaq Helsinki. (Helsinki Stock Exchange). In its administration and governance Metsä Board applies Finnish laws, especially the Companies Act, the Company’s Articles of Association and rules and regulations issued pursuant to laws, including those issued by the Financial Supervisory Authority and applying to listed companies. Metsä Board also complies with the rules and recommendations of Nasdaq Helsinki as applicable to listed companies.
Metsä Board prepares its financial statements and interim reports according to the International
Financial Reporting Standards (IFRS). The financial statement documents are prepared and published in Finnish and English.
Metsä Board’s headquarters are located in Espoo, Finland. The Company’s registered domicile is Helsinki.
APPLICATION OF THE FINNISH CORPORATE GOvERNANCE CODEAs a Finnish listed company, Metsä Board applies the Finnish Corporate Governance Code of 2020, which became effective on 1 January 2020. Currently Metsä Board does not deviate from any single recommendation of the Code. This statement has been issued in compliance with the regulations concerning reporting content set out in the code. This statement has been reviewed by the Board of Directors’ Audit Committee.
METSÄ BOARD’S GOVERNANCE STRUCTURE
The Company’s statutory bodies include the General Meeting of Shareholders, the Board of Directors and the CEO. In addition, a Corporate Management Team assists the CEO in the operative management of the Company and in coordinating
its operations. Members of the management team are not members of the Board of Directors. The tasks and responsibilities of the different corporate bodies are specified in the Finnish Companies Act.
Metsä Board has a function based organisation, including marketing and sales, production and technology, finance, business development and human resources. Function heads are members of the Corporate Management Team. Functions are supported by centralised support functions, most of which are common with other Metsä Group companies. Support functions are based on specific service agreements, the terms of which are at arm’s length.
GENERAL MEETINGThe General Meeting of Shareholders is the Company’s highest decision-making body where shareholders use their decision-making power. Each shareholder is entitled to participate in a Gen-eral Meeting by following the procedure described in the notice to the General Meeting. According to the Companies Act, the General Meeting decides on the following matters, among others:
• amending the Articles of Association• approving the financial statements
CORPORATE GOVERNANCE IN METSÄ BOARD
• profit distribution• mergers and demergers• acquisition and transfer of own shares• appointing the members of the Board and
specifying their and Board committee members’ compensation
• appointing the auditor and specifying his/her compensation.
Shareholders are entitled to put forward a matter pertaining to the General Meeting to be addressed when the shareholder delivers a written request to this effect so well in advance that the matter can be included in the notice to the meeting. The Company has specified January 15 as the relevant deadline. In addition, a shareholder has a right to present questions on the items on the agenda of the General Meeting. A shareholder is entitled to participate in a General Meeting when he/she is included in the register of shareholders eight (8) working days before the General Meeting. An Annual General Meeting takes place each year in June at the latest. Notice to a General Meeting is served at the earliest three months and at the latest three weeks before the meeting by publishing it on the Company’s website and by publishing the notice or a summary thereof in at least one Finnish nationwide newspaper.
An Extraordinary General Meeting will convene if the Board finds it necessary, or if the auditor or shareholders representing at least 10% of all shares deliver a written request to this effect in order to process a specified matter.
BOARD OF DIRECTORSThe Board of Directors is responsible for the Company’s administration and arranging the Company’s operations properly according to applicable laws, the Articles of Association and good corporate governance. The general authority of the Board covers matters that are far-reaching, strategically significant or unusual and which therefore do not belong to the Company’s day-to-day business operations. The Board supervises Metsä Board’s operations and management and decides on strategy, major investments, the Company’s organisation structure and significant financing matters. The Board supervises the proper arrangement of the Company’s operations, and ensures that accounting and asset management control, financial reporting and risk management have been organised in an appropriate manner.
For its operation, the Board has a written work-ing order. In accordance with the working order, the Board’s tasks include:
• appointing and discharging the CEO and ensur-ing that the CEO takes care of the Company’s day-to-day administration in accordance with the regulations and guidelines given by the Board;
• establishing necessary committees, appointing their members and approving their working orders;
• addressing and approving the long range plan and corporate strategy;
• accepting the annual operational plan and budget;
• monitoring how the Company’s accounting, asset management, risk control and financial reporting are arranged;
• deciding on significant investments, business acquisitions, divestments and closures of operations;
• deciding on considerable investments and financing arrangements;
• deciding on the transfer and pledging of the Company’s significant real property;
• deciding on management authorizations and granting rights to represent the Company;
• monitoring that the Company’s Articles of Association are complied with;
• convening the General Meeting and monitoring that the decisions taken by the General Meeting are implemented;
• signing and presenting the financial statements to the Annual General Meeting for approval, and preparing a proposal for the use of profits;
• approving key policies and guidelines, including the insider guidelines;
• publishing the financial statements bulleting as well as interim and half-year financial reports;
• approving and publishing or authorizing the CEO to publish all inside information likely to have a significant effect on the value of the Com-pany’s shares, or which otherwise have to be made public according to the Finnish Securities Markets Act or the Rules of the Helsinki Stock Exchange.
The working order of the Board of Directors is presented in full on the Company’s website (www.metsaboard.com/lnvestors/Corporate Governance). The Board can delegate matters in its general authority to the CEO and correspondingly take
charge of decision-making in a task that belongs to the CEO’s general authority.
On an annual basis, the Board assesses its own operation and the Company’s governance and decides on any necessary changes.
The Board convenes on a regular basis. In the financial year 2020, the Board held a total of 17 meetings. Due to corona pandemic, meetings were held by using a number of different methods of participation. The attendance rate of the members was 100% (100% in 2019 and 98% in 2018).
COMPOSITION, DIvERSITy AND INDEPENDENCE OF THE BOARD OF DIRECTORSThe composition and number of members of the Board of Directors must facilitate effective fulfilment of the Board’s tasks. The composition of the Board of Directors takes into account the development phase of the Company, ownership structure, the special requirements of the industry and the needs of the Company’s operations. Both genders are represented on the Board of Directors. A member of the Board must possess the compe-tence required by the task and the opportunity to allocate sufficient time for the task.
The Board recognises the benefits to the Company and its shareholders of a diverse and broad Board composition. Diversity supports the Board’s open work atmosphere, independent role and decision-making. The Board is responsible for the company’s administration and the proper arrangement of its operations. A key task of the Board is also to support and challenge the operative management from various perspectives in a consist-ent and predictable manner. The successful working by the Board and its Committees requires a diverse composition, knowledge and experience base as well as taking into account the personal qualities of individual members. Diversity shall further support the Company’s each development stage and correspond to the future needs of the development of the Company and its business.
Metsä Board has identified that key diversity fac-tors for the company include industry knowledge, experience from different fields of business and the international business scene. In addition, varying educational backgrounds, management experience from different business sectors and a varying age and gender structure have been identified as items promoting diversity. Metsä Board’s target is to have both genders represented at the Board. The Board evaluates the successful implementation of
FINA
NC
IAL R
EP
OR
TIN
G
Inte
rnal
au
dit
ing
| A
ud
itin
g
SHAREHOLDERS’ MEETING
BOARD OF DIRECTORS
BOARD COMMITTEES
AuditCommittee
Nomination and compensationCommittee
CEO
Corporate Management Team
Corporate governance statement
135134
METSÄ BOARD Annual Report 2020
Business operations and value creation
2 This is Metsä Board
4 CEO’s review
6 Highlights of the year
8 Strategy and targets
10 Creating value
12 Operating environment
16 Product and service development
18 Circular economy
Sustainability
20 Sustainability targets
24 We bring the forest to you
26 We offer sustainable choices
30 We work for a better climate and environment
34 We create well-being
40 Mill-specific information
Financial development
44 Report of the Board of Directors
57 Consolidated financial statements
61 Notes to the consolidated financial statements
107 Parent company financial statements
110 Notes to the parent company financial statements
123 Auditor’s report
126 Shares and shareholders
132 Key figures and taxes
Governance
134 Corporate governance statement
140 Metsä Board Corporation’s Board of Directors
142 Metsä Board Corporation’s Corporate Management Team
144 Investor relations and investor information

SUSTAINABILITYBUSINESS OPERATIONS AND VALUE CREATION
FINANCIAL DEVELOPMENT GOVERNANCE
CORPORATE GOvERNANCE STATEMENT | METSÄ BOARD ANNUAL REPORT 2020
these targets as part of its and its Nomination and Compensation Committee’s normal operation.
According to the Articles of Association, a minimum of five and a maximum of ten ordinary members shall be appointed to the Board of Directors by the shareholders at the Annual General Meeting for a one-year period at a time. The number of consecutive terms is not limited. At present, the Board has nine members.
The Board appoints a Chairman and a Vice Chairman from among its members. The Annual General Meeting of 2020 appointed the following persons as members of the Board of Directors:
• Mr Hannu Anttila, born 1955, independent of the Company and of its significant shareholders, M.Sc. (Econ.), member since 2018, 140,619 B shares
• Mr Ilkka Hämälä, born 1961, Chairman, M.Sc. (Eng.), member since 2018, 337,648 B-shares
• Ms Kirsi Komi, born 1963, independent of the Company and of its significant shareholders, L.L.M., member since 2010, 78,287 B shares
• Mr Kai Korhonen, born 1951, independent of the Company and of its significant shareholders, M.Sc. (Eng.), member since 2008, 215,057 B shares
• Ms Liisa Leino, born 1960, independent of the Company and of its significant shareholders, M.Sc. (Nutrition), member since 2009, 182,932 B shares
• Mr Jussi Linnaranta, born 1972, independent of the Company, M.Sc. (Agr.), member since 2017, 20,939 B shares
• Mr Jukka Moisio, born 1961, independent of the Company and of its significant shareholders, M.Sc. (Econ.), MBA, member since 2020, 5,275 B shares
• Mr Timo Saukkonen, born 1963, independent of the Company, M.Sc. (For.), member since 2020, 9,875 B shares
• Mr Veli Sundbäck, born 1946, independent of the Company and of its significant shareholders, L.L.M., member since 2013, 67,952 B shares
These ownerships include shares possibly owned by controlled entities as at 31 December 2020.
A majority of the members of the Board of Direc-tors are independent of both the Company and its significant shareholders. As President and CEO of Metsä Group Chairman Hämälä is dependent on both the Company and its majority shareholder Metsäliitto Cooperative. Jussi Linnaranta and Timo Saukkonen are members of the Board of Metsäliitto
Cooperative and consequently dependent on a significant shareholder. Kirsi Komi, Liisa Leino and Kai Korhonen have each served on the Board for more than 10 consecutive years but are considered as independent of the Company and its significant shareholders, based on the Board’s general evaluation.
The Board’s Nomination and Compensation committee proposes to the Annual General Meet-ing convened for March 25, 2021 that current Board members Anttila, Hämälä, Komi, Linnaranta, Moisio, Saukkonen and Sundbäck be re-elected for a new term and further that Raija-Leena Hankonen and Erja Hyrsky be elected as new members. Fur-ther information on existing and proposed Board members is available on the Company’s website at (www.metsaboard.com/Investors/Corporate Governance).
BOARD COMMITTEESBoard committees provide assistance to the Board of Directors, preparing matters for which the Board is responsible. The Board of Directors appoints an Audit Committee and a Nomination and Compen-sation Committee from among its members. Every year after the Annual General Meeting, the Board of Directors appoints each committee’s chairman and members. The Board of Directors and its committees can also seek assistance from external advisors.
Final decisions concerning matters related to the tasks of the committees are made by the Board of Directors on the basis of committee proposals, excluding proposals on Board composition and compensation made directly to the General Meeting by the Nomination and Compensation Committee.
AUDIT COMMITTEEThe Audit Committee is responsible for assisting the Board of Directors in ensuring that the com-pany’s financial reporting, calculation methods, annual financial statements and other financial information made public by the Company are cor-rect, balanced, transparent and clear. On a regular basis, the Audit Committee reviews the internal control and management systems and monitors the progress of financial risk reporting and the auditing of the accounts. The Audit Committee assesses the efficiency and scope of internal auditing, the company’s risk management, key risk areas and compliance with applicable laws and regulations. The Committee assesses the independence of the Auditor and gives a recommendation to the Board
concerning the appointment of auditors to the Company. The Audit Committee also processes the annual plan for internal auditing and the reports prepared on significant auditing.
The Audit Committee consists of four Board members. Since the Annual General Meeting of 2020, Kai Korhonen has been chairman of the Audit Committee with Hannu Anttila, Kirsi Komi and Jukka Moisio as members. All members are independent of the Company and its significant shareholders.
The committee members must have adequate expertise in accounting and financial statement policies. The Audit Committee convenes on a regular basis, at least four times a year, including meeting with the Company’s auditor. The commit-tee chairman provides the Board with a report on each meeting of the Audit Committee. The tasks and responsibility areas have been specified in the committee’s working order which the Board has approved (www.metsaboard.com/Investors/Corporate Governance).
When necessary, the following persons are also represented in the Audit Committee meetings as summoned by the Committee: the auditor, Chief Executive Officer and Chief Financial Officer as well as other management representatives and external advisors.
The Audit Committee convened five times dur-ing 2020 and the attendance rate of the members was 95% (100% in 2019 and 94% in 2018).
NOMINATION AND COMPENSATION COMMITTEE The task of the Nomination and Compensation Committee is to assist the Board of Directors in matters related to the appointment and compensa-tion of the company’s CEO, a possible Deputy CEO and the senior management and prepare matters related to the reward schemes for management and employees. In addition, the Committee prepares for the Annual General Meeting a proposal on the number of Board members, Board composition and Board member compensation. The Committee also recommends, prepares and proposes to the Board the CEO’s (and a Deputy CEO’s) nomination, salary and compensation, and further evaluates and provides the Board and the CEO with recom-mendations concerning management rewards and compensation systems.
The Committee consists of five Board members. It convenes on a regular basis at least four times a year. The Committee chairman presents the proposals issued by the Committee to the Board.
The tasks and responsibilities of the Nomination and Compensation committee have been specified in the committee’s working order, which the Board approves (www.metsaboard.com/Investor Relations/Corporate Governance).
Since the Annual General Meeting of 2020, Ilkka Hämälä has been chairman of the Nomination and Compensation Committee with Liisa Leino, Jussi Linnaranta, Timo Saukkonen and Veli Sundbäck as members.
The Nomination and Compensation Committee convened four times during 2020 and all members participated in all meetings (the attendance rate was 100% also in 2019 and 2018).
CHIEF EXECUTIvE OFFICERChief Executive Officer Mika Joukio, M.Sc.(Eng.), born 1964, is responsible for the daily management of the Company’s administration according to the guidelines and instructions given by the Board. In addition, the CEO is responsible for ensuring that the Company’s accounting has been carried out according to applicable laws and that asset man-agement has been organised in a reliable manner. The CEO manages the Company’s daily business and is responsible for controlling and steering the functions.
The CEO has a written CEO contract approved by the Board. The Board monitors the CEO’s per-formance and provides a performance evaluation once a year. The CEO is covered by the Finnish Employees’ Pension Act, which provides for a pension compensation based on service years and earnings. Basic salary, rewards and fringe benefits are included in the calculation, but not stock option or share plan based income. The Company has commissioned an extra pension insurance policy for the CEO, entitling the CEO to retire at the age of 62. The policy entitles the CEO to receive pension compensation equal to 60% of his salary at the time of retirement (calculated in accordance with Finn-ish pension laws) on the basis of a five-year-period preceding the moment of retirement.
The Board appoints and discharges the CEO. The Board can discharge the CEO without a specific reason. The CEO can also resign from his assign-ment. The mutual term of notice is six months. The Board may, however, decide to discharge the CEO without a period of notice. When the service contract of the CEO is terminated by the Board, the CEO is entitled to receive discharge compensation equal to his 12-month salary.
DEPUTy TO THE CEOThe Board can at its discretion appoint a Deputy to the CEO. The Deputy to the CEO is responsible for carrying out the CEO’s tasks when the CEO is unable to perform his duties. For the time being no Deputy to the CEO has been appointed.
CORPORATE MANAGEMENT TEAMIn the operative management of Metsä Board, the CEO is assisted by the Corporate Management Team, which consists of Mika Joukio, CEO, together with function heads Ari Kiviranta (Business Development), Jussi Noponen (Finance and Control), Sari Pajari-Sederholm (Sales and Marketing), Harri Pihlajaniemi (Production and Technology) and Camilla Wikström (Human Resources), who all report to the CEO.
Each Corporate Management Team member has a written employment or service contract, With the exception of the CEO, members of the Corporate Management Team have no extraordinary pension arrangements which would deviate from applicable pension legislation. The term of notice of Corporate Management team members is six months.
The Corporate Management Team’s tasks and responsibilities include planning investments, specifying and preparing the Company’s strategic guidelines, allocating resources, controlling routine functions as well as preparing several matters to be reviewed by the Board.
The Corporate Management Team convenes at the Chairman’s invitation once a month, as a rule, and also otherwise when necessary.
The Corporate Management Team members owned the Company’s shares at the end of the financial year 2020 as follows:
Mika Joukio 354,025 B sharesAri Kiviranta 36,000 B sharesJussi Noponen 55,000 B sharesSari Pajari-Sederholm 48,000 B sharesHarri Pihlajaniemi 17,523 B sharesCamilla Wikström 35,184 B shares
Possible controlled entities of management team members do not hold shares in the Company.
INTERNAL CONTROL, INTERNAL AUDITING AND RISK MANAGEMENT
Profitable business requires that operations are monitored continuously and with adequate efficiency. Metsä Board’s internal management and control procedure is based on the Finnish
Companies Act, regulations and recommendations for listed companies, the Articles of Association and the company’s own approved principles and policies. The functionality of the company’s inter-nal control is evaluated by the company’s internal auditing. Internal control is carried out throughout the organisation. Internal control methods include internal guidelines and reporting systems. The following describes the principles, objectives and responsibilities of Metsä Board’s internal control, risk management and internal auditing.
INTERNAL CONTROLBeing a listed company, Metsä Board’s internal control is steered by the Finnish Companies Act and the Securities Market Act, other laws and regulations applicable to the operations and the rules and recommendations of the Nasdaq Hel-sinki, including the Corporate Governance Code. External control is carried out by Metsä Board’s auditor and the authorities.
In Metsä Board, internal control covers financial reporting and other monitoring. Internal control is implemented by the Board and operative management as well as the entire personnel. Internal control aims to ensure achieving the goals and objectives set for the company; economical, appropriate and efficient use of resources; correct and reliable financial information and other man-agement information; adherence to external regu-lations and internal policies; security of operations, information and property in an adequate manner; and the arrangement of adequate and suitable manual and IT systems to support operations.
Internal control is divided into (i) proactive control, such as the specification of corporate values, general operational and business principles; (ii) daily control, such as operational systems and work instructions related to operational steering and monitoring; and (iii) subsequent control, such as management evaluations and inspections, comparisons and verifications with the aim of ensuring that the goals are met and that the agreed operational and control principles are followed. The corporate culture, governance and the approach to control together create the basis for the entire process of internal control.
MONITORING OF THE FINANCIAL REPORTING PROCESS, CREDIT CONTROL AND AUTHORISATION RIGHTSThe financial organisations of the functions and the central administration are responsible for financial reporting. The units and functions report the
137136
METSÄ BOARD Annual Report 2020
Business operations and value creation
2 This is Metsä Board
4 CEO’s review
6 Highlights of the year
8 Strategy and targets
10 Creating value
12 Operating environment
16 Product and service development
18 Circular economy
Sustainability
20 Sustainability targets
24 We bring the forest to you
26 We offer sustainable choices
30 We work for a better climate and environment
34 We create well-being
40 Mill-specific information
Financial development
44 Report of the Board of Directors
57 Consolidated financial statements
61 Notes to the consolidated financial statements
107 Parent company financial statements
110 Notes to the parent company financial statements
123 Auditor’s report
126 Shares and shareholders
132 Key figures and taxes
Governance
134 Corporate governance statement
140 Metsä Board Corporation’s Board of Directors
142 Metsä Board Corporation’s Corporate Management Team
144 Investor relations and investor information

SUSTAINABILITYBUSINESS OPERATIONS AND VALUE CREATION
FINANCIAL DEVELOPMENT GOVERNANCE
CORPORATE GOvERNANCE STATEMENT | METSÄ BOARD ANNUAL REPORT 2020
financial figures each month. The functions’ control functions check their units’ monthly performance and report them further to central administration. Functions’ profitability development and business risks and opportunities are discussed in monthly meetings attended by senior management of the Company and of the function in question. The result will be reported to the Board and the Corporate Management Team each month. The Board presents the Financial Statements to the Annual General Meeting for approval, approves the financial statement bulletin and quarterly reports and decides on their publication. The Company’s internal guidelines provide detailed descriptions on the reporting and control rules and the reporting procedure.
Credit control in Metsä Board has been central-ised under a Credit Committee, which convenes at least each quarter. The development of trade receiv-ables is monitored in each sales company by credit controllers under the supervision of the Group Director, Credit Management. Counterparty-spe-cific credit limits are set within the boundaries of the credit policy confirmed by the Board in coop-eration with centralised credit control and business area management. The development of credit risks is reported to the Board on a regular basis.
Authorisation rights concerning expenses, significant contracts and investments have been specified continuously for different organisation levels according to the decision-making authority policy confirmed by the Board and the authority separately granted by the CEO and other management personnel. Investment follow-up is carried out by the Group’s financial administration according to the investment policy confirmed by the Board. After pre-approval, investments are taken to the management teams of the functions and the Corporate Management Team within the framework of the annual investment plan. Most significant investments are separately submitted for Board approval. Investment follow-up reports are compiled each quarter.
INTERNAL AUDITINGInternal auditing assists the Board and CEO with their control tasks by evaluating the quality of internal control maintained in order to achieve the Company’s objectives. In addition, internal auditing supports the organisation by evaluating and ensuring the functionality of business processes, risk management and the management and administration systems.
The key task of internal auditing is to assess the efficiency and suitability of internal control concerning the company’s functions and units. In its assignment, internal auditing evaluates how well the operational principles, guidelines and reporting systems are adhered to, how property is protected and how efficiently resources are used. Internal auditing also acts as an expert in development projects related to its task area and prepares special reports at the request of the Audit Committee or operative management.
Internal auditing operates under the supervision of the Audit Committee and the CEO. Audit observations, recommendations and the progress of measures are reported to the management of the target audited, the company management and the auditor. Every six months, internal auditing reports its auditing measures, plans and operations to the Audit Committee. Internal auditing applies in its tasks a working order approved by the Board of Directors.
The action plan of internal auditing is prepared for one calendar year at a time. The aim is to allocate the auditing to all functions and units at certain intervals. Auditing is annually allocated to areas that are in a key position regarding the evaluated risk and the company’s objectives at the time. The topicality and appropriateness of the action plan are processed with the Company’s management every six months.
The scope and coordination of the auditing operations are ensured through regular commu-nication and information exchange with other internal assurance functions and the auditor. When necessary, internal auditing uses external service providers for temporary additional resourcing or special expertise for carrying out demanding evaluation tasks.
RISK MANAGEMENTRisk management is an essential part of Metsä Board’s standard business planning and leadership. Risk management belongs to daily decision-making, operations follow-up and internal control, and it promotes and ensures that the objectives set by the Company are met.
Linking business management efficiently with risk management is based on the operational principles confirmed by the Board; the aim of the principles is to maintain risk management as a process that is well defined, understandable and sufficiently practical. Risks and their development are reported on a regular basis to the Board’s Audit Committee. Centralised risk management also
takes care of the coordination and competitive bidding of Metsä Board’s insurance coverage.
The most crucial objective of risk management is to identify and evaluate those risks, threats and opportunities which may have an impact on the implementation of the strategy and on how short-term and long-term objectives are met. The businesses regularly evaluate and monitor the risk environment and related changes as part of their normal operational planning. The risks identified and their control is reported to the Audit Committee and the Board at least twice a year. Business risks also involve opportunities, and they can be utilised within the boundaries of the agreed risk limits. Conscious risk-taking decisions must always be based on an adequate evaluation of the risk-bearing capacity and the profit/loss potential, among other things, which shall be conducted before any pre-engineering and execution phases of projects and investments.
Risk management responsibilities in Metsä Board are divided among different functions. The Board is responsible for the Company’s risk management and approves the Company’s risk management policy; the Audit Committee evaluates the levels and procedures of the Company’s risk management and the essential risk areas and provides the Board with related proposals. The CEO and the Manage-ment Team are responsible for the specification and adoption of the risk management principles. They are also responsible for ensuring that the risks are taken into account in the company’s planning processes and that risk reporting is adequate and appropriate. The Vice President of Risk Manage-ment reports to the CFO and is responsible for the Company’s risk management process development, coordination, the implementation of risk evaluation and the essential insurance decisions. The Risk Committee conducts twice each year a risk review, the results of which the CEO presents to the Board following a review by the Corporate Management Team. The Risk Committee consists of the CFO act-ing as Chair, SVP Production, SVP Development, VP Risk Management and VP Group Accounting. Businesses and support functions identify and evaluate the essential risks related to their own areas of responsibility in their planning processes, prepare for them, take necessary preventive action and report on the risks as agreed.
Metsä Board’s essential risk management elements include implementing a comprehensive corporate risk management process that supports the entire business, protecting property and ensuring business continuity, corporate security
and its continuous development, as well as crisis management and continuity and recovery plans. According to the risk management policy and prin-ciples, adequate risk management forms a necessary part of the preliminary review and implementation stages of projects which are financially or otherwise significant.
The tasks of Metsä Board’s risk management are to• ensure that all identified risks with an impact
on personnel, customers, products, property, information assets, corporate image, corporate responsibility and operational capacity are controlled according to applicable laws and on the basis of best available information and financial aspects
• ensure that the company’s objectives are met • fulfil the expectations of stakeholders• protect property and ensure disruption-free
business continuity• optimise the profit/loss possibility ratio• ensure the management of the company’s overall
risk exposure and minimise the overall risks.
The most significant risks and uncertainties that the company is aware of are described in the Report of the Board of Directors.
AUDITINGAccording to Metsä Board’s Articles of Association, the company has one auditor who shall be an auditing firm authorised by the Central Chamber of Commerce of Finland. The General Meeting appoints the auditor each year. The Audit Com-mittee together with the Audit Committee of the parent entity Metsäliitto Cooperative arranged in 2011 a tender for the auditing services. As a result of the tendering, the Company’s long-term auditor PricewaterhouseCoopers Oy was at the 2012 Annual General Meeting changed to KPMG Oy Ab. Pursuant to the decision of the Annual General Meeting of 2020, KPMG Oy Ab acts as the Company’s auditor and appointed Kirsi Jantunen, APA, as the new auditor with main responsibility. Pursuant to EU’s Audit Directive an audit entity may act as a company’s auditor for a maximum of 10 years, following which audit services shall be subject to tendering. Should the same auditor be re-elected in the tendering, it may proceed as the company’s auditor for another 10 years at maximum. Thereafter the auditor must be changed. The Audit committee controls the appointment procedure of the auditors and provides the Board
and the General Meeting with a recommendation for the appointment of the auditor.
In 2020, KPMG Oy Ab received EUR 196,064 (EUR 196,064 in 2019 and EUR 234,389 in 2018) in auditing compensation, KPMG internationally received altogether EUR 402,322 (EUR 413,528 in 2019 and EUR 410,642 in 2018) and other auditing firms outside Finland were paid EUR 23,484 (EUR 23,484 in 2019 and EUR 40,984 in 2018). In addi-tion, KPMG has received EUR 3,581 (EUR 34,327 in 2019 and EUR 6,825 in 2018) for services not related to the actual auditing of the accounts.
INSIDER ADMINISTRATIONMetsä Board and its group comply in insider matters with Finnish laws, namely the Securities Markets Act, the Regulation N:o 596/2014 by the European Parliament and the Commission on market abuse (MAR) and supporting orders and regulations as well as the insider guidelines of NASDAQ Helsinki Ltd. (Helsinki Stock Exchange) (https://www.nasdaq.com/solutions/rules-reg-ulations-helsinki). The Board has based on the above rules approved the Company’s own insider guidelines.
Pursuant to MAR Article 14 and Chapter 51 of the Penal Code, a person who possesses inside information shall not (i) engage or attempt to engage in insider dealing by acquiring or transfer-ring financial instruments in his own name or on behalf of a third party, (ii) recommend that another person engage in insider dealing or induce another person to engage in insider dealing, (iii) unlawfully disclose inside information to another person, unless such disclosure is made as part of carrying out normal work duties. The purpose of insider management is to enable a transparent ownership of the Company’s securities by the Company’s insiders, while simultaneously maintaining public trust in the trading with the Company’s securities and their price formation. The Company recommends only long-term investments. Insiders are being trained at regular intervals.
Following the MAR becoming effective on 3 July 2016, the Company no longer has a register of pub-lic insiders and the Company no longer maintains a permanent company-specific insider register. The Company shall, when required and by decision of the Chairman of the Board of Directors, set up a project-specific insider register to cover all persons who are involved in the preparation of a specific project containing insider information.
The Company’s managers with a duty to notify include members of the Board of Directors and
the CEO. The holdings of such managers and their related parties is public. Each of them have an individual duty vis-à-vis the Company and the competent supervisory authority to notify all transactions executed with the shares and other financial instruments of Metsä Board. Metsä Board will publish all such notifications by means of a stock exchange release.
Trading in the Company’s shares and other financial instruments is prohibited during a period starting at the end of each reporting period and lasting until the results release has been published (always at minimum 30 days; “closed window”). This prohibition applies not only to managers with a duty to notify but also to such other persons specified by the Company who participate in the preparation of financial reports.
RELATED PARTy TRANSACTIONSThe Board of Directors has determined the principles applicable to the review and evaluation of business transactions with related parties. The Company’s business activities include contractual relationships with the parent entity Metsäliitto Cooperative and affiliated companies Metsä Fibre Oy and Metsä Tissue Corporation. The most signif-icant of these include raw material (such as wood and pulp) sourcing and acting in jointly operated integrated mill sites. In situations where the Board of Directors addresses a business relationship or other contractual relationship or connection to Metsäliitto Cooperative or the Company’s affiliated companies, the Board of Directors shall, as a rule, act without those of its members who are dependent on Metsäliitto Cooperative or the relevant affiliated company. The Audit Committee follows up and anlyses any business and contractual relationships between the Company and its related parties.
To assess the independence and impartiality of the members of the Board of Directors, the mem-bers shall notify the Company of circumstances that may have an impact on the member’s ability to act without conflict of interest.
As at 31 December 2020, neither the Board members, nor the Company’s CEO or the Corpo-rate Management Team members had monetary loans from the Company or its subsidiaries. No security arrangements or significant business relations existed between these persons (including their related parties as defined in IFRS) and the Company during 2020.
139138
METSÄ BOARD Annual Report 2020
Business operations and value creation
2 This is Metsä Board
4 CEO’s review
6 Highlights of the year
8 Strategy and targets
10 Creating value
12 Operating environment
16 Product and service development
18 Circular economy
Sustainability
20 Sustainability targets
24 We bring the forest to you
26 We offer sustainable choices
30 We work for a better climate and environment
34 We create well-being
40 Mill-specific information
Financial development
44 Report of the Board of Directors
57 Consolidated financial statements
61 Notes to the consolidated financial statements
107 Parent company financial statements
110 Notes to the parent company financial statements
123 Auditor’s report
126 Shares and shareholders
132 Key figures and taxes
Governance
134 Corporate governance statement
140 Metsä Board Corporation’s Board of Directors
142 Metsä Board Corporation’s Corporate Management Team
144 Investor relations and investor information

SUSTAINABILITYBUSINESS OPERATIONS AND VALUE CREATION
FINANCIAL DEVELOPMENT GOVERNANCE
BOARD OF DIRECTORS | METSÄ BOARD ANNUAL REPORT 2020
JUSSI LINNARANTAb. 1972
M.Sc. (Agriculture and Forestry) Agronomist
Member of the Board since 2017 Vice Chairman of the Board since 2020
Independent of the company. Not independent of the company’s significant shareholder Shares owned in Metsä Board Corporation 31 Dec. 2020: 20,939 B shares
TIMO SAUKKONENb. 1963
M.Sc. (Agriculture and Forestry)Forester
Member of the Board since 2020
Independent of the company. Not independent of the company’s significant shareholder
Shares owned in Metsä Board Corporation 31 Dec. 2020: 9,875 B shares
VELI SUNDBÄCKb. 1946
LL.M., Master of Laws
Member of the Board since 2013
Independent of the company and of its significant shareholders
Shares owned in Metsä Board Corporation 31 Dec. 2020: 67,952 B shares
KIRSI KOMIb. 1963
LL.M., Master of Laws
Member of the Board since 2010
Independent of the company and of its significant shareholders
Shares owned in Metsä Board Corporation 31 Dec. 2020: 78,287 B shares
JUKKA MOISIOb. 1961
M.Sc. (Econ.), MBA
Member of the Board since 2020
Independent of the company and of its significant shareholders
Shares owned in Metsä Board Corporation 31 Dec. 2020: 5,275 B shares
ILKKA HÄMÄLÄb. 1961
M.Sc (Eng.) vuorineuvos(Finnish honorary title)Metsä Group, President and CEO
Chairman of the Board since 2018
Not independent of the company or its significant shareholder
Shares owned in Metsä Board Corporation 31 Dec. 2020: 337,648 B shares
HANNU ANTTILAb. 1955
M.Sc. (Econ.) Teollisuusneuvos(Finnish honorary title)
Member of the Board since 2018
Independent of the company and of its significant shareholders
Shares owned in Metsä Board Corporation 31 Dec. 2020: 140,619 B shares
KAI KORHONENb. 1951
M.Sc. (Eng.), eMBA
Member of the Board since 2008
Independent of the company and of its significant shareholders
Shares owned in Metsä Board Corporation 31 Dec. 2020: 215,057 B shares
LIISA LEINOb. 1960
M.Sc. (Nutrition) Teollisuusneuvos (Finnish honorary title)
Member of the Board since 2009
Independent of the company and of its significant shareholders
Shares owned in Metsä Board Corporation 31 Dec. 2020: 182,932 B shares
Metsä Board’s Board of Directors
Board of Directors
Read morewww.metsaboard.com/Investors/Board-of-Directors
141140
METSÄ BOARD Annual Report 2020
Business operations and value creation
2 This is Metsä Board
4 CEO’s review
6 Highlights of the year
8 Strategy and targets
10 Creating value
12 Operating environment
16 Product and service development
18 Circular economy
Sustainability
20 Sustainability targets
24 We bring the forest to you
26 We offer sustainable choices
30 We work for a better climate and environment
34 We create well-being
40 Mill-specific information
Financial development
44 Report of the Board of Directors
57 Consolidated financial statements
61 Notes to the consolidated financial statements
107 Parent company financial statements
110 Notes to the parent company financial statements
123 Auditor’s report
126 Shares and shareholders
132 Key figures and taxes
Governance
134 Corporate governance statement
140 Metsä Board Corporation’s Board of Directors
142 Metsä Board Corporation’s Corporate Management Team
144 Investor relations and investor information

SUSTAINABILITYBUSINESS OPERATIONS AND VALUE CREATION
FINANCIAL DEVELOPMENT GOVERNANCE
CORPORATE MANAGEMENT TEAM | METSÄ BOARD ANNUAL REPORT 2020
SARI PAJARI-SEDERHOLMb. 1968
M.Sc. (Tech)Senior vice President, Sales and Marketing
Metsä Group employee since 2007. Member of Metsä Board Corporate Management Team since 2011
Shares owned in Metsä Board Corporation 31 Dec. 2020: 48,000 B shares
MIKA JOUKIOb. 1964
M.Sc. (Tech), MBA Chief Executive Officer
Metsä Group employee since 1990. Chairman of Metsä Board Corporate Management Team since 2014
Shares owned in Metsä Board Corporation 31 Dec. 2020: 354,025 B shares
ARI KIVIRANTAb. 1963
D.Sc. (Tech)Senior vice President, Development
Metsä Group employee since 1993. Member of Metsä Board Corporate Management Team since 2014
Shares owned in Metsä Board Corporation 31 Dec. 2020: 36,000 B shares
HARRI PIHLAJANIEMIb. 1970
M.Sc. (Tech)Senior vice President, Production
Metsä Group employee since 2017. Member of Metsä Board Corporate Management Team since 2017
Shares owned in Metsä Board Corporation 31 Dec. 2020: 17,523 B shares
JUSSI NOPONENb. 1975
M.Sc. (Tech)Chief Financial Officer
Metsä Group employee since 2000.Member of Metsä Board Corporate Management Team since 2016
Shares owned in Metsä Board Corporation 31 Dec. 2020: 55,000 B shares
CAMILLA WIKSTRÖMb. 1970
M.Sc. (Tech)Senior vice President, Human Resources
Metsä Group employee since 2002. Member of Metsä Board Corporate Management Team since 2019
Shares owned in Metsä Board Corporation 31 Dec. 2020: 35,184 B shares
Metsä Board’s Corporate Management Team
Corporate Management Team
Read morewww.metsaboard.com/Investors/CEO-and-other-management
143142
METSÄ BOARD Annual Report 2020
Business operations and value creation
2 This is Metsä Board
4 CEO’s review
6 Highlights of the year
8 Strategy and targets
10 Creating value
12 Operating environment
16 Product and service development
18 Circular economy
Sustainability
20 Sustainability targets
24 We bring the forest to you
26 We offer sustainable choices
30 We work for a better climate and environment
34 We create well-being
40 Mill-specific information
Financial development
44 Report of the Board of Directors
57 Consolidated financial statements
61 Notes to the consolidated financial statements
107 Parent company financial statements
110 Notes to the parent company financial statements
123 Auditor’s report
126 Shares and shareholders
132 Key figures and taxes
Governance
134 Corporate governance statement
140 Metsä Board Corporation’s Board of Directors
142 Metsä Board Corporation’s Corporate Management Team
144 Investor relations and investor information
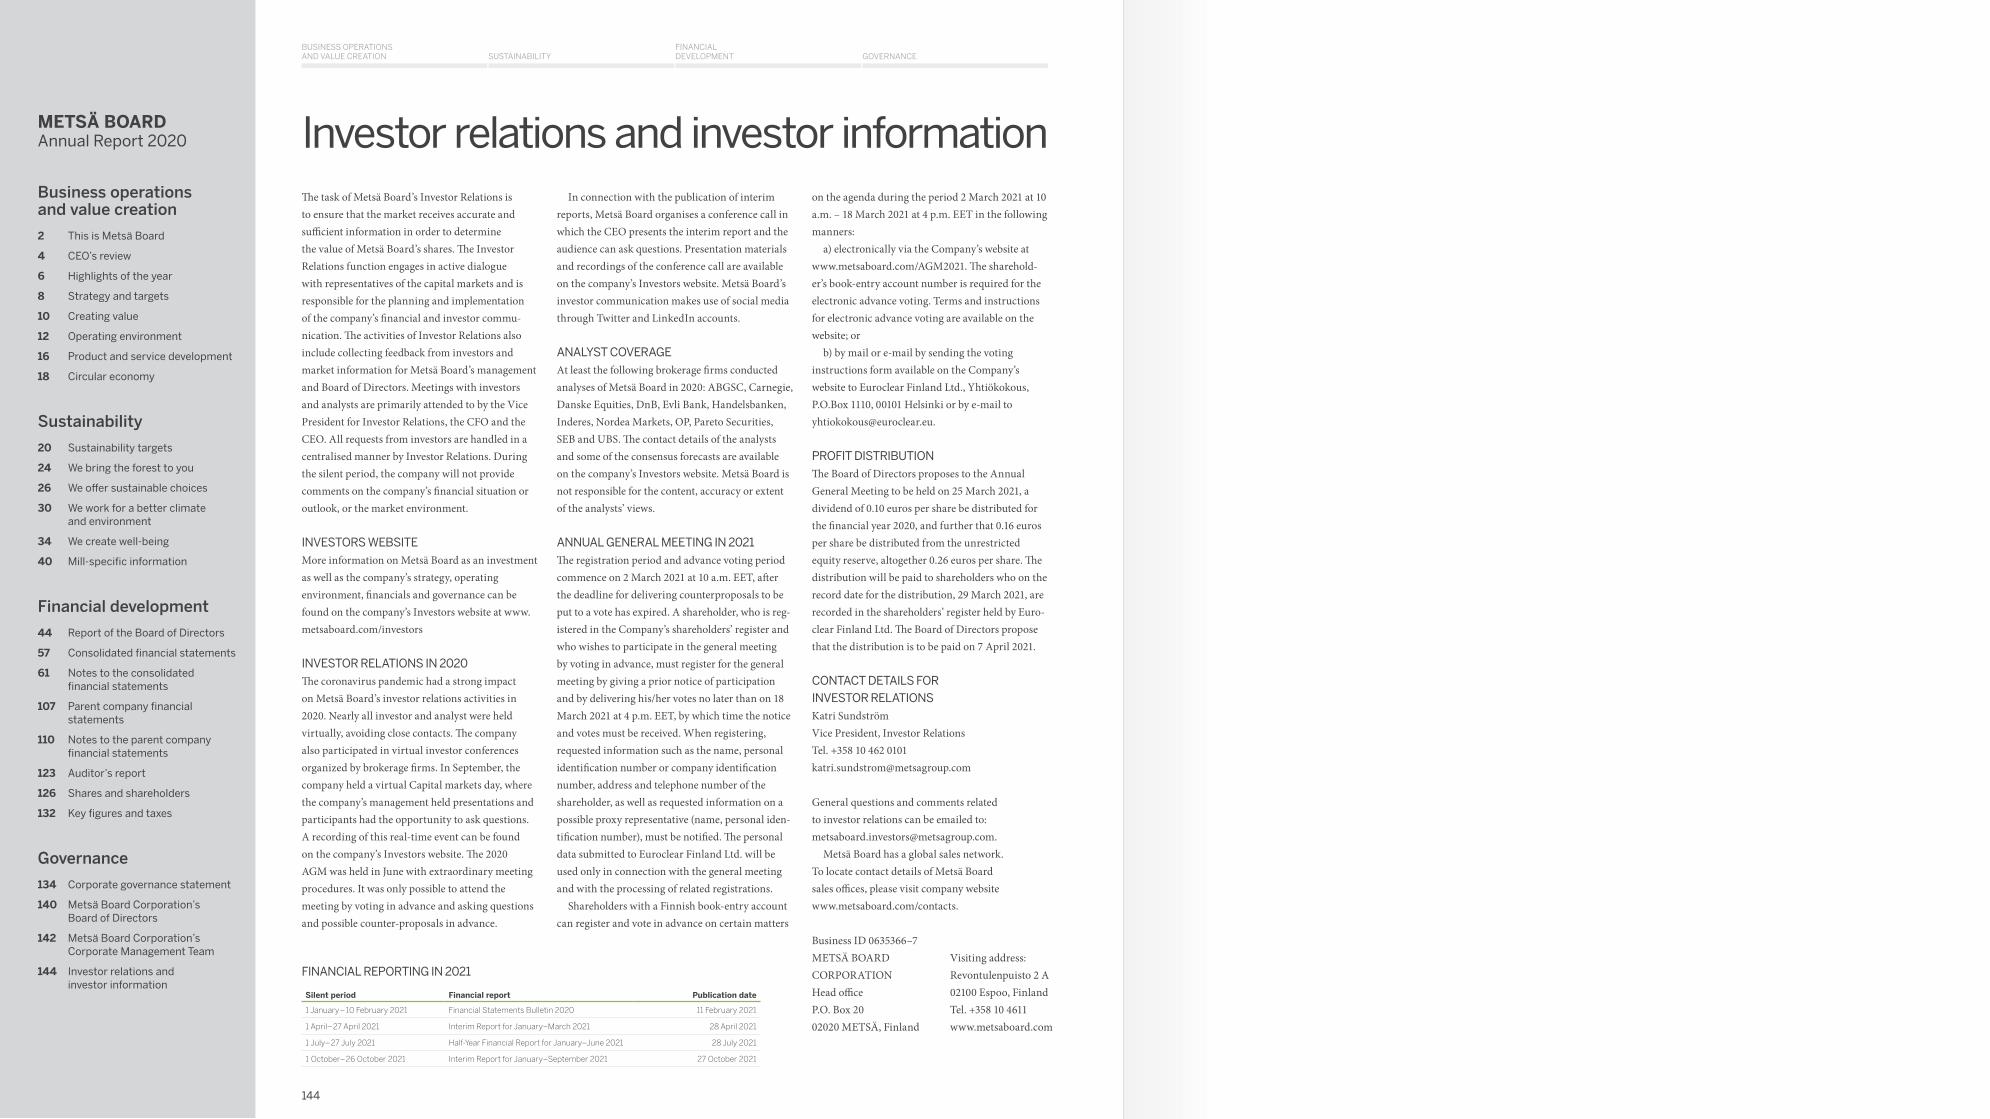
SUSTAINABILITYBUSINESS OPERATIONS AND VALUE CREATION
FINANCIAL DEVELOPMENT GOVERNANCE
The task of Metsä Board’s Investor Relations is to ensure that the market receives accurate and sufficient information in order to determine the value of Metsä Board’s shares. The Investor Relations function engages in active dialogue with representatives of the capital markets and is responsible for the planning and implementation of the company’s financial and investor commu-nication. The activities of Investor Relations also include collecting feedback from investors and market information for Metsä Board’s management and Board of Directors. Meetings with investors and analysts are primarily attended to by the Vice President for Investor Relations, the CFO and the CEO. All requests from investors are handled in a centralised manner by Investor Relations. During the silent period, the company will not provide comments on the company’s financial situation or outlook, or the market environment.
INvESTORS WEBSITE More information on Metsä Board as an investment as well as the company’s strategy, operating environment, financials and governance can be found on the company’s Investors website at www.metsaboard.com/investors
INvESTOR RELATIONS IN 2020 The coronavirus pandemic had a strong impact on Metsä Board’s investor relations activities in 2020. Nearly all investor and analyst were held virtually, avoiding close contacts. The company also participated in virtual investor conferences organized by brokerage firms. In September, the company held a virtual Capital markets day, where the company’s management held presentations and participants had the opportunity to ask questions. A recording of this real-time event can be found on the company’s Investors website. The 2020 AGM was held in June with extraordinary meeting procedures. It was only possible to attend the meeting by voting in advance and asking questions and possible counter-proposals in advance.
In connection with the publication of interim reports, Metsä Board organises a conference call in which the CEO presents the interim report and the audience can ask questions. Presentation materials and recordings of the conference call are available on the company’s Investors website. Metsä Board’s investor communication makes use of social media through Twitter and LinkedIn accounts.
ANALyST COvERAGE At least the following brokerage firms conducted analyses of Metsä Board in 2020: ABGSC, Carnegie, Danske Equities, DnB, Evli Bank, Handelsbanken, Inderes, Nordea Markets, OP, Pareto Securities, SEB and UBS. The contact details of the analysts and some of the consensus forecasts are available on the company’s Investors website. Metsä Board is not responsible for the content, accuracy or extent of the analysts’ views.
ANNUAL GENERAL MEETING IN 2021 The registration period and advance voting period commence on 2 March 2021 at 10 a.m. EET, after the deadline for delivering counterproposals to be put to a vote has expired. A shareholder, who is reg-istered in the Company’s shareholders’ register and who wishes to participate in the general meeting by voting in advance, must register for the general meeting by giving a prior notice of participation and by delivering his/her votes no later than on 18 March 2021 at 4 p.m. EET, by which time the notice and votes must be received. When registering, requested information such as the name, personal identification number or company identification number, address and telephone number of the shareholder, as well as requested information on a possible proxy representative (name, personal iden-tification number), must be notified. The personal data submitted to Euroclear Finland Ltd. will be used only in connection with the general meeting and with the processing of related registrations.
Shareholders with a Finnish book-entry account can register and vote in advance on certain matters
on the agenda during the period 2 March 2021 at 10 a.m. – 18 March 2021 at 4 p.m. EET in the following manners:
a) electronically via the Company’s website at www.metsaboard.com/AGM2021. The sharehold-er’s book-entry account number is required for the electronic advance voting. Terms and instructions for electronic advance voting are available on the website; or
b) by mail or e-mail by sending the voting instructions form available on the Company’s website to Euroclear Finland Ltd., Yhtiökokous, P.O.Box 1110, 00101 Helsinki or by e-mail to [email protected].
PROFIT DISTRIBUTION The Board of Directors proposes to the Annual General Meeting to be held on 25 March 2021, a dividend of 0.10 euros per share be distributed for the financial year 2020, and further that 0.16 euros per share be distributed from the unrestricted equity reserve, altogether 0.26 euros per share. The distribution will be paid to shareholders who on the record date for the distribution, 29 March 2021, are recorded in the shareholders’ register held by Euro-clear Finland Ltd. The Board of Directors propose that the distribution is to be paid on 7 April 2021.
CONTACT DETAILS FOR INvESTOR RELATIONS Katri Sundström Vice President, Investor Relations Tel. +358 10 462 0101 [email protected]
General questions and comments related to investor relations can be emailed to: [email protected].
Metsä Board has a global sales network. To locate contact details of Metsä Board sales offices, please visit company website www.metsaboard.com/contacts.
Business ID 0635366–7METSÄ BOARD CORPORATION Head office P.O. Box 20 02020 METSÄ, Finland
FINANCIAL REPORTING IN 2021
Silent period Financial report Publication date
1 January– 10 February 2021 Financial Statements Bulletin 2020 11 February 2021
1 April–27 April 2021 Interim Report for January–March 2021 28 April 2021
1 July–27 July 2021 Half-Year Financial Report for January–June 2021 28 July 2021
1 October–26 October 2021 Interim Report for January–September 2021 27 October 2021
Investor relations and investor information
Visiting address: Revontulenpuisto 2 A 02100 Espoo, Finland Tel. +358 10 4611 www.metsaboard.com
144
METSÄ BOARD Annual Report 2020
Business operations and value creation
2 This is Metsä Board
4 CEO’s review
6 Highlights of the year
8 Strategy and targets
10 Creating value
12 Operating environment
16 Product and service development
18 Circular economy
Sustainability
20 Sustainability targets
24 We bring the forest to you
26 We offer sustainable choices
30 We work for a better climate and environment
34 We create well-being
40 Mill-specific information
Financial development
44 Report of the Board of Directors
57 Consolidated financial statements
61 Notes to the consolidated financial statements
107 Parent company financial statements
110 Notes to the parent company financial statements
123 Auditor’s report
126 Shares and shareholders
132 Key figures and taxes
Governance
134 Corporate governance statement
140 Metsä Board Corporation’s Board of Directors
142 Metsä Board Corporation’s Corporate Management Team
144 Investor relations and investor information

PEFC/02–31–92
Your partner in sustainable growth
METSÄ BOARD CORPORATIONP.O. Box 20FI-02020 Metsä, Finlandvisiting address: Revontulenpuisto 2 A02100 Espoo, Finland Tel. +358 10 4611www.metsaboard.com
Co
vers
: Met
säB
oar
d P
rim
e F
BB
Bri
gh
t 2
35
g/m
². ©
Met
sä B
oar
d C
orp
ora
tio
n 2
02
1
Together we make the perfect package
METSÄ BOARD Annual Report 2020
Business operations and value creation
2 This is Metsä Board
4 CEO’s review
6 Highlights of the year
8 Strategy and targets
10 Creating value
12 Operating environment
16 Product and service development
18 Circular economy
Sustainability
20 Sustainability targets
24 We bring the forest to you
26 We offer sustainable choices
30 We work for a better climate and environment
34 We create well-being
40 Mill-specific information
Financial development
44 Report of the Board of Directors
57 Consolidated financial statements
61 Notes to the consolidated financial statements
107 Parent company financial statements
110 Notes to the parent company financial statements
123 Auditor’s report
126 Shares and shareholders
132 Key figures and taxes
Governance
134 Corporate governance statement
140 Metsä Board Corporation’s Board of Directors
142 Metsä Board Corporation’s Corporate Management Team
144 Investor relations and investor information