metropolitan university environmental affairs …€¦ · table 2. particulate matter (pm) result...
TRANSCRIPT

METROPOLITAN UNIVERSITY
ENVIRONMENTAL AFFAIRS GRADUATE SCHOOL
SAN JUAN, PUERTO RICO
EVALUATION OF THE PRESENCE OF SOME PATHOGENIC
MICROORGANISMS IN THE AIR AND THE SURFACE OF THE FACILITIES
OF THE CAGUAS GYMNASTIC CLUB
Partial requirement for the procurement of
Master of Science in Environmental Management
Environmental Risk Assessment and Management
By
Waleska Díaz Muñoz
May 03, 2010

DEDICATORY
For all the people
that believe in himself.
We create our destiny each day
during the entire life.

AKNOWLEDGEMENTS
Thanks for all the people that help me during the development of this study.
Thanks to my husband Tony Yin, my daughters Leyshka and Nayhiara. Thanks to my
thesis committee Karlo Malavé, Harry Peña and Christian Velez. Thanks to Vocational
Rehabilitation Program for the economical support. I need to give special thank to Mr.
Francisco Ochoa, Director of Department of Recreation and Sport in Caguas
Municipality for approve this investigation in Caguas Gymnastic Club. Thanks to Dr.
Wilfredo Colón, Dean of the school of Science and Technology at the UNE. Thanks to
all employee of Zimmetry for the support during the spraying with the antimicrobial
product during the third phase and for all the equipment that we used. Thanks to Clendo
Environmental Laboratories, Rams Laboratories, Draft-Tech and Milka Miranda for the
technical support during our research.

v
TABLE OF CONTENTS
TABLE LIST ..................................................................................................................... vi
FIGURE LIST ................................................................................................................... vii
APPENDIX LIST ............................................................................................................ viii
ABSTRACT. ...................................................................................................................... ix
RESUMEN .. ...................................................................................................................... x
CHAPTER I: INTRODUCTION ........................................................................................ 1
DEDICATORY ........................................................................................................... v Goal .............................................................................................................................. 9
Objectives ..................................................................................................................... 9
CHAPTER II: LITERATURE REVIEW ......................................................................... 10
DEDICATORY ........................................................................................................... v
DEDICATORY ........................................................................................................... v Legal framework ......................................................................................................... 17
CHAPTER III: METHODOLOGY .................................................................................. 21
Field of study .............................................................................................................. 21
Length of time of the research .................................................................................... 23
Physical parameter procedure ..................................................................................... 24
Biological parameter procedure .................................................................................. 26
CHAPTER IV: RESULTS AND DISCUSSION ............................................................. 34
CHAPTER V: CONCLUSIONS AND RECOMMENDATIONS ................................... 47
LITERATURE REVIEW ................................................................................................. 50

vi
TABLES LIST
Table 1. Physical characteristics of the facilities during the first,
second and third monitory ........................................................................... 56
Table 2. Particulate matter (PM) result during the the first (A),
second (B) and third (C) monitory ............................................................... 57
Table 3. Exposure plate result .................................................................................... 58
Table 4. Sterile carpet test result ................................................................................ 59
Table 5. Most common pathogenic bacteria found with the Enviroswabs ................ 60
Table 6. Most common pathogenic fungi found in air sampling ............................... 61
Table 7. Most common pathogenic bacteria found in air sampling ........................... 62

vii
FIGURE LIST
Figure 1. Aerial photo of Caguas Gymnastic Club ..................................................... 64
Figure 2. Training area of Caguas Gymnastic Club .................................................... 65
Figure 3. Grid for the air sampling monitoring ........................................................... 66
Figure 4. Grid for the physical-chemical sampling monitory ..................................... 67
Figure 5. Bacteria air sampling result before and after
mitigation process ........................................................................................ 68
Figure 6. Yeast and Mold air sampling result before and after
mitigation process ........................................................................................ 69
Figure 7. Proportion of fungi and bacteria after the first Enviroswabs monitory ....... 70
Figure 8. Proportion of fungi and bacteria after the first air sampling ........................ 71

viii
APPENDIX LIST
Appendix 1. Particle Dust Characterization Analytical Result first monitory.................. 73
Appendix 2. Particle Dust Characterization Analytical Result second monitory ............. 76
Appendix 3. Sterile carpet Analytical Report (#10554) ................................................... 79
Appendix 4. Enviroswabs Analytical Report (#10558, #10559) ...................................... 88
Appendix 5. Air Sampling Analytical Report (#10330, #10332) ................................... 138
Appendix 6. Analytical Report after cleaning and disinfestations
(#10846 to #10849) .................................................................................... 196
Appendix 7. Cleaning Program for Caguas Gymnastic Club ......................................... 208

ix
ABSTRACT
The Environmental Protection Agency (EPA) identifies poor indoor air quality as one of
the top five environmental health hazards affecting public health. The average persons
spends more than 90% of their time in enclosed environments, that is why, pollutant free
air in those environments should be a priority. Exposure to indoor allergens can result in
allergies, asthma, bronchial hyper-reactivity, respiratory tract inflammation, dermatitis,
and sinusitis. This study analyzes the indoor air quality of a gymnasium on the
municipality of Caguas, Puerto Rico. Its woeful condition can expose users to
pathogenic fungi and bacteria species. During this study, we measured environmental
factors in six different points inside the facility including temperature, humidity, and dust
characterization, CO, CO2 and airflow. We collected 98 samples in total for the biotic
parameter, 36 surface samples in areas were the athletes are in contact with gymnastic
equipment such as beams, vaults, mattresses, foam pits, and others; 32 random air
samples were collected and 30 random samples for Dermathophytes were also collected.
We incubated all the samples and individual colonies were isolated for their
identification. Results showed the identification of fungi such as Acremonium strictum,
A. curvulum, Cladosporium cladosporoide, Curvularia brachyspora, C. clavata, C.
senegalensis, Penicillium chrysogenum, P. citrinum, Aspergillus niger, A. clavatus.
Among the most prevalent pathogenic Dermathophytes were Trichophyton soudanense,
T. verrucosum, and Epidermophyton floccosum. Identified bacteria were Sphingomonas
paucimobilis, Klebsiella pneumonia, Bacillus megaterium, Serratia odorifera,
Micrococus luteus, Staphylococcus hominis and S. saprophyticus, among others. This
study has allowed us to analyze the microbial diversity of the site and potential health
risk of users and athletes. Most of the microorganism isolated during this investigation
represents health problems for the children that practice in the facility. Therefore
cleaning, disinfection, sanitization and anti-microbial process was performs to minimize
the probability of infection by those using the facility.

x
RESUMEN
La Agencia de Protección Ambiental Federal (USEPA, por sus siglas en inglés) ha
identificado la pobre calidad de aire anterior dentro de los 5 problemas ambientales de
mayor importancia que afectan a la salud pública. Las personas pasan más del 90% de su
tiempo en ambientes cerrados; por tal razón, atender los contaminantes en ambientes de
interiores es una prioridad. La exposición a diferentes alérgenos pueden resultar en
alergias, asma, híper-reactividad bronquial, inflamación en el tracto respiratorio,
dermatitis y sinusitis. Cuando esto ocurre, la situación se conoce como Síndrome de
Edificios Enfermos y Enfermedades Relacionadas al Edificio. Durante este estudio,
evaluamos la calidad de aire interior del Club Gimnástico de Caguas, Puerto Rico. Las
condiciones lamentables existentes en el mencionado Club, pueden exponer a los
visitantes a diferentes microorganismos patogénicos. Durante el estudio medimos
diferentes factores abióticos en seis localizaciones dentro de dichas instalaciones
incluyendo temperatura, humedad, caracterización del polvo, CO, CO2 y flujo del viento.
Evaluamos un total de 98 muestras y medimos los parámetros físico-químicos; 36
muestras de superficies en áreas donde los atletas están en contacto directo como lo son
barra, viga, matress, fosa, alfombras, entre otros. Seleccionamos de manera aleatoria 32
muestras para la toma de aire y 30 muestras para la prueba de Dermatofitos. Incubamos
y aislamos todas las muestras para llevar a cabo su identificación microbiológica. Los
resultados evidenciaron la presencia de hongos como: Acremonium strictum, A.
curvulum, Cladosporium cladosporoide, Curvularia brachyspora, C. clavata, C.
senegalensis, Penicillium chrysogenum, P. citrinum, Aspergillus niger, A. clavatus.
Dentro del grupo de los Dermatofitos encontramos, Trichophyton soudanense, T.
verrucosum y Epidermophyton floccosum. Además, las bacterias encontradas y que
identificamos son: Sphingomonas paucimobilis, Klebsiella pneumonia, Bacillus
megaterium, Serratia odorifera, Micrococus luteus, Staphylococcus hominis y S.
saprophyticus, entre otras. Mediante este estudio evaluamos la diversidad microbiológica
existente en las instalaciones del Club Gimnástico de Caguas para conocer si existe
riesgo potencial que afecte la salud de los usuarios. Muchos de los microorganismos
aislados durante la investigación representan un problema para la salud de los niños que
utilizan esta instalación. Durante la investigación llevamos a cabo acciones correctivas y
procesos de limpieza tales como: desinfección, saneamiento mediante técnicas que
fomenten las mejores condiciones higiénicas y antimicrobianas que ayuden a combatir
los microorganismos o a controlar su aparición, así lograr minimizar la probabilidad de
infección en los usuarios.

CHAPTER I
INTRODUCTION
Background of the problem
During the last decades, we have seen progress in the area of science and
technology brought about by the industrial revolution. As a result, global population has
increased through the years. This has brought a change in the way people visualize their
houses and work places leading to the excessive construction of buildings and homes.
These are constructed with weather resistant materials appropriate to our tropical climate.
Due to the excess of buildings in such a small island, an urban vertical growth has been
noted, allowing a greater amount of people to live in smaller spaces, even forcing them to
occupy the vertical space.
All these technological advances have been increasing throughout the years
producing an adverse effect in the atmosphere. Air pollution can be defined; in general
terms as the introduction of biological or chemicals materials and particles that causes
inconvenience or harm to human beings and other living organisms, consequently,
damaging our planet and the quality of natural resources. The existing contaminants in
the outdoor environment will negatively influence the quality of the indoor air.
During the 70’s, it was acknowledged that the quality of the air inside non-
industrial buildings, under certain circumstances like poor maintenance, is harmful to
health. Exposure to indoor poor air quality pose a public health threat because the public
spend 90% of their time in closed environments such as buildings. The EPA recognizes
poor indoor air quality as one of the top five environmental health hazards affecting

2
public health. According to the US Center for Disease Control, Puerto Rico has a higher
overall prevalence of lifetime (19.6%) and current (11.6%) asthma than other parts of the
Americas. Incidence among children’s fewer than eighteens is particularly high in the
eastern part of the island (Rentas, Gonzales & Vélez, 2009).
Indoor air quality is defined by the air parameters found inside buildings,
businesses, schools, and homes. The source of contamination can vary they can be
biological resources or chemical resources; an examples are automobiles, paint,
photocopier machines, electric generators, numerous particles, fibers, dust, bacteria,
fungus, or gases (EPA, 1995a). Some environmental factors such as high temperatures
and humidity, if not under adequate parameters, foster the proliferation of biological
contaminants that can cause long and short term health problems. Bacteria, mold, fungi,
viruses, mite, cockroaches, pollen, and animal particles contributes to indoor air quality
and are known as biological indicators of air quality. These contaminants greatly
contribute to the symptoms of irritation or reactivity presented in persons exposed to
them (Sexton & Dyer, 2004).
Although biological allergens are very important and have priority in the health
area, they have certain special properties or characteristics that make them difficult to
evaluate and identify. This difficulty rests on the great amount and complexity of their
surface antigens and other protein molecules of these agents, being responsible not only
for their pathogenic capacity but also for their difficult evaluation. Asthma is caused by
the combination of genetic and environmental factor. Hakonarson and Halapi (2002)
attributed the condition to the interaction among many genes and how these genes react
with the environment. Different genes have been reported to show linkage of asthma and

3
bronchial hyper-sensitivity. In the last decade significant progress has been made in the
field of asthma but the clinical implication due the genetic variation remains
indeterminate.
Asthma can be broken down into two groups based on the causes of an attack:
extrinsic and intrinsic. Extrinsic asthma has a known cause, such as allergies dust mites,
pollens, grass, weed, or pet dandruff. These individuals produce an excess of antibodies
when exposed to triggers, like the previous. Intrinsic asthma has a known cause, but the
connection between the cause and the symptoms is not clear because it doesn’t have
antibody hypersensitivity.
We can found a lot of investigation about asthma and allergies but during my
research a lack of information about Dermathophytes fungi has been identified. These
fungi are very important to identify because are the most common infectious agent of
humans. Dermathophytes are filamentous fungi that are able to digest and obtain nutrient
from keratin (the primary component of skin, hair, and nails). Dermathophytes are the
only fungi that have evolved a dependency on human or animal infection for the survival
of the species. Trichophyton soudanense, Epidermophyton floccosum and Trichophyton
verrucosum are some of the most common fungi that inhabit the Caguas Gymnastic Club
and at the same time has been identified to produce outbreak in a Judo team in Europe
during 2005.
The chemical pollutants have interest in our environment due to the mixture of
pollutant and have significant health effects due to the mechanism of inflammation and
are responsible of a variety of environmental stressors. Some chemicals include Carbon
monoxide (CO), Ozone (O3), Particulate matter, Tobacco smoke, Volatile Organic

4
Compounds (VOC’s), Radon, Pesticides, Asbestos, Lead, and Arsenic. The
physiological effects of these contaminants are numerous; they can trigger asthma, and
irritate eyes, nose, throat, respiratory illnesses and lung cancer (Clifford et al., 2009).
Knowing this, and to maintain an indoor environment under adequate levels of
quality that will keep us healthy, we need to study the environmental characteristics that
promote the growth and proliferation of the organisms mentioned above. Environmental
characteristics include temperature, humidity, CO, Carbon dioxide (CO2), dust
characterization and air flow, among others. One of the most important factors is the
inappropriate temperatures for an indoor space is the temperature; this should be kept at
70º to 76ºF. High temperatures promote the growth of bacteria, fungi, and dust mites.
Therefore, temperature controls are important since if appropriate conditions are provided
for the proliferation of these pathogenic organisms, the probabilities of severely affecting
the health of the people exposed to them will increase. Another important factor which is
influenced by temperature is relative humidity. Relative humidity should be kept at 30-
60%; higher levels could be critical for people sensitive to these organisms and could
result in possible asthma episodes on chronic sufferers of this disease since the growth of
these microorganisms could propagate (Lemmo et al., 2006).
The presence of skin and eyes irritation, mucus membrane secretions and other
relates symptoms related with the working environment are characteristics of Sick
Building Syndrome. One important characteristic of this syndrome is that it is always
present in susceptible individuals while inside the building and absent or more moderate
when they leave or are not present on the premises. The main complaints among the
personnel that work in the premises include ear, nose, and throat problems; dermatitis,

5
concentration problems, headaches, and fatigue, shortness of breath, and smell
sensitivity. The term building related illnesses is used when the symptoms of the disease
are identified, diagnosed, and directly attributed to the air contaminants of the building.
The signs and symptoms include cough, chest pain, respiratory problems, edema,
palpitations, cancer, alveolitis, pneumonia, occupational asthma among others (Sumedha,
2008). Many people know the health hazards of atmospheric pollutants, but others
ignored how the contaminants inside a building can significantly affect their health.
Some studies on the exposure to air pollutants indicate that indoor levels of
contamination can be 2 to 5 times and sometimes up to 100 times higher than the outside
air (EPA, 1997).
The majority of biological contaminants that are found inside a building come are
outdoor allergens. These penetrate the indoor environment through windows, doors, and
ventilation systems. The aeroallergens vary with the seasons, weather conditions,
geographic location, and the indoor ambient. Researchers have established the following
hypothesis: the higher the flow of air from the exterior to the interior of the building, the
lower is the concentration of contaminants and the probability of getting sick due to air
contamination (Menzies et al., 2003). Therefore, contrary to popular belief closing our
doors and windows to limit the flow of air goes against our desire to protect our health.
Until our people start to understand the symptoms, causes, conditions and the risk
of airborne contaminants, we will continue to suffer illness. The excess of humidity in
structures contributes to the growth of fungi and provides a favorable environment for
dust, roaches, rats, and other plagues. Structural problems, plumbing deficiencies and
poor maintenance in buildings provide mechanisms for those plagues to enter the

6
buildings. On the other hand, the fungus found in the interior comes from two sources,
from the outside through doors and windows and from fungus colonization in the
building. Once fungi obtain specific nutrients and sufficient humidity to grow, they will
appear on walls, insulation material, carpets, mattresses, and other surfaces. The above-
mentioned biological agents sensitize the immunological system producing antibodies
after the first exposure. After repeated exposure, the immune responses are faster and
more intense and can result in allergic asthma, bronchial hyper-reactivity and respiratory
tract inflammation (Jacobs & Baeders, 2005).
In the mid- 1990’s, the Health Center of the University of Michigan or UMHS
began to diagnose serious infections caused by Staphylococcus aureus and Streptococcus
sp. among athletes, healthy children, military recruiters, and groups of professional
football players. This situation caused a great concern to the Center of Disease Control
or CDC. The CDC recommends that communities and athletic centers work to develop
prevention strategies since this bacterium are opportunistic especially when it comes to
open skin wounds (UMHS, 2004).
There are two ways in which humans can be infected with pathogens or acquire
diseases: direct contact and indirect contact. With the direct contact, the pathogenic
microorganism goes directly from the infectious source to the healthy host. The indirect
contact is produced through an intermediary that can be a vector. It is important to
remember that for an exposition to result in an adverse health reaction the presence of a
microorganism is needed along with other variables like abiotic factors. Among external
factors we have temperature, humidity, changes in pressure, and microorganisms; all of
them influencing for the contagion of diseases (Koren & Bisesi, 2008).

7
Children and the elderly are more sensitive to pets and birds allergens when in
enclosed in a classroom or facility. Inhalation, skin contact, and ingestion are the most
frequent ways to exposition of particles. Bacteria, dust, mites, animal epithelium, pollen,
fungi, and animal excrement particles penetrate the system affecting the health like in the
case of allergies, dermatitis, sinuses, and asthma among others (EPA, 1995b).
Study problem
The Caguas Gymnastic Club is a facility that receives approximately 300 children
between the ages of 2½ and 18 years of age. These children use this facility six day as a
week from Monday to Saturday. Some of the children, teenagers, and coaches have
expressed that at one point in time they have suffered from eye irritation, dry cough,
headaches, and sinuses. During the year 2008, one athlete had hospitalized because of
Streptococcus sp., though the origin of the bacterium was not identified. Other factors
that worsen the situation are the presence of pigeons, dogs, cats, mice and baby snake,
elevated temperatures, and humidity. In the past, the presence of pigeons had been
identified as a problem.
We evaluated the environmental conditions like temperature, humidity, airflow in
the facility that was unknown. These physical parameters also influence in the growth of
pathogenic microorganisms. The pigeons’ excrement represents a serious health hazard.
The excretion of these birds contains acids such as phosphoric acid and uric acid. The
pigeons in general build their nests in the buildings’ eaves. Many diseases of these birds
can be transmitted to the humans through the excrement that infect the organic material in
the soil and the surface can be highly infections for years. The complexity of the

8
infection will also depend on the time of exposure, the quantity of inoculums and the
route of infection. Clamidiosis, Salmonellosis, Arizonosis, and Colibacillosis are the
most traditional infections caused by pigeons’ excrement and the most treated ones at
hospitals and clinics. Many of the diseases transmitted by pigeons’ excretion, like
Histoplasmosis, can be serious and require a treatment for life.
Justification
Monitoring, identifying, and evaluating the quantity and types of microorganisms
that inhabit the Caguas Gymnastic Club is an important matter, since there is the
possibility that athletes and coaches are working in an environment where contaminants
can affect their health. The importance of this evaluation relies on the fact that the
population that uses such gymnasium is predominately children. Due to its physiological
characteristics and behavior, children are one of the groups more susceptible to infections
by the endogenous pathogens of the gymnasium. The diseases caused by Streptococcus
sp. are considered sporadic, but can cause epidemics. They are common in places where
there is overcrowding.
We have to remember that contamination of the indoor air has a direct impact on
the health of the people that work inside the facilities. Due to the limited knowledge on
this problem, research should be continuing focusing in minimizing the impact on public
health. This preventable problem concerns all of us. Medical specialist identify that the
most common problems found with children under eighteen are problems related with
asthma, allergies and dermatitis.

9
Investigation question
Are some of the microorganisms, in air and surface, present in the facilities of the
Caguas Gymnastic Club could affect the health of the children and coaches that use those
facilities?
Goal
The goal of this research was to investigate the presence of pathogenic
microorganisms in the Caguas Gymnastic Club that could be a risk to the health of the
users of the Club and to propose corrective measures. The corrective measures included
develop a cleaning and disinfection plan with the purpose to compare the result obtained
before and after mitigation process.
Objectives
1. Identify and evaluate the presence of some microorganisms and the
environmental conditions in the Caguas Gymnastic Club.
2. Determine whether the microorganisms founded were a potential risk to the
health of the children that use the facilities.
3. Make a Risk Communication Plan.
4. Create a mitigation plan for the facilities.

10
CHAPTER II
LITERATURE REVIEW
Historical background of air quality
In 1984, the Organizational Committee for Global Health reported to the
Environmental Protection Agency or EPA that 30% of the new and remodeled buildings
has excessive complaints related to the indoor air quality (Global Health Alliances,
2002).
The contaminants of the outdoor air are a dynamic system in which the physical
and chemical processes affect the accumulation of contaminants in the atmosphere. The
emission origin is a reserve that is constantly changing. On the other hand, the indoor air
contaminants are diluted in the air, but in a static environment where the physical and
chemical characteristics transform, they can be found in higher concentration levels
(Nazaroff, 2004).
In the past, the discussion of indoor air quality focused in the constituents of the
air, like for example, primary particles, bioaerosoles and chemicals, and in factors such as
temperature, air flow and humidity (Samet, Splender & Mitchel, 1998). Environmental
problems have acquired a higher relevance in the last years, especially those that are
directly related to the health. A relationship has now been established between the
building ambient and the human being. A relation has been identified between the
occupants of a building and the implications that the design, operation, light, noise, and
use of the building might cause, therefore, creating an added exposition that can

11
contribute to the health and physical discomforts of the occupants (Cummins & Jackson,
2001).
The biological reservoirs of exterior air contaminants are also found in the interior
of a building (National Research Council, 2004). The air contaminants that are mostly
found inside a building are gas and material particles; animals contribute to the
production of these contaminants producing fecal excrement and detritus of the skin.
People release epithelial cells and along with the dust accumulated in beds, rugs, and
furniture contribute to the production of allergens. The poor condition of an air condition
system can harbor psichrophilic bacteria like Legionella pneumophilla, which is
responsible for the Legionnaires’ disease. In this way, the microorganisms or substances
that caused diseases are not only circumscribe to a specific location, but also can be
transported throughout the building by ways of the air condition system. This situation
has a global effect in the general population that lives, works, or uses the building
facilities (World Health Organization, 2002).
Particulate Matter (PM) is one of the six current USEPA criteria air pollutants.
PM are particles that consist of many different substance suspended in the air in the form
of particles of solid or liquid matter, which vary in size, source, chemical composition,
and remain suspended in the air for long periods (Abelsohn et al., 2002; Maynard et al.,
2003). Primary coarse particles are those produced by mechanical processes and include
windblown dust, road, sea salt, dust and combustion-generated particle such as fly ash
and soot. Secondary PM is form by chemical reactions of dissolved gases.
PM can be classified in small or fine particle that are less or equal to 2.5µm in
diameter; and PM 10 refer to all particles less than or equal to 10µm in diameter. These

12
entire particles are directly emitted to the environment and can produce adverse health
effect. The smaller particles are considered the most damage to health (Liu et al., 2003),
since they can move easily penetrate the respiratory tract and aggravates illness such
asthma and bronquitis (Godish, 2003).
Effects of the pathogens found in indoor air
During the last decades, there has been a concern about the presence of fungi and
other allergens in the indoor air, and their relation with the adverse effects to the health.
Today, research on indoor air quality is more focused in the analysis of fungi and the
measurement of air particles (Brasel et al, 2005). The exposition to these factors can
influence the responses to allergic hypersensitivity and problems with asthma (American
Academy of Allergy, Asthma and Immunology, 1998). The magnitude and dimension of
the illnesses caused by indoor air allergens will depend on different factors: the
prevalence of the disease measures the frequency in the population within a specific time,
and the incidence of the disease measures the number of new cases that take place within
a time frame. The incidence and prevalence will vary according to sex, age, ethnic
group, socio-economic class, and geographic region (Pope & Patterson, 1993).
Fungi and other biological agents are associated with a great number of conditions
including hypersensitivity to pneumonia. Fungi and spores found in indoor air with high
levels of humidity produce micro toxins, which increase the possibility of introducing
systemic diseases (Fisher & Dott, 2003). The clinical effects of the micro toxins include
respiratory, neurological, immunological, dermatological, and gastrointestinal problems
(Kuhn & Ghannoum, 2003). The most common fungi that can be found include species

13
of the genus Alternaria sp., Cladosporium sp., Aspergillus sp., Penicillium sp.,
Stachybiotrys sp., Chaetomium, yeast like Candida albicans, and members of the
Basidiomycetes, Zigomicetos, and Ascomicetos (Dillon et al., 1999).
Bacterium like Micrococcus, Bacillus sp., and Staphylococcus sp. can be found in
high concentrations in places with inadequate ventilation. The actinomycetes can cause
hypersensitivity to pneumonia and can be found in porous surfaces and humid places
(Morey et al., 1984).
Studies on pathogens in indoor air
There is a lack of exactness in the definition of health in respect to SBS, which
presents confusion in the investigation of adverse health effects associated with indoor air
contaminants. Surveys indicate that there is a difference in perception among men and
women on what is a healthy person. The physical build is not important when is time to
identify which persons are healthier. Mortality statistics failed to show the percentage of
the population that suffer chronic illnesses and were never under medical treatment and if
these people were healthy or not. Health is determined by factors such as genetics,
physique, lifestyle, and environment (Weetman & Mumby, 1994). Daily prevention of
diseases maintains the human being emotionally and physically healthy and productive.
Effects of pulmonary function
During the year 2000, the University of Washington did some studies on patients
that showed a decrease in the pulmonary function. These patients resided near areas
where problems with material particles and pathogenic biological agents in the

14
environment have been previously identified. Prior to the study, patients were examined
for specific contaminants such as Pseudomonas aeruginosa. The participants of this
study were relocated close to the Environmental Protection Agency (EPA) during the
stage of investigation. The results show that the patients who reside in large cities are
exposed to emissions since most of them are concentrated inside their homes, causing
like this an increase in respiratory problems (Newson, Schidcrout & Kaufman, 2004).
Impetigo among athletes with direct contact
Impetigo is a very common and highly infectious condition among athletes. It is
communicated through a direct link or through a transport, and it can infect undamaged
skin. The responsible organisms could be Streptococcus sp. and Staphylococcus aureus.
High temperatures, humidity, and poor hygiene are some of the favorable factors for the
proliferation and transmission of the impetigo (Sherry & Wilson, 2002).
Outbreak of Tinea corporis due a Trichophyton tonsurans in a Judo Team
A hospital of France reports an outbreak of tinea corporis due to Trichophyton
tonsurans infection in a Judo Team in 2005. Personal hygiene practices were founded to
be very good among the athletes. The high attack rate was linked to the poor shower
facilities in the gymnasium where they practiced that led them to have their showers
several hours after the end of daily practice (Poisson, Rousseau, Defo & Esteve, 2005).

15
Furunculosis in a football team in an Illinois high school
The deteriorated physical state of sport facilities along with open wounds in a
group of football players, favored the outbreak of swollen abscesses in the armpits and
extremities of these athletes. The responsible organism was Staphylococcus aureus. The
lack of hot water, soap, and poor hygiene in the shower area were factors that facilitated
the outbreak of infection (Barlett, Martin & Cahill, 1982).
Swimming pools and fungi in indoor facilities
In the University of Urbino, Italy an environmental epidemiology survey was
performed in indoor swimming facilities. They founded a filamentous fungi and yeast
was isolated from contaminated air, water and surfaces. The result revealed a high
biodiversity of fungi likes: Aspergillus spp., Penicillium spp., Cladosporium spp.,
Alternaria spp., and Fusarium. The investigation considers that the biodiversity of the
microorganisms in the facilities may represent a biological risk for employees and users
(Brandi et al., 2007).
Meningococcal diseases
Meningococosis is a condition caused by Neisseria meningitis, a condition
thoroughly studied in athletic facilities and universities of the United States of America.
The importance and priority of these studies lay in the long and short term harmful results
that this condition can have in people of all age groups. The University of Dubuque,
Iowa, made a study and estimated that around 100 and 125 cases appear annually in his
campuses of colleges and universities. This incidence has increased since the 1990’s.

16
The disease is transmitted through the respiratory airways and the direct contact with the
affected persons (University of Dubuque, 2008).
Outbreak of Giardiasis and Cryptosporidiosis associated with neighborhood
interactive water fountain
A group of Environmental and Epidemiological investigator identified an
outbreak of Giardiasis and Cryptosporidiosis in Central Florida during September 2006.
The source identify was a water fountain. The population affected was children between
ages of four years old. This outbreak was the first documented associated with exposure
to an interactive water fountain in the United States. This outbreak and others need to
design and implement more stringent disinfection practices. Giardia cyst and
Cryptosporidium oocyst are small and chlorine-resistant, and they may require
supplemental disinfection methods, such as ultraviolet light irradiation, ozonation, or
chlorine dioxide (Leah, 2008).
People who practice contact sports are in risk of suffering infection outbreaks and
skin lacerations. The most common causes of outbreaks and infections include the
Staphylococcus aureus, herpes virus, Streptococcus pyogenes and various fungi. The
Staphylococcus aureus resistant to Methicillin has been identified as an emergency
problem within the community, but particularly among the athletic and military
population and in care centers. Many doctors in sports medicine are not well acquainted
with the epidemiology of this pathogen. It is important that health specialists adequately
manage and identify the infection in order to treat it and control a possible outbreak. On
the other hand, it is important to establish prevention measures among athletes, coaches,
parents, schools, and administration (Rihn, Michaels & Harner, 2005).

17
Skin infections including MRSA have been reported mostly in high-physical-
contact sport such as football, rugby players, soccer, basketball, volleyball, field hockey,
martial arts, fencing and baseball. Little physical contact occurs in some sport during
participation, skin contact or activities that may lead to spread of MRSA. Skin infection
may take place before or after participation such as in locker room or showers.
Therefore, anyone participating in organized, competitive or recreational sports should be
aware of the signs of possible skin infections and follow prevention measure.
Legal framework
Clean Air Act (CAA)
The Clean Air Act of 1970 requires that the Environmental Protection Agency or
EPA develops and regulates the exposition of air contaminants that are dangerous to the
health. Furthermore, it regulates air emissions, stationary sources, and mobile sources.
This law authorizes the EPA to establish the National Ambient Air Quality Standards or
NAAQS.
During the creation of this law, the federal government authorized the EPA to
reinforce the quality of air in forty-nine states with the exception of California. The EPA
allows each state to take responsibility over the observance of the regulations and to
create their own limits. In order to comply with the Clean Air Act, the state can write and
submit a State Implementation Plan or SIP for EPA’s approval. The SIP should comply
with the minimum criteria established by the EPA. If this plan is not acceptable, then the
EPA needs to reinforce the Clean Air Act in that state.

18
National Ambient Air Quality Standards (NAAQS)
The National Ambient Air Quality Standards are established by the EPA and
apply to the outdoor air through the cities. The standards are designed to protect the
health with an adequate margin of safety including sensitive populations like children,
adults, and individuals with respiratory illnesses. Furthermore, they are designed to
protect the public from any adverse health effect that can present a contaminant of
unknown origin.
The NAAQS requires that the EPA indicates the standards on six criteria of air
contaminants: ozone, material particles, carbon monoxide, sulfur dioxide, nitrogen oxide,
and lead. When an area does not meet the air quality standard for one of these criteria
pollutants it may be subject to a process that designates it as nonattainment area. This
classification is used to specify what air pollution reduction measures an area must adopt,
and a deadline for when the goal must be reached.
Annual and 24-hrs NAAQS for particulate matter were first set in 1971. Total
Suspended Particle (TSP) was the first indicator used to represent suspended particles in
the ambient air. The Title 40, Part 50, Section50.6 sets the National Primary and
Secondary ambient air quality standards for PM10: 150 µm/m³ for 24 hrs, not to be
exceeded, more than once per year and 50 µm/m³ annual arithmetic mean averaged over
three years not to be exceed. Section 50.7 sets the National primary and secondary
ambient air quality standards for PM 2.5 these include 65µm/m³ for 24 hrs based on the
98th
percentile concentration averaged over three years, not to be exceeded and 15µm/m³
annual arithmetic mean averaged over three years, not to be exceeded.

19
The National Environmental Policy Act (NEPA)
The purpose of the Law is that if requires that federal agencies conduct thorough
assessments of the environments impacts of all mayor activities undertaken or funded by
the federal government. Many states have enacted similar laws governing state activities.
Law of the Department of Health of Puerto Rico (DSPR)
The Department of Health creates rules and regulations to prevent infectious or
contagious diseases or epidemics. These rules also protect the public health in any
service, business, activity, or situation that could be affected such as water supply,
building construction, building ventilation, drainage, schools, workshops, hospitals,
barber shops, beauty salons, and public baths among others.
The Secretary of Health or his or her representatives are authorized to enter any
building to examine the sanitary conditions. They have the authority to order the closure
of any facility when it is proven that the sanitary conditions, or the way it operates
constitute a public health problem.
Organic Law of the Department of Recreation and Sports
This law promotes the mental, physical, and emotional health of the individual. It
states that the proper use of resources can foster the development of recreational activities
and sports that are essential for a better quality of life. It also promotes the development
of programs on physical efficiency and education about recreational alternatives.
The secretary of the Department of Recreation and Sports has the power to
regulate and supervise any sports or recreation program or facility of Puerto Rico. He or

20
she will make studies on the effect of recreation and sports in the physical, emotional,
and mental health of the citizens. The secretary through by-laws will establish guides for
the planning, designing, location, construction, maintenance, and use of sports and
recreation facilities in the island. Bilateral cooperation will be fostered between the
department and the different municipalities, in relation to the construction,
improvements, maintenance, and administration of sports facilities; always taking into
consideration the socio-economic characteristics of each municipality.

21
CHAPTER III
METHODOLOGY
In this study, our objective was to evaluate the presence of pathogenic
microorganisms in the air and the surface and the indoor air quality at the Gymnastic
Club in Caguas Puerto Rico. We conducted this investigation following a preliminary
visual assessment and the identification of some pathogenic microorganisms that may be
a potential risk to the health of the children and coaches that use those facilities.
Objectives
1. Identify and evaluate the presence of some pathogenic microorganisms and
the environmental conditions in the Caguas Gymnastic Club.
2. Determine whether the microorganisms found are a potential risk to the health
of the children that use the facilities.
3. Make a Risk Communication Plan.
4. Create a mitigation plan for the facilities.
Field of study
The Caguas Gymnastic Club is located inside the sports complex of the
Autonomous Municipality of Caguas. Located in front of the Club is the Roger Mendoza
Coliseum, to the right is the Caguas Department of Recreation and Sports, to the left
cardinals is a manufacturing plant of biomedical equipment called Saint Jude Medical,

22
and in the back cardinals, there is the parking lot of the Héctor Solá Bezares Coliseum
(Figure. 1).
The Caguas Gymnastic Club measures approximately 17,500 square feet, and 25
feet in height. The lower level is made of concrete and the upper level including the roof,
which is made of zinc. The facilities include bathrooms, administration offices, and a
warehouse for cleaning equipment, a kitchen, and a training area. The training area
includes shower for the athletes and the different practice implements like the foam pit,
beams, bars, a floor covered with a rug used for the floor exercises, floor mats, rings,
pommel horse, and containers to store the lime, wooden cubicle, and other equipment.
(Figure. 2) The Club is visit by six days a week, approximately 300 children between the
ages 2½ and 18 years of age.
The method used to assess the indoor air quality is characterized by the collection
of information. The assessment included an inspection of the relevant areas for visual
microorganism growth, air and surface sampling. The visual inspection was important to
us because allowed the identification of possible factors that affect the quality of indoor
air. Beside the visual inspections environmental factors likes temperature, humidity,
Carbon monoxide (CO), Carbon dioxide (CO2) Particulate matter were analyzed with
direct reading instrumentation and Spore Trap Air Filter was collected utilizing a Air-O-
Cell cassette.
For the identification of the sampling spot, we created a quadrangle following the
asbestos quadrangle. We divided the quadrangle in 134 equal squares; each one has
length of 10ft². Using the statistical program RANDOM.ORG, we selected 30 sample
points for the local identification of the air sampling using the SAS 100 (Figure 3). This

23
program will be used to selecting random samples from large data sets with a uniform
distribution. We used the same grid for the identification of the physical and chemical
parameters but divided in six equal parts (Figure 4). The physical parameter evaluated in
those points was temperature, humidity, CO, CO2, Particle matter and Spore Trap Air
Filter. We also collected two samples as background for the microbiological and
physical parameter to compare with the sample inside the training area.
Length of time of the research
We conducted this research in three phases. The first phase was performs on June
9, 2009. We sampled during the first phase sterile carpet test, exposure plates and
measure of direct reading instrumentation. On June 15, 2009 the sampling of air and
surfaces was performed to identify microbial presence. We measured physical and
chemical parameters like Temperatures, Relative humidity, CO, and CO2 utilizing an
IAQ Calc. manufactured by TSI. We measured particulate matter with direct reading
instrument and Spore Trap Air Filter.
We conducted the second phase on September 26 to September 30, 2009. The
purpose of this phase is to perform the mitigation process for fungi and bacteria in
Caguas Gymnastic Club. During this phase, we perform a cleaning and disinfestations
process using Microban QGC Disinfectant Cleaner manufactured by Sylvane. Microban
is a product approved by EPA for the use as disinfectant, fungicide, virucide, sanitizer,
mildewstat, deodorizer and heavy duty cleaner. Microban has been used in microbial
remediation, pest control and odor removal. On October 6, 2009 the second sampling of
sterile carpet test, air and surfaces was performed to compare the efectivity of the

24
cleaning procedure. Temperature, Relative humidity, CO, CO2, Particulate matter and
Spore Trap Air Filter was taken.
We conducted the third phase on October 10, 2009. The purpose of this phase
was the application of the Anti-microbial product (Trimethoxysilyl Quaternary
Ammonium Chloride) H.E.L.P Technologies that can prevent the presence of a broad
spectrum of microorganisms during 90 days.
Physical parameter procedure
Temperature and Relative humidity (%RH)
We analyzed these parameters utilizing a direct reading instrument model TSI-
8760, IAQ-CalcTM
. The field calibration was performs before the sample collection as
recommended by manufacturer. The samples were collected in each of six different
points identifies in the quadrangle. Two different samples as background were also
collected, one in the office and other in the exterior of the building.
Carbon monoxide (CO) & Carbon dioxide (CO2)
We analyzed these parameters utilizing a direct reading instrument model TSI-
8760, IAQ-CalcTM
. The field calibration was performs before the sample collection as
recommended by manufacturer. We collected the samples in each of six different points
identified in the quadrangle. Two different samples as background were also collected,
one in the office and other in the exterior of the building.

25
Particulate matter (PM)
These parameters were analyzed utilizing a direct reading instrument IAQ model
316 manufactured by LIGHTHOUSE World Wide Solution. We collected six samples of
non-viable particles in the training area using the above-mentioned quadrangle. Two
different samples as background were also collected, one in the office and other outside
of the building. The instrument read the concentration of the most common particulate
matter of air in ft3; 0.3 microns, 0.5 micron, 1.0 micron, 2.5 micron, 5.0 micron, 10.0
micron and Total Suspended Particle (TSP).
Spore trap air filter
This sampling consisted in trapping the dust in a Bioaerosol Sampling Cassette, a
unique sampling device specially designed for the rapid collection and analysis of a wide
range of airborne aerosols. These include mold, spores, pollen, insect parts, skin cell
fragment, fibers and inorganic particulate. We collected six sample of viable and non-
viable particle in the training area using the quadrangle and two different samples as
background, one in the office and other in the exterior of the building.
Sampling materials
Air-O-Cell Cassette
Rotameter
Flexible Tubing
High Volume Air Pump

26
Sampling procedures
Removed and retained the tape seal covering the Air-O-Cell inlet and outlet. We
connected the pump tubing into the outlet. The sampling pump flow rate was set of 15
liter during five minutes. We removed the Air-O-Cell Cassette from the tubing and
resealed with the original tape. We placed all the samples in a plastic bag and send to
RAMS Environmental Laboratory, Inc in Miami, Florida for the Dust Characterization by
Optical Microscopy techniques.
Sampling analysis
We removed the glass slide from the Cassette. We placed the glass slide into a
microscope slide with one drop of Lacto Phenol Cotton Blue. We covered the
microscope slide with the cover slip. We conducted the counting and quantification by
counting cross-sections of the deposited trace. The particle deposit area is approximately
1.1mm wide by 14.5mm an approximate area of 15.95mm2.
Biological parameter procedure
Exposure plate
The purpose of this sampling method was to estimate the contamination level in
the study area. We conducted this sampling technique following the SOP 300-021 of
Clendo Industrial laboratories Inc. and APHA. 4th
Edition (2001). We selected Tripticase
Soy Agar (TSA) media to identify bacteria, and Rose Bengal Agar (RBA) was choosing
for the collection of fungi. The RBA is a selective medium since the antibiotic inhibits
the growth of bacteria, consequently, avoiding the contamination of the samples. We

27
placed a totally of 30 TSA plate and 30 RBA plate in different point selecting the random
samples given by the program RANDOM.ORG and the quadrangle. Two different
samples as background were also collected, one in the office and other in the conference
room. We collected one plate of TSA and RBA as negative control for sterility test
purpose.
Sampling materials
TSA plates
RBA plates
Personal Protective Equipment
Biological Waste Disposal Autoclave Bags
Incubator 30º-35ºC
Incubator 20º-25ºC
Sampling procedure
We placed the exposure plates immediately after the athletes had left the training
area. We placed all samples at 9:00 pm and removed the next day at 8:00 am in the
morning. We packed and transported all samples in a cooler to the laboratory for
analysis. We incubated all TSA plates in inverted position at 30º-35ºC for 48 hours. We
incubated also the RBA plates in inverted position at 20º-25ºC for 48 hours.
Sampling analysis
We removed all the samples from the incubator at the 48 hours due an overgrowth
in all TSA and RBA plates. We evaluated all the samples only for macroscopic
identification and counted. All the samples were disposed as biohazard material.

28
Sterile carpet test
Dermathophytes are one of the most pathogenic fungi that have been identifying
in human skin, hair or nails infections. Usually is transmitted by contact, particularly in
common showers and gym facilities. This testing is a modification of the technique
follow by Calcanti, 2002 and Bentubo 2006. We collected 30 samples in equipment were
athletes are in direct contact. We also collected one sample for sterility check purpose.
Sampling materials
2 x 2 Sterile carpet
Mycosel Agar Petri dishes
Sampling procedure
We removed the sterilized carpet from the bag and rubbed in the area of interest.
We pushed the piece of carpet into the Mycosel Agar plate and then removed from the
agar plate. After packing, we transported all the samples in a cooler to the laboratory for
analysis. We incubated all the Mycosel agar plates in inverted position at 25ºC during
four week.
Sampling analysis
We removed all the samples from the incubator when presenting sufficient growth
for identification. We evaluated all samples by their macroscopic and microscopic
morphological characteristics. For the microscopic identification, we used a slide and
cover slip mounting with Lactophenol Aniline Blue. The analysis techniques was

29
conducted following the Clendo Industrial Lab specification and different taxonomic
guide
Surface monitoring using swabs
We taked the surface samples with Tecra Enviroswabs in areas where athletes
have greater contact. This type of sample is not destructive method in evaluating the
presence of microorganisms on surface. We collected 35 samples, 33 inside the training
area and two as background, one in the office and other in the Conference Room. We
collected one swab as negative control for sterility test purpose. We conducted this
sampling technique following the SOP 300-021 of Clendo Industrial laboratories Inc. and
APHA 4th
Edition (2001). The sampling technique, sampling analysis, incubation period
were also followed the procedure that have been previously validated and approved by
the laboratory. For the specific steps in the process of isolating and identifying bacteria,
we used the Vitec 2 Compact and followed the SOP 300-008. We evaluated all the
samples for fungi identification by their macroscopic and microscopic morphological
characteristics.
Sampling materials
Trypticase Soy Agar (TSA) plates
Trypticase Soy Broth (TSB) - 10 ml
Eosin Methylene Blue (EMB) agar plates
Sterile Tecra Enviroswabs
Personal Protection Equipment
20º-25ºC incubator
30º-35ºC incubator
Rose Bengal Agar (RBA)
Lactophenol Aniline Blue

30
Sampling procedure
We labeled each swab with the date, the spot of the sample and the control
number of the laboratory. We removed each swab from the tube and pushed the tip of the
swab to the side of the tube to remove excess diluents. We rubbed the sterile swab over
the surface of a diameter that measures 2 x 2 centimeters. We placed the swab again in
its packing and sealed. We transported all Enviroswabs to the laboratory for analysis.
Sampling analysis
We worked aseptically all Enviroswabs samples in the Biological Safety Cabinet
to avoid contamination. In each Enviroswabs, we added 20 ml of Trypticase Soy Broth
(TSB). We closed each tube and swirled in the vortex during one minutes. For each
Enviroswabs sample, we used TSA plates in duplicate. In each plate, we added 1.0 ml in
duplicate and 0.1 ml in duplicate of the sample. After added the samples in each Petri
dish we added TSA using pour plate technique. We incubated all plates at 30º-35ºC for
48 hour. We counted all colonies and calculated the number of colonies recovered from
50 cm2 (equivalent to 1 ml of poured media). We re-incubated the plates at 20º-25ºC for
another 120 hours. All TSA plates were counted and then calculate the number of
colonies recovered from 50 cm2 (Colonies/50cm
2) and reported in CFU. Use appropriate
selective and differential media like EMB, Nutrient Agar, TSA and Sabouraud Dextrose
Agar and incubated as required.

31
Air sampling
The objective of this study is to capture and quantify the different cultivable
fungal and bacteria present in the air to determinate if the level present indicate a problem
in the indoor environment. The samples was taken with the instrument SAS SUPER 100,
a portable instrument that use the impaction of a medium of solid culture using Petri
dishes of 100mm. We selected TSA media to identify bacteria and RBA was choosing
for the collection of fungi. We conducted this sampling technique following the SOP
100-023 of Clendo Industrial laboratories Inc and the EMLab P & K IAQ Pocket
Reference Guide 2008. We sampled a totally of 30 TSA plate and 30 RBA plate using
SAS 100 in different point selecting the random samples given by the program
RANDOM.ORG and the quadrangle. We also collected two different samples as
background, one in the Office and other in the exterior of the building. We collected one
plate of TSA and RBA as negative control for sterility test purpose.
Sampling materials
SAS SUPER 100 Air Sampler
70% ethanol
TSA plates
RBA plates
20º-25ºC incubator
30º-35ºC incubator
Personal Protective equipment
Sampling procedure
We removed the coverlid from the Air Sampler. We inserted the contact plate
into the Air Sampler. As manufacture recommendation, the air aspiration cycle was three

32
minutes for each TSA and RBA plates. We removed the contact plate from the
instrument and replaced with the lid of the SAS. After finished each sample we
identified each contact plate with the sample ID point and the control number of the
Clendo laboratory. After finished all the samples, packed it and sent to the laboratory in
a cooler for analysis. We incubated all the samples for the specific time at the
appropriate temperature: TSA at 30º to 35ºC for 48 hours and RBA at 20º to 25ºC for 5
days.
Sampling analysis
We counted all cultivable microorganisms at the end of the incubation period and
related this number to the volume of air sampled. We made subculture of representative
isolates for identification using an appropriate selective and differential media like EMB,
Nutrient Agar, and Sabouraud Dextrose Agar. We incubated all the subcultures as
required. We identified all the bacteria with gram stain. For the specific steps in the
process of isolating and identifying bacteria, we used the Vitec 2 Compact and followed
the SOP 300-008. We evaluated for fungi identification, all the samples by their
macroscopic and microscopic morphological characteristics.
Result calculation
We applied a correction factor to each sample prior to calculation of concentration
of fungi and bacteria in each sample, expressed in CFU per cubic meter of air. We used
the Most Probable Number (MPN) given by the manufacturer for the correction factor

33
because more bacteria could be aspirate from the same hole and land on top of another
bacterium on the surface media.
Pr x 100
Example of calculation results: X =
V
Where:
V = Volume of sampled air = 200 liters of air
R = Colony Forming Units counted on “55mm Contact Plates” = 67
Pr = Probable count obtained by positive hole correction = 80
X = Colony Forming Units per 1000 liters = 1m3 of air
X = 80 x 100
200
To express the result in CFU/ft3, multiply the CFU/m
3 value by 0.02832.
(Note conversion formula = 1 cubic foot = 20.32 liters

34
CHAPTER IV
RESULTS AND DISCUSSION
During our research a series of testing, we need to conduce with the purpose to
meet our objective. Our goal is evaluate the presence of pathogenic microorganisms in
the air and the surface and Indoor Air Quality at the Caguas Gymnastic Club. The
assessment included an inspection of different areas that athletes and coaches have direct
contact, physical-chemical testing and biological testing we need to perform to present
strategy to avoid repeated contamination in the facility. We conducted this research in
three phases, in order to present our results; a detail description of the finding is presented
below.
The visual assessment was perform in the interior of the facility on June 9, 2009
including training area, office, meeting room, bathrooms, storage room, kitchen and
bleachers. We observed evidence of water intrusion evidence from the ceiling to the
front carpet area. We observed a lot of dust in the entire training area specialty in the
foam pit area and in the back carpet. We observed mold growth in the pommel horse,
wooden cubicle, beams, carpet, and mats and in the foam pit area. We observed the
presence of pigeons dropping, cats and dog excrement, cockroaches, mice and the dead of
a baby snake in front of the door close to the training area. We also observed plant debris
inside the training area specialty in the back of the gym around the back carpet and in the
foam pit area. We observed pigeon evidence in the training area.
35
Temperature and Relative humidity (% RH)
During the first phase performed on June 9, 2009, the average temperature in the
training area was 91.1ºF and the relative humidity was 52.7%. The temperature in the
office collected as background inside the building was 89.1ºF and the relative humidity
was 56.7%. The temperature in the exterior of the building collected as background was
89.6ºF and the relative humidity was 55.8% (Table 1).
During the second monitoring in the first phase performed on June 15, 2009, the
average temperature in the training area was 93.0ºF and the relative humidity was 52.3%.
The temperature in the office collected as background inside the building was 90.0ºF and
the relative humidity was 59.3%. The temperature in the exterior of the building
collected as background was 82.2ºF and the relative humidity was 55.3% (Table 1).
During the second phase performed on October 6, 2009, the average temperature
in the training area was 82.5ºF and the relative humidity was 72.6%. The temperature in
the office collected as background inside the building was 81.5ºF and the relative
humidity was 74.0%. The temperature in the exterior of the building collected as
background was 80.8ºF and the relative humidity was 74.6% (Table 1).
Carbon monoxide (CO) and Carbon dioxide (CO2)
During the first phase performed on June 9, 2009, the average Carbon monoxide
measured in the training area was 1.6ppm and the CO2 measured was 407ppm. The CO
measured in the office collected as background inside the building was 1.7ppm and the
CO2 measured was 382ppm. The CO measured in the exterior of the building collected
as background was 1.4ppm and the CO2 measured was 384ppm (Table 1).

36
During the second monitoring in the first phase performed on June 15, 2009, the
average CO measured in the training area was 2.5ppm and the CO2 measured was
542ppm. The CO measured in the office collected as background inside the building was
2.3ppm and the Carbon Dioxide measured was 618ppm. The Carbon Monoxide
measured in the exterior of the building collected as background was 2.4ppm and the
Carbon Dioxide measured was 562ppm (Table 1).
During the second phase performed on October 6, 2009, the average Carbon
Monoxide measured in the training area was 1.4ppm and the Carbon dioxide measured
was 389ppm. The Carbon monoxide measured in the office collected as background
inside the building was 1.5ppm and the Carbon dioxide measured was 388ppm. The
Carbon monoxide measured in the exterior of the building collected as background was
1.5ppm and the Carbon dioxide measured was 496ppm (Table 1).
Particulate matter (PM)
During the first phase performed on June 9, 2009, the average of PM measured in
the training area was PM0.5 = 2.22 ug/m3, PM1.0 = 7.93 ug/m
3, PM2.5 = 37.30 ug/m
3,
PM5.0 = 192.40 ug/m3, PM10 = 252.60 ug/m
3 and TPM = 298.50 ug/m
3. The average of
PM measured in the office collected as background inside the building was PM0.5 =
1.72ug/m3, PM1.0 = 6.91 ug/m
3, PM2.5 = 33.03 ug/m
3, PM5.0 = 161.18 ug/m
3, PM10 =
188.87 ug/m3
and TPM = 201.35 ug/m3. The PM measured in the exterior of the building
collected as background was PM0.5 = 1.72ug/m3, PM1.0 = 6.88 ug/m
3, PM2.5 = 32.90
ug/m3, PM5.0 = 153.56 ug/m
3, PM10 = 180.28 ug/m
3 and TPM = 189.53 ug/m
3 (Table
2).

37
During the second monitoring in the first phase performed on June 15, 2009, the
average of PM measured in the training area was PM0.5 = 1.35 ug/m3, PM1.0 = 2.98
ug/m3, PM2.5 = 12.32 ug/m
3, PM5.0 = 62.91 ug/m
3, PM10 = 87.84 ug/m
3 and TPM =
115.36 ug/m3. The average of PM measured in the office collected as background inside
the building was PM0.5 = 1.24 ug/m3, PM1.0 = 2.92 ug/m
3, PM2.5 = 12.34 ug/m
3,
PM5.0 = 63.75 ug/m3, PM10 = 87.93 ug/m
3 and TPM = 117.05 ug/m
3. The PM measured
in the exterior of the building collected as background was PM0.5 = 1.17 ug/m3, PM1.0 =
2.65 ug/m3, PM2.5 = 10.51 ug/m
3, PM5.0 = 51.42 ug/m
3, PM10 = 60.39 ug/m
3 and TPM
= 71.48 ug/m3 (Table 2).
During the second phase performed on October 06, 2009, the average of PM
measured in the training area was PM0.5 = 2.07 ug/m3, PM1.0 = 8.51 ug/m
3, PM2.5 =
39.51 ug/m3, PM5.0 = 196.82 ug/m
3, PM10 = 241.64 ug/m
3 and TPM = 260.21 ug/m
3.
The average of PM measured in the office collected as background inside the building
was PM0.5 = 1.95 ug/m3, PM1.0 = 8.02 ug/m
3, PM2.5 = 35.82 ug/m
3, PM5.0 = 167.06
ug/m3, PM10 = 191.83 ug/m
3 and TPM = 205.70 ug/m
3. The PM measured in the
exterior of the building collected as background was PM0.5 = 3.64 ug/m3, PM1.0 = 9.44
ug/m3, PM2.5 = 24.82 ug/m
3, PM5.0 = 64.48 ug/m
3, PM10 = 68.38 ug/m
3 and TPM =
76.70 ug/m3 (Table 2).
Spore trap air filter
We collected air samples using the Air-O-Cell Cassette for particle dust
characterization. During the first phase performed on June 09, 2009, were collected six
samples inside the training area (REL09219PCA-01 to REL09219PCA-06). Sample

38
REL09219PCA-07 collected in the offices as background inside the building. Sample
REL09219PCA-08 collected in the exterior of the building as background. The air
samples in the training area indicated the presence of carbonaceous materials, dust and
skin cells. The results in samples REL09219PCA-01 to REL09219PCA-06 indicated the
presence of several fungal spores being the predominant the Penicillium/Aspergillus and
Cladosporium spores. Sample REL09219PCA-07 indicated a presence of dust and skin
cells. Sample REL09219PCA-08 indicated a presence of dust (Appendix 1).
During the second phase performed on October 06, 2009, were collected six
samples inside the training area (REL09400PCA-01 to REL09400PCA-06). Sample
REL09400PCA-07 collected in the offices as background inside the building. Sample
REL09400PCA-08 collected in the exterior of the building as background. The results in
samples REL09400PCA-01 to REL09400PCA-06 indicated the presence of dust. Air
samples REL09400PCA-04 and REL09400PCA-06 indicated the presence of several
fungal spores being the predominant the Penicillium/Aspergillus and Cladosporium
spores. Air sample REL09400PCA-07 indicated a presence of dust. Sample
REL09400PCA-08 indicated a presence of dust (Appendix 2).
Exposure plate
During the first phase performed on June 09, 2009 samples of TSA and RBA
were carefully collected after has been exposure during 10 hours. The results indicated
the presence of fungi and several bacteria. Due an overloaded growing in all the TSA
and RBA plates all samples were observe for macroscopic identification. The result
indicated Too Numerous to Count for all TSA and RBA plates (TNTC) (Table 3).

39
Sterile carpet test
During the first phase performed on June 09, 2009, we carefully collected samples
with a sterile carpet. The result indicated the presence of various species of
Dermathophytes likes Microsporum ferrugineum, Microsporum cookei, Microsporum
audouinii, Trichophyton verrucosum and Epidermophyton floccosum. Other species of
fungus identified was Blastomyces dermatidis, Fonsecaea pedrosoi, Aspergillus
avenaceus, Aspergillus hollandicus, Scopulariopsis asperula, Penicillium citrinum,
Paecilomyces viridis, Phialophora reptans, Phialophora richardsiae, Phialophora
verrucosa, Cladosporium cladosporoide, Scytalidium infestans, Polypaecilum insolitum,
Candida albicans and Histoplasma capsulatum (Table 4 and Appendix 3).
During the second phase performed on October 06, 2009, were collected the
sterile carpet test followed by the cleaning and disinfestations of the CGC. The result
indicated no growth of fungi in all Mycosel Agar plates after 21 days of incubation
period.
Surface monitoring using swab
During the first phase performed on June 15, 2009, were carefully collected
samples with Tecra Enviroswabs. The result indicated the presence of various species
bacterias. The most common pathogenic bacteria found with the Enviroswabs were
Micrococcus lylae, Sphingomonas paucimobilis, Brevibacillus choshinensis,
Staphylococcus epidermidis and Kocurria kristinae (Table 5 and Appendix 4).
During the second phase performed on October 6, 2009, were collected
Enviroswabs samples followed by the cleaning and disinfestations of the CGC. The

40
result demonstrated that the process of cleaning and disinfection was effective with a
cleaning efectivity of 97.44%.
Air sampling
During the first phase performed on June 15, 2009, were collected air samples
using SAS instrument. The result indicated the presence of various species of
microorganisms. The most common pathogenic fungi founded in Air sampling was
Aspergillus niger, Aspergillus avenaceus, Aspergillus clavatus, Acremonium curvulum,
Curvularia clavata and Penicillium chrysogenum (Table 6). The most common bacteria
were Staphylococcus haemolyticus, Staphylococcus saprophyticus, Pantoea spp.,
Klebsiella pneumoniae, Bacillus megaterium and Staphylococcus epidermidis (Table 7
and Appendix 5).
During the second phase performed on October 06, 2009, were collected air
samples followed by the cleaning and disinfestations of the CGC. The result
demonstrated that the process of cleaning and disinfestations was effective with a
cleaning efectivity of 80% (Figure 3 and Figure 4).
Discussion
At this moment, there are no state of federal regulation for fungi, bacteria and
indoor air quality standards. The industrial hygiene profession and ASHRAE have
recommended airborne concentrations of one-tenth the ACGIH Threshold Limit Value
(TLV). This limit of concentrations will not produce compliance in non-industrial
populations such schools, offices and others public buildings.

41
Temperature and Relative humidity (%RH)
Air temperature and relative humidity are measure to assess thermal comfort and
the possibility of mold growth. According to ASHRAE Standard 55, indoor air humidity
levels should be maintain between 30 and 65 percent for optimum comfort and the
temperature should be kept at 70º to 76ºF.
After been evaluated the result during three different days, the average
temperature measured was 88.8ºF and the relative humidity 59.2% in the training area.
These results are above the recommending limit and the results were consistent with the
background measurements obtained from the exterior of the building. The relative
humidity in the training area is between the recommending limits and was consistent with
the background.
Carbon monoxide (CO) and Carbon dioxide (CO2)
Carbon monoxide is a colorless, odorless, and tasteless gas. It results from
incomplete oxidation in combustion. Auto, truck or bus exhaust from attached garages,
nearby roads, or parking areas can also be a source. No standards for CO have agreed for
indoor air. The US National Ambient Air Quality Standards for outdoor air are 9ppm
(40,000ug/m3) for eight hours, and 35ppm for one hour. The Carbon monoxide
measurements were below the permissible exposure limit during our study.
Carbon dioxide (CO2) is a colorless, odorless product of carbon combustion.
Human metabolic processes and all combustion processes of carbon fuels are sources of
CO2. Exhaled air is usually the largest source of CO2. ASHRAE Standard 62
recommends an indoor level not to exceed about 700ppm above outdoor ambient air,

42
which is typically between 300 to 400ppm. The Carbon dioxide measurements result
were below the permissible exposure limits during our study.
Particulate matter (PM)
There are currently no federal government standards for PM2.5 in indoor air
environments. The annual limit in National Ambient Air Quality Standards list is 15
ug/m3 and 65 ug/m
3 is known as the 24-hours limit for PM2.5 in indoor air. The
particulate matter in homes are related to carpet and clothing fibers, dust and dirt tracked
into the home by its occupants, particles from food preparation, insect parts, plants, etc.
These particles can cause symptoms such asthma, cardiac function and allergies in
people, especially young children.
The result of particulate matter indicated an increase in all size range compared
with the background samples from the exterior of the building. This size range of
abnormal particles can be an indicator of potential risk for athletes and coaches inside the
CGC.
Spore trap air filter
Spore trap samplers are capable of capture viable and non-viable fungal spores
present in air. This sampler technique also captures particulate matter; quantify pollen,
fiberglass, hair, skin cells, and hyphae fragments among others. If use this technique
alone may miss a potential indoor air quality problem. That is why in our study we use
cultivable samples and non-cultivable samples with the purpose to compare results.

43
The analytical result obtained from RAMS Environmental Laboratory, Inc in
Miami, Florida for dust characterization by Optical Microscopy techniques indicated the
presence of several fungal spore were the most predominant are Aspergillus, Penicillium
and Cladosporium spp. These results are consistent with the cultivable samples using
SAS instrument. During the visual inspection, we observed dust accumulation
throughout the training area especially around the foam pit and the back rug. These
finding are consistent with the dust characterization result. The results indicated the
presence of dust, carbonaceous material and skin cell. After the cleaning and
disinfestations process, the result obtained from the spore trap sampler indicated that the
quantity of carbonaceous material, skin cell and fungal spore was decreasing
significantly. Good housekeeping practices can lower the levels of the skin cell in indoor
environment. However, at the same time, the quantity of dust are both >800. We
observe during the cleaning process all the windows were close and actually are still
close. The problem of bad ventilation in addition to maintain close window in the
training area do not allow that the particulate going out the building.
Exposure plate
The purpose of this sampling technique was estimate the contamination in the
study area. The results obtained in a short incubation period allow us to create strategy
for obtain accurately results and avoid technical mistake in the laboratory.

44
Sterile carpet test
This kind of testing is very uncommon for the indoor air quality specialist.
Dermathophytes are the only fungus that has evolved in a dependency of human body
that is why is very common to produce coetaneous infections in peoples. This group is
composed of three genera (Microsporum, Trichophyton and Epidermophyton). During
our study, we identified different species for each genus. We performed after the
cleaning and disinfestations process in CGC a second monitoring of sterile carpet test.
The sterile carpet test results indicate that no evidence of Dermathophytes after 21 days
of incubation period.
Surface monitoring using swabs
There are no governmental or federal regulations concerning permissible level of
fungi and bacteria. The result obtained from this testing indicated that 98% of the total
microorganisms founded in CGC was bacteria and 2% fungi (Figure 7). For the bacteria
identification, we used the Vitec Senior Model 120. Before the identification, we need to
have confirmed Gram stain from isolated colonies in purity plates. The result indicated
that the most common pathogenic bacteria found with the Enviroswabs are Gram-positive
bacteria. Micrococcus lylae, Brevibacillus choshinensis, Sthaphylococcus epidermidis
and Kocurria kristinae are Gram-positive bacteria. Most pathogenic bacteria in humans
are Gram-positive microorganisms. Two of these groups are Streptococcus and
Staphylococcus. Sphingomonas paucimobilis is Gram-negative bacteria. Gram-negative
bacteria are associated with nosocomial infections.

45
Air sampling
Actually there are none federal and governmental regulation concerning
permissible levels of fungi and bacteria in indoor air. All the resent standards and
guidelines range from 200cfu/m3 is an acceptable level for indoor environments. The
ACGIH have guidelines that less than 500cfu/m3 is acceptable for certain species except
for pathogenic species.
During our study, the 60.4% of the microorganisms identified were fungi and
39.6% bacteria (Figure 8). We identified 13 different fungi and 12 different bacteria.
The most common pathogenic fungi are Aspergillus spp. These results are consistent
with the spore trap technique. Aspergillus and Penicillium spp was the most common
fungi identified in spore trap sampler. Aspergillus spp. has been associate with
Aspergillosis, human carcinogenicity and be involved in respiratory cancers among food
and grain workers. The result indicated that the most common pathogenic bacteria found
in air samples are Gram-positive bacteria, for example Sthaphylococcus haemolyticus,
Sthaphylococcus saprophyticus, Sthaphylococcus epidermidis and Bacillus megaterium.
The Gram-negative bacteria are Pantoea spp. and Klebsiella pneumonia.
Sthaphylococcus epidermidis is a human commensal bacterium. An increase number of
human commensal bacteria in indoor environment may indicate high occupant density
and poor ventilation; this situation may suggest an environment where airborne
pathogens can be more easily spreader from person to person.

46
Risk communication plan
After the Caguas Gymnastic Club was monitored, evaluated and analyzed, we
requested a meeting with Mr. Francisco, Director of the Department of Recreation and
Sport in the Caguas municipality, in August 2010. In this meeting we discuss the results
obtained on our study and some recommendations were given to him regarding a
periodical disinfection plan and cleaning program of the facility (Appendix 7). This
document was worked in Spanish because the people that would use this document, the
first language is Spanish. The information gathered also should be shared with athletes,
coaches and visitors public health specialist, empowering them with health information
vital for everyone wellbeing.
47
CHAPTER V
CONCLUSIONS AND RECOMMENDATIONS
The gymnastics is a high-risk sport. Cuts and abrasion are inevitable for
gymnastics athletes creating an elevated risk of infectious disease spread by skin-to-skin
contact and contaminated equipment shared by athletes. Gymnastic mats, bars, beams,
pommel horse and carpet are constant sweated increasing the environment for the growth
of pathogenic microorganisms. The Caguas Gymnastic Club was builder in 1972. At the
beginning the facilities was for volleyball court. For this purpose the airflow, need to be
controlling for the practice of this sport. During our study, we identify the lack of airflow
using the Drager Rohrchen air tube. The Caguas Gymnastic Club is a facility with high
traffic of children during six day a week. During the visual assessment we can observed
a lack of cleaning inside the training area.
Our results demonstrate a lot of dust, skin cell, particulate matter, fungi and
bacteria inside the training area. The temperature levels in the facilities exceed the
recommended by ASHRAE standards 55-2204. The Particulate matter result could be an
indicator of potential risk health effect. The monitory before mitigation process revealed
the presence of Dermathophytes and pathogenic microorganisms in the air and the
surface that could pose a heath hazard to those in the facilities. The monitory after
mitigation process demonstrated that the microbial remediation was effective. With a
cleaning efectivity of Enviroswabs test = 97.44%, SAS air sampling = 80% and Sterile
carpet test = 100%. After the mitigation process was performed a statistically significant
difference (P-value = 0.000) between the number of cultivable bacteria and fungi before

48
and after the process was detected. Indicating that the process is effective in dismissing
bellow the public health concerns the number of potential pathogenic microorganism in
the Caguas Gymnastic Club.
With an effective method of cleaning and disinfestations of the facility we can
made the microbiology remediation for Caguas Gymnastic Club. The use of an
antimicrobial product (Trimethoxysilyl Quaternary Ammonium Chloride) H.E.L.P
Technologies we can prevent the presence of a broad spectrum of microorganisms during
approximately 90 days. With a good cleaning monitoring and good housekeeping
practice, we can prevent the risk to the health of the children and coaches that use the
facility.
To avoid repeated contamination we have a series of recommendations for the
facilities. Is important performs a general cleaning of Caguas Gymnastic Club at least
two times on a year. We recommended cleaning the carpet every six months. We
recommended the fumigation each two weeks. The training area must be clean every day
using Microban Disinfectant Cleaner. We highly recommended the application of
XMICROBE Neutral Disinfectant Cleaner and the XMICROBE Antimicrobial-Biostatic
Agent each three month. Install window screens in the training area and the side doors to
avoid the entrance of insects and organic materials debris. Install nets in bars to avoid the
entrance of dove. Install ceiling fan in the training area.
We have a series of limitation during our study. The Risk Communication Plan
will be performed by specialized personnel, A lack of money don’t give the opportunity
to make other testing like Mycotoxins, Endotoxins, Fungal glucan, Fungal ergosterol,
microbial volatile organic chemicals, allergens and pollens. Those testing have been use

49
like indicator because the identification of a fungus and bacteria is not necessary proving
the presence of Mycotoxins, bioactive agent associated with fever, flu symptoms and
other respiratory illness; study the assess fungal biomass, allergic symptoms among
others.
This study has the opportunity to other student follow our investigation with the
purpose to evaluate the athletes and coaches of this facility. Is important to perform an
epidemiologic survey to evaluate if athletes or coaches have been present symptoms or
conditions associate with the microorganisms founded during our research.
We know that the microorganisms found during our study have a potential risk of
infection for athletes and coaches in Caguas Gymnastic Club. The lacks of Standards and
Guidelines for indoor environments do not give us the opportunity to evaluate the
dose/responds and the exposition to humans. It is very important that the local agency
and the Department of Sport create a cleaning and disinfection plan for all sports facilities
to avoid bacterial and fungal infections acquired in athletic settings, including ringworm,
athlete’s foot, community acquired Methicillin-resistant Staphylococcus infection
(MRSA), herpes and impetigo.

50
CITED LITERATURE
Abelsohn, A., Stieb, D., Sanborn, MD. & Weir, E. (2002). Identifying and managing
adverse environmental health effects. Outdoor Air Pollution, 166(9): 241-248.
American Academy of Allergy, Asthma and immunology [AAAI]. (1998). Pollen and
spore report. Clearing the Air: Asthma and Indoor Air Exposures.
American Lung Association [ALA]. (2008). Trends in asthma morbidity and Mortality.
Retrieved from http:www.Ingusa.org/pub/minority/mldd.
Barlett, P., Martin, R. & Cahill, B. (1982). Furunculosis in a high school football team.
The American Journal of Sport Medicine, 10: 371-374.
Bentubo, H., Fedullo, J., Correa, S., Teixeira, R. & Coutinho, S. (2006). Isolation of
Microsporum gypseum from the hair coat of health wild felids kept in captivity in
Brazil. Brazilian Journals of Microbiology, 37: 148-152.
Brandi, G., Sisti, M., Paparini, A., Gianfranceschi, G., Schiavano, G., De Santi…
Romanospica, V. (2007). International Journal of Environmental Heath, 17(3): 197-
2006.
Brasel, T., Martin, J., Carriker, C., Wilson, S. & Straus, D. (2005). Detection of Airborne
Stachybotrys Chartarum Macrocyclic Trichothecene Mycotoxins in the Indoor
Environment. Applied Environmental Microbiology, 71(11):7376-7388.
Cavalcanti, J., Guerra, J., Gambale, W., Correa, B. & Paula, C. (2002). Histopathologic
and mycologic aspect of experimental infections of guinea pigs with Microsporum
canis. Brazilian Journals Veterirnary, 39(5): 238-243.
Chin, J. (2001). El control de las enfermedades transmisibles: Informe Oficial de la
Asociación Estadounidense de Salud Pública. 17th
Ed. Washington, DC: PAHO.
Published by: Pan American Health Organization.
Clifford, M., Juntfeng, Z., Torben, S., Matti, J., Paul, L., Samson, R. & Meryl, K. (2007).
Current State of the Science: Health Effects and Indoor Environmental Quality.
Environmental Health Perspectives, 115(6): 1-8.
Cummins, S. & Jackson, R. (2001). The build environment and children’s health.
Pediatric Clinical North America, 48:1241-1252.
Departamento de Recreación y Deportes. (1980). Ley Orgánica del Departamento de
Recreación y Deportes. 13 de junio de 1980. LPRA 3 442 et seq.

51
Departamento de Salud. (1912). Ley del Departamento de Salud de Puerto Rico del 14
de mayo de 1912; (Enmendada en el 1976, Ley 13; 1977, Ley 126) LPRA 3 secc.
171 y ss.
Dillon, K., Miller, D., Sorenson, W., Douwes, J. & Jacobs, R. (1999). Review of methods
applicable to the assessment of mold exposure to children. Environmental Health
Perspectives, 107: 1-9.
Dixon, J. (2002). Kids need clean air. Air pollution and children’s health, family and
community. 24(4): 9-26.
EMLab P & K (2008). Indoor Air Quality Pocket Reference Guide. (2nd
Ed). Test
America.
Environmental Protection Agency. (1990a). Clean Air Act Extension of 1970. 42 U.S.C.
s/s 7401 et seq. (1970). Retrieved from http://www.epa.gov/air/caa/.
Environmental Protection Agency. (1990b). National Ambient Air Quality Standards.
Retrieved from http://www.epa.gov/ttn/naaqs/
Environmental Protection Agency. (1995a). Indoor air pollution. A self-peaced learning
module. (EPA 402-K-95-001). Washington, DC: US.
Environmental Protection Agency. Indoor Environments Division. Indoor Air Quality
Tools for Schools.
Environmental Protection Agency. (1995b). A guide to indoor air quality. (EPA 402-K-
93-007). Washington, DC: US Environmental Protection Agency. Indoor
Environments Division, Indoor Air Quality Tools for Schools.
Environmental Protection Agency. (1997). Una breve guía para el moho y la humedad en
su hogar. Retrieved from www.epa.gov/iaq/mold/moldguide.html.
Febles, M. & Fanny, S. (2000). Immunology of the bacteria. The Wall Street Journal’s
Americas, 3: 2-11.
Fischer, G. & Dott, W. (2003). Relevance of airborne fungi and their secondary
metabolites for environmental, occupational and indoor hygiene. Environmental and
occupational Medicine, 179: 75-82.
Global Health Alliances. (2002). Developing successful global health alliances. Seattle,
WA. Retrieved from http://www.gatesfoundation.org/nr/downloads/gobal/health/Gl
obalHealthAlliqnces.pdf
Godish, T. (2003). Air quality (4th
Ed). United States of America: Lewis Publishers.

52
Hakonarson, H. & Halapi, E. (2002). Genetic analyses in asthma: current concepts and
future directions. American Journals of pharmacogenomics, 2(3): 155-166.
Jacobs, D. & Baeder, A. (2005). Housing intervention and health. Indoor Environmental
Quality, 5: 6-17.
Koren, H. & Bisesi, M. (2008). Environmental Problems and Human Health. Handbook
of Environmental Heath, Biological, Chemical and Physical Agent on
Environmentally Related Disease, (1), 79-85.
Koschel, D., Stark, W., Karmannf, A., Sennekamp, J. & Muller-Wening, D. (2005).
Extrinsic allergic alveolitis caused by misting fountains. Respiratory Medicine, (99),
943-947.
Kuhn, D. & Ghannoum, M. (2003). Indoor mold, toxigenetic fungi, and stachybotrys
chartarum: infectious disease perspective. Clinical Microbiology, (16): 144-172.
Leah, E., Bodager, D. & Ginzl. D. (2008). Outbreak of Giardiasis and Cryptosporidiosis
Associated with a Neighborhood Interactive Water Fountain. Journal of
Environmental Health, 71(3)
Lemmo, W., Kevin, W., Wang, A. & Andrew, K. (1996). Real Time Assessment of
Biomarkers for Disease. University of Florida Research Foundation, Inc.
Liu, L., Box, M., Kalman, D., Kaufman, J., Koenig, J., Larson, T.,…Wallace, L. (2003).
Exposure Assessment of Particle matter for Susceptible Population in Seattle.
Environmental Health Perspectives, 111(7): 909-918.
Maynard, R., Krewski, D., Burnett, T., Samet, J., Brook, R., Granville, G. & Craig, L.
(2003). Health and Air Quality: Directions for Policy-Relevant Research. Journal of
Toxicology and Environmental Health, 66, 891- 903.
Menzies, D., Comtois, P., Pasztor, J., Nunes, F. & Hanley, A. (2003). Aeroallergens and
work –related respiratory symptoms among office worker. Allergy Clinic
Immunology, 94(4): 38-44.
Morey, P., Hudson, M., Sorenson, W., Kullmann, G., Rhodes, W. & Visvesvara, G.
(1984). Environmental studies in moldy office buildings: Biological agents, sources
and preventative measures. Annual Conference of Government Industrial Hygiene,
(10), 21-35.
National Environmental Policy Act (NEPA). (1970). 42 U.S.C. s/s 4321-4347 et seq.
National Research Council: Committee of Air Quality Management in the EU, Board on
Environmental Studies and Toxicology. (2004). Air Quality Management in the
United States. ISBN 0-309-08932-8. Washington, D.C.: Valerie Chase.

53
Nazario, S., Torres-Palacios, J., Rodríguez, A., Delamater, W., Aplegate, A., Pediemonte,
E. & Wanner, G. (2004). Parent reported asthma in Puerto Rican children’s.
Pediatric Pulmunology, 37(5): 453-460.
Nazaroff, W. (2004). Indoor particle dynamics. Indoor Air, 14(7): 175-183.
Newson, A., Schidcrout, J. & Kaufman, J. (2004). Effect of ambient Air Pollution on
Pulmonary Exacerbations and Lung Function in Cystic Fibrosis. American Journal
of Respiratory and Critical Care Medicine, (169): 816-821.
Office of Environmental Health, Department of Health and the Police of Puerto Rico.
(1993). Law to Regulate the Practice of Smoking in Certain Public Place and Private
of August 3, 1993. LPRA 24 sec.891.
Poisson, D., Rousseau, D., Defo, D. & Esteve, E. (2005). Outbreak of tinea corporis
gladiatorum, a fungal skin infection due a Trichophyton tonsurans, in a French high-
level judo team. Euro Surveillance, 10(9):187-190.
Pope, A. & Patterson, R. (1993). Assessing and Controlling Adverse Health Effects.
Indoor Allergens, 144:668-674.
Rentas, A., Gonzales, A. & Vélez, C. (2009). Isolation and identification of airborne
fungi that can cause asthma: a case study from Eastern Puerto Rico. International
Journal Environmental Technology and Management, (10): 243-259.
Reyes, R., Rosario. O., Rodríguez, J. & Jiménez, B. (2000). Toxic evaluation of organic
extracts from APM in Puerto Rico. Environmental Health Perspectives, 108(7):635-
640.
Rihn, A., Michaels, M. & Harner, C. (2005). Community- Acquired Methicillin –
Resistant Staphylococcus aureus. The American Journal of Sport Medicine,
(33):1924-1929.
Samet, M., Splender, G. & Mitchell, C. (1998). Indoor air pollution. Environmental and
Occupational Medicine, 1523-1537.
Sexton, K. & Dyer, R. (2004). Indoor air and human health. (2nd
Ed). USA: CRC Press.
Shannon, W., Binns, H. & Johnson, C. (2004). Ambient air pollution. Health Hazards to
Children Pediatrics, 114(6): 1699-1707.
Sherry, E. & Wilson, S. (2002). El impétigo en deportes de contacto. Manual Oxford de
Medicina Deportiva. Publicación Barcelona: Editorial Paidotribo.
54
Sumedha, J. (2008). The sick building syndrome. (Review Article) (Clinical Report).
Indian Journal of Occupational and Environmental Medicine.
University of Michigan Health System. (2004). Potentially dangerous staph infections
spreading. Retrieved from www.med.umich.edu/opm/newspage/2004/hmmrsa.htm.
University of Dubuque. (2008). Infectious disease. Retrieved from
http://www.dbq.edu/medicalservices/InfectiousDesease.cfm.
Weetman, F. & Mumby, J. (1994). Categories of adverse health effects from indoor air
pollution. Indoor and Built Environment, 3: 200-212.
World Health Organization. (2002). Environmental risk factor. Congress of Expert
Committee on Biological Standardization. Geneva, Switzerland.

55
TABLES

56
Table 1. Physical characteristics of the facilities during the first, second and third monitory
Id
point Date Temp (ºF) RH% CO CO2
1 Jun 09 Jun 15 Oct 06 92.0 82.8 93.8 51.8 74.5 49.9 1.7 2.9 1.3 398 460 382
2 Jun 09 Jun 15 Oct 06 92.0 82.6 94.1 51.5 72.5 49.5 1.8 2.6 1.1 390 546 378
3 Jun 09 Jun 15 Oct 06 92.7 82.4 93.1 51.5 73.6 51.7 1.8 2.3 1.3 497 690 376
4 Jun 09 Jun 15 Oct 06 90.7 82.2 93.2 52.6 72.4 53.1 1.5 2.6 1.7 380 503 393
5 Jun 09 Jun 15 Oct 06 89.8 82.4 92.3 52.7 72.3 54.9 1.5 2.6 1.2 385 570 392
6 Jun 09 Jun 15 Oct 06 88.9 82.8 91.8 56.1 70.2 55.0 1.6 2.0 1.7 395 484 411
Bkg 1 Jun 09 Jun 15 Oct 06 89.1 81.5 90.0 56.7 74.0 59.3 1.7 2.3 1.5 382 618 388
Bkg 2 Jun 09 Jun 15 Oct 06 89.6 80.8 82.2 55.8 74.6 55.3 1.4 2.4 1.5 384 562 496
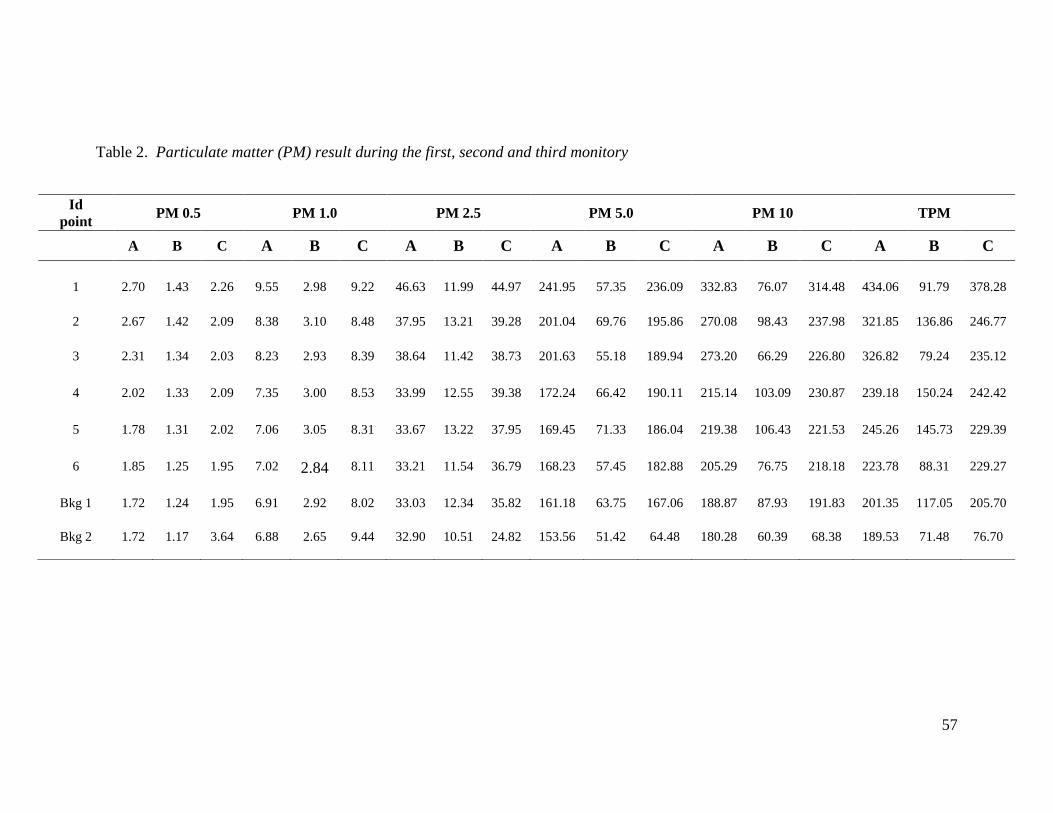
57
Table 2. Particulate matter (PM) result during the first, second and third monitory
Id point
PM 0.5 PM 1.0 PM 2.5 PM 5.0 PM 10 TPM
A B C A B C A B C A B C A B C A B C
1
2.70
1.43
2.26
9.55
2.98
9.22
46.63
11.99
44.97
241.95
57.35
236.09
332.83
76.07
314.48
434.06
91.79
378.28
2
2.67
1.42
2.09
8.38
3.10
8.48
37.95
13.21
39.28
201.04
69.76
195.86
270.08
98.43
237.98
321.85
136.86
246.77
3
2.31
1.34
2.03
8.23
2.93
8.39
38.64
11.42
38.73
201.63
55.18
189.94
273.20
66.29
226.80
326.82
79.24
235.12
4
2.02
1.33
2.09
7.35
3.00
8.53
33.99
12.55
39.38
172.24
66.42
190.11
215.14
103.09
230.87
239.18
150.24
242.42
5
1.78
1.31
2.02
7.06
3.05
8.31
33.67
13.22
37.95
169.45
71.33
186.04
219.38
106.43
221.53
245.26
145.73
229.39
6
1.85
1.25
1.95
7.02
2.84
8.11
33.21
11.54
36.79
168.23
57.45
182.88
205.29
76.75
218.18
223.78
88.31
229.27
Bkg 1
1.72
1.24
1.95
6.91
2.92
8.02
33.03
12.34
35.82
161.18
63.75
167.06
188.87
87.93
191.83
201.35
117.05
205.70
Bkg 2
1.72
1.17
3.64
6.88
2.65
9.44
32.90
10.51
24.82
153.56
51.42
64.48
180.28
60.39
68.38
189.53
71.48
76.70

58
Table 3. Exposure plate result
Sample
Id
TSA plate
(#CFU)
RBA plates
(#CFU)
Sample
Id
TSA plates
(CFU)
RBA plates
(#CFU)
109 TNTC TNTC 64 TNTC TNTC
34 TNTC 271 88 TNTC TNTC
100 TNTC TNTC 14 TNTC TNTC
85 TNTC TNTC 47 TNTC TNTC
124 TNTC TNTC 125 TNTC TNTC
114 TNTC TNTC 37 TNTC TNTC
127 TNTC TNTC 132 90 TNTC
29 TNTC TNTC 68 TNTC TNTC
102 TNTC TNTC 17 TNTC TNTC
43 TNTC TNTC 6 TNTC TNTC
105 TNTC TNTC 75 TNTC TNTC
26 TNTC TNTC 38 TNTC TNTC
16 96 TNTC 61 TNTC 81
52 TNTC TNTC 1 TNTC TNTC
90 TNTC TNTC Bkg 1 60 171
12 TNTC TNTC Bkg 2 TNTC TNTC
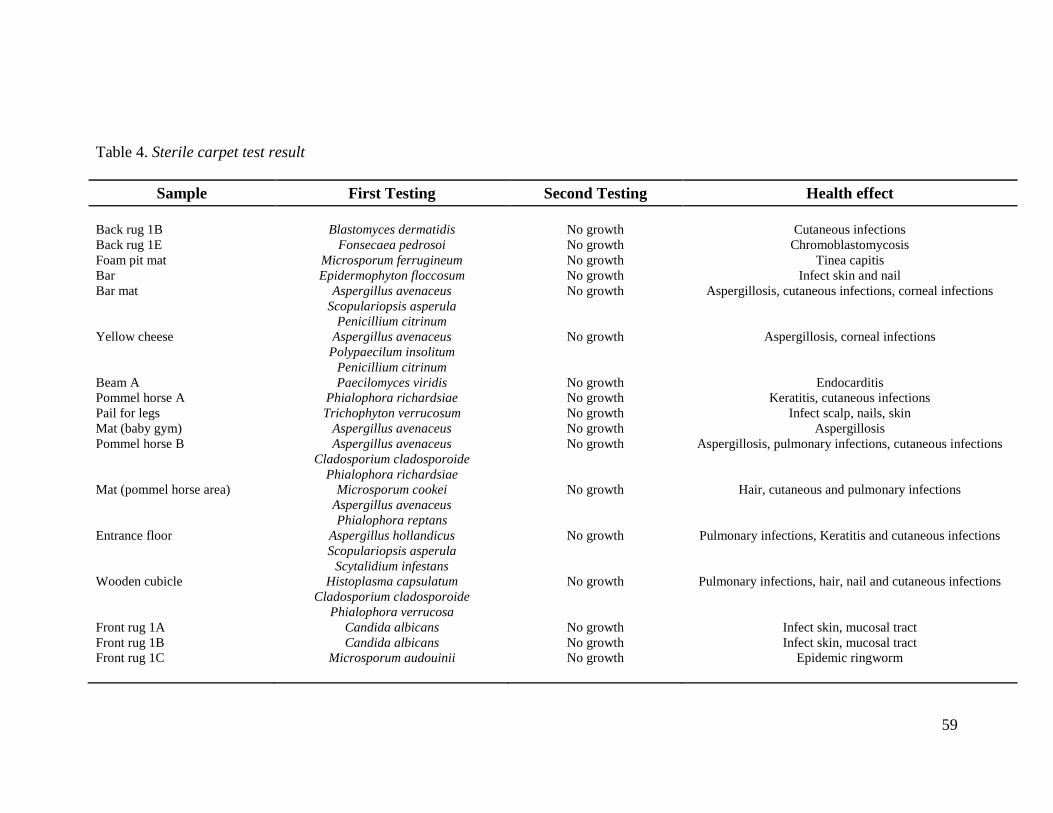
59
Table 4. Sterile carpet test result
Sample First Testing Second Testing Health effect
Back rug 1B
Blastomyces dermatidis
No growth
Cutaneous infections
Back rug 1E Fonsecaea pedrosoi No growth Chromoblastomycosis
Foam pit mat Microsporum ferrugineum No growth Tinea capitis
Bar Epidermophyton floccosum No growth Infect skin and nail
Bar mat Aspergillus avenaceus
Scopulariopsis asperula
Penicillium citrinum
No growth Aspergillosis, cutaneous infections, corneal infections
Yellow cheese Aspergillus avenaceus
Polypaecilum insolitum
Penicillium citrinum
No growth Aspergillosis, corneal infections
Beam A Paecilomyces viridis No growth Endocarditis
Pommel horse A Phialophora richardsiae No growth Keratitis, cutaneous infections
Pail for legs Trichophyton verrucosum No growth Infect scalp, nails, skin
Mat (baby gym) Aspergillus avenaceus No growth Aspergillosis
Pommel horse B Aspergillus avenaceus
Cladosporium cladosporoide
Phialophora richardsiae
No growth Aspergillosis, pulmonary infections, cutaneous infections
Mat (pommel horse area) Microsporum cookei
Aspergillus avenaceus
Phialophora reptans
No growth Hair, cutaneous and pulmonary infections
Entrance floor Aspergillus hollandicus
Scopulariopsis asperula
Scytalidium infestans
No growth Pulmonary infections, Keratitis and cutaneous infections
Wooden cubicle Histoplasma capsulatum
Cladosporium cladosporoide
Phialophora verrucosa
No growth Pulmonary infections, hair, nail and cutaneous infections
Front rug 1A Candida albicans No growth Infect skin, mucosal tract
Front rug 1B Candida albicans No growth Infect skin, mucosal tract
Front rug 1C Microsporum audouinii No growth Epidemic ringworm

60
Table 5. Most common pathogenic bacteria found with the Enviroswabs
Microorganisms Gram stain Human health effect
Micrococcus lylae Gram-positive Meningitis, Endocarditis
Sphingomonas paucimobilis Gram-negative
Bacterial infection of the
bloodstream
Brevibacillus choshinensis Gram-positive
Keratitis, urinary tract
infections
Sthaphylococcus
epidermidis
Gram-positive Endocarditis
Kocurria kristinae Gram-positive
Bacterial infection of the
bloodstream

61
Table 6. Most common pathogenic fungi found in air sampling
Microorganisms Human health effect
Aspergillus niger
Aspergillosis, human carcinogenicity
Penicillium chrysogenum
Potential hazard for human
Aspergillus avenaceus
Opportunistic invaders that cause
Aspergillosis
Aspergillus clavatus
Opportunistic invaders that cause
Aspergillosis
Acremonium curvulum
Corneal infection, and nail infection
Curvularia clavata
Chronic allergic sinusitis with cerebral
involvement

62
Table 7. Most common pathogenic bacteria found in air sampling
Microorganisms Gram stain Human health effect
Sthaphylococcus
haemolyticus
Gram-positive
Conjunctivitis, infection in
urinary tract
Sthaphylococcus
saprophyticus
Gram-positive
Acute urinary tract
infections
Pantoea spp.
Gram-negative
Opportunistic pathogen
Klebsiella pneumoniae
Gram-negative
Respiratory tract infections
Bacillus megaterium
Gram-positive
Involved in opportunistic
infections
Sthaphylococcus
epidermidis
Gram-positive
Opportunistic pathogen

63
FIGURES

64
Fig
ure
1. A
eria
l photo
of
Cag
uas
Gym
nas
t C
lub
.

65 F
igure
2. T
rain
ing a
nd s
ampli
ng a
rea
of
Cag
uas
Gym
nas
tic
Clu
b.
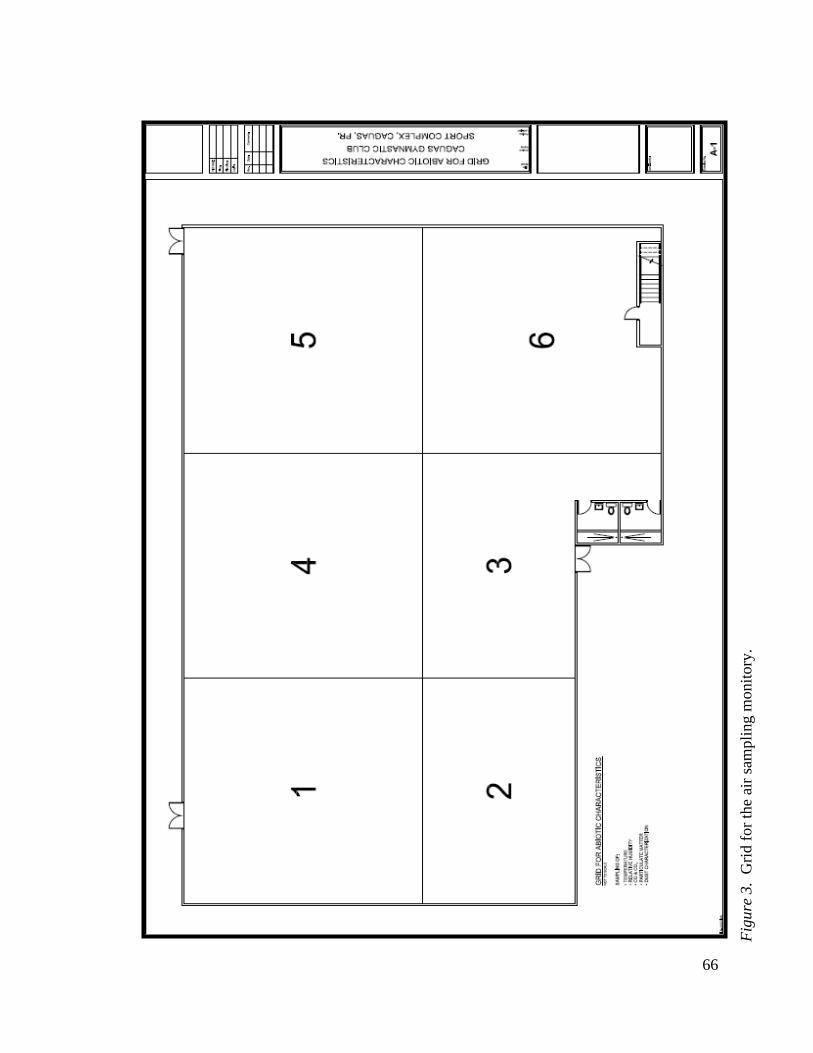
66
Fig
ure
3. G
rid f
or
the
air
sam
pli
ng m
onit
ory
.
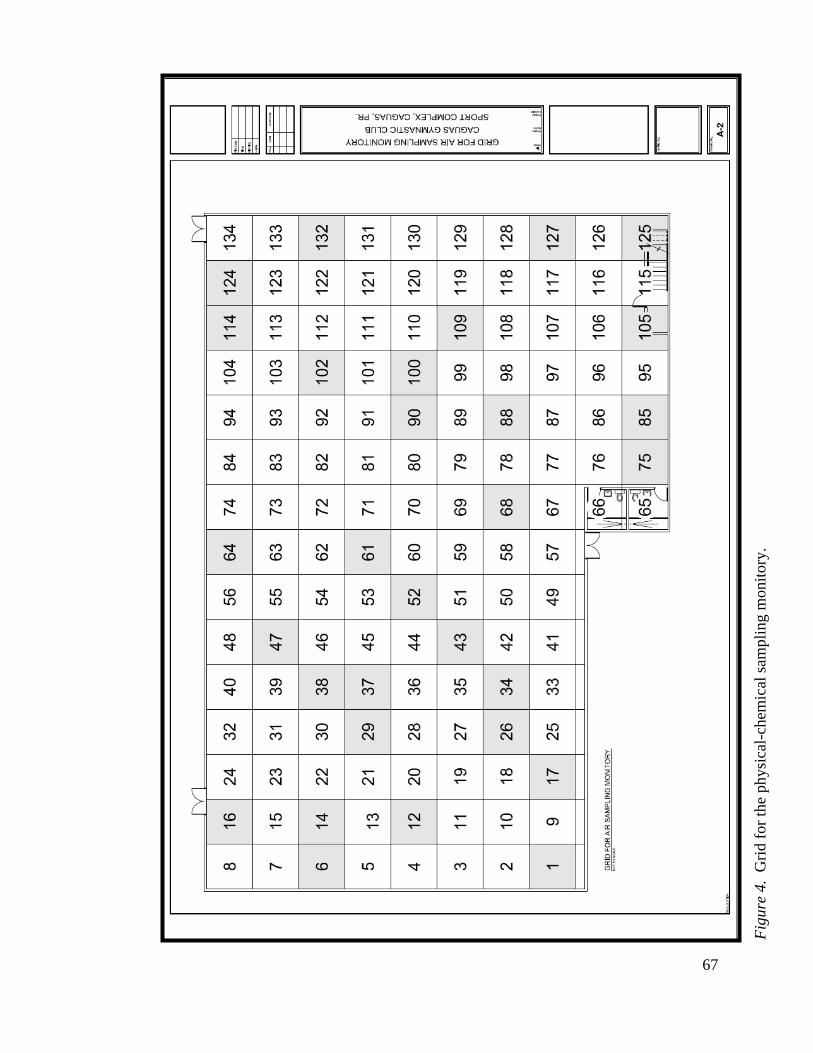
67
Fig
ure
4. G
rid f
or
the
ph
ysi
cal-
chem
ical
sam
pli
ng m
onit
ory
.

68
Fig
ure
5. B
acte
ria
air
sam
pli
ng r
esult
bef
ore
and a
fter
mit
igat
ion p
roce
ss.

69
Fig
ure
6. Y
east
and m
old
air
sam
pli
ng r
esult
bef
ore
and a
fter
mit
igat
ion p
roce
ss.

70
2%
98%
Fungi and Bacteria Proportion During the First Enviroswabs Monitory
fungi bacteria
Figure 7. Proportion of fungi and bacteria after the first Enviroswabs monitory.

71
60%
40%
Fungi and Bacteria Proportion During the First Air Sampling Monitory
Fungi 60.4% Bacteria 39.6%
Figure 8. Proportion of fungi and bacteria after the first air sampling.

72
APPENDIX

73
Appendix 1. Particle Dust Characterization Analytical Result First Monitory

74

75

76
Appendix 2. Particle Dust Characterization Analytical Result Second Monitory

77

78

79
Appendix 3. Sterile Carpet Analytical Report (#10554)

80

81

82

83

84

85

86

87

88
Appendix 4. Enviroswabs Analytical Report
(# 10558, #10559)

89

90
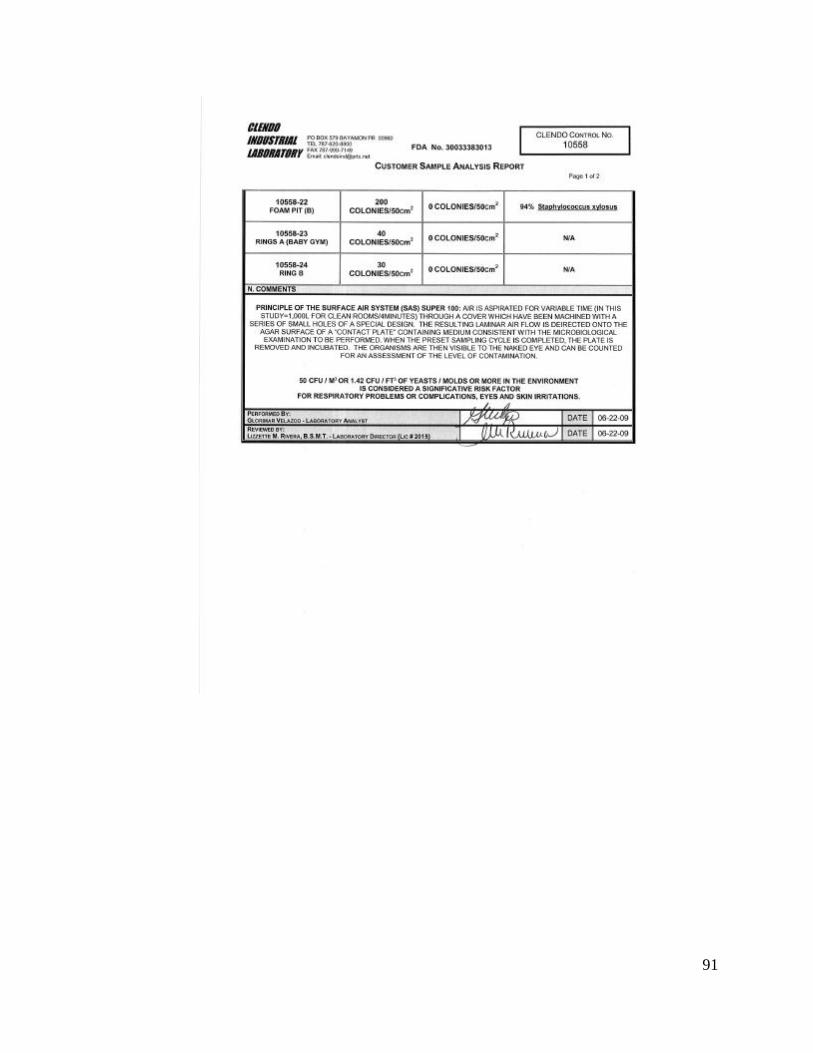
91

92
93

94
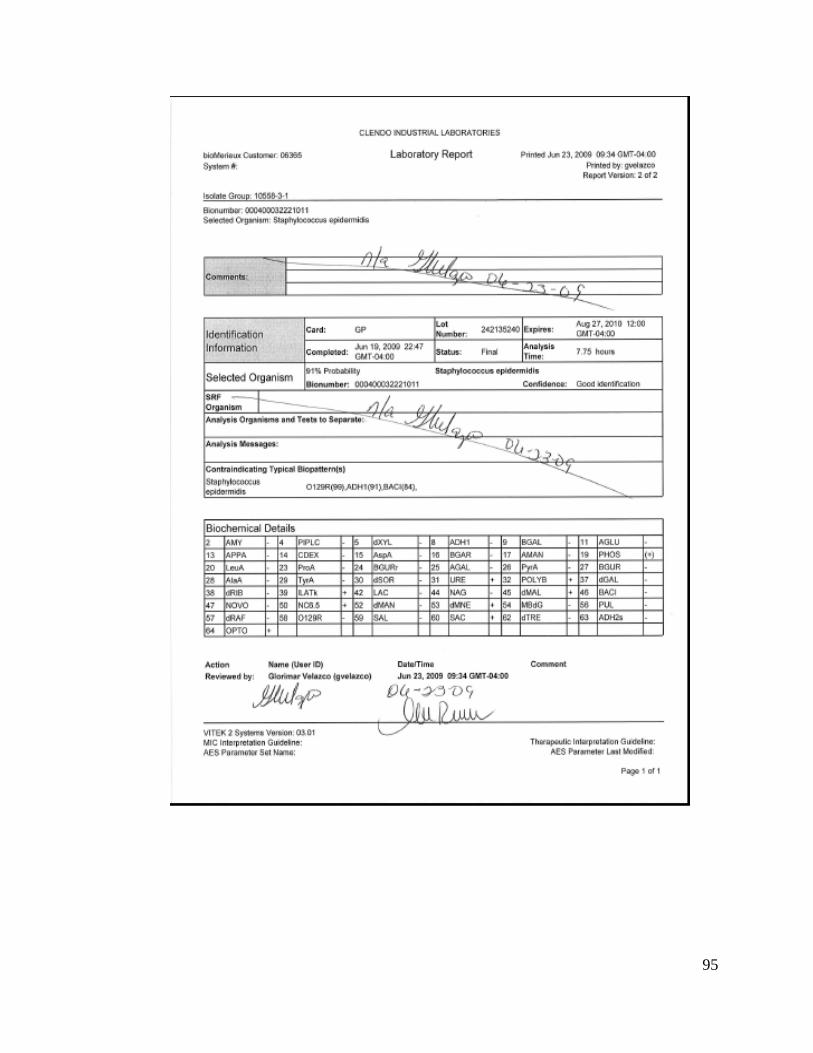
95

96

97

98

99

100

101

102

103

104
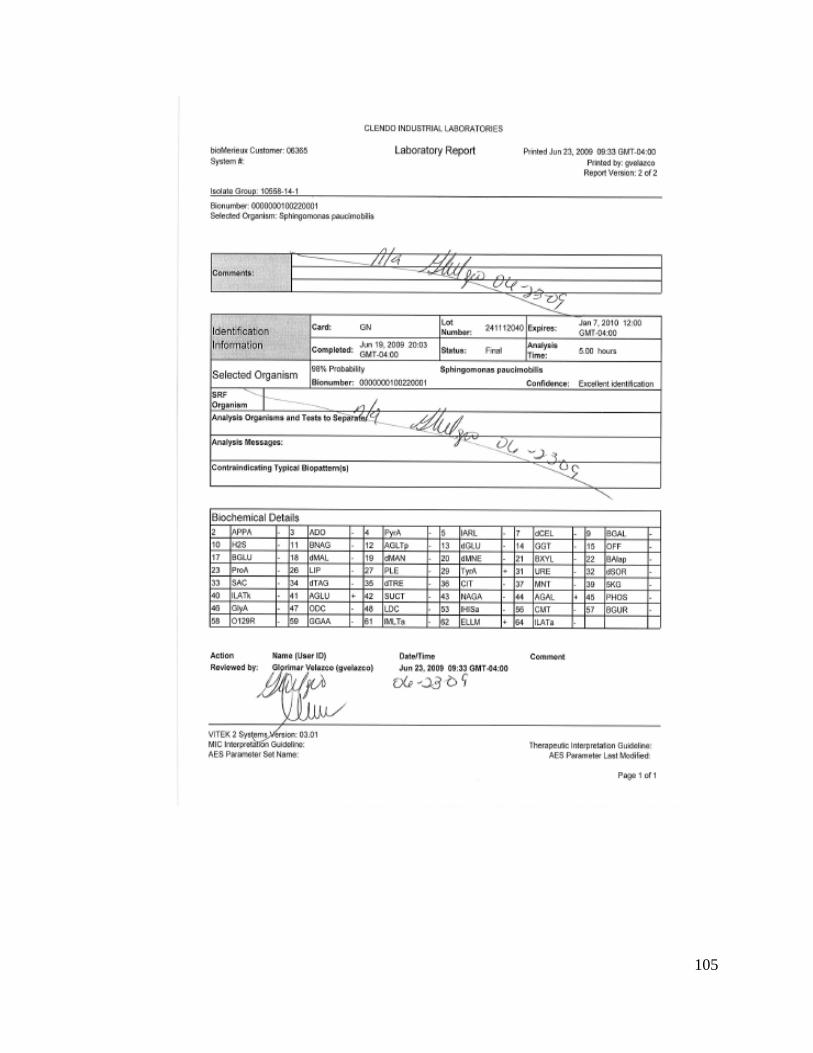
105

106

107

108

109

110

111
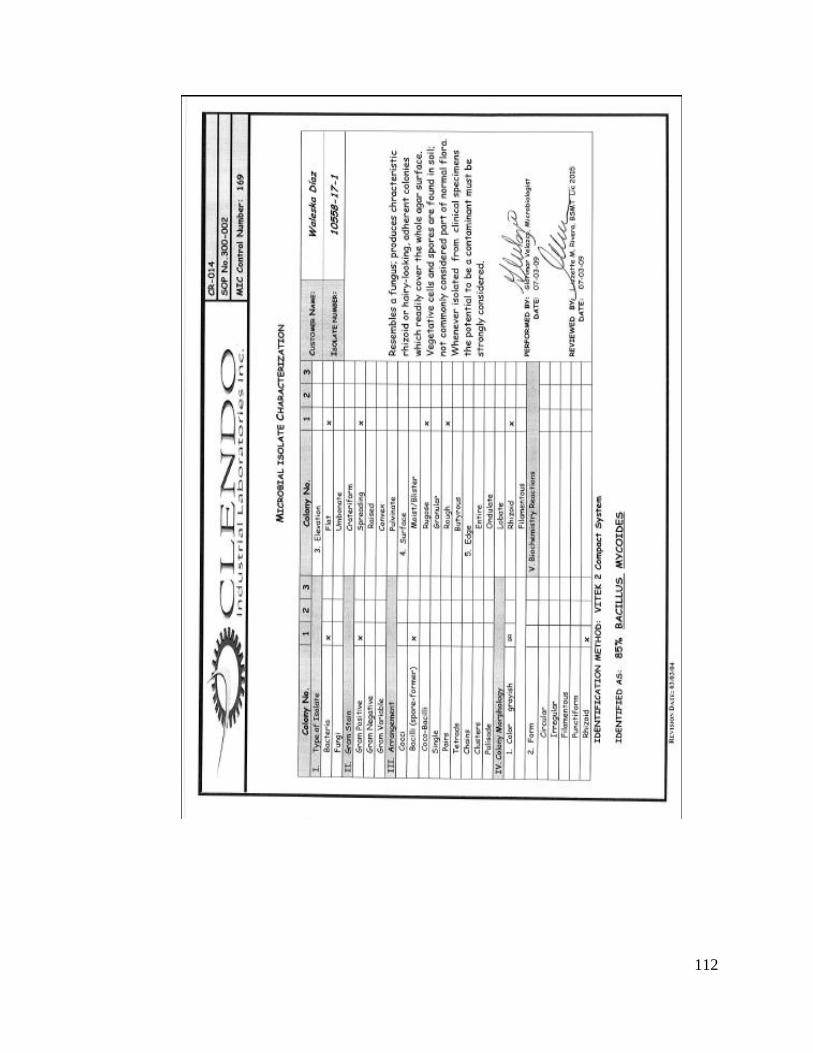
112

113

114

115

116

117

118

119

120

121

122

123

124

125

126

127

128

129

130

131

132

133

134
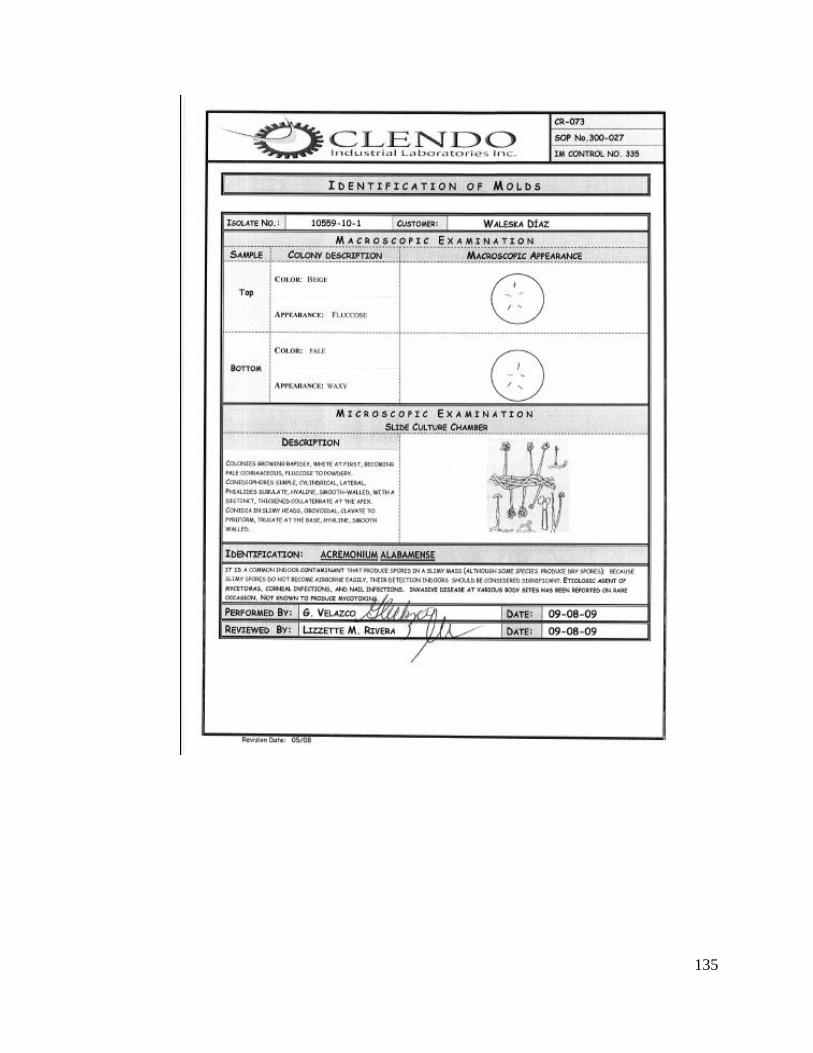
135

136
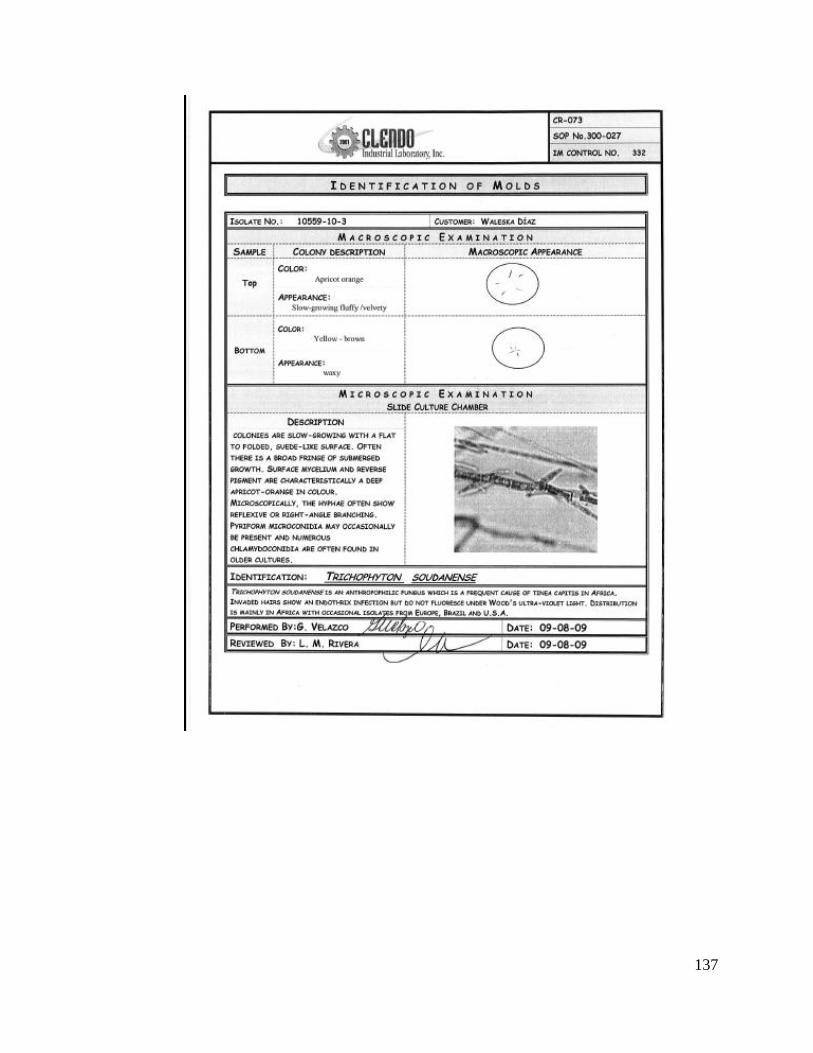
137

138
Appendix 5. Air Sampling Analytical Report
(#10330, #10332)

139

140

141

142

143

144

145

146

147

148

149

150

151
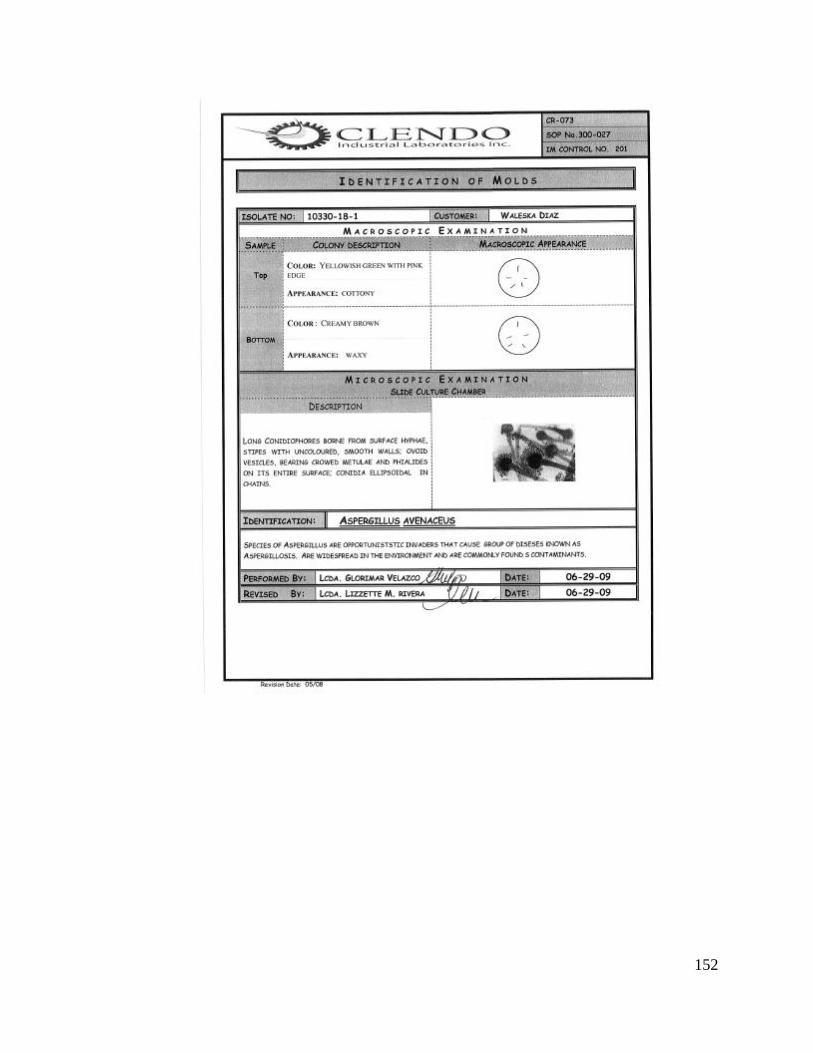
152
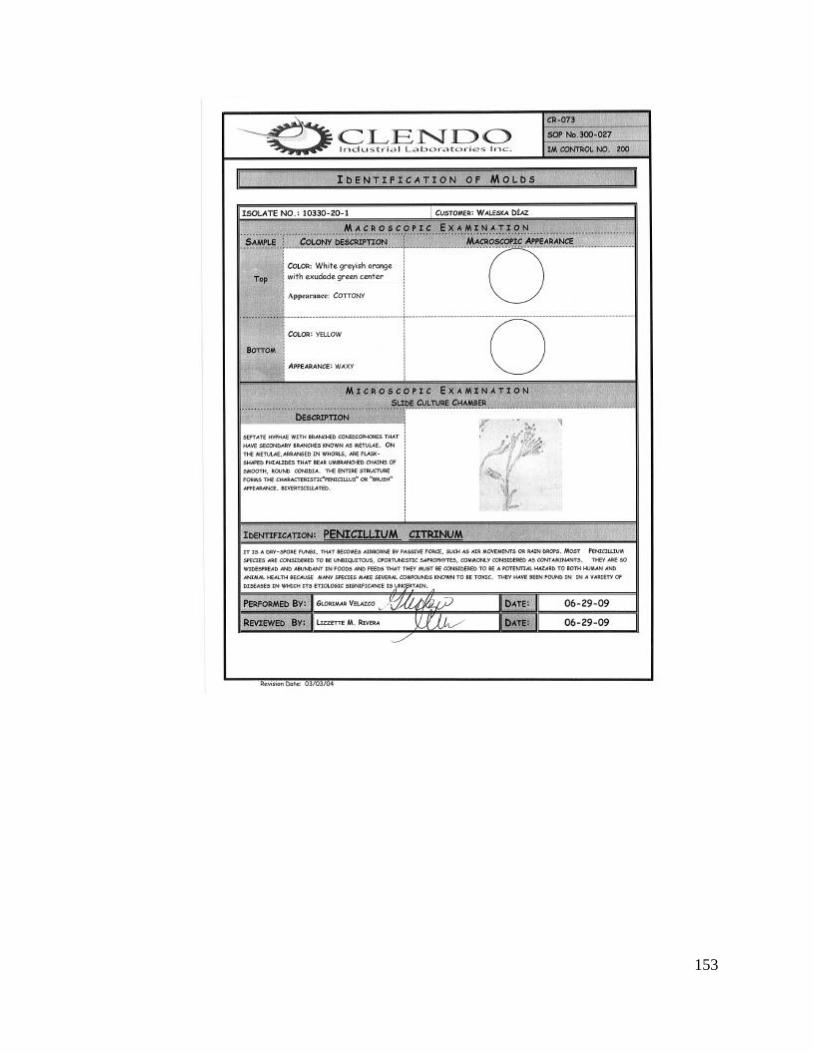
153

154

155

156

157

158

159

160

161

162

163

164

165

166

167

168
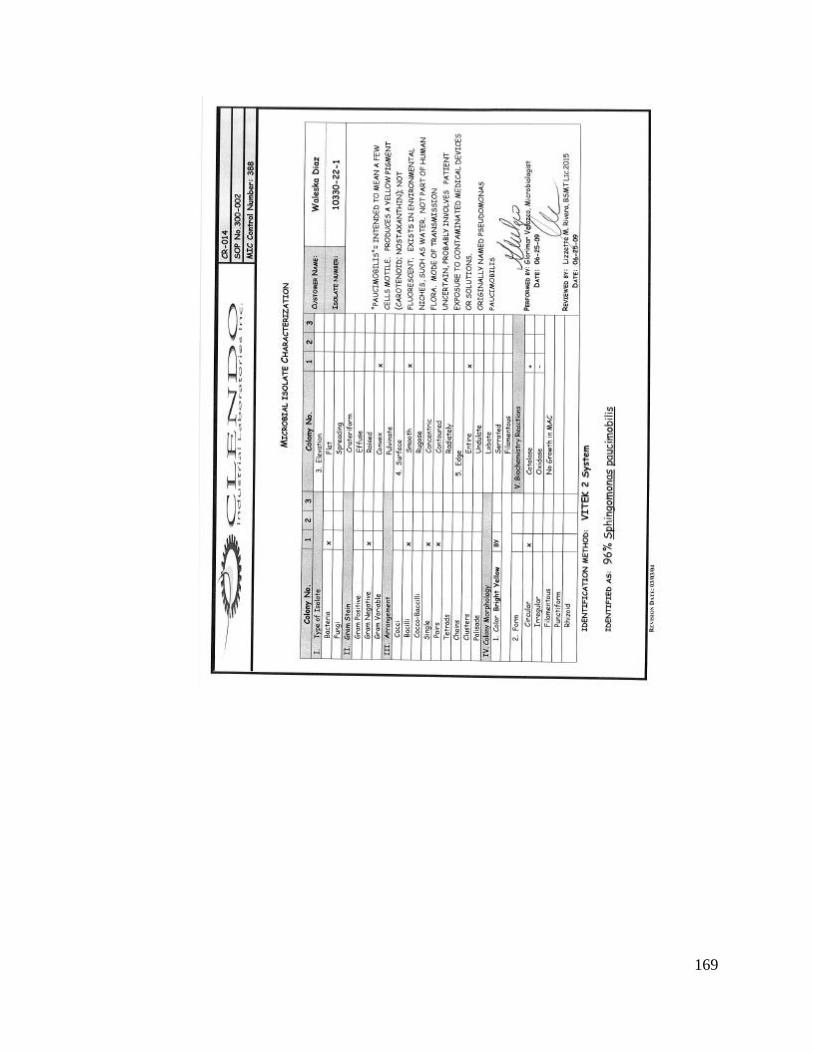
169
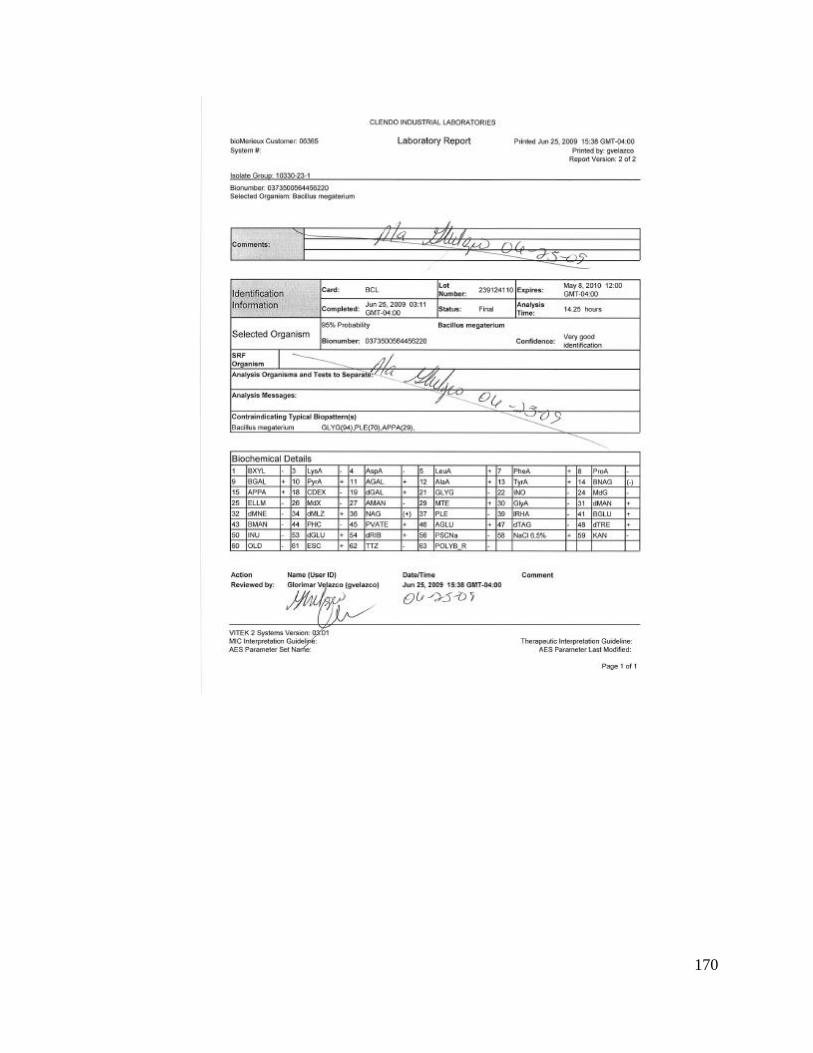
170
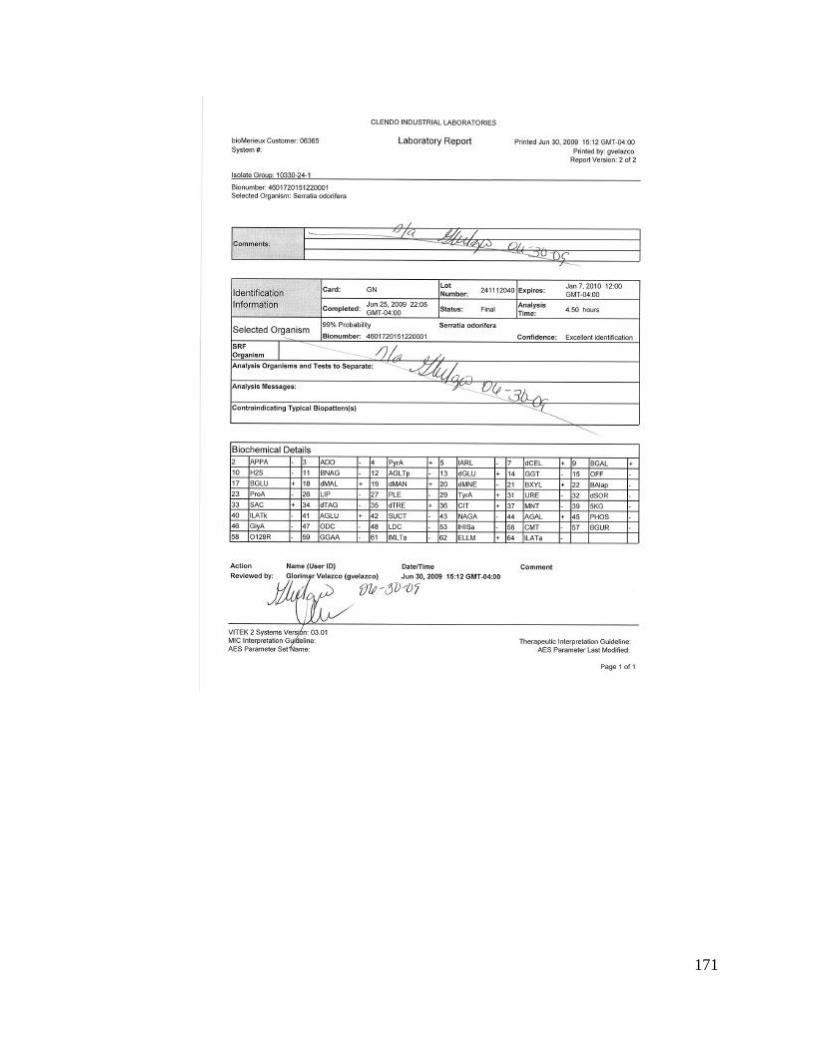
171

172

173

174

175

176

177
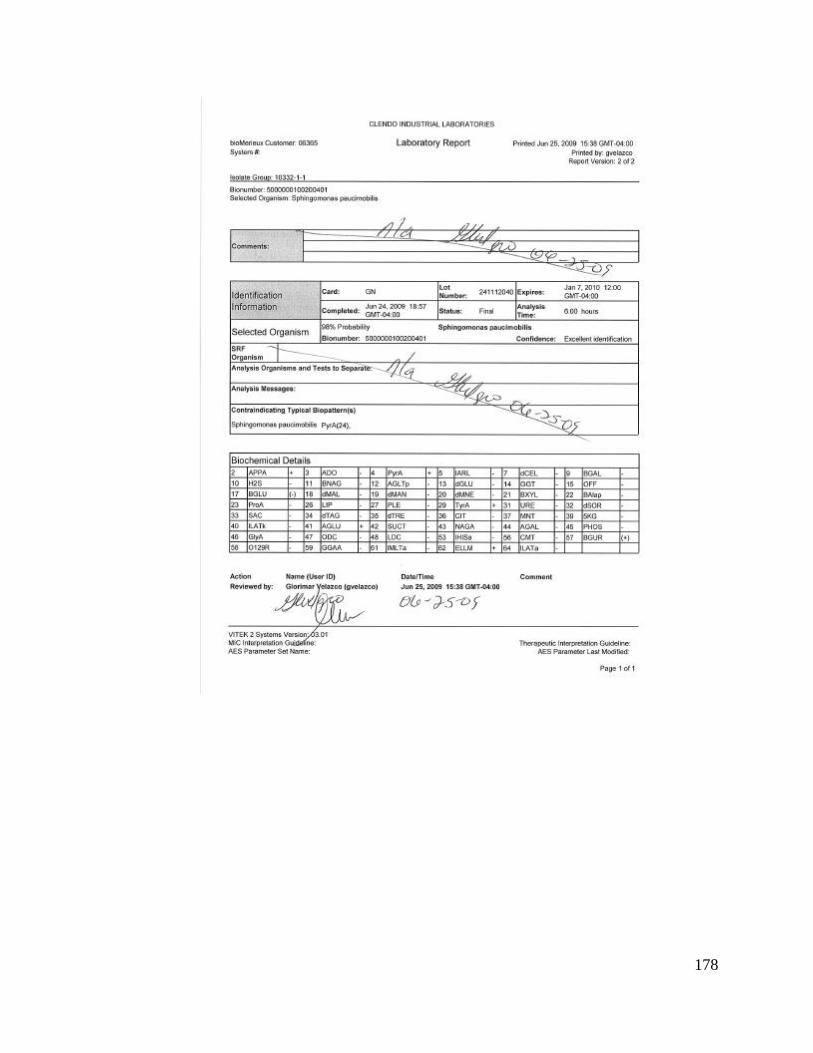
178

179

180

181

182

183
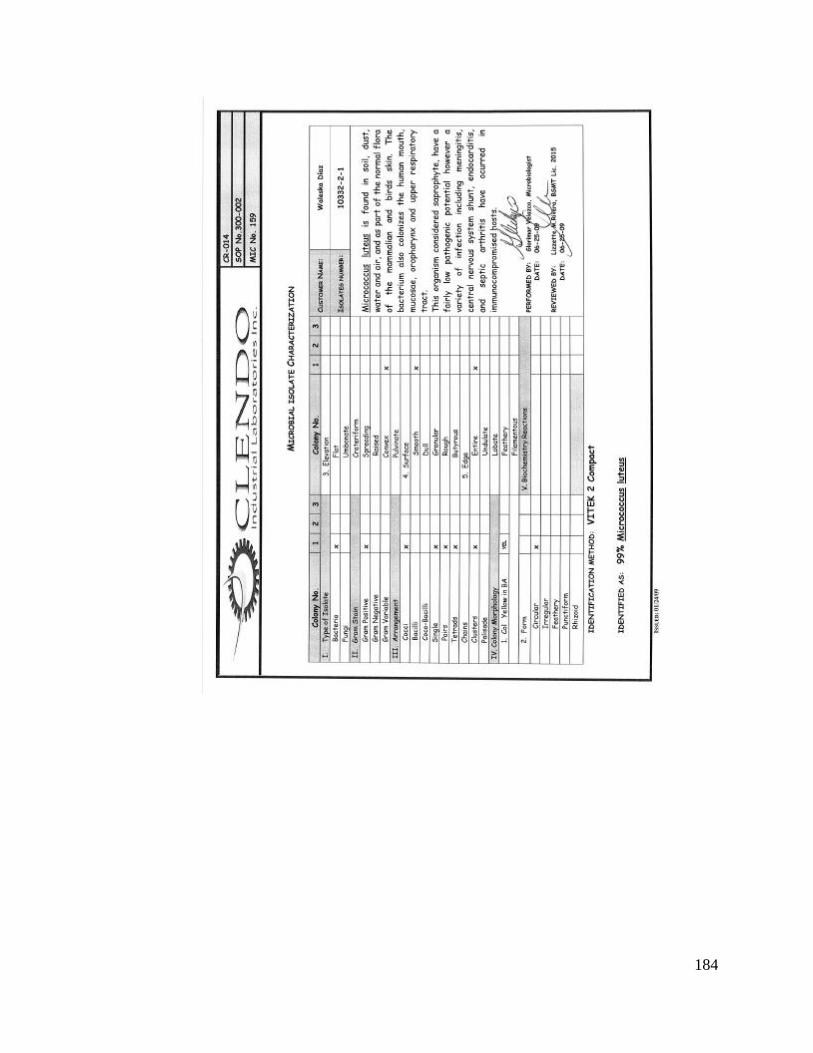
184

185

186

187

188

189

190
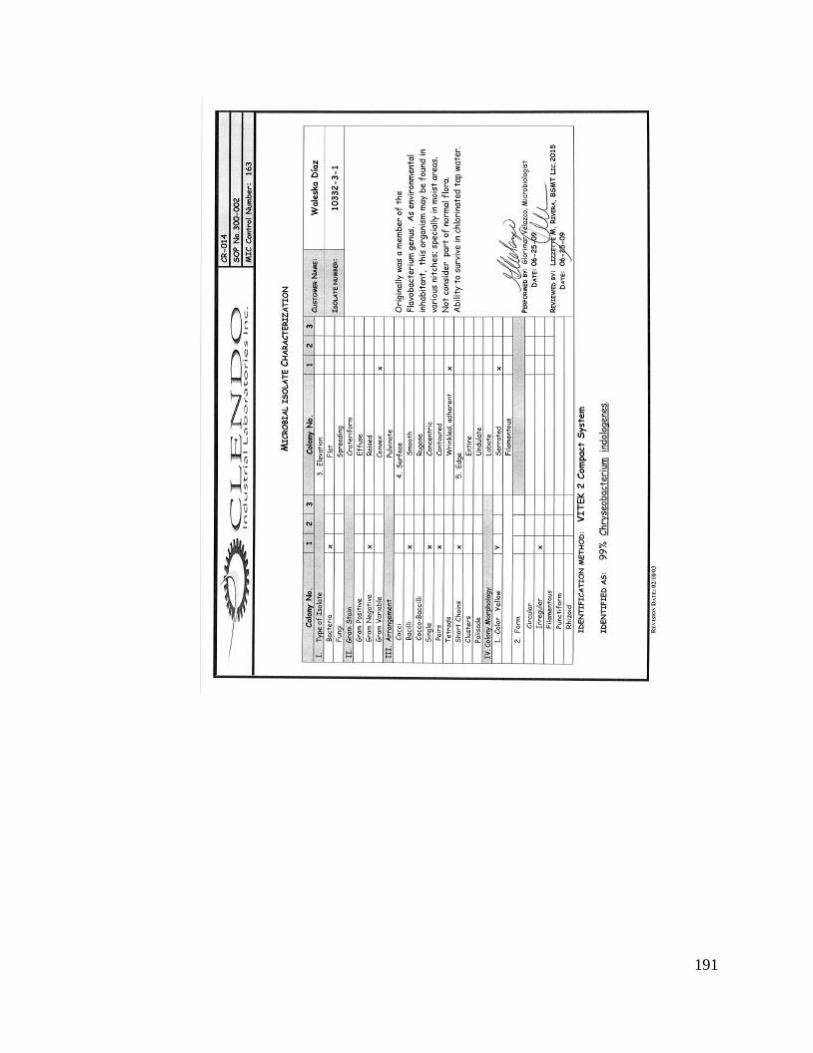
191

192

193

194

195

196
Appendix 6. Analytical Report after Mitigation Process
(#10846 to #10849)

197

198

199

200

201

202

203

204

205

206

207

208
Appendix 7. Cleaning Program for Caguas Gymnastic Club

209
Programa de limpieza para el área de entrenamiento en el Club Gimnástico Criollo
Area Lunes Martes Miércoles Jueves Viernes
Baños Niños
Baños Niñas
Fuente
Matress Baby Gym
Barras Paralelas Baby Gym
Cubo Para Piernas
Anillas
Fosa
Trampolín
Alfombra Posterior
Barras Asimétricas
Barras Paralelas
Vigas
Caballo con Arzones
Alfombra Frontal
Area de Salto
Matress
Envases Blancos
Piso
Cubículos de Madera
*Barrer las áreas de mayor tránsito (piso área frontal, alrededor de la fosa y la alfombra posterior).
*Se utilizará paño húmedo con una solución de Microban para limpiar los equipos de entrenamiento.
*Todo el piso debe ser limpiado en húmedo con una solución de Microban para evitar levantamiento de polvo.
*Entrenadores serán responsables de que finalizado el entrenamiento cada atleta se lleve sus pertenencias.