metropolitan portland mega trends 2005-2040 · metropolitan portland. mega trends 2005-2040. arthur...
TRANSCRIPT
Arthur C. Nelson, Ph.D., FAICPPresidential Professor, City & Metropolitan Planning
Director of Metropolitan ResearchUniversity of Utah
Metropolitan PortlandMega Trends 2005-2040
Arthur C. Nelson, Ph.D., FAICPPresidential Professor &
Director of Metropolitan ResearchUniversity of Utah
Presentation toPortland Metro Council
October 8, 2008

America Grows200 million in 1968300 million in 2006400 million in 2032500 million in 2050
America adds 100 million people faster than any other nation except India and
Pakistan – But faster than China.
Source: Arthur C. Nelson, Metropolitan Research, University of Utah.

Source: Architect magazine November 2006 based on analysis by Arthur C. Nelson, Metropolitan Research, University of Utah.

Source: Architect magazine November 2006 based on analysis by Arthur C. Nelson, Metropolitan Research, University of Utah.
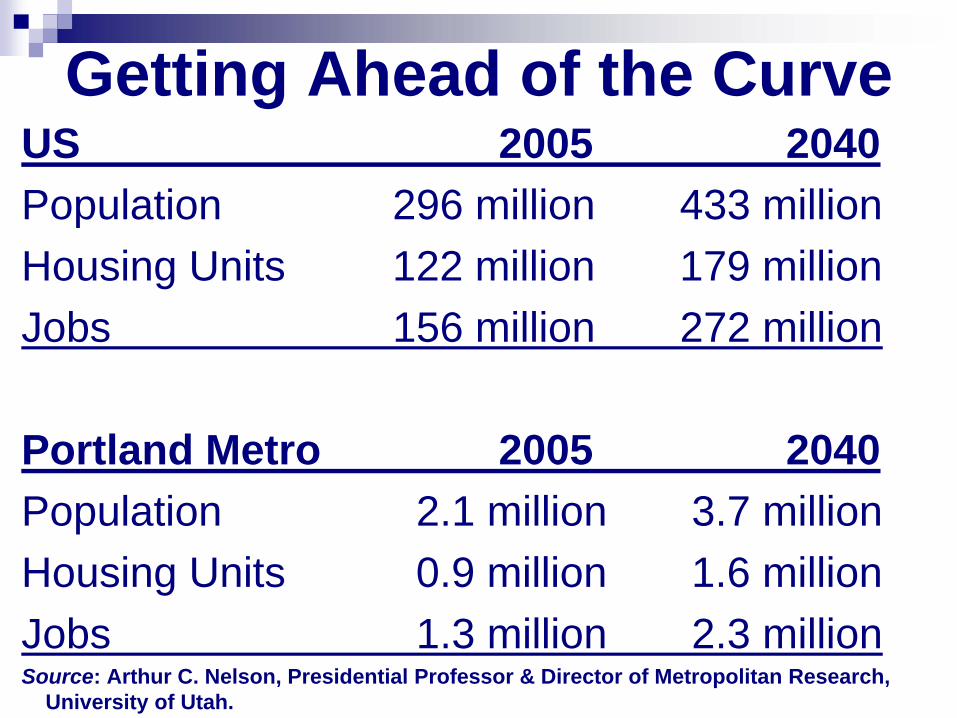
Getting Ahead of the CurveUS 2005 2040Population 296 million 433 millionHousing Units 122 million 179 millionJobs 156 million 272 million
Portland Metro 2005 2040Population 2.1 million 3.7 millionHousing Units 0.9 million 1.6 millionJobs 1.3 million 2.3 millionSource: Arthur C. Nelson, Presidential Professor & Director of Metropolitan Research,
University of Utah.
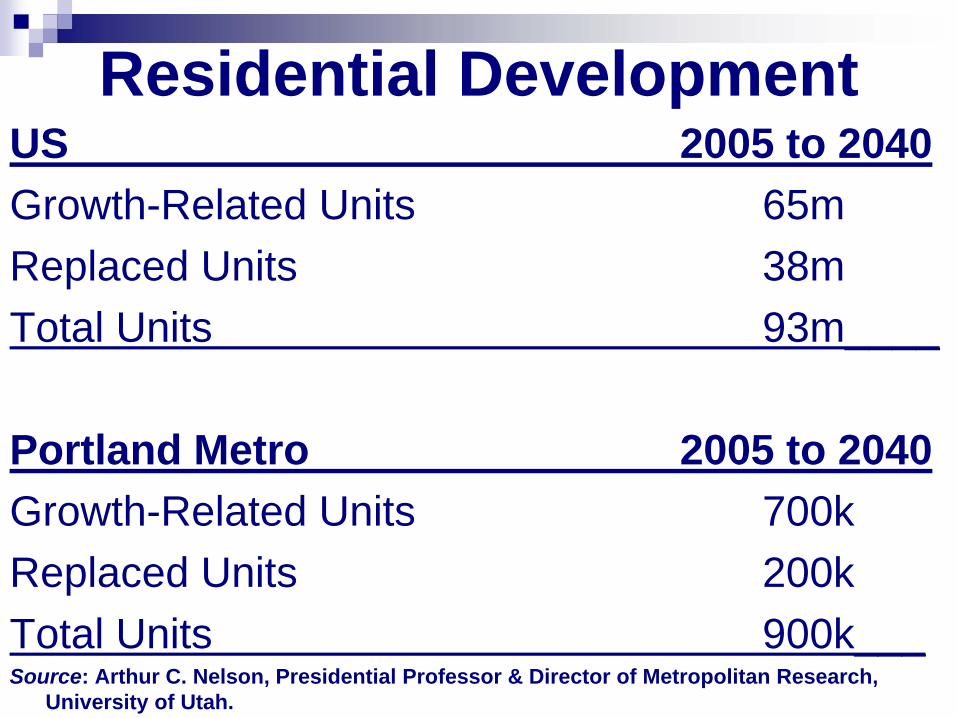
Residential DevelopmentUS 2005 to 2040Growth-Related Units 65mReplaced Units 38mTotal Units 93m____
Portland Metro 2005 to 2040Growth-Related Units 700kReplaced Units 200kTotal Units 900k___Source: Arthur C. Nelson, Presidential Professor & Director of Metropolitan Research,
University of Utah.

Nonresidential DevelopmentUS 2000 to 2040Growth-Related Square Feet 35 billionReplaced Square Feet 102 billionTotal Square Feet 137 billion
Portland Metro 2000 to 2040Growth-Related Square Feet 500 millionReplaced Square Feet 900 millionTotal Square Feet 1.40 billionSource: Arthur C. Nelson, Presidential Professor & Director of Metropolitan Research,
University of Utah.
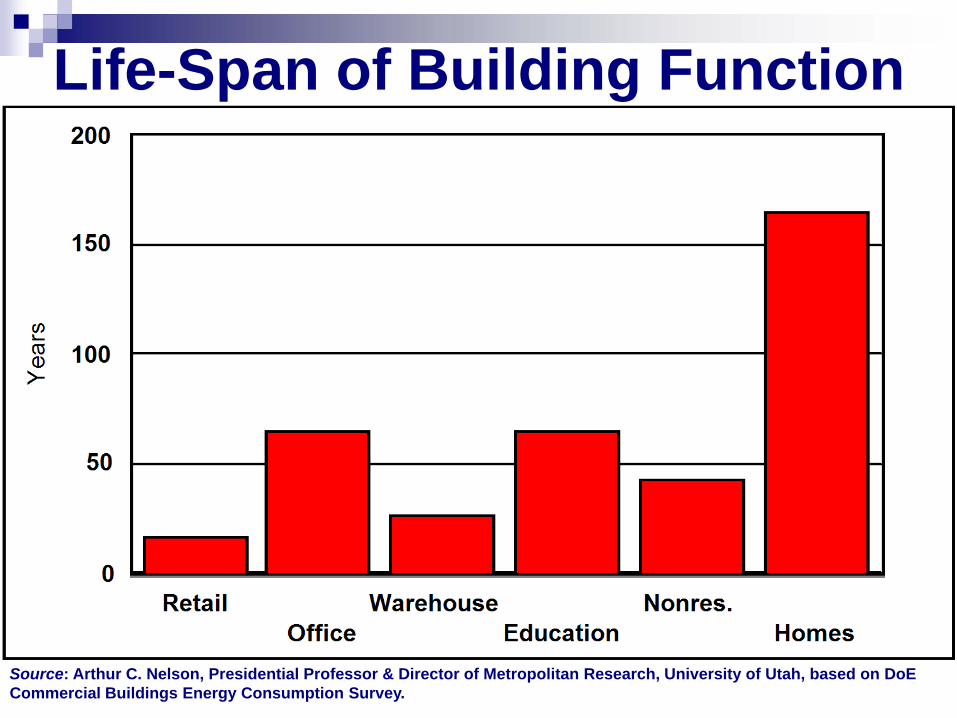
Life-Span of Building Function
Source: Arthur C. Nelson, Presidential Professor & Director of Metropolitan Research, University of Utah, based on DoE Commercial Buildings Energy Consumption Survey.
What About?
Telecommuting that could reduce demand for office space?
Internet retailing that could reduce demand for retail space?

Telecommuting RealitiesCabin fever reduces productivity.
Congestion and air pollution worsens.Census “work at home”:Year Percent1960 7.2%1970 3.5%1980 2.3%1990 3.0%2000 3.3%2007 4.1%
Source: Adapted from Census data by Arthur C. Nelson, Presidential Professor and Director of Metropolitan Research, University of Utah.
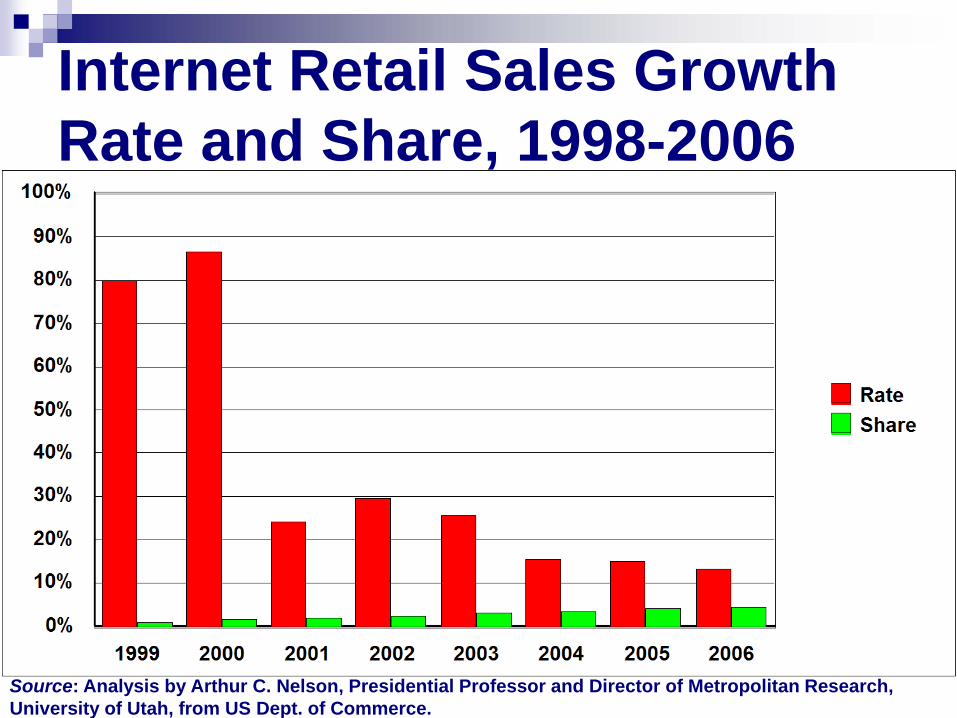
Internet Retail Sales Growth Rate and Share, 1998-2006
Source: Analysis by Arthur C. Nelson, Presidential Professor and Director of Metropolitan Research, University of Utah, from US Dept. of Commerce.
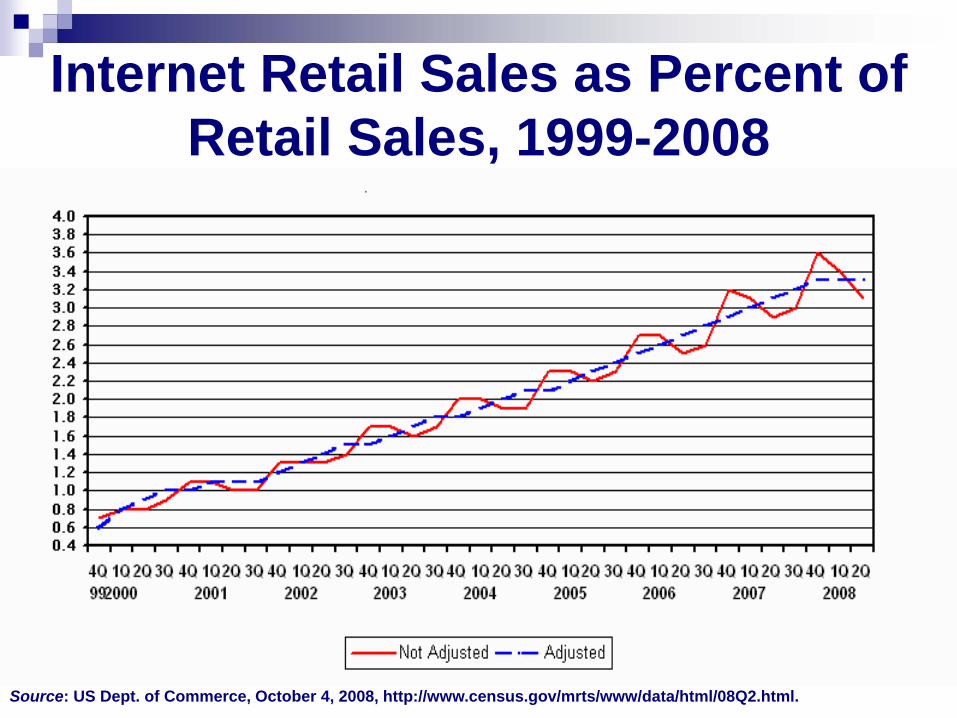
Internet Retail Sales as Percent of Retail Sales, 1999-2008
Source: US Dept. of Commerce, October 4, 2008, http://www.census.gov/mrts/www/data/html/08Q2.html.

Reality CheckSpace Class 1992 2003 %DifRetail & Service 57 62 +9%Office, Medical, Ed. 88 87 -1%Total Glamour Space 145 149 +3%Warehouse & Storage 45 35 -23%All Other 75 63 -16%
Non-percentage figures per capita based on Census estimates.Source: Calculated by Arthur C. Nelson, Presidential Professor and Director of Metropolitan
Research, University of Utah, from Energy Information Administration, Commercial Buildings Energy Consumption Surveys for 1992 and 2003.

Bottom Line ConstructionUS
Residential $34 TrillionNonresidential $14 TrillionInfrastructure $ 9 TrillionTotal $57 Trillion
Portland MetroResidential $350 BillionNonresidential $150 BillionInfrastructure $100 BillionTotal $600 Billion
Source: Arthur C. Nelson, Presidential Professor & Director of Metropolitan Research, University of Utah.

How Does It Grow?

Market Analysts Finding Changing Preferences
National Association of RealtorsNational Association of Home BuildersNationally Recognized Market Analysts
Urban Land InstituteLend Lease/PriceWaterhouseCoopers
Joint Center for Housing Policy at HarvardGolfing Buddies and Taxi Drivers

Residential Resale IndicatorsSingle family & TH:
Resale prices - 7.7% (6/07-6/08)
Unsold supply + 2.8% (4/08-6/08)
Condominium & Coop:Resale prices - 1.0% (6/07-6/08)
Unsold supply -15.5% (4/08-6/08)
Source: Arthur C. Nelson, Presidential Professor and Director of Metropolitan Research, University of Utah, adapted from National Association of Realtors monthly resale data accessed October 4, 2008.
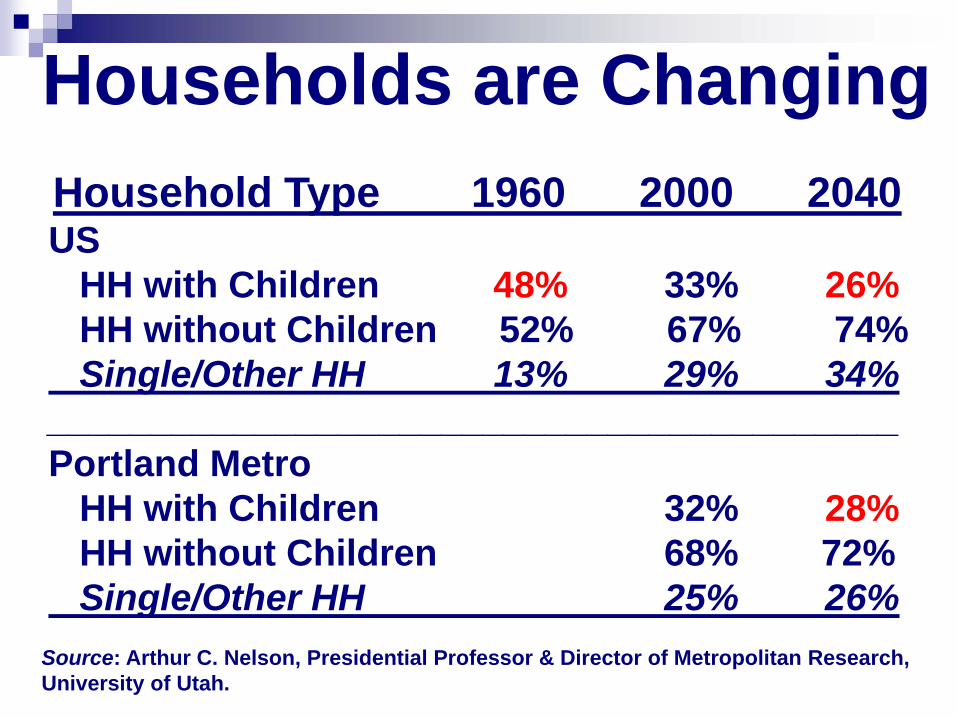
Households are ChangingHousehold Type 1960 2000 2040US
HH with Children 48% 33% 26%HH without Children 52% 67% 74%Single/Other HH 13% 29% 34%
_________________________________________ Portland Metro
HH with Children 32% 28%HH without Children 68% 72%Single/Other HH 25% 26%
Source: Arthur C. Nelson, Presidential Professor & Director of Metropolitan Research, University of Utah.
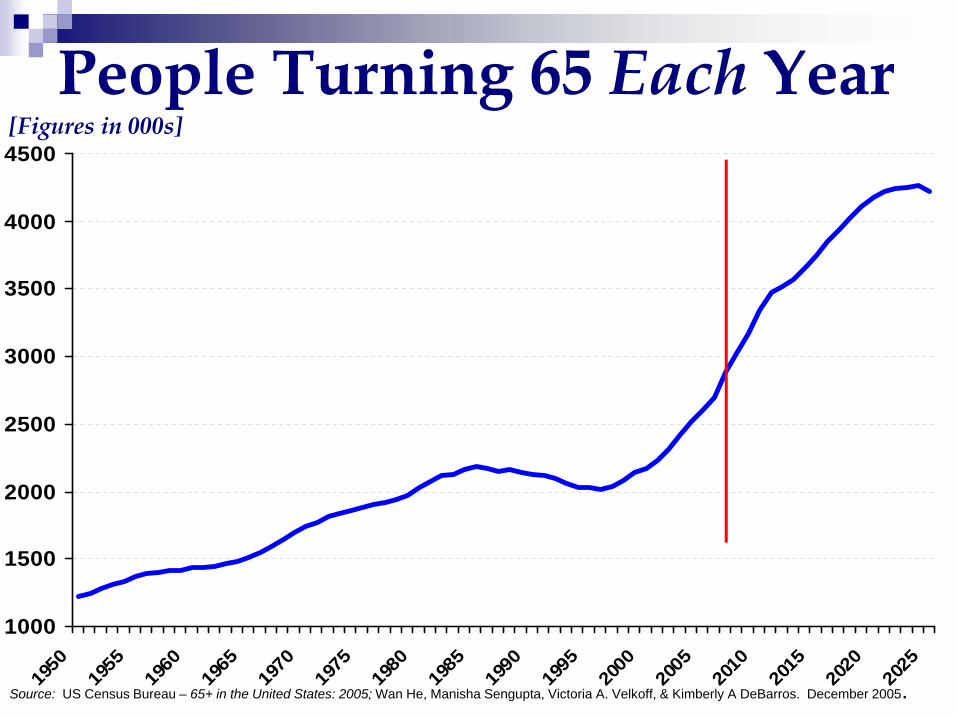
People Turning 65 Each Year[Figures in 000s]
Source: US Census Bureau – 65+ in the United States: 2005; Wan He, Manisha Sengupta, Victoria A. Velkoff, & Kimberly A DeBarros. December 2005.
1000
1500
2000
2500
3000
3500
4000
4500
1950
1955
1960
1965
1970
1975
1980
1985
1990
1995
2000
2005
2010
2015
2020
2025
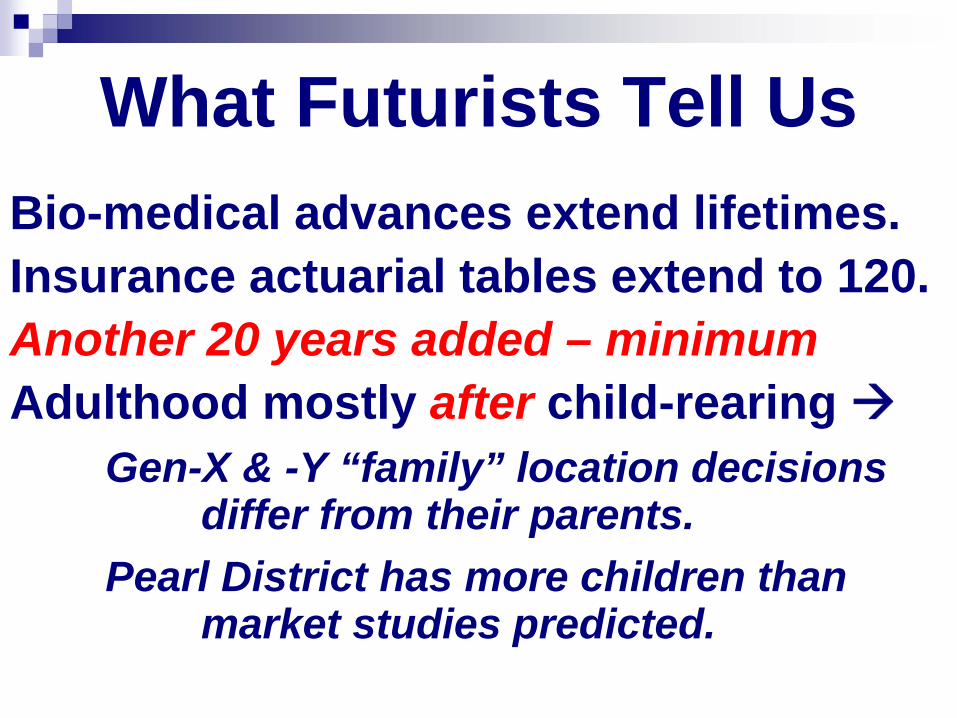
What Futurists Tell UsBio-medical advances extend lifetimes.Insurance actuarial tables extend to 120.Another 20 years added – minimumAdulthood mostly after child-rearing
Gen-X & -Y “family” location decisions differ from their parents.
Pearl District has more children than market studies predicted.

Share of Growth 2000-2040US HH Type Growth ShareHH Growth 54MWith children 7M 14%Without children 47M 86%
Single/Other 16M 30%Portland Metro HH Type Growth ShareHH Growth 700kWith children 100k 14%Without children 600k 86%
Single/Other 180k 26%Source: Arthur C. Nelson, Presidential Professor & Director of Metropolitan Research, University of Utah.

Neighborhood Feature Preferences
Source: National Association of Realtors, American Preference Survey 2004.
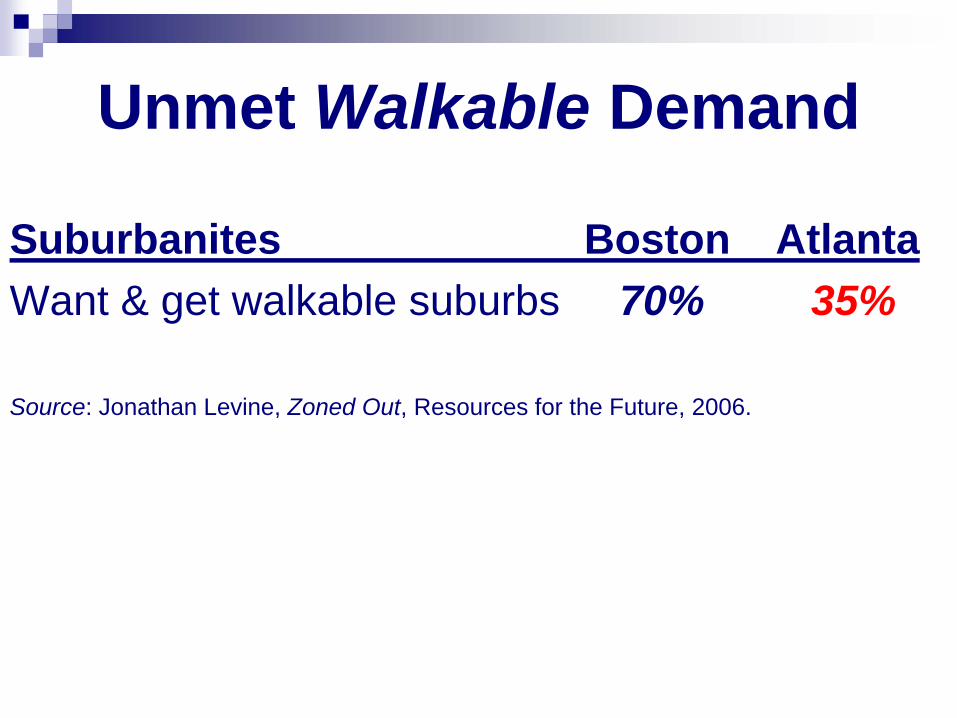
Unmet Walkable Demand
Suburbanites Boston AtlantaWant & get walkable suburbs 70% 35%
Source: Jonathan Levine, Zoned Out, Resources for the Future, 2006.

Retired Location PreferenceCity or suburb close to a city 51%Suburb away from a city 19%Rural community 30%
Conventional suburbs away from cities are the losers for this demographic group.
Source: National Association of Realtors & Smart Growth America, American Preference Survey 2004.

Housing Unit Preference by Type, National Surveys
Unit Type ShareAttached 38%Apartments 37%Condos, Coops 24%Townhouses 39%Detached 62%Small Lot (<7,000 sf) 60%Large Lot (>7,000 sf) 40%
Source: Low range of surveys reviewed by Arthur C. Nelson, “Planning for a New Era,” Journal of the American Planning Association, Fall 2006.

Fringe Values Eroding: Phoenix
Source: Arthur C. Nelson, Metropolitan Institute at Virginia Tech, based in Zillow analysis by Ceylan Oner.
Average Annual Appreciation 2004-2006
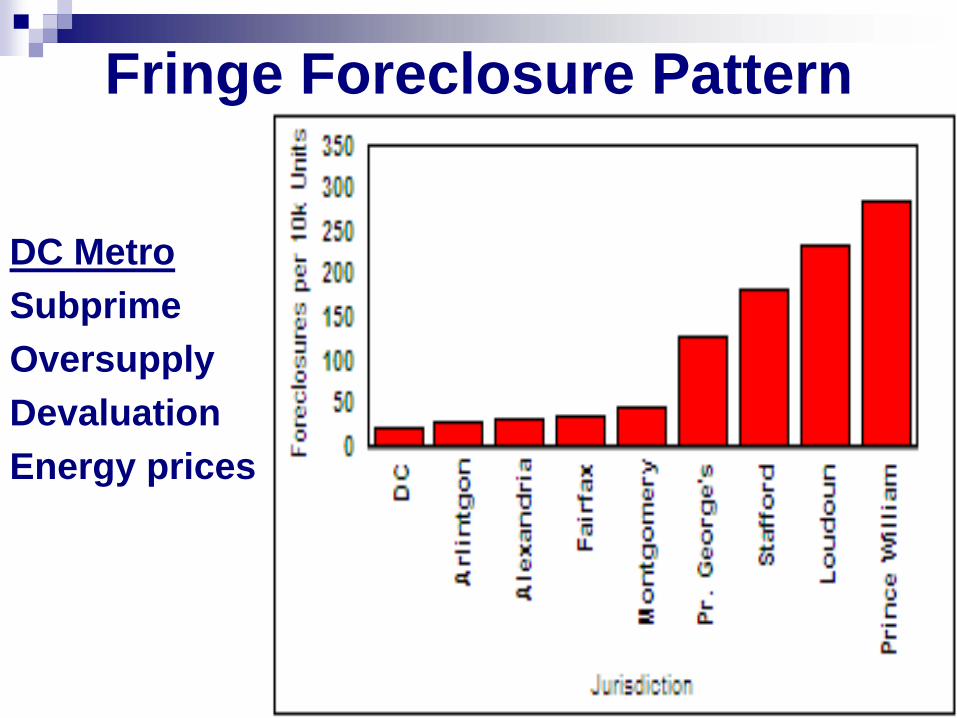
Fringe Foreclosure Pattern
DC MetroSubprimeOversupplyDevaluationEnergy prices

Location Costs
Transit-rich areas reduce “location” costs making
households more resilient to economic changes
“Drive until you qualify” mortgage underwriting
bias increases foreclosure risks
FORECLOSURE RESILIENT
FORECLOSURERISKY

Suburban Fringe Mortgage Time Bomb?
Source: Michael Hudson, “The New Road to Serfdom.” Harpers (May 2006), p. 46. This graph depicts the total mortgage market as viewed by Hudson.

Tenure Shift Imminent?Sub-prime “meltdown”.Private underwriting already far tighter.Re-regulation of commercial banks with more
rigorous mortgage underwriting.Many financially savvy people are renters.Renting creates mobility to move to jobs.Modern rental buildings and communities
attractive to middle/affluent/upper incomes.
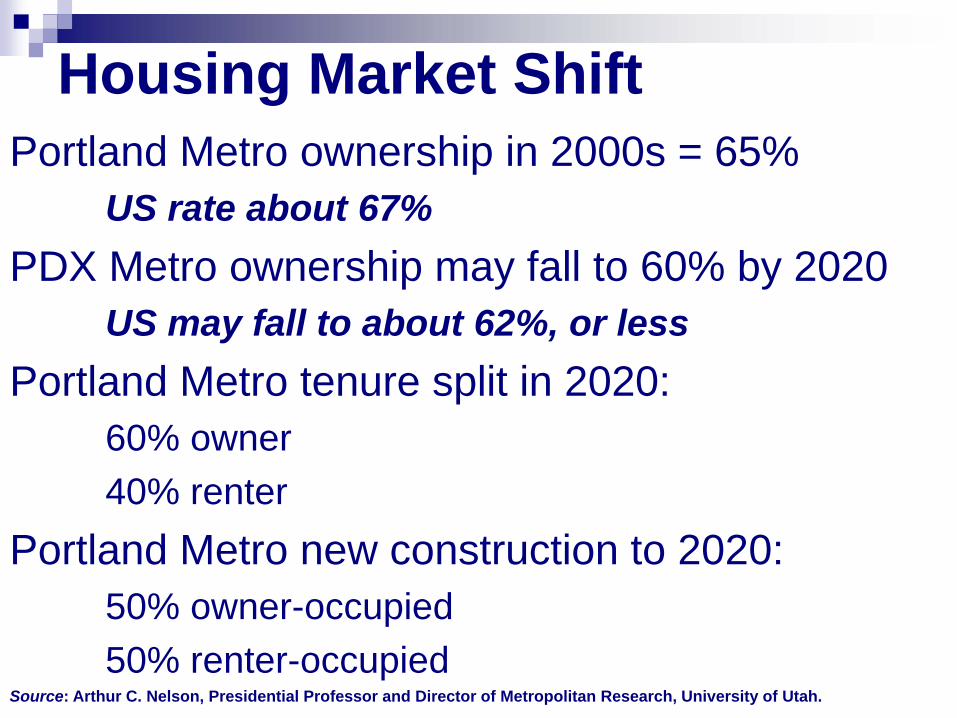
Housing Market ShiftPortland Metro ownership in 2000s = 65%
US rate about 67%PDX Metro ownership may fall to 60% by 2020
US may fall to about 62%, or lessPortland Metro tenure split in 2020:
60% owner40% renter
Portland Metro new construction to 2020:50% owner-occupied50% renter-occupied
Source: Arthur C. Nelson, Presidential Professor and Director of Metropolitan Research, University of Utah.
New Housing Tenure Demand Share to 2020
The next 400k new residential units:50% for owners50% for renters

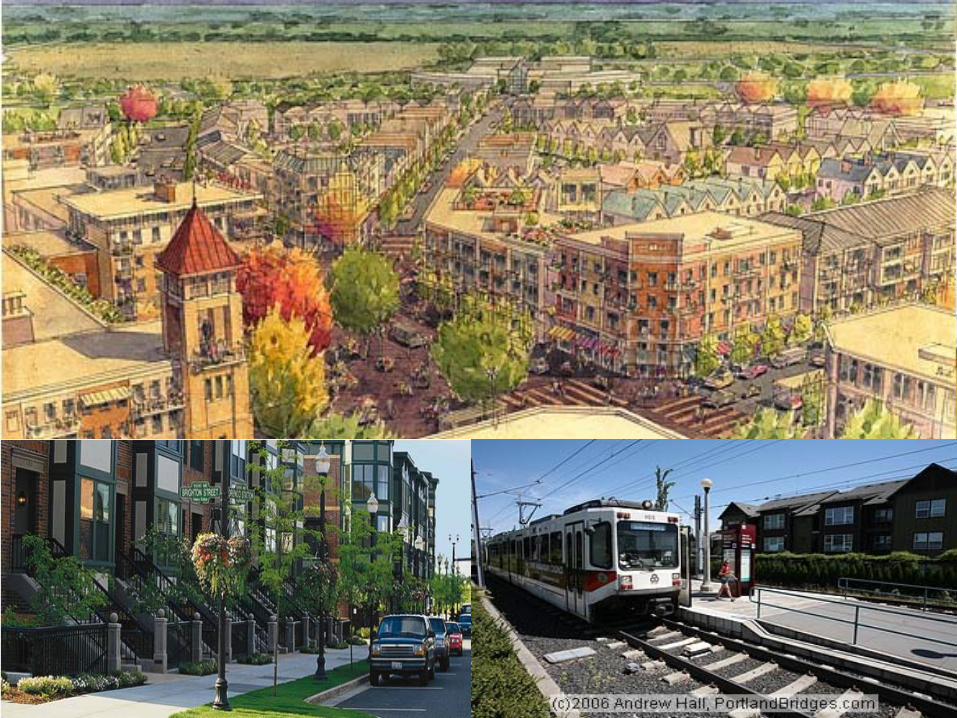
The Opportunity
The New Promise Land?
Tear Up a Parking Lot,Rebuild Paradise
Large, flat and well drainedMajor infrastructure in place
4+ lane highway frontage “transit-ready”“Kelo” problems avoided
Committed to commercial/mixed useCan turn NIMBYs into YIMBYs
Slide title phrase adapted from Joni Mitchell, Big Yellow Taxi, refrain: “Pave over paradise, put up a parking lot.”
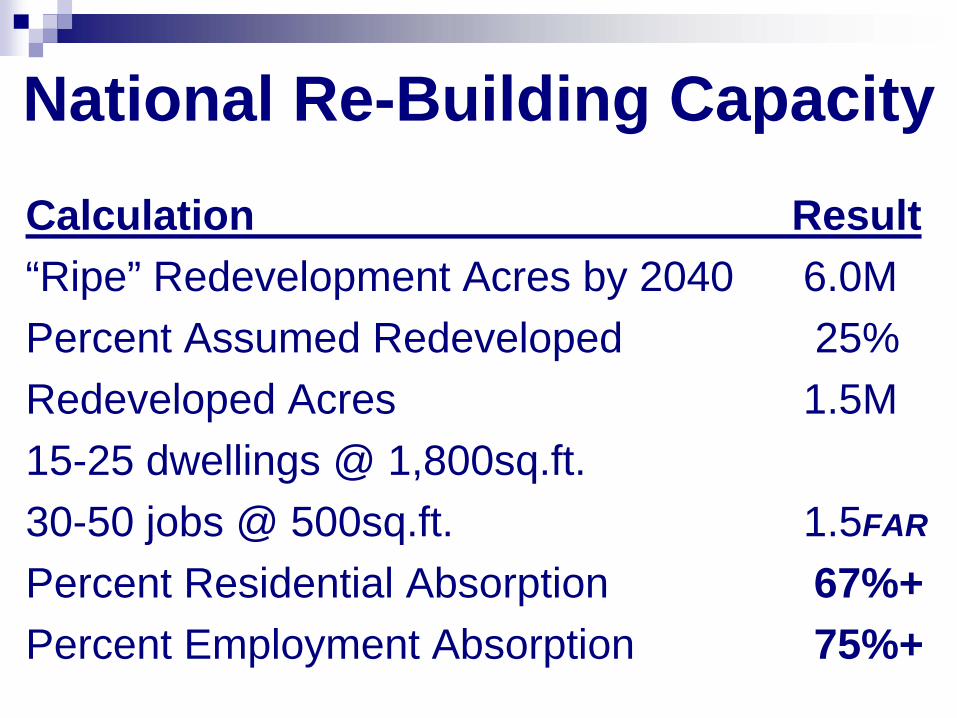
National Re-Building CapacityCalculation Result“Ripe” Redevelopment Acres by 2040 6.0MPercent Assumed Redeveloped 25%Redeveloped Acres 1.5M15-25 dwellings @ 1,800sq.ft. 30-50 jobs @ 500sq.ft. 1.5FAR
Percent Residential Absorption 67%+Percent Employment Absorption 75%+


Image courtesy of Dover Kohl Associates

Source: Calthorpe (1993)
Transit Oriented Development Template10-minute walk or about 1500-2000 feet
The speed of a saunter or a walk-in-the-park.
District Boundary Definitions in TOD OrdinancesSource: Community Design + Architecture (2001)
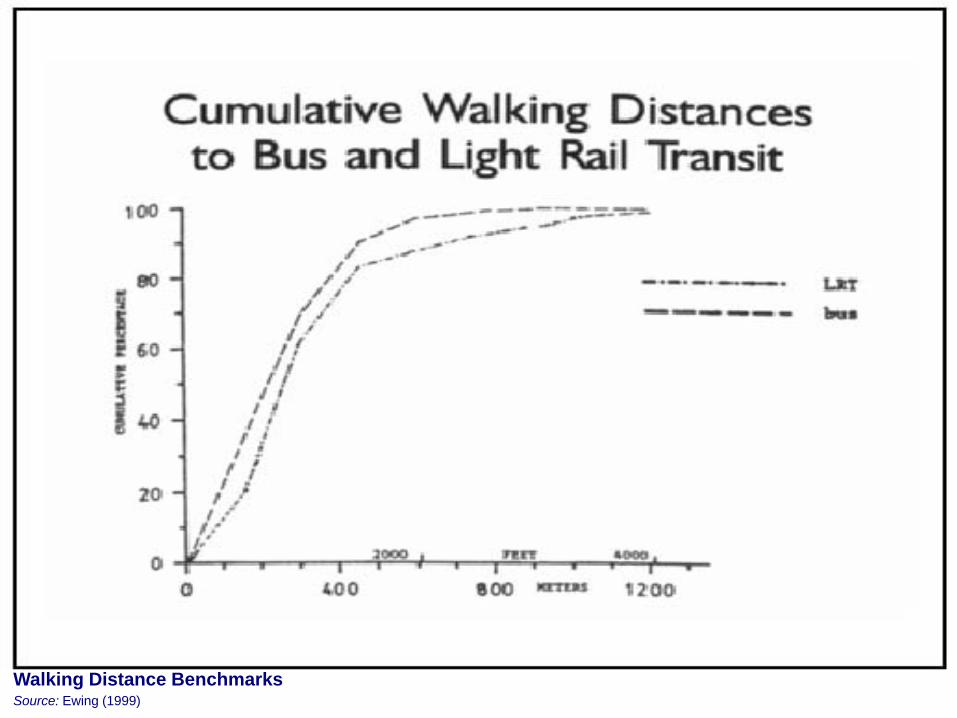
Walking Distance BenchmarksSource: Ewing (1999)
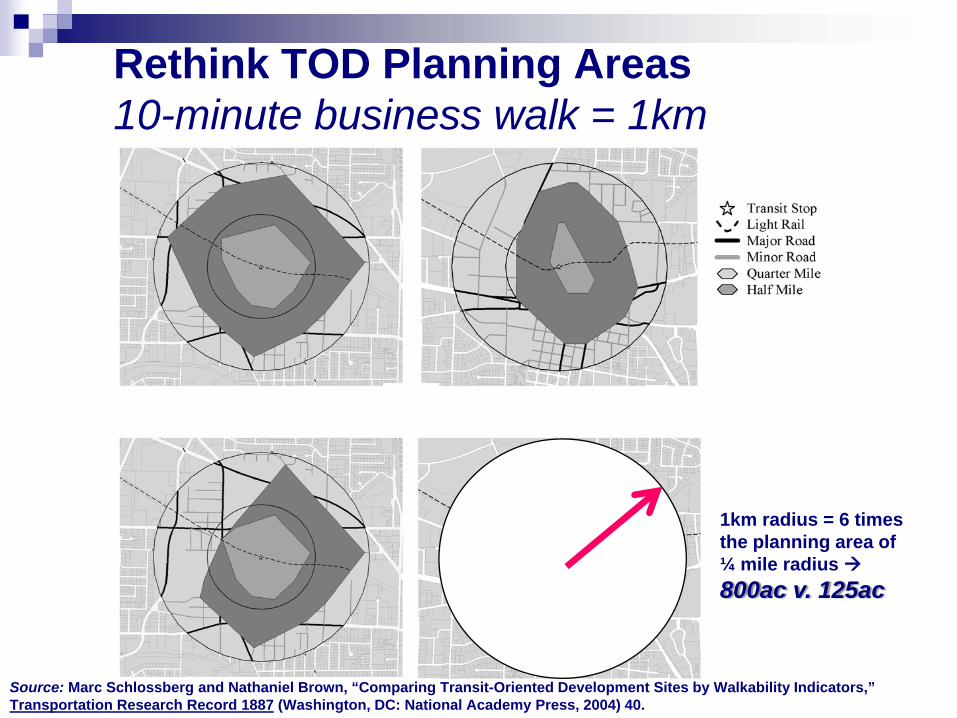
Rethink TOD Planning Areas10-minute business walk = 1km
1km radius = 6 times the planning area of ¼ mile radius 800ac v. 125ac
Source: Marc Schlossberg and Nathaniel Brown, “Comparing Transit-Oriented Development Sites by Walkability Indicators,” Transportation Research Record 1887 (Washington, DC: National Academy Press, 2004) 40.

Redevelopment acres 2040 (est) 30,000 14,000 12,000 9,000Share of metro growth @ 3.0 FAR 35% 65% 35% 20%Source: Figure from Reconnecting America, Realizing the Potential: Expanding Housing Opportunities Near Transit.
1km
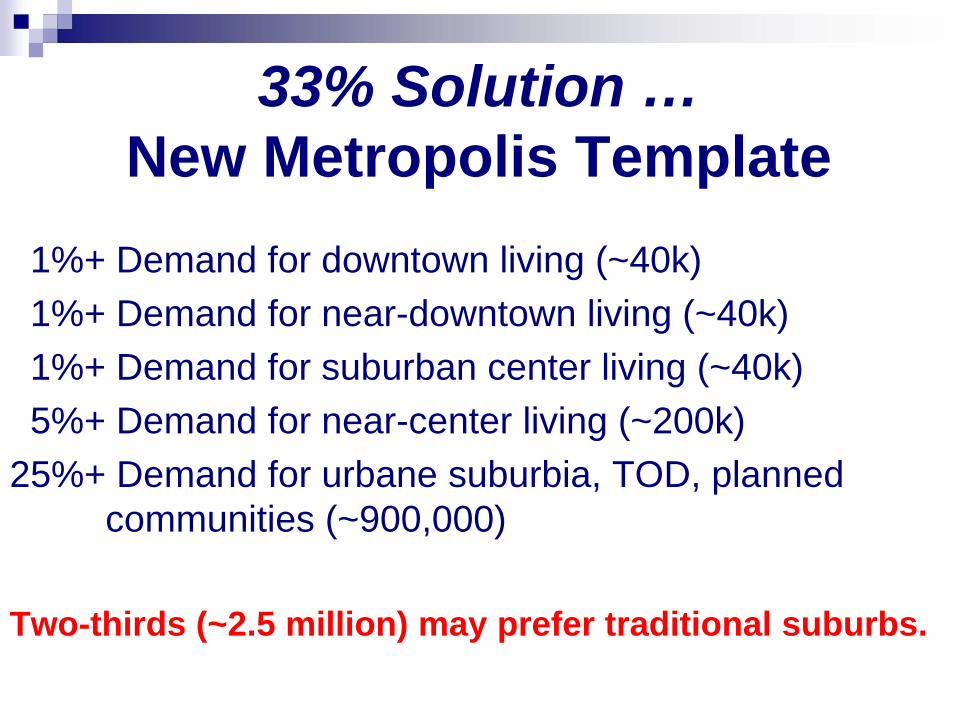
33% Solution …New Metropolis Template
1%+ Demand for downtown living (~40k)1%+ Demand for near-downtown living (~40k)1%+ Demand for suburban center living (~40k)5%+ Demand for near-center living (~200k)
25%+ Demand for urbane suburbia, TOD, planned communities (~900,000)
Two-thirds (~2.5 million) may prefer traditional suburbs.

New Metropolis Demand2005-2040
3,700k people 20401,600k growth 2005 to 20401,200k demand for New Metropolis options
100k supply by 2010(?)1,100k net new metropolis demand2/3rd+ of all new housing units must be in new
metropolis options to meet demand of the 1/3rd of who want those options in 2040.

THANK YOU!