metro trends
TRANSCRIPT

Metro Zkends Joseph Zimmerman, Editor
Income Tax Dependence on Increase
Income taxes from individuals and corporations supplied more than 87 percent of the $472 billion federal tax revenue in fiscal year 1986, according to a report released by the U.S. Bureau of the Census.
For state governments, sales taxes contributed 49 percent of the total of $228 billion in revenue, and income taxes raised 38 percent. Nearly three- fourths of local government taxes, totaling $145 billion, came from property taxes.
The Federal government relies slight- ly more on income taxes, a trend that has leveled off since 1977 after a fair- ly sharp rise from 1972 to 1977.
State governments still obtain the largest percentage of their taxes from income and sales taxes, but the impor- tance of income taxes has grown. Sales taxes, although remaining the largest portion, have waned relatively. For lo- cal governments, property taxes still re- main the prime source of tax revenue, although declining steadily in im- portance.
Percent of Total Taxes in F i d Year
1986 1982 1977 1972
Income taxes 87.3 85.7 86.8 82.5 Federal Government
State Governments Sales taxes Income taxes
49.3 48.4 51.8 55.5 37.6 36.7 34.3 29.1
Local Governments Property taxes 74.0 76.0 80.6 83.5
The report contains data on other indebtedness, and assets. It shows that revenues of government, expenditures, total revenue for all governments
156

METROTRENDS I 157
amounted to $1.5 trillion, an increase of 7 percent from the previous year.
Taxes comprised 56 percent of this total, or $845 billion, down from 59 percent in 1982 and 69 percent in 1972. Insurance trust revenue, mostly from Social Security, stood at 24 percent of all government revenues in 1986, an in- crease from 17 percent in 1972 and 21 percent in 1982.
Total government expenditures rose 7 percent to $1.7 trillion in 1986. Sa- laries and wages totaled 11 percent of federal expenditures, 18 percent of state government outlays, and 42 per- cent of local spending. However, salar- ies and wages have fallen since 1972 as a percentage of all government spend- ing, from 33 to 22 percent.
Government indebtedness showed an annual increase of 16 percent. Of the total debt of $2.8 trillion ($11,565
per person), more than three-fourths, or $2.1 trillion, was owed by the Fed- eral government.
The percentage rise in state and lo- cal government debt, just slightly be- low the percentage increase for all governments, resulted from favorable interest rates, changes in Federal tax legislation, and increased financial as- sistance to private and nonprofit or- ganizations through the issuance of tax-exempt bonds.
All comparisons have been made at the 90 percent confidence level. For further explanations of the measures of precision and hypothesis testing, refer to the text of the report.
Copies of the report, Government Finances in 1985-86, GF86, No. 5 , are available from the Superintendent of Documents, United States Government Printing Office, Washington, DC 20402.
Local Governments Increase, School Districts Decrease
The number of local governments in A five percent growth in the num- the nation rose 1.7 percent during the ber of special district governments, last five years and now totals 83,166, from 28,078 to 29,487, accounted for according to a preliminary report on nearly all of the 1.7 percent increase. the 1987 Census of Governments, The special district gain of 1,409 was released recently by the U.S. Bureau of about two-thirds of the increase the Census. recorded in the 1982 census. During the
158 I NATIONAL CIVIC REVIEW
past 35 years their number has more than doubled from the 12,340 record- ed in 1952.
Special districts are independent, limited-purpose governmental units dealing with functions such as hous- ing community development, fire pro- tection, drainage and flood control, irrigation, soil and water conservation, and water supply.
Illinois had the largest number of lo- cal governments, a total of 6,626, while Hawaii had the fewest with only 18. States with more than 3,000 local governments were Pennsylvania, Texas, California, Kansas, Minnesota, Ohio, New York, Nebraska, and Missouri. These states accounted for about one- half of all governments.
The preliminary report also shows the 14,741 school districts counted in 1987 marked a decline of 110 from the 1982 census. Although the number of school districts dropped by only 433 from 1977 to 1987, the new census count is less than half the 34,678 reported 25 years earlier, in 1962. It is less than one-seventh of the 108,579 districts, many with one-room schools, reported in 1942.
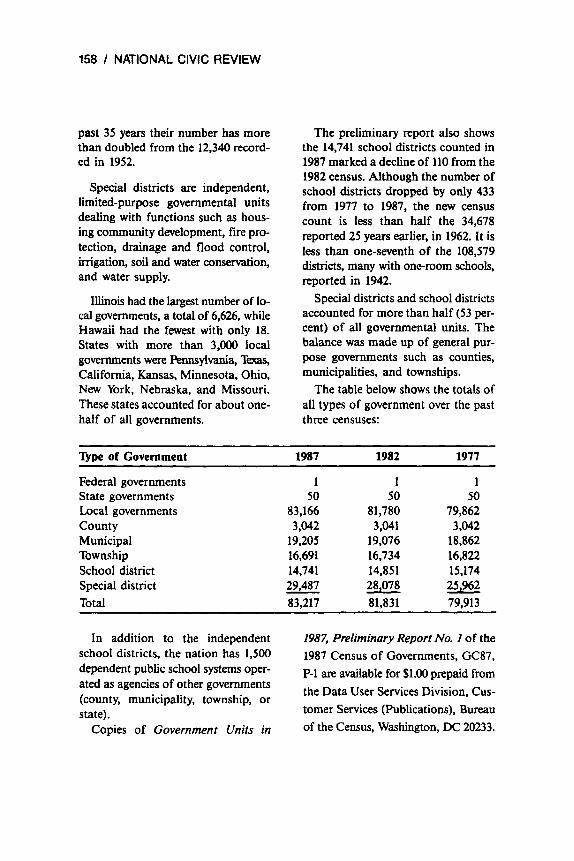
Special districts and school districts accounted for more than half (53 per- cent) of all governmental units. The balance was made up of general pur- pose governments such as counties, municipalities. and townships.
The table below shows the totals of all types of government over the past three censuses:
5 p e of Government 1987 1982 1977
Federal governments 1 1 1 State governments 50 50 50 Local governments 83,166 81,780 79,862 County 3,042 3,041 3,042 Municipal 19,205 19,076 18,862 Township 16,691 16,734 16,822 School district 14,741 14,851 15,174
25,962 Special district Total 83,217 81,831 79,913
- 28,078 - 29,487 -
In addition to the independent 1987. Preliminary Report No. I of the 1987 Census of Governments, GC87,
the Data User Services Division, Cus- tomer Services (Publications), Bureau
school districts, the nation has 1.500
ated as agencies of other governments (county, municipality, township, or state).
dependent public school systems OPer- p-1 are available for $1.00 prepaid from
Copies of Government Units in of the Census, Washington, DC 20233.

METROTRENDS I159
Congressional District Population Increases 6.4 Percent, 1980-86
The average population size of a congressional district in 1986 was 530,000, up 6.4 percent from the 519,000 shown by the 1980 census, ac- cording to estimates from the United States Bureau of the Census.
States with at least three congres- sional districts and an average popu- lation per district well above the national average were Arizona (649,000), Texas (617,000). Florida (614,000), Georgia (610,000), and California (660,000). These states can be expected to gain seats after the 1990 Census.
States with district populations well below the national average were Iowa
(475,000), West Virginia (480,000). Kansas (492,000), Michigan (509,000), Ohio (512,000), Pennsylvania (517,000), New York (523,000), Illinois (525,000), and Mississippi (525,000). These states can be expected to lose seats after the 1990 Census.
Thirty-four of the 435 congression- al districts were estimated to have had population growth of 20 percent or more since 1980, more than three times the 6.4 percent national average. Wenty of them were in the South and 14 in the West.
The congressional district estimat- ed to have grown the fastest since 1980 is Texas 26 (Fort Worth area), with an increase of nearly 42 percent. Nine other districts have growth rates of more than 30 percent. Of the top 10 growth districts listed below, five are in Florida and three are in Texas.
Congressional District Percent Change,
1980-86
Texas 26 (Fort Worth-Arlington) Florida 11 (Orlando-Cape Kennedy) Texas 10 (Austin) California 37 (Riverside County) Alaska at large Arizona 1 (Phoenix-Mesa) Florida 6 (Gainesville-Ocala) Florida 12 (North Palm Beach County-
Florida 14 (South Palm Beach County-
Florida 13 (Fort Myers-Sarasota)
Ft. Pierce-Naples
North Broward County)
41.7 33.4 33.2 33.1 32.8 32.7 32.5 32.3
31.5
31.4
Another 144 congressional districts grew in population at least as rapidly
as the national average. All but 22 of these were in the South and West. An

160 I NATIONAL CIVIC REVIEW
additional 163 districts grew at a rate have lost population, 83 of them in the lower than the national average. Midwest and Northeast. The distribu- Ninety-four districts are estimated to tion by region is shown below:
Population Change of Congressional Districts by Region, 1980-86
Total Population Population increase, 1980-86 Congressional loss, Less than 6.4 to 19.9 20 percent
Region districts 1980-86 6.4 percent percent or more
us. 435 94 163 144 34
Northeast 95 31 54 10 Midwest 113 52 49 12 South 142 10 47 65 20 West 85 1 13 57 14
The estimates are based on provi- sional county estimates for 1986 released by the Census Bureau on Au- gust 31, 1987 (Series P-26, No. 86-A), and on 1986 estimates just completed for 36,000 sub-county areas, to be pub- lished in Series P-26 in 1988. To obtain copies, contact: Supertinendent of Documents, United States Government Printing Office, Washington, DC 20402.
U.S. Voting Age Population up by 8 Million, 1984-89
The nation’s voting age population is expected to total 183 million by November 1. 1989, up more than 8 mil- lion from November 1984, according to projections made by the United States Bureau of the Census. The
projection is 4.1 million higher than the total at the time of the congressional election of November 1986.
Voting age population growth con- tinues to be concentrated among per- sons aged 25 to 44, who were born at the height of the baby boom. This age group will have increased by nearly 17 million since 1980 and should total some 79 million by this November. Their share of the voting age popula- tion will have grown to 43.5 percent, up from 38.5 percent in 1980.
The voting age population aged 65 and over will have grown by 5.1 mil- lion since 1980, increasing their num- ber to 30.6 million and their share from 15.7 percent to 16.8 percent of the to- tal. Those aged 45 to 64 will have grown by 1.5 million, their share drop- ping from 27.3 percent to 25.2 percent.

METROTRENDS I161
The number of persons aged 18 to 24 will have declined by more than 3.5 million since 1980 and will comprise only 14.5 percent of the voting age population this November, down from 18.4 percent.
More than one-third of the voting age population is expected to be living in the South, an increase of nearly 2 million since the 1986 election, or 3.2 percentage points. The voting age population in the West will have grown by 4 percentage points but still will be the smallest total among the four regions.
Nearly one-fourth of Florida’s vot- ing age population will be over age 65, with a median age over 45. Alaska will have the youngest voting age popu- lation.
Voting age women will outnumber men by nearly 8 million, comprising 52 percent of that population. Their highest proportion will be in the Northeast, and they will outnumber men in all age groups except those 18 to 24, where the numbers will be about equal. Women will comprise nearly 60
percent of the voting age population aged 65 and over.
Blacks will represent 11 percent of the voting age population. More than half of the 20.4 million blacks of vot- ing age will live in the voting age popu- lation, totaling some 13 million. Ttvo-thirds of the Hispanic voting age population will live in California, Texas, and New York; they will com- prise more than 20 percent of the vot- ing age populations in both California and Tewas, and 10 percent in New York.
The report also traces voter partici- pation in selected past presidential and congressional elections for the nation, regions, and states.
The projections are based on the resident population, including mem- bers of armed forces stationed in the states, and excludes all persons living overseas.
Copies of Projections of the Popu- lation of Voting Age for States, November 1988, Series P-25, No. 1019, are available from the Superintendent of Documents, United States Govern- ment Printing Office, Washington, D.C. 20402.