metrics that matter™ in leadership development articles/knowledgeadvisors/ka0603... · metrics...
TRANSCRIPT

Metrics That Matter™ in Leadership Development
March 10, 2006
Jeff SnipesPresident and CEONinth House, Inc.
Jami YorkDirector of Learning ServicesNinth House, Inc.

2
Overview
• Introductions
• Trends in Measuring Leadership Development
• How Ninth House Uses MTM
• Key Findings from 15 Client Implementations
• Select Customer Stories
• Best Practices & Recommendations
• Questions & Answers
3
Ninth House
• Focus: Leadership Development
• Unique Approach:Great content in a blended package for more effective results, faster and less expensive than traditional training.
• Tailored Business Solutions: High Potential & New Manager Development Creating More Adaptive Organizations Selecting and Retaining Key Talent
• Customers & Awards: Nearly 200 Fortune 1000 and Federal Organizations

4
Today’s Speakers
Jeff Snipes
CEO & Founder
Ninth House, Inc.
Named by both Gartner and Forbes as a leader in its industry, Ninth House offers organizations a highly effective yet scalable approach to leadership development.
Jeff works closely with the leading HR and Training executives of several Fortune 500 organizations to design effective, large scale leadership development systems.
Jami York
Director of Learning Services
Ninth House, Inc.
Since joining Ninth House in 1999, Jami has led the implementation of more than 40 online and blended leadership deployments.
Jami now serves as the Director of Learning Services and is responsible for the successful implementation and measurement of almost 200 Ninth House customers.

5
Market Trends
• U.S. Organizations spend $9B a year on formal leadership development programs (ASTD/Training).
• Yet less than half (40%) have metrics in place to evaluate the overall effectiveness of their leadership development practices (NH).
• And only 55% monitor objective, quantifiable indicators of leadership effectiveness on an on-going basis (NH).
Source: “Leadership Development Practices of Top-Performing Organizations”, Ninth House 2006

6
How Top Organizations Measure Leadership
Current Ideal
Talent Retention 31% 46%
Learner Satisfaction 19% 0%
Knowledge Retention 15% 0%
Financial Results 12% 46%
Employee Engagement 8% 38%
Organizational Culture 8% 12%
Customer Satisfaction 0% 12%
Source: “Leadership Development Practices of Top-Performing Organizations”, Ninth House 2006

7
CommunityDiscussion
Group Session in Virtual Classroom
Applying New Skills to Daily Environment
Full Library of Instant Advice Modules
Features 450+ Workplace Challenges
Assessing & Tracking Progress
Measuring Organizational Impact
Pre/Post Testing & 360 Degree Multi-raters
Self-Paced Interactive Learning
Engaging Format
High-Quality Content
Initiative-SpecificLearning Strategy
Align Training & Business Goals
ImplementationStrategy
Our Approach to Blended Learning
8
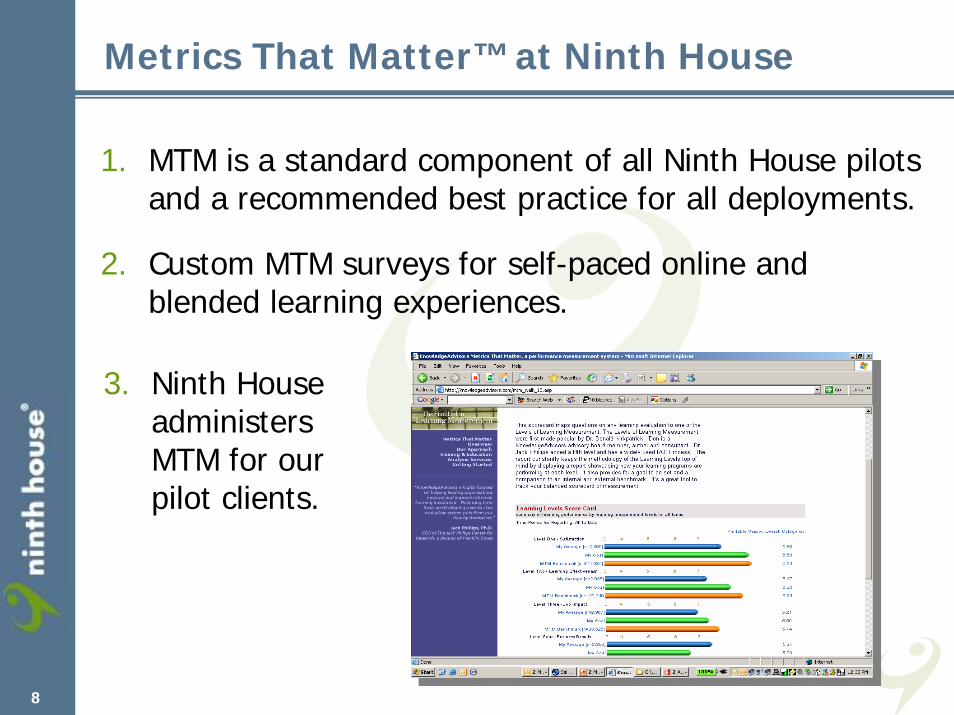
Metrics That Matter™ at Ninth House
1. MTM is a standard component of all Ninth House pilots and a recommended best practice for all deployments.
2. Custom MTM surveys for self-paced online and blended learning experiences.
3. Ninth House administers MTM for our pilot clients.
9
Metrics That Matter™ at Ninth House
4. MTM Post Event survey completed immediately following learning experience.
5. Quick Question and Human Capital ROI Scorecardare standard reports.
6. Creation of Executive Summary Report leveraging the End of Program Summary from MTM.

10
Key Findings across NH Clients
Based on MTM aggregate reports:
• 80% expect the program will significantly impact employee satisfaction (78% above average)
• 65% expect the program will significantly impact productivity (37% above average)
• 65% experienced significant knowledge and skill gains (25% above average)
• 70% were very satisfied with the overall program, content & delivery (20% above average)

11
Online Learning (Leadership vs. All Other Topics)
57%
70%
50%
62%
39%
51%
36%41%
0%
20%
40%
60%
80%
100%
satisfaction
effective
impact
results
cost: benefitAll Topics Technology Leadership
All Topics = 128,298 Online Tech = 12,939 Online Leadership = 636
Measurement Summary20:1
13:112:1

12
Online Learning (Leadership vs. All Other Topics)
0%
20%
40%
60%
80%
quality
costscycle time
productivity
salescust sat
employee satAll Topics Technology LeadershipAll Topics = 128,298
Online Tech = 12,939 Online Leadership = 636
Measurement of “Results”79%
13
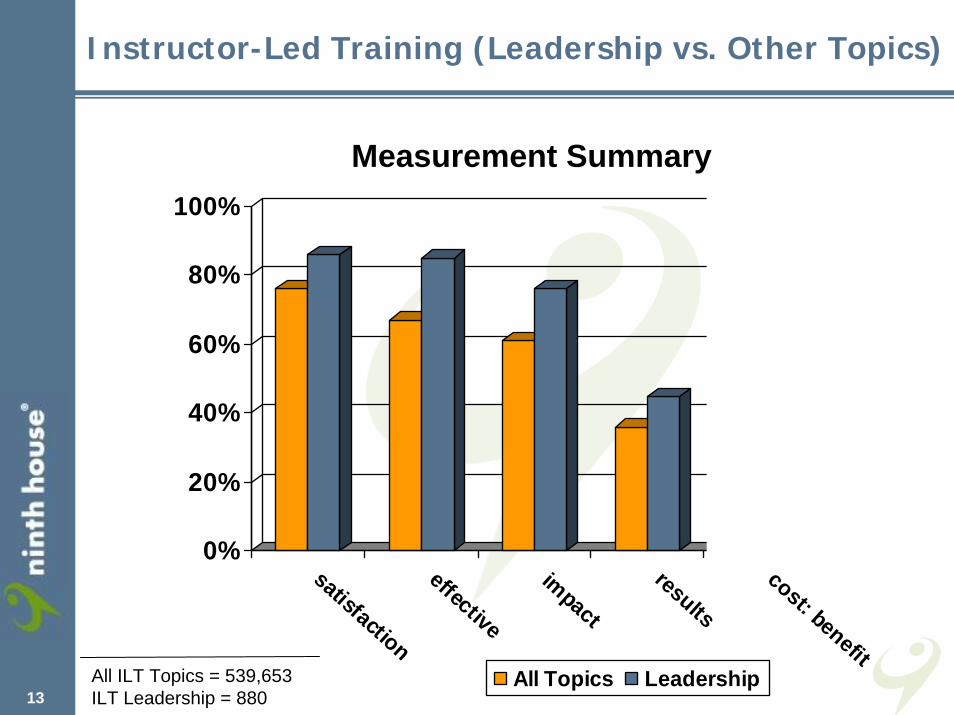
Instructor-Led Training (Leadership vs. Other Topics)
0%
20%
40%
60%
80%
100%
satisfaction
effective
impact
results
cost: benefitAll Topics LeadershipAll ILT Topics = 539,653
ILT Leadership = 880
Measurement Summary
7:1
4:1

14
Instructor-Led Training (Leadership vs. Other Topics)
0%
20%
40%
60%
80%
100%
quality
costscycle time
productivity
salescust sat
employee sat
All Topics Leadership
Measurement of “Results”
89%
All ILT Topics = 539,653 ILT Leadership = 880

15
Leadership Training (On-Line vs. Instructor-Led)
0%
20%
40%
60%
80%
100%
qualitycosts
cycle time
productivity
salescust sat
emp sat
cost/benefit
Instructor-Led On-LineILT Participants = 880 Online Participants = 636
20:1
7:1
Measurement of “Results”

16
Summary of Key Findings
1. Leadership Training scores better than the average of other training topics across all measurement categories…
… and it is more effective at improving employee satisfaction.
2. Leadership Training has a 60% greater cost / benefit ratio than the average of all other training programs.
3. Instructor-Led Leadership Training is slightly more effective than Online delivery alone (10%), but Online Leadership Training has a 300% greater cost / benefit ratio.

17
Client Stories: TAP Pharmaceutical
• Blended Leadership initiative with District Managers and Regional Managers across the country.
• Used a customized approach to measurement and found the following results:
51% expect an increase in customer satisfaction
73% expect an increase in employee satisfaction
88% expect an increase in employee retention
81% expect an increase in the quality of the manager/employee relationship

18
Client Stories: Ford Motor Co.
• Positioned MTM as part of an integrated leadership development solution for Ford IT.
• MTM measures impact of the Ford IT initiatives involving the following NH courses:
Systems Thinking(“Forging Breakthroughs”)
Diversity and Community Building(“Building Community”)
Internal & External Partnering(“Partnering for Results”)
Leadership & Management(Situational Leadership II)

19
Client Stories: Ford Motor Co. (cont’d)
• Key Findings:
70% expect the program will significantly impact increasing employee satisfaction
61% expect the program will significantly impact increasing productivity
74% were very satisfied with the overall program, content & delivery
70% felt the training was a very worthwhile investment
During times of a challenging fiscal environment, this data enabled Ford to justify continued investment in people through Leadership Development.

20
Client Stories: United States Navy
• 44% improvement in knowledge and retention of material
• 94% cost savings with online learning
• 90% saving in time required for course
• Statistically significant improvement in on the job performance (3,500 multi-rater participants over 12 months)

21
Best Practices & Recommendations
• Incorporate some measurement practices into all leadership development initiatives.
• Maintain a simple process/tool for gathering data. (i.e. One assessment for each blended initiative)
• Establish consistency in surveys so as to be able to leverage benchmarking capability of MTM.
• Continuously analyze the data being gathered, and learn from it to improve your offerings.

22
Measuring Employee Engagement
Organizations evaluating Leadership Developmentinitiatives should customize their standard MTM “Results” metrics to include measuring impact on retention and employee engagement in more detail:
Manager / Direct Report Relationship
Recognition / Feeling Valued
Opportunity for Learning & Growth
Team Collaboration / Sense of Community
Making an Impact

Q & A