metrics & more
TRANSCRIPT

Metrics & more how to monitor big data systems @scale!

About meStefan Thies
@seti321
!DevOps Evangelist @sematext!

Why monitoring is important
• Tuning !
• Detecting Bugs!
• Stability!
• Benchmarks!
• Capacity planning!
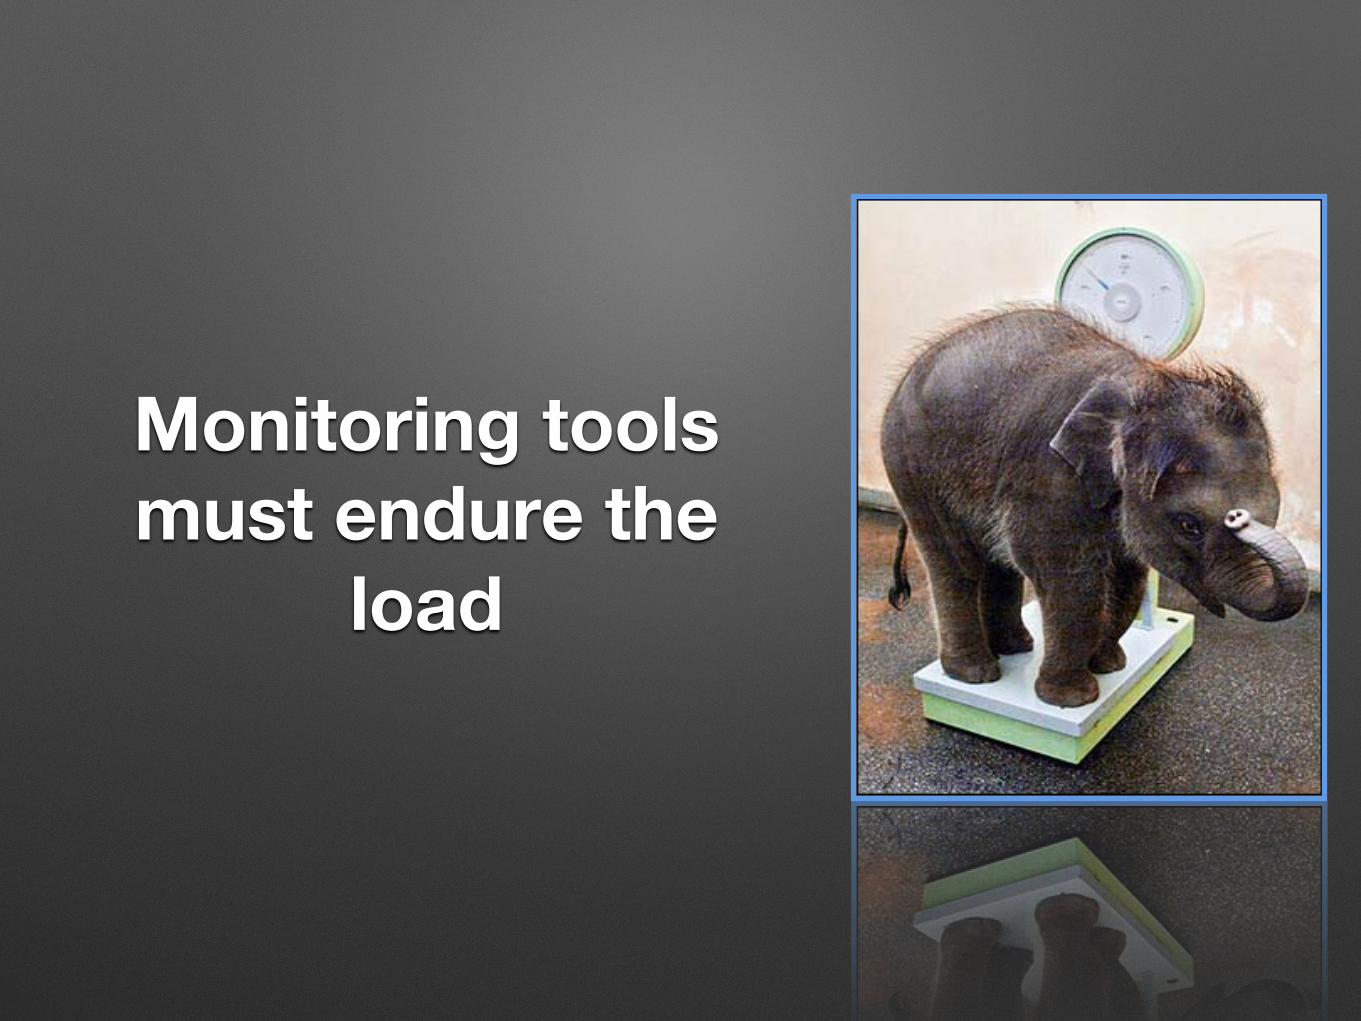
Monitoring tools must endure the
load

Would you start building own scales, when you would operate a real zoo?
- What’s your mechanical engineering expertise? - How long does it take to get tools and raw material? - Who feeds the animals while being in the workshop? - When do we need it and could it be ‚in time‘?

Let’s take something from
the shelf and build a custom
interface
‚load balancers‘!‚Custom Interface‘!

What happens @scale?
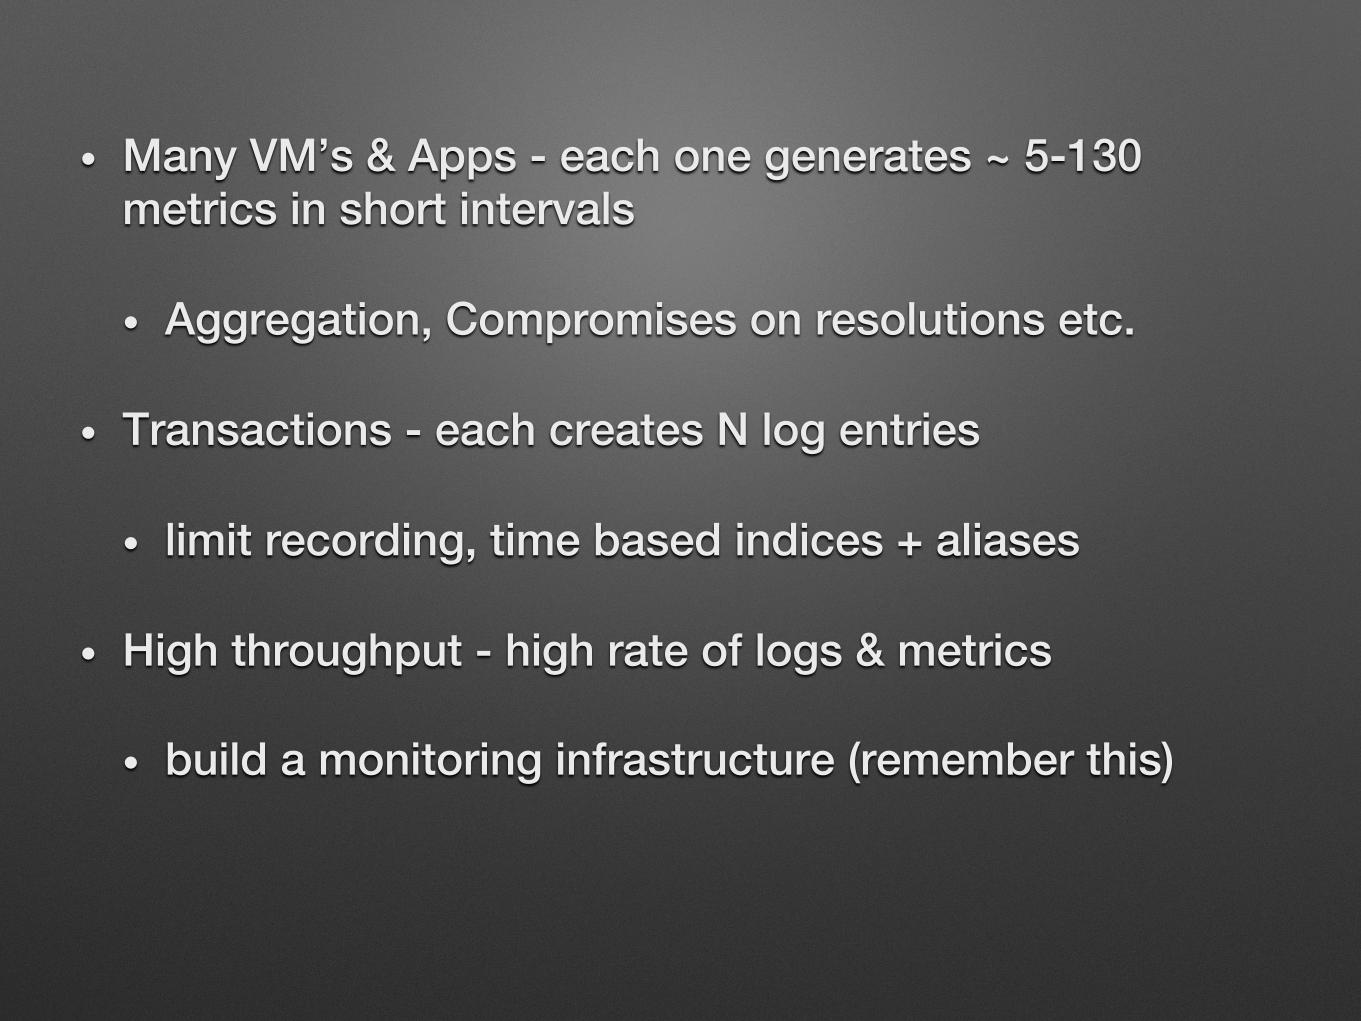
• Many VM’s & Apps - each one generates ~ 5-130 metrics in short intervals!
• Aggregation, Compromises on resolutions etc.!
• Transactions - each creates N log entries !
• limit recording, time based indices + aliases!
• High throughput - high rate of logs & metrics!
• build a monitoring infrastructure (remember this)!
!

METRIC SOURCE! NUMBER OF METRICS TO COLLECT!
OS (CPU. Mem, Disk) 21
Hadoop 133
Hbase 68
Elasticsearch 62
Apache Storm 25
Total 309
~ 3,1 Mio. data points per week x N machines !!
Example - No. of metrics per application!
25 Metric Categories !
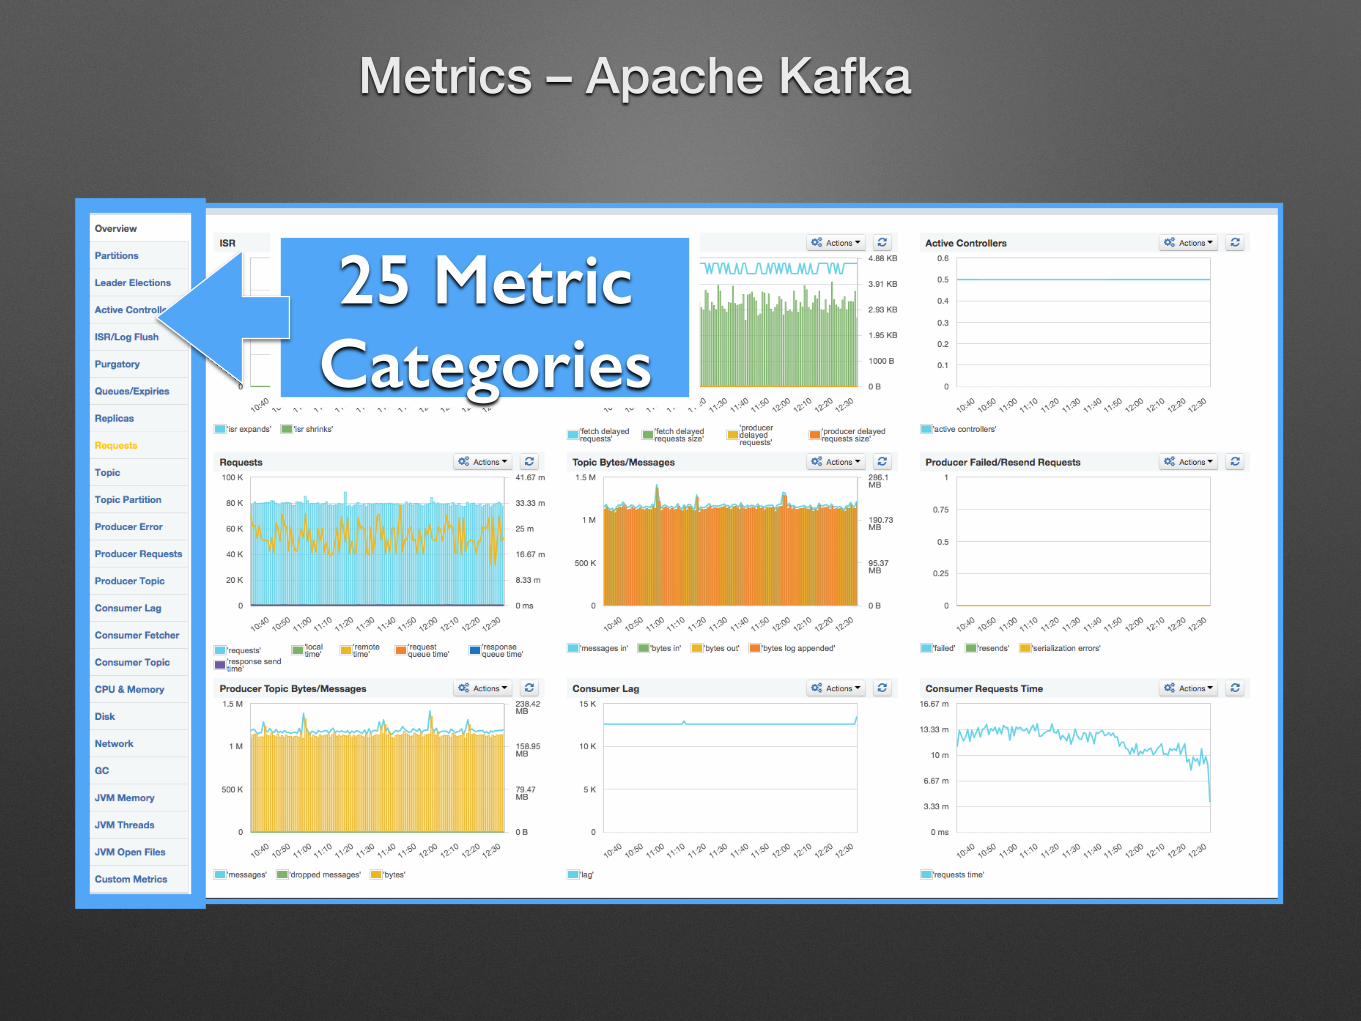
Metrics – Apache Kafka!

• Find out and define metrics to collect !
• Install, configure collectd, statsd, graphite, …!
• Build, install / configure available agents!
• Define reports or arrange all collected metrics to dashboards e.g. grafana, …!
• This are the basics!!
• automate deployment for agents!
#monitoringsucks

#monitoringlove • Integrate with the organization !
• alerting workflows + multi-user + security!
• Scale out: !
• Distributed event processing (e.g. Kafka)!
• Scalable data stores (e.g. Elasticsearch, HBase)!
• Add intelligence: !
• Machine learning for metrics & events!
• Alerting & Reporting based on it!
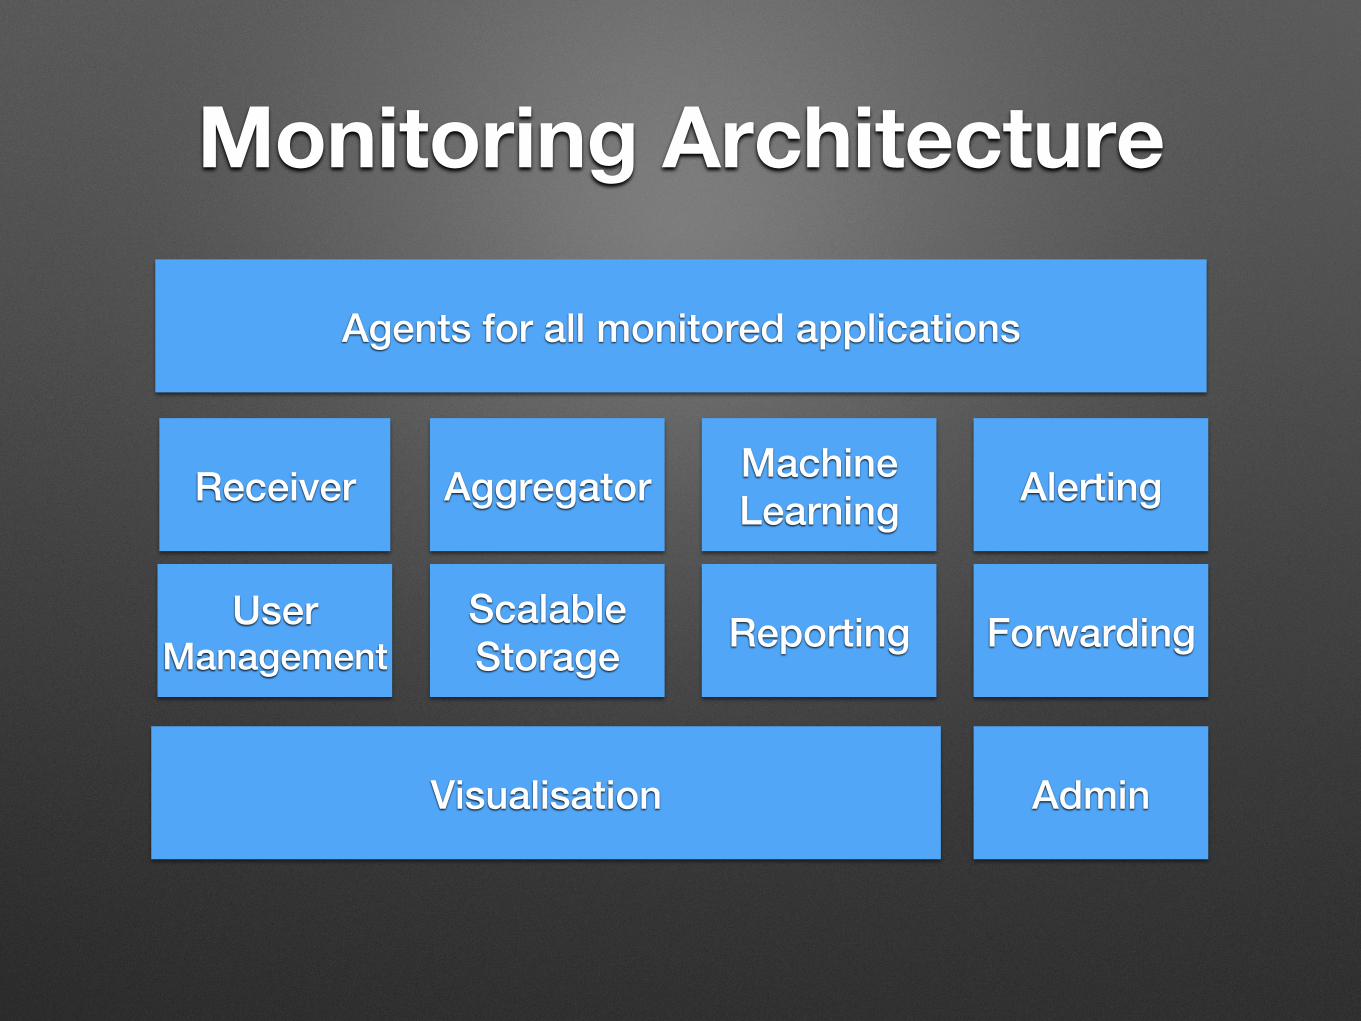
Monitoring Architecture
Receiver! Aggregator!
Scalable!Storage! Reporting!
Machine Learning! Alerting!
Forwarding!User Management!
Agents for all monitored applications!
Visualisation! Admin!


What can we findin the wild?

Network Level
• Packets: loss, size, counts!
• Latency, jitters, delays!
• Bandwidth – total, per link, per service, !
• Firewalls / security breaches!
• IDS, IPS – yet another malware detected !
• On physical, transport, application layer, ...!

Server Level
• Disk I/O!
• CPU load!
• Disk Space !
• Memory!
• Logs / security / events / syslog!

Standard Applications
• Webservers, Databases, Search Engines, MQ‘s!
• Request rates, disk space, partitions, locks, connections, queue sizes, cache sizes!
• Logfiles!

Hadoop, Elasticsearch, Cassandra, Kafka, Storm Spark, ...!

Example: Elasticsearch
Link: Top Metrics !

Own Application Custom Metrics & Logs
• Logs & API for measurement!
• Time measurements, KPI‘s, Usage tracking, Object counters, Click Streams!

Application Traces
• Post mortem analysis!
process.on (‚exit‘, heapdumpAndDie)
• Dtrace !
• Call Traces, Error stacks!
• Heapdumps & Flamegraphs!
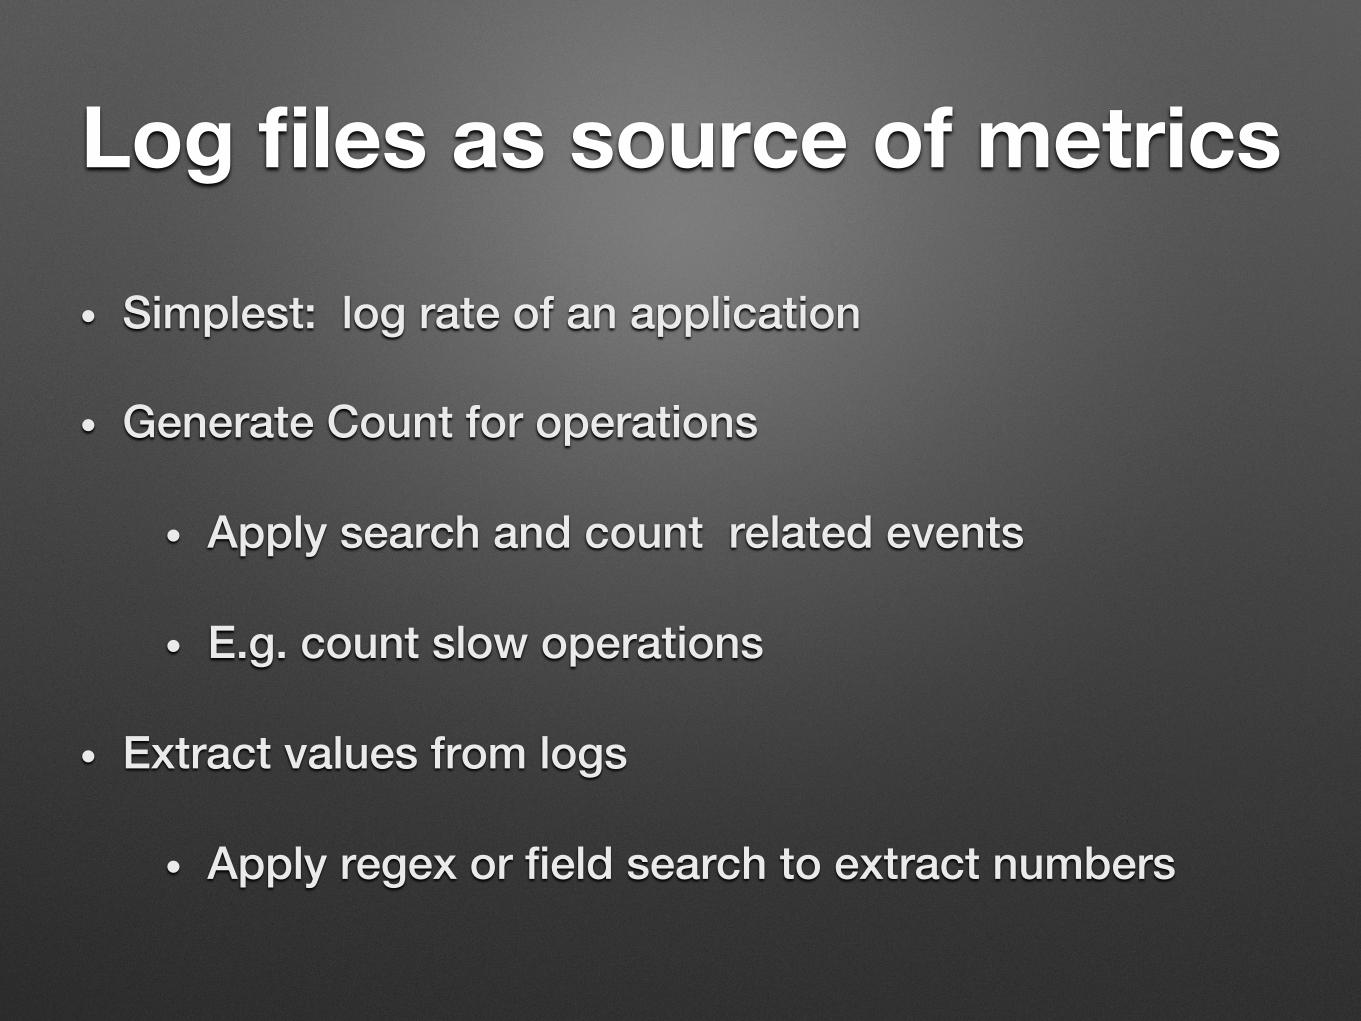
Log files as source of metrics
• Simplest: log rate of an application!
• Generate Count for operations!
• Apply search and count related events!
• E.g. count slow operations!
• Extract values from logs !
• Apply regex or field search to extract numbers !

Logs2Metrics
Logs! Index!
Scheduled Queries!
aggregate all messages matching e.g.
„session opened“ every Minute e.g. on
auth.log
Custom !Metric!
Monitoring !System!

A Checklist for the introduction of monitoring solutions

Define your criterias • Coverage of monitors/agents!
• Quality of agents & setup!
• Multi-User Support!
• Reporting Capability & Secure Sharing!
• Alerting capabilities!
• Integrations / Notifications / API‘s!
• Estimate required resources !

Map your landscape
• Quantity of servers & applications to monitor!
• What are the components of your App-Stack?!
• Linux on AWS, NGINX, Node.js, REDIS, Elasticsearch!
• Which programming languages are used?!
• Can you find agents/monitors for all your ‚Apps‘?!
• List missing parts -> find other or build a monitor!

Customizing – custom metrics/plugins
• What metrics are relevant for each ‚App‘?!
• What is covered by existing agents?!
• How to aggregate each of this metrics? !
• min, max, sum, avg!
• Pre-Aggregation vs. Query Time Aggregation!

Dashboards • Graphs!
• Which metrics belong together?!
• Display options ….!
• Query language !
• Dashboards!
• What combination of graphs provides best insight?!
• Can you share and re-use arranged dashboards for similar setups or situations? !
• Or do you need to configure it again for other servers?!
• Is sharing secured? Or just a link to your UI?!

Alerts
• Threshold based alerts!
• Status changes !
• Heartbeat alerts!
• Anomaly detection!
• Challenges: Number of alert rules and queries !& tuning ‘noise level’!
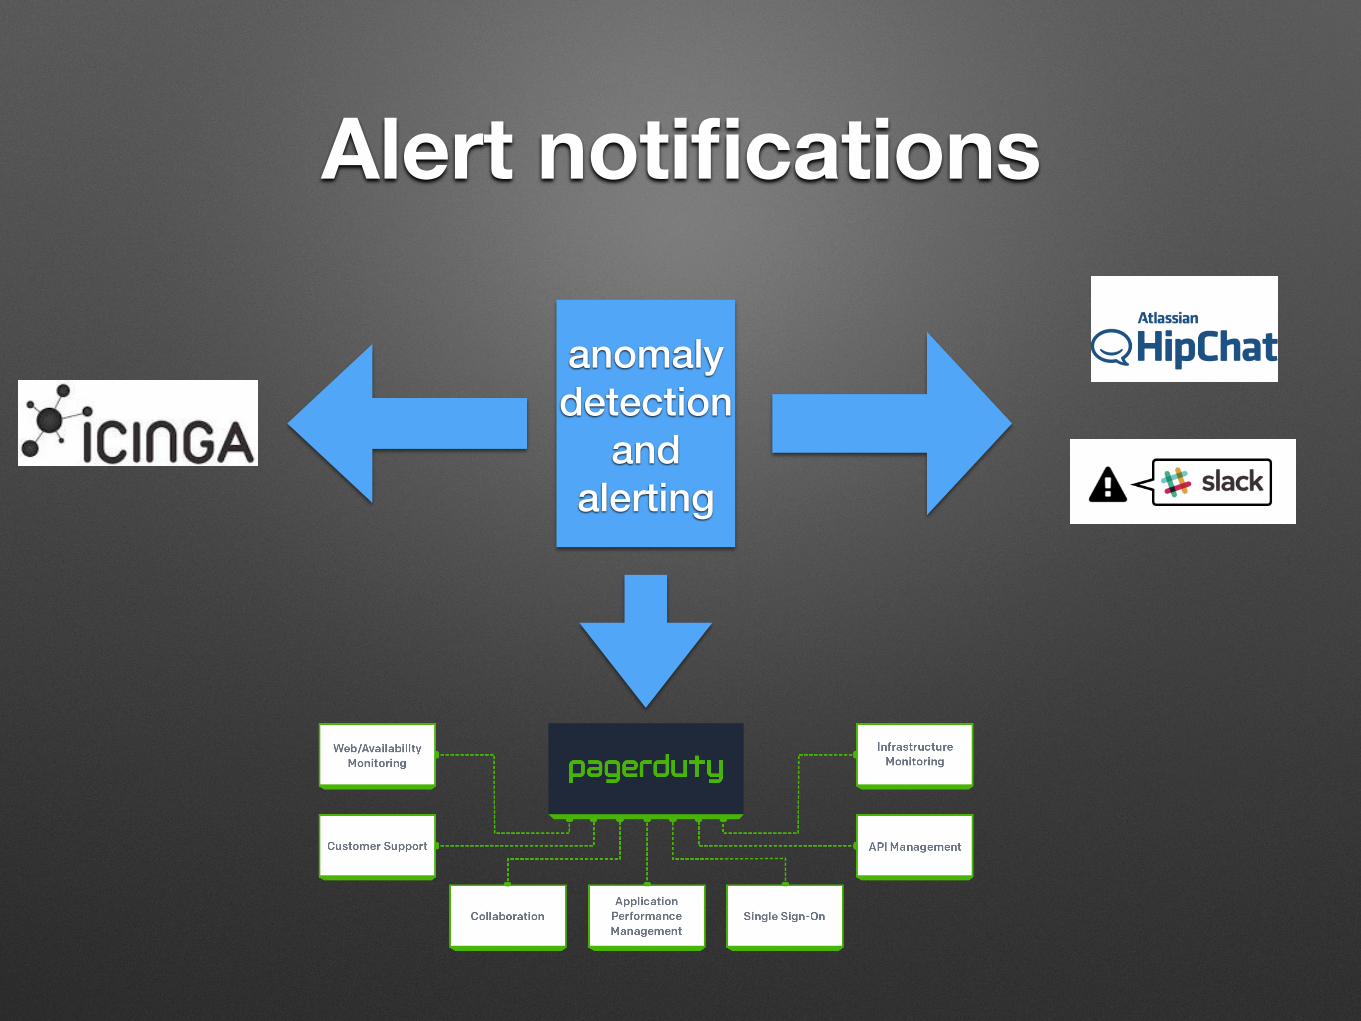
Alert notifications
anomaly detection
and alerting!
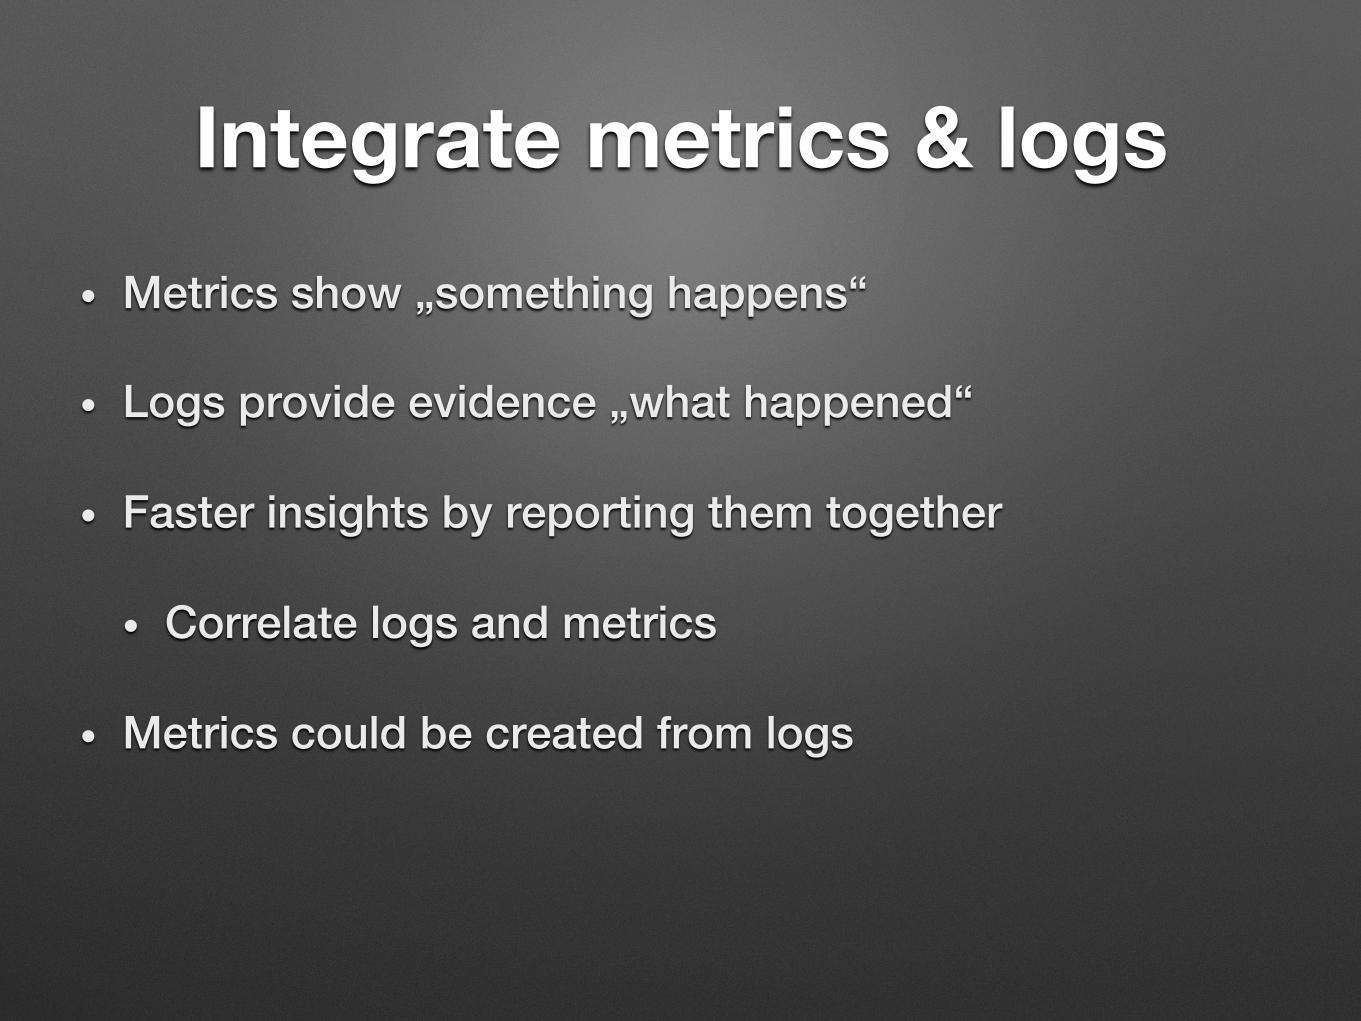
• Metrics show „something happens“!
• Logs provide evidence „what happened“!
• Faster insights by reporting them together!
• Correlate logs and metrics!
• Metrics could be created from logs!
Integrate metrics & logs

Correlate Logs & Metrics
A brief overview of Centralizing Logs
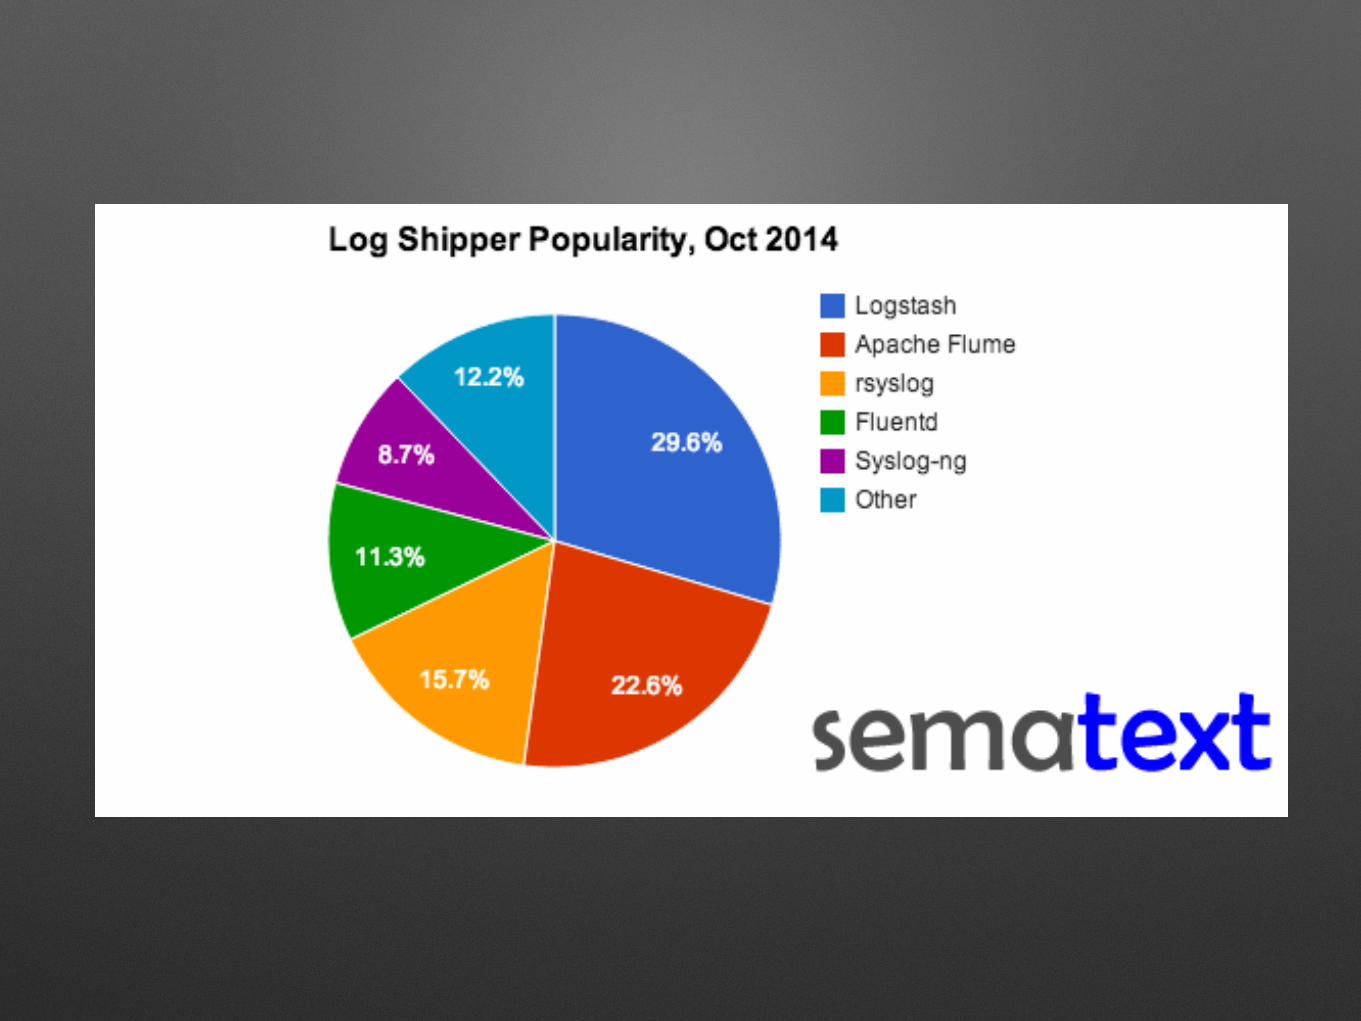

raw logs! parser! Log shipper! storage! Visualization!
Kibana!Elasticsearch!Logstash!
Where is the work?!
Centralizing Logs with ELK !
files, syslog!
Format adaption,!& transport!
Tuning !Maintenance!
Queries!Security !

• Input: Unstructured log lines!
• Filter & Parser: Grok / RegEx!
• Output: Structured JSON!
• Forwarder: !
• Elasticsearch, …!

• Schema: Define the right Mapping
• Insert rate:!
• Use bulk indexing!
• Increase refresh time for higher insert rate!
• Volume: !
• Aliases and time based indices!
• Memory usage: configure caching limits!
Setup Elasticsearch

• How to secure it? !
• Proxies, Security plugins, Hosted Solutions!
• Queries and dashboard creation!
• generators/templates for specific setups!
• Learn Lucene query language!
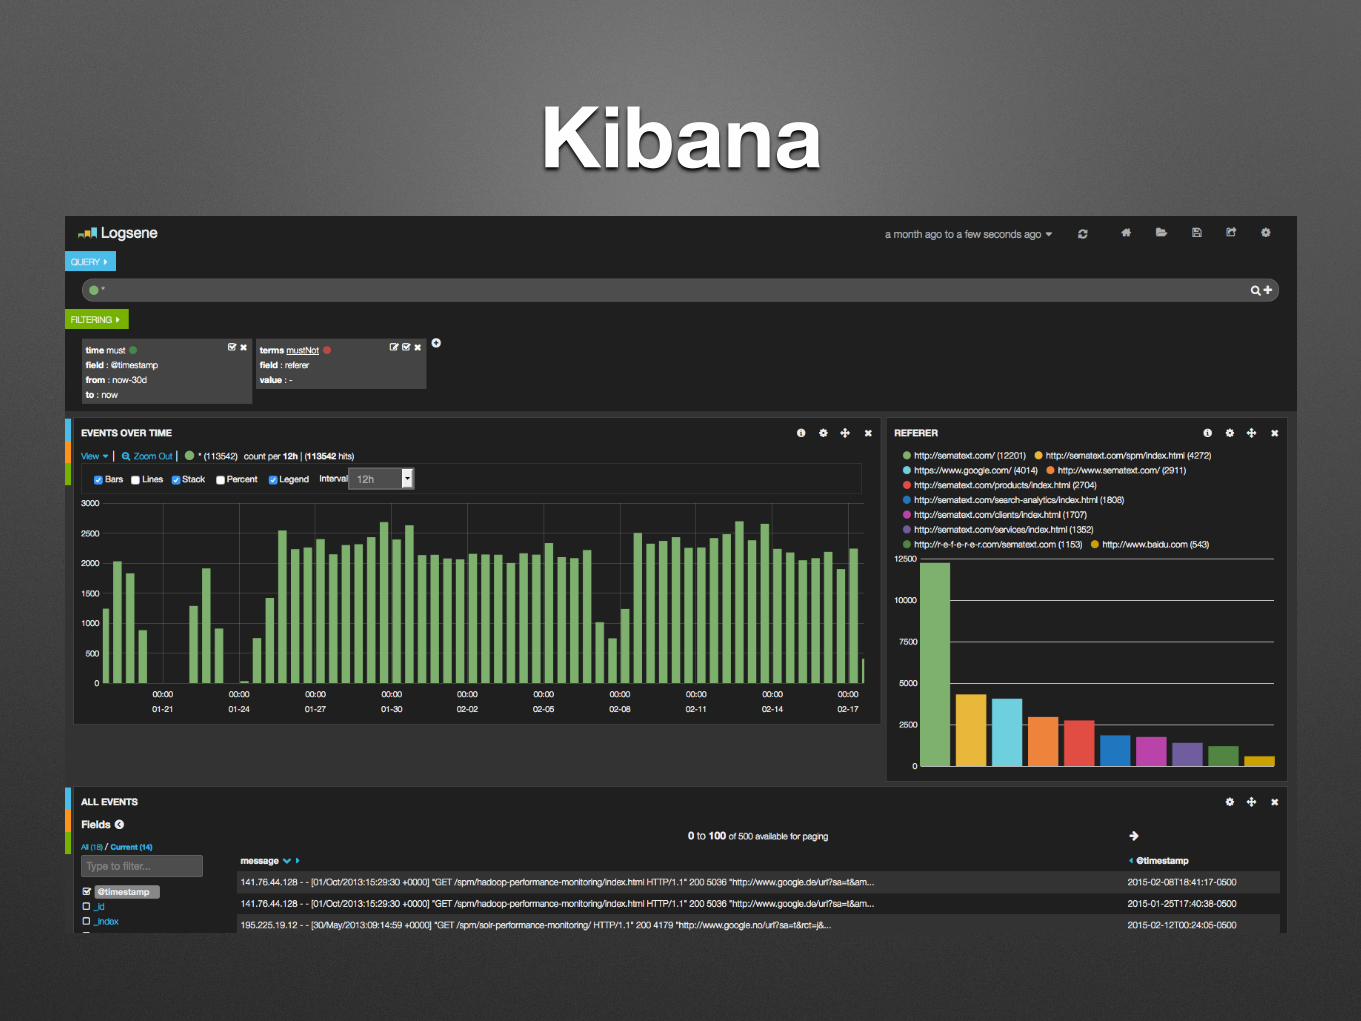
Kibana

Thank you for !your attention!
http://blog.sematext.com!