metrics driven dev ops 2017
TRANSCRIPT

Metrics-Driven DevOpsMyrvin Yap: [email protected]: https://www.spreaker.com/show/pureperformance

confidential

Confidential, Dynatrace, LLC
Develop
Ship
Deploy
Run
Scale
Compute
nodejs mongo db netty cassandra redis
ansible jenkins puppet chef
docker cloudfoundry rh openshift rh atomic rocket
core os rancher kvm busybox
mesos marathon kubernetes swarm
amazon azure openstack mesosphere calico weave
eureka/hystrix
A whole new technology stack & polyglot development

Code Complexity From Monolith to Microservice
No automated testing in the pipeline Cross Application Impacts

confidential
24 “Features in a Box” Ship the whole box!
Very late feedback
confidential
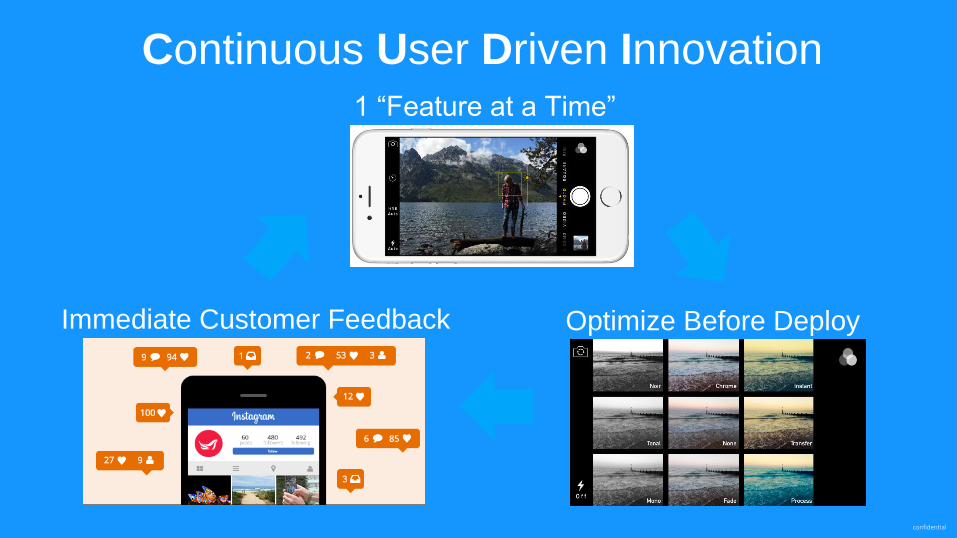
Continuous User Driven Innovation
1 “Feature at a Time”
Optimize Before DeployImmediate Customer Feedback

@grabnerandi
You measure it! from Dev (to) Ops

confidential
DevOps !=
Install Jenkins +
Micro-services & Cloud

@grabnerandi
Not every Sprint ends without bruises!

@grabnerandi
Richard Dominguez
Developer in Operations
Prep Sportswear
„In 2013 business demanded to go
from monthly to daily deployments“
„80% failed!“

@grabnerandi
Scaling an Online Sports Club Search Service
2015201420xx
Response Time
2016+
1) 2-Man Project 2) Limited Success
3) Start Expansion
4) Performance
Slows Growth Users
5) Potential Decline?

@grabnerandi
Early 2015: Monolith Under Pressure
Can‘t scale vertically endlessly!
May: 2.68s 94.09% CPU Bound
April: 0.52s
@grabnerandi
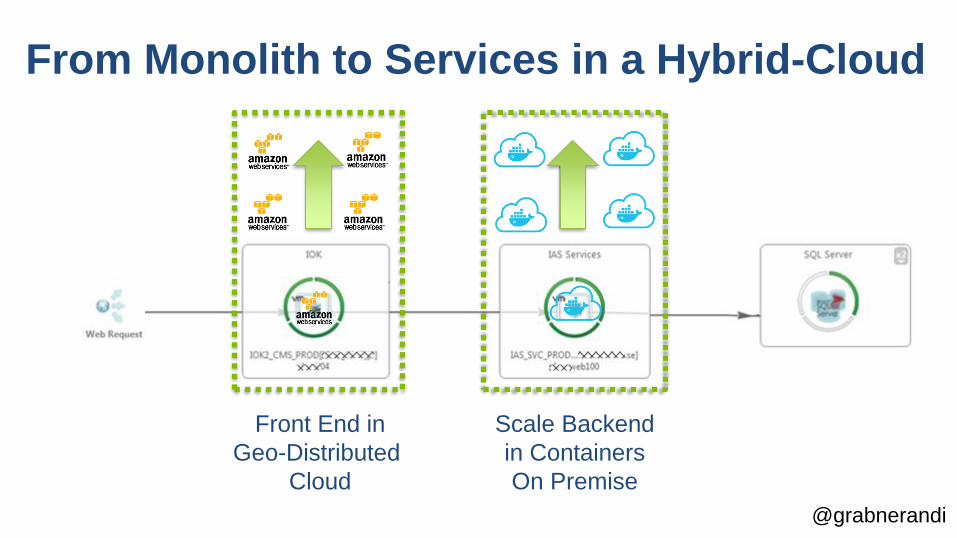
From Monolith to Services in a Hybrid-Cloud
Front End in
Geo-Distributed
Cloud
Scale Backend
in Containers
On Premise

@grabnerandi
Go live – 7:00 a.m.

@grabnerandi
Go live – 12:00 p.m.

What Went Wrong?

@grabnerandi
26.7s Load Time
5kB Payload
33! Service Calls
99kB - 3kB for each call!
171! Total SQL Count
Architecture ViolationDirect access to DB from frontend service
Single search query end-to-end

Understanding Code Complexity• Existing 10 year old code & 3rd party
• Skills: Not everyone is a perf expert or born architect
From Monolith to Microservice• Service usage in the End-to-End Scenarios?
• Will it scale? Or is it just a new monolith?
Understand Deployment Complexity• When moving to Cloud/Virtual: Costs, Latency …
• Old & new patterns, e.g: N+1 Query, Data
Understand Your End Users• What they like and what they DONT like!
• Its priority list & input for other teams, e.g: testing

@grabnerandi

@grabnerandi
“To Deliver High Quality Working Software Faster“
„We have to Shift-Left Performance to Optimize Pipelines“http://apmblog.dynatrace.com/2016/10/04/scaling-continuous-delivery-shift-left-performance-to-improve-lead-time-pipeline-flow/

Reduce Lead Time: Stop 80% of Performance Issues in your Integration Phase
CI/CD: Test Automation (Selenium, Appium, Cucumber, Silk, ...) to
detect functional and architectural (performance, scalabilty) regressions
Perf: Performance Test (JMeter, LoadRunner, Neotys, Silk, ...) to
detect tough performance issues

= Functional Result (passed/failed)+ Web Performance Metrics (# of Images, # of JavaScript, Page Load Time, ...)+ App Performance Metrics (# of SQL, # of Logs, # of API Calls, # of Exceptions ...)
Fail the build early!

@grabnerandi
The fixed end-to-end use case“Re-architect” vs. “Migrate” to Service-Orientation
2.5s (vs 26.7)
5kB Payload
1! (vs 33!) Service Call
5kB (vs 99) Payload!
3! (vs 177)
Total SQL Count

confidential
Show time!

confidential
2-Tier Micro-Service App

confidential
Build, deploy and test this application through Jenkins

confidential
Push 2 Versions of the App through our Pipeline

confidential
Detect the regression

confidential
Fail the pipeline

confidential
Use Case: DevOps
Transformation @ Dynatrace

confidential
Challenges to master!
Deploying the same way our customers do: Continuously!
Not disrupting current operations and slower moving customers
Aligning 300+ engineers across 3 different geos
Solution: Innovation through Incubation!

2 major releases/year
customers deploy & operate on-prem
26 major releases/year
170 prod deployments/day
self-service online sales
SaaS &
Managed
2011 2016

33 COMPANY CONFIDENTIAL – DO NOT DISTRIBUTE #Perform2015
believe in the mission impossible
6 monthsmajor/minor release
+ intermediate fix-packs
+ weeks to months
rollout delay
sprint releases (continuous-delivery)
1h : code to production

NOC lessons learnt

Shift-Left QualityQuality/Performance matters in Dev/Staging as well!Make Dev/CSA/PM dependent from Quality in trunk!
DevOps = start thinking like an Ops before Commit
Shift-Right Metricsenable DEVs defining quality metrics make DEVs to the primary consumers of their metrics

acting as
Engineers
Role of Dynatrace DevOps Team
Dynatrace Managed/SaaS
Orchestration Layer
Dynatrace Pipeline Visualization
Deployment Timeline
Log Overview
using Dynatrace Log APIJIRA Integrations
&
Product Managers

confidentialhttps://github.com/Dynatrace/ufo
Raising Awareness of Pipeline Quality

confidential
Dev/Test: Bad Code Changes
Ops/Biz: Unhappy End Users
Performance: Overloaded COEs

confidential
Dev/Test: Check-In Better Code
Ops/Biz: Use Real-Time End User Feedback
CI/CD/Performance: Stop Bad Builds Faster

ruxit theme 2014.05.15
Be proud of your feature!DevOps NoOps

Dynatrace Transformation by the numbers
26
170
Releases / Year
Deployments / Day
31000 60hUnit & Int Tests / hour UI Tests per Build
More Quality
~200 340Code commits / day Stories per sprint
More Agile
93%Production bugs found by Dev
More Stability 450 99.998%Global EC2 Instances Global Availability

confidential
Final Thoughts …

confidential
% 20%organization & culture technology

Dynatrace as a common platform for collaboration
Businessstakeholder
Operationsstakeholder
Apps/Devstakeholder

confidential
Ecosystem …

confidential

confidential
AI-Driven Digital Operation Ecosystem
DAVIS / REST

Thank you.