metric lens on child poverty_a case study from jharkhand
TRANSCRIPT

Page 0
Authored by: Sk Mosharaf Hossain
Daltonganj Area Program, ChildFund India
January, 2016
Metric lens on child poverty
A case study from Jharkhand
CONTENTS Abbreviation
Introduction
Study background
Conceptual discussion
Rationale for the study
Key research questions
Scope of this case study
Study design
Reference period
Study area profile
Respondents’ segment
Sampling plan and implementation
Methodological note
Study results, interpretation and discussion
Profile of the children
Multidimensional child poverty
Child poverty and headcount ratio with cutoff
Factor and dimension contribution to child poverty
Poverty dimensions and their share in poverty
Who is poor in what?
Child prosperity
Gender effect on child poverty
Deprivation and household income
Findings summary and policy implications
Limitation of the study
References
Annexure

Page 1
Abbreviation
AMCP: Average Multidimensional Child Poverty
ASER: Annual Status of Education Report
BMI: Body Mass Index
BPL: Below Poverty Line
CCF: Christian Children Fund
DISE: District Information System for Education
HH: Household
MCP: Multidimensional Child Poverty
MDM: Mid-Day Meal
MOSPI: Ministry of Statistics and Program Implementation
NFHS: National Family Health Survey
OPHI: Oxford Poverty and Human Development Initiative
RTE: Right to Education

Page 2
1. Introduction
1.1 Study Background
Future prospect and superiority of a nation hinge upon status and development of its children in several ways. It has been well established that meaningful and timely investment on child development has multiplier effect in building the nation through a generation of a powerful manpower base. Development professionals, policy makers, economists and law-framers advocate unequivocally that young children---the base of future human capital--- require adequate care and nurture for survival, growth, development and gradually to be transitioning into economically productive adults. Therefore promise and commitment are stronger than ever before in providing children with an enabling environment where they grow and flourish in childhood, enjoy their rights in a setup well connected to all their requirements and develop to their full potential. Recently this policy intention is increasingly being observed in developing countries and needless to say it is for the good of children as well as the nation.
But children across the world, more particularly in developing countries like India, are deprived of essentials, excluded many ways unreasonably and vulnerable to a range of risks and shocks. This dejection—often under realized-- is impeding overall developmental attainment of a country. However this situation if ameliorated can drive the fortune instead. Though status of child poverty is recognized by people who are at the helm of Government, yet the nature and intensity of this development aspect is far from being fully perceived by general public irrespective of they belong to urban or rural areas.
A problem is first perceived, conceptualized, measured, debated then acted upon. That’s the usual pathways of looking into a development issue. This is why child poverty, child living in poverty, child deprivation, child wellbeing are the buzz words and being brainstormed in development sphere globally. Of late it’s the understanding that issue of child poverty has many elements and implications that make it distinctive from adult poverty. It is more for the fact that child needs special attention, specific care and particular environ to grow as adult.
So if we concur that child poverty has far reaching bearings and enormous policy implication, it is of course imperative to delve more into this phenomenon before we take call on bettering wellbeing of children. Like general poverty, child poverty, has no universally accepted definition and method of measurement. A number of well reputed organizations, academicians, researchers have and are making substantial efforts to put various aspects of child poverty into a perspective and sprucing up child poverty definitions. Next section will take a close look into some of the definitions recognized internationally.
• Children make up about one-third of India’s population of 1.21 billion
• India Is home to 400 million children
• India has 10.12 million child laborers aged between 5 to 14 years
• One in every 11 children is working
• Every second child born in India is malnourished
• Gross Enrollment Ratio to upper primary is below 50%
• Over 25% increase in child murders recorded since 2000.
• School dropout amongst girls is as high as 63%
• Two-third of child are victim of physical abuse, the majority are beaten in schools.
Source: MoSPI, Census-2011, NFSH, DISE

Page 3
1.2 Conceptual Discussion1
Child Poverty: As it is defined
Monetary Approach
Since 1990, in its World Development Report, World Bank has set poverty lines with periodic re-adjustment as and when need was perceived. Its income based poverty meter is set at $1.25 a day for an individual. If a child belongs to a poor family calculated by this standard, the child will be said to poor. This method is simple, easy to explain and most widely used. However many experts rationally rule this out as they think children’s need is much more complex and quite different from that of adults. This approach also excludes the consideration of gender, age, social fabric and so forth. If a child comes from rich family but his family doesn’t ensure basic needs like health care, sanitation, drinking water or if the child is subject to crime, political conflict, abuse and violence, he or she is to be considered not poor through the lens of development experts.
UNICEF’s Approach
It has a comprehensive and relatively all-encompassed definition for child poverty. It says “children living in poverty experience deprivation of material, spiritual and emotional resources needed to survive, develop and thrive, leaving them unable to enjoy their rights, achieve their full potential, or participate as full and equal members of the society” (United States General Assembly, 2006). In making the definition more working and practical UNICEF further states that “measuring child poverty can no longer be lumped together with general poverty assessment which often focus solely on income levels but must take into consideration access to basic social services especially nutrition, water, sanitation, shelter, education and information” (UNICEF,2007). This way of articulating child poverty is more plausible as it factors in various dimensions of child poverty. This definition includes materials that are critically important for a child to thrive. For more simplicity, a child, when falls short of certain standards of afore mentioned needs then the child will be considered under poor category.
Save the Children UK
UK based Save the Children; one of the leading child development organizations in the world has worked on defining child development-a measurement that directly relates to child poverty. It takes three dimensions viz health, education and nutrition to estimate a composite index for each child’s development and indicators used are: under 5 mortality rate (health), percentage of primary age children not in school (education) and percentage of under-five who are underweight. This measurement is arithmetic average of these three indicators and expressed on scale of 0 to 100.
1 With inputs from International Institute for Environment and Development (IIED), Vol 18(2): 481–500. DOI: 10.1177/095624780606962
Page 4
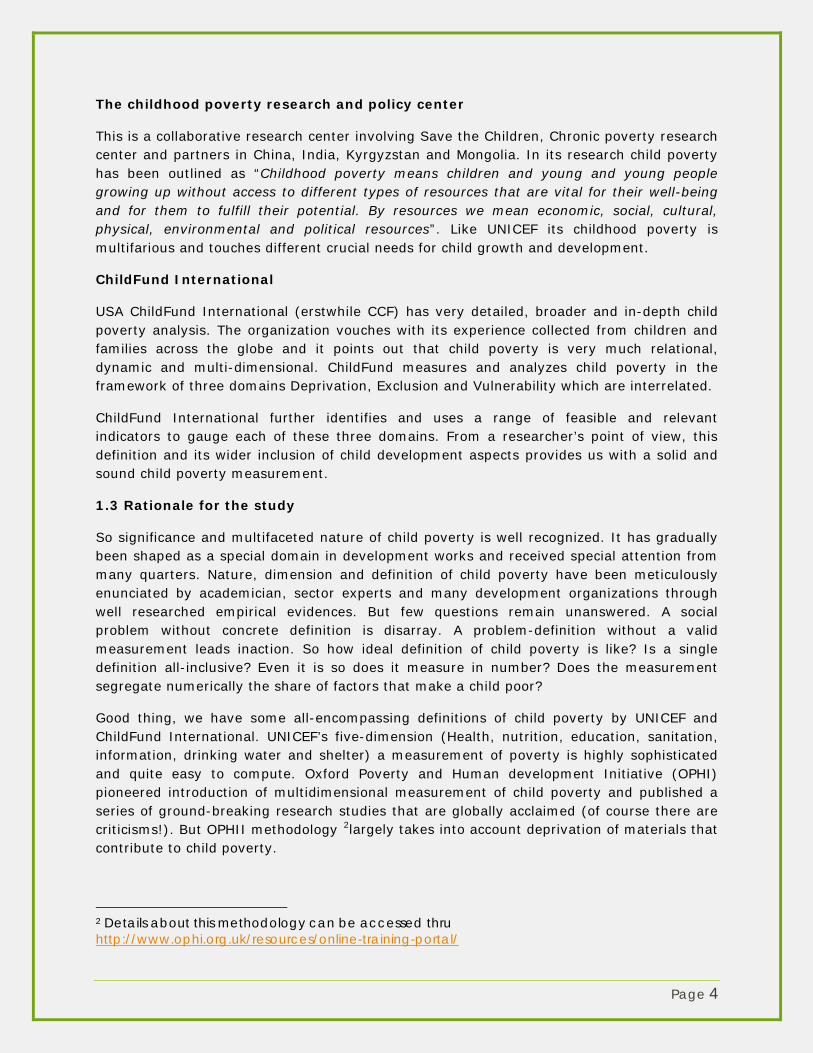
The childhood poverty research and policy center
This is a collaborative research center involving Save the Children, Chronic poverty research center and partners in China, India, Kyrgyzstan and Mongolia. In its research child poverty has been outlined as “Childhood poverty means children and young and young people growing up without access to different types of resources that are vital for their well-being and for them to fulfill their potential. By resources we mean economic, social, cultural, physical, environmental and political resources”. Like UNICEF its childhood poverty is multifarious and touches different crucial needs for child growth and development.
ChildFund International
USA ChildFund International (erstwhile CCF) has very detailed, broader and in-depth child poverty analysis. The organization vouches with its experience collected from children and families across the globe and it points out that child poverty is very much relational, dynamic and multi-dimensional. ChildFund measures and analyzes child poverty in the framework of three domains Deprivation, Exclusion and Vulnerability which are interrelated.
ChildFund International further identifies and uses a range of feasible and relevant indicators to gauge each of these three domains. From a researcher’s point of view, this definition and its wider inclusion of child development aspects provides us with a solid and sound child poverty measurement.
1.3 Rationale for the study
So significance and multifaceted nature of child poverty is well recognized. It has gradually been shaped as a special domain in development works and received special attention from many quarters. Nature, dimension and definition of child poverty have been meticulously enunciated by academician, sector experts and many development organizations through well researched empirical evidences. But few questions remain unanswered. A social problem without concrete definition is disarray. A problem-definition without a valid measurement leads inaction. So how ideal definition of child poverty is like? Is a single definition all-inclusive? Even it is so does it measure in number? Does the measurement segregate numerically the share of factors that make a child poor?
Good thing, we have some all-encompassing definitions of child poverty by UNICEF and ChildFund International. UNICEF’s five-dimension (Health, nutrition, education, sanitation, information, drinking water and shelter) a measurement of poverty is highly sophisticated and quite easy to compute. Oxford Poverty and Human development Initiative (OPHI) pioneered introduction of multidimensional measurement of child poverty and published a series of ground-breaking research studies that are globally acclaimed (of course there are criticisms!). But OPHII methodology 2largely takes into account deprivation of materials that contribute to child poverty.
2 Details about this methodology can be accessed thru http://www.ophi.org.uk/resources/online-training-portal/
Page 5
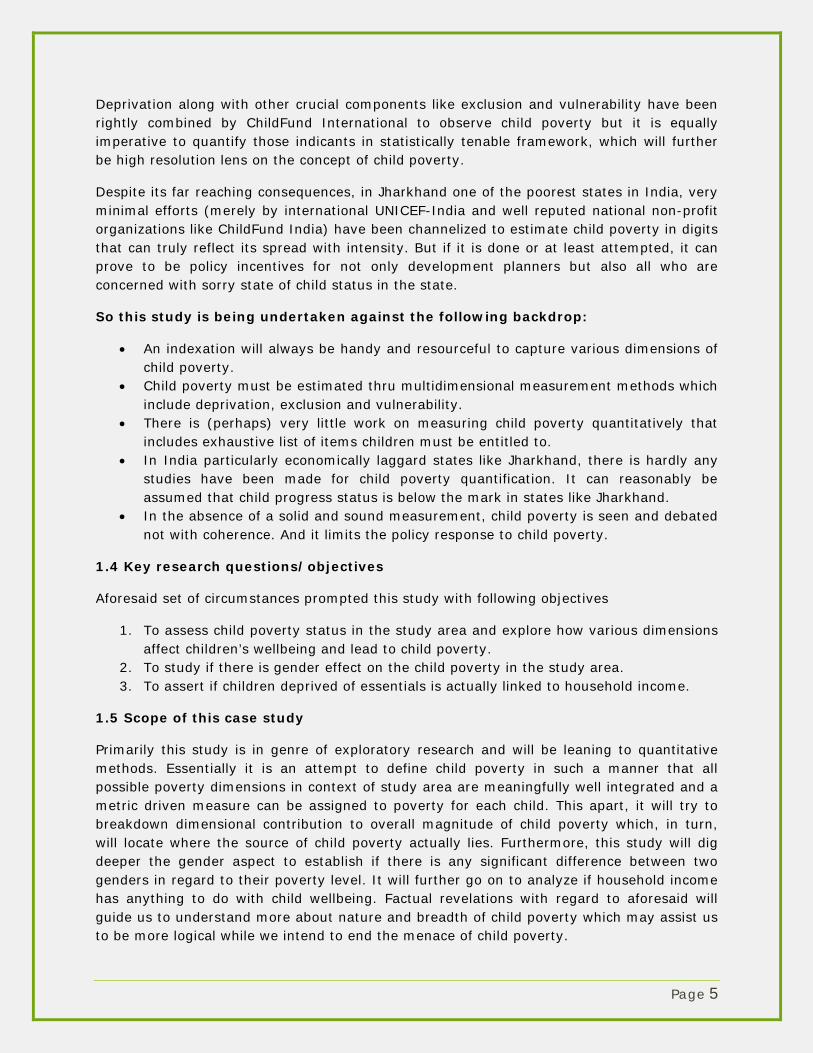
Deprivation along with other crucial components like exclusion and vulnerability have been rightly combined by ChildFund International to observe child poverty but it is equally imperative to quantify those indicants in statistically tenable framework, which will further be high resolution lens on the concept of child poverty.
Despite its far reaching consequences, in Jharkhand one of the poorest states in India, very minimal efforts (merely by international UNICEF-India and well reputed national non-profit organizations like ChildFund India) have been channelized to estimate child poverty in digits that can truly reflect its spread with intensity. But if it is done or at least attempted, it can prove to be policy incentives for not only development planners but also all who are concerned with sorry state of child status in the state.
So this study is being undertaken against the following backdrop:
• An indexation will always be handy and resourceful to capture various dimensions of child poverty.
• Child poverty must be estimated thru multidimensional measurement methods which include deprivation, exclusion and vulnerability.
• There is (perhaps) very little work on measuring child poverty quantitatively that includes exhaustive list of items children must be entitled to.
• In India particularly economically laggard states like Jharkhand, there is hardly any studies have been made for child poverty quantification. It can reasonably be assumed that child progress status is below the mark in states like Jharkhand.
• In the absence of a solid and sound measurement, child poverty is seen and debated not with coherence. And it limits the policy response to child poverty.
1.4 Key research questions/objectives
Aforesaid set of circumstances prompted this study with following objectives
1. To assess child poverty status in the study area and explore how various dimensions affect children’s wellbeing and lead to child poverty.
2. To study if there is gender effect on the child poverty in the study area. 3. To assert if children deprived of essentials is actually linked to household income.
1.5 Scope of this case study
Primarily this study is in genre of exploratory research and will be leaning to quantitative methods. Essentially it is an attempt to define child poverty in such a manner that all possible poverty dimensions in context of study area are meaningfully well integrated and a metric driven measure can be assigned to poverty for each child. This apart, it will try to breakdown dimensional contribution to overall magnitude of child poverty which, in turn, will locate where the source of child poverty actually lies. Furthermore, this study will dig deeper the gender aspect to establish if there is any significant difference between two genders in regard to their poverty level. It will further go on to analyze if household income has anything to do with child wellbeing. Factual revelations with regard to aforesaid will guide us to understand more about nature and breadth of child poverty which may assist us to be more logical while we intend to end the menace of child poverty.
Page 6
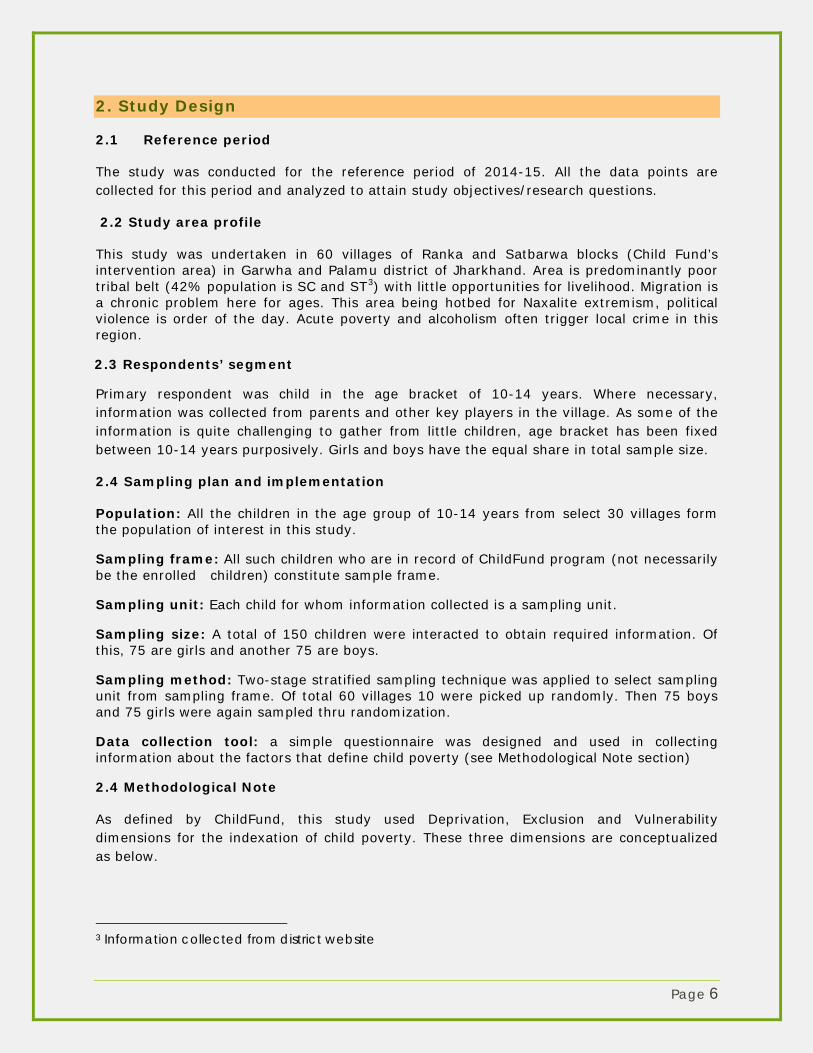
2. Study Design
2.1 Reference period
The study was conducted for the reference period of 2014-15. All the data points are collected for this period and analyzed to attain study objectives/research questions.
2.2 Study area profile
This study was undertaken in 60 villages of Ranka and Satbarwa blocks (Child Fund’s intervention area) in Garwha and Palamu district of Jharkhand. Area is predominantly poor tribal belt (42% population is SC and ST3) with little opportunities for livelihood. Migration is a chronic problem here for ages. This area being hotbed for Naxalite extremism, political violence is order of the day. Acute poverty and alcoholism often trigger local crime in this region.
2.3 Respondents’ segment
Primary respondent was child in the age bracket of 10-14 years. Where necessary, information was collected from parents and other key players in the village. As some of the information is quite challenging to gather from little children, age bracket has been fixed between 10-14 years purposively. Girls and boys have the equal share in total sample size.
2.4 Sampling plan and implementation
Population: All the children in the age group of 10-14 years from select 30 villages form the population of interest in this study.
Sampling frame: All such children who are in record of ChildFund program (not necessarily be the enrolled children) constitute sample frame.
Sampling unit: Each child for whom information collected is a sampling unit.
Sampling size: A total of 150 children were interacted to obtain required information. Of this, 75 are girls and another 75 are boys.
Sampling method: Two-stage stratified sampling technique was applied to select sampling unit from sampling frame. Of total 60 villages 10 were picked up randomly. Then 75 boys and 75 girls were again sampled thru randomization.
Data collection tool: a simple questionnaire was designed and used in collecting information about the factors that define child poverty (see Methodological Note section)
2.4 Methodological Note
As defined by ChildFund, this study used Deprivation, Exclusion and Vulnerability dimensions for the indexation of child poverty. These three dimensions are conceptualized as below.
3 Information collected from district website

Page 7
Deprivation: This dimension looks at the experiences of impoverishment with regard to their material conditions and access to basic services.
Exclusion: It connotes at the processes through which individuals or groups of children are wholly or partially marginalized from full participation in the society in which they live.
Vulnerability: This dimension essentially implies the dynamic nature of children’s experience of poverty in terms of how they are affected by, or resilient to, the array of changing threats in their environment.
Pic1: A girl is waiting to receive cooked MDM at a school in Palamu, Jharkhand
Pic 2: A girl doodles in classroom as her friend looks on, at a school in Garhwa, Jharkhand
Pic 3: As her parents went out for living, 12-year old Soni Kumari making roti for lunch in a remote Naxalite-hit village of Palamu, Jharkhand
Pic 4: Children washing hands before taking MDM at a school in Gharwa district of Jharkhand
Page 8
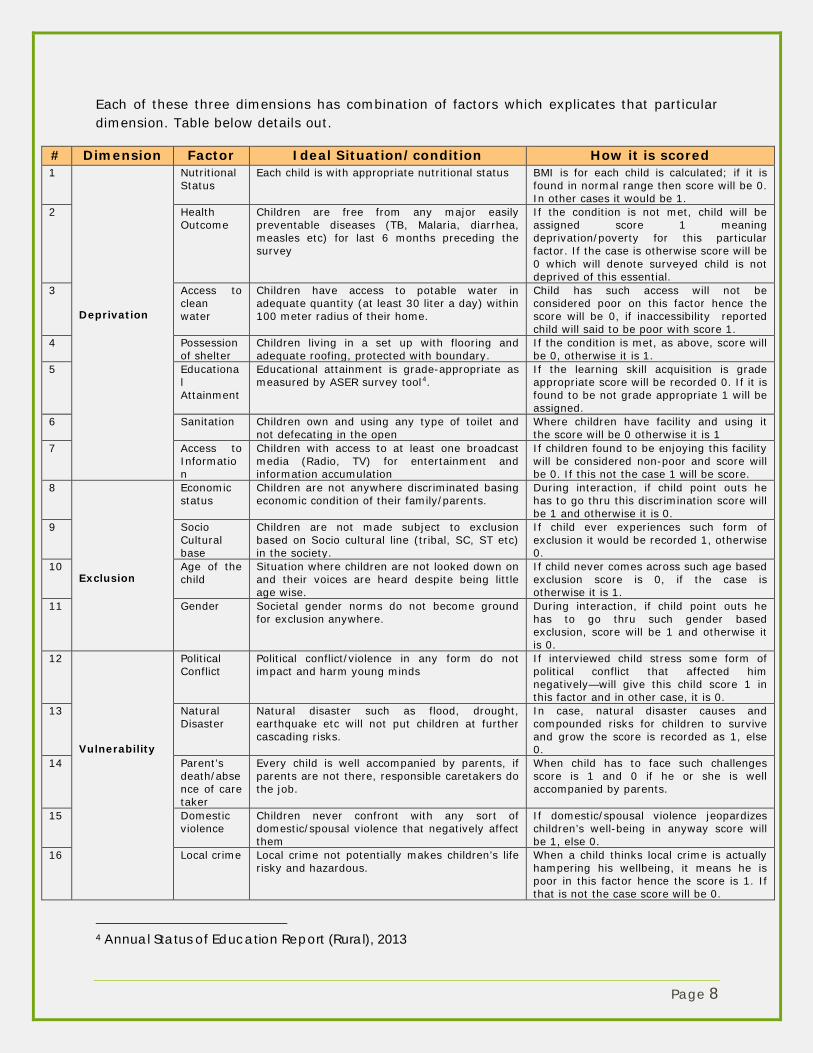
Each of these three dimensions has combination of factors which explicates that particular dimension. Table below details out.
# Dimension Factor Ideal Situation/condition How it is scored 1
Deprivation
Nutritional Status
Each child is with appropriate nutritional status BMI is for each child is calculated; if it is found in normal range then score will be 0. In other cases it would be 1.
2 Health Outcome
Children are free from any major easily preventable diseases (TB, Malaria, diarrhea, measles etc) for last 6 months preceding the survey
If the condition is not met, child will be assigned score 1 meaning deprivation/poverty for this particular factor. If the case is otherwise score will be 0 which will denote surveyed child is not deprived of this essential.
3 Access to clean water
Children have access to potable water in adequate quantity (at least 30 liter a day) within 100 meter radius of their home.
Child has such access will not be considered poor on this factor hence the score will be 0, if inaccessibility reported child will said to be poor with score 1.
4 Possession of shelter
Children living in a set up with flooring and adequate roofing, protected with boundary.
If the condition is met, as above, score will be 0, otherwise it is 1.
5 Educational Attainment
Educational attainment is grade-appropriate as measured by ASER survey tool4.
If the learning skill acquisition is grade appropriate score will be recorded 0. If it is found to be not grade appropriate 1 will be assigned.
6 Sanitation Children own and using any type of toilet and not defecating in the open
Where children have facility and using it the score will be 0 otherwise it is 1
7 Access to Information
Children with access to at least one broadcast media (Radio, TV) for entertainment and information accumulation
If children found to be enjoying this facility will be considered non-poor and score will be 0. If this not the case 1 will be score.
8 Exclusion
Economic status
Children are not anywhere discriminated basing economic condition of their family/parents.
During interaction, if child point outs he has to go thru this discrimination score will be 1 and otherwise it is 0.
9 Socio Cultural base
Children are not made subject to exclusion based on Socio cultural line (tribal, SC, ST etc) in the society.
If child ever experiences such form of exclusion it would be recorded 1, otherwise 0.
10 Age of the child
Situation where children are not looked down on and their voices are heard despite being little age wise.
If child never comes across such age based exclusion score is 0, if the case is otherwise it is 1.
11 Gender Societal gender norms do not become ground for exclusion anywhere.
During interaction, if child point outs he has to go thru such gender based exclusion, score will be 1 and otherwise it is 0.
12 Vulnerability
Political Conflict
Political conflict/violence in any form do not impact and harm young minds
If interviewed child stress some form of political conflict that affected him negatively—will give this child score 1 in this factor and in other case, it is 0.
13 Natural Disaster
Natural disaster such as flood, drought, earthquake etc will not put children at further cascading risks.
In case, natural disaster causes and compounded risks for children to survive and grow the score is recorded as 1, else 0.
14 Parent’s death/absence of care taker
Every child is well accompanied by parents, if parents are not there, responsible caretakers do the job.
When child has to face such challenges score is 1 and 0 if he or she is well accompanied by parents.
15 Domestic violence
Children never confront with any sort of domestic/spousal violence that negatively affect them
If domestic/spousal violence jeopardizes children’s well-being in anyway score will be 1, else 0.
16 Local crime Local crime not potentially makes children’s life risky and hazardous.
When a child thinks local crime is actually hampering his wellbeing, it means he is poor in this factor hence the score is 1. If that is not the case score will be 0.
4 Annual Status of Education Report (Rural), 2013

Page 9
Scoring Technique
Each factor under three dimensions will be measured by 0 or 1 where 1 will mean that child is poor in that particular factor. If he or she is found to be non-poor for a factor, score assigned will be 0. Majority of these factors (except under deprivation dimension) are perceptional measurement in nature. A child’s perception and experience for a particular factor were taken as accurate information without imposing anything normatively.
Data Analysis
Collected data were grouped dimension wise and tabulated in order. When we have data for all factors for all surveyed children, a composite poverty index was constructed giving equal weightage to each factor. Thus poverty score for a particular child has been calculated using boxed mathematical expression and it will be called multidimensional poverty as it takes into account different dimensions.
Score thus calculated will take the numerical value from 0 to 1. Where 0 is no incidence of overall poverty and 1 will denote maximum possible quantum of poverty. For further simplification, if a child scores 0 it will explain he or she is not poor in any of those 16 factors. On the other hand a score of 1 will tell us that particular child is poor in all the listed factors. In this way we will get a poverty score for each child. Thereafter poverty cut off mark is fixed as 0.4. It means a child will be called multidimensionally poor only if his or her total score is above 0.4. The cut off mark was arrived at by brainstorming it among sector experts.
Average multidimensional child poverty was then computed by taking arithmetic mean of MSP score of all children.
Thus poverty head count ratio and poverty intensity were worked out using simple descriptive statistical tools. The important component--poverty intensity (sometimes called breadth) is the average poverty score of all children who come under poverty bracket (with more than 0.4 score) and it can be expressed as:
Multidimensional Child Poverty (MCP) for a particular child =
1/16*[Nutrition]+1/16*[Health]+1/16*[Water]+1/16*[Education]+1/16*[Shelter]+1/16*[Sanitation]+1/16*[Information]+1/16*[Economic status]+1/16*[Socio-cultural Bias]+1/16*[Age related discrimination]+1/16*[Gender based bias]+1/16*[Political Conflict]+1/16*[Natural Disaster]+1/16*[Death of Parents/Absence of caretaker]+1/16*[Domestic Violence]+1/16*[Local Crime]
Headcount Ratio = n/N; n is the number of poor children with the cut off mark, N is total number of children
A (Poverty intensity) = MPS/n;
Where MPS is total score of who are multidimensionally poor, n is number of such poor children.
Page 10
This score will help us in comprehending how intensively poverty is spread out among poor children.
Breaking down poverty score by dimensions and factors
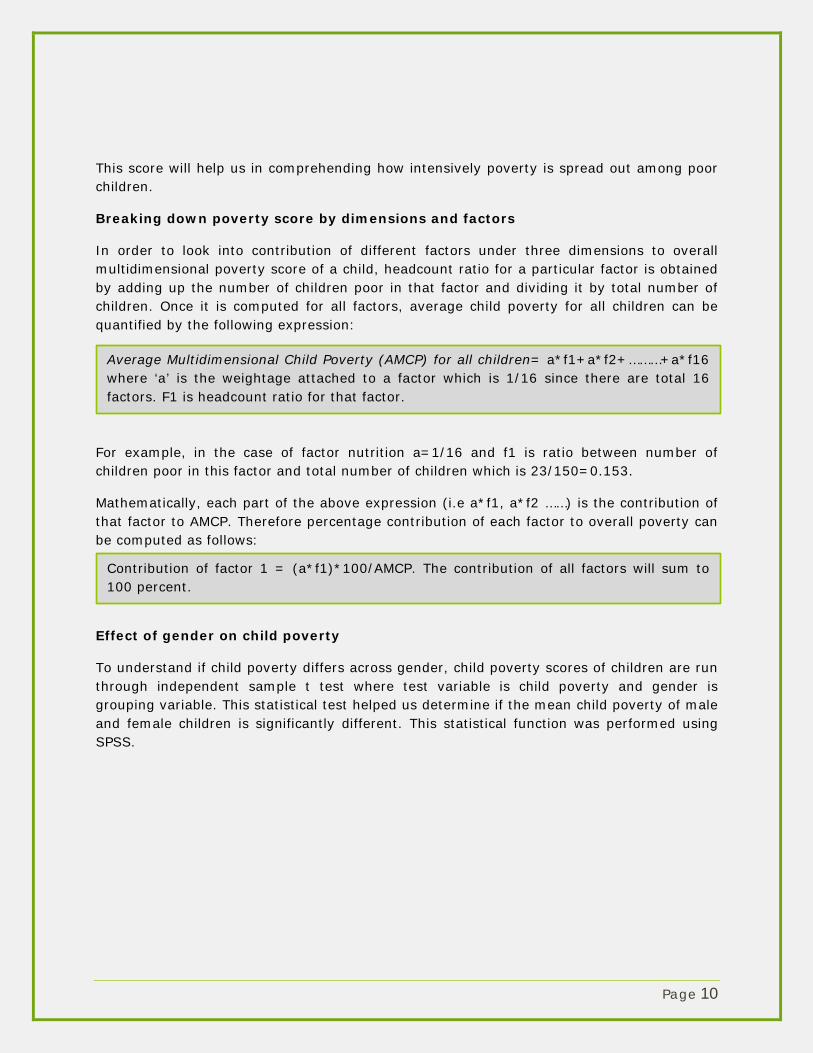
In order to look into contribution of different factors under three dimensions to overall multidimensional poverty score of a child, headcount ratio for a particular factor is obtained by adding up the number of children poor in that factor and dividing it by total number of children. Once it is computed for all factors, average child poverty for all children can be quantified by the following expression:
For example, in the case of factor nutrition a=1/16 and f1 is ratio between number of children poor in this factor and total number of children which is 23/150=0.153.
Mathematically, each part of the above expression (i.e a*f1, a*f2 ……) is the contribution of that factor to AMCP. Therefore percentage contribution of each factor to overall poverty can be computed as follows:
Effect of gender on child poverty
To understand if child poverty differs across gender, child poverty scores of children are run through independent sample t test where test variable is child poverty and gender is grouping variable. This statistical test helped us determine if the mean child poverty of male and female children is significantly different. This statistical function was performed using SPSS.
Average Multidimensional Child Poverty (AMCP) for all children= a*f1+a*f2+………+a*f16 where ‘a’ is the weightage attached to a factor which is 1/16 since there are total 16 factors. F1 is headcount ratio for that factor.
Contribution of factor 1 = (a*f1)*100/AMCP. The contribution of all factors will sum to 100 percent.

Page 11
3. Study results, interpretation and discussion
3.1 Profile of the children
All the children in the study belong to tribal community of Ranka block of Garwha and Satbarwa block of Palamu district. Their parents are majorly daily wage earner and engaged in farming activities. Many of them migrate to nearby cities in lean period in search of livelihood. Average household size was found to be 6.23 and they make both ends meet on the average monthly earning of Rs. 2325, an amount—meagre for the sustenance of family members. As per records all these children are enrolled in schools.
3.2 Multidimensional Child poverty (MCP)
When MCP was computed for all children and analyzed, it was observed that it ranges from 0.13 (least poor) to 0.69. So the maximum poverty recorded for a child was 0.69 which can be considered a severe level of child poverty. The mean poverty level was estimated to be 0.48 and it underlines how extensively children experience poverty which is hardly noticed by policy makers and often not realized by communities. It further puts forth the fact that many of those needs and care essential for children’s survival and development are in fact missing or simply not met in the study area. Therefore, high multidimensional poverty level alone is a trigger to think and act on developmental issues that are directly linked to wellbeing of children. Child poverty scores for all 150 children are quite normally distributed with standard deviation of 0.10 and median 0.50.
3.3 Child Poverty Headcount Ratio with cutoff
When we measure the incidence of poverty with cut off level 0.40, 113 of 150 children came into the poverty fold which translates 75.33% (Headcount ratio) children are actually poor in this multidimensional framework. Undoubtedly this figure is quite dismal and seeks immediate all-encompassing attention from those who are at the helm of the affairs. Even when cutoff is raised to 0.50, still shockingly 60% children turned out to be poor. Furthermore what is critically worrisome for development planners is that a sizeable number of children is scoring just below the cutoff mark 0.4 and can fall on poverty trap anytime soon. Therefore, logically, if this grim situation of child poverty is to be altered with interventions, children those are close to poverty cut off mark should not be excluded.
N Minimum Maximum Mean
Std. Deviat
ion Chil_poverty 150 .13 .69 .48 .1071
3 Valid N (listwise) 150
Parameter ResultAvg Household Size 6.34Avg Family Income 2325Mean age of respondents 12.8Study Area Ranka and Satbarwa
Cut off No of poor children Percentage0.3 147 980.4 113 750.5 90 60

Page 12
Each and every factor is extremely critical for a child so essentially a child cannot be denied any of those 16 enabling factors. So to calibrate this measurement cut off mark is further lowered down to 0.3 and surprisingly 98% children (147 out of 150) came to be counted as poor. Interestingly all these revelations throw plethora of cues and indication where and how much the works to be done to lift these unfortunate children from poverty trap.
3.4 Factor and dimension contribution to poverty
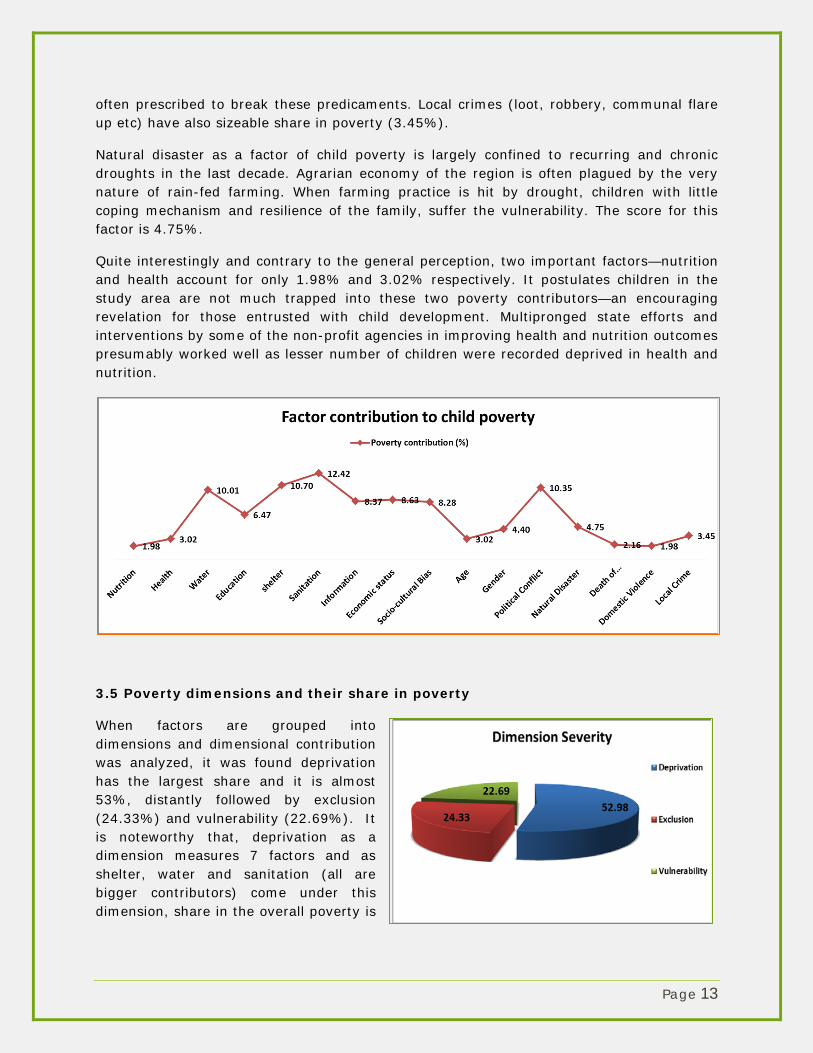
Mean poverty level or average multidimensional poverty is recorded 0.48 which by any standard is an alerting figure and this poverty is resulting from children’s unmet needs in 16 crucial factors. So each factor has a contribution to the mean poverty level. Analysis has broken it down to factors and it was revealed that sanitation with its 12.42% contribution becomes the biggest challenge to extricate children out of poverty trap. It was closely followed by shelter (10.7%), political conflict (10.4%) and water (10.1%). These figures quite evidently bring back the rousing discussion of providing children with very basic needs for their sustenance. Sanitation---an important child development parameter is abysmally under attained in the study area as it made up 12.42% in overall mean poverty of 0.48. Shelter and water two basic components of human life are not adequately ensured for the children---a fact sticking out with much despair and despondency. It further emphasizes that if an effort ever made to bring down child poverty—shelter, political conflict and water must to be worked on priority basis. Striking feature, political conflict is one of the highest poverty contributors. Study area is government-declared stronghold of left wing extremism. The entire region has seen frequent deadly exchange of firearms, cases of ransom, extortion, political unrest, murder and atrocities. Needless to say this prevailing situation has negative bearing on the young kids who actually need to be free from all such disturbances and hostility. So in some sense, these children are regrettably entrapped in political conflict and it calls for a huge response from administration, political circuit and locals to neutralize these detrimental forces at least for the betterment of children.
Other important poverty contributors is “Exclusion” on the basis of economic status (8.63%), Socio-cultural bias (8.28%) --- which are long standing developmental issues that need social remedies. These are closely followed by education factor (6.47) which has a significant connotation as this factor measures learning skill acquisition of those children. There are unending discussion and relentless deliberation on poor learning outcome of children in school especially since with Right to Education Act, 2009 (RtE) is in effect.
This apart, gender and age based exclusion importantly made up 4.40% and 3.02% respectively to mean poverty level. Balancing out social dynamics and behavior change are
Page 13
often prescribed to break these predicaments. Local crimes (loot, robbery, communal flare up etc) have also sizeable share in poverty (3.45%).
Natural disaster as a factor of child poverty is largely confined to recurring and chronic droughts in the last decade. Agrarian economy of the region is often plagued by the very nature of rain-fed farming. When farming practice is hit by drought, children with little coping mechanism and resilience of the family, suffer the vulnerability. The score for this factor is 4.75%.
Quite interestingly and contrary to the general perception, two important factors—nutrition and health account for only 1.98% and 3.02% respectively. It postulates children in the study area are not much trapped into these two poverty contributors—an encouraging revelation for those entrusted with child development. Multipronged state efforts and interventions by some of the non-profit agencies in improving health and nutrition outcomes presumably worked well as lesser number of children were recorded deprived in health and nutrition.
3.5 Poverty dimensions and their share in poverty
When factors are grouped into dimensions and dimensional contribution was analyzed, it was found deprivation has the largest share and it is almost 53%, distantly followed by exclusion (24.33%) and vulnerability (22.69%). It is noteworthy that, deprivation as a dimension measures 7 factors and as shelter, water and sanitation (all are bigger contributors) come under this dimension, share in the overall poverty is

Page 14
obviously high.
Another observation that creates space for debate and discussion is that despite ‘exclusion’ has 4 factors but contribution is slightly more than ‘vulnerability’ which comprises 5 factors. Clearly it explained children in the study area are more prone to factors that make them ‘exclusion’ than those bring them to be ‘vulnerable’.
It certainly calls for policy intention and urgent action to mend this fiasco before it further slips down. Dimensional along with factor wise decomposition of child poverty is extremely helpful in pinpointing the locus where response and intervention actually to be infused. Moreover, these observations can unequivocally provide direction where and how much resource can be pumped into the system which will potentially bring down the poverty level. One more interesting feature is if it is estimated over the years, it can prove to be monitoring tool and achievement tracker for efforts being made in this direction.
3.5 Who is poor in what?
So far we have delved into poverty level and breaking it down into different factors and dimensions. This essentially tells us how extensively poverty is in existence among children in the study area. Now one more part of the whole analysis will throw light on who is poor in what. This will suggest development professionals, who to target in which factors in view of stamping out child poverty. It is abundantly clear in the graphical presentation that majority of children are poor in sanitation, shelter, water and political conflict. The entire red-colored area in the diagram actually measures number of children termed poor in several factors.
Therefore, if child poverty is of interest of anybody, developmental responses can be directed to those children and factors covered in red colored area of the graph.
3.6 Child Prosperity
After a discussion at length on child poverty, study attempted to find out degree of prosperity children enjoy in the area. The figure for the same for each child was computed by subtracting an individual poverty score from 1. Technically study assumed child prosperity is the absence of child poverty. In this way, we have estimated individual child prosperity for all the sampled children. Later it was attempted to look into equality of prosperity among these young kids through a Lorenz curve presentation. Surprisingly, child prosperity takes a trend of perfect equal distribution which seemingly has huge

Page 15
developmental ramification. Gap between rich and poor is usually huge and still widening in international arena. But this uniquely measured child poverty takes the twist and it brings out two important findings that are subject to further experimental validation.
(a) Inequality in prosperity becomes evident when a certain section enjoys prosperity disproportionately and deprives others. But here it is almost uniquely uniform and proportionately well distributed.
(b) Disproportionate distribution of prosperity is determined by interplay of several other factors. But here the distribution is proportionate which could well mean that elements affecting disproportionate prosperity are nullified. To make more evidence based conclusion in this regard further empirical studies are suggested.
3.7 Gender effect on child poverty
This study further went on to investigate if there is gender effect significant in determining child poverty. The mean poverty for girls is 0.4775 whereas it is 0.4883 among boys. Making the conclusion and claim stronger, SPSS output was referred (independent t sample test) and it statistically reasoned out that there is no significant difference between mean poverty across gender (p value=0.538). It therefore corroborates the fact that, neglecting and denying essentials is same regardless the child’s gender. Hence, gender effect in determining the poverty is insignificant. So boys or girls they are equally likely to be in poverty zone.
3.8 Deprivation and household income
Deprivation—the highest contributor to child poverty left space for more analytical studies. Therefore a deprivation score has been constructed by attaching equal weightage to each of those seven factors under this dimension. The first dimension essentially captures a child’s deprivation in basic needs and those are often linked to family’s financial capability. The general notion—a financially established
Gender N Mean Std.
Deviation
Std. Error Mean
Child poverty
Female 75 .4775 .12272 .01417
male 75 .4883 .08939 .01032
Model R R Square Adjusted R Square
Std. Error of the Estimate
1 .453(a) .206 .200 .15472

Page 16
family is more capable of meeting children’s basic amenities. But it was noticed during the course of analysis that these two variables. HH income and deprivation not highly correlated though the negative nature of correlation is revealed and it is well justified. The correlation coefficient is just --0.453 and it falsifies that general perception that more the income more the child wellbeing.
The study further dug dipper to comprehend if the household income affects the deprivation to a significant extent. Data on deprivation scores and household incomes were regressed. Results have shown that very little (20%) of difference in deprivation is explained by family income. So it is imperative to find out the variables which statistically make deprivation dependent on. 4. Findings summary and policy implications
• The mean multidimensional child poverty is measured at 0.48 which is alarmingly
high and it opened up larger debate and discussion on child poverty of this region. Severity of this social issue requires prompt and sustainable response.
• With 0.4 poverty cut off, 75% of child population are poor. Unlike the adult poverty, majority of the children are in fact languishing in poverty trap. Strategic and continued efforts needed to break this trap.
• Children who are just below 0.4 cut off mark are significant in number. They are with grater probability of falling into poverty region. Thus it needs special attentions who are engaged in advocating and promoting child development.
• Sanitation, shelter, water and political conflict constitute almost half (43.62%) of the mean poverty. Hence any initiative and responses aimed at reducing child poverty must warrant looking into these factors on urgent basis.
• Deprivation dimension has highest (53%) share in child poverty which concludes factors under ‘deprivation’ assume special significance in developmental initiatives for children.
• Equality in trend of child prosperity was observed in the population and it implies, ceteris paribus, inequality-triggering components are not significant in study population.
• Popular notion in the development sphere is girls are more deprived than boys but in this particular experiment, it is statistically established that there is no significant difference in the mean poverty across gender. This revelation points out any anti-poverty measures framed in addressing child poverty can uniformly be directed irrespective of the children’s gender.
• Deprivation index alone is not largely affected by the level of family income. So it cannot be strongly concluded that more the income lower the child poverty or vice versa. Hence it stimulates to investigate on other possible issues which actually

Page 17
regulate the level of child poverty. Thus it will be assisting policy maker to act on the issue with more efficacy.
5. Limitation of the study
• The study was undertaken with first-hand information about children from some of the remote and deprived areas of Palamu and Garhwa district. It may not be representative of the general situation in Jharkhand as a whole.
• Selection of factors and grouping them into dimensions to define child poverty is based on technical inputs from handful child development experts. But nevertheless it still can have room for debate and discussion.
• There could be issue of ‘multicollinearity’ among those 16 factors but that was ignored to avoid further data reduction exercises.
Cited References: Alkire, S. and Foster, J.E. (2011), “Counting and Multidimensional Poverty Measurement”, working paper 7, Oxford Poverty and Human Development Initiative, University of Oxford. Boyden, J. and Stefan, D (2012), “Child Development and Economic Development: Lessons and Future Challenges”, Oxford: Young Lives Boyden, J. and Feeny, T., (2003), A Review of Contemporary Literature and Thought on Children and Poverty, Christian Children’s Fund (CCF), Children and Poverty Series Pt I, Richmond, USA. Websites referred:
1. http://www.care.org/work/poverty/child-poverty as on 25.12.2015 2. http://www.savethechildren.org.uk/sites/default/files/docs/child-development-
index.pdf as on 22.12.2015 3. https://www.childfund.org/program_documents/ as on 12.12.2015 4. http://www.unicef.org/socialpolicy/files/August_2012_CPI.pdf as on 04.12.2015

Page 18
Annexures
1. SPSS Output for Independent Samples Test for difference in poverty mean for both the gender
Levene's Test for Equality of Variances t-test for Equality of Means
F Sig. t df Sig. (2-tailed)
Mean Differenc
e
Std. Error Differenc
e
95% Confidence Interval of the
Difference
Lower Upper Lower Upper Lower Upper Lower Upper Lower
Chil_poverty Equal variances assumed
7.988 .005 -.618 148 .538 -.01083 .01753 -.04548 .02381
Equal variances not assumed
-.618 135.281 .538 -.01083 .01753 -.04550 .02384
2. Correlations between HH income and Deprivation score (Score on dimension Deprivation)
HH_Income Deprivation HH_Income Pearson Correlation 1 -.453(**) Sig. (2-tailed) .000 N 150 150 Deprivation Pearson Correlation -.453(**) 1 Sig. (2-tailed) .000 N 150 150
** Correlation is significant at the 0.01 level (2-tailed).
3. Regression Output
Model Sum of Squares df Mean Square F Sig.
1 Regression .917 1 .917 38.294 .000(a) Residual 3.543 148 .024 Total 4.460 149
a Predictors: (Constant), HH_Income b Dependent Variable: Deprivation
Model Unstandardized
Coefficients Standardized Coefficients t Sig.
B Std. Error Beta B Std. Error 1 (Constant) .735 .025 28.971 .000 HH_Income -5.86E-005 .000 -.453 -6.188 .000
a Dependent Variable: Deprivation