metis: a profiling toolkit based on the virtualization of hardware
TRANSCRIPT

RESEARCH Open Access
Metis: a profiling toolkit based on thevirtualization of hardware performance countersXia Xie1*, Haiou Jiang1, Hai Jin1, Wenzhi Cao1, Pingpeng Yuan1 and Laurence Tianruo Yang2
* Correspondence: [email protected] Computing Technologyand System Lab, Cluster and GridComputing Lab, School ofComputer Science andTechnology, Huazhong Universityof Science and Technology, Wuhan430074, ChinaFull list of author information isavailable at the end of the article
Abstract
Background: With wide application of virtualization technology, the demand isincreasing for performance analysis and system diagnosis in virtualizationenvironment. There are some profiling toolkits based on hardware events, such asOProfile in native Linux and Xenoprof in Xen virtual machine environment. However,sometimes users in different domains need monitor different hardware eventsindividually at the same time. For programming and profiling in environment forvirtual machine, it may become popular in the coming future. In this paper, wepresent Metis, a system-wide profiling toolkit for Xen virtual machine environmentbased on the virtualization of hardware performance counters.
Methods: Virtualization of hardware performance counters is used to enableprofiling of processes and routines running in the domain or Xen virtual machinemonitor.
Results: This toolkit allows multiple users in different domains to monitor differenthardware events simultaneously in Xen virtual machine environment, obtaining thedistribution of hardware events such as clock cycles, instruction execution and cachemisses, etc. Our experiments with a real-world benchmark demonstrate the goodperformance of Metis.
Conclusion: Comparing to all the existing profiling toolkits, Metis is different whichenables multiple users in different virtual machines to monitor different CPU eventssimultaneously, and users in different domains can use this toolkit individuallywithout affecting each other. We apply a popular benchmark to verify thecorrectness of Metis and its cool features.
Keywords: Hardware Performance Counter, CPU Event, Virtual Machine, Profile
IntroductionVirtualization technology allows multiple Virtual Machines (VMs) running on a single
physical host. Each VM can run different Operating System (OS), applications in
respective OS can run individually without affecting each other. Many enterprise appli-
cations traditionally running on dedicated servers consolidate to a smaller and shared
pool of servers [1]. Xen is an x86 virtual machine monitor, which allows multiple com-
modity operating systems to share conventional hardware in a safe and resource mana-
ged fashion without sacrificing either performance or functionality [2]. Even some
cases for high performance computing with virtual machines can achieve almost the
same performance as those running in a native, non-virtualized environment [3,4].
Xie et al. Human-centric Computing and Information Sciences 2012, 2:8http://www.hcis-journal.com/content/2/1/8
© 2012 Xie et al; licensee Springer. This is an Open Access article distributed under the terms of the Creative Commons AttributionLicense (http://creativecommons.org/licenses/by/2.0), which permits unrestricted use, distribution, and reproduction in any medium,provided the original work is properly cited.
With the wide application of virtualization technology, the demand is increasing for
performance analysis and system diagnosis in virtualization environment [5].
Xenoprof is a system-wide statistical profiling toolkit, which is modeled on the OPro-
file profiling toolkit and available for Linux systems. The Xenoprof toolkit supports
system-wide coordinated profiling in a Xen environment to obtain the distribution of
hardware events, such as clock cycles, instruction execution, TLB and cache misses.
However, since domains (Xen uses the term “domain” to refer to a virtual machine)
are in a coordinated profiling session when Xenoprof is used, they should have the
same hardware events configuration and obtain respective performance data. Some-
times, users in different domains may have the demand to monitor different hardware
events simultaneously. For example, a user is in A domain, and want to monitor two
events, such as CPU_CLK_UNHALTED and ITLB_MISS_RETIRED, while another
user logs in B domain and need to use another two hardware events such as
DTLB_MISSES and BUS_TRAN_MEM at the same time. A new profiling toolkit is
preferred to make multiple users monitor different events individually at any time
without affecting each other.
In this paper, we present Metis, a system-wide profiling toolkit for Xen virtual
machine environment. It is depended on the virtualization of hardware performance
counters. This toolkit enables profiling of processes and routines running in domain or
Xen virtual machine monitor (VMM, which is intrigued both researchers and entrepre-
neurs [6]). It allows multiple users in different domains to monitor different hardware
events simultaneously in Xen virtual machine environment, for obtaining the distribu-
tion of hardware events such as clock cycles, instruction execution, TLB and cache
misses, etc. Though the number of hardware performance counters is limited, the
number of hardware events that a domain can monitor is also dependent on it because
of the virtualization of hardware performance counters.
We present an experiment in a physical host with two hardware performance coun-
ters, and monitor two events (CPU_CLK_UNHALTED and ITLB_MISS_RETIRED) in
a domain, while another two events (DTLB_MISSES and BUS_TRAN_MEM) are mon-
itored in another domain. It shows the effect of the virtualization of hardware perfor-
mance counters in detail. Besides this, we report on the use of Metis to analyze
performance overheads for Gzip (a benchmark in SPEC CPU2000) by monitoring two
hardware events such as CPU_CLK_UNHALTED and ITLB_MISS_RETIRED. Two
users in two different domains start and stop Metis simultaneously in the experiment,
and we compare the performance data with the output produced by Xenoprof.
The rest sections are organized as follows. Section 2 discusses the related works
about profiling toolkits. Section 3 details the design and implementation of Metis on
Xen. In Section 4, we test Metis with popular benchmark and analyze the experiments.
We draw the conclusion in section 5.
Related worksThere are a few profiling toolkits which use hardware performance counters, such as
OProfile, VTune in native Linux and Xenoprof in Xen virtual machine environment.
In this section, we briefly describe these toolkits, and then we present our motivation
for this work.
Xie et al. Human-centric Computing and Information Sciences 2012, 2:8http://www.hcis-journal.com/content/2/1/8
Page 2 of 15
Oprofile
OProfile is a system-wide statistical profiling tool for Linux systems. We can use OPro-
file to profile code executing at any privilege level, including kernel code, kernel mod-
ules, user level applications and user level libraries.
OProfile uses performance-monitoring hardware on processors to collect periodic
samples of various performance data. Performance monitoring hardware on modern
processor architectures include counters that track various processor events including
clock cycles, instruction retirements [7], TLB misses, cache misses, branch mis-predic-
tions, etc. Researchers can configure the performance-monitoring hardware to notify
the operating system when these counters reach specified values. Profiles are generated
by regularly sampling the current registers on each CPU and converting the runtime
PC value into something meaningful to the programmer. OProfile achieves this by tak-
ing the stream of sampled PC values, along with the detail which task was running at
the time of the interrupt, and converting it into a file offset against a particular binary
file. Because applications map the code that they run by using mmap(), it’s possible to
find the relevant binary file and offset by walking the task’s list of mapped memory
areas. Then the user-space tools can reconstruct where the code came from, including
the particular assembly instructions, symbol, and source line (via the binary’s debug
information if present).
Profiling with OProfile operates as follows [8]:
1. User provides input for OProfile about the performance events to be monitored
and the periodic count.
2. OProfile programs hardware counters to calculate the number of user-specified
performance events and to generate a non-maskable interrupt (NMI) when the counter
has counted to the user-specified count.
3. The performance-monitoring hardware generates an NMI according to counter
overflow.
4. OProfile’s NMI handler catches the NMI and records the program counter value
in a kernel buffer.
5. OProfile processes the buffer periodically to determine the routine and executable
corresponding to the program counter on each sample in the buffer. This is deter-
mined by consulting the virtual memory layout of the process and the kernel.
VTune
Intel VTune Performance analyzer is a commercial application for software perfor-
mance analysis about Intel-manufactured x86 and x64 based machines, and has both
GUI and command line interfaces. It is available for both Linux and Microsoft Win-
dows operating systems.
Intel VTune Performance analyzer assists in various kinds of code profiling including
time-based profiling, event-based profiling. The profiler result consists of details such
as time spent in each sub routine, which is drilled down to the instruction level. The
time taken by the instructions is indicative of any stalls in the pipeline during instruc-
tion execution. The tool can be also used to analyze thread performance [9,10].
Xie et al. Human-centric Computing and Information Sciences 2012, 2:8http://www.hcis-journal.com/content/2/1/8
Page 3 of 15

Xenoprof
Xenoprof is a system-wide profiler for Xen virtual machine environments, capable of
profiling the Xen VMM, multiple Linux guest operating systems, and applications run-
ning on them [11].
The Xenoprof toolkit provides capabilities similar with OProfile for the Xen environ-
ment (i.e., using performance-monitoring hardware to collect periodic samples of per-
formance data). The performance of applications running on Xen depends on
interactions among the application’s processes, the operating system it is running on,
the Xen VMM, and potentially other virtual machines (e.g., driver domain) running on
the same system. In order to study the costs of virtualization and the interactions
among multiple domains, the performance profiling tool must be able to determine
the distribution of performance events across routines in the Xen VMM and all the
domains running on it.
In virtual machine environments like Xen, a major source of performance degrada-
tion is the cost of I/O devices virtualization to allow multiple guest VMs to share a
single device securely [12], and we can use Xenoprof to measure the I/O performance
meanwhile. We also use information extracted by Xenoprof to uncover bugs and chan-
nel the information into optimizing Xen, to provide a view of their application on vir-
tual machines for a scientist or an application’s user [13]. In [14], researchers use
Xenoprof for memory intensive applications such as DGEMM.
The Xenoprof toolkit consists of a VMM-level layer responsible for servicing counter
overflow interrupts from the performance monitoring hardware and a domain-level
layer derived from OProfile responsible for attributing samples to specific routines
within the domain [15]. The OProfile layer drives the performance profiling through
hypercalls supported by Xenoprof and Xenoprof delivers samples to the OProfile layer
using Xen’s virtual interrupt mechanism. System-wide profiling is generated through
the coordination of multiple domain-level profilers. While our current implementation
is dependent on OProfile, other statistical profilers (e.g., VTune) also can be ported for
using the Xenoprof interface.
Domain level profilers must be ported to the Xenoprof interface so that they can be
used in the Xen environment. Porting a profiler to Xenoprof is very straightforward,
and entails the following steps:
1. We modify the profiler code for accessing and programming the hardware coun-
ters by using the Xenoprof virtual event interface.
2. Before starting profiling, the profiler queries Xenoprof to determine whether it is
to take on the role of the initiator. Only the initiator domain performs the global pro-
filing setup, such as deciding the events and profiling duration. Both the initiator and
the other profilers register their callback functions for collecting PC samples.
3. We extend the profiler with access to the Xen virtual memory layout, so that it
can identify Xen routines corresponding to PC samples in Xen’s virtual address range.
We put forward a system-wide profiling toolkit for Xen virtual machine environ-
ment, which is dependent on the virtualization of hardware performance counters.
This toolkit enables multiple users in different domains to profile different hardware
events simultaneously in Xen virtual machine environment, without affecting each
other.
Xie et al. Human-centric Computing and Information Sciences 2012, 2:8http://www.hcis-journal.com/content/2/1/8
Page 4 of 15

System Design and ImplementationSystem framework and overview
The toolkit consists of two parts: kernel level and user level. Key processing are mainly
concentrated in the kernel level (including Xen and Linux), such as the configuration
and virtualization of hardware performance counters, sampling mechanism and etc.,
while use-space daemons of virtual machines are primarily used to analyze samples
from the buffer in the kernel which are connected with corresponding functions or
sections. Finally, the performance analysis data is shown for users clearly. The frame-
work of this toolkit is as follows in Figure 1.
Figure 2 shows the workflow of Metis, and the whole process schedule of workflow
is as follows:
Step 1 A background daemon is running in each privileged domain or guest domain
to monitor the operations triggered by users, such as starting or stopping profiling.
Step 2 The user in respective privileged domain or guest domain sets the CPU events
to profile. If the count of CPU events in a domain is bigger than the number of hard-
ware performance counters, the user will be alerted that he should reduce the number
of CPU events, and then repeat this step.
Step 3 The user starts profiling, and send a starting signal to the privileged domain.
Then the CPU events configuration is written to respective structures of Virtual CPU
(VCPU):
Step 3.1 All CPU events configurations of the domains are stored in the monitor.
(Each VCPU belongs to a domain, and each domain has respective CPU events config-
uration, including CPU event name, sampling frequency, etc.)
Step 3.2 After the user in a domain sets CPU events to monitor and starts profiling,
add corresponding CPU event item for this domain in respective structures of VCPU.
Step 4 If the total count of all CPU events is bigger than the number of hardware
performance counters in the machine, the virtualization of hardware performance
counters is used, and go to step 5. Otherwise, go to step 6 directly.
Step 5Start the virtualization of hardware performance counters (time-sharing multi-
plexing technology).
Figure 1 Metis’s Framework.
Xie et al. Human-centric Computing and Information Sciences 2012, 2:8http://www.hcis-journal.com/content/2/1/8
Page 5 of 15
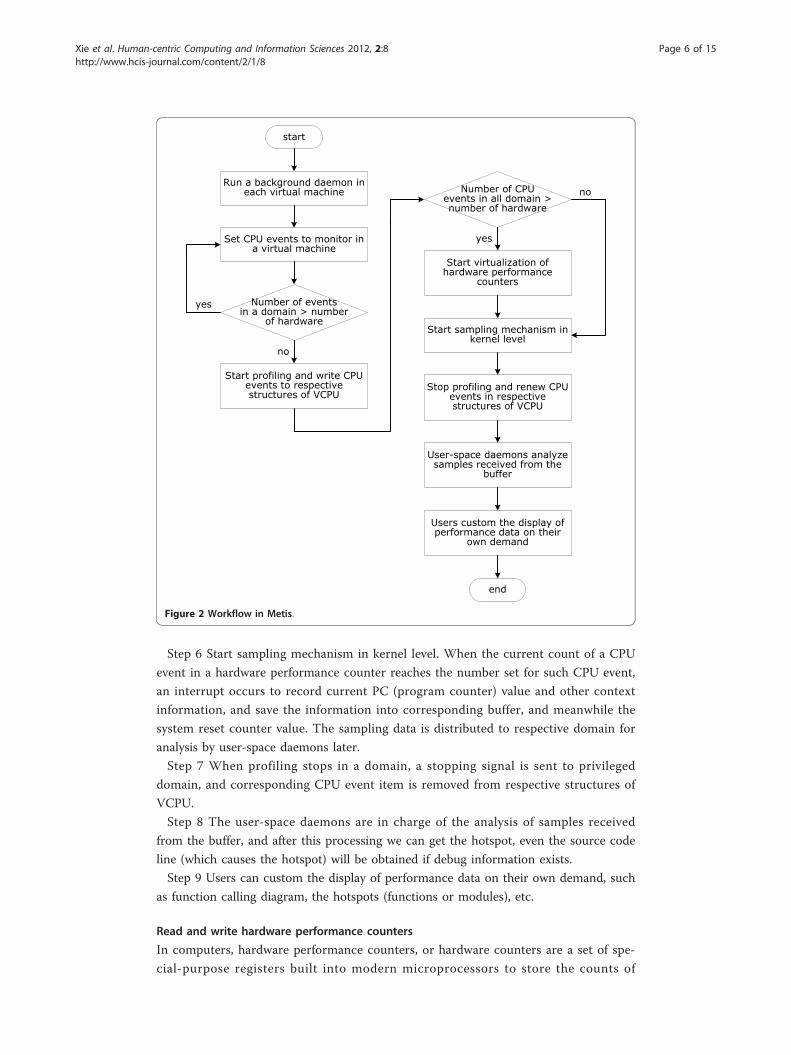
Step 6 Start sampling mechanism in kernel level. When the current count of a CPU
event in a hardware performance counter reaches the number set for such CPU event,
an interrupt occurs to record current PC (program counter) value and other context
information, and save the information into corresponding buffer, and meanwhile the
system reset counter value. The sampling data is distributed to respective domain for
analysis by user-space daemons later.
Step 7 When profiling stops in a domain, a stopping signal is sent to privileged
domain, and corresponding CPU event item is removed from respective structures of
VCPU.
Step 8 The user-space daemons are in charge of the analysis of samples received
from the buffer, and after this processing we can get the hotspot, even the source code
line (which causes the hotspot) will be obtained if debug information exists.
Step 9 Users can custom the display of performance data on their own demand, such
as function calling diagram, the hotspots (functions or modules), etc.
Read and write hardware performance counters
In computers, hardware performance counters, or hardware counters are a set of spe-
cial-purpose registers built into modern microprocessors to store the counts of
start
Run a background daemon in each virtual machine
Number of events in a domain > number
of hardware
Set CPU events to monitor in a virtual machine
Start profiling and write CPU events to respective structures of VCPU
Start virtualization of hardware performance
counters
Start sampling mechanism in kernel level
Stop profiling and renew CPU events in respective structures of VCPU
User-space daemons analyze samples received from the
buffer
Users custom the display of performance data on their
own demand
Number of CPU events in all domain > number of hardware
end
yes
yes
no
no
Figure 2 Workflow in Metis.
Xie et al. Human-centric Computing and Information Sciences 2012, 2:8http://www.hcis-journal.com/content/2/1/8
Page 6 of 15
hardware-related activities within computer systems. Advanced users often rely on
those counters to conduct low-level performance analysis or optimizing.
The number of available hardware counters in a processor is limited while each CPU
model might have many different events that a developer might like to measure. Each
counter can be programmed with the index of an event type to be monitored, like a
L1 cache miss or a branch misprediction [16].
Regard Intel Itanium 2 performance monitoring unit as an example, it organizes the
counters as four pairs of performance event monitoring registers. Each pair is com-
posed of a Performance Monitoring Configuration (PMC) register and Performance
Monitoring Data (PMD) register. The PMC selects the performance event monitored
and the PMD determines the sampling interval [17].
When a CPU event is monitored, you should configure the attributes of this event
and then set PMC register and PMD register. All attributes of a CPU event are as fol-
lows Table 1:
For example, in user space, when we want to set the PMC register, we can call perf-
monctl with the parameter cmd valued PFM_WRITE_PMCS, while the parameter cmd
will be set to PFM_WRITE_PMDS if we need to set the PMD register.
In Xen, functions such as xenpfm_write_pmcs or xenpfm_write_pmds will be called
to set the hardware performance counters.
Message delivery mechanism in domains
The privileged virtual machine is called Dom0, while a guest virtual machine is called
DomU. We run specific daemons in Dom0 and DomU, in which place users are willing
to use this profiling toolkit, and use Xenstore as the message delivery mechanism in
domains.
Xenstore is a database for Xen applications and drivers to communicate and store
configuration information. Applications and tools should use the store to configure dri-
vers by writing information into keys in the database; drivers should set watches on the
appropriate keys and respond to changes appropriately [18]. Xenstore is an information
storage space shared between domains. It is meant for configuration and status infor-
mation rather than for large data transfers. Each domain gets its own path in the store,
which is somewhat similar in spirit to procfs. When values change in the store, the
appropriate drivers are notified [19].
The process how this toolkit handles in Dom0 and DomU is different. Details are
shown in the following:
1. When Dom0 starts profiling, it will use Xenstore to send a signal. As soon as the
background daemon in Dom0 catches the signal, it will initialize the beginning pro-
cesses and start relative daemons. Finally, we clear relative information in Xenstore.
When Dom0 stops profiling, the process is similar to starting (shown as Figure 3).
Table 1 All attributes of a CPU event
Event The event type e.g. CPU_CLK_UNHALTED
unit mask The sub-events to count
counter The hardware counter(s) that can count this event
Count The reset value (how many events before an interrupt)
Kernel Whether the counter should increment when in kernel space
User Whether the counter should increment when in user space
Xie et al. Human-centric Computing and Information Sciences 2012, 2:8http://www.hcis-journal.com/content/2/1/8
Page 7 of 15
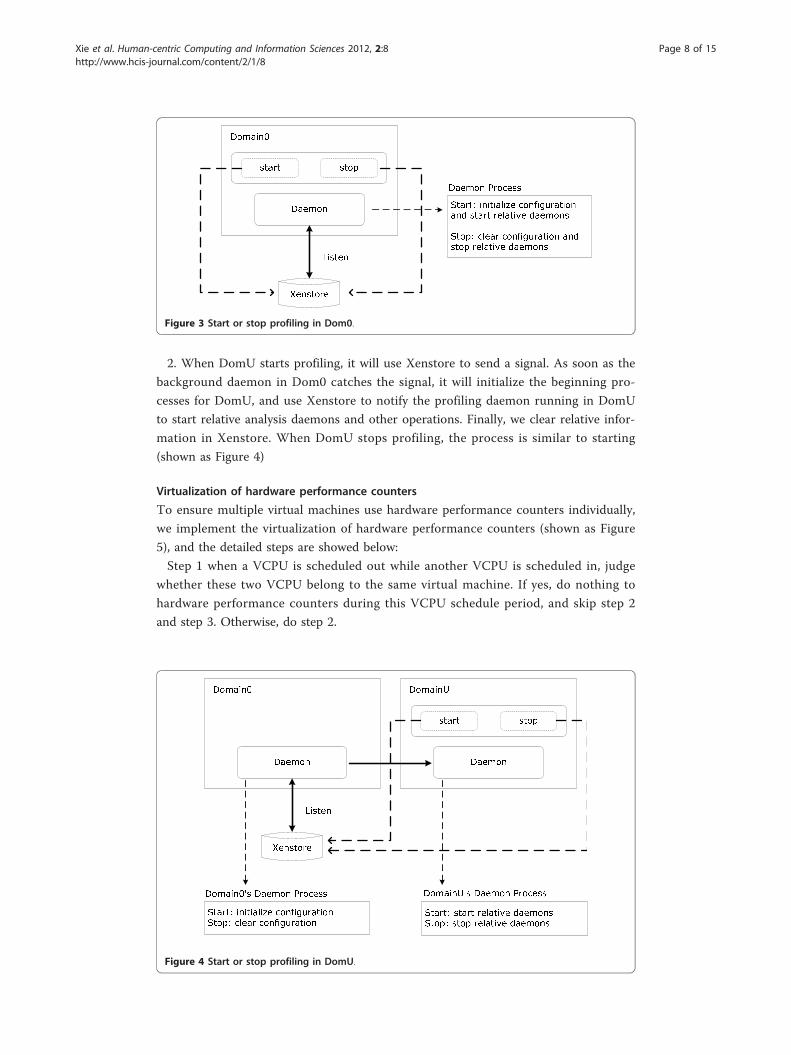
2. When DomU starts profiling, it will use Xenstore to send a signal. As soon as the
background daemon in Dom0 catches the signal, it will initialize the beginning pro-
cesses for DomU, and use Xenstore to notify the profiling daemon running in DomU
to start relative analysis daemons and other operations. Finally, we clear relative infor-
mation in Xenstore. When DomU stops profiling, the process is similar to starting
(shown as Figure 4)
Virtualization of hardware performance counters
To ensure multiple virtual machines use hardware performance counters individually,
we implement the virtualization of hardware performance counters (shown as Figure
5), and the detailed steps are showed below:
Step 1 when a VCPU is scheduled out while another VCPU is scheduled in, judge
whether these two VCPU belong to the same virtual machine. If yes, do nothing to
hardware performance counters during this VCPU schedule period, and skip step 2
and step 3. Otherwise, do step 2.
Figure 3 Start or stop profiling in Dom0.
Figure 4 Start or stop profiling in DomU.
Xie et al. Human-centric Computing and Information Sciences 2012, 2:8http://www.hcis-journal.com/content/2/1/8
Page 8 of 15

Step 2 Read the values of hardware performance counters responding to the respec-
tive CPU events for the virtual machine, which the previous VCPU belongs to, and
store them for restoration when the virtual machine is scheduled to run next time.
Step 3 Read the stored counts of respective CPU events for the virtual machine,
which the next VCPU belongs to, meanwhile get CPU events configured by the virtual
machine, and reconfigure the hardware performance counters for CPU events moni-
tored by the virtual machine to run.
Ensure profiling accuracy
To ensure the profiling accuracy, we put read/write operations of hardware perfor-
mance counters in the VMM time slice instead of VCPU time slice, as we can see in
Figure 6. During this process, we always need to restore or reset the hardware perfor-
mance counters to satisfy the need of monitoring different CPU events in different
domains. This operation will affect little to running domains and help reduce some
performance cost in domains.
Because hardware performance counters are generally used by a certain profile
toolkit instead of other processes, we ignore the samples corresponding to the pro-
cesses on hardware performance counters during the analysis of samples, which can
reduce the interference from hardware performance counters.
Performance EvaluationsIn this section, we present an experiment on a physical host with two hardware perfor-
mance counters, to monitor two events (CPU_CLK_UNHALTED and ITLB_MISS_RE-
TIRED) in a domain, while another two events (DTLB_MISSES and
Figure 5 Virtualization of hardware performance counters.
Figure 6 A way to ensure profiling accuracy.
Xie et al. Human-centric Computing and Information Sciences 2012, 2:8http://www.hcis-journal.com/content/2/1/8
Page 9 of 15

BUS_TRAN_MEM) are monitored in another domain. It shows the effect of the virtua-
lization of hardware performance counters. Besides this, we report the use of Metis to
analyze performance overheads of Gzip (a benchmark in SPEC CPU2000) by monitor-
ing two hardware events such as CPU_CLK_UNHALTED and ITLB_MISS_RETIRED.
Two users in two domains start and stop Metis simultaneously in the experiment, and
we compare the performance data with the output produced by Xenoprof.
Experimental Setup
We built our experimental environment on a server, which has 4 Intel Xeon 1.6 GHz
CPUs, 4 GB DDR RAM and 150 GB hard disk. We used Linux 2.6.18 with Xen 3.3.1
installed as the operation system. We run Xen with two guest domains configured
with equal resource allocations [20]. In all cases the VM was configured to have a sin-
gle CPU with 512 MB of RAM, and installed a Red Hat Enterprise Linux 5.3 as guest
OS. To execute evaluation, we create our test environment where two domains
(domain1 and domain2) run. The experiment environment is listed as Figure 7.
We present two experiments in this section. One is to prove that Metis enables two
domains to monitor different CPU events simultaneously without affecting each other.
Another is used to compare the performance data generated by Metis with the result
produced by Xenoprof when the gzip benchmark is running.
Functional experiment
We can use this profiling toolkit individually in either domain1 or domain2, which
enables domain1 and domain2 to monitor different CPU events simultaneously. For
example, we monitor CPU_CLK_UNHALTED and ITLB_MISS_RETIRED in domain1,
while DTLB_MISSES and BUS_TRAN_MEM are monitored in domain2 at the same
time. There are two hardware performance counters in the server, so each domain can
monitor two CPU events each time without affecting each other.
We have done an experiment in two domains (and two domains are enough for indi-
cating advantage of VirtOprof). We use domain1 to represent a priviledged domain,
while domain2 is used to represent a guest domain, and more guest domains are not
necessary because they share all CPU time slices and will not affect each other. We
monitor CPU_CLK_UNHALTED and ITLB_MISS_RETIRED in domain1, while
DTLB_MISSES and BUS_TRAN_MEM are monitored in domain2 at the same time.
We start and stop Metis in two domains simultaneously, and respective performance
Domain1
Xen 3.3.1
Server(4 Intel Xeon 1.6GHz CPUs, 4GB DDR
RAM and 150GB hard disk)
Domain1
Figure 7 The experiment environment.
Xie et al. Human-centric Computing and Information Sciences 2012, 2:8http://www.hcis-journal.com/content/2/1/8
Page 10 of 15

data can be obtained. We can use Metis to get the performance data of each running
domain.
The performance data in domain1 are showed in Figure 8 and 9 below:
In Figure 8, we can get CPU usage rate of each symbol, and it is clear that the sym-
bol named “xen-syms-3.3.1” and the symbol named “vmlinux-2.6.18.8-xen” consumed
most of CPU resources.
In Figure 9, we can get ITLB miss rate of each symbol, and it’s seen that the symbol
named “vmlinux-2.6.18.8-xen” generated most of ITLB misses, while ITLB miss rate of
the symbol named “xen-syms-3.3.1” and the symbol named “xen-unknown” are fol-
lowed it.
In Figure 10, we can see that the symbol named “vmlinux-2.6.18.8-xen” is the main
source of DTLB misses, while the symbol named “xen-syms-3.3.1” is followed. More-
over, these two symbols take up most of the whole samples.
In Figure 11, we can get BUS_TRAN_MEM sample rate of each symbol, and it is
shown that the symbol named “vmlinux-2.6.18.8-xen” generated more than a half of
total samples, while the symbol named “xen-syms-3.3.1” takes up about one third.
We can see that Metis allows two different domains to monitor different CPU events
individually, which cann’t be supported with Xenoprof, which is based on hardware
performance counters in Xen environment.
Performance comparison
SPEC CPU2000 is the next-generation industry-standardized CPU-intensive benchmark
suite. SPEC designed CPU2000 to provide a comparative measure of compute intensive
performance across the widest practical range of hardware. The implementation
resulted in source code benchmarks and developed from real user applications. These
benchmarks measure the performance of the processor, memory and compiler on the
tested system [15].
Figure 8 CPU_CLK_UNHALTED profiling in domain1.
Xie et al. Human-centric Computing and Information Sciences 2012, 2:8http://www.hcis-journal.com/content/2/1/8
Page 11 of 15
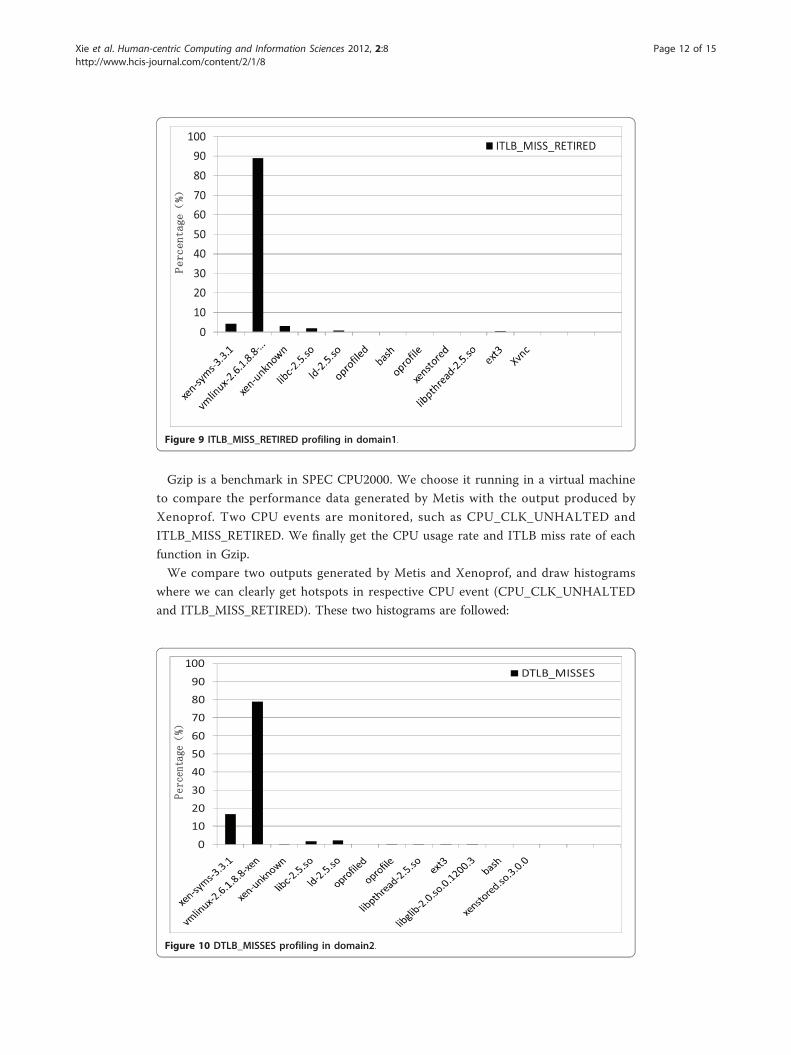
Gzip is a benchmark in SPEC CPU2000. We choose it running in a virtual machine
to compare the performance data generated by Metis with the output produced by
Xenoprof. Two CPU events are monitored, such as CPU_CLK_UNHALTED and
ITLB_MISS_RETIRED. We finally get the CPU usage rate and ITLB miss rate of each
function in Gzip.
We compare two outputs generated by Metis and Xenoprof, and draw histograms
where we can clearly get hotspots in respective CPU event (CPU_CLK_UNHALTED
and ITLB_MISS_RETIRED). These two histograms are followed:
Figure 10 DTLB_MISSES profiling in domain2.
Figure 9 ITLB_MISS_RETIRED profiling in domain1.
Xie et al. Human-centric Computing and Information Sciences 2012, 2:8http://www.hcis-journal.com/content/2/1/8
Page 12 of 15
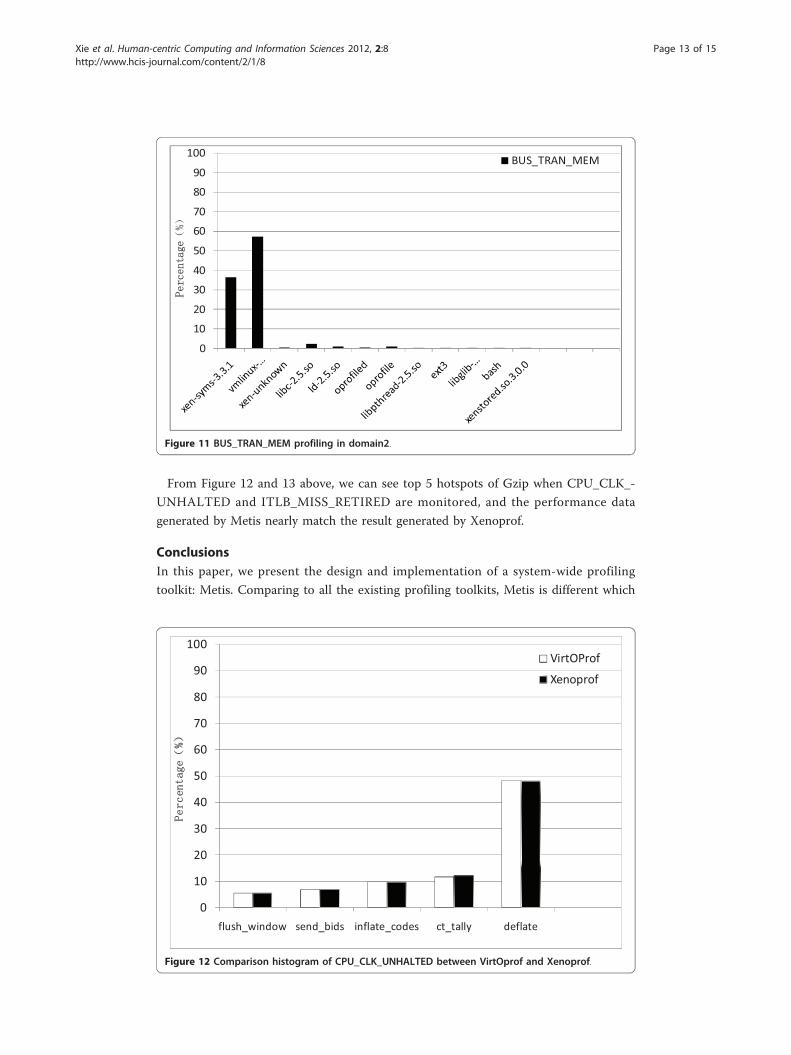
From Figure 12 and 13 above, we can see top 5 hotspots of Gzip when CPU_CLK_-
UNHALTED and ITLB_MISS_RETIRED are monitored, and the performance data
generated by Metis nearly match the result generated by Xenoprof.
ConclusionsIn this paper, we present the design and implementation of a system-wide profiling
toolkit: Metis. Comparing to all the existing profiling toolkits, Metis is different which
Figure 11 BUS_TRAN_MEM profiling in domain2.
Figure 12 Comparison histogram of CPU_CLK_UNHALTED between VirtOprof and Xenoprof.
Xie et al. Human-centric Computing and Information Sciences 2012, 2:8http://www.hcis-journal.com/content/2/1/8
Page 13 of 15

enables multiple users in different virtual machines to monitor different CPU events
simultaneously, and users in different domains can use this toolkit individually without
affecting each other. To make Metis used individually, we choose to run background
daemons in domains to profile for answering requests in time, and use the virtualiza-
tion of hardware performance counters to satisfy our need. We modify Xen source
code and Linux source code to support the virtualization of hardware performance
counters. Besides this, a set of user level daemons are used too as the management
unit in the toolkit, and we ensure the profiling accuracy in our implementation. We
apply a popular benchmark to verify the correctness of Metis and its cool features.
AcknowledgementsThis work is supported by National 973 Basic Research Program of China under grant No. 2007CB310900 and NationalNatural Science Foundation under grant No.61003007.
Author details1Services Computing Technology and System Lab, Cluster and Grid Computing Lab, School of Computer Science andTechnology, Huazhong University of Science and Technology, Wuhan 430074, China 2School of Computer Scienceand Technology, Huazhong University of Science and Technology, Wuhan 430074, China
Authors’ contributionsXia Xie carried out the Metis architecture framework, participated in the message delivery mechanism design anddrafted the manuscript. Haiou Jiang and Wenzhi Cao carried out performance evaluation. Pingpeng Yuan participatedin analyze message delivery mechanism. Hai Jin and Tianruo Yang participated in its design and coordination andhelped to draft the manuscript. All authors read and approved the final manuscript.
Competing interestsThe authors declare that they have no competing interests.
Received: 1 November 2011 Accepted: 22 March 2012 Published: 22 March 2012
References1. Padala P, Zhu X, Wang Z, Singhal S, Shin KG (2007) Performance evaluation of virtualization technologies for server
consolidation. Technical Report HPL-2007-59R1, HP Laboratories2. Barham P, Dragovic B, Fraser K, Harris SHT, Ho A, Neugebauer R, Pratt I, Warfield A (2003) Xen and the Art of
Virtualization. the Nineteenth ACM Symposium on Operating Systems Principles (SOSP2003). New York, USA
Figure 13 Comparison histogram of ITLB_MISS_RETIRED between VirtOprof and Xenoprof.
Xie et al. Human-centric Computing and Information Sciences 2012, 2:8http://www.hcis-journal.com/content/2/1/8
Page 14 of 15

3. Gavrilovska A, Kumar S, Raj K, Gupta V, Nathuji R, Niranjan A, Saraiya P (2007) High-Performance HypervisorArchitectures: Virtualization in HPC Systems. 1st Workshop on System-level Virtualization for High PerformanceComputing, Canada
4. Huang W, Liu J, Abali B, Panda DK (2006) A Case for High Performance Computing with Virtual Machines. 20th ACMInternational Conference on Supercomputing (ICS (2006) Cairns. Queensland, Australia
5. Tikotekar A, Ong H, Alam S, Vallée G, Naughton T, Engelmann C, Scott SL (2009) Performance comparison of two virtualmachine scenarios using an hpc application: a case study using molecular dynamics simulations. the 3 rd ACMWorkshop on System-level Virtualization for High Performance Computing. USA, New York
6. Rosenblum M, Garfinkel T (2005) Virtual machine monitors: Current technology and future trends. IEEE Computer38(5):39–47
7. Oprofile.http://oprofile.sourceforge.net. Accessed 10 Oct 20108. Menon A, Santos JR, Turner Y, Janakiraman GJ, Zwaenepoel W (2005) Diagnosing performance overheads in the Xen
virtual machine environment. First International Conference on Virtual Execution Environments (VEE2005). Chicago,Illinois, USA
9. The VTune™ Performance Analyzers.http://www.intel.com/software/products/vtune. Accessed: 20 Jan., 201110. VTune.http://en.wikipedia.org/wiki/VTune. Accessed: 10 Oct., 201111. Xenoprof.http://xenoprof.sourceforge.net. Accessed: 1 Feb., 201012. Santos JR, Turner Y, Janakiraman G, Pratt IA (2008) Bridging the gap between software and hardware techniques for I/O
Virtualization. ATC’08: USENIX (2008) Annual Technical Conference on Annual Technical Conference. USENIX Association,Berkeley, Korea
13. Tikotekar A, Vallée G, Naughton T, Ong HH, Engelmann C, Scott SL, Filippi AM (2008) Effects of virtualization on ascientific application running a hyperspectral radiative transfer code on virtual machines. the 2nd workshop on System-level virtualization for high performance computing. ACM, New York, NY, USA
14. Tikotekar A, Vallée G, Naughton T, Ong H, Engelmann C, Scott SL (2008) An analysis of hpc benchmarks in virtualmachine environments. 3 rd Workshop on Virtualization in High-Performance Cluster and Grid Computing. New York,USA
15. SPEC CPU2000.http://www.spec.org/cpu2000/. Accessed 10 Oct 201116. Hardware performance counters.http://en.wikipedia.org/wiki/Hardware_performance_counter. Accessed: 16 Apr., 201117. Configuration details.http://oprofile.sourceforge.net/doc/detailed-parameters.html. Accessed: 12 Aug., 201118. XenBus.http://wiki.xen.org/xenwiki/XenBus. Accessed: 10 Oct., 201119. Xenstore.http://wiki.xensource.com/xenwiki/XenStore. Accessed 10 Oct 201120. Cherkasova L, Gardner R (2005) Measuring CPU overhead for I/O processing in the xen virtual machine monitor. USENIX
(2005) Annual Technical Confernce. USA, New York
doi:10.1186/2192-1962-2-8Cite this article as: Xie et al.: Metis: a profiling toolkit based on the virtualization of hardware performancecounters. Human-centric Computing and Information Sciences 2012 2:8.
Submit your manuscript to a journal and benefi t from:
7 Convenient online submission
7 Rigorous peer review
7 Immediate publication on acceptance
7 Open access: articles freely available online
7 High visibility within the fi eld
7 Retaining the copyright to your article
Submit your next manuscript at 7 springeropen.com
Xie et al. Human-centric Computing and Information Sciences 2012, 2:8http://www.hcis-journal.com/content/2/1/8
Page 15 of 15