methods to improve anesthetic drug management by sandeep …
TRANSCRIPT
METHODS TO IMPROVE ANESTHETIC
DRUG MANAGEMENT
by
Sandeep Choudary Manyam
A dissertation submitted to the faculty of
The University of Utah
in partial fulfillment of the requirements for the degree of
Doctor of Philosophy
Department of Bioengineering
The University of Utah
December 2006

Copyright © Sandeep Manyam 2006
All Rights Reserved

ABSTRACT
Modern day anesthesia involves the use of multiple drugs simultaneously to
maintain insensitivity to pain or analgesia, lack of awareness of the surgical procedure
and suppression of autonomic responses. The sedative component of anesthesia is
primarily provided by using a hypnotic drug (volatile or intravenously administered) and
the analgesic component is provided by an opioid (primarily intravenously administered).
The level of anesthetic effect produced by these drugs is assessed by the use of a
multitude of physiologic responses such as heart rate, blood pressure, movement etc. The
response dynamics of these indicators are typically non linear and change with the
combination of anesthetics being used. The potency of drugs also vary among patients
and across age groups. These factors make the accurate titration of anesthetic drugs
challenging. Accurate titration of anesthetic drug such that the effect is just enough to
cause unconsciousness and immobility in the patient helps to avoid adverse effects such
as delayed emergence, awareness during the procedure, hyper variable cardiovascular
state and memory loss that is thought to be associated with under or overdose.
This work aims to improve anesthetic drug management through efficient drug
delivery and real time monitoring. The first goal is to improve drug delivery and clinical
outcomes for the average patient by identifying combinations of sedative and analgesic
drugs that ensure fast recovery from anesthesia. Although the combinations are suitable
to be applied in clinical practice they may not be effective when applied to individual
v
patients that are outliers (such as those who use chronic pain medication). The drug dose
in such patients can be titrated by assessing the depth of anesthesia in real time. The
second goal is to test the ability of emerging depth of anesthesia monitoring technologies
to assess each patient’s anesthetic state. Real time monitors of anesthetic effect can help
the clinicians refine their dosing strategy and predict adverse events such as intra-
operative awareness or patient responses to pain.

CONTENTS
ABSTRACT...................................................................................................................... iv
ACKNOWLEDGEMENTS .......................................................................................... viii
1. INTRODUCTION......................................................................................................... 1
1.1 Goals ................................................................................................................. 6
1.2 References......................................................................................................... 8
2. OPIOID-VOLATILE ANESTHETIC SYNERGY AND CONTEXT
SENSITIVE TARGETS ............................................................................................. 13
2.1 Abstract ........................................................................................................... 13
2.2 Introduction..................................................................................................... 15
2.3 Materials and Methods.................................................................................... 17
2.4 Results............................................................................................................. 25
2.5 Discussion ....................................................................................................... 36
2.6 Appendix A: The Logit Model for Pharmacodynamics ................................. 52
2.7 Appendix B: Pharmacokinetic and Pharmacodynamic Simulations .............. 54
2.8 References....................................................................................................... 56
3. CONTEXT SENSITIVE TARGETS FOR OPIOIDS AND
INTRAVENOUS ANESTHETICS ........................................................................... 62
3.1 Abstract ........................................................................................................... 62
3.2 Introduction..................................................................................................... 64
3.3 Materials and Methods.................................................................................... 65
3.4 Results............................................................................................................. 70
3.5 Discussion ....................................................................................................... 84
3.6 References....................................................................................................... 90
4. PROCESSED EEG TARGETS REQUIRED FOR
ADEQUATE ANESTHESIA ..................................................................................... 93
4.1 Abstract ........................................................................................................... 93
4.2 Introduction..................................................................................................... 94
4.3 Materials and Methods.................................................................................... 97
4.4 Results........................................................................................................... 102

vii
4.5 Discussion ..................................................................................................... 115
4.6 References..................................................................................................... 126
5. PROCESSED EEG SIGNALS AS INDICATORS OF
INADEQUATE ANESTHESIA............................................................................... 132
5.1 Abstract ......................................................................................................... 132
5.2 Introduction................................................................................................... 134
5.3 Materials and Methods.................................................................................. 136
5.4 Results........................................................................................................... 140
5.5 Discussion ..................................................................................................... 147
5.6 References..................................................................................................... 149
6. SUMMARY AND CONCLUSIONS ....................................................................... 151
6.1 Summary....................................................................................................... 151
6.2 Conclusions................................................................................................... 153
6.3 Impact ........................................................................................................... 154
6.4 Future Work .................................................................................................. 155

ACKNOWLEDGEMENTS
I would like to acknowledge a number of people for their help and support during
my doctoral work.
Foremost, of course is my advisor, Dr. Dwayne Westenskow. Throughout my
doctoral work he encouraged me to work on ideas that had practical applications in
clinical anesthesia. Ever since I entered his laboratory he placed extreme confidence in
me and provided me with limitless opportunities. He greatly assisted me with developing
my scientific communication skills and translating my ideas into viable research grants.
I am also grateful to a number of anesthesiologists who taught me all I know
about clinical anesthesia and conducting clinical research. Dr. Talmage Egan, for
spending countless hours in reviewing and helping me interpret my results and providing
the direction to make my work clinically relevant and innovative. For the creative
freedom he gave me while simultaneously insisting on the highest standards for both
form and content. His simple words of encouragement -- “keep up the good work” when I
had not shown him results for ages were an additional incentive for me to work harder. I
am thankful for his efforts in providing me with the broad perspective with which I could
relate any specific problem I was working on, to anesthesiology and patient care as a
whole. I was deeply touched by his kindness and generosity with ideas and financial
support.
x
Dr. Dhanesh Gupta, for his enthusiastic guidance and his step by step involvement
in translating a “paper napkin” idea in to an exciting “high-impact” manuscript. Without
his energy and emphasis on completion, I would be forever lost in refining my data
analysis. For the numerous operating room breaks and weekends he decided to spend
with me to ensure my simulations were meaningful.
Dr. Ken Johnson, for his insightful comments on my results and constant
encouragement. For the number of hours he spent helping me understand anesthetic
dosing.
Dr. Nathan Pace, for insisting on the right statistical methods at every stage. For
allowing me to “pick his brain” at will and always helping me with a solution or pointing
me in a direction in which I could find one.
I am greatly appreciative of the committee members for their time and effort in
not only clarifying my research ideas but also in ensuring that I receive a well rounded
education. Dr. Richard Normann, who was incidentally the first professor whom I met in
Utah, helped me continually in identifying my interests and helping me define my long
term career goals. I am still in awe of his child-like enthusiasm when conducting
laboratory research and hope that I am able to bring that level of energy in to my own
experiments some day. I have always relied on his frank opinion and guidance throughout
my graduate education and hope this will continue for years to come.
Dr. Steve Kern, for his support with any engineering dilemmas and his
stimulating discussions on pharmacodynamic models and methods. For the confidence he
gave me by just “being there” for I knew that if I was stuck with a problem Dr. Kern
could probably bail me out.

xi
Dr. Rob Macleod who, along with Dr. Patrick Tresco, taught a set of classes that
formed the foundation of my graduate education. What made these two classes stand out
was not just the content that was taught but their emphasis on the manner in which an
engineer-scientist ought to approach a biological system. As I set out on my academic
career their teaching style will always be the standard that I would try to achieve. I
would also like to thank Rob for offering me a teaching assistantship. This enabled me to
observe his teaching methods at close hand and also came at a time when I was faced
with funding problems.
Dr. Srikantan Nagarajan, who taught me so much about the basic principles of
conducting research. So many of the concepts I learnt in his laboratory extend far beyond.
Sri insisted in making the most out of any experiment. He would insist that every
experiment whether a failure or a success needs to “count” toward my own as well as the
society’s learning process. His words “focus on the science” still ring in my ears and
motivate me when I am frustrated with a research problem.
Drs. Gregory Clark and Kenneth Horch, for their advice during the crucial days
when I was faced with major decisions during my graduate studies. Dr. Clark for his
particular emphasis on rigorous experimental techniques and personal attention to my
experimental skills and writing techniques in the neural interfaces laboratory.
Julia White, our research nurse, who was involved in all steps of planning the
study, volunteer recruitment and data collection. Without her attention to detail these
studies would have been monumentally difficult.

xii
Noah Syroid and Jim Agutter at MedVis, for their continued support over the
years. I will miss the informal discussions with Noah and his active participation in
research conferences.
The administrative staff at the anesthesiology and bioengineering departments.
Specifically, Jeff Mann, Vicki Larsen, Karen Terry, Paul Dryden and Linda Twitchell
among many for others their logistical and technical help. My past and present lab mates
at the anesthesia bioengineering laboratory for their friendship and their insightful
discussions.
Finally, I deeply appreciate the unwavering support and encouragement my
family and friends. My mother, Deepa Choudary, for her encouragement to explore and
young age. For her numerous personal sacrifices to keep us oblivious to other problems.
My sister, Kinnera Krishna, who has always encouraged me to pursue my interests no
matter what the costs. My fiancée, Nirupama Ramkumar, who endured frustrating and
good times with me through the various stages of graduate school. With great pleasure
and gratitude I dedicate my work to them

CHAPTER 1
INTRODUCTION
In modern clinical practice, anesthesia comprises of three main components-
insensitivity to pain or analgesia, lack of awareness of the surgical procedure and
suppression of autonomic responses. This is achieved by using different classes of drugs
simultaneously. The analgesic component is most commonly provided by opioids which
are primarily delivered intravenously. Lack of awareness or sedation is achieved by a
hypnotic drug. The hypnotic agent may be administered through a vaporizer for volatile
agents (ex. sevoflurane) or by using an infusion pump for intravenous drugs (ex.
propofol). In addition to sedation and analgesia, muscle relaxants are used to suppress
somatic motor responses.
Certain hypnotic drugs alone can often produce surgically adequate anesthesia
albeit at higher concentrations.13
This approach, which was common in the past, is often
associated with excessive hemodynamic depression14
and other undesirable side effects
of administration of high doses of the hypnotic drug for a long period of time (e.g.,
prolonged time to awakening from anesthesia, etc.).15
Thus, for practical purposes, the
current state of the art is to produce anesthesia with an opioid and a sedative in
combination.1
Interaction is observed among many drugs used in anesthetic practice. The
addition of opioid reduces the concentration of the hypnotic drug required to produce

2
sedation.3,16-29
Similarly the presence of a hypnotic drug enhances analgesia and reduces
the opioid requirements. Although, anesthetic drug interactions were widely studied in
the past,17,22,27,28,30,31
it is only more recently that they have been quantified by the use of
a mathematical model.2,3,23,25,32-36
The pharmacodynamic interaction models relate the
concentration of the two drugs to the level of effect they produce. These models can help
clinicians determine if a certain dose combination of hypnotic and opioid will provide
adequate sedation and analgesia. Response surface models allow the complete
characterization of pharmacodynamic interactions over the entire spectrum of possible
concentration pairs32,33
instead of just a single level of drug effect such as a 50%
probability of nonresponsiveness to surgical incision (e.g., Minimum Alveolar
Concentration, MAC). Short, et al. describe a crisscross sampling method37
which can be
used to sample drug concentration pairs needed to construct a response surface. Response
surface pharmacodynamic interaction methods provide a framework to define and
explore these issues. However such methods have not been used to study the interaction
between volatile anesthetics and opioids. These models can also form the basis for the
development of a real-time pharmacokinetic-pharmacodynamic display system.38
The choice of anesthetic drugs and their clinically effective concentrations is
based on a number of factors. The opioid is selected based on a combination of the
potency and the speed of decay of the drug at the effect site.39
For shorter procedures a
drug with rapid induction and a very short half life, such as remifentanil (t1/2 = 0.9 min.)
is ideal. For longer procedure a long acting drug such as, fentanyl (t1/2 = 4.7 min.) or
sufentanil (t1/2 = 5.9 min.) may be preferred. The hypnotic drug is selected based on the
patient’s preexisting clinical conditions, the intensity and duration of procedure. The drug

3
dosage is computed using the patient parameters that influence uptake and delivery, such
as age, weight, height, etc. The drug dose regimen that is determined based on knowledge
of clinical testing of the drug is adapted intraoperatively to suit the patient.
The accurate titration of drugs such that the level of drug is just enough to block
responses is highly desirable. This enables the clinician to provide an adequate level of
anesthesia within the operating room and facilitate rapid recovery once the procedure has
ended. Several factors such as interpatient pharmacokinetic and pharmacodynamic
variability make this task challenging. Pharmacokinetic variability can be described as
the variation in the uptake and distribution of drug between patients. It is on the order of
70% (i.e. with an infusion rate of 10 mg/kg/hr of propofol the blood concentration may
vary from 3 to 5 mg/L in patients). Differences in cardiac output, hepatic perfusion,
enzyme activity and protein binding contribute to this variability.6,40-46
Pharmacodynamic
variability can be described as the variation of the potency of the drug in each patient.
Several investigators have quantified this variation to be on the order of 300-400%47-54
(i.e., some patients may lose consciousness at a blood concentration of 1 mg/L while
other’s may need as much as 5 mg/L before they are sedated). The factors responsible for
pharmacodynamic variability are still unclear although some investigators suspect the
variability arises from genetic differences in receptor pharmacology.55
Clinicians cope
with this combined variability by adjusting the drug dose to suppress patient responses.
These limitations necessitate the development of methodical schemes to determine the
dose for combinations of anesthetic drugs that will work in all types of patients.
To determine the level of anesthesia clinicians often depend on unreliable,
nonspecific measures56
such as hemodynamics, reflexes to stimuli, spontaneous

4
respiration rate, etc. to determine the level of anesthetic effect. To use these methods, the
clinician is dependent on a number of factors such as training, experience and availability
of intraoperative monitoring methods. It is difficult to monitor some measures such as
blood pressure as a continuous signal intraoperatively. Hemodynamic responses are often
affected by the presence of vasoactive and ionotropic drugs.57
The lack of definite
indicators for sedation and analgesia make the precise delivery of anesthetics drugs
challenging. The use of patient responses to accurately titrate anesthetic drugs
intraoperatively is not viable ethically, as eliciting patient responses may cause patient
discomfort. Thus, many clinicians often chose to operate with a more than adequate level
of drug to prevent patient awareness and responses. Even though there are no direct
adverse effects with using this range of concentrations they may result in delayed
emergence and higher operating costs. A real-time monitoring system may address may
address many of these concerns.
It is well understood that patterns within the electroencephalogram (EEG) are
good correlates to clinical endpoints such as loss of consciousness.58, 59
Despite this, EEG
monitors have not been widely accepted intraoperatively by anesthesiologists. The
primary reasons are (1) EEG is a data intensive signal and analysis in real time is tedious,
(2) Large inherent variability in the signal (3) lack of clear guidelines to assess changing
levels of sedation and (4) Not all drugs produce a similar effect on the EEG at a given
clinical endpoint (loss of consciousness). These limitations are somewhat addressed by
CNS effect monitors that extract salient features of the EEG waveform that correlate well
with depth of anesthesia and quantify them in to a index.

5
The processed EEG has emerged as an important surrogate measure of CNS drug
effect.11, 12
Surrogate measures are employed when the clinical drug effect of interest is
difficult or impossible to measure. The processed EEG has many characteristics of the
ideal surrogate. In contrast to more clinically oriented measures of drug effect, it is an
objective, continuous, reproducible, noninvasive, high resolution signal. It can also be
used as an effect measure when an experimental subject is unconscious or apneic,
whereas many of the more clinically oriented measurements require awake, cooperative
subjects. The processed EEG signal has been commercialized by number of
manufacturers. Preliminary studies validating the bispectral index (BIS), reported the
concentration-BIS relationship and examined the ability of the BIS monitor to track
sedation.12
A major limitation of several such studies is that they report the predictive
performance of the BIS monitor when drugs are used in isolation. Since modern
anesthesia calls for a balanced sedation and analgesia, opioids are almost ubiquitous in
pain management. A study that evaluates such monitoring technologies must replicate the
clinical environment in which they are intended for use. Although the ability of processed
EEG monitors to track the sedative state has been extensively studied, the ability of these
monitors to detect pain in patients who are undergoing a surgical procedure has not been
reported. If processed EEG monitors correlate with patient responses to pain, they will be
an invaluable tool to identify inadequate anesthesia in patients when traditional markers
such as movement and heart rate are obscured by the presence of other drugs.
Recent advances in drugs, monitoring technology and combined pharmacologic
knowledge have shown that drugs can be improved in clinical anesthetic practice.
Accurate knowledge of the drug disposition and a method of feedback of the analgesic

6
and sedative drug effect may eventually lead to the development of a closed loop
computer controlled anesthesia system.60, 61
1.1 Goals
This dissertation aims to improve anesthetic drug management in two steps.
Pharmacokinetic and pharmacodynamic models can be used to predict the level of
sedation and analgesia in a patient. The first step is to construct pharmacodynamic
models for a commonly used opioid (remifentanil) and volatile hypnotic drug
(sevoflurane). We can then use simulations based on these models, to identify certain
factors which when applied to anesthetic practice will improve clinical outcomes.
Specifically simulations will be used to identify a combination of opioid and hypnotic
that will provide adequate anesthesia and enable the patient to regain sensation quickly
after the procedure. Further, these models will help understand the combined effects of
volatile anesthetics and opioids. Our second goal is to provide the clinician with a means
for feedback of the patient’s anesthetic state within the operating room. To achieve this
we will test emerging technologies in their ability to monitor adequate anesthesia and
their ability to detect patient responses. Understanding the operating characteristics of
such monitors will improve intraoperative monitoring and enable more accurate drug
administration.
Chapters 2 and 3 of this dissertation describe pharmacodynamic models that
estimate the interaction between commonly used hypnotic and opioid drugs. Chapter 2 in
specific describes the interaction between a volatile agent and an opioid drug. Chapter 2
fills in an important void in our understanding of volatile anesthetic and opioid
interactions. The quantitative description of analgesic and sedative effect caused by the
7
combinations of drugs can be extended to other volatile anesthetics and opioids. Chapter
2 also introduces an optimization technique used to estimate context sensitive optimal
combinations that ensure adequate anesthesia by targeting drug doses that produce
sedation and analgesia in a wide patient population and speed up emergence. After
further validation, the clinical application of these results will lead to accurate anesthetic
dosing in the general patient population. Chapter 3 extends the methods described in
Chapter 2 to estimate optimal combinations of an intravenous hypnotic drug and an
opioid. Chapter 3 introduces methods by which number of clinical endpoints (adequate
sedation, analgesia and rapid emergence) can be ensured simultaneously through drug
optimization. These techniques can be extended to wide range of anesthetic procedures
that require a particular level of sedation and analgesia (e.g., outpatient procedures that
are common in a gastroenterology clinic have specific sedation and analgesia
requirements that differ from the typical surgical procedure). This technique can also be
used to ensure other desirable clinical outcomes such as minimizing cost of anesthetics,
minimal respiratory depression or preventing side effects such as nausea that are
associated with a specific drug concentration.
Chapters 4 and 5 examine the performance of two emerging processed
electroencephalographic (EEG) monitors that can be used to determine the depth of
anesthesia in real-time. In Chapter 4, the ability to monitor depth of sedation is studied.
Processed EEG monitor targets that coincide with adequate analgesia and sedation are
described. The manufacturers of processed EEG monitors recommend certain monitor
indices that are associated with adequate sedation, the results presented in this chapter
prove that the monitor index associated with adequate sedation varies as function of the

8
combination of drugs used to provide anesthesia. These limitations are addressed by the
suggesting processed EEG monitor targets associated with adequate anesthesia. Chapter 5
examines the changes in processed EEG monitor indices in response to stimulation. The
results of this exploratory study highlight the need for further algorithm development in
the processed EEG monitors. Finally, Chapter 6 summarizes important conclusions from
this work and suggests future work in this area of research.
1. 2 References
1. Eger EI, 2nd, Saidman LJ, Brandstater B: Minimum alveolar anesthetic
concentration: a standard of anesthetic potency. Anesthesiology 1965; 26: 756-63
2. Zbinden AM, Petersen-Felix S, Thomson DA: Anesthetic depth defined
using multiple noxious stimuli during isoflurane/oxygen anesthesia. II. Hemodynamic
responses. Anesthesiology 1994; 80: 261-7
3. Zbinden AM, Maggiorini M, Petersen-Felix S, Lauber R, Thomson DA,
Minder CE: Anesthetic depth defined using multiple noxious stimuli during
isoflurane/oxygen anesthesia. I. Motor reactions. Anesthesiology 1994; 80: 253-60
4. Kissin I: General anesthetic action: an obsolete notion? Anesth Analg
1993; 76: 215-8
5. Bouillon T, Schmidt C, Garstka G, Heimbach D, Stafforst D, Schwilden
H, Hoeft A: Pharmacokinetic-pharmacodynamic modeling of the respiratory depressant
effect of alfentanil. Anesthesiology 1999; 91: 144-55
6. Brunner MD, Braithwaite P, Jhaveri R, McEwan AI, Goodman DK, Smith
LR, Glass PS: MAC reduction of isoflurane by sufentanil. Br J Anaesth 1994; 72: 42-6
7. Egan TD, Minto C: Common Pharmacodynamic Drug Interactions in
Drug Practice. Anesthetic Pharmacology: Physiologic Principles and Clinical Practice
2004; Chap. 6: 91-102
8. Glass PS, Gan TJ, Howell S, Ginsberg B: Drug interactions: volatile
anesthetics and opioids. J Clin Anesth 1997; 9: 18S-22S
9. Katoh T, Kobayashi S, Suzuki A, Kato S, Iwamoto T, Bito H, Sato S:
Fentanyl augments block of sympathetic responses to skin incision during sevoflurane
anaesthesia in children. Br J Anaesth 2000; 84: 63-6
9
10. Katoh T, Nakajima Y, Moriwaki G, Kobayashi S, Suzuki A, Iwamoto T,
Bito H, Ikeda K: Sevoflurane requirements for tracheal intubation with and without
fentanyl. Br J Anaesth 1999; 82: 561-5
11. Kazama T, Ikeda K, Morita K: Reduction by fentanyl of the Cp50 values
of propofol and hemodynamic responses to various noxious stimuli. Anesthesiology
1997; 87: 213-27
12. Kern SE, Xie G, White JL, Egan TD: A response surface analysis of
propofol-remifentanil pharmacodynamic interaction in volunteers. Anesthesiology 2004;
100: 1373-81
13. Mertens MJ, Olofsen E, Engbers FH, Burm AG, Bovill JG, Vuyk J:
Propofol reduces perioperative remifentanil requirements in a synergistic manner:
response surface modeling of perioperative remifentanil-propofol interactions.
Anesthesiology 2003; 99: 347-59
14. Mertens MJ, Vuyk J, Parivar K, Engbers FH, Burm AG, Bovill JG:
Pharmacodynamic interaction of eltanolone and alfentanil during lower abdominal
surgery in female patients. Br J Anaesth 1999; 83: 250-2
15. Minto CF, Schnider TW, Short TG, Gregg KM, Gentilini A, Shafer SL:
Response surface model for anesthetic drug interactions. Anesthesiology 2000; 92: 1603-
16
16. Nieuwenhuijs DJ, Olofsen E, Romberg RR, Sarton E, Ward D, Engbers F,
Vuyk J, Mooren R, Teppema LJ, Dahan A: Response surface modeling of remifentanil-
propofol interaction on cardiorespiratory control and bispectral index. Anesthesiology
2003; 98: 312-22
17. Sebel PS, Glass PS, Fletcher JE, Murphy MR, Gallagher C, Quill T:
Reduction of the MAC of desflurane with fentanyl. Anesthesiology 1992; 76: 52-9
18. Smith C, McEwan AI, Jhaveri R, Wilkinson M, Goodman D, Smith LR,
Canada AT, Glass PS: The interaction of fentanyl on the Cp50 of propofol for loss of
consciousness and skin incision. Anesthesiology 1994; 81: 820-8; discussion 26A
19. Vuyk J, Engbers FH, Burm AG, Vletter AA, Griever GE, Olofsen E,
Bovill JG: Pharmacodynamic interaction between propofol and alfentanil when given for
induction of anesthesia. Anesthesiology 1996; 84: 288-99
20. Katoh T, Ikeda K: The effects of fentanyl on sevoflurane requirements for
loss of consciousness and skin incision. Anesthesiology 1998; 88: 18-24

10
21. Katoh T, Kobayashi S, Suzuki A, Iwamoto T, Bito H, Ikeda K: The effect
of fentanyl on sevoflurane requirements for somatic and sympathetic responses to
surgical incision. Anesthesiology 1999; 90: 398-405
22. Minto C, Vuyk J: Response surface modelling of drug interactions. Adv
Exp Med Biol 2003; 523: 35-43
23. Greco WR, Bravo G, Parsons JC: The search for synergy: a critical review
from a response surface perspective. Pharmacol Rev 1995; 47: 331-85
24. Nieuwenhuijs D, Sarton E, Teppema LJ, Kruyt E, Olievier I, van Kleef J,
Dahan A: Respiratory sites of action of propofol: absence of depression of peripheral
chemoreflex loop by low-dose propofol. Anesthesiology 2001; 95: 889-95
25. Dahan A, Nieuwenhuijs D, Olofsen E, Sarton E, Romberg R, Teppema L:
Response surface modeling of alfentanil-sevoflurane interaction on cardiorespiratory
control and bispectral index. Anesthesiology 2001; 94: 982-91
26. Bouillon TW, Bruhn J, Radulescu L, Andresen C, Shafer TJ, Cohane C,
Shafer SL: Pharmacodynamic interaction between propofol and remifentanil regarding
hypnosis, tolerance of laryngoscopy, bispectral index, and electroencephalographic
approximate entropy. Anesthesiology 2004; 100: 1353-72
27. Berenbaum MC: What is synergy? Pharmacol Rev 1989; 41: 93-141
28. Short TG, Ho TY, Minto CF, Schnider TW, Shafer SL: Efficient trial
design for eliciting a pharmacokinetic-pharmacodynamic model-based response surface
describing the interaction between two intravenous anesthetic drugs. Anesthesiology
2002; 96: 400-8
29. Syroid ND, Agutter J, Drews FA, Westenskow DR, Albert RW, Bermudez
JC, Strayer DL, Prenzel H, Loeb RG, Weinger MB: Development and evaluation of a
graphical anesthesia drug display. Anesthesiology 2002; 96: 565-75
30. Shafer SL, Varvel JR: Pharmacokinetics, pharmacodynamics, and rational
opioid selection. Anesthesiology 1991; 74: 53-63
31. Bouillon T, Shafer SL: Does size matter? Anesthesiology 1998; 89: 557-
60
32. Egan TD, Huizinga B, Gupta SK, Jaarsma RL, Sperry RJ, Yee JB, Muir
KT: Remifentanil pharmacokinetics in obese versus lean patients. Anesthesiology 1998;
89: 562-73

11
33. Ausems ME, Stanski DR, Hug CC: An evaluation of the accuracy of
pharmacokinetic data for the computer assisted infusion of alfentanil. Br J Anaesth 1985;
57: 1217-25
34. Kuipers JA, Boer F, de Roode A, Olofsen E, Bovill JG, Burm AG:
Modeling population pharmacokinetics of lidocaine: should cardiac output be included as
a patient factor? Anesthesiology 2001; 94: 566-73
35. Kuipers JA, Boer F, Olieman W, Burm AG, Bovill JG: First-pass lung
uptake and pulmonary clearance of propofol: assessment with a recirculatory indocyanine
green pharmacokinetic model. Anesthesiology 1999; 91: 1780-7
36. Maitre PO, Ausems ME, Vozeh S, Stanski DR: Evaluating the accuracy of
using population pharmacokinetic data to predict plasma concentrations of alfentanil.
Anesthesiology 1988; 68: 59-67
37. Maitre PO, Vozeh S, Heykants J, Thomson DA, Stanski DR: Population
pharmacokinetics of alfentanil: the average dose-plasma concentration relationship and
interindividual variability in patients. Anesthesiology 1987; 66: 3-12
38. Minto CF, Schnider TW, Egan TD, Youngs E, Lemmens HJ, Gambus PL,
Billard V, Hoke JF, Moore KH, Hermann DJ, Muir KT, Mandema JW, Shafer SL:
Influence of age and gender on the pharmacokinetics and pharmacodynamics of
remifentanil. I. Model development. Anesthesiology 1997; 86: 10-23
39. Bailey PL, Rhondeau S, Schafer PG, Lu JK, Timmins BS, Foster W, Pace
NL, Stanley TH: Dose-response pharmacology of intrathecal morphine in human
volunteers. Anesthesiology 1993; 79: 49-59; discussion 25A
40. Bouillon T, Bruhn J, Radu-Radulescu L, Andresen C, Cohane C, Shafer
SL: Mixed-effects modeling of the intrinsic ventilatory depressant potency of propofol in
the non-steady state. Anesthesiology 2004; 100: 240-50
41. Drover DR, Lemmens HJ: Population pharmacodynamics and
pharmacokinetics of remifentanil as a supplement to nitrous oxide anesthesia for elective
abdominal surgery. Anesthesiology 1998; 89: 869-77
42. Egan TD: Remifentanil pharmacokinetics and pharmacodynamics. A
preliminary appraisal. Clin Pharmacokinet 1995; 29: 80-94
43. Minto C, Schnider T: Expanding clinical applications of population
pharmacodynamic modelling. Br J Clin Pharmacol 1998; 46: 321-33
44. Ropcke H, Wirz S, Bouillon T, Bruhn J, Hoeft A: Pharmacodynamic
interaction of nitrous oxide with sevoflurane, desflurane, isoflurane and enflurane in

12
surgical patients: measurements by effects on EEG median power frequency. Eur J
Anaesthesiol 2001; 18: 440-9
45. Schnider TW, Minto CF, Bruckert H, Mandema JW: Population
pharmacodynamic modeling and covariate detection for central neural blockade.
Anesthesiology 1996; 85: 502-12
46. Somma J, Donner A, Zomorodi K, Sladen R, Ramsay J, Geller E, Shafer
SL: Population pharmacodynamics of midazolam administered by target controlled
infusion in SICU patients after CABG surgery. Anesthesiology 1998; 89: 1430-43
47. Kharasch ED, Jubert C, Senn T, Bowdle TA, Thummel KE:
Intraindividual variability in male hepatic CYP3A4 activity assessed by alfentanil and
midazolam clearance. J Clin Pharmacol 1999; 39: 664-9
48. Schneider G, Sebel PS: Monitoring depth of anaesthesia. Eur J
Anaesthesiol Suppl 1997; 15: 21-8
49. Berne RM, Levy MN: Physiology. Fourth Edition, Mosby 1998
50. Rampil IJ, Lockhart SH, Eger EI, 2nd, Yasuda N, Weiskopf RB, Cahalan
MK: The electroencephalographic effects of desflurane in humans. Anesthesiology 1991;
74: 434-9
51. Rampil IJ: A primer for EEG signal processing in anesthesia.
Anesthesiology 1998; 89: 980-1002
52. Gan TJ, Glass PS, Windsor A, Payne F, Rosow C, Sebel P, Manberg P:
Bispectral index monitoring allows faster emergence and improved recovery from
propofol, alfentanil, and nitrous oxide anesthesia. BIS Utility Study Group.
Anesthesiology 1997; 87: 808-15
53. Glass PS, Bloom M, Kearse L, Rosow C, Sebel P, Manberg P: Bispectral
analysis measures sedation and memory effects of propofol, midazolam, isoflurane, and
alfentanil in healthy volunteers. Anesthesiology 1997; 86: 836-47
54. Locher S, Stadler KS, Boehlen T, Bouillon T, Leibundgut D, Schumacher
PM, Wymann R, Zbinden AM: A new closed-loop control system for isoflurane using
bispectral index outperforms manual control. Anesthesiology 2004; 101: 591-602
55. Glass PS, Rampil IJ: Automated anesthesia: fact or fantasy?
Anesthesiology 2001; 95: 1-2
CHAPTER 2
OPIOID-VOLATILE ANESTHETIC SYNERGY AND CONTEXT
SENSITIVE TARGETS §
2.1 Abstract
2.1.1 Background
Combining a hypnotic and an analgesic to produce sedation, analgesia, and
surgical immobility required for clinical anesthesia is more common than administration
of a volatile anesthetic alone. The aim of this study was to apply response surface
methods to characterize the interactions between remifentanil and sevoflurane.
2.1.2 Methods
Sixteen adult volunteers received a target controlled infusion of remifentanil (0-
15 ng•mL-1
) and inhaled sevoflurane (0-6 vol %) at various target concentration pairs.
After reaching pseudo-steady-state drug levels, the Observer's Assessment of
Alertness/Sedation score and response to a series of randomly applied experimental pain
stimuli (pressure algometry, electrical tetany, and thermal stimulation) were observed for
each target concentration pair. Response surface pharmacodynamic interaction models
were built using the pooled data for sedation and analgesic endpoints. Using computer
§ Accepted for publication in Anesthesiology, February 2006. Reprinted with permission
from Anesthesiology. Copyright 2006, American Society of Anesthesiologists. Original
article titled: “Opioid-volatile anesthetic synergy: A response surface model with
remifentanil and sevoflurane as prototypes.”

14
simulation, the pharmacodynamic interaction models were combined with previously
reported pharmacokinetic models to identify the combination of remifentanil and
sevoflurane that yielded the fastest recovery (Observer’s Assessment of
Alertness/Sedation score ≥ 4) for anesthetics lasting 30-900 minutes.
2.1.3 Results
Remifentanil synergistically decreased the amount of sevoflurane necessary to
produce sedation and analgesia. Simulations revealed that as the length of the procedure
increased, faster recovery was produced by concentration target pairs containing higher
amounts of remifentanil. This trend plateaued at a combination of 0.75 vol % sevoflurane
and 6.2 ng•mL-1
remifentanil.
2.1.4 Conclusion
Response surface analyses demonstrate a synergistic interaction between
remifentanil and sevoflurane for sedation and all analgesic endpoints.
2.1.5 Acknowledgements
Supported in part by a research grant from Alaris Medical Systems, Inc., San
Diego, CA, U.S.A. (TDE) and by the National Institute of Biomedical Imaging and
Bioengineering of the National Institutes of Health 8 RO1 EB00294 (SCM and DRW).
Portions of this work have been presented at the 79th
Annual Clinical and
Scientific Congress of the International Anesthesia Research Society in Honolulu, HI,
March 15, 2005, (Poster S-405) and the 80th
Annual Clinical and Scientific Congress of
the International Society of Anesthesia Research in San Francisco, CA, March 27, 2006.

15
The authors would like to thank Steve E. Kern, Ph. D. (Associate Professor,
Departments of Pharmaceutics and Anesthesiology, University of Utah), for his insightful
comments and feedback in the preparation of this manuscript.
2.2 Introduction
In the modern era, anesthesia is at least a two drug process consisting of an opioid
and a sedative. The sedative component is typically provided by a volatile anesthetic or
the intravenous sedative propofol. The opioid component is most commonly provided by
fentanyl or one of its congeners. Although it is possible to achieve anesthesia with high
doses of the sedative alone (i.e., a volatile anesthetic or propofol), this approach is often
associated with excessive hemodynamic depression1 and other adverse effects such as
prolonged time to awakening from anesthesia.2 Thus, for practical purposes, the current
state of the art is to produce anesthesia with an opioid and a sedative in combination.
Opioid-hypnotic drug interaction studies have traditionally evaluated the effects
of adding one or two fixed doses or concentrations of a drug to several defined
concentrations of the second drug.3-7
Analysis of this interaction data is most commonly
performed utilizing an isobologram or demonstrating the shift of parallel dose-response
curves. Studies designed to characterize the interaction between sedatives and opioids
using these traditional methods confirm the synergistic nature of the pharmacodynamic
interactions.8-10
A significant drawback of the isobologram technique is that it describes
the interaction at a single level of drug effect (e.g., the Minimum Alveolar Concentration,
MAC- the end-tidal concentration of volatile anesthetic where there is a 50% probability
of moving to a skin incision-among others). Recently, response surface methodology has
been applied to the study of anesthetic drug interactions.11-14
Response surface models

16
allow the complete characterization of pharmacodynamic interactions over the entire
spectrum of possible concentration pairs.12,15
Isobolograms represent just a single
“slice” through the response-surface, whereas the response surface approach provides
information over the entire spectrum of drug effect.
Response surface pharmacodynamic interaction methods provide a framework to
define and explore opioid-hypnotic interactions. Information about whether the
interaction between two drugs is supradditive (synergistic), additive, or antagonistic is
easily determined by the morphology of the surface. Furthermore, through computer
simulation, it is possible to combine these response surface pharmacodynamic models
with pharmacokinetic models to identify combinations of drugs that produce the same
probability of producing a therapeutic effect while optimizing some other desirable
outcome, such as the speed of awakening from anesthesia.8
Prior work in our laboratory created response surface pharmacodynamic models
for remifentanil and propofol in combination.13
The current study is intended to extend
this work to the interaction between volatile anesthetics and opioids using sevoflurane
and remifentanil as prototypes of their respective drug classes. The principle aim of this
study was to characterize the pharmacodynamic interactions of remifentanil and
sevoflurane in producing sedation and analgesia using response surface models. We
hypothesized that sevoflurane and remifentanil would demonstrate synergistic
interactions for all the analgesic and sedative endpoints. By quantitatively describing
these interactions and utilizing previously described pharmacokinetic models, we
hypothesized that we could determine, through simulation, those combinations of

17
sevoflurane and remifentanil that would provide clinically adequate anesthesia and result
in the most rapid emergence from anesthetics of varying durations.
2.3 Materials and Methods
2.3.1 Volunteer Recruitment and Instrumentation
After approval by the Human Institutional Review Board at the University of
Utah Health Sciences Center (Salt Lake City, Utah, U.S.A.), informed written consent
was obtained from 16 healthy adult male and female volunteers. Eligible subjects had an
American Society of Anesthesiologists Physical Status of I, were nonsmokers, were 18–
45 years of age, and deviated by no more than 25% from their ideal body weight.
Volunteers who had a history of significant alcohol or drug abuse, a history of allergy to
opioids, a family history of malignant hyperthermia , or a history of chronic drug use or
medical illness that is known to alter the pharmacokinetics or pharmacodynamics of
opioids or inhalation anesthetics were not eligible.
After a period of overnight fasting, volunteers had an intravenous catheter placed
for fluid and drug administration, and electrocardiogram, pulse oximetry, non-invasive
blood pressure, expired carbon dioxide and expired anesthetic gas monitoring were
applied. To measure the response to electrical tentanic stimulation, surface electrodes
were placed at the posterior tibial nerve. Prior to administration of the study drugs,
volunteers were treated with 0.2 mg glycopyrrolate to prevent bradycardia, and 1 mg
pancuronium to prevent muscle rigidity due to the opioid infusion. Each volunteer
received 30 mL of sodium citrate by mouth.
18
2.3.2 Study Design
The study was an open-label, randomized, parallel group study using a crisscross
design as advocated by Short, et al.16
to assess drug interactions. Similar methodology
was used in our earlier report describing the interactions between propofol and
remifentanil.13
Each volunteer was randomized into one of two study groups. The
primary drug for the first group was remifentanil (0.5-15 ng•mL-1
) and for the second
group the primary drug was sevoflurane (0.3-6 vol %). The primary agent was
administered from a low to a high concentration in random steps determined a priori to
allow characterization of the entire concentration range when all data were pooled
(Figure 2.1). After obtaining pharmacodynamic measurements at the highest
concentration of the primary agent, a washout period was observed during which time the
primary agent decayed to predicted concentrations below the initial target concentrations.
This was followed by the administration of the secondary drug at a stable background
level. The primary agent was administered from low to high concentration in the same
steps as in the initial period. Following another washout period, a higher background
level of the secondary drug was administered before the primary agent was administered
from low to high concentration in the same steps. Upon completion of this third set of
data collection, all of the drugs were discontinued and the volunteer was allowed to
recover.
2.3.3 Drug Delivery
Remifentanil was administered to specific predicted effect site concentration
targets using a computer assisted infusion pump (Pump 22, Harvard Apparatus, Limited,
Holliston, MA ) utilizing the pharmacokinetic parameters described by Minto, et al.,17

19
Figure 2.1: A schematic summary of the infusion scheme. During each of the three study
periods the primary drug is administered in a stepwise fashion (solid black line), while in
the second and third study periods, the second drug (grey filled area) is held at a constant
predicted effect site concentration or measured alveolar concentration. In between each
study period there is a washout phase, during which the primary and secondary drugs are
allowed to decay to predicted concentrations below that of the subsequent target
concentration pair.

20
and controlled by STANPUMP software.§ Sevoflurane was administered in 2-10 L•min
-1
of oxygen by a tight fitting mask connected to a standard circle anesthesia circuit attached
to an anesthesia machine (Drager Medical, Inc., Telford, PA ).
2.3.4 Effect Measurements
Five minutes after achieving the targeted effect-site concentration (or stable end-
tidal concentration) for a primary drug “step,” a battery of pharmacodynamic assessments
were made. Effect measures included the Observer’s Assessment of Alertness/Sedation
score (OAA/S)18
and three surrogates for surgical stimulus- pressure algometry and
tetanic electrical stimulation, similar to those previously described by Kern, et al.,13
and
thermal stimulation. All stimuli were applied until reaching supra-maximal levels-50 mA,
50 PSI, and 50 °C for 5 seconds. The maximum intensity of the stimulation was
decreased from those utilized by Kern, et al.,13
because intensity levels of 60 mA and 60
PSI were found to be well above the supra-maximal stimulus intensity. Sedation was
measured first and then the experimental pain stimuli were measured in random order. In
terms of sedation, volunteers were considered nonresponsive if the OAA/S was ≤ 1 (loss
of response to “shake and shout,” Table 2.1). Once the volunteer became nonresponsive
(OAAS ≤ 1), direct laryngoscopy was performed with a Macintosh #3 blade to achieve a
Cormack Grade I view19
at each target concentration pair. The volunteer was considered
responsive to the noxious stimuli when the volunteer exhibited painful verbalization,
withdrawal movement, or an increase in heart rate of 20% over the prestimulus level.
With the exception of laryngoscopy, baseline measurements of the subject response to
§ Available from Steven L. Shafer, M.D., at http://anesthesia.stanford.edu/pkpd/. Posted
April 29, 1998. Accessed October 18, 2005.

21
Table 2.1: Observer’s Assessment of Alertness/Sedation Score (OAA/S)*
Responsiveness Score
Responds readily to name spoken in normal tone 5
Lethargic response to name spoken in normal tone 4
Responds only after name is called loudly and/or repeatedly 3
Responds only after mild prodding or shaking 2
Does not respond to mild prodding or shaking 1
Does not respond to noxious stimulus 0
1 For the purposed of this study, an OAA/S ≤ 1 was considered nonresponsive, whereas
an OAA/S ≥ 4 was considered “awake.”

22
each surrogate effect were made at the start of the study day in the absence of drugs. Two
kinds of data were recorded as surrogate measurements to surgical stimulus- the level of
tolerated stimulus (a continuous data variable) and a quantal response of whether the
volunteer could tolerate the maximal stimulus level (e.g., no withdrawal, no increase in
heart rate or blood pressure)20
. By convention, the maximum stimulation levels for the
surrogate pain measures were 5 seconds of 50 mA for tetanic electrical pain, 50 PSI for
pressure algometry, and 50 °C for thermal stimulation.
2.3.5 Data Analysis
Demographic data for the volunteers in each group were compared utilizing an
unpaired, two-sided t-test using StatView version 5.0.1 (SAS Institute, Inc., Cary, NC)
with P < 0.05 considered significant. All demographic data were reported as means with
standard deviations.
Data points that revealed a hyperalgesic response to a noxious stimulation at low
sevoflurane concentrations 21
were discarded in order to allow modeling of the drug
response as a monotonic function.
2.3.6 Response Surface Models
Response surface models were constructed for each pharmacodynamic response
using the Logit model as shown below: 22
)( 32101
1CrCsCrCs
eEffect
⋅⋅−⋅−⋅−+=
ββββ
where Cs and Cr are the concentration of sevoflurane (alveolar end-tidal concentration,
vol %) and remifentanil (effect site concentration, ng•mL-1
, as predicted by Stanpump
),

23
respectively, and ßi are the parameters describing the response surface. Additional details
of the Logit model are provided in Appendix A.
For each pharmacodynamic response, the data were combined and used to fit the
three-dimensional response surface using a naïve pooled technique. Model coefficients
and standard errors were estimated using MATLAB (MathWorks Inc., Natick, MA).
Models were built by an iterative process in which the log likelihood (LL) between the
observations and the model predictions was maximized. The contribution of each
coefficient was evaluated by excluding it from the model and determining whether the
model deteriorated significantly using the likelihood ratio test (∆ Likelihood Ratio ≥
30%). The standard error of the model parameters was estimated using the bootstrap
method for 5000 iterations.23
Model performance was evaluated by assessment of Error Prediction (observed vs.
predicted probability of effect for each dose combination) and the correlation coefficient.
The Error Prediction is defined as the following:
ObservededictedObservedXError ediction /Pr100Pr −=
The correlation coefficient of the regression parameter estimates was used to
evaluate how well the nonlinear regression models described the observed data. A large
value of the correlation coefficient (≥ 0.7) indicates that the responses predicted from the
surface described the observed data well.24
2.3.7 Determination of Synergy
Using the response surfaces for surrogate surgical stimuli and sedation, it is
possible to simulate two-dimensional concentration-effect relationship curves for
sevoflurane at a variety of remifentanil concentrations.9 Each of these curves represents

24
a vertical slice from the respective response surface. The synergistic effects of combining
remifentanil and sevoflurane in producing sedation and analgesia are demonstrated by
examining the change in the slope and the leftward shift of the sevoflurane concentration-
effect curves.
2.3.8 Combined Pharmacokinetic and Pharmacodynamic Simulations
The time to regaining responsiveness from a single drug anesthetic is determined
by the pharmacokinetics of the individual drug, the concentration-effect relationship, and
the duration of administration of the drug.2,25
For two-drug anesthetics, the time to
awakening is not only dependent on the individual drug pharmacokinetics and the
duration of the anesthetics, but also on the target concentrations achieved for each of the
drugs administered.8 To provide a clinically useful context for applying the response
surface models to everyday anesthesia practice, the pharmacodynamic response surface
models from this study were combined with pharmacokinetic models17,26
using computer
simulation as described by Vuyk, et al.,8 to identify target concentration pairs of
remifentanil and sevoflurane that provided a high probability of nonresponsiveness to
noxious stimulation and the most rapid emergence after cessation of anesthetic
administration. Additional details are provided in Appendix B.
The sevoflurane model described by Lerou, et al., 26
and the remifentanil model
reported by Minto, et al.,17
were utilized to simulate a range of alveolar concentrations
and effect site concentrations of the sevoflurane and remifentanil, respectively, that
produced a 95% probability of nonresponsiveness to the maximal tetanic stimulus of 50
mA, as determined by the response surface. Electrical tetanic stimulation is a surrogate
noxious stimulus that is thought to be similar to a skin incision.27
These alveolar and

25
effect site concentrations were maintained at these levels for one hour, after which time
the drugs were discontinued and the “washout” of the anesthetics was simulated. The
shortest time during the washout until the drug interaction model predicted a 95%
probability that OAA/S was ≥ 4 was found through iterative simulation utilizing a binary
search algorithm.28
The initial concentration pair was randomly picked from those target
concentration pairs located along the EC95 isobole for tetanic stimulation. After
calculating the recovery time (OAA/S ≥ 4) for this initial target concentration pair, a
fixed “step” of a 25% change in either the remifentanil concentration or the sevoflurane
concentration in a random direction along the isobole was made and the time to
awakening was calculated. If this time was higher than that of the previous concentration
pair, the next concentration pair was picked half-way between the previous point and this
point; otherwise, the next concentration pair was a picked to be the same size step change
in concentration away from the previous point. This step-wise search was continued until
a point was reached where recovery time was within 5% of the previously calculated
recovery time at the previous concentration pair. The combination of sevoflurane and
remifentanil that resulted in the quickest recovery (OAA/S ≥ 4) was determined for
anesthetics of 30-900 minutes in duration.
2.4 Results
All 16 volunteers completed the study. The demographics of the two groups are
shown in Table 2.2. There were no differences between the groups except that the
remifentanil group was predominately male volunteers, whereas the sevoflurane group
contained equal numbers of male and female volunteers.

26
Table 2.2: Demographics of Study Volunteers*
Group 1
Sevoflurane
Group 2
Remifentanil
Age [years] 25.0 ± 4.2 23.1 ± 2.7
Weight [kg] 70.8 ± 13.0 74.5 ± 9.3
Height [cm] 174.3 ± 9.0 177.8 ± 8.4
Sex [M:F] 4:4 7:1
1 All values are given as mean ± standard deviation, except for the ratio of males to
females.
27
2.4.1 Response Surface Models and Determination of Synergy
The parameters for all the response surface models were identifiable. The Logit
model parameters estimated through nonlinear regression are shown in Table 2.3. The
estimates of “goodness of fit” (e.g., Log Likelihood, Standard Errors, and Correlation
Coefficient) suggest that the models describe the data well. Based on the drug
concentrations required to achieve nonresponsiveness, thermal stimulation was the
mildest and tetanic stimulation was the most noxious stimulus. All of the simulated
concentration-effect relationship curves from the response surface models showed
synergy for both analgesia and sedation.
The response surface for sedation (OAA/S ≤ 1) of the unstimulated volunteers is
shown in Figure 2.2. The response surface for tetanic stimulation is shown in Figure 2.3.
The other pain stimuli surfaces (not shown) were of very similar shape. The raw data
used to create these surfaces are shaded based on the residual error between the measured
response and model prediction. Throughout most of the clinically relevant range of
concentrations (sevoflurane 0- 3 vol % and remifentanil 0- 7.5 ng•mL-1
) the residual error
is below 10%. The OAA/S score and the tolerance to electrical tetanic stimulation are
shown topographically in Figure 2.2b and Figure 2.3b, respectively. Figures 2.4a and
2.4b are two-dimensional concentration-response curves for sevoflurane at a variety of
remifentanil concentrations that are based on the response surfaces for surrogate surgical
stimuli and sedation. Each of these concentration-response curves was determined by
taking a vertical slice through the respective response surface (Figure 2.2a and 2.3a,
Table 2.4).

28
Table 2.3: Mean Model Parameters for the Logit Response Surface*
ß0 ß1 ß2 ß3 Log
Likelihood
Correlation
Coefficient
Pressure algometry 3.82 2.43 0.54 1.27 -78.90 0.78
Tetanic Stimulation 3.27 0.97 0.088 1.09 -84.06 0.72
Thermal stimulation 3.38 1.32 0.55 3.47 -103.99 0.73
Laryngoscopy 3.70 2.36 0.54 1.22 -82.48 0.78
OAA/S 7.30 7.84 0.23 3.94 - 24.12 0.89
* Model parameters are listed for all values. Standard errors for all parameters were <
0.01, as determined by the bootstrap method. OAA/S = Observer assessment of alertness
and sedation score.

29
Figure 2.2: The remifentanil-sevoflurane interaction for sedation. The Logit response
surface model prediction for sedation for unstimulated volunteers is presented in the top
panel (Figure 2.2a). An Observer’s Assessment of Alertness/Sedation (OAA/S) score ≤ 1
represents a sedated volunteer. A 0 indicates an OAA/S ≥ 2 and a 1 indicates an OAA/S ≤
1. The symbols show measured responses and the surface predicted by the model is
represented by the grid-lined surface. The raw data used to create this model is shaded
based on the residual error. A topographic view of the 50% and 95% effect isoboles for
probability of being sedated is presented in the bottom panel (Figure 2.2b). The OAA/S
score at each target concentration pair is overlaid.

30
Figure 2.2
a)
b)

31
Figure 2.3: The remifentanil-sevoflurane interaction for electrical tetanic stimulation.
The top panel (Figure 2.3a) shows the Logit response surface model prediction for tetanic
stimulation of 50 mA. A 0 indicates a response (movement or a 10% increase in blood
pressure or heart rate) to a 50 mA stimulus current and a 1 indicates no response to 50
mA stimulus current. The symbols show measured volunteer responses to 50 mA of
stimulus current and the surface predicted by the model is represented by the grid-lined
surface. The raw data used to create this model is shaded based on the residual error. The
bottom panel (Figure 2.3b) shows a topographic view of the 50% and 95% effect isoboles
for probability of tolerating a 50 mA stimulus current. The percentage of tolerated
stimulus current at each target concentration pair is overlaid.

32
Figure 2.3
a)
b)

33
Figure 2.4: The effect of adding remifentanil on the concentration-effect relationships of
sevoflurane for sedation (Figure 2.4a) and analgesia (Figure2.4b). Each curve represents
the concentration-effect relationship for sevoflurane with a fixed effect site concentration
of remifentanil simulated from the corresponding response surface model. The shift in the
curves toward the left indicates that much less sevoflurane is needed when remifentanil is
added, demonstrating the significant pharmacodynamic synergy between the sedative and
the opioid. Note that the magnitude of the leftward shift decreases as the remifentanil
concentration increases (i.e., there is a ceiling effect).

34
Figure 2.4
a)
b)

35
Table 2.4: Reduction in Sevoflurane Requirements by Remifentanil*
Remifentanil
Ce
[ng••••mL-1
]
Remifentanil
Infusion Rate
[mcg••••kg-1••••min
-1]
Sevoflurane
EC95% OAA/S ≤≤≤≤ 1
[vol %]
Sevoflurane
EC95% Tetanic
Stimulation
[vol %]
0 0 1.30 6.48
1.25 0.05 0.78 2.63
5 0.18 0.33 0.90
7.5 0.27 0.23 0.61
* The reduction in the alveolar concentration of sevoflurane that produces a 95%
probability (EC95%) of an OAA/S score ≤ 1 or no movement or hemodynamic response to
a 50 mA tetanic stimulation by the addition of remifentanil in doses ranging from 0-0.27
mcg•kg-1•min
-1 (Effect Site Concentration, Ce , 0-7.5 ng•mL
-1) are reported. All infusion
rates were calculated for a hypothetical 30 year old male who weighed 80 kg and was 183
cm tall utilizing Stanpump (http://anesthesia.stanford.edu/pkpd/).

36
2.4.2 Combined Pharmacokinetic and Pharmacodynamic Simulations
For shorter procedures the target concentration pairs that resulted in the most
rapid return to responsiveness approached the maximally synergistic combination-a
combination that lies on the point of the response surface where the surface curves
maximally towards the origin. (Figure 2.5a) At this combination, the plasma
concentrations of the drugs are both relatively low and therefore the plasma
concentrations of the drugs decline to sub-clinical levels quickly (Figure 2.5b). As the
duration of the anesthetic increases, the target concentration pairs with the shortest
recovery time must be adjusted to be weighted towards the drug with the shorter acting
kinetic profile, in this case remifentanil. By avoiding a large increase in the accumulation
of sevoflurane in the body, the kinetics of washout of these combinations would allow
rapid emergence from anesthesia. This trend plateaued at 0.75 vol % sevoflurane and 6.2
ng•mL-1
remifentanil (Figure 2.6, Table 2.5).
2.5 Discussion
In this study we utilized response surface models to characterize the
pharmacodynamic interactions between a potent volatile agent, sevoflurane, and a
synthetic opioid, remifentanil, across a wide range of concentration pairs. With these
pharmacodynamic models, we determined that the addition of remifentanil to sevoflurane
anesthesia not only synergistically decreases the response to painful stimulation but also
synergistically potentiates the sedative effects of the volatile anesthetic. Furthermore,
utilizing these pharmacodynamic models and previously described pharmacokinetic
models, 17,26
we performed simulations to identify the target concentration pairs of
remifentanil and sevoflurane that produced clinically adequate anesthesia (e.g., ≥ 95%

37
Figure 2.5: The results of computer simulations designed to identify optimal target
concentration pairs of remifentanil- and sevoflurane that minimize the time to
responsiveness. The top panel (Figure 2.5a) shows the predicted decline in effect site and
alveolar concentrations for remifentanil and sevoflurane after stopping drug
administration regimens targeted to reach the EC95 isobole for tetanic stimulation for one
hour. The EC95 isobole is on the “floor” of the cube; the vertical axis represents time
elapsed since stopping the administration of the drugs. The isobole representing a 95%
probability of the return of responsiveness (Observer’s Assessment of Alertness/Sedation
score ≥ 4) is shown by a dotted line that is superimposed on the concentration decay
curves. The highlighted curve is the sevoflurane and remifentanil target concentration
pair that resulted in the fastest return of responsiveness. The bottom panel (Figure 2.5b)
shows the time in minutes to the return of responsiveness after a 1 hour procedure in
which sevoflurane and remifentanil were administered to target concentration pairs on the
EC95 isobole for tetanic stimulation. The highlighted trace on the panel on the left is
shown topographically. The minimum time to regain responsiveness represents the target
concentration pairs for a 1 hour procedure.

38
Figure 2.5
a)
b)

39
Figure 2.6: The optimal combinations of remifentanil and sevoflurane to maintain
adequate anesthesia and promote rapid emergence. The combinations that produced the
quickest time to regain responsiveness (Observer’s Assessment of Alertness/Sedation
score ≥ 4) at various durations (in hrs) are shown. For example: In a 1 hour procedure
target concentrations of 1.05 vol % of sevoflurane and 4.3 ng•mL-1
of remifentanil result
in the fastest return of responsiveness. The simulations show that optimal combination
changes as a function of length of procedure. Although a target concentration pair with
higher remifentanil concentrations provides a faster recovery in longer cases,
remifentanil-sevoflurane mixtures in which sevoflurane is less than 0.75 vol % show no
significant advantage.

40
Table 2.5: Simulation Results for Anesthetics 30-900 Minutes in Length*
Length of
Anesthetic
[hr]
Shortest
Recovery Time
[min]
Remifentanil
Ce
[ng••••mL-1
]
Remifentanil
Infusion Rate
[mcg••••kg-1••••min
-1]
Sevoflurane
Alveolar
vol %
0.5 4.5 4.1 0.15 1.10
1 5.0 4.3 0.16 1.05
2 5.8 4.9 0.18 0.93
4 6.7 5.2 0.19 0.88
7 7.2 6.1 0.22 0.75
10 7.4 6.1 0.22 0.75
15 7.5 6.2 0.23 0.74
20 7.6 6.1 0.22 0.75
24 7.7 6.1 0.22 0.75
* The effect site concentration (Ce) and infusion rate for remifentanil and the alveolar end
tidal concentration of sevoflurane that produced the shortest recovery times are reported
for anesthetics lasting 0.5-24 hours. All simulations were performed for a hypothetical 30
year old male who weighed 80 kg and was 183 cm tall.

41
probability of no response to painful stimulation) while allowing the quickest time to
awakening (e.g., ≤ 5% probability of OAAS ≤ 4) for surgical procedures of increasing
duration.
These simulations demonstrated that there was a plateau in the utility of
remifentanil to decrease the amount of sevoflurane necessary to produce clinically
adequate anesthesia (sedation and nonresponsiveness to noxious stimulation).
2.5.1 Response Surface Models
Response surface methods have been utilized to model the interactions between a
variety of combinations of anesthetics, the most common being that of propofol and
remifentanil.8,13,14,29-31
Our results are similar to the findings with propofol and
remifentanil, in that our data demonstrate that the addition of remifentanil to sevoflurane
results in a synergistic effect for both analgesia and sedation. Our results do not agree
with the study by Dahan who found that alfentanil produced no synergistic effect on
sevoflurane induced sedation.32
Dahan used Bispectral Index rather than OAA/S to
measure sedation and used a relatively lower concentration of alfentanil. Our data
evaluated the contribution of higher levels of opioid effect (remifentanil) relative to the
alfentanil concentration range studied by these investigators. Furthermore, we
specifically evaluated the effects of combinations of sevoflurane and remifentanil on
clinical sedation, as measured by the OAA/S, as opposed to the surrogate marker of the
Bispectral Index. Perhaps the limitations of the Bispectral Index algorithm, specifically
its insensitivity to the effect of an opioid on sedation,33
may explain differences in our
results. Alternatively, the fact that we utilized the Logit model for our response surface
data whereas Dahan utilized the Minto response surface models, may have resulted in a

42
“forced fit” of our data to the relatively constrained model. However, the response
surface generally predicted the observed data extremely well (Figure 2.2a and 2.2b and
Table 2.3), and therefore is most likely not a “forced fit.”
Over the past few years, several investigators have utilized response surface
models to determine the interactions between propofol and remifentanil,8,11,13,30
propofol
and alfentanil,34,35
and sevoflurane and alfentanil.32
Each of these authors utilized a
single type of pharmacodynamic model to develop their response surface models. The
pharmacodynamic model described by Greco,12
and utilized by Kern,13
differs from the
pharmacodynamic model developed by Minto,15
and utilized by Dahan,32
in that it
requires the exponent of the response to be fixed, therefore limiting the flexibility of the
model to fit optimally the response data. However, the Greco form of this model provides
a specific parameter that examines the interaction between the two drugs. The models
proposed by Bouillon,11
Bol,30,36
and the Logit model also differ in their mathematical
complexity and physiologic plausibility. Choosing the right model to describe the data is
an empirical process in which the error statistics of each model are used to determine if
increasing the level of complexity allows a better fit of the measured response data.23
However, if a model that has many degrees of freedom is chosen, it is possible to fit a
surface to data from poorly designed trials or studies with inadequate response
sampling.15
For the analysis of our data, we chose the Logit model because it easily allowed
the analysis of data from volunteers with different baseline and maximal responses to the
surrogate pain stimuli and the clinical assessment of sedation. Given the diversity of
different response surfaces models published in the anesthesia literature, the fact that we

43
were able to characterize adequately our data set with the Logit model, which is a
moderately constrained model compared to those proposed by Greco,12
Minto14
or Bol,36
may indicate that the synergism observed by these surfaces is accurate. Minto, et al., have
proposed that there are several criteria necessary for an “Ideal Pharmacodynamic
Interaction Model.”14
The Logit model is able to predict additive, synergistic, and
antagonistic interactions. Simulations of the isoboles that result with changes in the Logit
model’s ß3 coefficient-the coefficient that controls the interaction between the two drugs-
produce isoboles consistent with those of Berenbaum37
(Figure 2.7). The response
surfaces derived from the Logit model were easily derived from a relatively small
number of volunteers from predicted effect-site remifentanil concentrations and measured
alveolar end-tidal sevoflurane concentrations covering the entire clinical range of
concentration pairs.
In addition, the response surface reduces to single drug concentration-response
curves that are similar to those that would be derived by single drug analysis 17,38
as
shown in Figures 2.4a and 2.4b. However, the mathematics of logarithms dictates that
when there is no drug present (i.e., sevoflurane-remifentanil target concentration pair of 0
vol % and 0 ng•mL-1
) there is still a slight effect (approximately 0.0007 probability of no
response). Therefore, the Logit model that we have chosen as the basis of our response
surface analysis meets all but one of the criteria proposed by Minto, et al.,15
albeit that the
predictions made when there are no drugs present is close to no drug effect.

44
Figure 2.7: The isoboles derived from simulated Logit model of the sedation response
surface (Observer’s Assessment of Alertness/Sedation score ≤ 1) to demonstrate additive,
synergistic, and antagonistic interactions, by only modifying the ß3 coefficient. In the
Logit model, the ß3 coefficient controls the interaction between the two drugs- ß3 = 0, ß3
> 0, and ß3 < 0, producing additive, synergistic, and antagonistic interactions. The dotted
line represents the isobole predicted by the Logit model when the drug interaction is
simply additive (ß3 = 0), while the solid line and the dotted line represent the predicted
isoboles when there is a synergistic (ß3 = 3.94) or antagonistic (ß3 = -0.22) drug
interaction.

45
2.5.2 Combined Pharmacokinetic and Pharmacodynamic Simulations
The simulations utilizing pharmacokinetic models and our pharmacodynamic
response surfaces to determine the combination of sevoflurane and remifentanil that
would produce the fastest return of responsiveness for anesthetics of varying durations
provided interesting insight into the role of pharmacokinetics and pharmacodynamics in
optimizing clinical anesthetics. As shown in Figure 2.5a, for a 1 hour duration anesthetic,
the “optimum” combination of sevoflurane and remifentanil is at the point in the center of
the “edge” of the plateau of maximum response-on the isobole that defines 95%
probability of not responding to electrical tetanic stimulation. As the duration of the
anesthetic increases, the optimal combinations shifted toward higher remifentanil
concentrations due to the rapid elimination of remifentanil.
Despite the synergistic interactions between remifentanil and sevoflurane in
providing analgesia and sedation, there was a discrete plateau in the sevoflurane-
remifentanil combinations for the longest of procedures (Figure 2.6). This plateau occurs
at a sevoflurane concentration of 0.75 vol % which correlates with an approximately
66% reduction in the Mean Alveolar Concentration (MAC) of sevoflurane (2.2 vol % for
adult males and females between the ages of 20-50 years).38
The 66% reduction in
sevoflurane requirements coincidentally is between the amount of reduction of MAC
(61%) and MACBAR (Blocks Autonomic Responses, 83%) expected when high doses of
opioids are combined with the modern, potent volatile anesthetics.3,7,38,39
Furthermore,
this value is similar to the MACAWAKE of sevoflurane (0.35 MAC, approximately 0.75
vol %),40
thereby demonstrating that these response-surface models may account for the
fact that opioids themselves cannot provide complete anesthesia.41-43
The major factor

46
preventing a further decrease in the sevoflurane requirement may be the limited reduction
of the MACAWAKE observed with opioids.44
That these sevoflurane-remifentanil response
surface pharmacodynamic models predict interactions that are consistent with clinical
practice further demonstrates that these response surfaces may be useful tools for
understanding anesthetic interactions in the clinical realm.45
2.5.3 Clinical Implications
These response surface models allow the creation of two-dimensional
concentration-effect curves that demonstrate an approximately 6-fold decrease in the
EC95 for sedation and an approximately 10-fold decrease in the EC95 for tolerance of
tetanic stimulation with the addition of 7.5 ng•mL-1
remifentanil (0.27 µg•kg-1•min
-1
infusion) to a sevoflurane anesthetic (Figure 2.4a and 2.4b and Table 2.4).
Based on the synergistic interaction between sevoflurane and remifentanil in
preventing a response to the surrogate surgical stimuli and in producing sedation, the
response surfaces from this study confirm the utility of administrating “balanced”
anesthetics with a combination of a volatile anesthetic and an opioid. The
pharmacokinetic-pharmacodynamic simulations illustrate the benefit of minimizing the
administered dose of even a low solubility volatile anesthetic to near 0.5 MAC in the
presence of remifentanil, an opioid with rapid elimination. This is especially true for
anesthetics with duration of over 5 hours. Whether this results in a pharmacoeconomic
advantage of combining a low dose of sevoflurane with a higher dose of remifentanil will
require prospective studies, because the pharmacoeconomic advantages of a drug are
certainly not limited to just minimizing the time until awakening or the drug acquisition
costs.46

47
2.5.4 Limitations
One of the limitations of our study design is that the response surface model for
sedation was determined in unstimulated volunteers. Because the level of stimulation can
change the depth of sedation, it is possible that our unstimulated volunteer response
surface analysis for sedation may not accurately predict the sedation response of patients
undergoing surgical procedures. In particular, the lack of an endotracheal tube in the
volunteers may have resulted in our measuring deeper levels of sedation than would be
apparent if the endotracheal tube was stimulating a patient or volunteer receiving the
same target concentration pairs of sevoflurane and remifentanil. However, the difficulty
in measuring the level of sedation during stimulation in a volunteer setting (e.g.,
confounding sedation score by stimulation response, etc.) prevented us from collecting
the data that would be needed to estimate a surface with continual stimulation.
A further limitation of our study design was that the surrogate pain stimuli used to
measure the analgesic response in volunteers is only a surrogate of intraoperative surgical
pain. By including a range of experimental pain stimuli to cover the range expected
during a surgical procedure, it is probable that the most stimulating intraoperative events-
surgical incision and laryngoscopy-have been recreated in the volunteer laboratory.
However, since key surgical stimuli can only be applied once (e.g., skin incision, etc.),
and since surgical patients cannot ethically be provided with subtherapeutic combinations
of anesthetics or serve as their own pharmacologic control, volunteer studies are essential
to allow the collection of the high resolution data needed to achieve the goal of mapping
the interaction surface between two agents over the entire concentration spectrum.
48
Another limitation in this study is that we used a pharmacokinetic model to
predict remifentanil effect site concentrations rather than drawing blood samples during
pseudo-steady state to measure remifentanil plasma concentrations. This limitation may
explain the variability found in the single drug dose-response data for remifentanil.47
Mertens, et al., determined that remifentanil can be delivered accurately by target
controlled infusions.48
However, they found that the most accurate and least biased
delivery was achieved when the pharmacokinetic set(s) determined by Egan, et al. 49-51
were utilized. Given the fact that the pharmacokinetic set utilized (by Minto, et al.17
) was
determined in a population very similar to that being studied here, the accuracy and bias
of the target controlled infusion should be at least as accurate as employing the
pharmacokinetic sets of Egan, et al.48
Although we had an unequal number of males and
females in our groups, it is unlikely that this accounted for the pharmacodynamic
variability given that sex has little influence on the pharmacokinetics or
pharmacodynamics of remifentanil17
or sevoflurane.52
Other sources of pharmacokinetic
variability (e.g., age, body weight, cardiac output, etc.) most likely did not contribute
much to the pharmacodynamic variability, given the similarities between groups in the
important covariates.
For the analgesic response measurements we were forced to both limit the
maximum stimulus applied and discard those responses that were below the respective
baseline values. We limited the maximum stimulus applied in order to prevent
irreversible tissue damage in the volunteers. In a previous investigation in our
laboratory,13
we found levels of the pressure, temperature, and electrical current that
could be tolerated without any evidence of long lasting damage. However, this approach

49
may result in censored data that can result in pharmacodynamic response curves that
predict potency lower than the true values. Therefore, extending the application of these
response surfaces beyond the range of concentrations examined by these response
surfaces may result in erroneous conclusions.
Just as difficult of a statistical problem is how to deal with those analgesic
responses that were below the baseline values. This hyperalgesic response has been
observed when low doses of volatile anesthetics are administered to animals and
humans.21
Unfortunately, the models utilized to construct response surfaces require a
monotonic function, and therefore are unable to characterize this phenomenon. Other
investigators often do not observe this hyperalgesic response because the step change in
inhaled anesthetic concentration is either so large that the hyperalgesic concentrations are
“jumped over” or the variability in the analgesic response measurement is so large that
this small hyperalgesic effect is unidentifiable.
The hyperalgesia associated with the presence of low concentrations of volatile
anesthetics21
is different from the hyperalgesia phenomenon occasionally observed after
the administration of remifentanil.53-55
The hyperalgesia observed by some investigators
after remifentanil administration is associated with a rightward shift in the subsequent
analgesic concentration-response curves. Although we did not design this study to
specifically address the presence or absence of remifentanil induced hyperalgesia, we did
not find any difference between the baseline levels of tolerated stimuli (e.g., prior to
remifentanil administration) and the levels of stimuli tolerated at the lowest level of
remifentanil with the first doses of sevoflurane (Study Period II, Remifentanil Group,
One-sided paired t-test, P > 0.05 for all three stimuli). This is consistent with the

50
observations of Lotsch and Angst where hyperalgesia to pressure and electrical
stimulation was not induced by remifentanil.55
The Logit model offered the advantage of being able to easily compensate for
data from volunteers with different baseline and maximal responses to the surrogate pain
stimuli and the clinical assessment of sedation. However, the mathematics of logarithms
dictates that when there is no drug present (i.e., sevoflurane-remifentanil target
concentration pair of 0 vol % and 0 ng•mL-1
) there is still a very slight effect
(approximately 0.0007 probability of no response). Furthermore, the Logit model
requires a dichotomous response-“response” vs. “no response” to a single stimulus
intensity. For the surrogates for surgical stimulus, this was the equivalent of having no
movement and no hemodynamic change when a volunteer received the maximum
possible intensity of the pain surrogate. However, the OAA/S is an ordinal scale that
consists of five different scores (Table 2.1). The Logit model mandated that we choose
which OAA/S scores defined patients who were “awake” and those who were “asleep.”
In order to represent the state most consistent with adequate sedation for surgery, the
response surface model for “general anesthesia” was based on an OAA/S ≤ 1 (“no
response to shake and shout”). On the other hand, to most accurately represent the
emergence from general anesthesia (i.e., suitable for extubation), we chose an OAA/S ≥ 4
(“responds to normal voice”) as the basis of the response surface for awakening from
anesthesia. Although this dichotomous view of general anesthesia is not reflected by the
OAA/S score, it is more consistent with “adequate” general anesthesia-for any given
stimulus at any given time point, anesthesia can be either considered adequate or not.20
The models described by Greco,12
Minto,14
and Bouillon11
would have avoided this
51
complexity because all of these models easily handled continuous response variables.
However, each of these alternative model architectures would have had difficulty
resolving the intersubject variability that naturally exists in the baseline and maximal
tolerated stimulus.
2.5.5 Future Work
Our response surface models for sevoflurane and remifentanil interactions were
developed in volunteers exposed to a variety of surrogate pain stimuli. These models will
need to be validated in a variety of surgical patients receiving these two drugs as the only
anesthetic agents. Further work will need to be done to determine if the surrogate pain
stimuli accurately predict the responses to different surgical stimuli (e.g., skin incision,
abdominal insufflation, placement of Mayfield head fixation, etc.). In addition, there are
conceivably 15 different sedative-opioid combinations that could be generated when one
considers the pharmacodynamic and pharmacokinetic differences between the clinically
available volatile anesthetics (desflurane, sevoflurane, and isoflurane) and commonly
utilized opioids (morphine, fentanyl, alfentanil, sufentanil, and remifentanil), not to
mention the alternative of a propofol based anesthetic. Response surface models of these
combinations would be necessary to develop a comprehensive library of models for use
in everyday anesthesia practice that would not constrain the clinician to a single pair of
anesthetics (i.e., sevoflurane and remifentanil only).
2.5.6 Conclusion
In summary, the sevoflurane-remifentanil response surfaces estimated in this
study demonstrate clear and profound synergism for both analgesia and sedation.
Furthermore, combined with pharmacokinetic models, the response surfaces provide the

52
scientific foundation to identify the “optimal” combinations of sevoflurane and
remifentanil required to produce the fastest return to alertness (OAA/S ≥ 4) after
anesthetics varying in duration from 30-900 minutes. The reduction in sevoflurane
requirements predicted by these simulations plateaus at a value (0.75 vol %, 0.34 MAC)
comparable to that of MACAWAKE (0.35 MAC) of sevoflurane and in the range of the
maximum reduction in MAC (61%) and MACBAR (85%) that results from co-
administration of high doses of remifentanil with sevoflurane, acting as indirect
validation of the response surfaces. These response surfaces may potentially be used to
clinical advantage, such as their incorporation into real-time, pharmacokinetic-
pharmacodynamic display systems.45,56
2.6 Appendix A: The Logit Model For Pharmacodynamics
The pharmacodynamic response to a single drug can be described by the logistic
regression model. In the logistic regression model, the natural logarithm of the odds ratio
of drug effect (the Logit) is described as a function of drug concentration (C):
CP
PoddsratioLogit ⋅+=
−== 10
1ln)ln( ββ (1)
where P is the probability of the desired effect, and ß0 and ß1 are estimated parameters.
The Logit model can be generalized to multiple drugs, using the linear function of
the concentrations of the two drugs sevoflurane (Cs) and remifentanil (Cr)22
:
rsrs CCCCP
PoddsratioLogit ⋅⋅+⋅+⋅+=
−== 3210
1ln)ln( ββββ (2)
where P is the probability of the desired effect, and ß0, ß1, ß2, ß3 are estimated
coefficients of the linear function.

53
Rearranging equation (2) to solve for the probability of effect, P, results in
equation (3):
)( 32101
1CrCsCrCs
eP
⋅⋅−⋅−⋅−+=
ββββ (3)
Equation (3) can be rearranged to compute the 50% (equation (4a)) and 95%
(equation (4b)) probability isoboles for sevoflurane:
Cr
CrEC S
⋅+
⋅−=
31
20,50
ββ
ββ (4a)
Cr
Cr
EC S⋅+
⋅−+−=
31
20
,95
)195.0
1ln(
ββ
ββ (4b)
The Logit model reduces to a simpler form that allows calculation of the
concentration-effect relationship for sevoflurane or remifentanil when administered
alone. By substituting into equation (3) a value of 0 for remifentanil or sevoflurane,
respectively, the concentration of each drug needed to produce 50% probability of effect
(EC50) when each of the drugs is used individually, can be calculated by equations (5a)
and (5b).
1
0,50
β
β=SEC
(5a)
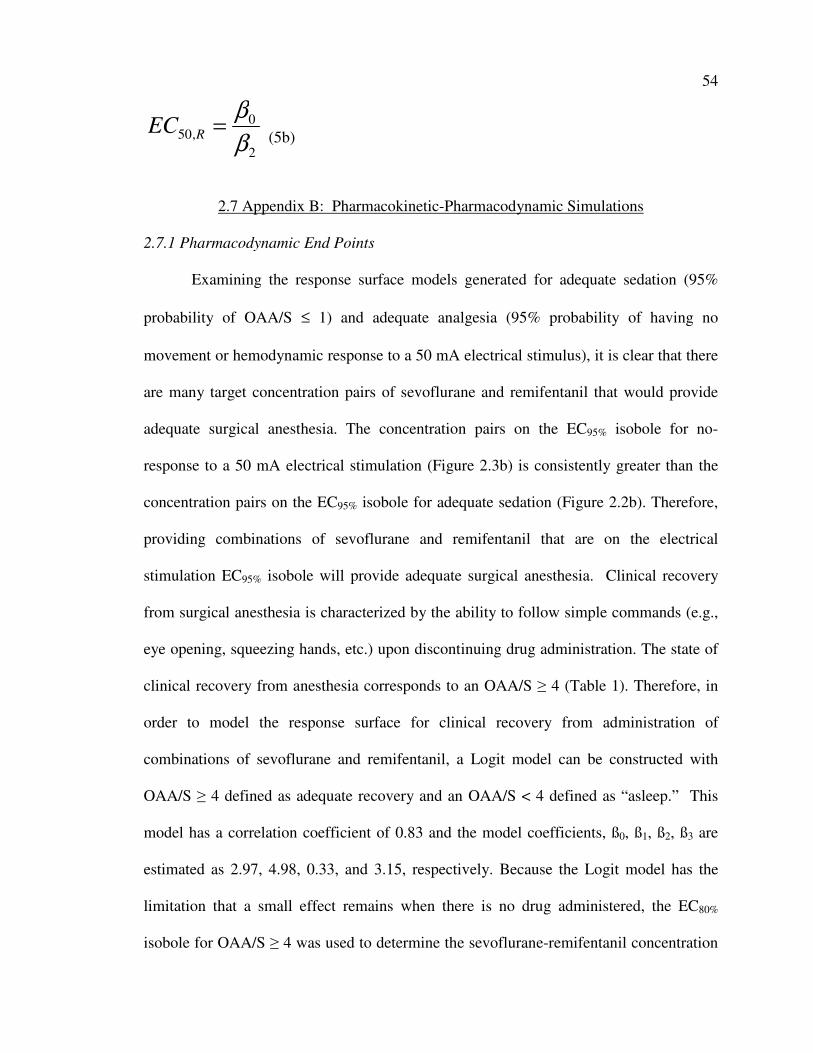
54
2
0,50
β
β=REC
(5b)
2.7 Appendix B: Pharmacokinetic-Pharmacodynamic Simulations
2.7.1 Pharmacodynamic End Points
Examining the response surface models generated for adequate sedation (95%
probability of OAA/S ≤ 1) and adequate analgesia (95% probability of having no
movement or hemodynamic response to a 50 mA electrical stimulus), it is clear that there
are many target concentration pairs of sevoflurane and remifentanil that would provide
adequate surgical anesthesia. The concentration pairs on the EC95% isobole for no-
response to a 50 mA electrical stimulation (Figure 2.3b) is consistently greater than the
concentration pairs on the EC95% isobole for adequate sedation (Figure 2.2b). Therefore,
providing combinations of sevoflurane and remifentanil that are on the electrical
stimulation EC95% isobole will provide adequate surgical anesthesia. Clinical recovery
from surgical anesthesia is characterized by the ability to follow simple commands (e.g.,
eye opening, squeezing hands, etc.) upon discontinuing drug administration. The state of
clinical recovery from anesthesia corresponds to an OAA/S ≥ 4 (Table 1). Therefore, in
order to model the response surface for clinical recovery from administration of
combinations of sevoflurane and remifentanil, a Logit model can be constructed with
OAA/S ≥ 4 defined as adequate recovery and an OAA/S < 4 defined as “asleep.” This
model has a correlation coefficient of 0.83 and the model coefficients, ß0, ß1, ß2, ß3 are
estimated as 2.97, 4.98, 0.33, and 3.15, respectively. Because the Logit model has the
limitation that a small effect remains when there is no drug administered, the EC80%
isobole for OAA/S ≥ 4 was used to determine the sevoflurane-remifentanil concentration

55
pairs that resulted in “clinical recovery” after discontinuing administration of sevoflurane
and remifentanil.
2.7.2 Pharmacokinetic Models
As detailed above, the time until “clinical recovery” after the discontinuation of
the administration of sevoflurane and remifentanil can be defined as the time that it takes
for the sevoflurane and remifentanil concentrations to reach a combination on the EC80%
isobole for OAA/S ≥ 4. In order to simulate the elimination of sevoflurane and
remifentanil, it is necessary to know the concentrations in all of the pharmacokinetic
compartments prior to the cessation of drug administration. Administration and
elimination of sevoflurane was simulated utilizing the 14 compartment physiologic model
described by Lerou, et al., 26
with the volumes and blood flows reported by Lowe and
Ernst,57
and partition coefficients reported by Kennedy, et al.58
Simulation of the
administration of propofol required the use of the target controlled infusion algorithm
described by Van Puocke, et al.,59
employing the remifentanil pharmacokinetic model
described by Minto, et al.,17
to maintain a remifentanil effect site concentration on the
EC95% isobole for no-response to 50 mA electrical stimulus.
2.7.3 Determination of the Shortest Time to Awakening
The EC95% isobole for no-response to a 50 mA electrical stimulus provides a
large number of concentration pairs of sevoflurane and remifentanil. An initial
concentration pair was randomly picked from those concentration pairs located on the
EC95% isobole for tetanic stimulation. The alveolar concentration of sevoflurane and the
effect site concentration of remifentanil were maintained constant for the predetermined
duration (30-900 minutes). For example, to simulate the administration of 1.05 vol %
56
sevoflurane and 4.53 ng•ml-1
of remifentanil, the uptake and distribution of sevoflurane
throughout the body was simulated to maintain an alveolar concentration of 1.05% and
the uptake and distribution of remifentanil was simulated for utilizing the target
controlled infusion algorithm to maintain a constant value of 4.53 ng•ml-1
at the effect
site. At the end of the predetermined length of drug administration, the decay of the effect
site concentration of remifentanil and alveolar concentration of sevoflurane were
observed. The time at which these combinations fell below levels on the EC80% isobole
for OAA/S ≥ 4 were noted. For this example, the recovery time was 5 minutes (see
Figure 2.5b). This procedure was repeated with a binary search algorithm to determine
the combination of sevoflurane and remifentanil that started on the EC95% isobole for
tetanic stimulation and had the fastest recovery time for the predetermined duration of
drug administration. Using the same methods the ratio that had the fastest recovery time
was determined for each procedure length (0.5, 1, 2, 4, 7, 10, 15, 20 and 24 hrs).
2.8 References
1. Zbinden AM, Petersen-Felix S, Thomson DA: Anesthetic depth defined
using multiple noxious stimuli during isoflurane/oxygen anesthesia. II. Hemodynamic
responses. Anesthesiology 1994; 80: 261-7
2. Eger EI, 2nd, Shafer SL: Tutorial: context-sensitive decrement times for
inhaled anesthetics. Anesth Analg 2005; 101: 688-96
3. Katoh T, Kobayashi S, Suzuki A, Iwamoto T, Bito H, Ikeda K: The effect
of fentanyl on sevoflurane requirements for somatic and sympathetic responses to
surgical incision. Anesthesiology 1999; 90: 398-405
4. Kazama T, Ikeda K, Morita K: Reduction by fentanyl of the Cp50 values
of propofol and hemodynamic responses to various noxious stimuli. Anesthesiology
1997; 87: 213-27

57
5. Smith C, McEwan AI, Jhaveri R, Wilkinson M, Goodman D, Smith LR,
Canada AT, Glass PS: The interaction of fentanyl on the Cp50 of propofol for loss of
consciousness and skin incision. Anesthesiology 1994; 81: 820-8; discussion 26A
6. Vuyk J, Lim T, Engbers FH, Burm AG, Vletter AA, Bovill JG:
Pharmacodynamics of alfentanil as a supplement to propofol or nitrous oxide for lower
abdominal surgery in female patients. Anesthesiology 1993; 78: 1036-45; discussion 23A
7. Hall RI, Szlam F, Hug CC, Jr.: The enflurane-sparing effect of alfentanil
in dogs. Anesth Analg 1987; 66: 1287-91
8. Vuyk J, Mertens MJ, Olofsen E, Burm AG, Bovill JG: Propofol anesthesia
and rational opioid selection: determination of optimal EC50-EC95 propofol-opioid
concentrations that assure adequate anesthesia and a rapid return of consciousness.
Anesthesiology 1997; 87: 1549-62
9. Vuyk J, Lim T, Engbers FH, Burm AG, Vletter AA, Bovill JG: The
pharmacodynamic interaction of propofol and alfentanil during lower abdominal surgery
in women. Anesthesiology 1995; 83: 8-22
10. Glass PS, Gan TJ, Howell S, Ginsberg B: Drug interactions: volatile
anesthetics and opioids. J Clin Anesth 1997; 9: 18S-22S
11. Bouillon TW, Bruhn J, Radulescu L, Andresen C, Shafer TJ, Cohane C,
Shafer SL: Pharmacodynamic interaction between propofol and remifentanil regarding
hypnosis, tolerance of laryngoscopy, bispectral index, and electroencephalographic
approximate entropy. Anesthesiology 2004; 100: 1353-72
12. Greco WR, Bravo G, Parsons JC: The search for synergy: a critical review
from a response surface perspective. Pharmacol Rev 1995; 47: 331-85
13. Kern SE, Xie G, White JL, Egan TD: A response surface analysis of
propofol-remifentanil pharmacodynamic interaction in volunteers. Anesthesiology 2004;
100: 1373-81
14. Minto C, Vuyk J: Response surface modelling of drug interactions. Adv
Exp Med Biol 2003; 523: 35-43
15. Minto CF, Schnider TW, Short TG, Gregg KM, Gentilini A, Shafer SL:
Response surface model for anesthetic drug interactions. Anesthesiology 2000; 92: 1603-
16
16. Short TG, Ho TY, Minto CF, Schnider TW, Shafer SL: Efficient trial
design for eliciting a pharmacokinetic-pharmacodynamic model-based response surface
describing the interaction between two intravenous anesthetic drugs. Anesthesiology
2002; 96: 400-8

58
17. Minto CF, Schnider TW, Egan TD, Youngs E, Lemmens HJ, Gambus PL,
Billard V, Hoke JF, Moore KH, Hermann DJ, Muir KT, Mandema JW, Shafer SL:
Influence of age and gender on the pharmacokinetics and pharmacodynamics of
remifentanil. I. Model development. Anesthesiology 1997; 86: 10-23
18. Chernik DA, Gillings D, Laine H, Hendler J, Silver JM, Davidson AB,
Schwam EM, Siegel JL: Validity and reliability of the Observer's Assessment of
Alertness/Sedation Scale: study with intravenous midazolam. J Clin Psychopharmacol
1990; 10: 244-51
19. Cormack RS, Lehane J: Difficult tracheal intubation in obstetrics.
Anaesthesia 1984; 39: 1105-11
20. Prys-Roberts C: Anaesthesia: a practical or impractical construct? Br J
Anaesth 1987; 59: 1341-5
21. Zhang Y, Eger EI, 2nd, Dutton RC, Sonner JM: Inhaled anesthetics have
hyperalgesic effects at 0.1 minimum alveolar anesthetic concentration. Anesth Analg
2000; 91: 462-6
22. Egan TD, Minto C: Common Pharmacodynamic Drug Interactions in
Anesthetic Practice, Anesthetic Pharmacology: Physiologic Principles & Clinical
Practice. Edited by Evers AX, Maze M. London, Churchill Livingstone, 2004, pp 94-97
23. Jacquez JA, Perry T: Parameter estimation: local identifiability of
parameters. Am J Physiol 1990; 258: E727-36
24. Glantz SA, Slinker KK: Primer of Applied Regression and Analysis of
Variance, 2 Edition. New York, McGraw-Hill, Inc., 2001, pp 118-119
25. Shafer SL, Varvel JR: Pharmacokinetics, pharmacodynamics, and rational
opioid selection. Anesthesiology 1991; 74: 53-63
26. Lerou JG, Booij LH: Model-based administration of inhalation
anaesthesia. 1. Developing a system model. Br J Anaesth 2001; 86: 12-28
27. Zbinden AM, Maggiorini M, Petersen-Felix S, Lauber R, Thomson DA,
Minder CE: Anesthetic depth defined using multiple noxious stimuli during
isoflurane/oxygen anesthesia. I. Motor reactions. Anesthesiology 1994; 80: 253-60
28. Knuth D: Sorting and Searching, The Art of Computer Programming, 3
Edition. Reading, Massachusetts, Addison-Wesley, 1997, pp 409-426
29. Short TG, Plummer JL, Chui PT: Hypnotic and anaesthetic interactions
between midazolam, propofol and alfentanil. Br J Anaesth 1992; 69: 162-7
59
30. Mertens MJ, Olofsen E, Engbers FH, Burm AG, Bovill JG, Vuyk J:
Propofol reduces perioperative remifentanil requirements in a synergistic manner:
response surface modeling of perioperative remifentanil-propofol interactions.
Anesthesiology 2003; 99: 347-59
31. Nieuwenhuijs DJ, Olofsen E, Romberg RR, Sarton E, Ward D, Engbers F,
Vuyk J, Mooren R, Teppema LJ, Dahan A: Response surface modeling of remifentanil-
propofol interaction on cardiorespiratory control and bispectral index. Anesthesiology
2003; 98: 312-22
32. Dahan A, Nieuwenhuijs D, Olofsen E, Sarton E, Romberg R, Teppema L:
Response surface modeling of alfentanil-sevoflurane interaction on cardiorespiratory
control and bispectral index. Anesthesiology 2001; 94: 982-91
33. Lysakowski C, Dumont L, Pellegrini M, Clergue F, Tassonyi E: Effects of
fentanyl, alfentanil, remifentanil and sufentanil on loss of consciousness and bispectral
index during propofol induction of anaesthesia. Br J Anaesth 2001; 86: 523-7
34. Vuyk J, Hennis PJ, Burm AG, de Voogt JW, Spierdijk J: Comparison of
midazolam and propofol in combination with alfentanil for total intravenous anesthesia.
Anesth Analg 1990; 71: 645-50
35. Mertens MJ, Olofsen E, Burm AG, Bovill JG, Vuyk J: Mixed-effects
modeling of the influence of alfentanil on propofol pharmacokinetics. Anesthesiology
2004; 100: 795-805
36. Bol CJ, Vogelaar JP, Tang JP, Mandema JW: Quantification of
pharmacodynamic interactions between dexmedetomidine and midazolam in the rat. J
Pharmacol Exp Ther 2000; 294: 347-55
37. Berenbaum MC: What is synergy? Pharmacol Rev 1989; 41: 93-141
38. Katoh T, Ikeda K: The minimum alveolar concentration (MAC) of
sevoflurane in humans. Anesthesiology 1987; 66: 301-3
39. Hall RI, Murphy MR, Hug CC, Jr.: The enflurane sparing effect of
sufentanil in dogs. Anesthesiology 1987; 67: 518-25
40. Katoh T, Suguro Y, Ikeda T, Kazama T, Ikeda K: Influence of age on
awakening concentrations of sevoflurane and isoflurane. Anesth Analg 1993; 76: 348-52
41. Hug CC, Jr.: Does opioid "anesthesia" exist? Anesthesiology 1990; 73: 1-
4
42. Philbin DM, Rosow CE, Schneider RC, Koski G, D'Ambra MN: Fentanyl
and sufentanil anesthesia revisited: how much is enough? Anesthesiology 1990; 73: 5-11

60
43. Wong KC: Narcotics are not expected to produce unconsciousness and
amnesia. Anesth Analg 1983; 62: 625-6
44. Katoh T, Ikeda K: The effects of fentanyl on sevoflurane requirements for
loss of consciousness and skin incision. Anesthesiology 1998; 88: 18-24
45. Syroid ND, Agutter J, Drews FA, Westenskow DR, Albert RW, Bermudez
JC, Strayer DL, Prenzel H, Loeb RG, Weinger MB: Development and evaluation of a
graphical anesthesia drug display. Anesthesiology 2002; 96: 565-75
46. Miller DR, Tierney M: Observational studies and "real world" anesthesia
pharmacoeconomics/Les etudes par observation et la realite pharmacoeconomique de
l'anesthesie. Can J Anesth 2002; 49: 329-334
47. Avram MJ, Krejcie TC: Using front-end kinetics to optimize target-
controlled drug infusions. Anesthesiology 2003; 99: 1078-86
48. Mertens MJ, Engbers FH, Burm AG, Vuyk J: Predictive performance of
computer-controlled infusion of remifentanil during propofol/remifentanil anaesthesia. Br
J Anaesth 2003; 90: 132-41
49. Egan TD, Huizinga B, Gupta SK, Jaarsma RL, Sperry RJ, Yee JB, Muir
KT: Remifentanil pharmacokinetics in obese versus lean patients. Anesthesiology 1998;
89: 562-73
50. Egan TD, Lemmens HJ, Fiset P, Hermann DJ, Muir KT, Stanski DR,
Shafer SL: The pharmacokinetics of the new short-acting opioid remifentanil (GI87084B)
in healthy adult male volunteers. Anesthesiology 1993; 79: 881-92
51. Egan TD, Minto CF, Hermann DJ, Barr J, Muir KT, Shafer SL:
Remifentanil versus alfentanil: comparative pharmacokinetics and pharmacodynamics in
healthy adult male volunteers. Anesthesiology 1996; 84: 821-33
52. Eger EI, 2nd, Laster MJ, Gregory GA, Katoh T, Sonner JM: Women
appear to have the same minimum alveolar concentration as men: a retrospective study.
Anesthesiology 2003; 99: 1059-61
53. Angst MS, Koppert W, Pahl I, Clark DJ, Schmelz M: Short-term infusion
of the mu-opioid agonist remifentanil in humans causes hyperalgesia during withdrawal.
Pain 2003; 106: 49-57
54. Guignard B, Bossard AE, Coste C, Sessler DI, Lebrault C, Alfonsi P,
Fletcher D, Chauvin M: Acute opioid tolerance: intraoperative remifentanil increases
postoperative pain and morphine requirement. Anesthesiology 2000; 93: 409-17

61
55. Lotsch J, Angst MS: The mu-opioid agonist remifentanil attenuates
hyperalgesia evoked by blunt and punctuated stimuli with different potency: a
pharmacological evaluation of the freeze lesion in humans. Pain 2003; 102: 151-61
56. Schumacher PM, Bouillon TW, Leibundgut D, Sartori V, Zbinden AM:
Anesthesia Advisory Display (AAD): Real Time Guidance through the Pharmacokinetic
and Interaction Pharmacodynamic Relationship during Simultaneous Administration of
Multiple Drugs. Anesthesiology 2004; 101: A504
57. Lowe HJ, Ernst EA: The Quantitative Practice of Anesthesia-- Use of
Closed Circuit. Baltimore, Williams & Wilkens, 1981, pp 118-119
58. Kennedy RR, French RA, Spencer C: Predictive accuracy of a model of
volatile anesthetic uptake. Anesth Analg 2002; 95: 1616-21, table of contents
59. Van Poucke GE, Bravo LJ, Shafer SL: Target controlled infusions:
targeting the effect site while limiting peak plasma concentration. IEEE Trans Biomed
Eng 2004; 51: 1869-75
CHAPTER 3
CONTEXT SENSITIVE TARGETS FOR OPIOIDS AND
INTRAVENOUS ANESTHETICS §
3.1 Abstract
3.1.1 Background
Anesthesia is most often achieved by a combination of a hypnotic and an opioid.
Utilizing pharmacokinetic models and pharmacodynamic response surface models, it
should be possible to determine the combination of propofol and remifentanil that would
result in the shortest time to awakening for anesthetics with different durations.
3.1.2 Methods
Response surface models that described the interaction between propofol and
remifentanil in providing adequate sedation and surgical analgesia generated from
volunteer data. Pharmacokinetic models were used to simulate dosing regimens that
maintained constant effect site target concentration pairs on the 95% isobole for adequate
anesthesia and the opioid/sedative mixture that yielded the fastest recovery (Observer’s
Alertness and Assessment Scale, OAA/S 4) from anesthetics with durations varying from
§ Submitted for review in Anesthesiology, June 2006. Original article titled: “Does the
ideal combination of remifentanil and propfol change with the duration of surgery?” The
text of Chapter 3 of this dissertation is primarily authored by Dhanesh K. Gupta M.D.,
Assistant Professor, Department of Anesthesiology, University of Utah. Sandeep C
Manyam conducted research, performed data analysis, and generated figures and tables
that form the basis of this manuscript.
63
0.5 to 24 hours were calculated.
3.1.3 Results
Logit response surface models were able to characterize all the pharmacodynamic
endpoints well. The pharmacokinetic-pharmacodynamic simulations revealed that as the
length of the procedure increased, faster recovery was produced by mixtures containing
higher amounts of remifentanil. This trend plateaued for anesthetics lasting two or more
hours at effect site concentrations of 1 µg•mL-1
propofol and 15 ng•mL-1
remifentanil.
3.1.4 Conclusions
For longer duration anesthetics, the pharmacokinetic advantage of remifentanil
becomes more apparent. Therefore, it appears that the optimal target concentration pairs
of propofol-remifentanil anesthetics only changes during the first two hours of anesthesia,
before the optimal concentration pairs plateau at their final values.
3.1.5 Acknowledgements
Supported in part by a research grant from Alaris Medical Systems, Inc., San
Diego, CA, (TDE) and by the National Institute of Biomedical Imaging and
Bioengineering of the National Institutes of Health 8 RO1 EB00294 (SCM and DRW).
Portions of this work have been presented at the 79th
Annual Clinical and
Scientific Congress of the International Anesthesia Research Society in Honolulu, HI,
March 15, 2005, (Poster S-405) and the 80th
Annual Clinical and Scientific Congress of
the International Society of Anesthesia Research in San Francisco, CA, March 27, 2006.

64
3.2 Introduction
The time until a patient regains responsiveness from a single drug anesthetic is
determined by the pharmacokinetics of the individual drug, the concentration-effect
relationship, and the duration of administration of the drug.1,2
For two-drug anesthetics,
the time to awakening is not only dependent on the individual drug pharmacokinetics and
the duration of administration of the anesthetics, but it is also dependent on the target
concentrations achieved for each of the drugs administered.3 Attempting to run a “lean”
anesthetic can result in an increased chance of intraoperative awareness,4 while
attempting to run a “deep” anesthetic can result in intraoperative hemodynamic
instability5 and possibly even an increase in one year mortality.
6 To provide a clinically
useful context for applying the response surface models to everyday anesthesia practice,
pharmacodynamic response surface models can be combined with pharmacokinetic
models7,8
using computer simulation as described by Vuyk, et al.,3 to identify target
concentration pairs of the sedative/hypnotic and the opioid that provide a high probability
of clinical sedation and nonresponsiveness to noxious stimulation and the most rapid
emergence after cessation of anesthetic administration.9
Several authors have developed response surface pharmacologic interaction
models of the prototypic intravenous sedative/hypnotic, propofol and the prototypic
synthetic opioid, remifentanil.10-12
However, only the work by Mertens, et al.,10
applied
these models to predict possible optimum target concentration pairs of propofol and
remifentanil that would result in the fastest return of consciousness. Surprisingly,
simulations based on these response surface models, and those based of isobologram data
extrapolated form propofol-alfentanil interaction data3 have both determined that with

65
increasing duration of anesthesia there was no change in the “optimal” propofol-
remifentanil target concentrations. This is in direct contrast to what would be predicted
based on the complex pharmacokinetics of propofol and remifentanil2 and the synergistic
interactions that occur for a variety of pharmacologic end points.3,11-14
In addition,
increasing the duration of anesthesia changes the “optimal” sevoflurane-remifentanil
target concentration pairs to contain higher concentrations of remifentanil. 9
The aim of this study was to utilize previously collected pharmacodynamic data
and apply the generated propofol-remifentanil response surface models to determine if
the “optimal” propofol-remifentanil concentrations changes as the anesthetic duration
increased. We hypothesized that by combining Logit response surface models developed
from volunteer data with published pharmacokinetic models, we could predict the target
concentrations of propofol and remifentanil that resulted in the fastest time to awakening
from anesthesia. We also hypothesized that the pharmacokinetic advantages of
remifentanil over propofol would result in higher remifentanil concentrations being
targeted as the duration of the anesthetic increased-the “optimal” propofol-remifentanil
concentration would increase as the duration of anesthesia increased.
3.3 Materials and Methods
Data from 32 of the 40 subjects included in this manuscript were acquired from
the datasets reported in two manuscripts from our laboratory that examined the
synergistic interaction between sedative/hypnotics and remifentanil in producing clinical
sedation and analgesia to experimental painful stimuli that are surrogates for
intraoperative painful stimuli.9,11
The data from all 24 subjects reported by Kern, et al.,11
were included in the current analyses, while only the data acquired from the eight

66
subjects who received remifentanil alone during the initial phase of the study reported by
Manyam, et al.,9 were included in the current analyses. The data from an additional eight
subjects who received propofol as the initial anesthetic drug followed by two fixed doses
of remifentanil were included in these analyses; these subjects were collected as part of
the volunteer study conducted by Manyam, et al.,9 but have not been reported elsewhere.
A written informed consent document that was approved by the Human
Institutional Review Board at the University of Utah Health Sciences Center (Salt Lake
City, Utah) was obtained from each of 40 volunteers in this open-label, randomized,
parallel group crisscross designed study to asses drug interactions (Figure 3.1).15
Each
volunteer was randomized to receive a target controlled infusion of propofol (predicted
effect site concentrations of 0.5 -12 µg•mL-1
) or remifentanil (predicted effect site
concentrations of 0.5 -80 ng•mL-1
) as the primary agent with the other drug acting as the
secondary agent (Figure 3.1). The reader is referred to the previous manuscripts by Kern,
et al.,11
and Manyam, et al.,9 for complete details regarding the methods of volunteer
preparation, drug administration, data collection, and data analysis). Only those portions
of the data analysis that have substantial differences from the previous manuscripts are
provided in detail below.
All of the effect measurements utilized by Manyam, et al.,9 had maximum
intensities that were decreased from those utilized by Kern, et al.,11
because intensity
levels of 60 mA and 60 PSI were found to be well above the supra-maximal stimulus
intensity. To adjust for the different supra-maximal stimulus levels applied between the
two studies as well as the intersubject variation in baseline tolerance of noxious
stimulation, the level of stimulus tolerated was normalized against each volunteer’s
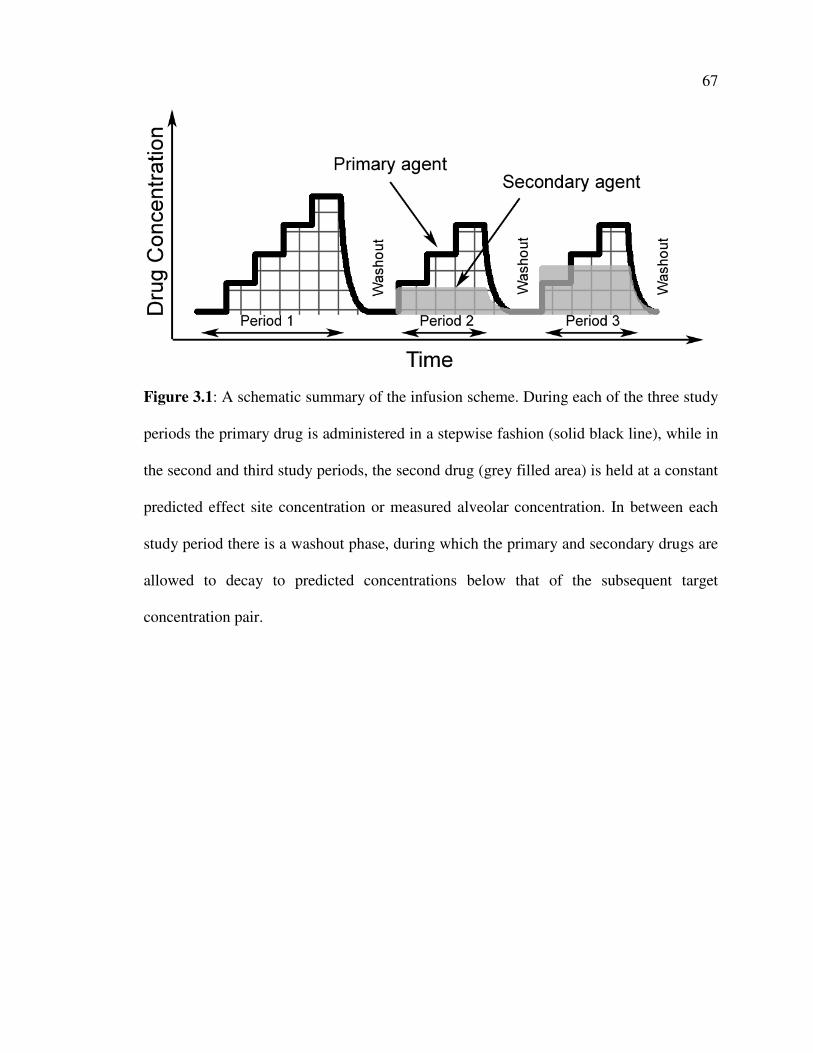
67
Figure 3.1: A schematic summary of the infusion scheme. During each of the three study
periods the primary drug is administered in a stepwise fashion (solid black line), while in
the second and third study periods, the second drug (grey filled area) is held at a constant
predicted effect site concentration or measured alveolar concentration. In between each
study period there is a washout phase, during which the primary and secondary drugs are
allowed to decay to predicted concentrations below that of the subsequent target
concentration pair.
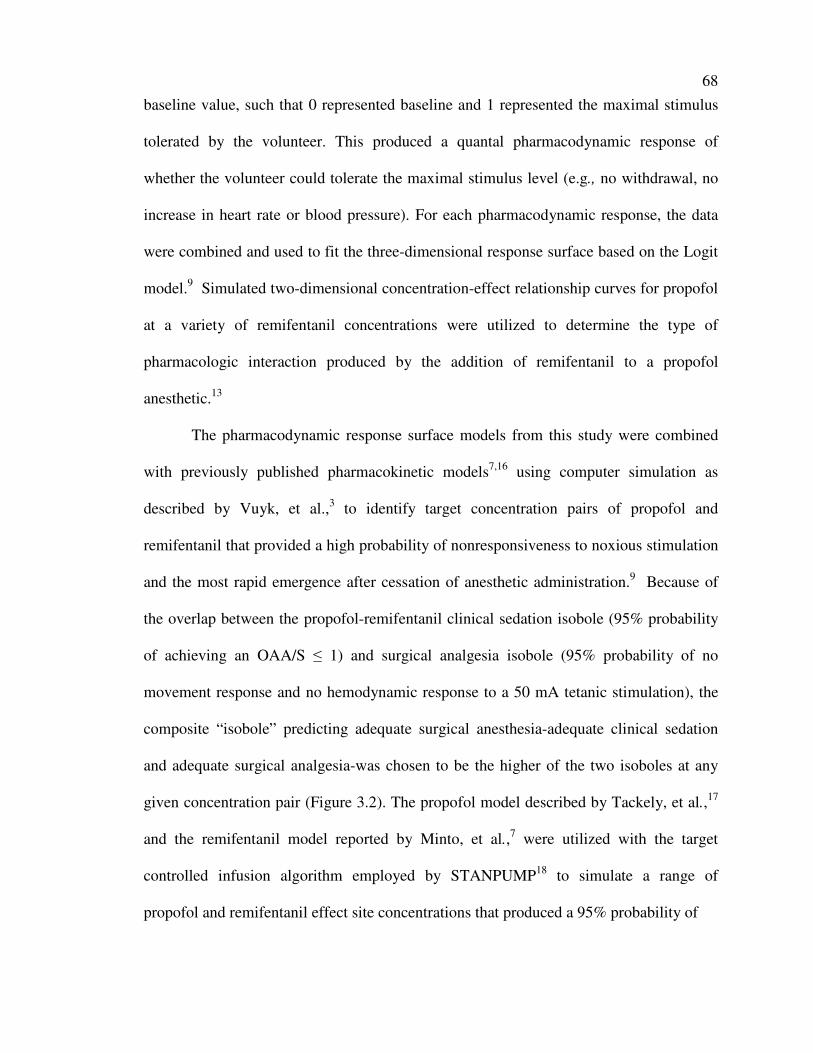
68
baseline value, such that 0 represented baseline and 1 represented the maximal stimulus
tolerated by the volunteer. This produced a quantal pharmacodynamic response of
whether the volunteer could tolerate the maximal stimulus level (e.g., no withdrawal, no
increase in heart rate or blood pressure). For each pharmacodynamic response, the data
were combined and used to fit the three-dimensional response surface based on the Logit
model.9 Simulated two-dimensional concentration-effect relationship curves for propofol
at a variety of remifentanil concentrations were utilized to determine the type of
pharmacologic interaction produced by the addition of remifentanil to a propofol
anesthetic.13
The pharmacodynamic response surface models from this study were combined
with previously published pharmacokinetic models7,16
using computer simulation as
described by Vuyk, et al.,3 to identify target concentration pairs of propofol and
remifentanil that provided a high probability of nonresponsiveness to noxious stimulation
and the most rapid emergence after cessation of anesthetic administration.9 Because of
the overlap between the propofol-remifentanil clinical sedation isobole (95% probability
of achieving an OAA/S ≤ 1) and surgical analgesia isobole (95% probability of no
movement response and no hemodynamic response to a 50 mA tetanic stimulation), the
composite “isobole” predicting adequate surgical anesthesia-adequate clinical sedation
and adequate surgical analgesia-was chosen to be the higher of the two isoboles at any
given concentration pair (Figure 3.2). The propofol model described by Tackely, et al.,17
and the remifentanil model reported by Minto, et al.,7 were utilized with the target
controlled infusion algorithm employed by STANPUMP18
to simulate a range of
propofol and remifentanil effect site concentrations that produced a 95% probability of
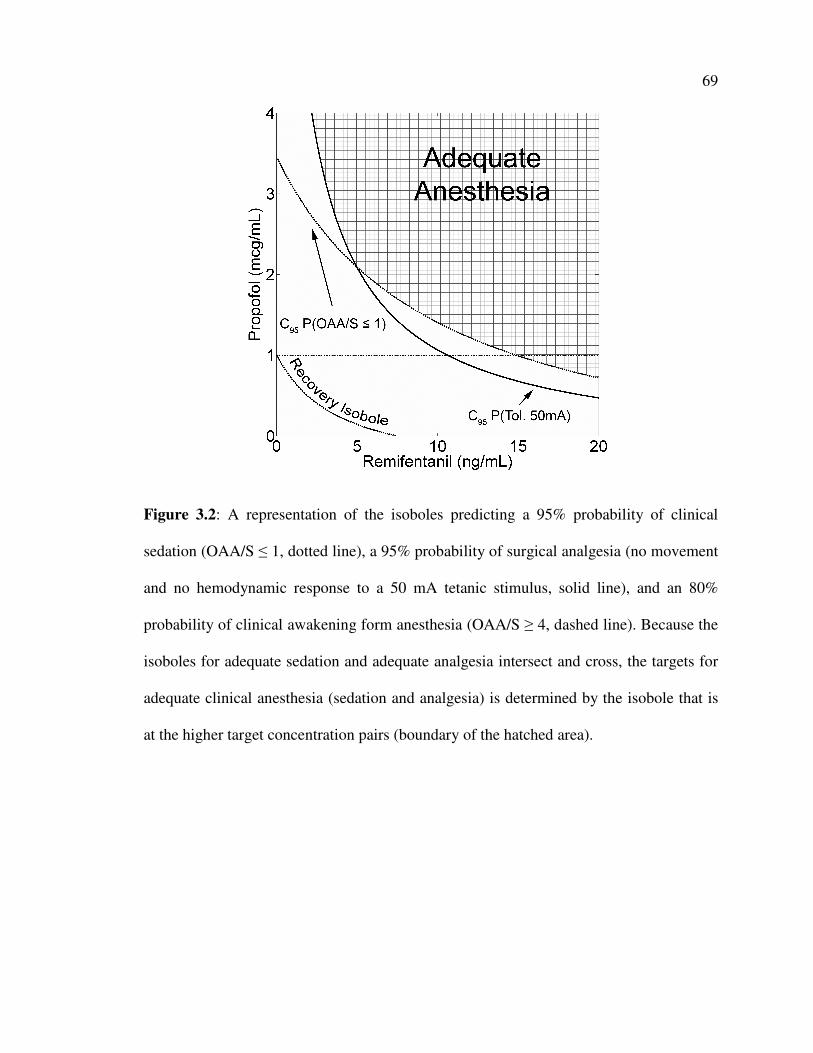
69
Figure 3.2: A representation of the isoboles predicting a 95% probability of clinical
sedation (OAA/S ≤ 1, dotted line), a 95% probability of surgical analgesia (no movement
and no hemodynamic response to a 50 mA tetanic stimulus, solid line), and an 80%
probability of clinical awakening form anesthesia (OAA/S ≥ 4, dashed line). Because the
isoboles for adequate sedation and adequate analgesia intersect and cross, the targets for
adequate clinical anesthesia (sedation and analgesia) is determined by the isobole that is
at the higher target concentration pairs (boundary of the hatched area).

70
surgical anesthesia, as determined by the composite clinical anesthesia isobole. These
effect site concentrations were maintained at these levels for one hour, after which time
the drugs were discontinued and the “washout” of the anesthetics was simulated. The
shortest time during the washout until the drug interaction model predicted a 95%
probability that OAA/S was ≥ 4 was found through iterative simulation utilizing a binary
search algorithm.19
The combination of propofol and remifentanil that resulted in the
quickest recovery (OAA/S ≥ 4) was determined for anesthetics of 30-900 minutes in
duration.
3.4 Results
All forty volunteers completed one of the two study protocols. The demographics
of the four groups of patients are shown in Table 3.1. There was no difference between
the groups except that the remifentanil patients from Manyam’s study were
predominately male, whereas the remainder of the groups contained equal numbers of
male and female volunteers.
3.4.1 Response Surface Models and Determination of Synergy
The parameters for all the response surface models were identifiable. The Logit
model parameters estimated through the nonlinear regression are shown in Table 3.2. The
models described the pharmacodynamic data reasonably well (R2 > 0.5), with the models
for clinical sedation score and pressure algometry performing best. Figure 3.3a shows the
response surface for sedation (OAA/S ≤ 1) of the unstimulated volunteers and Figure
3.3b shows the data overlaid on the simulated isoboles that predict a 50% and 95%
probability of having an OAA/S ≤ 1. Figure 3.4a and 3.4b demonstrate the tetanic
stimulation response surface and the simulated isoboles that predict a 50% and 95%

71
Table 3.1: Demographics of Study Volunteers*
Propofol
Kern
(n = 12)
Propofol
Manyam
(n = 8)
Remifentanil
Kern
(n = 12)
Remifentanil
Manyam
(n = 8)
Age [years] 29.0 ± 3.8 28.6 ± 7.9 31.6 ± 6.0 23.0 ± 3.0
Weight [kg] 69.0 ± 11.8 72.9 ± 13.2 73.0 ± 10.9 75.0 ± 9.0
Height [cm] 169.5 ± 8.9 172.7 ± 10.5 175.8 ± 12.8 178.0 ± 8.0
Sex [M:F] 5 : 7 8 : 3 7 : 5 7: 1
* All values are given as mean ± standard deviation, except for the ratio of males to
females.

72
Table 3.2: Mean Model Parameters for the Logit Response Surface*
ß0 ß1 ß2 ß3 Log
Likelihood
Correlation
Coefficient
Pressure algometry 3.02 0.63 0.28 0.57 -273.68 0.71
Tetanic Stimulation 3.73 0.56 0.09 0.48 -214.15 0.63
Laryngoscopy 3.37 0.51 0.04 0.20 -143.04 0.59
OAA/S 5.23 2.36 0.16 0.23 - 86.13 0.83
* Model parameters are listed for all values. Standard errors for all parameters were <
0.01, as determined by the bootstrap method. OAA/S = Observer assessment of Alertness
and sedation score.

73
Figure 3.3: The propofol-remifentanil interaction for sedation. The Logit response
surface model prediction for sedation for unstimulated volunteers is presented in the top
panel (Figure 3.3a). An Observer’s Assessment of Alertness/Sedation (OAA/S) score ≤ 1
represents a sedated volunteer. A 0 indicates an OAA/S ≥ 2 and a 1 indicates an OAA/S ≤
1. The symbols show measured responses and the surface predicted by the model is
represented by the grid-lined surface. The raw data used to create this model are shaded
based on the residual error. A topographic view of the 50% and 95% effect isoboles for
probability of being sedated is presented in the bottom panel (Figure 3.3b). The OAA/S
score at each target concentration pair is overlaid.
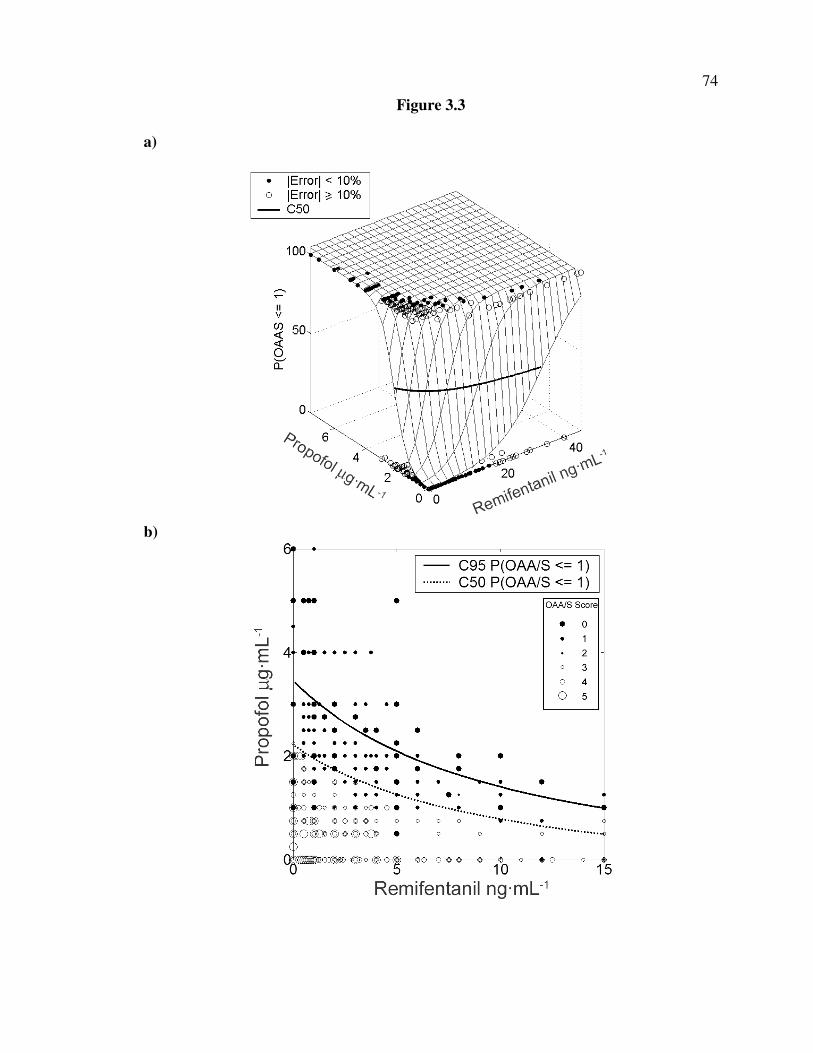
74
Figure 3.3
a)
b)

75
Figure 3.4: The remifentanil-sevoflurane interaction for electrical tetanic stimulation.
The top panel (Figure 3.4a) shows the Logit response surface model prediction for tetanic
stimulation of 50 mA. A 0 indicates a response (movement or a 10% increase in blood
pressure or heart rate) to a 50 mA stimulus current and a 1 indicates no response to 50
mA stimulus current. The symbols show measured volunteer responses to 50 mA of
stimulus current and the surface predicted by the model is represented by the grid-lined
surface. The raw data used to create this model is shaded based on the residual error. The
bottom panel (Figure 3.4b) shows a topographic view of the 50% and 95% effect isoboles
for probability of tolerating a 50 mA stimulus current. The percentage of tolerated
stimulus current at each target concentration pair is overlaid.
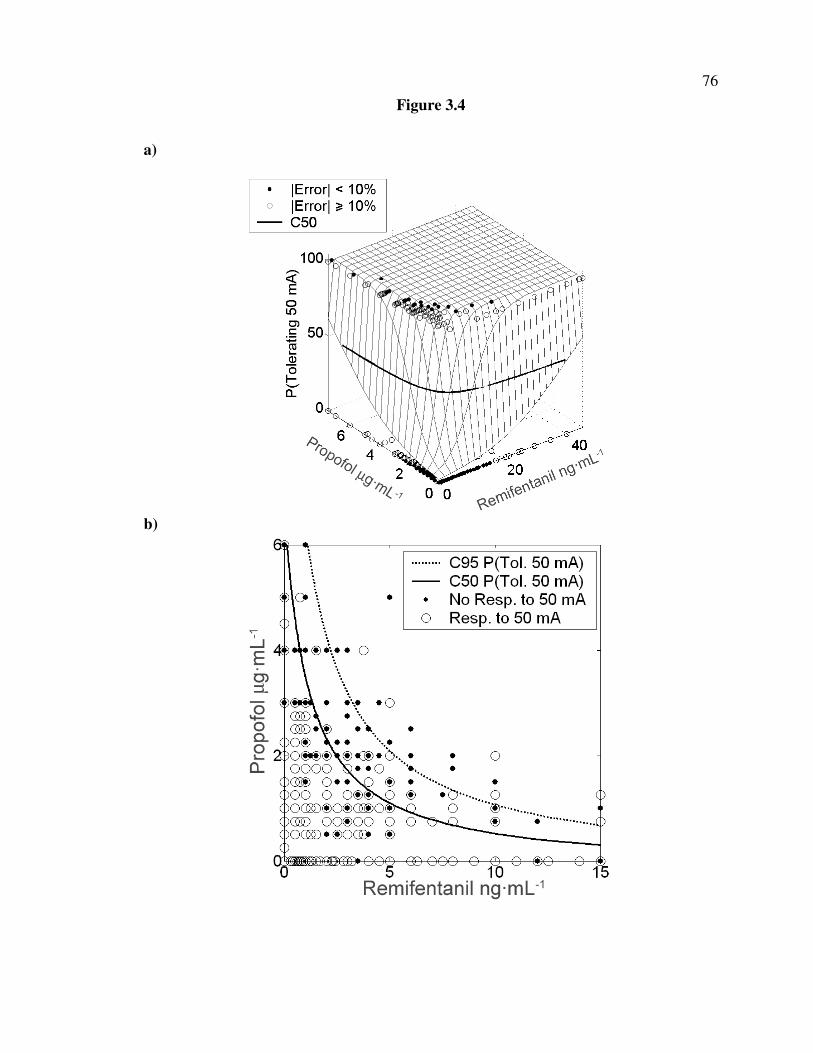
76
Figure 3.4
a)
b)

77
probability of not having a movement response or hemodynamic response to a 50 mA
tetanic stimulation.
All of the other pain stimuli surfaces (not shown) were of similar shape. The
residual errors for both clinical sedation and “surgical anesthesia” were less than 10%
throughout most of the clinically relevant range of concentrations (propofol 0-10 µg•mL-1
and remifentanil 0-15 ng•mL-1
). Simulated concentration-response curves for propofol at
a variety of remifentanil concentrations that are based on the response surface models for
clinical anesthesia and surrogate surgical anesthesia are shown in Figures 3.5a and 3.5b,
respectively.
3.4.2 Combined Pharmacokinetic and Pharmacodynamic Simulations
The addition of a moderate dose of remifentanil (Ce 9.03 ng•mL-1
) to a thirty
minute anesthetic decreased the propofol effect site concentration 8 fold (Ce 11.95 �
1.51 µg•mL-1
) compared to the propofol effect site concentration required to produce
surgical analgesia without any remifentanil (Tables 3.3 and 3.4). The concentration of
propofol and remifentanil that resulted in the fastest emergence from surgical anesthesia
plateaued at 1 µg•mL-1
and 15 ng•mL-1
, respectively, for anesthetics lasting as short as
two hours (Figure 3.6 and Table 3.4). By administering combinations of anesthetics
containing higher amounts of remifentanil than propofol, it is possible to take advantage
of the more favorable pharmacokinetic properties of remifentanil and exploit the
synergistic pharmacodynamic effects.

78
Figure 3.5: The effect of adding remifentanil on the concentration-effect relationships of
propofol for sedation (Figure 3.5a) and analgesia (Figure 3.5b). Each curve represents the
concentration-effect relationship for propofol with a fixed effect site concentration of
remifentanil simulated from the corresponding response surface model. The shift in the
curves toward the left indicates that much less propofol is needed when remifentanil is
added, demonstrating the significant pharmacodynamic synergy between0 the sedative
and the opioid. Note that the magnitude of the leftward shift decreases as the remifentanil
concentration increases (i.e., there is a ceiling effect). The addition of small to moderate
amounts of remifentanil to a propofol anesthetic result in a large decrease in the amount
of propofol required to produce clinically adequate sedation and surgical anesthesia
(Figures 3.5a and 3.5b, and Table 3.3).

79
Figure 3.5
a)
b)

80
Table 3.3: Reduction in Propofol Requirements by Remifentanil *
Remifentanil
Ce
[ng•mL-1
]
Remifentanil
Infusion Rate
[µ•kg-1
•min-1
]
Propofol
C95% OAA/S ≤≤≤≤ 1
[µ•mL-1
]
Propofol
C95% Tetanic
Stimulation
[µ•mL-1
]
0 0 3.46 11.95
1.25 0.05 3.00 5.64
5 0.18 2.09 2.08
7.5 0.27 1.70 1.43
* The reduction in the effect site concentration (Ce) of propofol that produces a 95%
probability (C95%) of an OAA/S score ≤ 1 or no movement or hemodynamic response to a
50 mA tetanic stimulation by the addition of remifentanil in doses ranging from 0-0.27
mcg•kg-1•min
-1 are reported. All infusion rates were calculated for a hypothetical 30 year
old male who weighed 80 kg and was 183 cm tall utilizing Stanpump.

81
Table 3.4: Simulation Results for Anesthetics 30-900 Minutes in Length *
Length of
Anesthetic
[hr]
Shortest
Recovery Time
[min]
Remifentanil
Ce
[ng••••mL-1
]
Remifentanil
Infusion Rate
[µ••••kg-1••••min
-1]
Propofol
Ce
[µ••••mL-1
]
0.5 9.92 9.03 0.33 1.51
1 11.25 13.0 0.48 1.14
2 13.73 15.0 0.55 1.0
4 14.2 15.0 0.55 1.0
7 14.48 15.0 0.55 1.0
10 14.62 15.0 0.55 1.0
15 14.72 15.0 0.55 1.0
20 14.75 15.0 0.55 1.0
24 14.75 15.0 0.55 1.0
* The effect site concentration (Ce) and infusion rate for remifentanil and effect site
concentration (Ce) for propofol that produced the shortest recovery times are reported for
anesthetics lasting 0.5-24 hours. All simulations were performed for a hypothetical 30
year old male who weighed 80 kg and was 183 cm tall.

82
Figure 3.6: The results of computer simulations designed to identify optimal target
concentration pairs of remifentanil- and propofol that minimize the time to
responsiveness. The top panel (Figure 3.6a) shows the predicted decline in effect site
concentrations for remifentanil and propofol after stopping drug administration regimens
targeted to reach the EC95 for adequate clinical anesthesia isobole for one hour. The EC95
isobole is on the “floor” of the cube; the vertical axis represents time elapsed since
stopping the administration of the drugs. The isobole representing a 95% probability of
the return of responsiveness (Observer’s Assessment of Alertness/Sedation score ≥ 4) is
shown by a dotted line that is superimposed on the concentration decay curves. The
highlighted curve is the sevoflurane and remifentanil target concentration pair that
resulted in the fastest return of responsiveness. The bottom panel (Figure 2.5b) shows the
time in minutes to the return of responsiveness after a 1hr procedure in which propofol
and remifentanil were administered to target concentration pairs on the EC95 isobole for
adequate clinical anesthesia isobole. The highlighted trace on the panel on the left is
shown topographically. The minimum time to regain responsiveness represents the target
concentration pairs for a 1 hour procedure.

83
Figure 3.6
a)
b)

84
3.5 Discussion
Our simulations revealed that for short duration anesthetics, the pharmacokinetic
advantage of remifentanil becomes more apparent. Between 0.5 hours and 2 hours, the
propofol target effect site concentration decreased by 33% while the remifentanil target
effect site concentration increased by 66% (Table 3.5). However, with further increases
in the anesthetic duration, both the remifentanil and the propofol effect site
concentrations rapidly reached their plateau values-for all anesthetics lasting two or more
hours, the “optimal” target effect site concentration of propofol reached a nadir at 1.0
µg•mL-1
while the target effect site concentration of remifentanil plateaued at 15.0
ng•mL-1
. Therefore, our results are similar to those predicted by the Mertens, et al.,10
and
Vuyk, et al.,3 and different from our previous observations with sevoflurane-remifentanil
anesthesia.9
3.5.1 Response Surface Models and Determination of Synergy
We chose to utilize a Logit model as the basis of our response surface analyses
because the Logit model is able to characterize quantal pharmacologic responses.
Transformation of the data from different data collection periods that have different
baseline and maximal pharmacologic response into quantal responses allows the analysis
of a larger data set derived from a variety of sources. With the Logit model we were able
to confirm the synergistic interaction of propofol and remifentanil in producing clinical
sedation and analgesia.10-12
As before, the Logit model fulfills all but one of the criteria
proposed by Minto, et al.,20
and the single unfulfilled criterion is that the Logit based
response surface model dictates that there is a slight effect (< 0.1% probability of a
response) when no drug is administered.9
85
Our predictions for the EC50, PROP for sedation and tetanic stimulation are very
close to those predicted by the previous analysis of portion of this dataset utilizing the
Greco form of the response surface model (2.2 vs 1.8 µg•mL-1
and 6.7 vs 4.6 ng•mL-1
,
sedation and tetanic stimulation, respectively).11
The estimates for the EC50, PROP for
sedation are also in agreement with those reported for surgical patients by other
investigators.10,21
The relative agreement between the EC50, PROP for tetanic stimulation
and the reported EC50, PROP for laryngoscopy in this manuscript ( 6.7 vs. 6.6 µg•mL-1
,
tetanic stimulation vs. laryngoscopy) and by others10,12
suggests that electric stimulation
may provide an stimulus of an intensity comparable to surgical incision or laryngoscopy.
Therefore, the volunteer paradigm utilized in this an other studies,9,11
is able to predict
results that are consistent with similar pharmacologic end points in surgical patients. The
volunteer paradigm offers several advantages over the surgical patient for studying
pharmacodynamic interactions between two anesthetic drugs. The main two advantages
are the ability to study subtherapeutic combinations of drugs without concern of
providing inadequate clinical effect and the ability to perform repeated measurement of
responses thereby allowing characterization of the entire spectrum of concentration pairs.
However, one of the remaining challenges in pharmacodynamics research is the
validation of the surrogates of surgical stimulation (e.g., electrical stimulation) by other
means than comparing the predicted concentration effect relationship to those reported
for the same drug in surgical patients.
3.5.2 Combined Pharmacokinetic and Pharmacodynamic Simulations
There appears to be a very limited range of anesthetic lengths over which the
“optimal” propofol-remifentanil effect site concentrations change before reaching plateau
86
values. The minimum sedative concentration of propofol plateaus at 1.0 µg•mL-1
which
correlates with approximately a 71% reduction in the EC95, PROP for sedation.
Coincidently, various opioid and sedative/hypnotic combinations have revealed that even
“high” concentrations of opioid are unable to produce more than a 60-70% reduction in
pharmacologic requirements for a sedative/hypnotic.10,13,22-25
Examined another way, it
appears that the fundamental processes of anesthesia (amnesia) require a modest amount
of sedative/hypnotic even in the presence of extremely high opioid concentrations-the
ceiling effect.10,13,22-25
Accordingly, the EC95, REMI for sedation and EC95, REMI for surgical
analgesia were two to three times higher than the maximum remifentanil concentrations
simulated (32.7 and 41.4 ng•mL-1
, sedation and tetanic stimulation, respectively), which
is consistent with the findings of other investigations.3,9,10
3.5.3 Clinical Implications
The concentration-effect curves generated by these response surface models
demonstrate an approximately 2-fold reduction in the EC95, PROP for sedation and an
approximately 8-fold decrease in the EC95, PROP for surgical analgesia with the addition
of 7.5 ng•mL-1
of remifentanil (0.27 µg•kg-1
•min-1
infusion) to a propofol anesthetic
(Figure 3.5a and 3.5b and Table 3.3). Comparing this to the 6-fold reduction in the EC95,
SEVO for sedation and an approximately 10-fold decrease in the EC95, SEVO for surgical
analgesia under similar conditions,9 one can see that propofol is a more potent
sedative/hypnotic than sevoflurane and about equally as good of an immobilizer or
analgesic.
The propofol-remifentanil synergy in producing clinical sedation and surgical
analgesia supports the utility of administrating “balanced” anesthetics with a combination

87
of sedative/hypnotic and opioid. The pharmacokinetic-pharmacodynamic simulations
demonstrate the benefit of administrating a very low target effect site concentration of
propofol (1.0 µg•mL-1
) in the presence of remifentanil, an opioid with a very rapid
elimination clearance. This is especially true for anesthetics 2 hours or longer. Because
the pharmacoeconomic advantages of the drug are not limited to just minimizing the time
until awakening or the drug acquisition costs, it is unclear whether these high dose
remifentanil-low dose propofol anesthetics will be of a pharmacoeconomic advantage.26
3.5.4 Limitations
Although the volunteer study design affords the advantages of ethically allowing
the investigation of multiple concentration pairs spanning from subtherapeutic to supra-
therapeutic combinations, it is limited in that the sedation end point is determined in
unstimulated volunteers because of the lack of an endotracheal tube. Since every surgical
patient has at least the mild to moderate stimulation provided by the constant presence of
an endotracheal tube, there is a possibility that our predictions for the drug concentration
pairs that provide adequate sedation may underestimate the sedative requirements of an
intubated surgical patient. However, the robustness of the OAA/S criteria utilized to
define sedation (OAA/S ≤ 1-does not respond to shaking or shouting) may compensate
by providing intermittent stimulation. The similarities between the EC50, PROP for sedation
determined from this model and that determined in unintubated patients during
placement of an intracerebral stimulating electrode21
or intubated surgical patients
undergoing gynecological operations10
is reassuring that this limitation is not too large.
The application of surgical stimulus surrogates also has advantages and
disadvantages. Although it is possible to apply these surgical surrogates multiple times in

88
order to determine the pharmacologic response spanning the entire concentration range,
in order to assure that the volunteers were not injured, we had to limit the maximum
stimulus applied. This limitation may have resulted in censored data that could result in
pharmacodynamic response curves that predict a falsely low potency. Therefore, care
must be used if the data are extrapolated above the concentration range examined. The
other disadvantage of the surrogates to surgical stimulus is that it is unclear what the true
intraoperative correlates are for the tested stimuli just as it is unclear what the appropriate
surrogate stimulus is for many intraoperative stimuli (e.g., pneumoperitoneum,
subcutaneous tunneling, etc.). Based on our growing experience with these surgical
surrogate stimuli and observations of the pharmacodynamic and physiologic
responses,9,11
it is probably safe to state that the most stimulating intraoperative events-
surgical incision, placement of a Mayfield head fixation device, sternotomy, and
laryngoscopy-are mimicked by the most intense surrogate stimuli-tetanic stimulation and
laryngoscopy.
The use of intravenous anesthetics brought about two possible limitations. First,
the use of pharmacokinetic models to predict the propofol and remifentanil effect site
concentrations in lieu of measuring the actual blood drug concentration may compound
some of the variability in the opioid only, single drug data.27
However, as in our previous
study,9 there is convincing evidence to demonstrate that this may not be a major source of
pharmacokinetic variability. Second, continuous infusions of remifentanil has been
shown to induce hyperalgesia in patients28
and volunteers.29
As detailed in our prior
manuscript,9 we did not design the studies to detect the existence of or the presence of
remifentanil induced hyperalgesia. However, we did not find any differences between the

89
baseline levels of tolerated stimuli and the levels of stimuli tolerated at the lowest doses
of propofol. In addition, one could conjecture that any opioid hyperalgesia that developed
would not effect the clinical sedation scores (OAA/S) that were determined during quiet
periods prior to the determination of the analgesic response of each of the targeted
concentration pairs.
3.5.5 Future Work
Our response surface models for propofol and remifentanil interactions were
developed in volunteers exposed to a variety of surrogate pain stimuli. These models will
need to be validated in a variety of surgical patients receiving these two drugs as the only
anesthetic agents. Further work will need to be done to determine if the surrogate pain
stimuli accurately predict the responses to different surgical stimuli (e.g., skin incision,
abdominal insufflation, placement of Mayfield head fixation, etc.). In addition, there are
conceivably 20 different sedative-opioid combinations that could be generated when one
considers the pharmacodynamic and pharmacokinetic differences between the clinically
available sedative/hypnotics (propofol, desflurane, sevoflurane, and isoflurane) and
commonly utilized opioids (morphine, fentanyl, alfentanil, sufentanil, and remifentanil).
Simply utilizing the potency ratio of one drug compared to another member of it’s drug
class and performing computer simulations of the results based on previous developed
models may not yield correct results if the concentration-effect relationships are not
parallel and the appropriate dose ranges are not selected. But in order to develop a
comprehensive library of models for use in everyday anesthesia practice that would not
constrain the clinician to a single pair of anesthetics (i.e., sevoflurane and remifentanil
only) response surface models of these combinations would be necessary.
90
3.5.6 Conclusion
Several authors have used a variety of response surface models to characterize the
pharmacodynamic interactions of propofol and remifentanil for a variety of
pharmacologic end points in volunteers and surgical patients. We demonstrated that by
combining Logit response surface models developed from volunteer data with
pharmacokinetic models, we could identify target concentrations of propofol and
remifentanil that resulted in the fastest time to awakening from anesthesia. The
pharmacokinetic advantages of remifentanil over propofol resulted in higher remifentanil
concentrations being targeted as the duration of the anesthetic increased.
3.6 References
1. Eger EI, 2nd, Shafer SL: Tutorial: context-sensitive decrement times for
inhaled anesthetics. Anesth Analg 2005; 101: 688-96
2. Shafer SL, Varvel JR: Pharmacokinetics, pharmacodynamics, and rational
opioid selection. Anesthesiology 1991; 74: 53-63
3. Vuyk J, Mertens MJ, Olofsen E, Burm AG, Bovill JG: Propofol anesthesia
and rational opioid selection: determination of optimal EC50-EC95 propofol-opioid
concentrations that assure adequate anesthesia and a rapid return of consciousness.
Anesthesiology 1997; 87: 1549-62
4. Practice Advisory for Intraoperative Awareness and Brain Function
Monitoring: A Report by the American Society of Anesthesiologists Task Force on
Intraoperative Awareness. Anesthesiology 2006; 104: 847-64
5. Zbinden AM, Petersen-Felix S, Thomson DA: Anesthetic depth defined
using multiple noxious stimuli during isoflurane/oxygen anesthesia. II. Hemodynamic
responses. Anesthesiology 1994; 80: 261-7
6. Monk TG, Saini V, Weldon BC, Sigl JC: Anesthetic management and
one-year mortality after noncardiac surgery. Anesth Analg 2005; 100: 4-10
7. Minto CF, Schnider TW, Egan TD, Youngs E, Lemmens HJ, Gambus PL,
Billard V, Hoke JF, Moore KH, Hermann DJ, Muir KT, Mandema JW, Shafer SL:
Influence of age and gender on the pharmacokinetics and pharmacodynamics of
remifentanil. I. Model development. Anesthesiology 1997; 86: 10-23

91
8. Schnider TW, Minto CF, Shafer SL, Gambus PL, Andresen C, Goodale
DB, Youngs EJ: The influence of age on propofol pharmacodynamics. Anesthesiology
1999; 90: 1502-16
9. Manyam SC, Gupta DK, Johnson KB, White JL, Pace NL, Westenskow
DR, Egan TD: Opiod-Volatile Anesthetic Synergy: A Response Surface Model with
Remifentanil and Sevoflurane as Prototypes. Anesthesiology 2006: in press
10. Mertens MJ, Olofsen E, Engbers FH, Burm AG, Bovill JG, Vuyk J:
Propofol reduces perioperative remifentanil requirements in a synergistic manner:
response surface modeling of perioperative remifentanil-propofol interactions.
Anesthesiology 2003; 99: 347-59
11. Kern SE, Xie G, White JL, Egan TD: A response surface analysis of
propofol-remifentanil pharmacodynamic interaction in volunteers. Anesthesiology 2004;
100: 1373-81
12. Bouillon TW, Bruhn J, Radulescu L, Andresen C, Shafer TJ, Cohane C,
Shafer SL: Pharmacodynamic interaction between propofol and remifentanil regarding
hypnosis, tolerance of laryngoscopy, bispectral index, and electroencephalographic
approximate entropy. Anesthesiology 2004; 100: 1353-72
13. Vuyk J, Lim T, Engbers FH, Burm AG, Vletter AA, Bovill JG: The
pharmacodynamic interaction of propofol and alfentanil during lower abdominal surgery
in women. Anesthesiology 1995; 83: 8-22
14. Schraag S, Mohl U, Bothner U, Georgieff M: Interaction modeling of
propofol and sufentanil on loss of consciousness. J Clin Anesth 1999; 11: 391-6
15. Short TG, Ho TY, Minto CF, Schnider TW, Shafer SL: Efficient trial
design for eliciting a pharmacokinetic-pharmacodynamic model-based response surface
describing the interaction between two intravenous anesthetic drugs. Anesthesiology
2002; 96: 400-8
16. Lerou JG, Booij LH: Model-based administration of inhalation
anaesthesia. 1. Developing a system model. Br J Anaesth 2001; 86: 12-28
17. Tackley RM, Lewis GT, Prys-Roberts C, Boaden RW, Dixon J, Harvey
JT: Computer controlled infusion of propofol. Br J Anaesth 1989; 62: 46-53
18. Shafer SL, Gregg KM: Algorithms to rapidly achieve and maintain stable
drug concentrations at the site of drug effect with a computer-controlled infusion pump. J
Pharmacokinet Biopharm 1992; 20: 147-69
19. Knuth D: Sorting and Searching, The Art of Computer Programming, 3
Edition. Reading, Massachusetts, Addison-Wesley, 1997, pp 409-426
92
20. Minto CF, Schnider TW, Short TG, Gregg KM, Gentilini A, Shafer SL:
Response surface model for anesthetic drug interactions. Anesthesiology 2000; 92: 1603-
16
21. Fabregas N, Rapado J, Gambus PL, Valero R, Carrero E, Salvador L,
Nalda-Felipe MA, Troconiz IF: Modeling of the sedative and airway obstruction effects
of propofol in patients with Parkinson disease undergoing stereotactic surgery.
Anesthesiology 2002; 97: 1378-86
22. Smith C, McEwan AI, Jhaveri R, Wilkinson M, Goodman D, Smith LR,
Canada AT, Glass PS: The interaction of fentanyl on the Cp50 of propofol for loss of
consciousness and skin incision. Anesthesiology 1994; 81: 820-8
23. Sebel PS, Glass PS, Fletcher JE, Murphy MR, Gallagher C, Quill T:
Reduction of the MAC of desflurane with fentanyl. Anesthesiology 1992; 76: 52-9
24. Hall RI, Szlam F, Hug CC, Jr.: The enflurane-sparing effect of alfentanil
in dogs. Anesth Analg 1987; 66: 1287-91
25. Brunner MD, Braithwaite P, Jhaveri R, McEwan AI, Goodman DK, Smith
LR, Glass PS: MAC reduction of isoflurane by sufentanil. Br J Anaesth 1994; 72: 42-6
26. Miller DR, Tierney M: Observational studies and "real world" anesthesia
pharmacoeconomics. Can J Anaesth 2002; 49: 329-34
27. Avram MJ, Krejcie TC: Using front-end kinetics to optimize target-
controlled drug infusions. Anesthesiology 2003; 99: 1078-86
28. Crawford MW, Hickey C, Zaarour C, Howard A, Naser B: Development
of Acute Opioid Tolerance During Infusion of Remifentanil for Pediatric Scoliosis
Surgery. Anesth Analg 2006; 102: 1662-1667
29. Angst MS, Koppert W, Pahl I, Clark DJ, Schmelz M: Short-term infusion
of the mu-opioid agonist remifentanil in humans causes hyperalgesia during withdrawal.
Pain 2003; 106: 49-57
30. Prys-Roberts C: Anaesthesia: a practical or impractical construct? Br J
Anaesth 1987; 59: 1341-5
31. Greco WR, Bravo G, Parsons JC: The search for synergy: a critical review
from a response surface perspective. Pharmacol Rev 1995; 47: 331-85
32. Minto C, Vuyk J: Response surface modelling of drug interactions. Adv
Exp Med Biol 2003; 523: 35-43

CHAPTER 4
PROCESSED EEG TARGETS REQUIRED FOR
ADEQUATE ANESTHESIA §
4.1 Abstract
4.1.1 Background
Opioids are commonly used in conjunction with sedative drugs to provide
anesthesia. Previous studies have shown that opioids reduce the clinical requirements of
sedative drug needed to provide adequate anesthesia. Processed EEG parameters, such as
the Bispectral Index (BIS, Aspect Medical Systems, Newton, MA) and Auditory Evoked
Potential Index (AAI, Alaris Medical Systems, ), can be used intra-operatively to assess
the depth of sedation. The aim of this study was to characterize how the addition of
opioids sufficient to change the clinical level of sedation, influenced the BIS and AAI.
4.1.2 Methods
Twenty four adult volunteers received a target controlled infusion of
remifentanil (0-15 ng•mL-1
) and inhaled sevoflurane (0-6 vol %) at various target
concentration pairs. After reaching pseudo-steady-state drug levels, the Observer's
Assessment of Alertness/Sedation (OAAS) score, BIS, and AAI were measured at each
§ Accepted for publication in Anesthesiology, August 2006. Copyright 2006, American
Society of Anesthesiologists. Original article titled: “When is a bispectral index of 60 too
low? Rational processed EEG targets are dependent on the sedative-opioid ratio.”

94
target concentration pair. Response surface pharmacodynamic interaction models were
built using the pooled data for each pharmacodynamic end point.
4.1.3 Results
Response surface models adequately characterized all pharmacodynamic end
points. Despite the fact that sevoflurane-remifentanil interactions were strongly
synergistic for clinical sedation, BIS and AAI were minimally affected by the addition of
remifentanil to sevoflurane anesthetics.
4.1.4 Conclusion
Although clinical sedation increases significantly with the addition of a small to
moderate dose of remifentanil to a sevoflurane anesthetic, the BIS and AAI are
insensitive to this change in clinical state. Therefore, during sevoflurane-remifentanil
anesthesia, targeting a BIS < 60 or an AAI <30 may result in an unnecessarily deep
anesthetic state.
4.1.5 Acknowledgements
Supported in part by a research grant from Alaris Medical Systems, Inc., San
Diego, CA, (TDE) and by the National Institute of Biomedical Imaging and
Bioengineering of the National Institutes of Health 8 RO1 EB00294 (SCM and DRW).
4.1 Introduction
Explicit recall of intraoperative events (intraoperative awareness) is a major
concern of both patients undergoing anesthetics and health-care providers administering
anesthetics.1 With an incidence of 0.13% in the general population,
2 the topic of
intraoperative awareness has come under scrutiny by both the lay press and the scientific

95
community. This has intensified the search for the “Holy Grail” of intraoperative
anesthesia-a reliable, continuous monitor of the “depth of anesthesia.”3 However,
adequate “depth of anesthesia” is a vague term that spans from a state of sedation and
amnesia that prevents explicit recall4 to a state where there is no movement
5 or no
hemodynamic response to surgical stimuli.6 Furthermore, delivery of a single anesthetic
drug class (e.g., volatile anesthetic or propofol) results in a different anesthetic profile
than when a balanced anesthetic is delivered.7 Therefore, complete monitors of the
“depth of anesthesia” must characterize these clinical endpoints during the administration
of a variety of combinations of anesthetics.8
Processed EEG parameters are gaining popularity as intra-operative monitors of
depth of anesthesia.3 One depth of anesthesia monitor, the Bispectral Index (BIS, Aspect
Medical Systems, Newton, MA), is based on Bispectral analysis of the EEG.9 The
propriety BIS algorithm was a unique step forward in the use of EEG parameters to
determine anesthetic depth because it combined multiple distinct EEG parameters and a
large volume of prospectively collected clinical observations into a single descriptive
variable which was then prospectively tested and validated.3 The BIS is the only
processed EEG that has been found to decrease the incidence of intraoperative awareness
in a randomized controlled trial of patients with a large number of risk factors for
intraoperative awareness.10
In addition, titrating anesthetics to specific BIS target values
has been found to effect clinical outcomes-a BIS of 50-60 results in faster emergence
from anesthesia,11
whereas avoiding “deep anesthesia” (BIS < 40) may improve one year
survival of patients.12
96
During general anesthesia, the brainstem and the midbrain auditory function is
preserved, although meaningful interpretation of the auditory stimulus is inhibited.13,14
These brainstem responses to an auditory stimulus correlate with motor signs of
wakefulness and intraoperative awareness.15
The preservation of brainstem responses
that correlate with inadequate anesthesia (movement or awareness) suggests that the
auditory evoked potential (AEP) might be more robust in detecting inadequate anesthesia
as opposed to the EEG which solely monitors the cortical activity.16,17
The A-Line AEP
Index (AAI, Danmeter, Odense, Denmark) is the first commercially available monitor
that utilizes changes within the AEP to measure the depth of anesthesia.18
Like the BIS,
the AAI correlates well with the clinical level of sedation produced by increasing doses
of sevoflurane13,19
or propofol.9,20
Although adequate surgical anesthesia can be produced utilizing a volatile
anesthetic alone,5,6
hemodynamic depression21
and prolonged time to awakening22
limit
the practicality of utilizing a volatile anesthetic as the sole anesthetic agent. Therefore, an
opioid analgesic is commonly coadministered with smaller doses of a volatile anesthetic
to provided adequate analgesia and maintain a state of nonresponsiveness to surgical
stimulation.23
The addition of opioids is known to synergistically increase the clinical
level of sedation produced by propofol 24,25
and volatile anesthetics.26,27
However, the
effects of the addition of an opioid on the processed EEG parameters is controversial-
some reports show that the processed EEG is insensitive to opioids,9,28,29
whereas others
suggest that opioids do alter processed EEG parameters.30-32
Therefore, the “true” effects
of the addition of opioids to hypnotic drugs on the BIS (and AAI) are unclear.

97
The principle aim of this study was to characterize how the addition of opioids
sufficient to change the clinical level of sedation influenced processed EEG parameters
such as BIS and AAI. Data acquired from volunteers receiving various target
concentration pairs of sevoflurane and remifentanil were utilized to construct response
surfaces models of the observed level of sedation and the measured EEG parameters. We
hypothesized that the processed EEG parameters (BIS and AAI) do not accurately reflect
the level of clinical sedation observed with the addition of remifentanil to a sevoflurane
anesthetic. In addition, we hypothesized that with the co-administration of remifentanil
and sevoflurane, attempting to maintain a target BIS of 50-60 or a target AAI of 20-30
would result in overdosing the anesthetic-sevoflurane-remifentanil target concentration
pairs well above those that provide clinically adequate anesthesia (e.g., no awareness, no
movement, and no hemodynamic response in response to stimulation).
4.3 Materials and Methods
A portion of the data from this data set were published previously in a manuscript
examining the synergistic interaction between remifentanil and sevoflurane in producing
clinical sedation and analgesia to experimental painful stimuli that are surrogates for
intraoperative painful stimuli.33
Because of the minor overlap between the hypotheses of
the previous and the current manuscript and the large amount of data reported in each
manuscript, each analysis is reported in a separate manuscript.
A written informed consent document that was approved by the Human
Institutional Review Board at the University of Utah Health Sciences Center (Salt Lake
City, Utah) was obtained from each of 24 volunteers in this open-label, randomized,
parallel group crisscross designed study to asses drug interactions (Figure 4.1).34
Each

98
Figure 4.1: A schematic summary of the infusion scheme. During each of the three study
periods the primary drug is administered in a stepwise fashion (solid black line), while in
the second and third study periods, the second drug (grey filled area) is held at a constant
predicted effect site concentration or measured alveolar concentration. In between each
study period there is a washout phase, during which the primary and secondary drugs are
allowed to decay to predicted concentrations below that of the subsequent target
concentration pair.

99
volunteer was randomized to receive a target controlled infusion of remifentanil
(predicted effect site concentrations of 0.5-15 ng•mL-1
) or sevoflurane (0.3-6 vol % end
tidal alveolar concentration) as the primary agent with the other drug acting as the
secondary agent (Figure 4.1). The reader is referred to the previous manuscript by
Manyam, et al.,33
for complete details regarding the methods of volunteer preparation,
drug administration, and data collection. Because the methods of data analysis and
statistical analysis have substantial differences from the previous manuscript, they are
provided in detail.
4.3.1 BIS and AAI Measurements
To avoid variability arising from hysteresis between plasma concentration and
effect site, BIS and AAI were measured at each assessment point 5 minutes after the
targeted effect-site concentration (or stable end-tidal concentration) for a primary drug
“step,” was reached. The EEG parameters were averaged in a 40 second interval that
preceded the assessment of the Observer’s Assessment of Alertness/Sedation score
(OAA/S, Table 4.1).35
This interval was also considered a “quiet time” where no other
changes or assessments were made in the volunteers. Data resulting from faulty sensors
or monitor malfunction were not included in the subsequent analyses.
4.3.2 Demographic Data Analysis
Demographic data for the volunteers in each group were compared utilizing an
unpaired, two-sided t-test using StatView version 5.0.1 (SAS Institute, Inc., Cary, NC)
with P < 0.05 considered significant. All demographic data were reported as means with
standard deviations.

100
Table 4.1: Observer’s Assessment of Alertness/Sedation (OAA/S) Score*
Responsiveness Score
Responds readily to name spoken in normal tone 5
Lethargic response to name spoken in normal tone 4
Responds only after name is called loudly and/or repeatedly 3
Responds only after mild prodding or shaking 2
Does not respond to mild prodding or shaking 1
Does not respond to noxious stimulus 0
* For the purposes of this study, an OAA/S ≤ 1 was considered nonresponsive, whereas
an OAA/S ≥ 4 was considered “awake.”

101
4.3.3 Measurement of Association
The performance of each of the processed EEG parameters was assessed by
comparison against the sedation score (OAA/S). Because a direct correlation can not be
calculated between an ordinal variable (OAA/S score) and either of the continuous
variables (processed EEG parameters), we calculated the prediction probability (Pk) as
described by Smith and Dutton36
for the association between the clinical sedation scale
(OAA/S) and BIS and AAI using SPSS Version 14 (SPSS Inc., Chicago, IL). The Pk
values were also calculated for BIS and AAI to test their ability to detect the anesthetic
state that corresponds with loss of “shake and shout” responses (OAA/S <=1, Table 4.1).
4.3.4 Response Surface Models of the Processed EEG Parameters
Response surface models were constructed for each processed EEG parameter
using the Greco-Berenbaum model as shown below:37
1..
...
50505050
50505050
max
+
++
++
=n
B
B
A
A
B
B
A
A
n
B
B
A
A
B
B
A
A
EC
C
EC
C
EC
C
EC
C
EC
C
EC
C
EC
C
EC
CE
E
α
α
where CA, CB are the concentrations of the two drugs, EC50A, EC50B are drug
concentrations causing 50% of the maximal drug effect, EMAX is the maximal drug effect,
α characterizes the extent of interaction between both drugs, n is a measure of response
steepness For each processed EEG parameter, the data were pooled and used to fit the
three-dimensional response surface using a naïve pooled technique. Model coefficients
and standard errors were estimated using MATLAB (MathWorks Inc., Natick, MA).
102
Models were built by an iterative process in which the log likelihood between the
observations and the model predictions was maximized. The contribution of each
coefficient was evaluated by excluding it from the model and determining whether the
model deteriorated significantly using the likelihood ratio test (∆ Likelihood Ratio ≥
30%). The standard error of the model parameters was estimated using the bootstrap
method for 5000 iterations.38
Model performance was evaluated by assessment of Error Prediction (observed vs.
predicted probability of effect for each dose combination) and the correlation coefficient.
The Error Prediction is defined as the following:
ObservededictedObservedXError ediction /Pr100Pr −=
The correlation coefficient of the regression parameter estimates was used to
evaluate how well the nonlinear regression models described the observed data. A large
value of the correlation coefficient (≥ 0.7) indicates that the responses predicted from the
surface described the observed data well.39
4.4 Results
All 24 volunteers completed the study. The demographics of the two groups are
shown in Table 4.2. There were no differences between the groups except that the
sevoflurane group contained equal numbers of male and female volunteers, whereas the
remifentanil group was predominately male volunteers.
For individual drugs, the relationship between the processed EEG parameters, the
measured drug concentrations, and the OAA/S score at each assessment point is shown in
Figure 4.2 and summarized in Table 4.3. We observed that most volunteers were sedated
(OAA/S ≤ 1) at sevoflurane concentrations greater than 1.5 vol. %. Adequate sedation
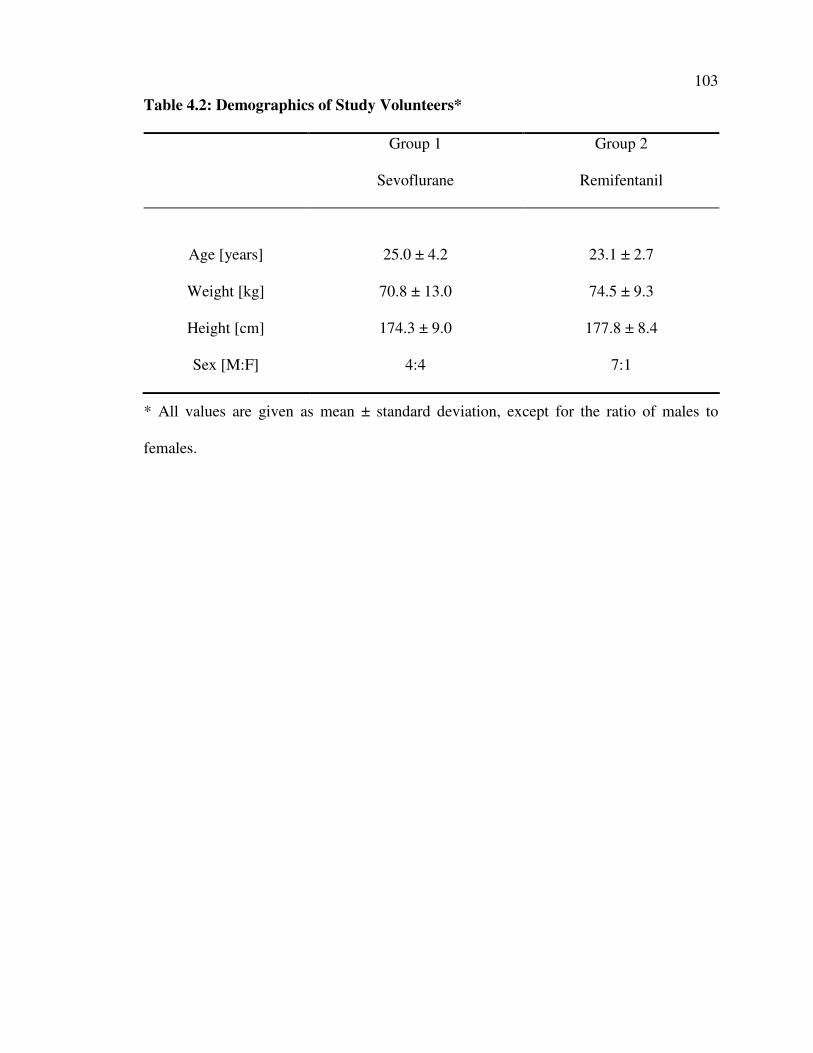
103
Table 4.2: Demographics of Study Volunteers*
Group 1
Sevoflurane
Group 2
Remifentanil
Age [years] 25.0 ± 4.2 23.1 ± 2.7
Weight [kg] 70.8 ± 13.0 74.5 ± 9.3
Height [cm] 174.3 ± 9.0 177.8 ± 8.4
Sex [M:F] 4:4 7:1
* All values are given as mean ± standard deviation, except for the ratio of males to
females.
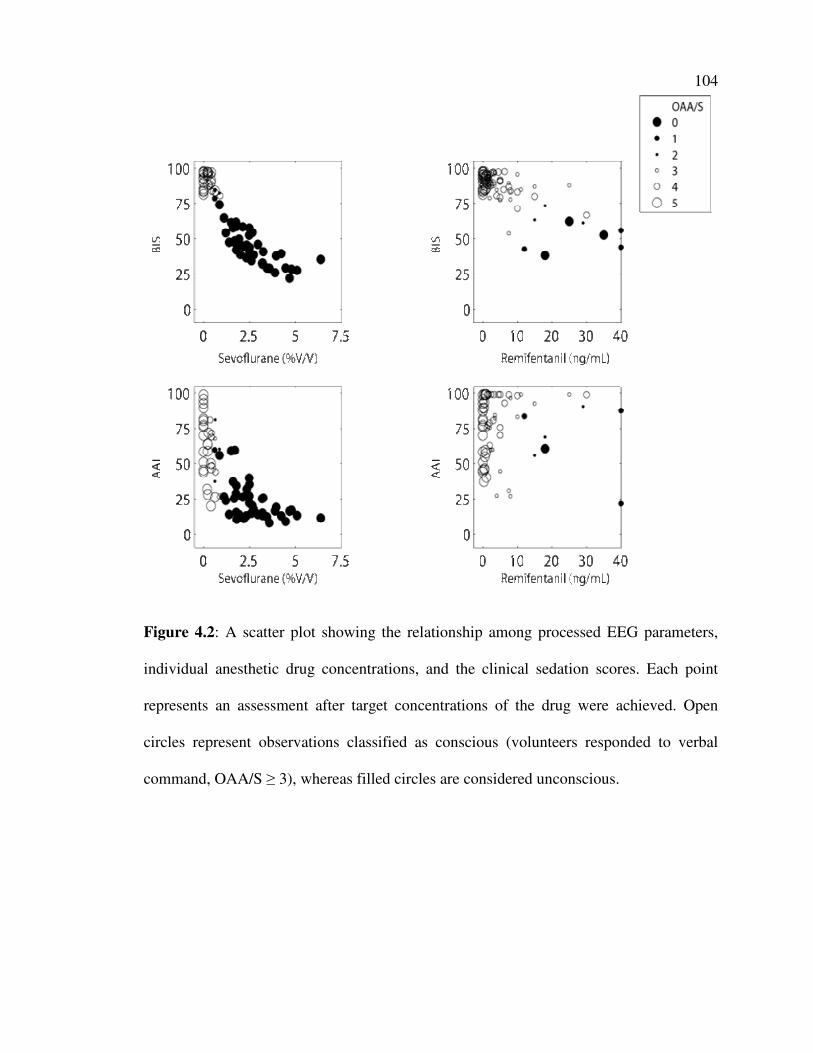
104
Figure 4.2: A scatter plot showing the relationship among processed EEG parameters,
individual anesthetic drug concentrations, and the clinical sedation scores. Each point
represents an assessment after target concentrations of the drug were achieved. Open
circles represent observations classified as conscious (volunteers responded to verbal
command, OAA/S ≥ 3), whereas filled circles are considered unconscious.
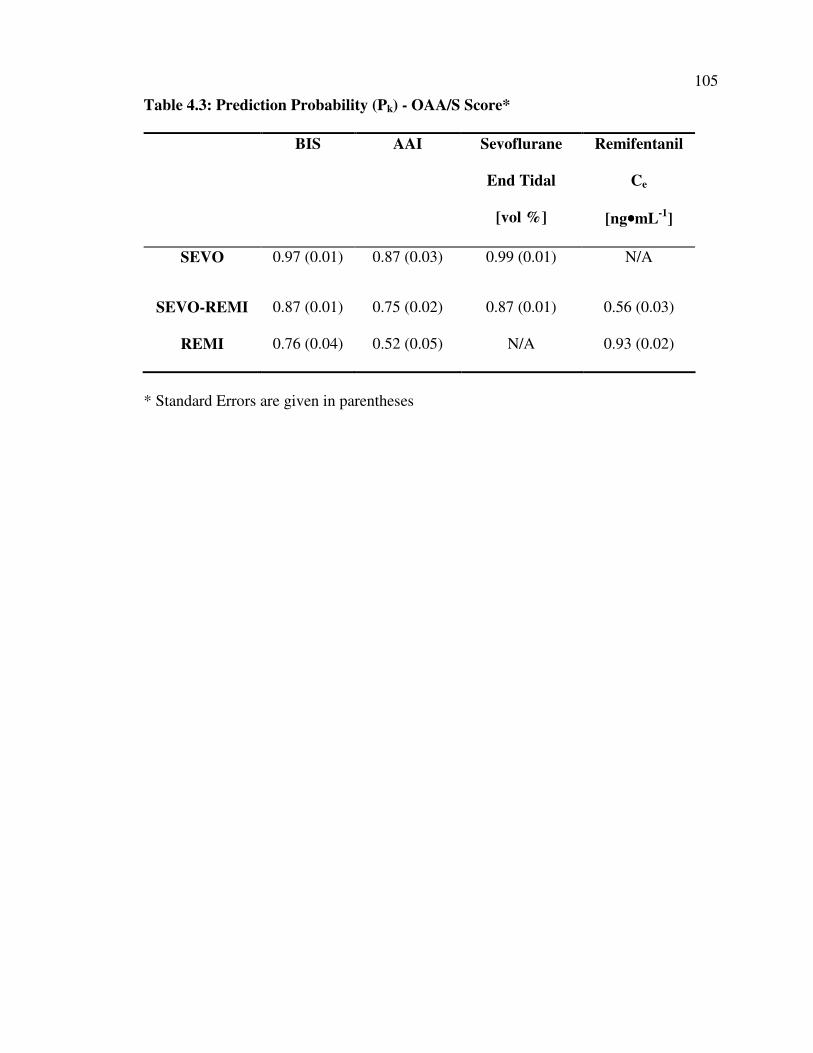
105
Table 4.3: Prediction Probability (Pk) - OAA/S Score*
BIS AAI Sevoflurane
End Tidal
[vol %]
Remifentanil
Ce
[ng••••mL-1
]
SEVO 0.97 (0.01) 0.87 (0.03) 0.99 (0.01) N/A
SEVO-REMI 0.87 (0.01) 0.75 (0.02) 0.87 (0.01) 0.56 (0.03)
REMI 0.76 (0.04) 0.52 (0.05) N/A 0.93 (0.02)
* Standard Errors are given in parentheses

106
could not be achieved at remifentanil concentrations in the clinical range (5- 10 ng•mL-1
).
Sedation using remifentanil could be achieved at concentrations higher than 20 ng•mL-1
.
Figures 4.3a and 4.3b show the distribution of BIS and AAI at clinically relevant
sedation states-loss of responsiveness to shouting (OAA/S = 2), loss of responsiveness to
shaking and shouting (OAA/S = 1), and loss of responsiveness to noxious stimulus
(OAA/S = 0). The data are presented in a group where only sevoflurane was administered
and in a group in which the volunteers received a combination of sevoflurane and
remifentanil.
4.4.1 Response Surface Models
The parameters for all the response surface models were identifiable. The Greco
model parameters estimated through nonlinear regression are shown in Table 4.4. The
estimates of “goodness of fit” (e.g., Log Likelihood, Standard Errors, and Correlation
Coefficient) suggest that the models described the BIS data better than the AAI data. The
response surfaces that describe BIS and AAI at various target concentrations of
sevoflurane and remifentanil are shown in Figures 4.4a and 4.4b, respectively.
Throughout most of the clinically relevant range of concentrations (sevoflurane 0- 3 vol
% and remifentanil 0- 7.5 ng•mL-1
) the residual error is below 10%.
Isoboles from Logit response surface models for clinical sedation (95%
probability of OAA/S score ≤ 1) and tolerance of surgical incision (the 95% probability
of no movement or hemodynamic response to a 50 mA electric tetanic stimulation)
previously reported by Manyam, et al.,33
are shown in Figures 4.5 and 4.6. In addition,
the raw data for each of the processed EEG parameters and the predicted processed EEG
parameter values for the concentration target pairs on the previously described isoboles

107
Figure 4.3: A box plot showing the distribution of BIS (top panel, Figure 4.3a) and AAI
(bottom panel, Figure 4.3b) at clinically relevant sedation states (OAA/S ≤ 2). The data
are presented in two groups-the first group (open boxes) show the distribution in the
processed EEG parameters where volunteers received only sevoflurane. The second
group (shaded boxes) show the distribution in the processed EEG parameters when the
volunteers received a combination of sevoflurane and remifentanil.

108
Figure 4.3

109
Table 4.4: Mean Model Parameters for the Greco Response Surface for Sevoflurane
and Remifentanil*
EC50,Sevoflurane
[vol %]
EC50,Remifentanil
[ng••••mL-1
]
Synergy
(α)
Gamma
(γ)
Log
Likeli
hood
Correlation
Coefficient
BIS
2.37 (0.06) 38.02 (2.57) 0.52(0.39) 1.12(0.02)
-
281.58
0.89
AAI 0.62 (0.06) 76.06 (17.40) 1.15(1.33) 1.12(0.08) -1.24 0.60
* Standard Errors are given in parentheses
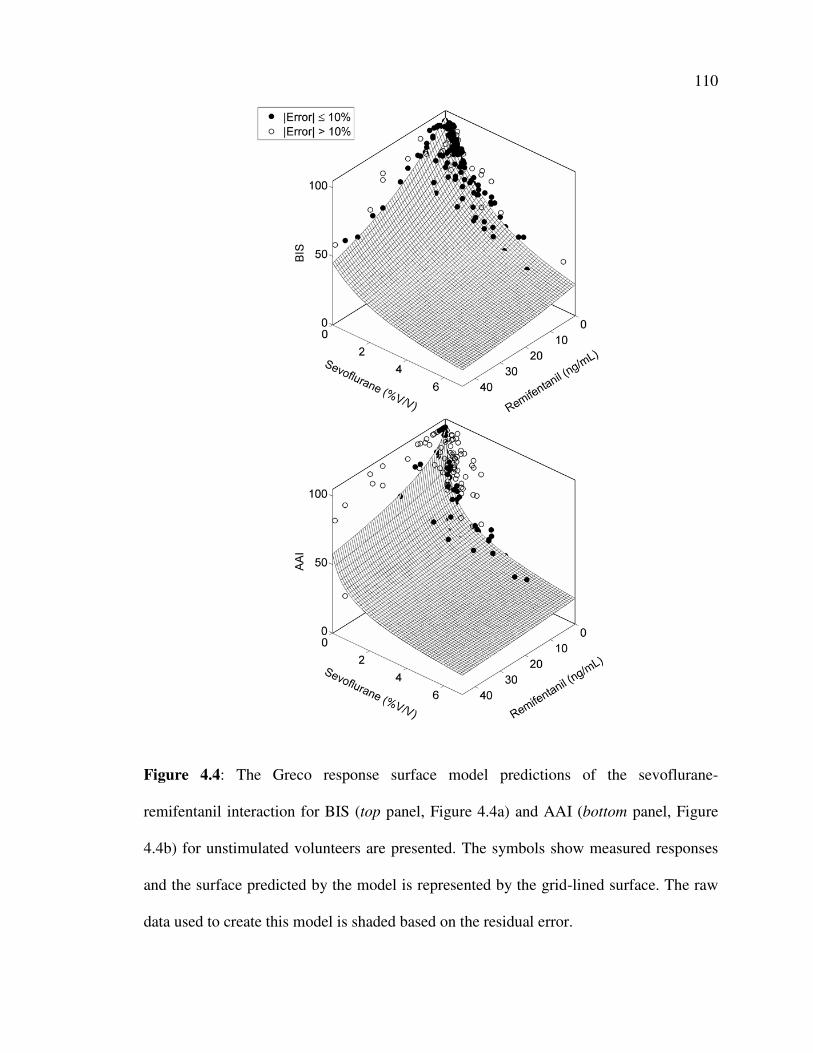
110
Figure 4.4: The Greco response surface model predictions of the sevoflurane-
remifentanil interaction for BIS (top panel, Figure 4.4a) and AAI (bottom panel, Figure
4.4b) for unstimulated volunteers are presented. The symbols show measured responses
and the surface predicted by the model is represented by the grid-lined surface. The raw
data used to create this model is shaded based on the residual error.
111
Figure 4.5: The panel on the top (Figure 4.5a) shows a topographic view of the raw data
(BIS) overlaid upon isoboles for adequate clinical sedation (95% probability of achieving
an OAA/S score ≤ 1) and adequate surgical analgesia (95% probability of no movement
response or hemodynamic response to a 50 mA tetanic electrical stimulation). The panel
on the bottom (Figure 4.5b) demonstrates the predictions of the BIS response surface
model (mean and standard deviation) at different concentration pairs along the isoboles
for adequate clinical sedation and surgical analgesia.

112
Figure 4.5
0 5 10 150
1
2
3
Remifentanil ng/mL
Se
vo!
ura
ne
%V
/V
EC95
P(OAAS ≤ 1)
EC95
P(Tol. 50 mA)
BIS
80-100
60-80
40-60
< 40
0 5 10 150
1
2
3
77(2)
81(0.9)
80(0.7)
77(0.6)
74(0.5)
71(0.5)
68(0.5)
72(2)
79(1)68(2)
69(1)
65(1)
61(1)
57(0.9)
52(0.9)
49(0.8)
45(0.8)
43(0.8)
69(1)
Remifentanil ng/mL
Se
vo
!u
ran
e %
V/V
EC95
P(OAAS ≤ 1)
EC95
P(Tol. 50 mA)

113
Figure 4.6: The panel on the top (Figure 4.6a) shows a topographic view of the raw data
(AAI) overlaid upon isoboles for adequate clinical sedation (95% probability of
achieving an OAA/S score ≤ 1) and adequate surgical analgesia (95% probability of no
movement response or hemodynamic response to a 50 mA tetanic electrical stimulation).
The panel on the bottom (Figure 4.6b) demonstrates the predictions of the AAI response
surface model (mean and standard deviation) at different concentration pairs along the
isoboles for adequate clinical sedation and surgical analgesia.

114
Figure 4.6
0 5 10 150
1
2
3
Remifentanil ng/mL
Se
vo
!u
ran
e %
V/V
EC95
P(OAAS ≤ 1)
EC95
P(Tol. 50 mA)
AAI
75-100
50-75
25-75
< 25
0 5 10 150
1
2
3
60(11)
55(10)
51(9)
47(9)
44(9)
42(9)
39(9)
62(11)
58(10)52(9)
45(9)
40(9)
37(9)
34(10)
32(10)
30(10)
29(10)
28(10)
49(9)
Remifentanil ng/mL
Se
vo
!u
ran
e %
V/V
EC95
P(OAAS ≤ 1)
EC95
P(Tol. 50 mA)

115
are overlaid onto the isoboles. These figures clearly demonstrate that the addition of
small amounts of remifentanil (2.5 ng•mL-1
) results in an increase in the target BIS and
AAI necessary to produce clinically adequate sedation or anesthesia (Figures 4.5b and
4.6b).
4.5 Discussion
In this study, we utilized the volunteer paradigm previously employed by our
laboratory25,33
and others27,40,41
to generate response surface models for two anatomically
distinct processed EEG parameters (BIS and AAI) during the concomitant administration
of a wide range of target concentration pairs of a prototypic potent volatile anesthetic,
sevoflurane, and a prototypic potent synthetic opioid, remifentanil. Although we had
previously demonstrated that remifentanil synergistically potentiates the sedative effects
of sevoflurane,33
we did not observe more than a mild, additive increase in BIS and AAI
with the addition of remifentanil to a sevoflurane anesthetic. The fact that the BIS and
AAI are both insensitive to the observed changes in the clinical sedation state produced
by the addition of a small to moderate dose of remifentanil to a sevoflurane anesthetics
suggests that sevoflurane-remifentanil anesthetics titrated to traditional BIS or AAI
targets would result in a deeper than predicted anesthetic state. With an estimated effect
site concentration of 5 ng•mL-1
of remifentanil (an infusion of approximately 0.2 µg•kg-
1•min
-1), no more than 1% sevoflurane is required to produce clinically adequate
anesthesia without any concern of explicit recall, and yet the BIS would > 65 and the
AAI would be > 40. Therefore, during sevoflurane-remifentanil anesthesia, targeting a
BIS < 60 or an AAI <30 may result in too deep of an anesthetic state. This work
identifies an important limitation of the currently available algorithms of two distinct
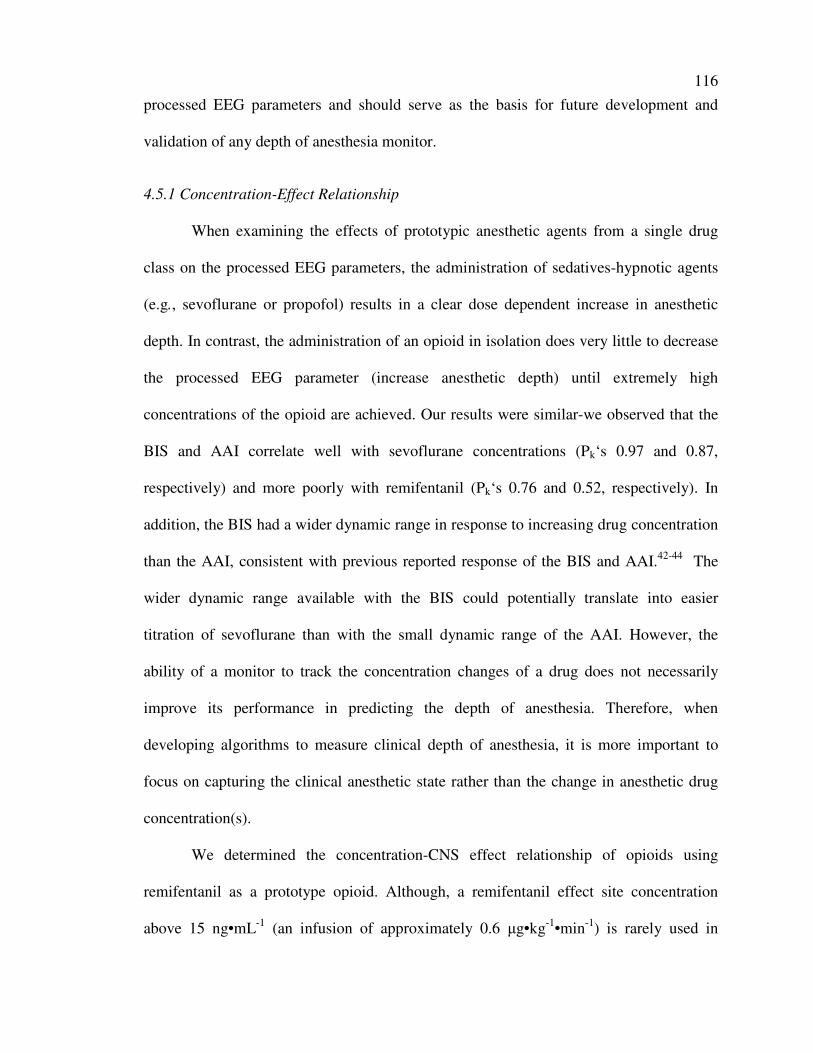
116
processed EEG parameters and should serve as the basis for future development and
validation of any depth of anesthesia monitor.
4.5.1 Concentration-Effect Relationship
When examining the effects of prototypic anesthetic agents from a single drug
class on the processed EEG parameters, the administration of sedatives-hypnotic agents
(e.g., sevoflurane or propofol) results in a clear dose dependent increase in anesthetic
depth. In contrast, the administration of an opioid in isolation does very little to decrease
the processed EEG parameter (increase anesthetic depth) until extremely high
concentrations of the opioid are achieved. Our results were similar-we observed that the
BIS and AAI correlate well with sevoflurane concentrations (Pk‘s 0.97 and 0.87,
respectively) and more poorly with remifentanil (Pk‘s 0.76 and 0.52, respectively). In
addition, the BIS had a wider dynamic range in response to increasing drug concentration
than the AAI, consistent with previous reported response of the BIS and AAI.42-44
The
wider dynamic range available with the BIS could potentially translate into easier
titration of sevoflurane than with the small dynamic range of the AAI. However, the
ability of a monitor to track the concentration changes of a drug does not necessarily
improve its performance in predicting the depth of anesthesia. Therefore, when
developing algorithms to measure clinical depth of anesthesia, it is more important to
focus on capturing the clinical anesthetic state rather than the change in anesthetic drug
concentration(s).
We determined the concentration-CNS effect relationship of opioids using
remifentanil as a prototype opioid. Although, a remifentanil effect site concentration
above 15 ng•mL-1
(an infusion of approximately 0.6 µg•kg-1
•min-1
) is rarely used in

117
clinical practice we sampled remifentanil concentrations up to 60 ng•mL-1
in an attempt
to rigorously capture the sedative effects of remifentanil. Within the clinical range, we
did not observe a clinically significant level of sedation with remifentanil. The variability
in BIS and AAI within this range was similar to that observed when volunteers did not
reach a clinical level of sedation with sevoflurane. At supra-clinical remifentanil
concentrations, remifentanil produced a clinically significant level of sedation; however,
this opioid induced sedation rarely approached an OAA/S score of 1. In addition,
increasing the level of clinical sedation with remifentanil did not alter the AAI although
the BIS decreased modestly. Our results are similar to previous reports that showed that
the processed EEG parameters are insensitive to opioids 9,28,29
within the clinical range.
4.5.2 Prediction Probability
Several previous reports have demonstrated that the BIS and the AAI are useful
surrogates of depth of anesthesia.3 The BIS showed less variation at each level of clinical
sedation than did the AAI (Figures 4.3a and 4.4b). This may be an intrinsic characteristic
of the arbitrary scaling of the AAI to have its operating range for general anesthesia
between 0-30, therefore, small changes in clinical state might result in a large (erroneous)
increase in AAI. An alternative explanation might be the fact that the brainstem auditory
pathways are well preserved during moderate levels of anesthetics resulting in an
increased sensitivity to ascending (sensory) signals.13,14
Finally, the increased variability
may simply be the result of the more primitive (and poorer performing) electromyogram
filtering algorithms available on the early model AAI compared to the more developed
BIS.

118
Our results are in agreement with previous reports that have demonstrated that the
BIS outperforms the AAI when evaluating the performances of the processed EEG
parameters utilizing Prediction Probabilities (Pk).18,45
However, prediction probabilities
are limited in that they report only the direction and the goodness of correlation between
the clinical sedation score and the processed EEG parameter- they do not give any feel to
whether the change in the parameter is large or small. Therefore, even though the
addition of remifentanil to a sevoflurane anesthetic resulted in a minor change in
processed EEG parameters that was underwhelming compared to the large change in
clinical sedation, the modest decrease in the prediction probabilities does not reflect the
inability of the BIS or the AAI to capture the observed clinical change.
4.5.3 Response Surface Models
As a complement to prediction probability analyses, response surfaces analysis
was used to study the pharmacodynamic effects of adding remifentanil to a sevoflurane
anesthetic. Response surface methods have been utilized to model the interactions
between varieties of combinations of anesthetics. Using the Greco form of the response
surfaces models, we were able to characterize the relationship between the effect site
concentrations of remifentanil, the end tidal concentrations, and the BIS with a low
amount of error (R2 > 0.8). The response surface model for AAI had moderately good
correlation (R2 > 0.8), with the poorer fit most likely related to the larger variability in the
response and the smaller operating range. The pharmacodynamic response surface
revealed that the addition of remifentanil decreased the BIS in a minor and additive
fashion, whereas the AAI response surface showed that AAI is not significantly affected
by the addition remifentanil. A possible explanation for this difference is that the

119
brainstem responses are relatively resistant to opioid effects46
while the cortical responses
are decreased with the inhibition of ascending sensory signals.47
In order to give clinical meaning to the predictions made by the response surface
models for processed EEG parameters, we utilized the Logit response surface models for
adequate sedation for general anesthesia (probability of providing an OAA/S score ≤ 1)
and for adequate analgesia for general anesthesia (probability of no movement of
hemodynamic response to a 50 mA electrical tetanic current) that were previously
described by our laboratory33
to generate 95%tile
isoboles. Then the predicted values for
the BIS (Figure 4.5b) and the AAI (Figure 4.6b) for a variety of target concentration pairs
of sevoflurane and remifentanil that lay on the two isoboles were calculated from the
response surface models generated in this manuscript. These figures demonstrate that
with the addition of a modest remifentanil effect site concentration of 5 ng•mL-1
(an
infusion of approximately 0.2 µg•kg-1
•min-1
), adequate sedation would be provided with a
BIS of 81 and an AAI of 57 and adequate general anesthesia would be provided with a
BIS of 65 and an AAI of 41- all values considerably higher than the usual target range of
either of the processed EEG parameters (BIS 40-60 and AAI 15-30). Therefore, the
inability of the two anatomically distinct processed EEG parameters to characterize the
increase in clinical sedation and the increase in clinical anesthetic depth brought about by
the addition of even modest doses of remifentanil to a sevoflurane anesthetic would result
in an overdose in the amount of sevoflurane administered and “too deep” of a clinical
anesthetic level being targeted (Figure 4.7).
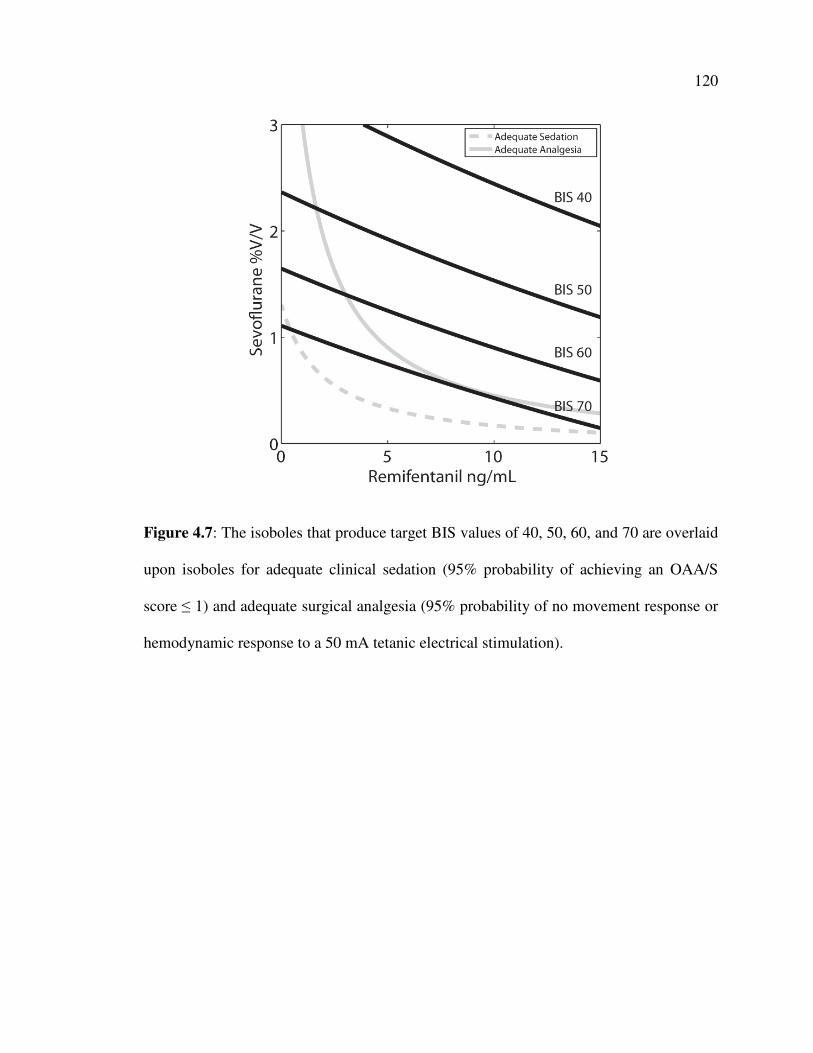
120
Figure 4.7: The isoboles that produce target BIS values of 40, 50, 60, and 70 are overlaid
upon isoboles for adequate clinical sedation (95% probability of achieving an OAA/S
score ≤ 1) and adequate surgical analgesia (95% probability of no movement response or
hemodynamic response to a 50 mA tetanic electrical stimulation).

121
4.5.4 Clinical Implications
The processed electroencephalogram (EEG) has emerged as an important
surrogate measure of the depth of anesthesia.9,48
Surrogate measures are employed when
the clinical drug effect of interest is difficult or impossible to measure. The processed
EEG has many characteristics of the ideal surrogate. In contrast to more clinically
oriented measures of drug effect, it is can be an objective, continuous, reproducible, non-
invasive, high resolution signal.3 It can also be used as an effect measure when an
experimental subject is unconscious, whereas many of the more clinically oriented
measurements require awake, cooperative subjects.49
The ability of the addition of even a small amount of synthetic opioid to decrease
the amount of potent volatile anesthetic required to produce clinically adequate
anesthesia has been reported in surgical patients using isobologram or dose reduction
analyses. Furthermore, previous work from our laboratory has demonstrated that the
addition of remifentanil to sevoflurane33
or propofol25
anesthetics results in a synergistic
increase in depth of anesthesia. In contrast, the lack of ability of the two processed EEG
parameters studied here to detect the increase in anesthetic depth produced by the
addition of even modest amounts of a synthetic opioid has been demonstrated with
isobologram analysis of surgical patients. Similar to our results here, response surface
analysis performed by Dahan, et al.,27
investigating the interaction of moderate levels of
alfentanil and sevoflurane anesthesia has shown that there is no increase in anesthetic
depth as measured by the BIS. Therefore, it would appear that despite the clinically
significant increase in the clinical sedation level and the anesthetic depth produced by the
addition of modest amounts of remifentanil to a sevoflurane anesthetic, there is minimal

122
effect of even supra-therapeutic doses of opioid on the depth of anesthesia measured by
the BIS and the AAI.
Our response surface models demonstrate that the targeting the familiar operating
range for the BIS of 40-60 would result in a 50-150% higher end tidal sevoflurane
concentration being administered than would be needed to provided clinically adequate
anesthesia if a modest dose of remifentanil (effect site concentration of 5 ng•mL-1
) was
administered (Figure 4.7). Besides the anticipated hemodynamic side effects expected
from this anesthetic overdose,21
if delivering too deep of an anesthetic (BIS < 40) results
in a reproducible increase in one year mortality,12
the resulting deep anesthesia could
have significant implications long after the perioperative period has ended. Therefore,
either new “context sensitive” operating ranges for the processed EEG parameters must
be derived to account for the unmeasured effects of the addition of varying doses of
opioids; a suitable easily usable “fudge factor” should be derived for adjusting the
measured processed EEG parameter for the opioid contribution; any anesthesiologist who
wanted to utilize a processed EEG parameter to titrate the administered anesthetic should
limit the administration of opioid to the emergence period as to avoid needing to calculate
the “corrected” BIS or AAI; or a monitor sensitive to the actual clinical conditions, with
or without opioids, needs to be developed. It is possible that the combination of real-time
pharmacokinetic-pharmacodynamic displays50
with the addition of the response surfaces
described here would be able to numerically and graphically provide anesthesiologists
with real time feedback as to the actual (predicted) clinical depth of anesthesia during a
balanced anesthetic. However, the lack of a ready solution suggests that the delivery of a
balanced anesthetic utilizing a closed loop controlled based on any of the conventional

123
processed EEG parameters could possibly result in clinically deeper anesthetics than
desired, especially if the algorithm attempts to utilize the unique pharmacokinetic and
pharmacodynamic characteristics of remifentanil to improve responsiveness and
pharmacologic control.51
Previously, we had identified “optimum” target combinations of sevoflurane and
remifentanil that provided adequate surgical anesthesia and minimized the time to
awakening.33
For anesthetics ranging in length between 0.5-24 hours, the target
sevoflurane concentration varied from 1.10-0.75% and the target remifentanil
concentration ranged from 4.1-6.1 ng•ml-1
(infusion rates of 0.15-0.22 µg•kg-1
•min-1
).
Targeting these optimum combinations would produce clinically adequate surgical
anesthesia with BIS (65-69) and AAI (41-46) higher than the normal operating ranges
suggested by the manufactures.
4.5.5 Limitations
The fact that our response surface models were determined in unstimulated
volunteers is a major constraint that may limit the applicability of our results. In
particular, the lack of constant stimulation from an endotracheal tube or the continuous
pain form a surgical incision may result in our volunteer data underestimating the
anesthetic requirements of surgical patients. However, the advantages of the volunteer
study paradigm to develop response surface models-key surgical stimulation can be
applied multiple times, repeated measurements can be made on the same subject, and the
entire dynamic range of anesthetic combinations can be examined, all without ethical
concerns of providing inadequate anesthesia during a surgical procedure, continues to
make the volunteer study paradigm popular.
124
The fact that we utilize pharmacokinetic models to predict the remifentanil effect
site concentration in lieu of measuring the actual blood drug concentration may
compound some of the variability in the opioid only, single drug data.52
However, as in
our previous study,33
there is convincing evidence to demonstrate that this may not be a
major source of pharmacokinetic variability. Another source of pharmacokinetic
variability may be the targeting of an end tidal alveolar pseudo-steady state of volatile
anesthetic instead of targeting the effect site concentration. The steady-state partial
pressure of the volatile anesthetic at the effect site correlates with the measured end tidal
alveolar partial pressure at steady state. However, achieving pseudo-steady state at the
alveoli results in an effect site concentration that would most likely not reach its own
pseudo-steady state. We did not choose to target a pseudo-steady state at the effect site
because we would have to assume a priori knowledge of which anatomic compartment
contained the pharmacologic effect site for sedation and for clinical anesthesia. Given the
fact that volatile anesthetics produce sedation through a supra-spinal site of action while
immobility is produced at the spinal cord level,53
the choice of effect site to target in the
pharmacokinetic simulations to determine when pseudo-steady state at the effect site is
achieved is one of many difficult assumptions that would be needed to construct an
accurate pharmacokinetic-pharmacodynamic model for sevoflurane. In addition, the time
involved in achieving a steady state alveolar concentration or a pseudo-steady state effect
site concentration would be prohibitively longer than that required to achieve alveolar
pseudo-steady state.
Although remifentanil induced hyperalgesia has been observed in the patients54
and volunteers55
receiving infusions of various durations, as detailed in our prior

125
manuscript,33
we did not find any differences between the baseline levels of tolerated
stimuli and the levels of stimuli tolerated at the lowest doses of sevoflurane. In addition,
one could conjecture that any opioid hyperalgesia that developed would not effect the
clinical sedation score (OAA/S) or the processed EEG parameters that were determined
during quiet periods prior to the determination of the analgesic response of each of the
targeted concentration pairs.
The Greco response surface model used to describe the response surface models
generated here is different than the Logit model utilized in the previous manuscripts from
our laboratory.33,56
Although the Logit model proved advantageous for the modelling of
stimuli whose responses can be dichotomized, the Greco model,37
along with the models
described by Minto57
and Bouillon,58
all handle continuous response variables (e.g.,
processed EEG parameters) extremely well. The main advantage of the Greco model is
that it assumes a sigmoidal Emax structure that is readily familiar to most readers of
pharmacodynamic modelling. The biggest limitation of the Greco model is that it cannot
account for a partial agonist-it presumes that remifentanil at sizeable concentrations will
produce a BIS or AAI of 0. This assumption causes a bias in the determination of the
response surface, however, because no model that accounts for partial agonists currently
exists, there is no way to overcome this limitation. Even with the assumption that Greco
model does not account for a partial agonist, by setting the CMAX, REMI at a high enough
value (i.e., 400 ng•mL-1
), the error in the response surface is not significantly large to
cause a change in model predictions.

126
4.5.6 Conclusions
Although clinical sedation increases significantly with the addition of a small to
moderate dose of remifentanil to a sevoflurane anesthetic, the BIS and AAI are
insensitive to this change in clinical state. Therefore, during sevoflurane-remifentanil
anesthesia, targeting a BIS < 60 or an AAI <30 may result in too deep of an anesthetic
state. If providing “too deep” of an anesthetic state produces undesirable side effects,
such as intraoperative hemodynamic instability or an increase in one year mortality,
correcting the measured processed EEG parameter to account for the actual measured
clinical anesthetic depth would be required to prevent these undesirable side effects. As a
first step, by superimposing the isobolograms for adequate surgical anesthesia and
adequate sedation on top of the isobolograms for various targets values for BIS or AEP, a
figure is developed that can be utilized to make crude clinical adjustments to either the
combination of sevoflurane and remifentanil administered or the targeted BIS or AEP
value necessary to produce the desired clinical depth of anesthesia (Figure 4.7).
Incorporation of these response surfaces into a real-time, pharmacokinetic-
pharmacodynamic display system50
may allow more precise concentration pairs or target
adjustments.
4.6 References
1. Practice Advisory for Intraoperative Awareness and Brain Function
Monitoring: A Report by the American Society of Anesthesiologists Task Force on
Intraoperative Awareness. Anesthesiology 2006; 104: 847-64
2. Sebel PS, Bowdle TA, Ghoneim MM, Rampil IJ, Padilla RE, Gan TJ,
Domino KB: The incidence of awareness during anesthesia: a multicenter United States
study. Anesth Analg 2004; 99: 833-9, table of contents
3. Rampil IJ: A primer for EEG signal processing in anesthesia.
Anesthesiology 1998; 89: 980-1002

127
4. Stoelting RK, Longnecker DE, Eger EI, 2nd: Minimum alveolar
concentrations in man on awakening from methoxyflurane, halothane, ether and
fluroxene anesthesia: MAC awake. Anesthesiology 1970; 33: 5-9
5. Eger EI, 2nd, Saidman LJ, Brandstater B: Minimum alveolar anesthetic
concentration: a standard of anesthetic potency. Anesthesiology 1965; 26: 756-63
6. Roizen MF, Horrigan RW, Frazer BM: Anesthetic doses blocking
adrenergic (stress) and cardiovascular responses to incision--MAC BAR. Anesthesiology
1981; 54: 390-8
7. Glass PS, Gan TJ, Howell S, Ginsberg B: Drug interactions: volatile
anesthetics and opioids. J Clin Anesth 1997; 9: 18S-22S
8. Kalkman CJ, Drummond JC: Monitors of depth of anesthesia, quo vadis?
Anesthesiology 2002; 96: 784-7
9. Glass PS, Bloom M, Kearse L, Rosow C, Sebel P, Manberg P: Bispectral
analysis measures sedation and memory effects of propofol, midazolam, isoflurane, and
alfentanil in healthy volunteers. Anesthesiology 1997; 86: 836-47
10. Myles PS, Leslie K, McNeil J, Forbes A, Chan MT: Bispectral index
monitoring to prevent awareness during anaesthesia: the B-Aware randomised controlled
trial. Lancet 2004; 363: 1757-63
11. Song D, Joshi GP, White PF: Titration of volatile anesthetics using
bispectral index facilitates recovery after ambulatory anesthesia. Anesthesiology 1997;
87: 842-8
12. Monk TG, Saini V, Weldon BC, Sigl JC: Anesthetic management and
one-year mortality after noncardiac surgery. Anesth Analg 2005; 100: 4-10
13. Schwender D, Conzen P, Klasing S, Finsterer U, Poppel E, Peter K: The
effects of anesthesia with increasing end-expiratory concentrations of sevoflurane on
midlatency auditory evoked potentials. Anesth Analg 1995; 81: 817-822
14. Plourde G, Belin P, Chartrand D, Fiset P, Backman SB, Xie G, Zatorre RJ:
Cortical processing of complex auditory stimuli during alterations of consciousness with
the general anesthetic propofol. Anesthesiology 2006; 104: 448-57
15. Schwender D, Klasing S, Madler C, Poppel E, Peter K: Depth of
anesthesia. Midlatency auditory evoked potentials and cognitive function during general
anesthesia. Int Anesthesiol Clin 1993; 31: 89-106

128
16. Schwender D, Daunderer M, Mulzer S, Klasing S, Finsterer U, Peter K:
Midlatency auditory evoked potentials predict movements during anesthesia with
isoflurane or propofol. Anesth Analg 1997; 85: 164-73
17. Schwender D, Golling W, Klasing S, Faber-Zullig E, Poppel E, Peter K:
Effects of surgical stimulation on midlatency auditory evoked potentials during general
anaesthesia with propofol/fentanyl, isoflurane/fentanyl and flunitrazepam/fentanyl.
Anaesthesia 1994; 49: 572-8
18. Struys MM, Jensen EW, Smith W, Smith NT, Rampil I, Dumortier FJ,
Mestach C, Mortier EP: Performance of the ARX-derived auditory evoked potential
index as an indicator of anesthetic depth: a comparison with bispectral index and
hemodynamic measures during propofol administration. Anesthesiology 2002; 96: 803-
16
19. Katoh T, Suzuki A, Ikeda K: Electroencephalographic derivatives as a tool
for predicting the depth of sedation and anesthesia induced by sevoflurane.
Anesthesiology 1998; 88: 642-50
20. Schwender D, Faber-Zullig E, Klasing S, Poppel E, Peter K: Motor signs
of wakefulness during general anaesthesia with propofol, isoflurane and
flunitrazepam/fentanyl and midlatency auditory evoked potentials. Anaesthesia 1994; 49:
476-84
21. Zbinden AM, Petersen-Felix S, Thomson DA: Anesthetic depth defined
using multiple noxious stimuli during isoflurane/oxygen anesthesia. II. Hemodynamic
responses. Anesthesiology 1994; 80: 261-7
22. Eger EI, 2nd, Shafer SL: Tutorial: context-sensitive decrement times for
inhaled anesthetics. Anesth Analg 2005; 101: 688-96, table of contents
23. Kissin I: General anesthetic action: an obsolete notion? Anesth Analg
1993; 76: 215-8
24. Vuyk J: Pharmacokinetic and pharmacodynamic interactions between
opioids and propofol. J Clin Anesth 1997; 9: 23S-26S
25. Kern SE, Xie G, White JL, Egan TD: A response surface analysis of
propofol-remifentanil pharmacodynamic interaction in volunteers. Anesthesiology 2004;
100: 1373-81
26. Olofsen E, Sleigh JW, Dahan A: The influence of remifentanil on the
dynamic relationship between sevoflurane and surrogate anesthetic effect measures
derived from the EEG. Anesthesiology 2002; 96: 555-64
129
27. Dahan A, Nieuwenhuijs D, Olofsen E, Sarton E, Romberg R, Teppema L:
Response surface modeling of alfentanil-sevoflurane interaction on cardiorespiratory
control and bispectral index. Anesthesiology 2001; 94: 982-91
28. Guignard B, Menigaux C, Dupont X, Fletcher D, Chauvin M: The effect
of remifentanil on the bispectral index change and hemodynamic responses after
orotracheal intubation. Anesth Analg 2000; 90: 161-7
29. Iselin-Chaves IA, Flaishon R, Sebel PS, Howell S, Gan TJ, Sigl J,
Ginsberg B, Glass PS: The effect of the interaction of propofol and alfentanil on recall,
loss of consciousness, and the Bispectral Index. Anesth Analg 1998; 87: 949-55
30. Heck M, Kumle B, Boldt J, Lang J, Lehmann A, Saggau W:
Electroencephalogram bispectral index predicts hemodynamic and arousal reactions
during induction of anesthesia in patients undergoing cardiac surgery. J Cardiothorac
Vasc Anesth 2000; 14: 693-7
31. Koitabashi T, Johansen JW, Sebel PS: Remifentanil
dose/electroencephalogram bispectral response during combined propofol/regional
anesthesia. Anesth Analg 2002; 94: 1530-3, table of contents
32. Lysakowski C, Dumont L, Pellegrini M, Clergue F, Tassonyi E: Effects of
fentanyl, alfentanil, remifentanil and sufentanil on loss of consciousness and bispectral
index during propofol induction of anaesthesia. Br J Anaesth 2001; 86: 523-7
33. Manyam SC, Gupta DK, Johnson KB, White JL, Pace NL, Westenskow
DR, Egan TD: Opiod-Volatile Anesthetic Synergy: A Response Surface Model with
Remifentanil and Sevoflurane as Prototypes. Anesthesiology 2006: in press
34. Short TG, Ho TY, Minto CF, Schnider TW, Shafer SL: Efficient trial
design for eliciting a pharmacokinetic-pharmacodynamic model-based response surface
describing the interaction between two intravenous anesthetic drugs. Anesthesiology
2002; 96: 400-8
35. Chernik DA, Gillings D, Laine H, Hendler J, Silver JM, Davidson AB,
Schwam EM, Siegel JL: Validity and reliability of the Observer's Assessment of
Alertness/Sedation Scale: study with intravenous midazolam. J Clin Psychopharmacol
1990; 10: 244-51
36. Smith WD, Dutton RC, Smith NT: Measuring the performance of
anesthetic depth indicators. Anesthesiology 1996; 84: 38-51
37. Greco WR, Bravo G, Parsons JC: The search for synergy: a critical review
from a response surface perspective. Pharmacol Rev 1995; 47: 331-85
130
38. Jacquez JA, Perry T: Parameter estimation: local identifiability of
parameters. Am J Physiol 1990; 258: E727-36
39. Glantz SA, Slinker KK: 2nd Edition. Primer of Applied Regression and
Analysis of Variance 2001
40. Vuyk J: Clinical interpretation of pharmacokinetic and pharmacodynamic
propofol-opioid interactions. Acta Anaesthesiol Belg 2001; 52: 445-51
41. Minto CF, Schnider TW, Short TG, Gregg KM, Gentilini A, Shafer SL:
Response surface model for anesthetic drug interactions. Anesthesiology 2000; 92: 1603-
16
42. Ekman A, Brudin L, Sandin R: A comparison of bispectral index and
rapidly extracted auditory evoked potentials index responses to noxious stimulation
during sevoflurane anesthesia. Anesth Analg 2004; 99: 1141-6, table of contents
43. Alpiger S, Helbo-Hansen HS, Vach W, Ording H: Efficacy of A-line AEP
Monitor as a tool for predicting acceptable tracheal intubation conditions during
sevoflurane anaesthesia. Br J Anaesth 2005; 94: 601-6
44. Alpiger S, Helbo-Hansen HS, Vach W, Ording H: Efficacy of the A-line
AEP monitor as a tool for predicting successful insertion of a laryngeal mask during
sevoflurane anesthesia. Acta Anaesthesiol Scand 2004; 48: 888-93
45. Kreuer S, Bruhn J, Larsen R, Buchinger H, Wilhelm W: A-line, bispectral
index, and estimated effect-site concentrations: a prediction of clinical end-points of
anesthesia. Anesth Analg 2006; 102: 1141-6
46. Schwender D, Rimkus T, Haessler R, Klasing S, Poppel E, Peter K:
Effects of increasing doses of alfentanil, fentanyl and morphine on mid-latency auditory
evoked potentials. Br. J. Anaesth. 1993; 71: 622-628
47. Morley AP, Derrick J, Seed PT, Tan PE, Chung DC, Short TG: Isoflurane
dosage for equivalent intraoperative electroencephalographic suppression in patients with
and without epidural blockade. Anesth Analg 2002; 95: 1412-8, table of contents
48. Gan TJ, Glass PS, Windsor A, Payne F, Rosow C, Sebel P, Manberg P:
Bispectral index monitoring allows faster emergence and improved recovery from
propofol, alfentanil, and nitrous oxide anesthesia. BIS Utility Study Group.
Anesthesiology 1997; 87: 808-15
49. Leslie K, Sessler DI, Smith WD, Larson MD, Ozaki M, Blanchard D,
Crankshaw DP: Prediction of movement during propofol/nitrous oxide anesthesia.
Performance of concentration, electroencephalographic, pupillary, and hemodynamic
indicators. Anesthesiology 1996; 84: 52-63

131
50. Syroid ND, Agutter J, Drews FA, Westenskow DR, Albert RW, Bermudez
JC, Strayer DL, Prenzel H, Loeb RG, Weinger MB: Development and evaluation of a
graphical anesthesia drug display. Anesthesiology 2002; 96: 565-75
51. Struys MM, Mortier EP, De Smet T: Closed loops in anaesthesia. Best
Pract Res Clin Anaesthesiol 2006; 20: 211-20
52. Avram MJ, Krejcie TC: Using front-end kinetics to optimize target-
controlled drug infusions. Anesthesiology 2003; 99: 1078-86
53. Rampil IJ, Mason P, Singh H: Anesthetic potency (MAC) is independent
of forebrain structures in the rat. Anesthesiology 1993; 78: 707-12
54. Crawford MW, Hickey C, Zaarour C, Howard A, Naser B: Development
of Acute Opioid Tolerance During Infusion of Remifentanil for Pediatric Scoliosis
Surgery. Anesth Analg 2006; 102: 1662-1667
55. Angst MS, Koppert W, Pahl I, Clark DJ, Schmelz M: Short-term infusion
of the mu-opioid agonist remifentanil in humans causes hyperalgesia during withdrawal.
Pain 2003; 106: 49-57
56. Gupta DK, Manyam SC, Johnson KB, White JL, Pace NL, Westenskow
DR, Egan TD: Does the Ideal Combination of Remifentanil and Propfol Change with the
Duration of Surgery? Anesthesiology 2006: submitted
57. Minto C, Vuyk J: Response surface modelling of drug interactions. Adv
Exp Med Biol 2003; 523: 35-43
58. Bouillon TW, Bruhn J, Radulescu L, Andresen C, Shafer TJ, Cohane C,
Shafer SL: Pharmacodynamic interaction between propofol and remifentanil regarding
hypnosis, tolerance of laryngoscopy, bispectral index, and electroencephalographic
approximate entropy. Anesthesiology 2004; 100: 1353-72

CHAPTER 5
PROCESSED EEG SIGNALS AS INDICATORS OF
INADEQUATE ANESTHESIA §
5.1 Abstract
5.1.1 Background
The processed auditory evoked potential (AAI, Danmeter, Odense, Denmark)
and the Bispectral Index (BIS, Aspect Medical Systems, Newton, MA) of the
electroencephalogram are two mechanistically different technologies used to assess the
functional depression of the central nervous system during general anesthesia. The aim of
this study was to compare how the AAI and BIS perform in response to noxious
stimulation in volunteers who are profoundly sedated. This study examines the possibility
of using the AAI and BIS monitors intraoperatively to detect patient responses to
stimulation under inadequate anesthesia.
5.1.2 Methods
After obtaining institutional approval and informed consent, twenty two healthy
adult male and female volunteers were enrolled. Volunteers received a combination of
opioid (remifentanil, REMI) and hypnotic drug (sevoflurane, SEVO or propofol, PROP)
§ Will be submitted for review in Anesthesia & Analgesia, July 2006. Will be published in
Anesthesia & Analgesia pending review. Original article titled: “The auditory evoked
potential and bispectral index: A comparison of signal performance during clinically
inadequate anesthesia.”

133
at various target concentration pairs spanning the entire clinical spectrum (i.e. REMI 0-80
ng•mL-1
(computer controlled infusion), PROP 0-7.5 mcg•mL-1
(computer controlled
infusion) and end-tidal SEVO ranging from 0-7% atm). AAI, BIS, and heart rate were
digitally acquired throughout the experiment. Baseline AAI and BIS values were
recorded after volunteers reached steady-state drug levels. A series of randomly applied
experimental pain stimuli (pressure algometry on the leg to 50 psi, electrical tetany on the
leg to 50 mAmps, and thermal stimuli on the forearm to 50° C) were used to assess the
level of anesthesia. Response to stimulation was defined as withdrawal movement or a
heart rate increase of 20%. The magnitude and time course of AAI and BIS changes in
the first minute after volunteer response were considered the outcome of interest.
Artifactual corrupted AAI and BIS signals (movement artifact, etc.) were not analyzed.
For volunteers with OAAS <= 1 (i.e., subjects sedated as during general anesthesia), the
magnitude of the change in the AAI and the BIS values were plotted versus time to
examine the signal response in patients with and without adequate anesthesia, as assessed
by heart rate change and withdrawal movement in response to stimulation.
5.1.3 Results
All 22 subjects completed the experiment. The temporal profiles of AAI and BIS
values showed responses at a latency of 40 and 50 seconds respectively. For volunteers
with sedation scores equivalent to loss of conscious response(OAAS >= 1) both the AAI
and the BIS values showed robust responses when there was a heart rate or withdrawal
movement response to experimental pain stimuli. In those subjects in whom there were
no responses to pain, the AAI and BIS values showed no change compared to
prestimulation values.

134
5.1.4 Discussion
In this observational study, application of experimental pain measures to
volunteers receiving various combinations of remifentanil and sevoflurane producing
sedation scores equivalent to adequate anesthesia (OASS <= 1) resulted in robust
increases in the AAI and BIS values only in those volunteers who showed other signs of
inadequate anesthesia-withdrawal movement or increase in heart rate.
5.2 Introduction
Clinicians often depend on unreliable, nonspecific measures of anesthetic effect 1
such as hemodynamics, reflexes to stimuli, spontaneous respiration rate, etc. to determine
the level of anesthetic effect. To use these methods the clinician is dependent on a
number of factors such as training, experience and availability of intraoperative
monitoring methods. Some measures such as blood pressure are rarely available on a
continuous basis intraoperatively. Hemodynamic responses are often affected by the
presence of vasoactive and ionotropic drugs.2 A practical, more reliable method is needed
to determine patient responses to inadequate anesthesia. Such methodology would
improve intraoperative monitoring, enable more accurate drug administration, and may
eventually lead to closed loop computer controlled drug delivery.3,4
Processed EEG parameters are gaining popularity as intraoperative monitors of
depth of anesthesia.5 One such example, the Bispectral Index (BIS, Aspect Medical
Systems, Newton, MA), is based on Bispectral analysis of the EEG.6 The propriety BIS
algorithm was a unique step forward in the use of EEG parameters to determine
anesthetic depth because it combined multiple distinct EEG parameters and a large

135
volume of prospectively collected clinical observations into a single descriptive variable
which was then prospectively tested and validated.5
During general anesthesia, the brainstem and the midbrain auditory function is
preserved, although meaningful interpretation of the auditory stimulus is inhibited.7,8
These brainstem responses to an auditory stimulus correlate with motor signs of
wakefulness and intraoperative awareness.9 The preservation of brainstem responses that
correlate with inadequate anesthesia (movement or awareness) suggests that the auditory
evoked potential (AEP) might be more robust in detecting inadequate anesthesia as
opposed to the EEG which solely monitors the cortical activity.10,11
The A-Line AEP
Index (AAI, Danmeter, Odense, Denmark) is the first commercially available monitor
that utilizes changes within the AEP to measure the depth of anesthesia.12
Like the BIS,
the AAI correlates well with the clinical level of sedation produced by increasing doses
of sevoflurane7,13
or propofol.6,14
The principle aim of this study was to measure AAI and BIS responses to
stimulation in volunteers who were clinically sedated. We use multimodal experimental
pain measures to elicit movement or heart rate responses in volunteers anesthetized using
a combination of sevoflurane and remifentanil or propofol or remifentanil. The
magnitude and latency of BIS and AAI responses were estimated off line. We
hypothesized that the responses shown by processed EEG parameters (BIS and AAI) are
comparable to traditional markers of inadequate anesthesia such as increased heart rate or
movement. In addition, we hypothesized that the modality of stimulus, i.e., thermal,
electrical and mechanical, did bias the responses shown by processed EEG parameters.

136
5.3 Materials and Methods
A portion of the data from this data set were published previously in a manuscript
examining the synergistic interaction between remifentanil and sevoflurane in producing
clinical sedation and analgesia to experimental painful stimuli that are surrogates for
intraoperative painful stimuli.15
Because of the minor overlap between the hypotheses of
the previous and the current manuscript and the large amount of data reported in each
manuscript, each analysis is reported in a separate manuscript.
A written informed consent document that was approved by the Human
Institutional Review Board at the University of Utah Health Sciences Center (Salt Lake
City, Utah) was obtained from each of 24 volunteers in this open-label, randomized,
parallel group crisscross designed study to asses drug interactions (Figure 5.1).16
Each
volunteer was randomized to receive a target controlled infusion of remifentanil
(predicted effect site concentrations of 0.5-15 ng•mL-1
) or target controlled infusion of
propofol (predicted effect site concentrations of 0.5-7.5 mcg•mL-1
) or sevoflurane (0.3-6
vol % end tidal alveolar concentration) as the primary agent with the other drug acting as
the secondary agent (Figure 5.1). Five minutes after achieving the targeted effect-site
concentration (or stable end-tidal concentration) for a primary drug “step,” a battery of
pharmacodynamic assessments were made. Effect measures included the Observer’s
Assessment of Alertness/Sedation score (OAA/S)17
and three surrogates for surgical
stimulus- pressure algometry and tetanic electrical stimulation, as previously described
by Kern,18
and thermal stimulation.
The reader is referred to the previous manuscript by Manyam, et al.,15
for
complete details regarding the methods of volunteer preparation, drug administration, and

137
Figure 5.1: A schematic summary of the data collection and analysis. At each target
concentration pair, baseline measurements of AAI and BIS were determined by averaging
monitor indices in a 40 second time window (upper panel). Responses were elicited by
gradually increasing stimulus level in until the volunteers showed signs of discomfort
(20% increase in heart rate or a movement response). A safety limit of stimulation was
defined to prevent long term pain that could confound successive measurements (middle
panel). The AAI and BIS signals in the response time window (bottom panel) were used
for data analysis. Time “zero” in the response time window corresponds to the time at
which the volunteers responded in case of “responders” or the time at which the safety
limit was reached in the case of “non responders”.

138
Figure 5.1

139
data collection. Because the methods of data analysis and statistical analysis have
substantial differences from the previous manuscript, they are provided in complete
detail.
5.3.1 Baseline BIS and AAI Measurements
To avoid variability arising from hysteresis between plasma concentration and
effect site, BIS and AAI were measured at each assessment point five minutes after the
targeted effect-site concentration (or stable end-tidal concentration) for a primary drug
“step,” was reached. The processed EEG parameters were averaged in a 40 second
interval that preceded the assessment of the Observer’s Assessment of Alertness/Sedation
score (OAA/S).17
This interval was also considered a “quiet time” where no other
changes or assessments were made in the volunteers. Data resulting from faulty sensors
or monitor malfunction were not included in the subsequent analyses.
5.3.2 Demographic Data Analysis
Demographic data for the volunteers in each group were compared utilizing an
unpaired, two-sided t-test using StatView version 5.0.1 (SAS Institute, Inc., Cary, NC)
with P < 0.05 considered significant. All demographic data were reported as means with
standard deviations.
5.3.3 Definition of Volunteer Responses
Volunteer responses to stimulation were defined as a movement and/ or a 20%
increase in heart rate.

140
5.3.4 Time Series Analysis
The protocol for determining responses in processed EEG parameters is outlined
in Figure 5.1. AAI and BIS signals stored were time aligned with the patient responses.
Time zero represents the time at which the volunteers responded to stimulation or the
maximal permissible stimulus was reached. Signal analysis was performed using
MATLAB (MathWorks Inc., Natick, MA). The magnitude of the response was defined as
the percentage change from the baseline assessment. The Percent change is defined as the
following:
( ) BISorAEPBISorAEPBISorAEP BaselineBaselineStimXngePercentCha /100 −=
The latency of responses was identified by time-averaging all the responses. The
window in which the percentage change of the processed EEG parameters exceeded
baseline variation was defined as the “Time-Window”. The average signal within this
time window was used in comparing responses across stimuli and comparing responses in
volunteers who were awake from those who were sedated.
5.4 Results
All 22 volunteers completed the study. The demographics of volunteers are shown
in Table 5.1.
The time course of AAI and BIS signal changes is shown in Figure 5.2 and Figure
5.3. The percent change at 30 seconds prior to volunteer response, the time of response (0
sec.), 30 and 60 seconds after the response are represented by the box plots. The central
line indicates the median value and the whiskers indicate 10 and 90% intervals. The
average response, computed by averaging all signals within the response time window is
shown in as a gray trace in Figure 5.2 and Figure 5.3. An unpaired t-test indicated that
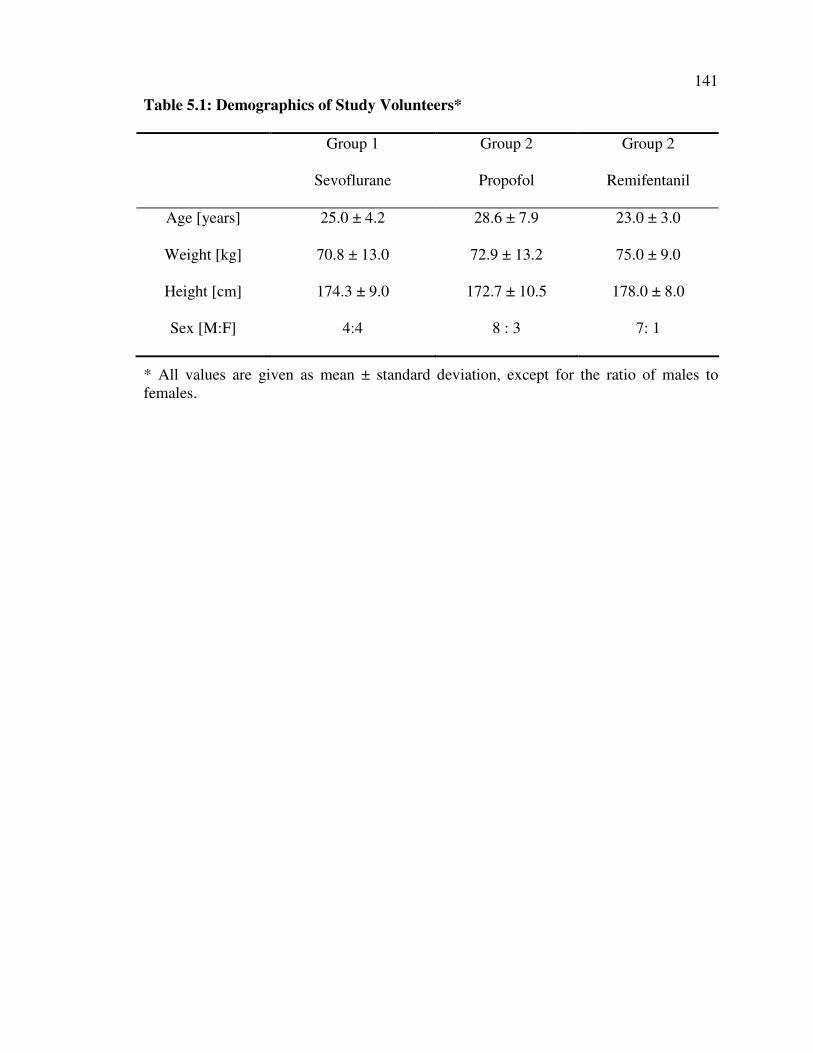
141
Table 5.1: Demographics of Study Volunteers*
Group 1
Sevoflurane
Group 2
Propofol
Group 2
Remifentanil
Age [years] 25.0 ± 4.2 28.6 ± 7.9 23.0 ± 3.0
Weight [kg] 70.8 ± 13.0 72.9 ± 13.2 75.0 ± 9.0
Height [cm] 174.3 ± 9.0 172.7 ± 10.5 178.0 ± 8.0
Sex [M:F] 4:4 8 : 3 7: 1
* All values are given as mean ± standard deviation, except for the ratio of males to
females.

142
Figure 5.2: A box plot showing the time course of AAI response to stimulation. The
average signal change is shown by the gray trace. The upper panel shows the AAI signal
change in volunteers who showed signs of discomfort when stimulated. The bottom panel
shows percent change AAI signal change in volunteers who showed no signs of
discomfort. Filled circles indicate outlier data.
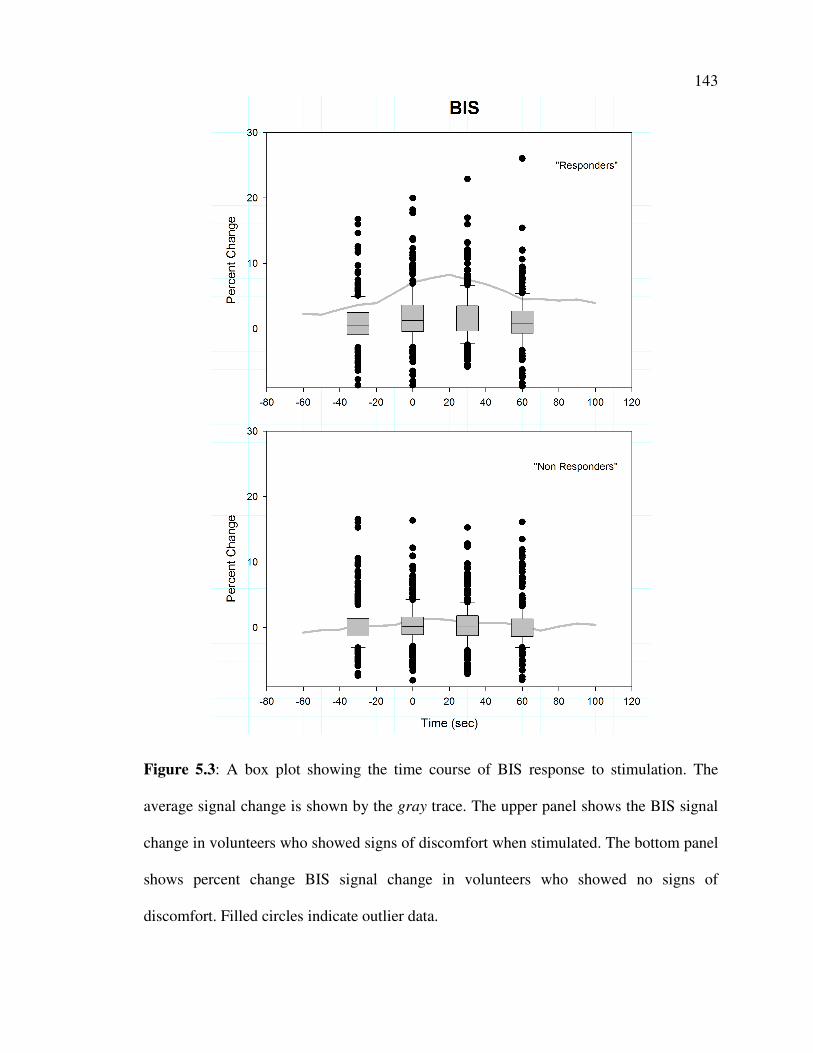
143
Figure 5.3: A box plot showing the time course of BIS response to stimulation. The
average signal change is shown by the gray trace. The upper panel shows the BIS signal
change in volunteers who showed signs of discomfort when stimulated. The bottom panel
shows percent change BIS signal change in volunteers who showed no signs of
discomfort. Filled circles indicate outlier data.

144
responders and non responders differed with a significance values of < 0.01 for AAI and
<0.001 for BIS. The latency of responses was defined as the average time at which the
signal increased more that two standard deviations from its mean value.
5.4.1 Sedated vs. Awake volunteers
Signal responses in volunteers who did not have a clinical level of sedation, i.e.,
OAA/S >=2 volunteers were not oblivious to shaking, were compared against those who
were sedated to level at which they did not respond to shaking prior to stimulation. The
average percent change indicated in Figure 5.4 indicates larger changes in the signal in
volunteers who were awake than sedated.
5.4.2 Modality of Stimulus
Signal responses were compared during stimulation with multiple experimental
pain measures, attempted laryngoscopy and OAA/S assessment (Figure 5.5). The
monitors showed no preference to a particular stimulus modality although laryngoscopy,
considered a much more intense form of stimulation than other experimental showed the
largest change.
5.5 Discussion
In this study, we utilized the volunteer paradigm previously employed by our
laboratory15,18
and others19-21
to elicit responses to stimulation at varying levels of
anesthesia. Processed EEG parameters (BIS and AAI) were recorded during stimulation
using a variety of experimental pain measures and attempted laryngoscopy. The average
change in processed EEG parameter differed in those volunteers that exhibited movement
or heart rate increases in response to stimulation from those volunteers that did not
respond to stimulation. The changes in processed EEG signals were observed with in a

145
Figure 5.4: A box plot comparing signal responses in sedated (OAA/S <=1, or loss of
responsiveness to shaking and shouting) and awake (OAA/S >=2, or responsive to
shouting) volunteers. The upper and lower panels show AAI and BIS responses
respectively. Data is only shown for volunteers who responded to stimulation. Filled
circles indicate outlier data.

146
Figure 5.5: A box plot comparing signal responses among different stimuli. OAA/S
assessment, a predominantly auditory stimulus was considered to see if it produced any
change in signals. Data is only shown for volunteers who responded to stimulation. Filled
circles indicate outlier data.

147
reasonable latency (30-40 seconds) from the actual volunteer response. These results
suggest that processed EEG monitoring could provide a potential advantage if used
during surgery to predict patient’s anesthetic state when traditional markers of inadequate
5.5 Discussion
In this study, we utilized the volunteer paradigm previously employed by our
laboratory15,18
and others19-21
to elicit responses to stimulation at varying levels of
anesthesia. Processed EEG parameters (BIS and AAI) were recorded during stimulation
using a variety of experimental pain measures and attempted laryngoscopy. The average
change in processed EEG parameter differed in those volunteers that exhibited movement
or heart rate increases in response to stimulation from those volunteers that did not
respond to stimulation. The changes in processed EEG signals were observed with in a
reasonable latency (30-40 seconds) from the actual volunteer response. These results
suggest that processed EEG monitoring could provide a potential advantage if used
during surgery to predict patient’s anesthetic state when traditional markers of inadequate
anesthesia such as heart rate, blood pressure and movement can not be used. Although the
results show an easily observable change in the processed EEG parameters, the results
also showed large baseline variations the signals that may result to poor confidence in
changes that actually result from inadequate anesthesia. This work identifies an important
limitation of the currently available algorithms of two distinct processed EEG parameters
and should serve as the precursor for future development and validation of any depth of
anesthesia monitor.

148
5.5.1 Limitations
One of limitations in our study design is that a gradually increasing stimulus was
used as opposed to using a constant level of stimulus and changing the anesthetic depth to
elicit a response. While this approach is a closer replicate of inadequate anesthesia during
a typical surgical procedure, such a study design may prove difficult in a volunteer
setting. Changing the anesthetic depth in a step wise manner such that a response is
observed may expose the volunteers to a greater level of discomfort than necessary.
Anesthesia is best described as a “yes/no” phenomenon which can be described as a
probability; a graded change in the level of anesthesia may not be feasible.
A further limitation of our study design was that the surrogate pain stimuli used to
measure the analgesic response in volunteers is only a surrogate of intra-operative
surgical pain. By including a range of experimental pain stimuli to cover the range
expected during a surgical procedure, it is probable that the most stimulating intra-
operative events-surgical incision and laryngoscopy-could have been recreated in the
volunteer laboratory. However, since surgical patients can not be deliberately subject to
conditions that create inadequate anesthesia, volunteer studies are essential to allow the
collection of the high quality data needed to achieve the goal of determining monitor
response characteristics during inadequate anesthesia.
5.5.2 Conclusions
Processed EEG monitors such as, AAI and BIS showed robust responses only in
those volunteers who showed other signs of inadequate anesthesia-withdrawal movement
or increase in heart rate. Response latency of 20-60 seconds was observed. Although AAI
149
showed larger response amplitude when compared BIS, the large baseline variability in
the signal may limit its application as a monitor to detect inadequate anesthesia.
5.6 References
1. Schneider G, Sebel PS: Monitoring depth of anaesthesia. Eur J
Anaesthesiol Suppl 1997; 15: 21-8
2. Berne RM, Levy MN: Physiology. Fourth Edition, Mosby 1998
3. Locher S, Stadler KS, Boehlen T, Bouillon T, Leibundgut D, Schumacher
PM, Wymann R, Zbinden AM: A new closed-loop control system for isoflurane using
bispectral index outperforms manual control. Anesthesiology 2004; 101: 591-602
4. Glass PS, Rampil IJ: Automated anesthesia: fact or fantasy?
Anesthesiology 2001; 95: 1-2
5. Rampil IJ: A primer for EEG signal processing in anesthesia.
Anesthesiology 1998; 89: 980-1002
6. Glass PS, Bloom M, Kearse L, Rosow C, Sebel P, Manberg P: Bispectral
analysis measures sedation and memory effects of propofol, midazolam, isoflurane, and
alfentanil in healthy volunteers. Anesthesiology 1997; 86: 836-47
7. Schwender D, Conzen P, Klasing S, Finsterer U, Poppel E, Peter K: The
effects of anesthesia with increasing end-expiratory concentrations of sevoflurane on
midlatency auditory evoked potentials. Anesth Analg 1995; 81: 817-822
8. Plourde G, Belin P, Chartrand D, Fiset P, Backman SB, Xie G, Zatorre RJ:
Cortical processing of complex auditory stimuli during alterations of consciousness with
the general anesthetic propofol. Anesthesiology 2006; 104: 448-57
9. Schwender D, Klasing S, Madler C, Poppel E, Peter K: Depth of
anesthesia. Midlatency auditory evoked potentials and cognitive function during general
anesthesia. Int Anesthesiol Clin 1993; 31: 89-106
10. Schwender D, Daunderer M, Mulzer S, Klasing S, Finsterer U, Peter K:
Midlatency auditory evoked potentials predict movements during anesthesia with
isoflurane or propofol. Anesth Analg 1997; 85: 164-73
11. Schwender D, Golling W, Klasing S, Faber-Zullig E, Poppel E, Peter K:
Effects of surgical stimulation on midlatency auditory evoked potentials during general
anaesthesia with propofol/fentanyl, isoflurane/fentanyl and flunitrazepam/fentanyl.
Anaesthesia 1994; 49: 572-8

150
12. Struys MM, Jensen EW, Smith W, Smith NT, Rampil I, Dumortier FJ,
Mestach C, Mortier EP: Performance of the ARX-derived auditory evoked potential
index as an indicator of anesthetic depth: a comparison with bispectral index and
hemodynamic measures during propofol administration. Anesthesiology 2002; 96: 803-
16
13. Katoh T, Suzuki A, Ikeda K: Electroencephalographic derivatives as a tool
for predicting the depth of sedation and anesthesia induced by sevoflurane.
Anesthesiology 1998; 88: 642-50
14. Schwender D, Faber-Zullig E, Klasing S, Poppel E, Peter K: Motor signs
of wakefulness during general anaesthesia with propofol, isoflurane and
flunitrazepam/fentanyl and midlatency auditory evoked potentials. Anaesthesia 1994; 49:
476-84
15. Manyam SC, Gupta DK, Johnson KB, White JL, Pace NL, Westenskow
DR, Egan TD: Opiod-Volatile Anesthetic Synergy: A Response Surface Model with
Remifentanil and Sevoflurane as Prototypes. Anesthesiology 2006: in press
16. Short TG, Ho TY, Minto CF, Schnider TW, Shafer SL: Efficient trial
design for eliciting a pharmacokinetic-pharmacodynamic model-based response surface
describing the interaction between two intravenous anesthetic drugs. Anesthesiology
2002; 96: 400-8
17. Chernik DA, Tucker M, Gigli B, Yoo K, Paul K, Laine H, Siegel JL:
Validity and reliability of the Neurobehavioral Assessment Scale. J Clin
Psychopharmacol 1992; 12: 43-8
18. Kern SE, Xie G, White JL, Egan TD: A response surface analysis of
propofol-remifentanil pharmacodynamic interaction in volunteers. Anesthesiology 2004;
100: 1373-81
19. Vuyk J: Clinical interpretation of pharmacokinetic and pharmacodynamic
propofol-opioid interactions. Acta Anaesthesiol Belg 2001; 52: 445-51
20. Minto CF, Schnider TW, Short TG, Gregg KM, Gentilini A, Shafer SL:
Response surface model for anesthetic drug interactions. Anesthesiology 2000; 92: 1603-
16
21. Dahan A, Nieuwenhuijs D, Olofsen E, Sarton E, Romberg R, Teppema L:
Response surface modeling of alfentanil-sevoflurane interaction on cardiorespiratory
control and bispectral index. Anesthesiology 2001; 94: 982-91

CHAPTER 6
SUMMARY AND CONCLUSIONS
This dissertation is broadly aimed at improving anesthetic drug management
within the operating room. The dissertation contains two approaches to meet this goal.
The specific aims of the two approaches are to (1) determine the combined
pharmacodynamic effect caused by opioids and hypnotic drugs and prescribe a safe and
efficient combination that will meet the needs of a general patient population and (2)
provide anesthesiologists with real-time feedback of the patient’s anesthetic state thus
enabling them to identify outliers and improve accuracy of drug titration.
6.1 Summary
The first specific aim is addressed by Chapters 2 and 3. The results can be
summarized as follows:
• A volunteer study was conducted to determine the interaction between a
commonly used volatile hypnotic drug (sevoflurane) and a commonly used opioid
(remifentanil). Analgesia and sedation were quantified at various concentrations
of the two drugs by using surrogate measures. Response surface models were
used to describe interaction between the two drugs. The response surfaces enable
us to predict the probability of being sedated and tolerating painful stimulus in a
patient belonging to a general patient population.

152
• The response surfaces were combined with pharmacokinetic models to determine
efficient and safe combinations of remifentanil and sevoflurane that could directly
applied to anesthetic practice. Optimal combinations were also prescribed for a
variety of anesthetic procedure lengths.
• Response surface models were used to describe the interaction between an
intravenous hypnotic drug (propofol) and an opioid (remifentanil). Data that was
previously reported in a manuscript was combined with data from a new set of
volunteers to create models that predict the probability of being sedated and
tolerating painful stimulus in a patient belonging to a general patient population.
These response surface models were combined with combined with
pharmacokinetic models to determine efficient and safe combinations of
remifentanil and propofol that could be used in anesthetic practice.
The second specific aim is addressed by Chapters 3 and 4. The results can be
summarized as follows:
• A volunteer study was conducted to determine the relation between the outputs of
real-time monitors that are surrogates of central nervous system effect, drug
concentration and the true state of sedation. The linearity of the monitor was
described qualitatively by using graphs and quantitatively by prediction
probabilities.
• Processed EEG parameters (e.g., BIS and AAI) were used to characterize the
interaction between a hypnotic drug (sevoflurane) and opioid (remifentanil).
Response surface models were used to suggest processed EEG targets that can be
associated with adequate sedation and analgesia.
153
• Movement and heart rate increase during surgery, often associated with
inadequate anesthesia, is compared to responses observed in processed EEG
parameters by means of a volunteer study. Specifically, the latency of the monitor
response and magnitude are reported. Responses in volunteers that were deeply
sedated were compared against those in volunteers who did not have adequate
sedation.
6.2 Conclusions
The conclusions that support the first specific aim are as follows:
• Response surface analyses demonstrate a synergistic interaction between opioids
(remifentanil) and hypnotic volatile anesthetics (sevoflurane) for sedation and all
analgesic endpoints. We found that the addition of remifentanil to sevoflurane
profoundly reduced the amount of sevoflurane needed to produce sedation and
analgesia.
• Pharmacodynamic models can accurately predict the analgesic and sedative
effects produced by the administration of hypnotic drugs and opioids. We found
that response surface models such as the logit model capture population
pharmacodynamics with high fidelity.
• It is possible to determine, through simulation, combinations of hypnotics and
opioids that provide clinically adequate anesthesia and result in the most rapid
emergence from anesthesia. We designed and implemented techniques that
combine the pharmacokinetic and pharmacodynamic models to identify strategic
combinations of opioids and hypnotic drugs that ensure adequate anesthesia while
simultaneously minimizing the time to emerge from the anesthetic procedure.

154
• Pharmacokinetic advantages of fast acting opioids (remifentanil) over intravenous
hypnotic drugs (propofol) would result in higher opioid concentrations being
targeted as the duration of the anesthetic increased.
The conclusions that support the second specific aim are as follows:
• Processed EEG monitors correlate well with hypnotic drug concentrations and
level of sedation when a single drug is used. We observed that BIS and AAI
monitors correlate well with the concentration of the hypnotic drug.
• Processed EEG monitors do not represent the level of sedation when two drugs
(opioid and hypnotic) are used to provide anesthesia. We observed that BIS and
AAI monitors are largely insensitive to the increase in sedative effect produced.
This may potentially lead to overdose in clinical practice if the drugs are titrated
by using processed EEG monitors. We address this limitation by suggesting target
processed EEG monitor indices that correlate with adequate analgesia and
sedation.
• Responses of under anesthetized patients to painful stimuli may be detected by
processed EEG monitors. We test the potential future application of processed
EEG monitors in detecting patient responses to stimulation when traditional
markers such as heart rate and movement are obscured by the presence of
vasoactive drugs or drugs that produce neuromuscular blockade.
6.3 Impact
The broad impact of the two specific aims is to improve the accuracy with which
anesthetic drugs are dosed while still maintaining a strict regard for the safety of the
155
patient. The clinical implications that are discussed at the end of chapters 2, 3, 4 and 5
may be summarized by the following statements.
• The presence of a modest amount of opioid may decrease the amount of hypnotic
drug needed to produce sedation by several fold.
• Model based drug dose recommendations will ensure balanced anesthesia intra-
operatively and speed up emergence post-operatively.
• The application of such dose recommendations will lead to greater patient safety
and reduced operating costs.
• Processed EEG monitors can improve drug delivery by measuring individual
patient response to drugs. This enables the identification of outlier patients
thereby minimizing the adverse events associated with over dose or under dose of
anesthetic drugs
• Several potential limitations of the monitors are identified. This enables clinicians
to better understand the operating characteristics of these monitors. This also
serves as guide to the future development of depth of anesthesia monitors.
6.4 Future Work
The current work examines a quantitative and empirical approach to improving
anesthetic drug delivery and clinical outcomes. Traditional anesthetic “recipes” are
gradually becoming obsolete as researchers show the benefit of an empirically derived,
model based approach to anesthesia. Some concepts that are part of this dissertation such
as response surface models seek to quantify anesthetic effect. This improves safety and
emergence by enabling precise titration of the drug that is targeted to reach the desired
level of effect rather than “more than adequate” approach to drug dosing. As improved
156
methods to quantify anesthetic effect become available and as interactions among the
entire plethora of drugs used in anesthetic practice are reported we face obvious
questions, such as, how do we practically utilize such multidimensional information to
improve clinical outcomes? One approach to this challenge that our laboratory as well as
other scientists have taken is to develop information displays that combine patient’s
physiologic data with population models in an intuitive manner. The secondary use of
quantifying anesthetic effect among combinations of drugs is in drug dose optimization.
Drug dose suggestions commonly accompany the packages in which drugs are dispensed.
They rarely contain recommendations on combined use with other drugs. The choice of
drug combination is often based on training and experience with the said combination.
Offline drug dose optimization combines desired positive clinical outcomes such as
adequate anesthesia, fast induction, fast emergence and minimum amount of drug use
with negative outcomes such as, respiratory depression, hyper(or hypo) variable cardio
vascular system, nausea and memory loss, to identify a drug dose and combination that
provides the maximum therapeutic benefit. Such an optimization technique can also
provide economic advantages by utilizing cheaper drugs (which often corresponds to
drugs with slower kinetics and greater side effects) strategically. Drug dose optimization
may offer the greatest advantage in countries where modern drugs are prohibitively
expensive or unavailable.