methods of assessing human health vulnerability and public health
TRANSCRIPT
Health and Global Environmental ChangeSER IES No. 1
UNEP
Methods of assessing human health vulnerability and public health adaptation to climate change
WMO

Health and Global Environmental ChangeSER IES No. 1
UNEP
Methods of assessing human health vulnerability and public health adaptation to climate change
WMO
Lead authors:
Sari Kovats,Kristie L. Ebi and Bettina Menne
Contributing authors:
Diarmid Campbell-Lendrum,Osvaldo F. Canziani,Andrew Githeko,Katrin Kuhn,David Le Sueur,Pim Martens,Anthony J. McMichael,Anna Rosa Moreno,Jonathan Patz,Dieter Riedel,Joel Scheraga,Elisabeth Seymour,Michael Sharpe and Roger Street
Steering Committee:
Carlos Corvalan,Hiremagalur Gopalan,Buruhani Nyenzi and Jacinthe Seguin
2
Abstract
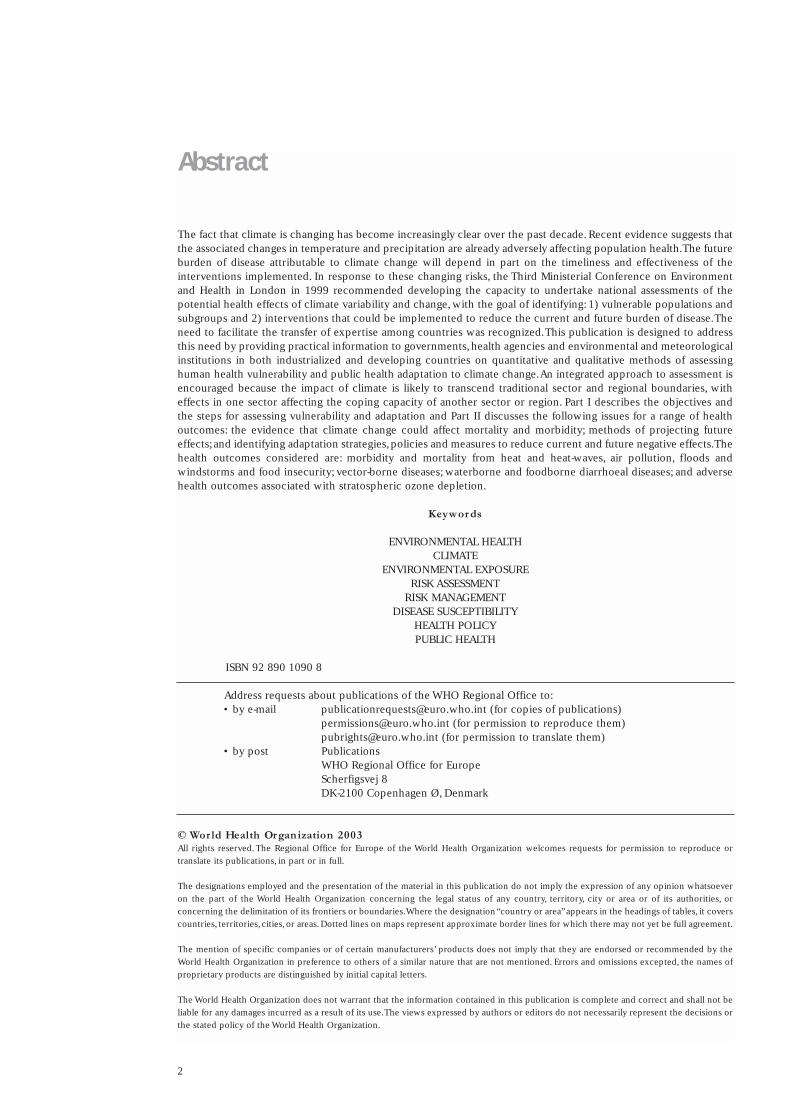
The fact that climate is changing has become increasingly clear over the past decade. Recent evidence suggests thatthe associated changes in temperature and precipitation are already adversely affecting population health.The futureburden of disease attributable to climate change will depend in part on the timeliness and effectiveness of theinterventions implemented. In response to these changing risks, the Third Ministerial Conference on Environmentand Health in London in 1999 recommended developing the capacity to undertake national assessments of thepotential health effects of climate variability and change, with the goal of identifying: 1) vulnerable populations andsubgroups and 2) interventions that could be implemented to reduce the current and future burden of disease.Theneed to facilitate the transfer of expertise among countries was recognized.This publication is designed to addressthis need by providing practical information to governments,health agencies and environmental and meteorologicalinstitutions in both industrialized and developing countries on quantitative and qualitative methods of assessinghuman health vulnerability and public health adaptation to climate change.An integrated approach to assessment isencouraged because the impact of climate is likely to transcend traditional sector and regional boundaries, witheffects in one sector affecting the coping capacity of another sector or region. Part I describes the objectives andthe steps for assessing vulnerability and adaptation and Part II discusses the following issues for a range of healthoutcomes: the evidence that climate change could affect mortality and morbidity; methods of projecting futureeffects; and identifying adaptation strategies,policies and measures to reduce current and future negative effects.Thehealth outcomes considered are: morbidity and mortality from heat and heat-waves, air pollution, floods andwindstorms and food insecurity; vector-borne diseases; waterborne and foodborne diarrhoeal diseases; and adversehealth outcomes associated with stratospheric ozone depletion.
Keywor ds
ENVIRONMENTAL HEALTHCLIMATE
ENVIRONMENTAL EXPOSURERISK ASSESSMENT
RISK MANAGEMENTDISEASE SUSCEPTIBILITY
HEALTH POLICYPUBLIC HEALTH
ISBN 92 890 1090 8
Address requests about publications of the WHO Regional Office to:• by e-mail [email protected] (for copies of publications)
[email protected] (for permission to reproduce them)[email protected] (for permission to translate them)
• by post PublicationsWHO Regional Office for EuropeScherfigsvej 8DK-2100 Copenhagen Ø, Denmark
© Wor ld Health Or ganization 2003All rights reserved. The Regional Office for Europe of the World Health Organization welcomes requests for permission to reproduce or
translate its publications, in part or in full.
The designations employed and the presentation of the material in this publication do not imply the expression of any opinion whatsoever
on the part of the World Health Organization concerning the legal status of any country, territory, city or area or of its authorities, or
concerning the delimitation of its frontiers or boundaries.Where the designation “country or area”appears in the headings of tables, it covers
countries, territories, cities, or areas.Dotted lines on maps represent approximate border lines for which there may not yet be full agreement.
The mention of specific companies or of certain manufacturers’ products does not imply that they are endorsed or recommended by the
World Health Organization in preference to others of a similar nature that are not mentioned. Errors and omissions excepted, the names of
proprietary products are distinguished by initial capital letters.
The World Health Organization does not warrant that the information contained in this publication is complete and correct and shall not be
liable for any damages incurred as a result of its use.The views expressed by authors or editors do not necessarily represent the decisions or
the stated policy of the World Health Organization.

3
Contents
FOREWORD 4
PREFACE 6
ACKNOWLEDGEMENTS 7
PART I. CONTEXT 9
1. Introduction 102. Vulnerability and adaptation to climate change: key concepts 163. The framework for the assessment 29
PART II. METHODS AND TOOLS 37
4. Quantitative health impact assessment 405. Direct effects of heat and heat-waves 546. Air pollution 597. Disasters: floods and windstorms 638. Vector-borne diseases 689. Waterborne and foodborne diarrhoeal diseases 8510. Stratospheric ozone depletion 8811. Food security 9112. Vulnerable populations 94
REFERENCES 96
ANNEX 1. KEY TERMS USED IN THIS REPORT 105
ANNEX 2. SOURCES OF DATA AND INFORMATION 106

4
Climate change is one of several unprecedented, large-scale, environmental changes that are affectingour planet.These changes reflect the overload of several of the Earth’s biophysical and ecologicalsystems caused by the combined impact of growing human population and economic activities.Environmental changes are now affecting the whole planet and disrupting earth’s life-supportingmechanisms, but the extent to which this affects human well-being and health varies substantially indifferent parts of the world.
Many research activities have been carried out in recent years to improve understanding of climatechange patterns as well as their effects on human health.Thanks to this extensive effort, these changescan now be better understood and scenarios for the future developed that allow the policycommunity to identify adequate strategies for response and adaptation.
In general, climate change does not and will not cause novel environmental exposure, but globalwarming and the increasing variability of weather patterns will tend to intensify the effects of climate-related environmental determinants of health. For instance, as Europe has experienced during thefloods in 2002 and the heat-waves in 2003, climate change will increase the number and intensity ofextreme weather events.This will cause excess death, injury, disability and disease. It is now time toidentify these health effects on the population and to plan and take appropriate measures to preventthe effects, especially among the most vulnerable groups.
At the WHO Third Ministerial Conference on Environment and Health in London in 1999, countriesrecommended developing the necessary capacity to undertake national health assessment ofvulnerability and adaptation to climate change with the aims of identifying the vulnerability ofpopulations and subgroups and ensuring the necessary transfer of expertise among countries.
This publication is a response to this call. It is a result of an extensive consultation process involvingmany institutions. It provides an overview of the methods available to assess vulnerability to climatechange and includes practical, real-life information for governments, health agencies andenvironmental and meteorological institutions in both industrialized and developing countries.We hope that the world community will take the necessary steps to address the causes of climatechange. In the mean time, we are confident that this work will help public authorities at all levels toidentify and implement measures that will facilitate adaptation to climate change and protect humanpopulations from the most serious and preventable health effects in each context.
Foreword
Roberto Bertollini
DirectorDivision of Technical Support Health Determinants
WHO Regional Office for Europe
5
Foreword
There is growing evidence that global climate is changing and will have profound effects on thehealth and well-being of citizens in countries throughout the world.As the climate changes in Canada,we may experience more extreme weather events, an increase in contamination of our air, water andfood and a greater number of emerging infectious diseases. Other countries may find themselves to beanticipating even greater risks than this.As a result, Health Canada, together with departments ofhealth in other countries, will need to have a better understanding of the health effects expectedfrom climate change and of those who may be the most vulnerable in our respective societies inorder to be able to manage the risks.
For many countries, adapting to the effects of climate change will necessitate strengthening existingcapacity and applying new approaches to examining the risks associated with a changing climate andincreased climate variability. For health departments, this also means an increasing need to collaboratewith other sectors of society that can play a critical role in managing the risks to health and well-being. Expanding national and international partnerships, particularly cross-sectoral ones, needs to besupported by a solid base of evidence and knowledge of the health effects and vulnerability resultingfrom a changing environment.
Health Canada is pleased to contribute to ongoing efforts aimed at adapting to climate change byproviding a report that outlines the tools and methods available to conduct vulnerability andadaptation assessments in a manner that is adaptable to all levels of development.We hope thatcountries will find the content useful in their efforts to identify the health concerns that will requiretheir attention in the coming years.
My Department looks forward to using the publication as we examine more closely the climatechange related health effects which are of concern in Canada. Health Canada has appreciated theopportunity to work closely with WHO and other international experts in developing this publicationand would like to thank all collaborators for their dedication over the past 2 years.
Paul Glover
Director GeneralSafe Environments Programme
Health Canada

6
This publication provides practical information to governments, health agencies and environmental andmeteorological institutions in both industrialized and developing countries on how to assessvulnerability and adaptation to climate variability and change at the regional, national and local levels.Flexible methods and tools are described to achieve better understanding of the current and futurevulnerability of specific populations.This will help institutions and agencies to identify appropriate andeffective adaptation strategies, policies and measures.
The proposed methods and tools are designed to fit into current international frameworks for assessingthe potential impact of environmental change on sectors other than health.This includes the guidanceprovided by the Intergovernmental Panel on Climate Change (IPCC) for assessing the impact of andadaptation to climate change, developing scenarios and dealing with uncertainty.
In presenting this publication,WHO,Health Canada,UNEP and WMO offer governments and their healthagencies an opportunity to join a wider collaborative effort to identify and develop strategies forreducing the potential health impact of an emerging worldwide environmental problem that willprofoundly affect all of us.
Finally, we dedicate this publication to the memory of David Le Sueur.
Carlos Corvalan, Hiremagalur Gopalan, Buruhani Nyenzi and Jacinthe Seguin
Preface
7
The process of developing this publication started in 2001, thanks to the financial, scientific andtechnical contribution of Health Canada. Bettina Menne from the WHO Regional Office for Europecoordinated the overall development of this publication, the numerous meetings, the writing processand the review process in close cooperation with Dieter Riedel, Jacinthe Seguin, Michael Sharpe andAnita Walker from Health Canada. Carlos Corvalan from WHO, Hiremagalur Gopalan from UNEP andBuruhani Nyenzi from WMO advised throughout the whole process.
Sari Kovats (Centre on Global Change and Health, London School of Hygiene and Tropical Medicine,United Kingdom), Kristie L. Ebi (Global Change and Health,WHO Regional Office for Europe; currentlyExponent Health Group, USA) and Bettina Menne (Global Change and Health,WHO Regional Office forEurope) were the main authors.
The coordinator, authors and advisers would like to thank the following for contributing text: DiarmidCampbell-Lendrum, WHO, Geneva, Switzerland; Osvaldo F. Canziani, Co-chair, Working Group II of theIntergovernmental Panel on Climate Change, Buenos Aires, Argentina; Andrew Githeko, Kenya MedicalResearch Institute (KEMRI), Nairobi, Kenya; Katrin Kuhn, London School of Hygiene and TropicalMedicine, United Kingdom; David Le Sueur, National Malaria Research Programme, Medical ResearchCouncil Durban, Congella, South Africa; Pim Martens, International Centre for Integrative Studies,Universiteit Maastricht, the Netherlands; Anthony J. McMichael, National Centre for Epidemiology andPopulation Health, Australian National University, Canberra, Australia; Anna Rosa Moreno, MexicoFoundation for Sciences, Mexico City, Mexico; Jonathan Patz, Director, Program on Health Effects ofGlobal Change, Department of Environmental Health Sciences, Bloomberg School of Public Health,TheJohns Hopkins University, Baltimore, MD, USA; Dieter Riedel, Climate Change and Health Office, HealthyEnvironments and Consumer Safety Branch, Health Canada, Ottawa, Canada; Joel Scheraga, United StatesEnvironmental Protection Agency,Washington, DC, USA; Elisabeth Seymour, Healthy Environments andConsumer Safety Branch, Health Canada, Ottawa, Canada; Michael Sharpe, Climate Change and HealthOffice, Healthy Environments and Consumer Safety Branch, Health Canada, Ottawa, Canada; and RogerStreet,Adaptation and Impacts Research Group, Meteorological Service of Canada, Environment Canada,Ottawa, Canada.
The coordinator, authors and advisers would like to thank the following people for the very usefulsuggestions, advice and assistance received during the several years during which this publication wasprepared and for participating in several meetings: Houssain Abouzaid, WHO Regional Office for theEastern Mediterranean,Cairo,Egypt;Martha Anker,WHO,Geneva,Switzerland;Elaine Barrow,EnvironmentCanada, Ottawa, Canada; Rachid Bessaoud, Oran,Algeria; Åke Blomqvist, Health Canada, Ottawa, Canada;Robert Boss,WHO,Geneva,Switzerland; José Calheiros, Institute Ciências Biomédicas,Porto,Portugal;ElsaCasimiro, SIAM Project, Lisbon, Portugal; Aline Chiabai, Fondazione Eni Enrico Mattei, Milan, Italy; LigiaCastro de Doens, Cathalac Centre de Aqua del Tropico Humedo para America Latina y el Caribe, PanamaCity, Panama; Franck De Gruijl, Dermatology, University Medical Center Utrecht, the Netherlands; CarlosDora,WHO, Geneva, Switzerland; Gretel Gambarelli, Fondazione Eni Enrico Mattei, Milan, Italy;VladimirKendrovski,Republic Institute for Health Protection, Skopje,The former Yugoslav Republic of Macedonia;Richard J.T. Klein, Potsdam Institute for Climate Impact Research, Germany; Paul Llanso,WMO, Geneva,Switzerland; Pierrette Miron, Health Canada, Ottawa, Canada; Charles Nhachi, WHO Regional Office forAfrica, Brazzaville, Congo; Dorbrene O’Marde, Ministry of Health, St Johns, Antigua and Barbuda; AnnaPaldy, National Institute of Environmental Health, Budapest, Hungary; Olga Pilifosova, United NationsFramework Convention for Climate Change, Bonn, Germany; Peter Scholefield, WMO, Geneva,Switzerland; Emilio Sempris, National Programme on Climate Change, National Environmental Authority,Panama City,Panama;Paul Sockett,Health Canada,Ottawa,Canada;Colin L.Soskolne,University of Alberta,Edmonton,Alberta, Canada; Elisaveta Stikova, Republic Institute for Health Protection, Skopje,The formerYugoslav Republic of Macedonia; Joel Tickner, Lowell Center for Sustainable Production, University ofMassachusetts, Lowell, MA, USA; Peter Toft, Pan American Health Organization, Washington, DC, USA;
Acknowledgements
8
Thomas Voigt, European Environment Agency, Copenhagen, Denmark; and Anita Walker, Health Canada,Ottawa, Canada.
We received comments from the following reviewers: Shaheeda Adam, Maldives Water and SanitationAuthority, Malé, Maldives; Göran Aner, Swedish National Food Administration, Uppsala, Sweden; SergioBonini, Institute of Neurobiology and Molecular Medicine, Rome, Italy; Marianne Boysen, SwedishNational Food Administration, Uppsala, Sweden; Paulo Ortiz Bulto, Centro Nacional del Clima, Institutode Meteorología, Havana, Cuba; Tanja Cegnar, Hydrometeorological Institute of Slovenia, Ljubljana,Slovenia; Dominique Charron, Population Public Health Branch, Health Canada, Ottawa, Canada;Bernhard Clot, MeteoSwiss, Zurich, Switzerland; Marlies Craig, Medical Research Lead Programme,Medical Research Council, Durban, South Africa; Eva Falck, National Institute for Public Health,Stockholm Sweden; Hans-Martin Fuessel, Potsdam Institute for Climate Impact Research, Germany;Carmen Galan, University of Córdoba, Spain; Pierre Gosselin, Institut nationale de santé publique duQuébec, Québec City, Canada; Simon Hales, University of Otago, New Zealand; Leif Hansen, Ministry ofHealth and Social Affairs, Stockholm, Sweden; Max Harry, HERRY Consult GmbH,Vienna,Austria; BrittaHedlund, Swedish Environment Protection Agency, Stockholm, Sweden; Baggier Hidayatov, Ministry ofEcology and Natural Resources, Baku,Azerbaijan; Mike Hulme, University of East Anglia, Norwich, UnitedKingdom; Rozlan Ishak, Ministry of Health, Kuala Lumpur, Malaysia;Thomas Jaenson, Uppsala University,Sweden; Gerd Jendritzky, Deutscher Wetterdienst, Freiburg, Germany; Michinori Kabuto, NationalInstitute for Environmental Studies, Ibaraki, Japan; Christina Koppe, Deutscher Wetterdienst, Freiburg,Germany; Andy Kusi-Appiah, Health Canada, Ottawa, Canada; Kuulo Kutsar, Health ProtectionInspectorate, Tallinn, Estonia; Roland Lindqvist, Swedish National Food Administration, Stockholm,Sweden; Wieslaw Magdzik, National Institute of Hygiene, Warsaw, Poland; Chantal Maheu, Health CareSystem Division, Health Canada, Ottawa, Canada; Leslie Malone, World Climate Programme, WMO,Geneva, Switzerland; Jim McIlwee, United Kingdom Climate Impacts Programme, London; BarbMcKinnon, New Brunswick Lung Association, Fredericton, Canada; Michele Monteil, Faculty of MedicalSciences, University of the West Indies, St.Augustine,Trinidad and Tobago;Torsten Naucke, Institute forMedical Parasitology, University of Bonn, Germany; Ragnar Norrby, Swedish Institute for InfectiousDisease Control, Solna, Sweden; Maggie Opondo, University of Nairobi, Kenya; Bo Petersson, Unit forHealth Protection, National Board of Health and Welfare, Stockholm, Sweden; Karen Polson, CaribbeanEpidemiology Centre, Port of Spain, Trinidad and Tobago; Samuel Rawlins, Caribbean EpidemiologyCentre, Port of Spain,Trinidad and Tobago; Jeff Scott, Nova Scotia Health Department, Halifax, Canada;Emilio Sempris, National Programme on Climate Change, National Environmental Authority, CATHALAC,Panama City, Panama; Andriy M. Serdyuk, Marzwyev Institute for Hygiene and Medical Ecology of theAcademy of Medical Sciences, Kiev, Ukraine; Colin Soskolne, University of Alberta, Edmonton, Canada;Leena Srivastava, Energy and Resources Institute (TERI), New Delhi, India; Goh Kee Tai, Ministry ofHealth,Singapore;Frank C.Tanser,Malaria Research Lead Programme,Medical Research Council,Durban,South Africa; Pat Troop, Health Protection Agency, London, United Kingdom; Stephan Weiland, Universityof Ulm, Germany; Magnus Wickman, National Institute of Environmental Medicine, Karolinska Institute,Stockholm, Sweden; Tania Wolf and Ken Wright, Department of Environment, Food & Rural Affairs,London, United Kingdom.
We thank David Breuer for excellent text editing and Emilio Dotto - Edb&Rdb for layout and graphicdesign and Roberto del Balzo for cover photo. Phil Jones kindly provided Fig. 1.1, Frank C.Tanser Fig. 8.2and Neil de Wet Fig. 8.3.
This publication was printed by Colombo, Rome, Italy.
9
PART 1. CONTEXT
1. Introduction
2. Vulnerability and adaptation to climate change: key concepts
3. The framework for the assessment
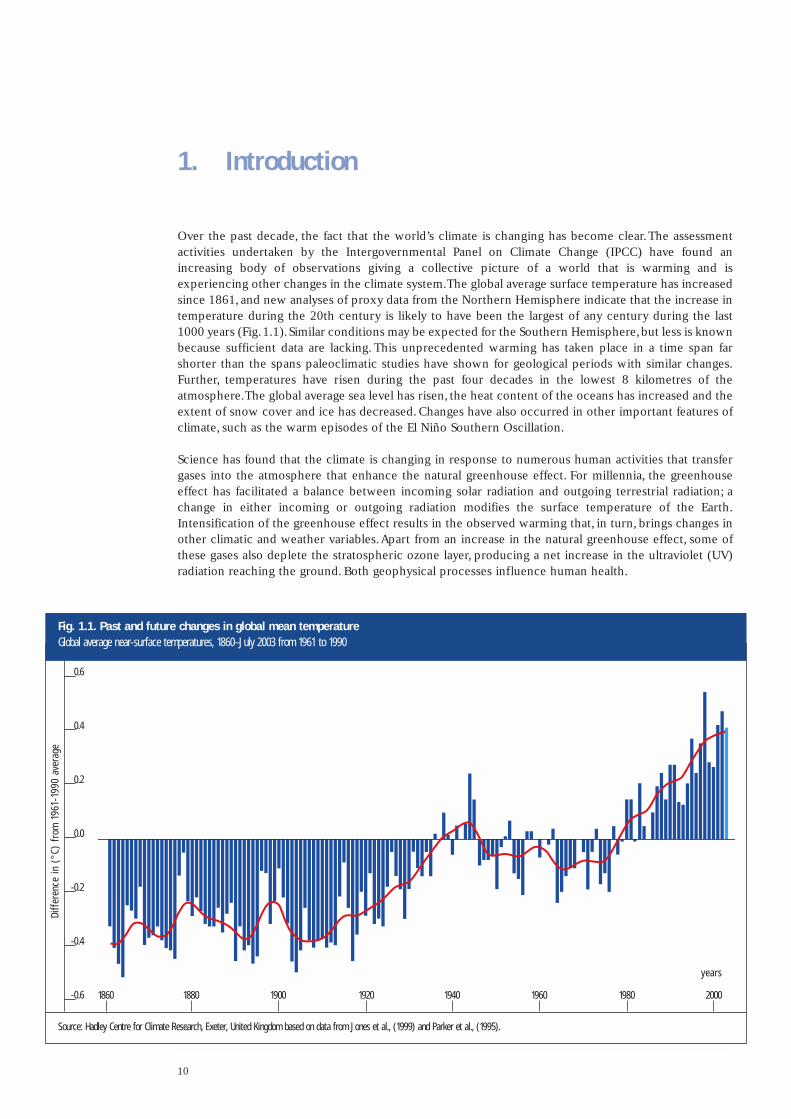
Over the past decade, the fact that the world’s climate is changing has become clear.The assessmentactivities undertaken by the Intergovernmental Panel on Climate Change (IPCC) have found anincreasing body of observations giving a collective picture of a world that is warming and isexperiencing other changes in the climate system.The global average surface temperature has increasedsince 1861, and new analyses of proxy data from the Northern Hemisphere indicate that the increase intemperature during the 20th century is likely to have been the largest of any century during the last1000 years (Fig.1.1).Similar conditions may be expected for the Southern Hemisphere,but less is knownbecause sufficient data are lacking. This unprecedented warming has taken place in a time span farshorter than the spans paleoclimatic studies have shown for geological periods with similar changes.Further, temperatures have risen during the past four decades in the lowest 8 kilometres of theatmosphere.The global average sea level has risen, the heat content of the oceans has increased and theextent of snow cover and ice has decreased. Changes have also occurred in other important features ofclimate, such as the warm episodes of the El Niño Southern Oscillation.
Science has found that the climate is changing in response to numerous human activities that transfergases into the atmosphere that enhance the natural greenhouse effect. For millennia, the greenhouseeffect has facilitated a balance between incoming solar radiation and outgoing terrestrial radiation; achange in either incoming or outgoing radiation modifies the surface temperature of the Earth.Intensification of the greenhouse effect results in the observed warming that, in turn, brings changes inother climatic and weather variables.Apart from an increase in the natural greenhouse effect, some ofthese gases also deplete the stratospheric ozone layer, producing a net increase in the ultraviolet (UV)radiation reaching the ground. Both geophysical processes influence human health.
10
1. Introduction
Source: Hadley Centre for Climate Research, Exeter, United Kingdom based on data from Jones et al., (1999) and Parker et al., (1995).
Fig. 1.1. Past and future changes in global mean temperature Global average near-surface temperatures, 1860–July 2003 from 1961 to 1990
Diff
eren
ce in
(°C
) fr
om 1
961-
1990
ave
rage
0.6
0.4
0.2
0.0
-0.2
-0.4
-0.6 18801860 1900 1920 1940 1960 1980 2000
years
11
PART 1. CONTEXT
Aims
Global climate change is one of several unprecedented, large-scale, environmental changes nowoccurring around the world. These momentous changes reflect the overloading of several of Earth’sbiophysical and ecological systems by the combined weight of human numbers and economic activity.Together with global climate change, loss of biodiversity, desertification, stratospheric ozone depletionand water resource depletion give rise to global environmental change.These environmental changesare disrupting Earth’s life-supporting infrastructure, posing risks to human well-being and health.
Three independent factors determine the scale of the human effects on the environment: consumptionper capita, the size of the human population and the technologies used to produce and consumeresources.The fact that human activities generate greenhouse gases, in addition to other pollutants ofthe air, water and soil, brought governments to adopt the United Nations Framework Convention onClimate Change (UNFCCC).The ultimate objective of the UNFCCC is to achieve
... , in accordance with the relevant provisions of the Convention, stabilization of greenhouse gasconcentrations in the atmosphere at a level that would prevent dangerous anthropogenicinterference with the climate system.Such a level should be achieved within a time-frame sufficientto allow ecosystems to adapt naturally to climate change, to ensure that food production is notthreatened and to enable economic development to proceed in a sustainable manner.
To achieve this objective, the Parties to the UNFCCC approved the Kyoto Protocol to the UNFCCCaiming to mitigate greenhouse gas emissions. Environmental changes are disrupting Earth’s life-supportsystems, which pose a number of risks to human health and well-being. Researchers are intensifyingtheir studies of the relationship between climate and weather and of the rates and patterns of mortalityand morbidity. Indeed, these are now a central focus of the IPCC,which since 1988 has been responsiblefor assessing the information on the science of climate change; the vulnerability to and effects of climatechange; and the strategies to mitigate greenhouse gases and to adapt to global warming. Governments,international and regional programmes and projects have undertaken studies to analyse the vulnerabilityof human health to climate change and the effects of climate change on a range of health outcomes.
The UNFCCC’s efforts devoted to mitigate greenhouse gas emissions will not immediately reverse thecurrent warming. In fact, the long lifetime of some greenhouse gases and the inertia of the climatesystem mean that, even if all emissions are stopped, the physical composition of the presentatmospheres will continue to influence the climate system for decades or even centuries. Theconsequences of mitigation may therefore not become apparent until after a considerable time interval.These physical constraints have brought decision-makers to recognize that anticipated precautionarymeasures, designed to cope with the expected effects of climate change, are required. Adaptationstrategies and measures should be developed to lessen the potential adverse effects and to takeadvantage of their potential beneficial effects. These actions should take into account the followingfactors.
• Climate change does not cause novel environmental exposures but may exacerbate the burden ofclimate-sensitive diseases, depending on the implementation of timely and effective interventions.
• Climate change results from both natural and human processes. Emissions of greenhouse gases affecthuman health at different scales.At the local scale, particulate matter emitted by vehicles has harmfuleffects. At the regional scale, transport of sulfur and nitrogen oxides cause acid deposition. At theglobal scale, the links between climate change and local environmental factors produce a range ofhazards to human health.
• Intergovernmental agencies, nongovernmental and regional institutions and some nationalorganizations have begun to assess the vulnerability of people to the potential health hazards resultingfrom climate variability (the El Niño Southern Oscillation) and change and to develop methods ofassessing risk and enhancing adaptation.

12
1. Introduction
This publication will serve as a reference to many activities associated with the protection of the humanenvironment, such as those stemming from the foci on water, energy,health, agriculture and biodiversityfrom the World Summit on Sustainable Development in Johannesburg in 2002 and Agenda 21 bydescribing a basic approach to assessing the vulnerability of human populations to changes in theclimate system.
Why conduct a national assessment on human health vulnerability and public healthadaptation to climate change?
Few industrialized and developing countries have conducted national assessments of the potentialeffects of climate change on human health to better understand current vulnerability and to evaluate thecountry’s capacity to adapt to climate change by modifying the health infrastructure or by adoptingspecific measures (Kovats et al., 2003a).
National assessments should be carried out to evaluate the risk of climate change for current and futuregenerations and to enable policy-makers to plan for measures, strategies and policies to cope withclimate change. In addition, more national information and assessments are needed to feed into theinternational policy processes, such as that of the national communications to the UNFCCC and thosefrom other climate change assessments.
The importance of timely decision-making is indicated by the need to adapt to climate change longbefore the stabilization of greenhouse gas concentrations leads to the stabilization of temperature andmean sea level.This includes considering such issues as the time required to replace infrastructure.
Potential users of this document
Parties to the United Nations Framework Convention on Climate Change
In acting to achieve the ultimate objective of the UNFCCC (outlined earlier), the Parties to the UNFCCCmust periodically communicate information related to its implementation to the Conference of theParties.This information takes the form of national communications, including a national inventory ofanthropogenic emissions by sources and removals by sinks of all greenhouse gases not controlled by theMontreal Protocol on Substances that Deplete the Ozone Layer and information that assesses thenational vulnerability to the potential effects of climate change.
The UNFCCC (1999),with the scientific cooperation of the IPCC,has developed reporting guidelines onnational communications.These guidelines are periodically revised for the preparation of ongoing setsof national communications. The current guidelines include only a few references to human health.
• Cl imate is the average s ta te o f the a tmosphere and the under ly ing land or water in a par t icu lar reg ion over a spec i f ic t ime per iod .
• Weather is the day- to-day mani fes ta t ion o f c l imate in a par t icu lar p lace a t a par t icu lar t ime .
• Cl imate change is a s ta t is t ica l l y s ign i f icant var ia t ion in e i ther the mean s ta te o f the c l imate or in i ts var iab i l i t y , pers is t ing over an extended per iod ( t yp ica l l y decades or longer) .
• Cl imate var iab i l i t y re fers to var ia t ions around the mean s ta te , inc lud ing the occurrence of ex t reme weather events .
Box 1.1. Definitions
13
PART 1. CONTEXT
Under Section 6, “Vulnerability assessment, climate change impacts and adaptation measures”, theguidelines specify the following:
A national communication shall include information on the expected impacts of climate changeand an outline of the action taken to implement Article 4.1(b) and (e) with regard to adaptation.Parties are encouraged to use the Intergovernmental Panel on Climate Change (IPCC) TechnicalGuidelines for Assessing Climate Change Impacts and Adaptations and the United NationsEnvironment Programme (UNEP) Handbook on Methods for Climate Change Impacts Assessmentand Adaptation Strategies. Parties may refer, inter alia, to integrated plans for coastal zonemanagement, water resources and agriculture. Parties may also report on specific results ofscientific research in the field of vulnerability assessment and adaptation.
Article 4 of the UNFCCC defines a number of “enabling activities” to support non-Annex I Parties(developing countries) in their efforts to undertake these assessments. Information on these activitiesmay be obtained from the UNFCCC web site (Annex 2).
National adaptation programmes of action for climate change
International policy mechanisms for climate change are currently being directed towards implementingadaptation strategies,policies and measures in developing countries,where the effects of climate changeare likely to be greatest.The need for national adaptation programmes of action for climate change wasagreed under the UNFCCC process in 2001.
Least developed countries have contributed least to the emission of greenhouse gases but are the mostvulnerable countries to the effects of climate change and have the least capacity to adapt to thesechanges, especially the impact of the increased damage from natural disasters. The least developedcountries lack the necessary institutional, economic and financial capacity to cope with the impact ofclimate change and to rebuild their infrastructure when it is damaged by natural disasters.Adaptationhas yet to become a major issue in developing countries.Although progress has been made in describingvulnerability to climate change in such populations, much more remains to be done to mainstreamadaptation within the national policy-making processes (Huq et al., 2003). Several key lessons have beenidentified.
• Information on the impact of climate change needs to be translated from scientific research intolanguage and time scales appropriate for policy-makers.
• Research on potential effects needs to be supported within countries to enable information to beimproved and passed on to policy-makers.
• Sectoral-level decision-makers are relatively more likely to mainstream adaptation to climate changewith ongoing and planned work, provided that information is given in a usable form.
Significant funds for implementing adaptation strategies are being made available, mainly through theGlobal Environment Facility of the United Nations Development Programme (UNDP).The Parties to theUNFCCC have agreed to develop the Least Developed Countries Fund to support the work programme,including preparing and implementing national adaptation programmes of action.
Regional programmes have also been developed to support developing countries in implementing theUNFCCC, as part of the Climate Change Training Programme of the United Nations.The South PacificRegional Environment Programme developed the Pacific Islands Climate Change Program to be moreappropriate to the needs of Pacific countries (Annex 2). The Special Climate Change fund wasestablished under the UNFCCC Marrakesh Accords in 2001. Adaptation is one type of activity that isintended to be supported by the Special Climate Change fund and/or the Adaptation Fund of the KyotoProtocol.
14
1. Introduction
Such activities include (Dessai, 2002):
• starting to implement adaptation activities promptly where sufficient information is available towarrant such activities, including water resources management; land management; agriculture; health;infrastructure development; fragile ecosystems, including mountainous ecosystems; and integratedcoastal zone management;
• improving the monitoring of diseases and vectors affected by climate change and related forecastingand early-warning systems, and in this context improving disease control and prevention;
• supporting capacity-building, including institutional capacity, for preventive measures, planning,preparedness and management of disasters relating to climate change, including contingencyplanning, especially for droughts and floods in areas prone to extreme weather events; and
• strengthening existing and, where needed, establishing national and regional centres and informationnetworks for rapid response to extreme weather events, using information technology as much aspossible.
This publication might help to focus some of the health-related adaptation activities within these plans.
Member States of WHO and the Climate Agenda
As a response to Agenda 21 and the UNFCCC, several organizations carrying out significant climate-related activities jointly developed the Climate Agenda, a comprehensive and integrating framework onall aspects of international climate-related programmes, including collecting and applying data, researchon climate systems and studies of the socioeconomic,health and ecosystem effects of climate variability.The Fifty-first World Health Assembly endorsed WHO participation (resolution WHA 51.29).An informalInter-Agency Network on Climate and Human Health was established in 1998 with a secretariat at WHO,to coordinate the relevant activities of the Climate Agenda.The work of WHO on climate change focuseson capacity-building, exchanging information and promoting research.
A first step was taken in the WHO European Region,where the European Ministers for Environment andHealth welcomed the recommendations on the early health effects of climate change and stratosphericozone depletion at the Third Ministerial Conference on Environment and Health in London in 1999.These included:
• developing the capacity, as necessary, to undertake national health impact assessments with the aimof identifying the vulnerability of populations and subgroups to ensure the necessary transfer ofexpertise among countries; and
• reviewing the social, economic and technical prevention, mitigation and adaptation options availableto reduce the potential adverse impact of climate change and stratospheric ozone depletion onhuman health.
This publication can help health ministries and institutions in giving priority to climate change–relatedactivities at the national, regional and local levels.
International reviews
Several international reviews have been undertaken.The scientists of the IPCC comprehensively assessthe scientific literature on this and related issues in its reports.The First Assessment Report (IPCC, 1990)introduced the health effects of climate change under a general chapter on human settlements andlinked them with air quality and ultraviolet B (UVB) radiation.The subsequent IPCC assessment reportsdevoted specific chapters to climate change and human health: the Second Assessment Report

15
PART 1. CONTEXT
(McMichael et al., 1996) and the Third Assessment Report (McMichael & Githeko, 2001). Further, thespecial report on the regional impact of climate change (Watson et al., 1997) included the human healthissue in a number of regional chapters.The Third Assessment Report also includes chapters on impactof climate change by region.These global reviews make general statements about the types of effectsclimate change may have on human health outcomes. In theory, national assessments should provideimportant information for the global assessments on regional and local vulnerability. In practice, this hasproved difficult to achieve because few national assessments have been undertaken. Assessments shouldbe country-driven and reflect local environmental and health priorities.
A task group convened by WHO, the World Meteorological Organization (WMO) and the United NationsEnvironment Programme (UNEP) (IPCC,1996) comprehensively reviewed the literature on the potentialhealth impact of climate change. In 2003, WHO collaborated with UNEP and WMO in publishing anupdated volume (McMichael et al., 2003b) that describes the actual and likely impact of climate changeon health and how human societies and their governments should respond,with particular focus on thehealth sector.

16
Both vulnerability and adaptation need to be understood to ensure effective risk management of thecurrent and potential effects of climate variability and change. This chapter defines vulnerability andadaptation within the context of global climate change and discusses possible steps in conductingvulnerability and adaptation assessments.The terms vulnerability and adaptation are used by the climatechange community and are analogous to concepts used in public health.The following definitions areprovided to facilitate the communication between the public health and climate change communities.
The public health sector frames the interventions needed to reduce the potential negative impact ofclimate variability and change in terms of prevention. Public health prevention is classified as primary,secondary or tertiary. Primary prevention aims to prevent the onset of disease in an otherwiseunaffected population (such as by supplying bed nets to all members of a population at risk of exposureto malaria). Secondary prevention entails preventive action in response to early evidence of healtheffects (including strengthening disease surveillance and responding adequately to disease outbreaks,such as the West Nile virus outbreak in the United States).Tertiary prevention consists of measures toreduce long-term impairment and disability and to minimize the suffering caused by existing disease. Ingeneral, secondary and tertiary prevention are less effective and more expensive than primaryprevention. In terms of global climate change, the mitigation of greenhouse gas emissions could beconsidered as primary prevention. For any specific health outcome of interest, there are many possibletypes of primary, secondary or tertiary prevention, as discussed in Chapters 5–11.
Definitions of vulnerability and adaptation
The public health and climate change communities share the goal of increasing the ability of countries,communities and individuals to effectively and efficiently cope with the challenges and changes that arelikely to arise because of climate variability and change. Realistically assessing the potential healthimpact of climate variability and change requires understanding both the vulnerability of a populationand its capacity to respond to new conditions.The relationships between vulnerability, adaptive capacityand potential effects are discussed below and shown in Fig. 2.1.
The IPCC defines vulnerability as the degree to which individuals and systems are susceptible to orunable to cope with the adverse effects of climate change, including climate variability and extremes.The vulnerability of human health to climate change is a function of:
• sensitivity,which includes the extent to which health,or the natural or social systems on which healthoutcomes depend, are sensitive to changes in weather and climate (the exposure–responserelationship) and the characteristics of the population, such as the level of development and itsdemographic structure;
• the exposure to the weather or climate-related hazard, including the character, magnitude and rate ofclimate variation; and
• the adaptation measures and actions in place to reduce the burden of a specific adverse healthoutcome (the adaptation baseline), the effectiveness of which determines in part theexposure–response relationship.
Populations, subgroups and systems that cannot or will not adapt are more vulnerable, as are those thatare more susceptible to weather and climate changes. Understanding a population’s capacity to adapt tonew climate conditions is crucial to realistically assessing the potential health and other effects ofclimate change. In general, the vulnerability of a population to a health risk depends on the localenvironment, the level of material resources, the effectiveness of governance and civil institutions, the
2. Vulnerability and adaptation to climate change: key concepts

17
PART 1. CONTEXT
quality of the public health infrastructure and the access to relevant local information on extremeweather threats (Woodward et al., 1998).These factors are not uniform across a region or country oracross time and differ based on geography, demography and socioeconomic factors. Effectively targetingprevention or adaptation strategies requires understanding which demographic or geographicalsubpopulations may be most at risk and when that risk is likely to increase.Thus, individual, communityand geographical factors determine vulnerability.
Adaptation includes the strategies, policies and measures undertaken now and in the future to reducepotential adverse health effects.Adaptive capacity describes the general ability of institutions, systemsand individuals to adjust to potential damages, to take advantage of opportunities and to cope with theconsequences.The primary goal of building adaptive capacity is to reduce future vulnerability to climatevariability and change.Coping capacity describes what could be implemented now to minimize negativeeffects of climate variability and change. In other words, coping capacity encompasses the interventionsthat are feasible to implement today (in a specific population), and adaptive capacity encompasses thestrategies,policies and measures that have the potential to expand future coping capacity. Increasing theadaptive capacity of a population shares similar goals with sustainable development – increasing theability of countries,communities and individuals to effectively and efficiently cope with the changes andchallenges of climate change.
Specific adaptation interventions arise from the coping capacity of a community, country or region.Theseinterventions, similar to all interventions in public health, are designed to maximize the number ofavoidable adverse health effects. Adaptation can be anticipatory (actions taken in advance of climatechange effects) or responsive and can encompass both spontaneous responses to climate variability andchange by affected individuals and planned responses by governments or other institutions. Examples ofadaptation interventions include watershed protection policies and effective public warning systems forfloods and storm surges such as advice on water use, beach closings and evacuation from lowlands and
Source: Ebi et al., (forthcoming).
SensitivityExposure-effectPopulation characteristics
Exposure
Adaptation baseline
TI M E 3
TI M E 2
TI M E 1
CURRENT VULNERABILITY
Coping capacity
A d a p t a t i o n
Avoidable
Unavoidable
ADAPTIVE CAPACITY FUTURE POTENTIALIMPACTS
Fig. 2.1. Schematic of relationships between vulnerability, adaptive capacity and potential health impact
seashores. To explain the observed diversity in the ability of systems to adapt (primarily to naturalhazards), the IPCC offered the hypothesis that adaptive capacity is a function of a series of determinants(Smit & Pilifosova, 2001):
• the range of available technological options for adaptation;
• the availability of resources and their distribution across the population;
• the structure of critical institutions, the derivative allocation of decision-making authority and thedecision criteria that would be employed;
• the stock of human capital, including education and personal security;
• the stock of social capital, including the definition of property rights;
• the system’s access to risk-spreading processes;
• the ability of decision-makers to manage information, the processes by which these decision-makersdetermine which information is credible and the credibility of the decision-makers themselves; and
• the public’s perceived attribution of the source of stress and the significance of exposure.
A framework more familiar in public health is the prerequisites required for prevention (Last, 1998):
• awareness that a problem exists
• understanding of the causes
• a sense that the problem matters
• the capability to intervene or influence
• the political will to deal with the problem.
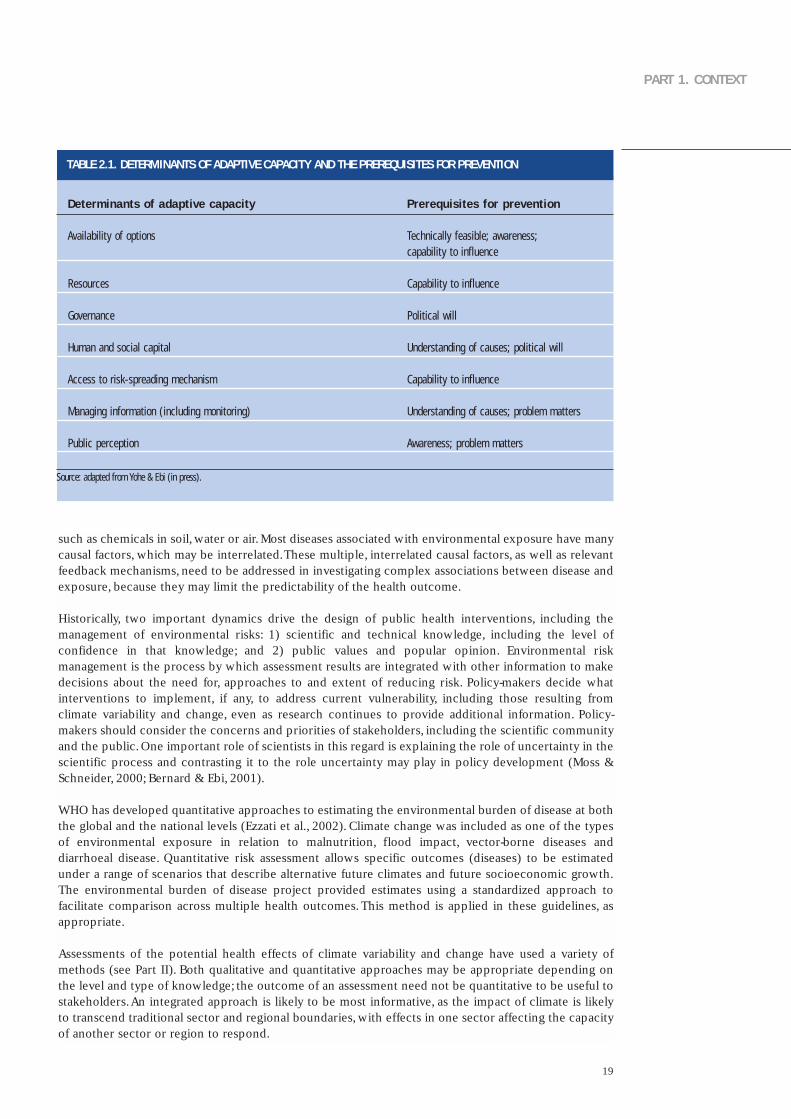
Table 2.1 compares the determinants of adaptive capacity with the prerequisites required for prevention(Yohe & Ebi, forthcoming). This comparison shows that the public health and climate changecommunities share similar perspectives but use somewhat different terms.
Human societies are currently adapted to some extent to weather and climate variability. It is thereforeimportant to identify where populations are not able to cope with current climate variability and extremes,such as floods, droughts and heat-waves. This shows where additional interventions are needed now.Improving the capacity to cope with current climate variability will probably improve the capacity to copewith long-term climate change. An adaptation assessment describes specific strategies, policies andmeasures that can be implemented to reduce current and future vulnerability as well as the resourcesneeded (financial, technological and human capital) to implement them.The information generated froman adaptation assessment can be combined with a cost–benefit or other economic analysis to informpriority-setting by policy-makers. The Adaptation Policy Framework developed under funding from theGlobal Environment Facility of UNDP further describes designing and conducting a project focused onidentifying adaptation options for short- and long-term policy planning in developing countries (Annex 2).
Assessing vulnerability or health impact
Approaches to assessing the potential effects of climate variability and change on human health varydepending on the outcome of interest. Conventional environmental health impact assessment is basedon the toxicological risk assessment model that addresses population exposure to environmental agents,
18
2. Vulnerability and adaptation to climate change: key concepts
19
PART 1. CONTEXT
such as chemicals in soil, water or air. Most diseases associated with environmental exposure have manycausal factors, which may be interrelated.These multiple, interrelated causal factors, as well as relevantfeedback mechanisms, need to be addressed in investigating complex associations between disease andexposure, because they may limit the predictability of the health outcome.
Historically, two important dynamics drive the design of public health interventions, including themanagement of environmental risks: 1) scientific and technical knowledge, including the level ofconfidence in that knowledge; and 2) public values and popular opinion. Environmental riskmanagement is the process by which assessment results are integrated with other information to makedecisions about the need for, approaches to and extent of reducing risk. Policy-makers decide whatinterventions to implement, if any, to address current vulnerability, including those resulting fromclimate variability and change, even as research continues to provide additional information. Policy-makers should consider the concerns and priorities of stakeholders, including the scientific communityand the public. One important role of scientists in this regard is explaining the role of uncertainty in thescientific process and contrasting it to the role uncertainty may play in policy development (Moss &Schneider, 2000; Bernard & Ebi, 2001).
WHO has developed quantitative approaches to estimating the environmental burden of disease at boththe global and the national levels (Ezzati et al., 2002). Climate change was included as one of the typesof environmental exposure in relation to malnutrition, flood impact, vector-borne diseases anddiarrhoeal disease. Quantitative risk assessment allows specific outcomes (diseases) to be estimatedunder a range of scenarios that describe alternative future climates and future socioeconomic growth.The environmental burden of disease project provided estimates using a standardized approach tofacilitate comparison across multiple health outcomes. This method is applied in these guidelines, asappropriate.
Assessments of the potential health effects of climate variability and change have used a variety ofmethods (see Part II). Both qualitative and quantitative approaches may be appropriate depending onthe level and type of knowledge; the outcome of an assessment need not be quantitative to be useful tostakeholders.An integrated approach is likely to be most informative, as the impact of climate is likelyto transcend traditional sector and regional boundaries, with effects in one sector affecting the capacityof another sector or region to respond.
TABLE 2.1. DETERMINANTS OF ADAPTIVE CAPACITY AND THE PREREQUISITES FOR PREVENTION
Determinants of adaptive capacity Prerequisites for prevention
Availability of options Technically feasible; awareness; capability to influence
Resources Capability to influence
Governance Political will
Human and social capital Understanding of causes; political will
Access to risk-spreading mechanism Capability to influence
Managing information (including monitoring) Understanding of causes; problem matters
Public perception Awareness; problem matters
Source: adapted from Yohe & Ebi (in press).
20
Climate impact assessment
The IPCC has developed methodological guidelines for assessing climate impact (Carter et al., 1994;Parry & Carter,1998).The guidelines were developed primarily for the biophysical and economic sectorsand were not intended to apply to the effects on health and social systems. However, it is desirable thathealth impact assessment follow IPCC practice to facilitate the inclusion and interpretation of healtheffects in the forthcoming Fourth Assessment Report. The Fourth Assessment Report is due to becompleted in 2007, with research and assessments completed by mid-2005 considered in theassessment.The methods and tools in this publication are therefore consistent with IPCC guidance. Inaddition, this publication provides guidelines on the use of consistent scenarios of climate change andsocioeconomic futures for comparison across assessments: across different countries and within acountry or region over time (Chapter 4 discusses scenarios in more detail).
Another resource is the UNEP Handbook on methods for climate change impact assessment andadaptation (Feenstra, 1998), which includes a chapter on health.The aim of the UNEP country studiesprogramme was to improve the methods for assessing the effects of climate change in developingcountries or countries with economies in transition.
Health impact assessment should aim:
• to evaluate the impact of climate variability and change in a range of areas and populations, especiallyamong vulnerable populations and, when possible, to determine the attributable burden of weatherand climate, including extreme events, to climate-sensitive diseases (Chapters 5–11 discuss methodsof achieving this);
• to evaluate possible threshold effects;
• to evaluate the effects of multiple stresses, including changes in socioeconomic systems;
• to evaluate uncertainty and its implications for risk management;
• to evaluate the effects of reducing emissions, such as by comparing impact under scenarios withbusiness-as-usual and stabilization of emissions; and
• to measure coping capacity, especially under different socioeconomic futures (such as Nakicenovic &Swart (2000) or health-related scenarios) and in the context of sustainable development.
Risk management
Applying appropriate risk management principles, tools, and measures can reduce current and futurevulnerability to climate variability and change. Numerous risk management frameworks have beendeveloped that can be modified to address national, regional and local assessment needs (Annex 2).Thefirst steps in these frameworks are identifying risks and assessing exposure and response. Riskidentification involves evaluating whether a specific exposure is a risk to human health and well-being.Once a type of exposure is determined to be a risk (such as heavy rain causing rivers to overflow), theexposure and response are assessed to determine the consequences of exposure for the health and well-being of the affected population.This involves describing: the magnitude and frequency of the risk; thelikelihood of exposure; who is or will be at increased risk of adverse health effects by level of exposure;and what is or will be at risk that could adversely affect health, such as damage to built infrastructureand/or interference with health and social services.
The risk identification and assessment of exposure and response should be followed by assessingcapacity to identify the strengths and weaknesses of the human and material resources available toreduce (or manage) the risks. This might include assessing the ability of public health units, firedepartments,emergency services and even military units to provide emergency services during weather-
2. Vulnerability and adaptation to climate change: key concepts

21
PART 1. CONTEXT
related disasters. It should also assess the ability to cope with risks that increase gradually, such asprogressive droughts shrinking water supplies and increasing crop failures.Policy-makers and the publicneed to know whether public health services and other health and social infrastructure might beweakened by a deteriorating economy and by shrinking government income and resources.
Next, information is needed on the awareness and tolerance of risk at the local, regional and nationallevels. Information should be gathered on the risks the affected economic or social sectors,various levelsof government and interest groups, experts, citizens and other appropriate sources perceive to be themost important and why. Priorities need to be established for how, by whom, how quickly, to whatextent and in which order the risks should and could be reduced.This means that comprehensive andefficient information-gathering and consensus-building is essential.
The process of risk mitigation (risk management) focuses on the issues of highest priority. Theadaptation assessment will have identified a range of possible strategies, policies and measures thatcould be implemented to address the risks of concern. These interventions have varying degrees ofeffectiveness, ease of implementation, expected disadvantages and cost in reducing the risk of adverseeffects.These interventions are often analysed for costs and benefits.Decision-makers and policy-makerscombine this information with factors such as current policy priorities and social values in determininga strategic direction and in implementing specific intervention. Finally, a mechanism for monitoring andevaluation needs to be established to determine whether the intervention has the desired effect andwhether mid-course corrections are needed. Corrections may arise because of changes in social,economic, environmental and technological conditions over time. Significant changes may requireinitiating a new cycle of assessment and risk management to take these changes into account. Riskmanagement is a process; this progression in time and the cyclical nature of the tasks can be representedby a clock face (Fig. 2.2).The United Kingdom Climate Impacts Programme has developed a decision-making framework for risk-based decision-making with respect to climate change (Willows & Connell,2003).
Fig. 2.2. The risk management cycle
Source: Treasury Board of Canada Secretariat (2001).
CONT
INUO
US
LEARNING AND COMM
UNICATION
Assessingkey riskareas
Measuringlikelihoodand impacts
Rankingrisks
Settingdesiredresults
Developingoptions
Selecting astrategy
Implementingthe strategy
Monitoring,evaluating andadjusting
Identifyingissues; settingthe context
INTEGRATED RISKMANAGEMENT
91 2
3
4
56
8
7

Steps in assessing vulnerability and adaptation
Assessment of vulnerability and adaptation uses similar concepts to those used in health impactassessment. Chapter 3 describes the process of conducting an assessment. Chapters 4 to 12 describemethods that can be used during the assessment process. Box 2.1 lists the recommended steps inconducting an assessment.The steps are consistent with the risk management framework; this reportdoes not explicitly address the development of options, the selection of future strategies and theeventual implementation of the strategy as well as its monitoring, but they need to be considered infuture policy development (Chapter 3).Not all steps may be possible or desirable,and the determinationof which steps are included depends on the objectives and resources available for the assessment.
1. Determine the scope of the assessment
The first step is to specify the scope of the assessment in relation to:
• the health and community security issues of concern today and of potential risk in the future;
• the geographical region to be covered by the assessment; and
• the time period.
22
2. Vulnerability and adaptation to climate change: key concepts
Fig. 2.3. Climate change and health: pathway from driving forces through exposure to potential healtheffects. Arrows under research needs represent input required by the health sector
Source: adapted from McMichael et al., (2003b).
HEALTH EFFECTS
Temperature-related illness and death
Extreme weather-related health effects
Air pollution-relatedhealth effects
Water and food-bornediseases
Vector-borne and rodent-borne diseases
Effects of food and water shortages
Mental, nutritional,infectious and otherhealth effects
Adaptivecapacity
Modulatinginfluences
Microbialcontaminationpathways
REGIONALWEATHER CHANGES
Heat-waves
Extreme weather
Temperature
Precipitation
Transmissiondynamics
Agro-ecosystems,hydrology
Socioeconomics,demographics
Health-specificadaptation measures
Evaluation ofadaptationResearch needs
Mitigativecapacity
Mitigationmeasures
Greenhousegas emissions
Naturalcauses
Drivingforces
Populationdynamics
Unsustainableeconomicdevelopment
CLIMATECHANGE

23
PART 1. CONTEXT
Fig. 2.3 shows the many mechanisms by which changes in climate may affect human health.Table 2.2describes the association between well assessed health outcomes and climate risks. Part II furtheraddresses the evidence of an association between a specific health outcome and weather or climate.
Interactions between weather and climate and health are location-specific; using epidemiologicalevidence based on local data if they are available is therefore important. Evidence of an associationbetween weather and health outcome may not imply an increased burden from climate change (seeChapter 4). Assessments should include current vulnerability to climate variability to informunderstanding of what could occur with climate change.The extent to which an assessment addressesthese issues depends on the goals of the assessment and the resources available.
The national boundaries may not be the most appropriate geographical framework for the assessment.Climate, diseases and vectors do not respect national boundaries, and other countries may thereforeneed to be considered to assess the national risk. Countries with similar health and climate problemsmay work together for a regional assessment. Many countries (such as the United Kingdom, the UnitedStates and Canada) have undertaken assessments at the subnational level. The geographical areas ofinterest are likely to vary by outcomes.
Box 2.1. Steps in assessing vulnerability and adaptation
1 Determine the scope of the assessment .
2 Descr ibe the current d istr ibut ion and burden of c l imate -sensit ive d iseases .
3 Ident i fy and descr ibe current strategies , pol ic ies and measures that reduce the burden of
c l imate -sensit ive d iseases .
4 Review the health impl icat ions of the potent ia l impact of c l imate var iabi l i ty and change on
other sectors .
5 Est imate the future potent ia l health impact using scenar ios of future c l imate change, populat ion
growth and other factors and descr ibe the uncertainty.
6 Synthesize the results and draft a scient i f ic assessment report .
7 Ident i fy addit ional adaptat ion pol ic ies and measures to reduce potent ia l negat ive health
effects , including procedures for evaluat ion after implementat ion .

24
2. Vulnerability and adaptation to climate change: key concepts
Health outcome Known effects of weather and cl imate
Card iovascu lar resp i ra tor y mor ta l i t y and heat s t roke mor ta l i t y • Shor t - term increases in mor ta l i t y dur ing heat-waves• V- and J-shaped re la t ionsh ip between temperature and morta l i t y in popula t ions
in temperate c l imates• Deaths f rom heat s t roke increase dur ing heat waves
Al lerg ic rh in i t is • Weather a f fec ts the d is t r ibu t ion , seasonal i t y and product ion o f aeroa l lergens
Respi ra tor y and card iovascu lar d iseases and morta l i t y • Weather a f fec ts concentra t ions o f harmfu l a i r po l lu tants
Deaths and in jur ies • F loods , lands l ides and windstorms cause death and in jur ies
In fec t ious d iseases and menta l d isorders • F lood ing d isrupts water supply and san i ta t ion sys tems and may damage t ranspor t sys temsand heal th care in f ras t ruc ture
• F loods may prov ide breeding s i tes for mosqui to vectors and lead to outbreaks o f d isease• Floods may increase post - t raumat ic s t ress d isorders
Star vat ion , malnut r i t ion and d iarrhoeal and resp i ra tor y d iseases • Drought reduces water ava i lab i l i t y for hyg iene• Drought increases the r isk o f forest f i res• Drought reduces food ava i lab i l i t y in popula t ions that are h igh ly dependent on household
agr icu l ture product iv i t y and/or economica l l y weak
Mosqui to , t ick-borne d iseases and rodent-borne d iseases • Higher temperatures shor ten the deve lopment t ime of pathogens in vectors and(such as malar ia , dengue , t ick-borne encephal i t is and Lyme d iseases) increase the potent ia l t ransmiss ion to humans
• Each vector spec ies has spec i f ic c l imate condi t ions ( temperature and humid i t y) necessary to be suf f ic ient ly abundant to main ta in t ransmiss ion
Malnutr i t ion and undernutr i t ion • Cl imate change may decrease food suppl ies (crop y ie lds and f ish s tocks) or access to food suppl ies
Waterborne and foodborne d iseases • Surv iva l o f d isease-caus ing organisms is re la ted to temperature• Cl imate condi t ions a f fec t water ava i lab i l i t y and qual i t y• Ext reme ra in fa l l can a f fec t the t ranspor t o f d isease-caus ing organisms in to the water
supply
The responsible national or regional health authority can identify the health outcomes to be includedin collaboration with, when appropriate, (1) the authorities responsible for the social security,environmental affairs and meteorological offices; (2) the research community; and (3) otherstakeholders, such as nongovernmental organizations, business and the public.The assessment of somehealth outcomes may be postponed for future consideration if either climate or epidemiologicalinformation is currently insufficient to evaluate exposure and response. However, when the outcome isof high societal importance, qualitative estimates could be made.
2. Describe the associations between disease outcomes and climate variability andchange
Once health outcomes (the climate-sensitive diseases) are identified for inclusion in the assessment, thecurrent evidence (published literature) should be reviewed.A variety of statistical methods are available
TABLE 2.2. SUMMARY OF THE KNOWN EFFECTS OF WEATHER AND CLIMATE

25
PART 1. CONTEXT
to analyse associations with exposure to weather or climate, taking into account modifying and/orinteracting factors (described in detail in Part II).Adverse health outcomes associated with interannualclimate variability, such as El Niño events, could also be considered. Meteorologists can provide inputinto how to define and describe the important types of weather exposure; for example, the severity andrecurring periods of extreme weather events.For each chosen outcome, determining the factors that could modify its association with weather andclimate variables is important. Modifying factors will vary by disease outcome and could includesocioeconomic and other variables. Consideration should be given to interacting effects. For example,morbidity and mortality may be increased during periods with both extreme heat and high levels of airpollutants. If epidemiological analyses cannot be conducted, such as if data are not of sufficient qualityand quantity, the available literature can be reviewed to produce a qualitative assessment.The current burden of the climate-sensitive diseases can be described using the following indicators andoutcomes:
• the current incidence and prevalence of the disease and the trend (is the disease increasing ordecreasing), which may be available from routine statistics from the appropriate national agency; and
• the attributable burden of a disease to climate and/or weather, such as what proportion of allcardiovascular deaths are attributable to high or low temperatures or the number of deaths caused byfloods.
For vector-borne diseases, having a map showing the current geographical distribution of human casesand vectors may be useful. Finally, environmental and socioeconomic conditions also influence humanvulnerability and need to be considered within the assessment.
3. Identify and describe current strategies, policies and measures that reduce theburden of climate-sensitive diseases
For each health outcome, activities and measures individuals, communities and institutions currentlyundertake to reduce the burden of disease should be identified and evaluated for effectiveness.Adaptation measures can be identified from: (1) review of the literature; (2) from information availablefrom international and regional agencies (WHO, the Pan American Health Organization, UNEP andothers) and from national health and social welfare authorities (ministries of health); and (3) fromconsultations with other agencies and experts that deal with the impact of the health outcome ofconcern (that is, agencies that deal with the effects of extreme weather events, such as rivercommissions). Identifying successful adaptations being undertaken to address the negative effects ofclimate variability and those implemented in anticipation of climate change is important. For example,is an early warning system for heat-waves in place? What activities are instituted during a heat-wave toreduce morbidity and mortality? Reviewing adaptation measures implemented in other regions withsimilar health concerns may be valuable.
Ideally, the effectiveness of adaptation measures should be evaluated. Information from the previouslymentioned sources is needed to evaluate the effectiveness of measures, including the barriers toimplementation for proposed interventions.An evaluation should consider approaches to monitor howthe performance of a strategy, policy or measure may change over time compared with the baseline. Forexample, if an early warning system for heat-waves is in place, evaluation can determine whethermorbidity and/or mortality is lower with the system based on comparable heat-wave.
The key questions to address for a specific health outcome include the following.
• What is being done now to reduce the burden of disease? How effective are these policies andmeasures?
• What could be done now to reduce current vulnerability? What are the main barriers toimplementation (such as technology or political will)?
26
• What strategies, policies, and measures should begin to be implemented to increase the range ofpossible future interventions?
4. Review the health implications of the potential impact of climate variability anchange on other sectors
Climate change is likely to affect natural and human systems.Assessments should therefore be integratedacross the concerned scientific disciplines and non-health sectors included. International agencies (theIPCC) or regional or national authorities may have assessed the potential impact of climate change onthe environment (habitat and land use) at the relevant spatial scale.These effects should be included inthe assessments to better understand issues such as the health implications of the direct impact ofclimate change on the food supply and the risk of disasters (such as coastal or river flooding).The impactof implemented strategies, policies and measures in response to actual or projected climate changeneeds to be evaluated in terms of potential health effects. For example, in cases where domestic waterstorage is recommended, the implementation of this measure may have implications for vector breedingand the transmission of dengue. Water development projects should be subject to environmental andhealth impact assessment.Information at the regional, national or local scale about climate variability and change should be usedwhenever possible.
5. Estimate the future potential health impact
Climate variability and change are adversely affecting human health and well-being and will continue todo so. The inherent inertia in the climate system means that the impact of current greenhouse gasemissions will be delayed for decades to centuries.The IPCC projections for the increase in mean surfacetemperature for the 21st century range from 1.4°C to 5.8°C.As a consequence, anthropogenic warmingis projected, on average, to range from 0.1°C to 0.5°C per decade during this century. Even largerchanges may be expected beyond the 21st century. Greater climatic changes are expected in higherlatitudes in both hemispheres, with increasing risks of heat-waves, flooding and drought events and thespread of infectious diseases.This emphasizes that health and civil defence authorities need to designand implement adaptation strategies, polices and measures to reduce potential health impact. Theclimate change community often chooses from the present until 2050 and until 2100 as the referenceperiods for projecting the impact of climate change.
This requires using climate scenarios. Climate scenarios are now available for a range of time scales (seeChapter 4). The time scale of the assessment depends on the scope and purpose of the assessment.However, addressing potential effects both in the near term (the next 20 years) and the long term (upto 2050 or 2080) is advisable.The focus on the near term provides relevant information within the usualplanning horizon of health agencies. A further need is looking beyond the near term to developcomprehensive adaptation measures.
The potential future impact of climate variability and change on health may be estimated using a varietyof methods, as described in Part II.These methods imply a top-down approach in which scenarios ofclimate change (and other changes) are used as inputs into a model on climate and health. Such modelscan be complex spatial models or be based on a simple relationship between exposure and response.
Models of climate change should include projections of how other relevant factors may change in thefuture, such as population growth, income, fuel consumption and other relevant factors.Projections maybe incorporated from models developed for other sectors, such as flood risk, food supply and land-usechanges (see step 4). An assessment needs to address uncertainty explicitly.Scientists,policy-makers andthe public must recognize the existence of multiple sources of uncertainty, from climate projections tothe potential future public health effects. This step should be realistic about the likelihood that theuncertainty can be resolved in a meaningful time frame. Carefully estimating uncertainty can furtherunderstanding of the level of confidence in what is known and can provide input into future research
2. Vulnerability and adaptation to climate change: key concepts
27
PART 1. CONTEXT
directions and to policy-making.
Future capacity to adapt to the effects of climate change depends on the future levels of economic andtechnological development, local environmental conditions and the quality and availability of healthcare and of public health infrastructure. Social, economic, political, environmental and technologicalfactors strongly influence health. These determinants of health are complex enough that futureprojections about stresses on population health, including but not limited to projections of the potentialeffects of climate variability and change on health, become increasingly uncertain with expandingtimelines. Future projections must make explicit their assumptions about adaptive capacity.
6. Synthesize the results and draft a scientific assessment report
This step synthesizes the quantitative and qualitative information collected in the previous steps toidentify changes in risk patterns and opportunities and to identify links between sectors, vulnerablegroups and stakeholder responses. Convening an interdisciplinary panel of experts with relevantexpertise is one approach to developing a consensus assessment. Chapter 6 provides guidance fordescribing the level of evidence behind a consensus statement. Once synthesized, the informationshould be peer-reviewed and published.
Assumptions that underlie any quantitative estimates should be clearly described.Quantitative estimatesshould be clearly identified with a climate scenario.Vague statements about potential impact should beavoided. In particular, it should not be stated that climate change “may affect” a given disease, as this isvirtually meaningless.The degree of certainty of a statement should be provided (see Chapter 4).Themost vulnerable population groups should be identified (see Chapter 12).
Value judgements have to be made in summarizing the assessment. In particular, decisions should betaken about (Lehto & Ritsatakis, 1999):
• how to balance near-term and long-term effects;
• how to weight the different potential effects in different population groups;
• how to balance the more certain,quantifiable potential effects with those that are less certain and notquantifiable, as well as the qualitative effects; and
• how to balance the interests of the various stakeholder groups: experts, people potentially affectedand decision-makers.
7. Identify additional adaptation policies and measures, including procedures forevaluation after implementation
Identify possible adaptation measures that could be undertaken over the short term to increase thecapacity of individuals, communities and institutions to effectively cope with the weather or climateexposure of concern.These measures should be possible to institute within the population’s access tomaterial resources, technology and human and social capital. For example, if heat-related morbidity andmortality are health issues in an urban area and if an early warning system for heat-waves is not in place,then would implementing such a system be likely to benefit population health? Strengths and weaknessesas well as opportunities and threats to implementation should be evaluated and priorities set.
Every country needs to adapt to long-term climate change.The aim of this step is to identify possiblemeasures that can be taken today and in the future to increase the ability of individuals, communitiesand institutions to effectively cope with future climate exposure, including extremes.
Consideration should be given to the lessons learned from past public health policies, including the
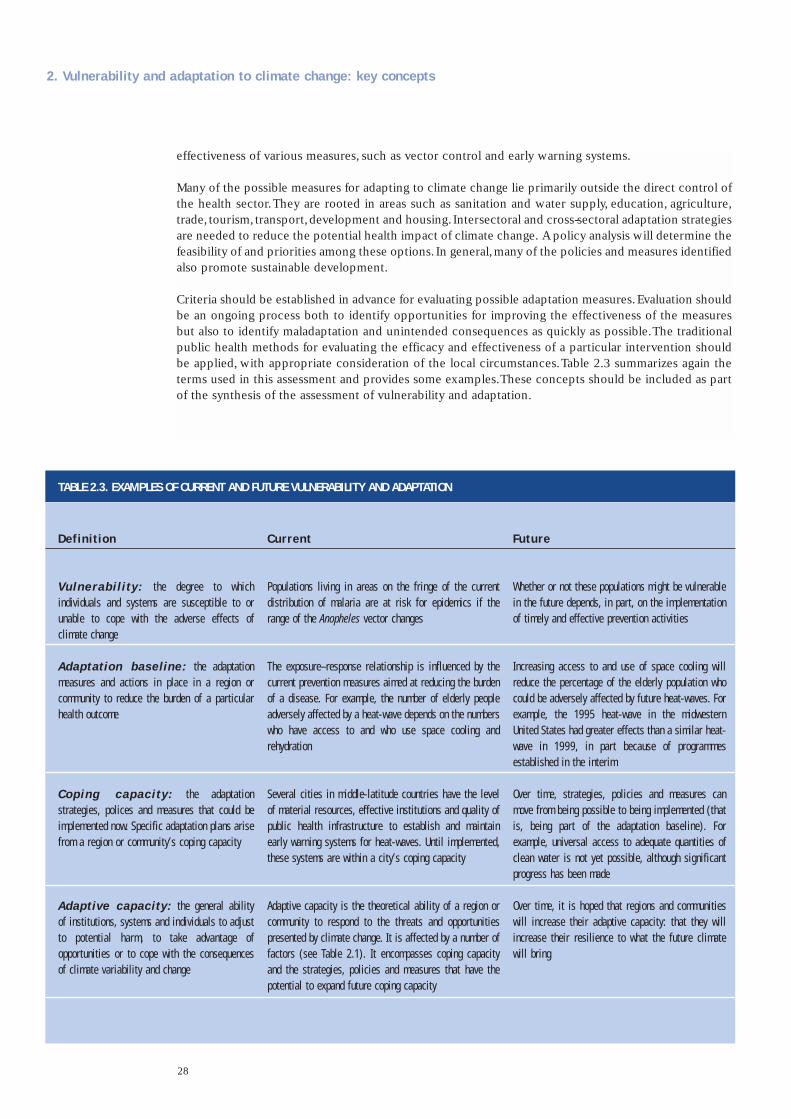
28
effectiveness of various measures, such as vector control and early warning systems.
Many of the possible measures for adapting to climate change lie primarily outside the direct control ofthe health sector.They are rooted in areas such as sanitation and water supply, education, agriculture,trade, tourism, transport,development and housing. Intersectoral and cross-sectoral adaptation strategiesare needed to reduce the potential health impact of climate change. A policy analysis will determine thefeasibility of and priorities among these options. In general,many of the policies and measures identifiedalso promote sustainable development.
Criteria should be established in advance for evaluating possible adaptation measures.Evaluation shouldbe an ongoing process both to identify opportunities for improving the effectiveness of the measuresbut also to identify maladaptation and unintended consequences as quickly as possible.The traditionalpublic health methods for evaluating the efficacy and effectiveness of a particular intervention shouldbe applied, with appropriate consideration of the local circumstances.Table 2.3 summarizes again theterms used in this assessment and provides some examples.These concepts should be included as partof the synthesis of the assessment of vulnerability and adaptation.
2. Vulnerability and adaptation to climate change: key concepts
Def in i t ion
Vu lne r ab i l i t y : t h e deg ree t o wh i chind iv idua ls and sys tems are suscept ib le to orunab le to cope wi th the adverse e f fec ts o fc l imate change
Adaptat ion basel ine: the adapta t ionmeasures and act ions in p lace in a reg ion orcommuni t y to reduce the burden of a par t icu larheal th outcome
Cop ing capac i t y : t h e adap t a t i onst ra teg ies , po l ices and measures that cou ld beimplemented now. Spec i f ic adapta t ion p lans ar isef rom a reg ion or communi t y ’s cop ing capac i t y
Adapt ive capaci ty : the genera l ab i l i t yo f ins t i tu t ions , sys tems and ind iv idua ls to ad jus tt o po t en t i a l ha rm , t o t a ke advan t age o foppor tun i t ies or to cope wi th the consequencesof c l imate var iab i l i t y and change
Current
Popula t ions l i v ing in areas on the f r inge o f the currentd is t r ibu t ion o f malar ia are a t r isk for ep idemics i f therange of the Anopheles vector changes
The exposure–response re la t ionsh ip is in f luenced by thecurrent prevent ion measures a imed at reduc ing the burdenof a d isease . For example , the number o f e lder ly peopleadverse ly a f fec ted by a heat-wave depends on the numberswho have access to and who use space coo l ing andrehydrat ion
Severa l c i t ies in midd le- la t i tude countr ies have the leve lo f mater ia l resources , e f fec t i ve ins t i tu t ions and qual i t y o fpub l ic hea l th in f ras t ruc ture to es tab l ish and main ta inear ly warn ing sys tems for heat-waves . Unt i l implemented ,these sys tems are wi th in a c i t y ’s cop ing capac i t y
Adapt ive capac i t y is the theoret ica l ab i l i t y o f a reg ion orcommuni t y to respond to the threats and oppor tun i t iespresented by c l imate change . I t is a f fec ted by a number o ffac tors (see Table 2 .1) . I t encompasses cop ing capac i t yand the s t ra teg ies , po l ic ies and measures that have thepotent ia l to expand fu ture cop ing capac i t y
Future
Whether or not these popula t ions might be vu lnerab lein the fu ture depends , in par t , on the implementat ionof t imely and e f fec t i ve prevent ion act iv i t ies
Increas ing access to and use o f space coo l ing wi l lreduce the percentage of the e lder ly popula t ion whocould be adverse ly a f fec ted by fu ture heat-waves . Forexample , the 1995 heat-wave in the midwesternUni ted Sta tes had greater e f fec ts than a s imi lar heat-wave i n 1999 , i n pa r t because o f p rog rammesestab l ished in the in ter im
Over t ime , s t ra teg ies , po l ic ies and measures canmove f rom being poss ib le to be ing implemented ( thati s , be ing par t o f t he adap ta t i on base l i ne) . Fo rexample , un iversa l access to adequate quant i t ies o fc lean water is not ye t poss ib le , a l though s ign i f icantprogress has been made
Over t ime , i t is hoped that reg ions and communi t ieswi l l increase the i r adapt ive capac i t y : that they wi l lincrease the i r res i l ience to what the fu ture c l imatewi l l br ing
TABLE 2.3. EXAMPLES OF CURRENT AND FUTURE VULNERABILITY AND ADAPTATION
29
PART 1. CONTEXT
Assessments need to be informative and timely. Experiences from many developing and industrializedcountries that have carried out assessments (WHO, 2001a) have shown that including variousstakeholders in the assessment planning, implementation and evaluation from the beginning is veryimportant.
Assessment requires an adequate management structure, to carefully plan the process, implement theassessment and to evaluate both the process and the outcome. Before, during and after the assessment,an adequate communication strategy needs to be planned, hand in hand with risk communication.
Assessments can have different levels of in-depth analysis. This often depends on the objectives, theinterest of stakeholders and the funding available.
This chapter briefly describes the involvement of stakeholders, the management structure, thecommunication, the level of assessment, peer review and risk management.
Involvement of stakeholders
The stakeholders in a health assessment are people within governments, nongovernmentalorganizations, research institutions and private entities that focus on public health. If the ultimate goalof vulnerability assessment is to provide useful information to these stakeholders, then they must beengaged throughout the assessment process.
For an assessment to be informative, the assessors must know the issues and questions of greatestconcern to the stakeholders. This does not imply that relevant issues – otherwise not identified orknown as important to stakeholders – would be left out of the assessment.A comprehensive assessmentcould identify “surprises”not expected by stakeholders. Stakeholders should be engaged from the outsetof the assessment process, including ongoing involvement in the analytical phase. Assessors andstakeholders are not necessarily distinct communities. In many cases, the stakeholder community canoffer data, analytical capabilities, insights and understanding of relevant problems that can contribute tothe assessment. Openness and inclusiveness enable different participants to bring a diversity of viewsand information that may benefit the assessment process. Involving all interested parties makes theassessment process more transparent and credible.
For an assessment to be timely, the assessors must understand how relevant stakeholders will use theinformation generated and understand the time frame within which the information is needed. Evenwith stakeholder involvement, researchers are often reluctant to make any statements policy-makersmight use because scientific uncertainty still exists. Nevertheless, policy-makers make decisions underuncertainty, whether or not scientists are prepared to inform those decisions.Assessors strive to answerdecision-makers’ questions to the extent possible given uncertain science based on the assumption thatinformed decisions are better than uninformed decisions. They also characterize the uncertainty andexplore what it implies for various policy or resource management decisions in the belief that improvingthe understanding of the quality and implications of scientific information leads to more informeddecisions.
Finally, re-evaluating the level of stakeholder concern and identifying any new issues of concern tostakeholders as they are informed of assessment results are especially important. Once an assessment iscompleted and the stakeholders informed of the results, assessors should elicit from the stakeholdersany new interests and concerns the assessment raises. Engaging stakeholders in the process andespecially keeping stakeholders engaged throughout the assessment is not easy. The managementstructure should include the need to design strategies to achieve this.
3. The framework for the assessment

30
Management structure
Before health impact assessment is begun, a management structure has to be established to superviseeach stage of the assessment. Identifying one leading institution is useful to ensure that the assessmentis supervised until completion. In countries, the national health ministry has primary responsibility forassessing and promoting the health of the population. It would therefore be advisable to identify a healthinstitution to take the lead. However, other departments and organizations may have variousresponsibilities for protecting human health and may need to participate in the management structureas well (such as those within environment, transport and industry).The national health ministry shouldhave the necessary expertise and capacity to manage an assessment of potential risks to public healthresulting from climate change and to integrate climate change considerations into public health policy.The national health ministry or joint health ministries at the regional level, in conjunction with otherenvironmental, social and security authorities, need to identify branches of responsibility within theirorganizations that will facilitate the development of the assessment.The health ministry has two primarytasks: to establish a management structure within the ministry with various responsibilities and tofacilitate the development of the assessment.
As the project leader, the health ministry needs to identify branches of responsibility within itsorganization to undertake each of the tasks outlined below and to work together in an integratedfashion. Generally the tasks fall into three categories: developing partnership, generating knowledge anddeveloping policy. Different offices within the organization should carry out these tasks throughcollaborative work.This forms the basis of the administrative operation.
Many of the aspects of the assessment process, such as synthesizing results, developing policy andengaging stakeholders, will have implications after the assessment is completed. Research gaps andinformation needs identified during the assessment will feed into the future development, selection andimplementation of policy options and into further monitoring and surveillance work that typicallyconstitute the risk management phase of an assessment.This publication focuses on the assessment ofvulnerability and adaptation, although a strong management structure will plan ahead and identify thenecessary resources and expertise required to make the transition to risk management activities.
Partnership development
The health ministry needs to work with international funding agencies, government andnongovernmental organizations and representatives of other sectors within and outside the country tosecure access to the resources, expertise and training materials needed to conduct the assessment.Theassessment process requires extensive and diverse human, financial and technical resources. For mostindustrialized countries, these resources are readily accessible or at least available within the countryitself. For developing countries, these resources may need to be obtained from external sources (seeChapter 1 on national adaptation programmes of action and adaptation funds).
Relationships should be established and fostered with international organizations, such as WHO, theWorld Bank, UNEP, UNDP, the Food and Agriculture Organization of the United Nations (FAO) andinternational nongovernmental organizations.
The health ministry will also facilitate the identification and organization of key partners within thecountry or region being assessed to participate in various fora, including an overarching steering group,various working groups and peer review committees.Other important considerations are what and howinformation will be documented.The leading organization should keep records and make them availableupon request, which requires resources. Proper documentation enhances transparency andaccountability, aids in decision-making processes and provides a reference for future assessments.
The leading institution should set up a coordination and steering team. Core coordination can help tomanage the process and to assist and advise the health, welfare and other relevant authorities.
3. The framework for the assessment

31
PART 1. CONTEXT
The process design includes:
• the timing and scale of the assessment;
• the language: for example, indigenous or other minority languages might be needed;
• the information requirements;
• the peer review process;
• the terms of reference of the assessment; and
• the procedures for internal and external communication mechanisms, meetings and decision-makingprocesses (if applicable).
Generating and exchanging knowledge
A primary task of the health ministry is to facilitate the successful building of a foundation ofinterdisciplinary evidence and action to identify and manage the potential risks to human health fromclimate change. Government and nongovernmental organizations, public health organizations, scientificresearchers and policy-makers collaboratively identify possible human health impact from climatechange and adaptation strategies, policies and measures to minimize potential adverse consequences.These feed into future monitoring and surveillance work to create an iterative cycle of assessment andpolicy development (see below).The health ministry facilitates the organization of the assessment, so that the assessment conclusionsand recommendations are useful for scientific studies, for giving priority to and implementingadaptation measures and for the needs of policy research.
The results of the assessment of vulnerability and adaptation need to be synthesized and communicatedto decision-makers and policy-makers.The objectives include identifying changes in risk patterns andopportunities, identifying links between sectors, vulnerable groups and stakeholder responses andidentifying adaptation measures and policies. Ideally, the individuals or groups conducting theassessment coordinate and collaborate throughout the assessment, so that the results can be easilyintegrated into a single product, such as a report.
Policy development and recommendations
The health ministry, together with experts and stakeholders, collectively develops the country’sassessment of health vulnerability and adaptation. Based on this process, the health ministrycollaboratively develops integrated health and well-being strategies, policies and measures for climatechange at the national, regional and community levels that effectively manage the risks to healthidentified in the assessment. This collaborative process encourages all other partners in promotinghealth and well-being to develop and incorporate integrated collaborative adaptation policies andmeasures for climate change into their policies. Although this is fundamentally a risk managementactivity,policy implications should be considered throughout the assessment process.Risk managers andpolicy-makers should therefore be identified as relevant stakeholders and involved throughout theassessment.
Steps 1 to 7 described in Chapter 2 lead to the identification of current and future vulnerability toclimate variability and change and to the identification of desirable adaptation options. For riskmanagement and policy development, risks need to be ranked, policy options identified and a strategyselected and implemented.Assessment should proactively analyse the costs and benefits of the policy measures recommended foradaptation to climate change.The assessment should not only inform policy-makers but also enable them

32
to make evidence-based decisions (Table 3.1). Decision-making is a social and political process that theassessment aims to inform.Assessment should help:
• to make the problem and the potential impact explicit and clear;
• to identify strategies,policies and measures that could reduce the potential adverse effects for a rangeof time frames;
• to establish programmes to evaluate specific strategies, policies and measures;
• to identify research gaps; and
• to assist decision-makers in choosing between competing alternatives.
Setting the research agenda
Assessments are iterative in nature.Key research gaps that are identified should guide the priority-settingof research to fill these gaps, and new research findings can advance future assessment.When differentsectors are part of assessing vulnerability and adaptation, exchange of findings should be encour
3. The framework for the assessment
TABLE 3.1. ASSESSMENT OF HEALTH VULNERABILITY AND ADAPTATION: PLANNED KEY MANAGEMENT DELIVERABLES
Pol icy development
Fac i l i ta te the organiza t ion o f in terd isc ip l inar y foraof po l icy-makers and dec is ion-makers to ident i f ypo l icy quest ions and research needs
Fac i l i ta te the deve lopment o f comprehens ive ,in terd isc ip l inar y assessment o f hea l th vu lnerab i l i t yand adapta t ion a t the nat iona l leve l
Organize in terd isc ip l inar y fora to set up a s t ruc tureddia logue to br ing research resu l ts forward to in formpol icy on heal th and wel l -be ing
Deve lop in tegrated heal th and wel l -be ing po l ic ies forc l imate change that e f fec t i ve ly manage the r isks toheal th
Fac i l i ta te the deve lopment o f moni tor ing andeva luat ion mechanisms to respond to changingc l imate condi t ions , evo lv ing heal th impact concernsand oppor tun i t ies for adapta t ion
Par tnership development
Secure externa l fund ing , techn ica l ass is tance and datasources to in i t ia te and conduct in terd isc ip l inar yassessment o f hea l th vu lnerab i l i t y and adapta t ion
Fac i l i ta te the organiza t ion o f key nat iona l andin ternat iona l s takeholders for an overarch ing s teer inggroup and in terd isc ip l inar y fora o f researchers , po l icyanalys ts and dec is ion-makers for work ing groups
Prov ide t ra in ing resources and ser v ices for work inggroup assessors and researchers
Fac i l i ta te e lec t ron ic access to the knowledgegenerated , sur ve i l lance and moni tor ing data ,in format ion sources and oppor tun i t ies for d ia logue
Fac i l i ta te the organiza t ion o f a mul t id isc ip l inar ynetwork o f researchers to conduct peer rev iew ofassessment f ind ings
Knowledge generation and exchange
Assess the u t i l i t y and e f f ic iency o f var ious methods andtoo ls to conduct the assessment and ident i f y capac i t yl imi ta t ions , resource needs and in format ion gaps
Fac i l i ta te the organiza t ion o f in terd isc ip l inar y fora o fresearchers , po l icy ana lys ts and dec is ion-makers toident i f y research needs for generat ing knowledge andfor promot ing formal and in formal d ia logue
Develop e f fec t i ve ways o f communicat ing researchresu l ts to fac i l i ta te dec is ion-making
Assess and synthes ize research f ind ings
Deve lop mechanisms for s tor ing and re t r iev ingin format ion
33
PART 1. CONTEXT
aged across disciplines. Several health issues relate to impact in a variety of other sectors, such as coastalzones, water and agriculture.
Assessment teams
Because the issues involved are complex, insight is required from multiple and diverse disciplines.Assessment teams must therefore comprise researchers from a variety of disciplines working togetherto integrate their results, such as public health, climatology, economics, social sciences, environmentalscience and ecology. Each discipline alone is complex, and extra incentives should therefore be in placeto encourage assessors to reach across established boundaries.
Assessment also entails considering how human behaviour might contribute to or ameliorate the risks.The extent to which climate change may harm human health depends on people’s ability to successfullyadapt to new climate conditions.This ability may depend on social, political, economic, environmental,technological and demographic factors that can affect human health. Hence, assessment must includeexpertise from the social,political,environmental and engineering sciences. Including stakeholders withinformation relevant to pertinent cultural and social practices may also be appropriate.
Levels of assessment
The material and human resources available result in vulnerability and adaptation being assessed atvarious levels.
A basic assessment could be conducted using readily available information and data, such as previousassessments, literature reviews by the IPCC and others and available region-specific health data. Limitedanalysis may be conducted of regional health data, such as plotting the data against weather variablesover time (Part II further discusses methods). Consultation with stakeholders is relatively limited.Theresult may produce trends in disease rates, and the effects may be minimally quantified, if at all.
A more comprehensive assessment could include a literature search focused on the goals of theassessment, some quantitative assessment using available data (such as the incidence or prevalence ofweather-sensitive diseases), more involvement by stakeholders, some quantification of effects and aformal peer review of results.
An even more comprehensive assessment could include a detailed literature review, collecting new dataand/or generating new models to estimate impact, extensive analysis of quantification and sensitivity,extensive stakeholder involvement throughout the assessment process, formal uncertainty analysis andformal peer review.
Peer review process
Peer review is a critical step for ensuring the scientific credibility of assessment results.The peer reviewprocess must be rigorous and open, have broad-based participation and be transparent and welldocumented. For this to occur, a review process should include the following minimal elements.
Technical review. A technical review should be conducted to evaluate the accuracy and validity ofstatements of fact and interpretations of data.Technical reviews should focus on analyses from specificdisciplines (presumably articulated in different sections of the final assessment report). The expertreviewers included in this step should include specialists active in relevant disciplines or fields ofendeavour who did not participate in the assessment process.
Comprehensive review. Experts with broad scientific and technical expertise relevant to the particular
34
region (or health effect) under study should comprehensively review the entire document. Thesereviewers should not have participated in the assessment process.
Public and stakeholder review. The assessment report should be circulated for comment to a range ofinterested parties, including the stakeholders engaged in the assessment. The report should also beavailable to the public upon request during the review period.
Documentation of reviews and responses. To ensure the transparency and credibility of the reviewprocess, a document should be prepared that compiles and summarizes all broad categories ofcomments and explains the responses of the assessment team.
Dissemination and risk communication
Risk communication is an “interactive process of exchange of information and opinion amongindividuals, groups, and institutions” (National Research Council, 1989).This process is defined by levelsof involvement in strategies, policies and measures aimed at managing or controlling health orenvironmental risks.Traditional messages about health risk tend to flow one way to motivate individualbehavioural change among stakeholders and policy-makers. Effective risk communications is a two-wayprocess including all exchanges among interested parties (individuals, social groups, industry andgovernments). It is a key element of responsible management. Government agencies, industry andnongovernmental organizations are all expected to take part in this communication effort.
The risk communication process is deeply embedded in broader social issues, which means that theremay be many barriers and problems.A key barrier is the differences in how interested parties measure,describe and perceive risk.
Planning for risk communication
Timeliness is essential to effective risk communication. Risk communication is, by definition, proactiveand may involve many stakeholders and audiences,various levels of communication and phases or stagesof communication to accommodate the needs inherent in each step of the assessment.
Key questions to be considered include:
• Who is responsible for initiating risk communication programmes?
• When should risk communication be started?
• What are the key messages to be delivered and what content supports them?
• Who are the key audiences and at what point should they be involved?
• What listening or response mechanisms will be in place to ensure two-way communicationthroughout the process?
• How is the effectiveness of communication going to be monitored?
Trust is a very important ingredient. National institutions are not always those that generate the mosttrust. An evaluation of both the reality and the perception of the health ministry’s performance willprovide important information in developing the strategic approach to communication. Continuous,two-way, open and responsive communication will help to establish trustworthiness.
One of the basic steps for success is early involvement of key stakeholders; knowing the stakeholders
3. The framework for the assessment
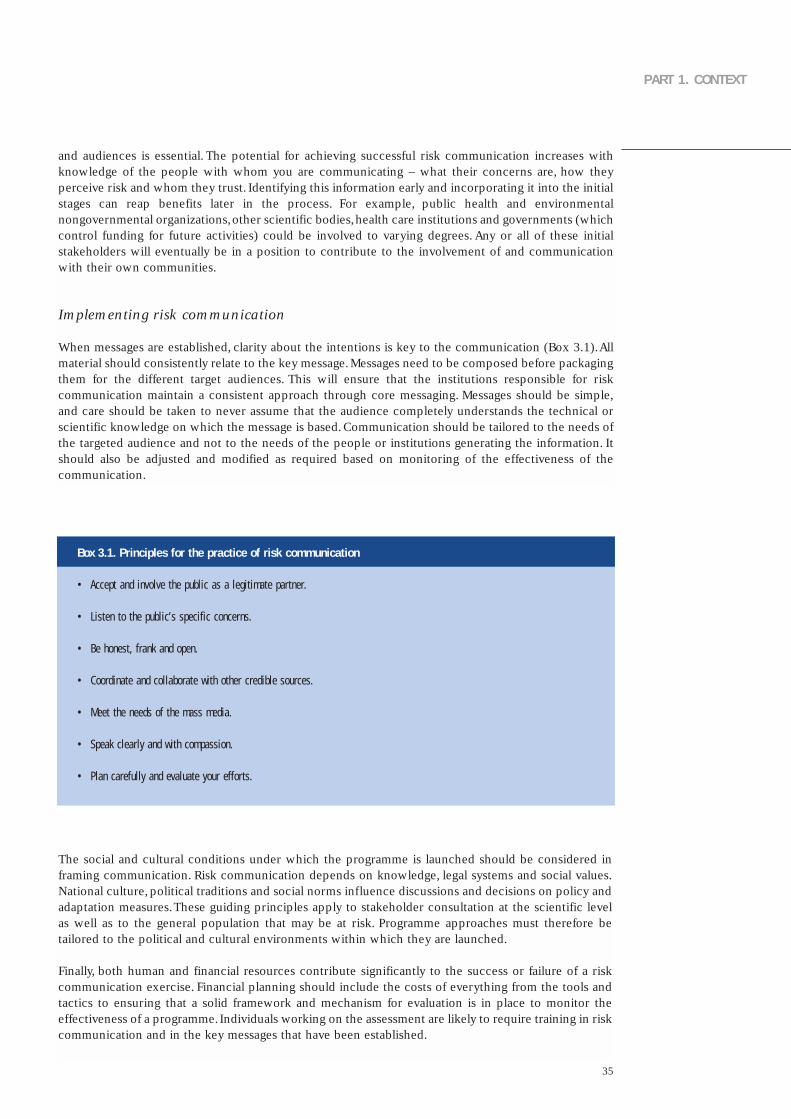
35
PART 1. CONTEXT
and audiences is essential. The potential for achieving successful risk communication increases withknowledge of the people with whom you are communicating – what their concerns are, how theyperceive risk and whom they trust. Identifying this information early and incorporating it into the initialstages can reap benefits later in the process. For example, public health and environmentalnongovernmental organizations,other scientific bodies,health care institutions and governments (whichcontrol funding for future activities) could be involved to varying degrees. Any or all of these initialstakeholders will eventually be in a position to contribute to the involvement of and communicationwith their own communities.
Implementing risk communication
When messages are established, clarity about the intentions is key to the communication (Box 3.1).Allmaterial should consistently relate to the key message.Messages need to be composed before packagingthem for the different target audiences. This will ensure that the institutions responsible for riskcommunication maintain a consistent approach through core messaging. Messages should be simple,and care should be taken to never assume that the audience completely understands the technical orscientific knowledge on which the message is based. Communication should be tailored to the needs ofthe targeted audience and not to the needs of the people or institutions generating the information. Itshould also be adjusted and modified as required based on monitoring of the effectiveness of thecommunication.
Box 3.1. Principles for the practice of risk communication
• Accept and invo lve the publ ic as a leg i t imate par tner.
• L is ten to the publ ic ’s spec i f ic concerns .
• Be honest , f rank and open .
• Coord inate and co l laborate wi th o ther cred ib le sources .
• Meet the needs o f the mass media .
• Speak c lear ly and wi th compass ion .
• Plan carefu l l y and eva luate your e f for ts .
The social and cultural conditions under which the programme is launched should be considered inframing communication. Risk communication depends on knowledge, legal systems and social values.National culture, political traditions and social norms influence discussions and decisions on policy andadaptation measures.These guiding principles apply to stakeholder consultation at the scientific levelas well as to the general population that may be at risk. Programme approaches must therefore betailored to the political and cultural environments within which they are launched.
Finally, both human and financial resources contribute significantly to the success or failure of a riskcommunication exercise. Financial planning should include the costs of everything from the tools andtactics to ensuring that a solid framework and mechanism for evaluation is in place to monitor theeffectiveness of a programme. Individuals working on the assessment are likely to require training in riskcommunication and in the key messages that have been established.


37
PART II. METHODS AND TOOLS
4. Quantitative health impact assessment
5. Direct effects of heat and heat-waves
6. Air pollution
7. Disasters: floods and windstorms
8. Vector-borne diseases
9. Waterborne and foodborne diarrhoeal diseases
10. Stratospheric ozone depletion
11. Food security
12. Vulnerable populations
38
This part of the publication describes a range of methods and tools that can be applied within climatechange and health assessment. Chapter 4 describes tools for quantitative risk assessment that can beapplied across a limited range of health outcomes. Recommendations are made for the use of certainapproaches or data sources to ensure some standardization in assessment between countries and overtime. However, quantitative risk assessment is appropriate for few potential health outcomes, and manyother methods are essential to comprehensively assess vulnerability, such as social science andqualitative methods.Many countries do not currently have sufficient resources, especially data on healthoutcomes, to undertake epidemiological studies or quantitative risk assessment.
Chapters 5 to 10 describe methods and tools in relation to specific health outcomes. Methods arerelatively well established for some outcomes, such as vector-borne diseases.
Chapters 11 and 12 focus on effects that are of concern but are less amenable to quantitative riskassessment, either because data and models are not available or because the effects are very uncertain,such as population displacement.An assessment needs to include the effects of high-risk, low-probabilityevents.
This publication cannot describe in detail the methods used for epidemiological research or riskassessment. Where possible, readers are referred to more detailed sources of information. For manyoutcomes, formal assessment methods have not yet been developed.

39
PART 2. METHODS AND TOOLS
TABLE 4.1 SUMMARY OF THE COMPONENTS OF ASSESSMENT
Issues addressed in Par t I I forspecif ic health outcomes
What is the ev idence that c l imate change cou ldaf fec t hea l th outcomes?
Methods for es t imat ing the e f fec t o f c l imate andweather on heal th outcomes
Methods for es t imat ing fu ture heal th impacta t t r ibu tab le to c l imate change
Adapta t ion: s t ra teg ies , po l ic ies and measures
Corresponding step in Par t I
Step 2 . Descr ibe the assoc ia t ions between d iseaseoutcomes and c l imate var iab i l i t y and change
Step 4 . Rev iew the impl ica t ions o f the potent ia limpact o f c l imate var iab i l i t y and change on o thersectors – such as agr icu l ture and food supply , waterresources , d isasters , coasta l and r iver f lood ing –and the consequences for hea l th
Step 2 . Descr ibe the assoc ia t ions between d iseaseoutcomes and weather and c l imate
Step 5 . Es t imate the fu ture potent ia l hea l th impactus ing scenar ios o f fu ture c l imate change , popula t iongrowth and other fac tors and descr ibe the uncer ta in t y
Step 3 . Ident i f y and descr ibe current s t ra teg ies ,po l ic ies and measures that reduce the burden ofc l imate-sens i t i ve d iseases
Step 7. Ident i f y add i t iona l adapta t ion po l ic ies andmeasures to reduce potent ia l negat ive hea l thef fec ts , inc lud ing procedures for the i r eva luat ionaf ter implementat ion
Component
• The s ta tus o f current sc ient i f ic knowledge on theexposure and the re ference to popula t ion o fin terest
• The potent ia l e f fec ts o f c l imate change on o therareas that have impl ica t ions for hea l th
• Any ava i lab le scenar ios
• Addi t iona l exper t ise
• The methods o f ep idemio log ica l s tud ies o fweather and c l imate e f fec ts current ly ava i lab le
• Ident i f ica t ion and use o f scenar ios , deve lop ingmodels and assess ing uncer ta in t y in re la t ion tothe quant i ta t i ve outcomes
• Some examples o f current adapta t ion measuresand addi t iona l measures that cou ld beimplemented or should be implemented in thefu ture

40
Environment and health: causal framework
4. Quantitative health impact assessment
Several different frameworks have been used in studying the environmental causes of disease. Thedriving forces–pressures–state–exposure–effect–action framework is widely used (Fig. 4.1). Drivingforces are the factors that motivate and push the environmental processes involved. Pressures arenormally expressed through human occupation or exploitation of the environment. State is the currentstatus of the environment. Exposure refers to the intersection between people and the hazard inherentin the environment.
Fig. 4.1 illustrates how the driving forces–pressures–state–exposure–effect–action framework can beadapted to address the potential health effects of global climate change. The framework can bedeveloped to identify the environmental causes of disease in a causal web. Proximal causes of diseaseare the more familiar types of exposure addressed within traditional environmental epidemiology, suchas pollutants in the water, air or soil, or high temperatures.The distal causes of disease are often more
Fig. 4.1. Driving forces–pressures–state–exposure–effect–action framework for describing linkages betweenhealth and climate change
Source: adapted from WHO European Centre for Environment and Health (2001), and Corvalan et al., (2000).
Driving forcesPopulation growth, energy, agriculture, transport policies, change in land use and
urbanization
PressuresGreenhouse gases, aerosols and chlorofluorocarbons
StateClimate change and variability
Health outcomeCardiovascular acute and chronic respiratory diseases, acute diarrhoeal diseases, injuries, vector-borne diseases, allergic diseases and others
ExposureHeat-waves, cold-waves, flooding, droughts, high wind, gradual temperature increase
and air pollution. Changes in environmental conditions, water scarcity, changes invector ranges, food availability and quality
ACTION
International andnational policies
Risk management
Global and nationalmonitoring
Mitigationand adaptationstrategies
Treatment
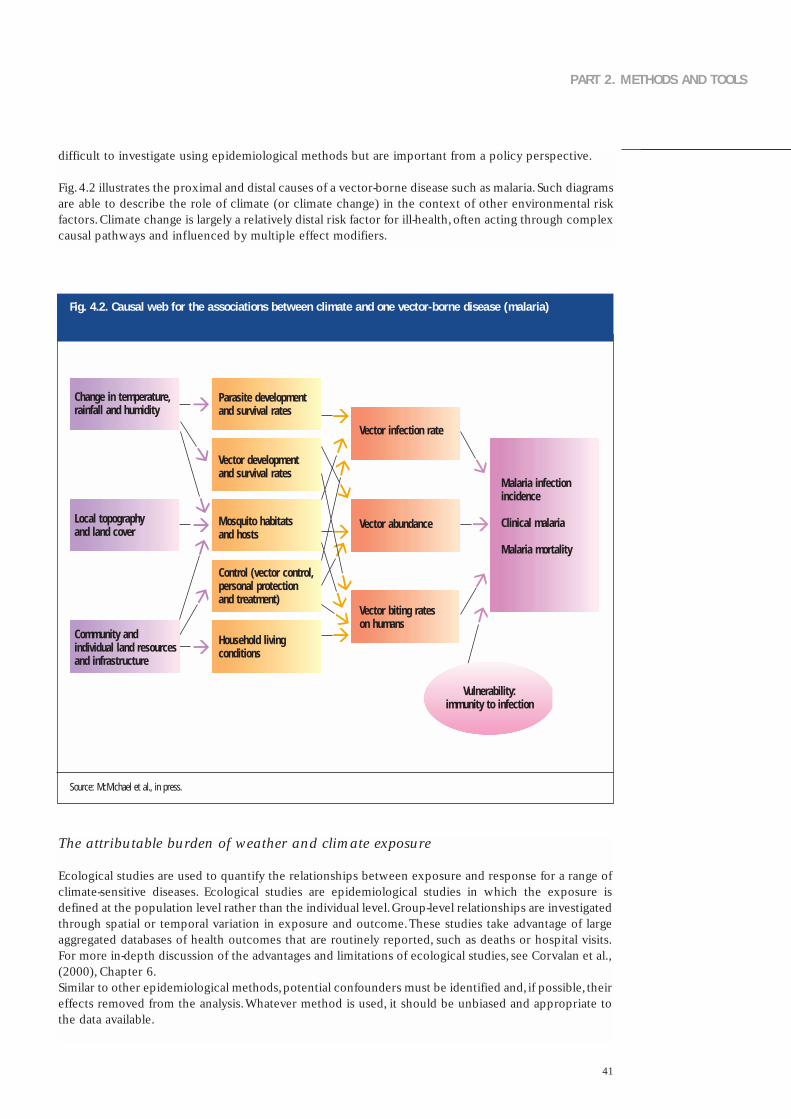
41
PART 2. METHODS AND TOOLS
difficult to investigate using epidemiological methods but are important from a policy perspective.
Fig.4.2 illustrates the proximal and distal causes of a vector-borne disease such as malaria.Such diagramsare able to describe the role of climate (or climate change) in the context of other environmental riskfactors.Climate change is largely a relatively distal risk factor for ill-health,often acting through complexcausal pathways and influenced by multiple effect modifiers.
The attributable burden of weather and climate exposure
Ecological studies are used to quantify the relationships between exposure and response for a range ofclimate-sensitive diseases. Ecological studies are epidemiological studies in which the exposure isdefined at the population level rather than the individual level.Group-level relationships are investigatedthrough spatial or temporal variation in exposure and outcome.These studies take advantage of largeaggregated databases of health outcomes that are routinely reported, such as deaths or hospital visits.For more in-depth discussion of the advantages and limitations of ecological studies, see Corvalan et al.,(2000), Chapter 6.Similar to other epidemiological methods,potential confounders must be identified and, if possible, theireffects removed from the analysis.Whatever method is used, it should be unbiased and appropriate tothe data available.
Fig. 4.2. Causal web for the associations between climate and one vector-borne disease (malaria)
Source: McMichael et al., in press.
Change in temperature,rainfall and humidity
Local topography and land cover
Community and individual land resourcesand infrastructure
Parasite developmentand survival rates
Vector developmentand survival rates
Mosquito habitatsand hosts
Control (vector control,personal protection and treatment)
Household living conditions
Vector infection rate
Vector abundance
Vector biting rates on humans
Vulnerability:immunity to infection
Malaria infectionincidence
Clinical malaria
Malaria mortality
42
4. Quantitative health impact assessment
Time–series methods have been developed to estimate the proportion of disease in a population that isattributable to weather: the day-to-day or week-to-week variation in exposure to weather (Schwartz etal., 1996).Temperature and daily mortality have been shown to be strongly associated (Chapter 5), ashave temperature and cases of diarrhoea (Chapter 9).The advent of geographical information systemsand the georeferencing of disease and exposure data have facilitated the investigation of the spatialdistribution of many vector-borne diseases and/or their vectors (Chapter 8).
Epidemiological research can be used to identify and quantify relationships between exposure andresponse in the relevant population. This relationship can then be applied using risk assessmentmethods to estimate the population at risk or the population-attributable fraction (Bruzzi et al., 1985;Committee on the Medical Effects of Air Pollution, 1998). Risk assessment may be undertaken withoutfirst undertaking expensive epidemiological research if an appropriate exposure–response relationshipis available in the published literature (Samet et al., 1998).
Any calculation of the attributable fraction or the absolute number of attributable cases should clearlystate the underlying assumptions. In particular, the following should be addressed:
• justification for applying the exposure–response relationship beyond the bounds of the observedtemperature range;
• justification for applying the exposure–response relationship derived from a different population; and
• the baseline disease incidence used to estimate attributable cases.
In traditional environmental epidemiology, only a proportion of the population is exposed to theexposure (a pollutant) of concern. Quantifying this exposure is therefore an important step in theassessment process. In climate change assessment, the whole population is assumed to be exposed tochanges in climate, although the degree of change may vary spatially (Campbell-Lendrum et al., 2003).Groups within a population may differ in sensitivity (exposure–response relationships). For example,mortality among elderly people is much more sensitive to higher temperatures than is mortality inyounger adults.
The attributable burden of climate change
Projecting mortality or morbidity into the future is difficult. An important task for public health isknowing the current and future burdens of disease to facilitate health policy decisions. In the short term,predictions of infectious diseases are modelled to estimate the course of an epidemic (such as HIV/AIDSor measles). Projections can be made based on current exposure (such as smoking) for diseases with along latency (such as lung cancer).
Projecting the potential health impact of climate change requires different methods because theobjective is to estimate the impact of different types of (future) climate exposure on different (future)disease patterns at specific times in the future. At the simplest level, the burden of disease attributableto climate change can be calculated as:
Attributable burden = (estimated burden of disease under climate change scenario) – (estimatedburden of disease under a baseline climate, such as that in 1961–1990).
Using this scenario-based approach, nothing changes in the future world except the climate.Althoughthis is unlikely to be realistic, for many reasons, it is a useful approach as it separates out the contributionof climate from other factors that determine the burden of disease, such as population growth, ageingand socioeconomic development.
In 2002, climate change was one of the types of environmental exposure analysed in the WHOcomparative risk assessment of the global burden of disease (WHO, 2002a; Campbell-Lendrum et al.,
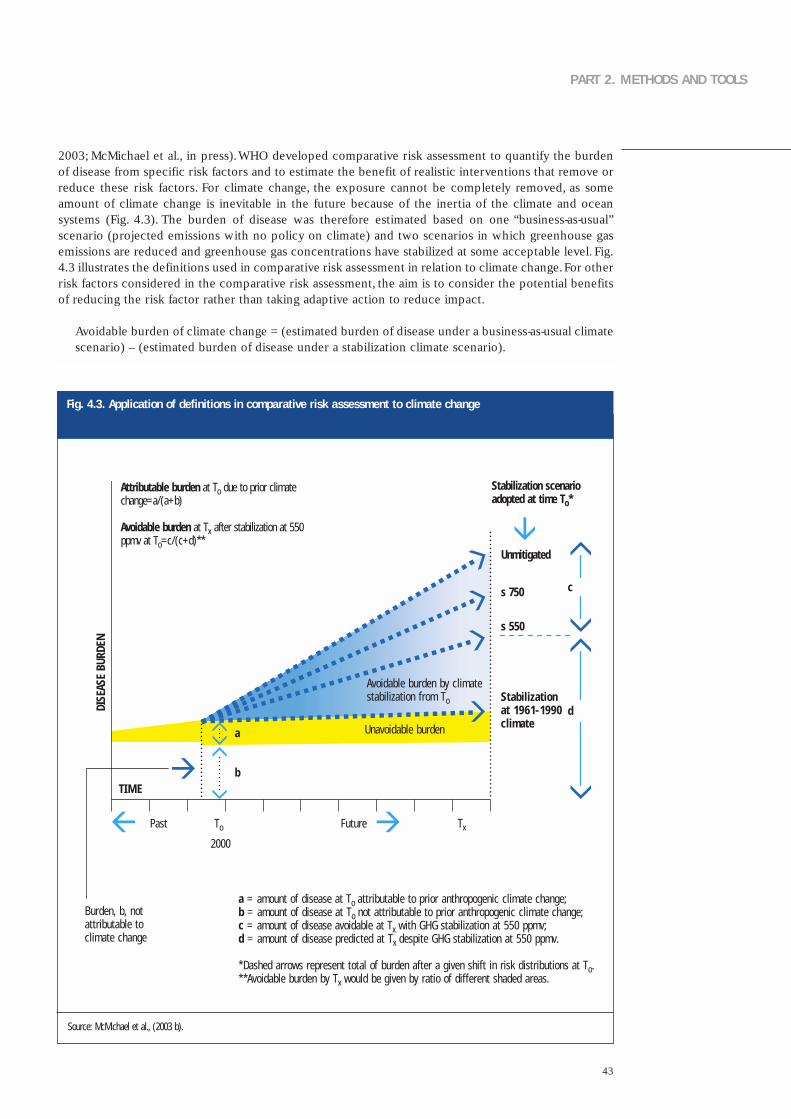
43
PART 2. METHODS AND TOOLS
2003; McMichael et al., in press).WHO developed comparative risk assessment to quantify the burdenof disease from specific risk factors and to estimate the benefit of realistic interventions that remove orreduce these risk factors. For climate change, the exposure cannot be completely removed, as someamount of climate change is inevitable in the future because of the inertia of the climate and oceansystems (Fig. 4.3). The burden of disease was therefore estimated based on one “business-as-usual”scenario (projected emissions with no policy on climate) and two scenarios in which greenhouse gasemissions are reduced and greenhouse gas concentrations have stabilized at some acceptable level. Fig.4.3 illustrates the definitions used in comparative risk assessment in relation to climate change.For otherrisk factors considered in the comparative risk assessment, the aim is to consider the potential benefitsof reducing the risk factor rather than taking adaptive action to reduce impact.
Avoidable burden of climate change = (estimated burden of disease under a business-as-usual climatescenario) – (estimated burden of disease under a stabilization climate scenario).
Fig. 4.3. Application of definitions in comparative risk assessment to climate change
Source: McMichael et al., (2003 b).
Stabilization scenarioadopted at time To*
Unmitigated
s 750
s 550
Stabilizationat 1961-1990climate
Avoidable burden by climatestabilization from To
a = amount of disease at To attributable to prior anthropogenic climate change;b = amount of disease at To not attributable to prior anthropogenic climate change;c = amount of disease avoidable at Tx with GHG stabilization at 550 ppmv;d = amount of disease predicted at Tx despite GHG stabilization at 550 ppmv.
*Dashed arrows represent total of burden after a given shift in risk distributions at To.**Avoidable burden by Tx would be given by ratio of different shaded areas.
Attributable burden at To due to prior climatechange=a/(a+b)
Avoidable burden at Tx after stabilization at 550ppmv at To=c/(c+d)**
Burden, b, not attributable to climate change
DISE
ASE
BURD
EN
Past To TxFuture
TIME
2000
Unavoidable burden
c
d
a
b

44
Models of the impact of climate on health have been developed for a limited range of health outcomes.These are described in the following chapters.The choice of model depends on several factors, such asthe purpose of the study and the type of data available. Integrated health risk assessment uses any or allof these methods to forecast the potential impact of global climate change and other majorenvironmental changes (such as population growth or urbanization) and policy responses upon humanhealth. However, quantitative modelling is only one approach for describing future vulnerability to thepotential health effects of climate change (see Chapter 2), and other methods are more appropriate forsome outcomes.
Systematic literature review
Thorough review of the relevant literature is required to provide a solid basis for health impactassessment. Such a review identifies existing knowledge and key gaps. One approach is to convene anexpert panel to conduct the review. It is important that the most appropriate experts be identified andthat they represent a range of skills and subject areas that are required for the assessment.With respectto climate change, having academic experts in the various diseases of concern as well as a climatologistwould be important.Clearly defining a search strategy is important (Box 4.1).This would include specifying the search terms(such as exposure and outcome) and the databases that will be searched (Annex 2).
4. Quantitative health impact assessment
Box 4.1. Specific steps of a literature search
1. Determine the scope of the l i ter ature rev iew
1.1 . Scope• Inc lus ion cr i ter ia• Exc lus ion cr i ter ia
1.2 . Types of l i terature• Inc lus ion cr i ter ia• Exc lus ion cr i ter ia (such as exc lud ing newspaper ar t ic les or non-peer-
rev iewed mater ia l )
2. Determine the sources of re levant l i ter ature
2.1 . Pr imary sources (such as or ig ina l peer-rev iewed ar t ic les)
2.2 . Secondar y and ter t iar y sources (a lso cal led grey l i terature)such as rev iew ar t ic les , repor ts , c i tat ions in journal ar t ic les ,books , l i terature d i rector ies , Internet databases , newspapers ,personal communicat ions and unpubl ished data
3. Locate l i ter ature
4. Review and evaluate l i ter ature
4.1 Develop evaluat ion cr i ter ia
4 .2 Evaluate each paper in re lat ion to• Methods used• Relevance to loca l area• Val id i t y o f f ind ings
5. Synthesize knowledge
6. Ident i fy research gaps

45
PART 2. METHODS AND TOOLS
The types of literature to be included should be decided at the beginning of the review.The assessmentmay include unpublished data from official sources (such as health statistics).An experienced literaturesearcher familiar with the relevant public health subject area should ideally be hired to perform theseactivities. Comprehensive literature review requires time and money.
Gaining access to literature in countries with less well developed library and Internet systems or fewliterature or journal subscriptions may be difficult. A current WHO initiative is promoting access tointernational journals for developing countries. The Health InterNetwork was created to bridge thedigital divide in health, ensuring that relevant information – and the technologies to deliver it – arewidely available and effectively used by health personnel: professionals, researchers and scientists andpolicy-makers (see Annex 2).
Using scenarios to estimate future effects
Scenarios provide an important tool for estimating the potential impact of climate change on specifichealth outcomes. Scenarios do not predict future worlds or future climates. There are many ways ofapplying scenarios, which have been variously defined as:
• plausible and often simplified descriptions of how the future may develop based on a coherent andinternally consistent set of assumptions about driving forces and key relationships;
• hypothetical sequences of events constructed for the purpose of focusing attention on causalprocesses and decision points; and
• archetypal descriptions of alternative images of the future, created from mental maps or models thatreflect different perspectives on past, present and future developments.
Participatory methods are increasingly used for designing scenarios. The latest scenarios also containboth a strong narrative and a quantitative component (Box 4.2) (Nakicenovic & Swart, 2000).These twotrends can complement and reinforce each other: a group of stakeholders with diverse knowledge,experiences and perspectives provides greater richness to scenarios, and appealing narrativesunderpinned by numbers can engage key stakeholders.
Box 4.2. The IPCC scenarios: special report on emission scenarios (SRES)
The I P CC spec ia l repor t on emiss ion scenar ios (Nak icenov ic & Swar t , 2000) documents a su i te o f g loba l deve lopmentscenar ios , which the I P CC may use as foundat ion for i ts Four th Assessment Repor t . Th is means that those under tak ingimpact and adapta t ion s tud ies wi l l be act ive ly encouraged to use these scenar ios . The scenar ios couple fu tureemiss ions pathways to exp l ic i t l y def ined fu ture parad igms of the wor ld that have the i r own un ique t rends in popula t iongrowth and soc ioeconomic deve lopment .
These scenar ios are non- in ter vent ion is t scenar ios and imply no exp l ic i t c l imate po l ic ies to reduce emiss ions . The a im of the scenar ios was to prov ide cons is tent input to c l imate models and impact models . A l l scenar ios arecons idered equal ly poss ib le , and there is no best guess .
The scenar ios are presented in four s tor y l ines that represent mutua l l y cons is tent character iza t ions o f fu ture s ta tes o fthe wor ld dur ing the 21st centur y , inc lud ing demographic and economic deve lopment , energy use and greenhouse gasemiss ions , together wi th assoc ia ted changes in c l imate and sea leve l . Reg iona l d i f ferences and in teract ions ,espec ia l l y between deve lop ing and indust r ia l i zed countr ies , are a lso assessed .
46
Climate scenarios
Climate scenarios are plausible representations of future climate that have been constructed for use ininvestigating the potential impact of climate change. Many national climate scenarios have beenspecifically constructed for national impact assessment. For example, the UKCIP02 scenarios wereconstructed for the United Kingdom impact and adaptation assessments, and guidance was provided fortheir implementation (Hulme et al., 2002). National or regional scenarios are recommended to be usedif they are available.
A climate scenario is not a climate projection or prediction. Climate projections are the results ofexperiments using a climate model driven by scenarios of greenhouse gas emissions and alone rarelyprovide sufficient information to estimate the future impact of climate change.Model output commonlyhas to be manipulated and combined with observed climate data to be usable within the researchcommunities studying vulnerability, impact and adaptation.For further information on climate scenarios,see Houghton et al., (2001).Table 4.2 summarizes the role of various types of climate scenarios.
Ensuring consistency in the methods used to study climate impact is important so that the results canbe compared and evaluated.This includes the time periods used in the studies, both for the baseline(current climate) and future climates. The climate averaged over the 30-year period 1961–1990 istherefore recommended to be used as the baseline climate for climate impact studies, as the vastmajority of research undertaken has used this period.Although WMO and climatologists have recentlyrevised the climate normal, the 30-year period that best represents the current climate, to 1971–2000, itis not recommended that these data be used. Similarly, the research communities studying vulnerability,impact and adaptation within the IPCC have predominantly used three standard 30-year averagedperiods for future assessment:2010–2039 (30 years centred on the 2020s),2040–2069 (30 years centredon the 2050s) and 2070–2099 (30 years centred on the 2080s).
Climate scenarios continue to need to improve temporal resolution (to examine variability andextremes) and spatial resolution.This need for information with higher resolution has to be balancedwith the fact that the scale of information taken from the climate models for scenario development oftenexceeds the reasonable resolution of accuracy of the models themselves. Data for the construction ofclimate scenarios and further guidance information on the use of climate scenarios are available fromthe IPCC Data Distribution Centre (Annex 2). Obtaining expert advice from a climatologist is stronglyrecommended before using any climate information (scenarios or instrumental).
A climate scenario is constructed from climate model experiments using the following steps.
• Compute the difference (such as air temperature) or ratio (such as precipitation and solar radiation)between the climate model control run (unforced) and the climate model forced runs at the modelgrid boxes coinciding with the area of interest (see comments within Houghton et al., (2001),Chapter10 on the use of output for a single relative to a cluster of grid boxes).
• Use change values to adjust the observed climate for the baseline period using the current climate asdefined by the 1961–1990 period for the future period(s) of interest (2020s, 2050s and/or 2080s).
Methods for incorporating high-resolution information into climate scenarios include: regional climatemodelling, statistical downscaling and high-resolution and variable-resolution time-slice techniquesusing an atmospheric-ocean general climate model. Once again, see Houghton et al., (2001) section 13.4for more details on these methods.
The scenarios used in the assessment should incorporate both “high” emissions (leading to upper limitsof the projections of changes in climate) and scenarios in which emissions are reduced by specificclimate policies (mitigation). Stabilization scenarios refer to emissions scenarios in which theconcentration of carbon dioxide (CO2) is stabilized at a given time point (the current global meanconcentration of CO2 is around 370 ppm). For example, an emissions pathway that stabilizes CO2concentrations at 750 ppm by the 2030s delays by around 50 years the 2050 temperature increases
4. Quantitative health impact assessment
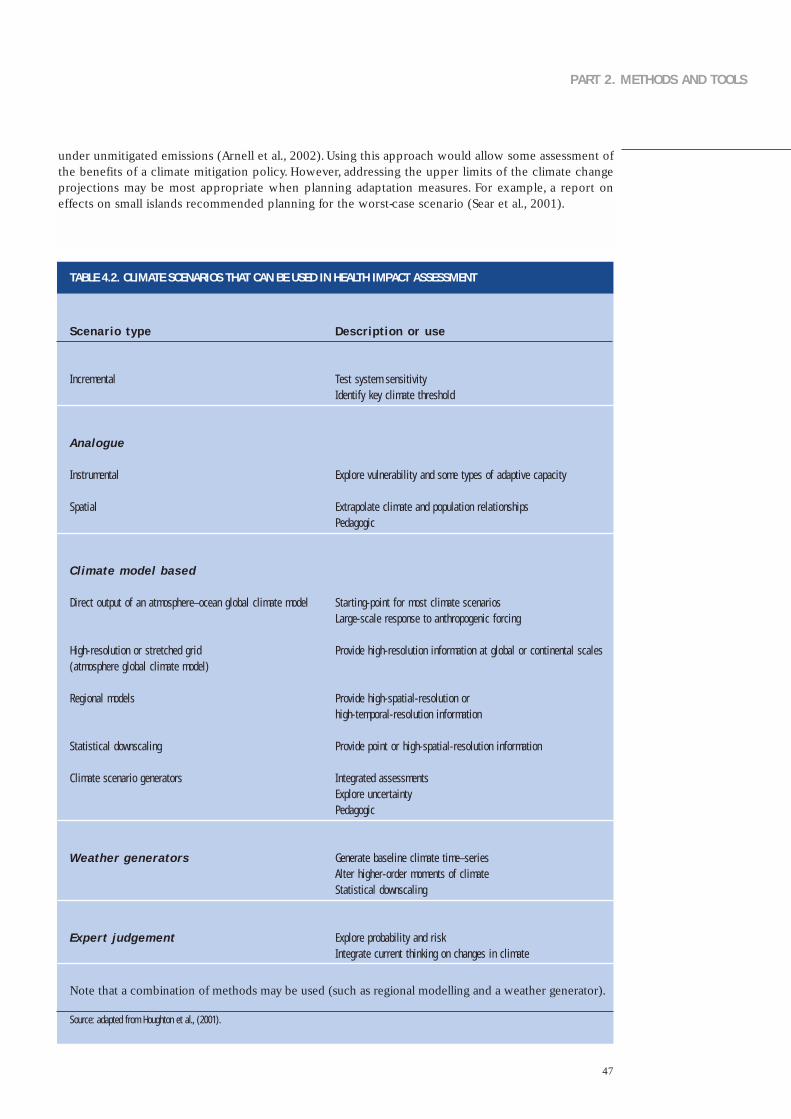
47
PART 2. METHODS AND TOOLS
under unmitigated emissions (Arnell et al., 2002). Using this approach would allow some assessment ofthe benefits of a climate mitigation policy. However, addressing the upper limits of the climate changeprojections may be most appropriate when planning adaptation measures. For example, a report oneffects on small islands recommended planning for the worst-case scenario (Sear et al., 2001).
TABLE 4.2. CLIMATE SCENARIOS THAT CAN BE USED IN HEALTH IMPACT ASSESSMENT
Scenario type
Incrementa l
Analogue
Ins t rumenta l
Spat ia l
Cl imate model based
Direct output o f an a tmosphere–ocean g loba l c l imate model
H igh-reso lu t ion or s t re tched gr id (a tmosphere g loba l c l imate model)
Regiona l models
Sta t is t ica l downscal ing
Cl imate scenar io generators
Weather gener ators
Exper t judgement
Descr ipt ion or use
Test sys tem sens i t i v i t yIdent i f y key c l imate threshold
Exp lore vu lnerab i l i t y and some t ypes o f adapt ive capac i t y
Ex t rapo la te c l imate and popula t ion re la t ionsh ipsPedagogic
Star t ing-po in t for most c l imate scenar iosLarge-sca le response to anthropogenic forc ing
Prov ide h igh-reso lu t ion in format ion a t g loba l or cont inenta l sca les
Prov ide h igh-spat ia l - reso lu t ion or h igh- tempora l - reso lu t ion in format ion
Prov ide po in t or h igh-spat ia l - reso lu t ion in format ion
In tegrated assessmentsExp lore uncer ta in t yPedagogic
Generate base l ine c l imate t ime–ser iesAl ter h igher-order moments o f c l imateSta t is t ica l downscal ing
Exp lore probabi l i t y and r iskIn tegrate current th ink ing on changes in c l imate
Source: adapted from Houghton et al., (2001).
Note that a combination of methods may be used (such as regional modelling and a weather generator).

48
Population scenarios
Population projections are available from a variety of national and international sources. Nationalpopulation projections are available from a central government agency in most countries. These arelikely to include age-specific and other relevant demographic information.However,projections may notbe available for time periods beyond 2020.
Global, regional, national and gridded population scenarios for the SRES illustrative emission scenarios(Box 4.2) will be available on the web site of the Center for International Earth Science InformationNetwork (CIESIN) (Annex 2), based on the Gridded Population of the World version 2.The national andgridded projections are derived from United Nations projections.The population grid (0.5° by 0.5°) andcountry-level averages for individual years from 2000–2100 are available as well as for the three standardperiods (2020s, 2050s and 2080s) to match the climate scenario information available on the IPCC DataDistribution Centre. Guidelines for use of these scenarios are being developed and will be madeavailable on the CIESIN web site.This guidance and the data are also expected to be incorporated ontoa CD-ROM together with climate change scenario information. A word of caution – CIESIN hasdownscaled using relatively simple methods that do not take into account different rates of growth ofcountries within the SRES regions. SRES scenarios are not intended to be used for assessment at thenational level because better sources of population projections are likely to be available. Nationalprojections of population can be developed that are compatible with the scenarios of the emissions ofgreenhouse gas used to force the climate scenarios (Box 4.2).
Several alternative data sets are available that map the current population on a grid (see Annex 2).Thesecan be used with geographical information systems to estimate changes in the size of the population atrisk for a given climate scenario.
Socioeconomic scenarios
Adaptation to climate change will take place in a dynamic social, economic, technological, biophysicaland political context that varies over time and location and across communities. It is essential thatadaptation be included in estimates of future impact.Adaptive capacity is the ability of a system to adjustto climate change (including climate variability and extremes), to moderate potential damages, to takeadvantage of opportunities or to cope with the consequences. These features of communities andregions that appear to determine their adaptive capacity include economic resources, technology,information and skills, social infrastructure, social institutional development and equity in terms of thearrangements governing the allocation of power and access to resources (Smit & Pilifosova, 2001).
Scenarios can be developed regarding possible changes in the adaptive capacity of the community ofinterest. In general, several variables can be identified that determine adaptive capacity and as well asthe plausible states of these variables in the future. One method is to consider two or three states forthe future:
• reduced capacity as a result of deterioration in one or more of the determinants of adaptive capacity;
• similar capacity with little or no change in the determinants; and
• increased capacity as a result of an enhancement in one or more of the determinants.
As in all scenarios, the basis and assumptions for constructing these scenarios must be consistent andplausible in light of the chosen future view (Table 4.3, Box 4.2).That is, the emission (such as SRES),climate and socioeconomic scenarios should be consistent.The topic-specific Chapters 5 to 12 addresssome specific aspects of adaptive capacity.
4. Quantitative health impact assessment

49
PART 2. METHODS AND TOOLS
TABLE 4.3. TYPES OF NON-CLIMATE SCENARIOS THAT CAN BE USED IN HEALTH IMPACT ASSESSMENT
Gross domest ic product per cap i taor re la ted economic ind icators
Target-based scenar io , re f lec t ingan ach ievab le leve l o f d iseasepreva lence and inc idence
Business as usual , based oncurrent leve ls o f d isease orcurrent t rends
Eco log ica l , such as presence ofvector
Env i ronmenta l change scenar ios
Malar ia (To l & Dowlatabadi , 2001) ,d isasters (Yohe & Tol , 2002) and d iarrhoeald isease (Campbel l -Lendrum et a l . , 2003)
Mi l lenn ium Development Goals
Mi l lenn ium Ecosystem Assessment
Nat iona l targets
High inc idence of H I V in fec t ion , h ighinc idence of malar ia , e tc .
Por tuguese nat iona l assessment (Cas imiro &Calhe i ros , 2002)
Syndromes of env i ronmenta l degradat ionpromoted by the Potsdam Ins t i tu te forCl imate Impact Research (Petschel -He ld e ta l . , 1999; German Adv isor y Counc i l onGlobal Change , 1997)
Yes
Yes
Yes
No
No
Global
G loba lor loca l
G loba lor loca l
Loca l
Loca l
Dr iven
Can be l inked
Can be l inked
Can be l inked
Can be l inked
Several initiatives are currently developing national-level indicators of adaptive capacity. Some globalassessments use gross domestic product (GDP) per capita as a national indicator of adaptive capacitybecause the SRES scenarios include a range of GDP projections (Yohe & Tol, 2002). Although SRESscenarios have been downscaled to national projections, they are not appropriate for use at the nationallevel but must be re-aggregated for regional or global assessments. However, the adaptive capacityscenarios should be evaluated in relation to the SRES storylines if the SRES climate scenarios are used.For a national assessment, GDP or income scenarios need only be compatible with the SRES scenarios(Arnell et al., in press).
The economic projections used in SRES are mostly based on national accounts, which measure incomeusing an internationally tradable currency, such as US dollars. Data sets using this measure arecomprehensive, widely accessible and available for several decades. Alternative economic scenariosusing income measured in purchasing power parity (PPP) account in part for different national pricestructures that particularly charge the costs of non-traded goods and services. However, PPP data setsare more limited than market exchange rate data sets (such as GDP per capita in US dollars) and thisreduces their utility. The choice of method depends on the objectives and methods of the riskassessment.Assessors using scenarios should be aware of the advantages and disadvantages, as outlined in Box 4.3.
Type Quantitative Scale SRES l ink Example
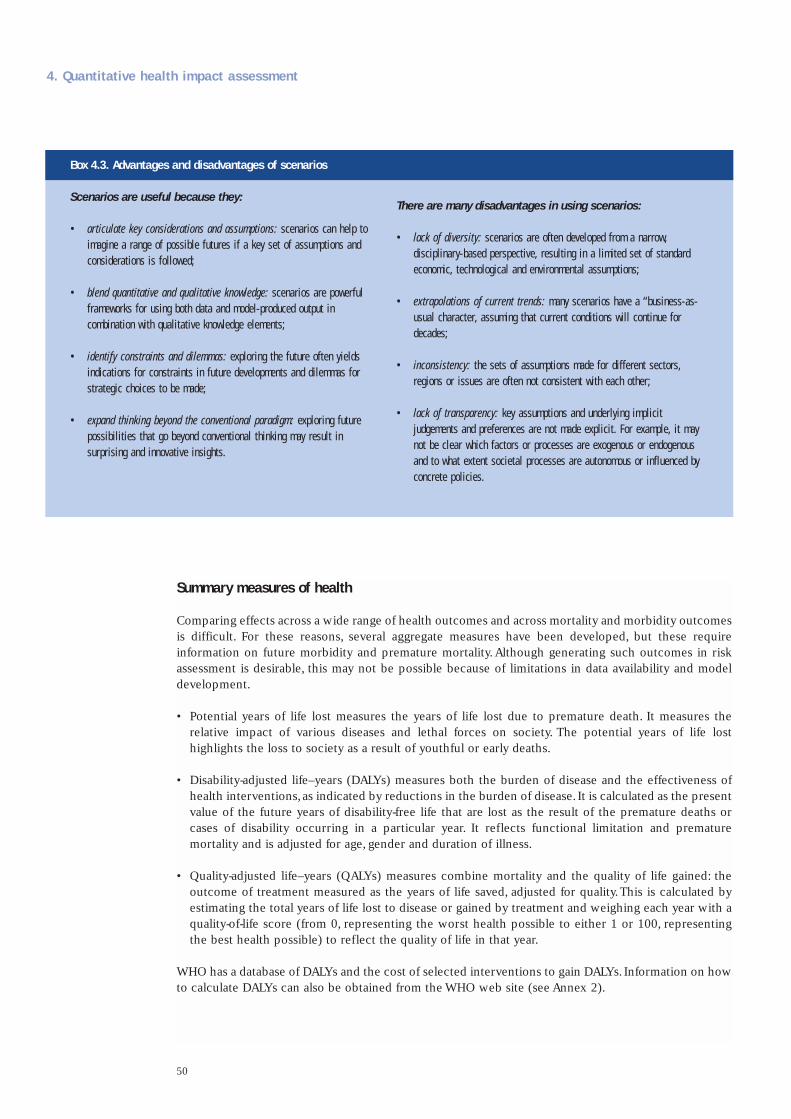
50
Summary measures of health
Comparing effects across a wide range of health outcomes and across mortality and morbidity outcomesis difficult. For these reasons, several aggregate measures have been developed, but these requireinformation on future morbidity and premature mortality. Although generating such outcomes in riskassessment is desirable, this may not be possible because of limitations in data availability and modeldevelopment.
• Potential years of life lost measures the years of life lost due to premature death. It measures therelative impact of various diseases and lethal forces on society. The potential years of life losthighlights the loss to society as a result of youthful or early deaths.
• Disability-adjusted life–years (DALYs) measures both the burden of disease and the effectiveness ofhealth interventions,as indicated by reductions in the burden of disease. It is calculated as the presentvalue of the future years of disability-free life that are lost as the result of the premature deaths orcases of disability occurring in a particular year. It reflects functional limitation and prematuremortality and is adjusted for age, gender and duration of illness.
• Quality-adjusted life–years (QALYs) measures combine mortality and the quality of life gained: theoutcome of treatment measured as the years of life saved, adjusted for quality.This is calculated byestimating the total years of life lost to disease or gained by treatment and weighing each year with aquality-of-life score (from 0, representing the worst health possible to either 1 or 100, representingthe best health possible) to reflect the quality of life in that year.
WHO has a database of DALYs and the cost of selected interventions to gain DALYs. Information on howto calculate DALYs can also be obtained from the WHO web site (see Annex 2).
4. Quantitative health impact assessment
Box 4.3. Advantages and disadvantages of scenarios
Scenarios are useful because they:
• ar t icu la te key considera t ions and assumpt ions: scenar ios can he lp toimagine a range of poss ib le fu tures i f a key set o f assumpt ions andcons iderat ions is fo l lowed;
• blend quant i ta t i ve and qual i ta t i ve knowledge: scenar ios are power fu lf rameworks for us ing both data and model-produced output incombinat ion wi th qua l i ta t i ve knowledge e lements ;
• ident i f y cons t ra in ts and d i lemmas: explor ing the fu ture o f ten y ie ldsind icat ions for const ra in ts in fu ture deve lopments and d i lemmas fors t ra teg ic cho ices to be made;
• expand th ink ing beyond the convent ional parad igm: explor ing fu tureposs ib i l i t ies that go beyond convent iona l th ink ing may resu l t insurpr is ing and innovat ive ins ights .
There are many disadvantages in using scenarios:
• lack o f d i vers i t y : scenar ios are o f ten deve loped f rom a narrow,d isc ip l inar y-based perspect ive , resu l t ing in a l imi ted set o f s tandardeconomic , technolog ica l and env i ronmenta l assumpt ions;
• ex t rapola t ions o f current t rends: many scenar ios have a “bus iness-as-usual character, assuming that current condi t ions wi l l cont inue fordecades;
• inconsis tency : the sets o f assumpt ions made for d i f ferent sectors ,reg ions or issues are o f ten not cons is tent wi th each o ther ;
• lack o f t ransparency: key assumpt ions and under ly ing impl ic i tjudgements and preferences are not made exp l ic i t . For example , i t maynot be c lear which fac tors or processes are exogenous or endogenousand to what ex tent soc ie ta l processes are autonomous or in f luenced byconcrete po l ic ies .

51
PART 2. METHODS AND TOOLS
Describing and quantifying uncertainty
Studies of climate impact span a wide range of approaches, from simple correlation of variables toincreasingly complex integrated assessment of multiple stresses. Many of these studies attempt tointegrate data of varying quality from multiple disciplines.There is always a danger that assessments canundermine their own public credibility because of simplifying assumptions.Managing uncertainty is justas important as reducing uncertainty.
Assessing health outcomes in relation to climate change is a complex task that must accommodate themultiple types of uncertainty that compound across the antecedent environmental and social changes.Many different types of uncertainty relate to the health effects of climate change (Table 4.4).A majorsource of uncertainty relates to the degree to which future emissions of greenhouse gases will changeradiative forcing over the coming century.Greenhouse-gas emissions are driven by complex factors suchas population growth,economic growth and energy policy.Addressing this level of uncertainty is limitedto the emissions scenarios that are available (Box 4.2).This section addresses uncertainty in relation tohealth impact assessment.
TABLE 4.4. EXAMPLES OF SOURCES OF UNCERTAINTY
Source of uncer tainty
Problems wi th data
Prob lems wi th models (re la t ionsh ips between c l imateand heal th)
Other sources o f uncer ta in t y
Examples
• Miss ing components or errors in data• “Noise” in data assoc ia ted wi th b ias or incomplete
observat ions• Random sampl ing error and b iases (nonrepresenta t i veness) in
a sample
• Known processes but unknown funct iona l re la t ionsh ips or errorsin s t ruc ture o f model
• Known s t ruc ture but unknown or erroneous va lues o f someimpor tant parameters
• Known h is tor ica l data and model s t ruc ture but reasons tobe l ieve that the parameters or model or the re la t ionsh ipbetween c l imate and heal th wi l l change over t ime
• Uncer ta in t y regard ing the pred ic tab i l i t y o f the sys tem or e f fec t• Uncer ta in t y in t roduced by approx imat ing or s impl i f y ing
re la t ionsh ips wi th in the model
• Ambiguous ly def ined concepts or terms• Inappropr ia te spat ia l or tempora l un i ts (such as in data on
exposure to c l imate or weather)• Inappropr ia teness o f or lack o f conf idence in the under ly ing
assumpt ions• Uncer ta in t y resu l t ing f rom pro jec t ions o f human behav iour
(such as fu ture d isease pat terns or technolog ica l change) incontras t to uncer ta in t y resu l t ing f rom “natura l” sources (suchas c l imate sens i t i v i t y)
Source: adapted from McCarthy et al., (2001), p. 127.
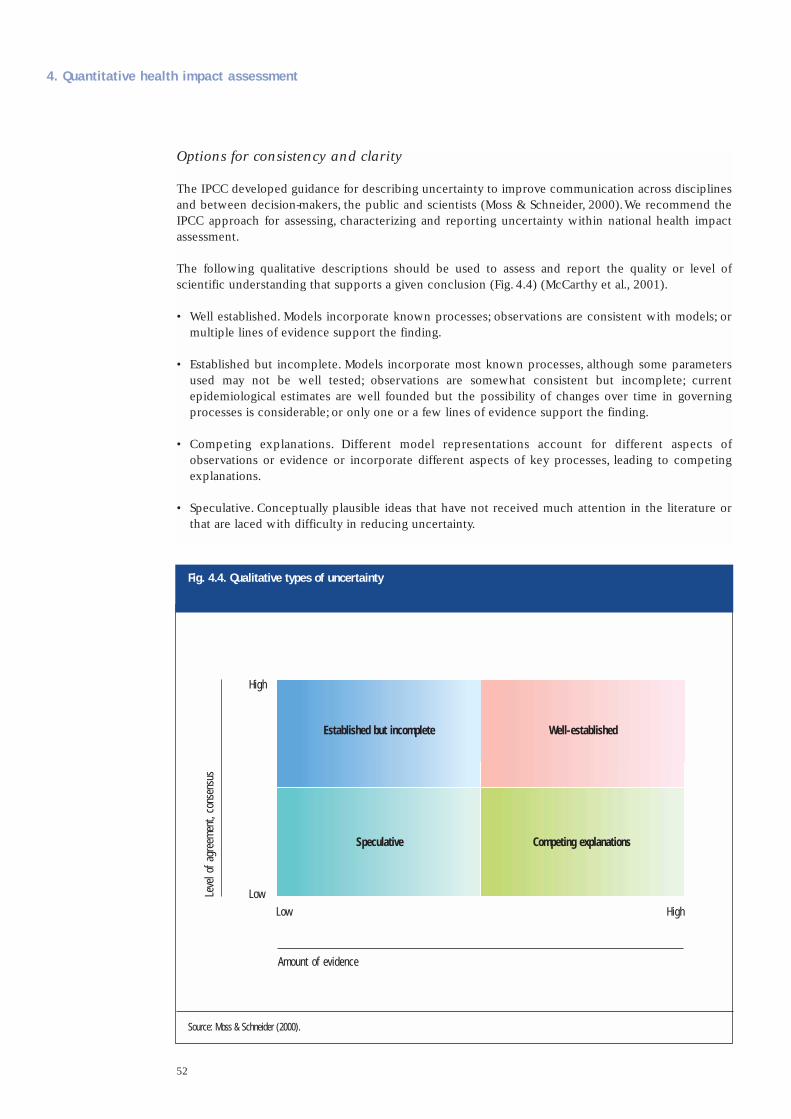
52
Options for consistency and clarity
The IPCC developed guidance for describing uncertainty to improve communication across disciplinesand between decision-makers, the public and scientists (Moss & Schneider, 2000).We recommend theIPCC approach for assessing, characterizing and reporting uncertainty within national health impactassessment.
The following qualitative descriptions should be used to assess and report the quality or level ofscientific understanding that supports a given conclusion (Fig. 4.4) (McCarthy et al., 2001).
• Well established. Models incorporate known processes; observations are consistent with models; ormultiple lines of evidence support the finding.
• Established but incomplete. Models incorporate most known processes, although some parametersused may not be well tested; observations are somewhat consistent but incomplete; currentepidemiological estimates are well founded but the possibility of changes over time in governingprocesses is considerable; or only one or a few lines of evidence support the finding.
• Competing explanations. Different model representations account for different aspects ofobservations or evidence or incorporate different aspects of key processes, leading to competingexplanations.
• Speculative. Conceptually plausible ideas that have not received much attention in the literature orthat are laced with difficulty in reducing uncertainty.
4. Quantitative health impact assessment
Source: Moss & Schneider (2000).
Established but incomplete
Speculative
Low
Amount of evidence
Leve
l of a
gree
men
t, co
nsen
sus
Low
High
High
Well-established
Competing explanations
Fig. 4.4. Qualitative types of uncertainty
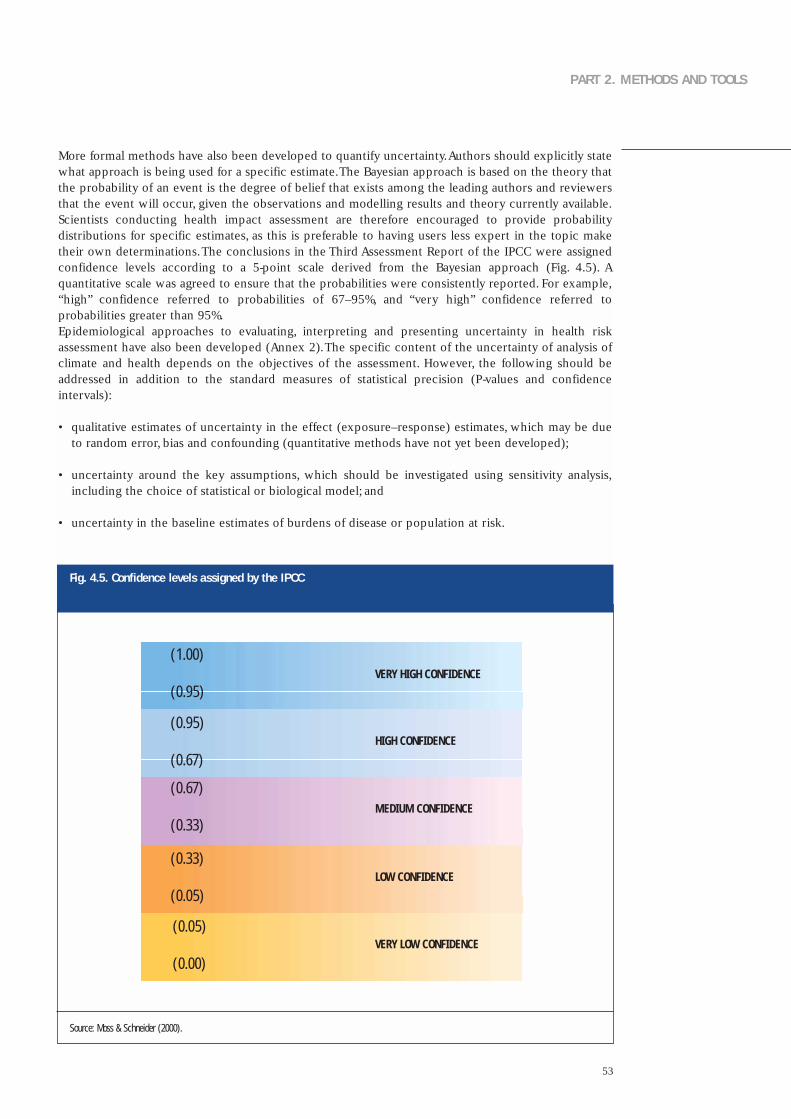
53
PART 2. METHODS AND TOOLS
More formal methods have also been developed to quantify uncertainty.Authors should explicitly statewhat approach is being used for a specific estimate.The Bayesian approach is based on the theory thatthe probability of an event is the degree of belief that exists among the leading authors and reviewersthat the event will occur, given the observations and modelling results and theory currently available.Scientists conducting health impact assessment are therefore encouraged to provide probabilitydistributions for specific estimates, as this is preferable to having users less expert in the topic maketheir own determinations.The conclusions in the Third Assessment Report of the IPCC were assignedconfidence levels according to a 5-point scale derived from the Bayesian approach (Fig. 4.5). Aquantitative scale was agreed to ensure that the probabilities were consistently reported. For example,“high” confidence referred to probabilities of 67–95%, and “very high” confidence referred toprobabilities greater than 95%.Epidemiological approaches to evaluating, interpreting and presenting uncertainty in health riskassessment have also been developed (Annex 2).The specific content of the uncertainty of analysis ofclimate and health depends on the objectives of the assessment. However, the following should beaddressed in addition to the standard measures of statistical precision (P-values and confidenceintervals):
• qualitative estimates of uncertainty in the effect (exposure–response) estimates, which may be dueto random error, bias and confounding (quantitative methods have not yet been developed);
• uncertainty around the key assumptions, which should be investigated using sensitivity analysis,including the choice of statistical or biological model; and
• uncertainty in the baseline estimates of burdens of disease or population at risk.
(1.00)
(0.95)VERY HIGH CONFIDENCE
(0.95)
(0.67)HIGH CONFIDENCE
(0.67)
(0.33)MEDIUM CONFIDENCE
(0.33)
(0.05)LOW CONFIDENCE
(0.05)
(0.00)VERY LOW CONFIDENCE
Source: Moss & Schneider (2000).
Fig. 4.5. Confidence levels assigned by the IPCC

54
What is the evidence that climate change could affect temperature-related mortality andmorbidity?
The health effects of exposure to heat and cold have been studied in several populations (Curriero etal.,2002;McMichael et al., 2003a).Physiological and biometeorological studies have shown that high andlow temperatures affect health and well-being. High temperatures cause well described clinicalsyndromes such as heat stroke, heat exhaustion, heat syncope and heat cramps. Many causes of deathincrease during periods of higher temperatures (heat-waves), especially those from cardiovascular andrespiratory disease in temperate countries.
Epidemiological studies have described seasonal fluctuation in mortality and morbidity. Most temperatecountries have a strong seasonal pattern, with mortality peaking in winter. Populations with tropicalclimates have considerably less seasonality in mortality patterns.
Methods for estimating the effect of the thermal environment on mortality and morbidity
The preferred epidemiological method for estimating the impact of temperature on mortality istime–series studies of daily mortality, following methods developed for air pollution studies (Schwartzet al., 1996).These methods are considered sufficiently rigorous to assess short-term (day-to-day or week-to-week) associations between the environmental exposure and mortality if adjustment is made forlonger-term patterns in the data series. The relationship between temperature and mortality can bederived using a regression model that quantifies the extent to which day-to-day variability in deaths isexplained by variation in temperature.An important step is to remove the seasonal component of thedata series so that only the short-term (day-to-day) associations are left. This is done because non-temperature seasonal effects are thought to strongly contribute to the seasonal pattern of mortality.Several approaches can be used to adjust for season:
• indicators for month;
• Fourier methods that fit sine and cosine patterns to model seasonal cycles in the series; and
• smooth or moving averages, such as the LOESS (a weighted moving average) or smoothing splines.
The relationship between temperature and mortality is often nonlinear across the whole temperaturerange. Most studies report a linear relationship above and below a minimum mortality temperature (orrange of temperatures).Thus, the temperature–mortality relationship in temperate countries is describedas nonlinear (V-shaped or U-shaped) where a minimum mortality point (or threshold) is identified (Fig.5.1). The threshold value and the slope of the temperature–mortality relationship can be quantified(Curriero et al., 2002; McMichael et al., 2003a; Pattenden et al., 2003). Populations in tropical orsubtropical climates are likely to show a different temperature–mortality relationship.
Quantifying temperature-related mortality requires daily counts of deaths, ideally grouped by underlyingcause of death, and temperature measured at a similar temporal and geographical resolution. Mortalitydata are available from national or regional registries in some places. However, the data may not beavailable in digital format. Coding of cause of death also varies between countries and may beincomplete.Attention should be paid to the accuracy with which the date of death is recorded.The impact of individual heat-wave events can be estimated using episode analysis.This method cannotbe applied to estimate future populations at risk from climate change. Studies of heat-wave events canbe used to inform the adaptation assessment.
5. Direct effects of heat and heat-waves
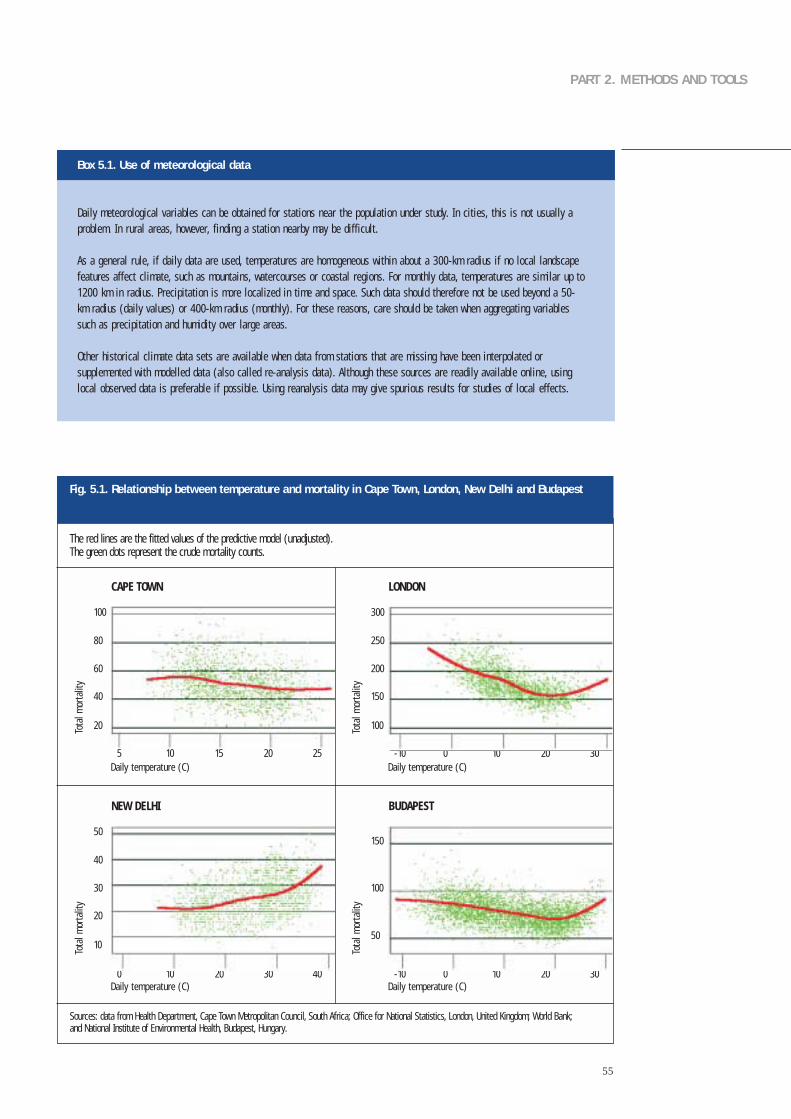
55
PART 2. METHODS AND TOOLS
Box 5.1. Use of meteorological data
Dai ly meteoro log ica l var iab les can be obta ined for s ta t ions near the popula t ion under s tudy . In c i t ies , th is is not usual ly aprob lem. In rura l areas , however, f ind ing a s ta t ion nearby may be d i f f icu l t .
As a genera l ru le , i f da i l y data are used , temperatures are homogeneous wi th in about a 300-km rad ius i f no loca l landscapefeatures a f fec t c l imate , such as mounta ins , watercourses or coasta l reg ions . For month ly data , temperatures are s imi lar up to1200 km in rad ius . Prec ip i ta t ion is more loca l i zed in t ime and space . Such data should therefore not be used beyond a 50-km rad ius (da i l y va lues) or 400-km rad ius (month ly) . For these reasons , care should be taken when aggregat ing var iab lessuch as prec ip i ta t ion and humid i t y over large areas .
Other h is tor ica l c l imate data sets are ava i lab le when data f rom sta t ions that are miss ing have been in terpo la ted orsupplemented wi th model led data (a lso ca l led re-analys is data) . A l though these sources are read i ly ava i lab le on l ine , us ingloca l obser ved data is pre ferab le i f poss ib le . Us ing reanalys is data may g ive spur ious resu l ts for s tud ies o f loca l e f fec ts .
Sources: data from Health Department, Cape Town Metropolitan Council, South Africa; Office for National Statistics, London, United Kingdom; World Bank; and National Institute of Environmental Health, Budapest, Hungary.
CAPE TOWN
100
5 10 15 20 25
Tota
l mor
talit
y
Daily temperature (C)
80
60
40
20
LONDON
300
-10 0 10 20 30
Tota
l mor
talit
y
Daily temperature (C)
250
200
150
100
NEW DELHI
50
0 10 20 30 40
Tota
l mor
talit
y
Daily temperature (C)
40
30
20
10
BUDAPEST
150
-10 0 10 20 30
Tota
l mor
talit
y
Daily temperature (C)
100
50
The red lines are the fitted values of the predictive model (unadjusted). The green dots represent the crude mortality counts.
Fig. 5.1. Relationship between temperature and mortality in Cape Town, London, New Delhi and Budapest

56
Methods for estimating future health impact
Research papers or assessments may have investigated the potential impact of climate change on thefrequency of temperature extremes in a particular region or city.The impact of climate change on the urbanheat island been estimated. Modelling studies (Fig.5.2) have estimated the impact of climate scenarios ona range of biometeorological indices, such as the heat index or perceived temperature (Table 5.1).
5. Direct effects of heat and heat-waves
TABLE 5.1. HEAT-WAVES AND CLIMATE CHANGE: MAPPING HEAT STRESS INDICATORS IN SPACE OR TIME
Study
Barrow & Hulme (1996)
Karacostas & Downing (1996)
Gawi th e t a l . , (1999)
Hulme et a l . , (2002)
Wagner (1999)
Region
Nine s i tes in the Uni ted K ingdom
Oxford , Un i ted K ingdom andThessalon ik i , Greece
Oxford , Un i ted K ingdom andThessalon ik i , Greece
Southern Uni ted K ingdom
Ber l in , Germany
Model
S P ECTR E
Extreme Values model E XAM
Extreme Values model E XAM
Uses da i ly g loba l c l imatemodel output
G loba l c l imate model output
Model output
Probabi l i t ies o f da i l y maximum andmin imum temperate ext remes (suchas maximum temperature > 20 °Cin Ju ly)
Number o f days that exceed thetemperature humid i t y index threshold
Number o f days that exceed thetemperature humid i t y index threshold
Number o f days wi th temperature >23 °C in summer ( temperaturegreater than 90th cent i le o fd is t r ibut ion)
Large increase in the f requency o fcont inuous days wi th ex t reme h ightemperature
Several assessments have estimated the future burdens of heat and cold stress on mortality.An importantsource of uncertainty is how climate change could affect the daily thermal environment in a givenlocality, such as a city or town. Methods are available that downscale climate scenarios to the local level,and these should be explored in consultation with a meteorological expert (see Table 5.1).
A proportion of the “acute”effect of heat episodes on mortality may be the hastening of death in alreadyill people by a few days or weeks.This mortality displacement effect can sometimes be seen in the lowerthan expected mortality immediately following a heat-wave. The key question is what proportion ofdeaths was brought forward by more than a matter of days or weeks? Assumptions on short-termmortality displacement should be clearly stated if the risk assessment quantifies mortality outcomes.
The population-attributable fraction can be estimated from the slope of the temperature–mortalityrelationship and the proportion of degree–days that occur above the threshold temperature for eachclimate scenario.Simply directly applying the change in mean temperature to the temperature–mortalityrelationship is not recommended.
A key assumption in estimating future impact is whether the population acclimatizes to changes in

57
PART 2. METHODS AND TOOLS
climate. Changes in population vulnerability and adaptive processes are predicted to substantiallyinfluence the burden of mortality and morbidity attributable to the direct effects of thermal extremes.For example, the WHO assessment of the global burden of disease incorporated an assumption regardingacclimatization of the populations to the changing climate that reduces the impact of climate change(Campbell-Lendrum et al., 2003).This study assumed that the threshold temperature (minimum mortality point) is increased aspopulations adapt to a new climate regimen, reflecting the physiological and behaviouralacclimatization that can take place over the time scale of decades.Changes in the threshold temperature(minimum mortality point) were region- and scenario-specific and reflected the rate of warmingexperienced. Changes were assumed to be proportional to the projected change in average summertemperature (mean in June, July and August).This assessment further assumed that the shape (slope) of the temperature–mortality relationship didnot change over time. However, this is unlikely to be true, as the relationship reflects the adaptivecapacity of the population, which is likely to change over time.
Milder winters may reduce cold-related mortality.The assessment should therefore address the potentialbenefits of climate change on temperature-attributable mortality.
Source: Watson et al., (2001).
Fig. 5.2. Climate change and changes in the distribution of daily temperatures
Probability of occurrence
Probability of occurrence
Probability of occurrence
Increase in mean temperature
Less cold weather
Morerecord hot weather
More hot weather
More cold weather
Morerecord cold
weather
Morerecord hot weather
More hot weather
Less changefor cold weather
More record hot weather
Much more hot weather
Increase in variance of temperature
New climate
Previous climate
Increase in mean and variance of temperature
COLD AVERAGE HOT
COLD AVERAGE HOT
COLD AVERAGE HOT

58
Adaptation: strategies, policies and measures
Assessment of adaptation generates a range of strategies, policies and measures to address the potentialhealth impact of heat and heat-waves. Ideally, this list will range from interventions that are theoreticallypossible at some future date to those that can be implemented practically in the short term. Policy-makers and decision-makers should be aware of possible interventions that could be available in thefuture to address heat and heat-waves so that appropriate action can be taken.This includes establishingresearch programmes to encourage the development of interventions that are not yet technicallyfeasible or are too costly, instituting trials of the effectiveness of promising but undemonstratedinterventions or changing policies or public attitudes for desirable interventions that are currently notsocially acceptable.
The interventions that policy-makers choose to implement need to satisfy a number of requirements,including being effective in reducing the burden of disease, technically and economically feasible,socially acceptable and compatible with current policies. Typically, cost–benefit analysis will beconducted to demonstrate the value of the intervention. In addition, having coordination andcollaboration across regions or countries on a specific issue may be desirable. Establishing a process ofcross-boundary coordination in advance of a heat-wave will help to ensure a more effective response.
The following section briefly discusses some of the interventions that aim to reduce heat-relatedmorbidity and mortality; this is intended only to illustrate some approaches.The appropriateness of aspecific intervention depends on local circumstances, including the projected severity of heat-waves, thedegree to which the population is affected by heat episodes, the age distribution of the population, thelevel and distribution of economic resources in the population, the proportion of the population thatlives in urban centres, the type of housing and the systems in place (if any) to protect vulnerable groupsduring a heat-wave.
A common way of reducing heat-related mortality is implementing a weather-based heat-wave warningsystem. Each city needs to develop a different system based on that city’s specific weather, thepopulation’s response to temperature extremes and the social infrastructure. Specific weather andhealth thresholds are determined and used to issue health warnings or advisories, with the warningstailored to each population.These systems have been shown to be effective in a number of cities in theUnited States and are being pilot-tested in other countries (Koppe et al., in press).
New buildings are designed to have a long lifetime. Changing lifestyles and new technologies all haveimplications for building design. In addition, climate change is likely to result in an increasing numberof extreme hot days;designing comfortable,energy-efficient and safe buildings is therefore a priority.Thedesign should aim to limit both the frequency of high-temperature episodes inside the building and theirindoor intensity and duration. Traditional building designs have evolved in harmony with theenvironment and usually provide adequate protection against heat. In recent decades, rapid urbanizationseems to have led to an increase in poor building design in many cities. Thus, populations in thesedwellings are less adapted and perhaps more vulnerable to heat episodes. People who live in informaldwellings in large cities also may be very vulnerable to weather extremes.
The urban heat island is defined as the difference in temperature between a city and the temperature ofthe surrounding rural area.This effect is greatest at night and during winter.The impact of heat-waves incities is exacerbated by the heat island effect, which can help maintain high nighttime temperatures.Urban planners and decision-makers have a range of interventions from which to choose that aredesigned to reduce urban heat islands and thereby reduce the temperature exposure during heat-waves.
5. Direct effects of heat and heat-waves

59
PART 2. METHODS AND TOOLS
What is the evidence that climate change could affect air quality and thereby health?
Weather conditions influence air quality via the transport and/or formation of pollutants (or pollutantprecursors). Weather conditions can also influence air pollutant emissions, both biogenic emissions(such as pollen production) and anthropogenic emissions (such as those caused by increased energydemand). Exposure to air pollutants can have many serious health effects, especially following severepollution episodes.Long-term exposure to elevated levels of air pollution may have greater health effectsthan acute exposure. Current air pollution problems are greatest in cities in developing countries.
Epidemiological studies conducted in the 1980s and 1990s, combined with analysis of the health effectsrecorded during individual episodes of severely elevated air pollution levels,provide strong evidence forstatistically significant associations between exposure to air pollutants and various types of healtheffects (Table 6.1). Six standard air pollutants have been extensively studied in urban populations: sulfur
6. Air pollution
TABLE 6.1. SELECTED AIR POLLUTANTS, SOURCES AND HEALTH EFFECTS
Pol lutant
Carbon monoxide
Ozone
Par t icu la te mat ter
Ni t rogen ox ides
Sul fur ox ides
Pol len
Sources
Biomass and foss i l fue l combust ion , c igaret te smoke ,veh icu lar emiss ions
Vehicu lar emiss ions , hydrocarbon re lease , foss i l fue lcombust ion (pr imary po l lu tant)
B iomass and foss i l fue l combust ion , c igaret te smoke ,veh icu lar emiss ions
Biomass and foss i l fue l combust ion , const ruc t ionmater ia ls , indust r y , c igaret te smoke , veh icu lar emiss ions
Biomass and foss i l fue l combust ion , indust r ia l emiss ions
F lower ing p lants
Health effects
Headache , nausea , d izz iness , breath lessness , fa t igue , lowbir th weight , v isua l d is turbances , menta l confus ion ,ang ina , coma, death
Eye i r r i ta t ion , resp i ra tor y t rac t i r r i ta t ion , reducedexerc ise capac i t y , exacerbat ion o f resp i ra tor y d isease
Eye i r r i ta t ion , resp i ra tor y t rac t in fec t ions , a l lerg ies ,exacerbat ion o f resp i ra tor y and card iovascu lar d isease ,cancer
Eye i r r i ta t ion , resp i ra tor y t rac t in fec t ions (ch i ldren areespec ia l l y vu lnerab le) , exacerbat ion o f as thma, i r r i ta t ionof bronch i
Respi ra tor y t rac t i r r i ta t ion , impaired pu lmonary funct ion ,exacerbat ion o f card iopu lmonary d isease
Exacerbat ion o f a l lerg ic rh in i t is , as thma and other a top icd iseases
Source: adapted from Yassi et al., (2001).
60
dioxide, ozone, nitrogen dioxide, carbon monoxide, lead and particulate matter. Other important airpollutants include toxic chemicals (such as benzene and mercury) and biological particles (such assome pollen and mould spores).
Biological particles such as pollen and mould also affect health.There is some evidence from Europe thatthe average length of the growing season in Europe has increased by 10–11 days over the last 30 years(Huynen et al., 2003).The pollen season is starting and peaking earlier, and this is more pronounced inspecies that start flowering earlier in the year.The duration of the pollen season has been extended insome summer and late-flowering species.
Evidence is growing that climate change might facilitate the geographical spread of specific plantspecies to new areas as they become climatically suitable.Warming is likely to further cause an earlieronset and may extend the duration of the flowering and pollen season for some species (such as grassesand weeds). Some species, such as ragweed and mugwort, present particular risks for health and requireland-use measures, maintenance of public areas or eradication. The impact of climate change on theincidence, prevalence, distribution and severity of allergic disorders is still uncertain. However, there isno current evidence that climate change will affect the prevalence or incidence of asthma (Huynen etal., 2003).
Methods for estimating the health effects of exposure to air pollutants
Many studies have been undertaken that quantify the relationship between air pollutants and healthoutcomes, mortality and morbidity, in a variety of populations. Such studies are not recommended to beundertaken within the remit of a climate change assessment.There is now an established method forquantifying the health effects of exposure to air pollutants (WHO Regional Office for Europe, 2000).AWHO working group concluded (WHO Regional Office for Europe, 2000) that the most completeestimates of both attributable numbers of deaths and average reductions in life span associated withexposure to air pollution are based on cohort studies.Risk assessment should carefully evaluate whetherapplying the exposure–response relationship from one population to another is appropriate.There areproblems with applying relationships from cities with low pollutant levels to cities with high pollutantlevels, such as those in many developing countries.
Time–series methods can be used to estimate the impact of airborne dust (windblown soil) on healthoutcomes. Larger particles have fewer health effects than do fine particles. However, littleepidemiological research has been performed on this exposure.
Methods for estimating future health impact
Studies relevant to climate change and air pollution can be divided into two general categories:
• those that estimate future levels of air pollution; and• those that estimate the combined impact of weather and air pollutants on health outcomes.
Future changes in air quality depend on many factors, especially emissions and the availability ofprecursor pollutants. In urban areas, the main source of primary air pollutants is motor vehicles.Theconcentrations of air pollutants are seasonal. During winter in temperate countries, air pollutionepisodes are often caused by stagnant weather conditions. Ozone levels are highest in hot sunnyweather, when ultraviolet light interacts with nitrogen dioxide and volatile organic compounds frommotor vehicles and other industrial sources.Unlike winter smog episodes,summer ozone episodes affecta larger region.
The background levels of ozone vary seasonally and from region to region. The background ozoneconcentration has steadily increased in most regions of the world. If other factors are unchanged, anincrease in summer temperatures may increase the concentration of ground-level ozone and increase
6. Air pollution
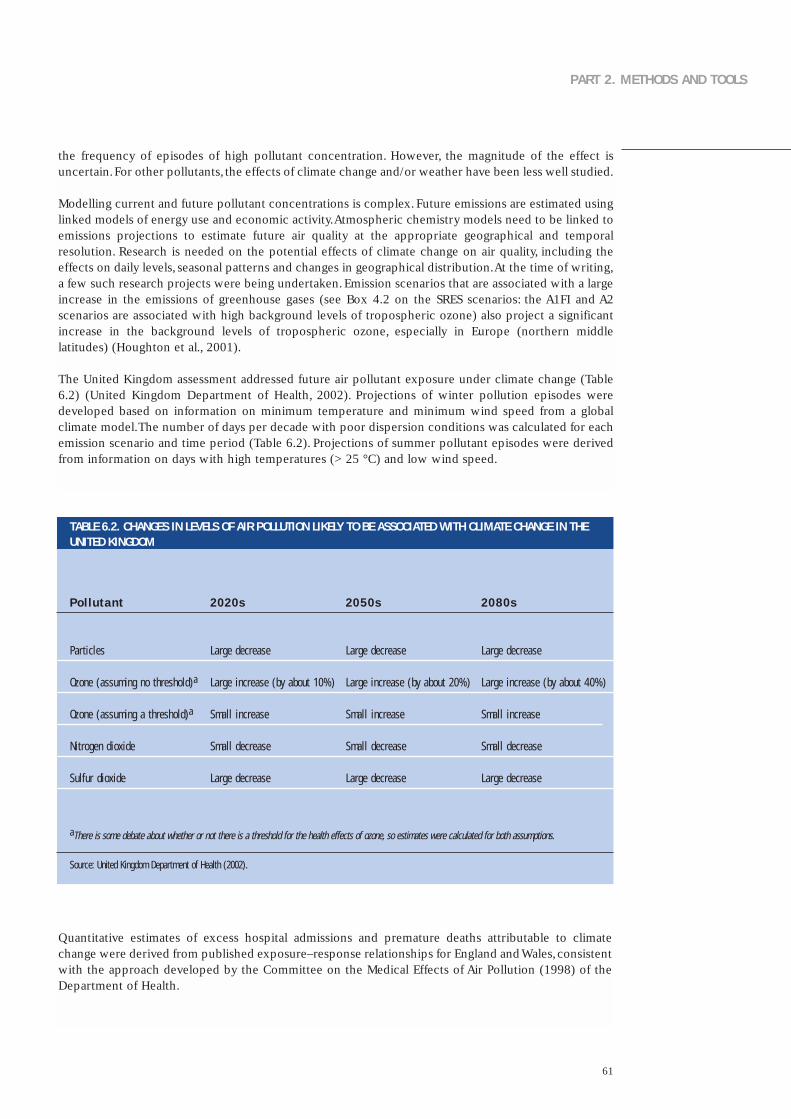
61
PART 2. METHODS AND TOOLS
the frequency of episodes of high pollutant concentration. However, the magnitude of the effect isuncertain.For other pollutants, the effects of climate change and/or weather have been less well studied.
Modelling current and future pollutant concentrations is complex. Future emissions are estimated usinglinked models of energy use and economic activity.Atmospheric chemistry models need to be linked toemissions projections to estimate future air quality at the appropriate geographical and temporalresolution. Research is needed on the potential effects of climate change on air quality, including theeffects on daily levels, seasonal patterns and changes in geographical distribution.At the time of writing,a few such research projects were being undertaken. Emission scenarios that are associated with a largeincrease in the emissions of greenhouse gases (see Box 4.2 on the SRES scenarios: the A1FI and A2scenarios are associated with high background levels of tropospheric ozone) also project a significantincrease in the background levels of tropospheric ozone, especially in Europe (northern middlelatitudes) (Houghton et al., 2001).
The United Kingdom assessment addressed future air pollutant exposure under climate change (Table6.2) (United Kingdom Department of Health, 2002). Projections of winter pollution episodes weredeveloped based on information on minimum temperature and minimum wind speed from a globalclimate model.The number of days per decade with poor dispersion conditions was calculated for eachemission scenario and time period (Table 6.2). Projections of summer pollutant episodes were derivedfrom information on days with high temperatures (> 25 °C) and low wind speed.
TABLE 6.2. CHANGES IN LEVELS OF AIR POLLUTION LIKELY TO BE ASSOCIATED WITH CLIMATE CHANGE IN THEUNITED KINGDOM
2020s
Large decrease
Large increase (by about 10%)
Smal l increase
Smal l decrease
Large decrease
aThere is some debate about whether or not there is a threshold for the health effects of ozone, so estimates were calculated for both assumptions.
Source: United Kingdom Department of Health (2002).
Quantitative estimates of excess hospital admissions and premature deaths attributable to climatechange were derived from published exposure–response relationships for England and Wales,consistentwith the approach developed by the Committee on the Medical Effects of Air Pollution (1998) of theDepartment of Health.
2050s
Large decrease
Large increase (by about 20%)
Smal l increase
Smal l decrease
Large decrease
2080s
Large decrease
Large increase (by about 40%)
Smal l increase
Smal l decrease
Large decrease
Pol lutant
Par t ic les
Ozone (assuming no threshold)a
Ozone (assuming a threshold)a
Ni t rogen d iox ide
Sul fur d iox ide
62
Adaptation: measures, strategies or policies
Air pollution is usually controlled by air quality standards: acceptable concentrations of air pollutants.Reducing the emissions that lead to outdoor air pollution is considered the most effective intervention.The WHO Strategy on Air Quality and Health (WHO, 2001b) provides a framework for countries toimprove their air quality by long-term intersectoral preventive activities (environmental healthmanagement).
Action taken to reduce greenhouse gas emissions is very likely to benefit population health (Barker &Srivastava, 2001; Davies et al., 2000). Fossil fuel combustion releases both local hazardous air pollutants(especially particulate matter, ozone, nitrogen oxides and sulfur dioxide) and greenhouse gases. Hence,policies to reduce greenhouse gas emissions by reducing vehicle emissions or other transport policymeasures could benefit health (see also Metz et al., (2001), section 9.2.8.4).Controlling road traffic couldalso benefit health through reductions in road traffic accidents and a possibly a decrease in sedentarylifestyles.
6. Air pollution
63
PART 2. METHODS AND TOOLS
What is the evidence that climate change could affect the health impact of weather disasters?
Climate change is likely to have major effects on human health via changes in the magnitude andfrequency of extreme events: floods,windstorms and droughts.Climate change projections are based onthe anticipation of increasing means or norms. Global or regional climate models are not easily able toforecast future climate variability, whether daily, interannual or decadal. Changes in extreme events canbe forecast by estimating changes in probability distributions (Downing et al., 1996; Palmer & Raisenen,2002; Campbell-Lendrum et al., 2003; Maheepala & Perera, 2003).
This chapter primarily addresses the impact of floods and windstorms (including tropical cyclones), butthe methods described can be applied to other types of disasters.The effects of drought are primarilyassociated with food security (Chapter 11) and increasing waterborne disease (Chapter 9).The meltingof permafrost in mountain regions is likely to increase the risk of avalanches of stones and mud.
Weather disasters affect human health by causing considerable loss of life. Extreme weather eventscause death and injury directly. Following disasters, deaths and injuries can occur as residents return toclean up damage and debris.The nonfatal effects of natural disasters include:
• physical injury;
• reduced nutritional status, especially among children;
• increases in respiratory and diarrhoeal diseases because of crowding of survivors, often with limitedshelter and access to potable water;
• effects on mental health that may be long lasting in some cases;
• increased risk of water-related diseases from disruption of water supply or sewerage systems; and
• exposure to dangerous chemicals or pathogens released from storage sites and waste disposal sitesinto floodwaters.
Bereavement, property loss and social disruption may increase the risk of depression and mental healthproblems.Substantial indirect health impact can also occur because of damage to the local infrastructure(such as damage to clinics and roads) and population displacement.
Methods for estimating the health effects of disasters
Information on the impact of disasters may be available from the national meteorological agency or thenational agency for disasters or emergency services. Global and regional agencies (such as EM-DAT, theEmergency Events Database of the Centre for Research on the Epidemiology of Disasters, or WMO) andreinsurance companies also collect information on disasters, but this is usually limited to the totalnumber of deaths attributed to an event. The total health impact of a disaster is difficult to quantify,because injuries and secondary effects are poorly reported and communicated.
Current vulnerability to weather disasters needs to be described in terms of total and age-specificmortality and morbidity. Determining whether this vulnerability is increasing or decreasing is thenimportant. Projecting the future impact of disasters on health outcomes is not advisable because theprojections and future vulnerability are highly uncertain under climate change.
7. Disasters: floods and windstorms

64
Floods
In vulnerable regions, the concentration of risks with both food and water insecurity can make theimpact of even minor weather extremes (floods and droughts) severe for the households affected (Table7.1). The only way to reduce vulnerability is to build infrastructure to remove solid waste andwastewater and to supply potable water. No sanitation technology is “safe” when covered byfloodwaters, as faecal matter mixes with floodwaters and is spread wherever the floodwaters run.
Epidemiological studies of flood events can be undertaken in relation to the following outcomes tocompare incidence in the pre- and post-flooding situations:
• injuries
• infectious diseases, especially skin, gastrointestinal and respiratory infections; and
• mental disorders: increases in common anxiety and depression disorders.
Routine surveillance may provide data on episodes of infectious disease both before and after a flood.Obtaining accurate information on disease incidence or prevalence before the flood may not bepossible. Detection may increase after the flood and bias the estimate because surveillance activity isenhanced. Injuries are not routinely recorded in relation to flood events. Because the methods ofattributing health impact to a flood event are difficult, the type of study used to quantify the impactshould be clearly stated (Glass & Noji, 1992). Qualitative methods can also be used to estimate theimpact of a flood on health and quality of life (Ohl & Tapsell, 2000;WHO Regional Office for Europe,2002; Few, 2003).
Drought
A potential increase in drought could substantially affect water resources and sanitation in situationswhere water supply is effectively reduced.This could lead to an increased concentration of pathogenicorganisms in raw water supplies.Additionally, water scarcity may require using poorer-quality sources offresh water, such as rivers, which are often contaminated.All these factors could increase the incidenceof diseases. Epidemiological assessment should be used to quantify this risk.
The health consequences of drought include diseases resulting from lack of water. In times of shortage,water is used for cooking rather than hygiene. In particular, this increases the risk of faecal-oral(primarily diarrhoeal) diseases and water-washed diseases (such as trachoma and scabies). Malnutritionalso increases susceptibility to infection (see Chapter 11 for discussion on food security).
Mapping effects in time and space
Mapping flood deaths or the other effects of a given event may be useful in identifying current andfuture populations at risk. Mapping can be done at the local scale, with linkage to census-derived smallarea indicators, or at a larger scale to show which geographical areas within a country are most at riskof flooding. Some countries have prepared maps of flood risk zones.
7. Disasters: floods and windstorms
65
PART 2. METHODS AND TOOLS
TABLE 7.1. PATHWAYS BY WHICH ABOVE-AVERAGE RAINFALL CAN AFFECT HEALT
Event
Heavy prec ip i ta t ion event
F lood
F lood
F lood
Potent ia l health impact
•Increased or decreased mosqui toabundance (decreased i f breedings i tes are washed away)
• Changes in mosqui to abundance
• Contaminat ion o f sur face water
• Changes in mosqui to abundance
• Contaminat ion o f water wi th faeca l mat ter and ra t ur ine ( leptosp i ros is)
• Changes in mosqui to abundance
• Contaminat ion o f water wi th faeca l mat ter and ra t ur ine , andincreased r isk o f resp i ra tor y anddiarrhoeal d isease
• Deaths (drowning)
• In jur ies
• Heal th e f fec ts assoc ia ted wi thpopula t ion d isp lacement
• Loss o f food supply
• Psychosoc ia l e f fec ts
Type
Weather
Hydro log ica l
Soc ioeconomic
Catast roph ic f lood d isaster
Descr ipt ion
Ext reme event
R iver or s t ream over f lows i tsbanks
Proper t y or crops damaged
People k i l led or in jured
More than 10 people k i l led and/or200 af fec ted and/or governmentca l l for ex terna l ass is tance
Source: adapted from Kovats et al., (1999).
Methods for estimating the future health impact of weather disasters
Estimating the impact of climate change on climate extremes is very difficult (Table 7.2). Climatescenarios do not typically incorporate information on extreme events. However, information may beavailable from other sources.The following may have been assessed for the population of interest:
• the risk of coastal flooding from rising sea level and changes in the frequency of storm surges;
• the risk of riverine flooding in relation to specific catchment areas and floodplains;

66
• changes in the frequency of windstorms;
• the effect of climate change on the frequency and/or intensity of El Niño events; and
• the risk of drought.
7. Disasters: floods and windstorms
TABLE 7.2. ESTIMATES OF CONFIDENCE IN OBSERVED AND PROJECTED CHANGES IN EXTREME WEATHER AND CLIMATE EVENTS
Changes in phenomenon
Higher maximum temperatures and more hot daysover near ly a l l land areas
Higher min imum temperatures , fewer co ld daysand f ros t days over near ly a l l land areas
Reduced d iurna l temperature range over most landareas
Increase in heat index d over land areas
More in tense prec ip i ta t ion events a
Increased summer cont inenta l dr y ing and assoc ia ted r isk o f drought
Increase in t rop ica l cyc lone peak wind in tens i t iesb
Increase in t rop ica l cyc lone mean and peakprec ip i ta t ion in tens i t ies b
Conf idence in observed changes ( latter half of 20th century)
L ike ly c
Ver y l ike ly c
Ver y l ike ly c
L ike ly c over many areas
L ike ly c over many Nor thern Hemisphere midd le- to h ighla t i tude land areas
L ike ly c in a few areas
Not observed in the few analyses ava i lab le
Insuf f ic ient data for assessment
Conf idence in projected changes(dur ing the 21st century)
Very l ike ly c
Ver y l ike ly c
Ver y l ike ly c
Ver y l ike ly c over most areas
Very l ike ly c over many areas
L ike ly c over most midd le- la t i tude cont inenta l in ter iors( lack o f cons is tent pro jec t ions in o ther areas)
L ike ly c over some areas
L ike ly c over some areas
a For other areas, either data are insufficient data or results conflict.b Past and future changes in tropical cyclone location and frequency are uncertain.c Judgement estimates for confidence: virtually certain (greater than 99% probability that the result is true); very likely (90–99% probability); likely (66–90% probability);
medium likelihood (33–66% probability); unlikely (10–33% probability); very unlikely (1–10% probability); and exceptionally unlikely (less than 1% probability).d Based on warm season temperature and humidity.
Source: McCarthy et al., (2001).

67
PART 2. METHODS AND TOOLS
Adaptation: strategies, policies and measures
There are four classical phases of disaster reduction:
• mitigation: long-term activities undertaken prior to impact aimed at reducing the risk or occurrenceand/or effect of a disaster;
• preparedness: pre-disaster activities intended to increase the effectiveness of emergency responseduring a disaster;
• response: activities undertaken immediately prior to and during an event to protect lives andproperties; and
• recovery: post-disaster activities undertaken to return affected communities to a more normalcondition.
Numerous policies have been identified to reduce the health impact of extreme events (Pan AmericanHealth Organization, 1981):
• undertaking vulnerability studies of existing water supply and sanitation systems and ensuring thatnew systems are built to reduce vulnerability;
• developing improved training programmes and information systems for both national programmesand international cooperation on emergency management; and
• developing and testing early warning systems; these should be coordinated by a single national agencyand involve vulnerable communities, providing and evaluating mental health care, especially forpeople who may be particularly vulnerable to the adverse psychosocial effects of disasters, such aschildren, elderly people and bereaved people.
Institutional and cultural barriers remain to using seasonal forecast information. Decision-makers shouldbe educated or encouraged to use scientific information that may reduce losses from natural disasters.Glantz (2002) studied 12 countries to evaluate responses to disasters associated with the 1997/1998 ElNiño event.

68
What is the evidence that climate change could affect the burden of vector-borne diseases
Vector organisms that do not regulate their internal temperatures and are therefore sensitive to externaltemperature and humidity transmit many important infectious diseases. Climate change may alter thedistribution of vector species (increasing or decreasing) depending on whether conditions arefavourable or unfavourable for their breeding places (such as vegetation, host or water availability) andtheir reproductive cycle (Box 8.1).Temperature can also influence the reproduction and maturation rateof the infective agent within the vector organism and the survival rate of the vector organism, therebyfurther influencing disease transmission.
Changes in climate that can affect the potential transmission of vector-borne infectious diseases includetemperature, humidity, altered rainfall, soil moisture and rising sea level. Determining how these factorsmay affect the risk of vector-borne diseases is complex. The factors responsible for determining theincidence and geographical distribution of vector-borne diseases are complex and involve manydemographic and societal as well as climatic factors. Transmission requires that the reservoir host, acompetent vector and the pathogen be present in an area at the same time and in adequate numbers tomaintain transmission.
8. Vector-borne diseases
Box 8.1. Climate effects on vectorial capacity, vector abundance and distribution
Cl imate a f fec ts a var ie t y o f b io log ica l processes in vectors , in f luenc ing the i r presence or absence at a par t icu lar t ime and p lace ,the i r abundance and the i r ab i l i t y to t ransmi t d isease . For anthroponot ic d iseases such as malar ia , the overa l l ab i l i t y o f a vectorpopula t ion to t ransmi t d isease can be summar ized as the vector ia l capac i t y . Vector ia l capac i t y has var ious formula t ions (Garre t t -Jones , 1964, Dye , 1992) , but is a funct ion o f the fo l lowing parameters :
• human-b i t ing ra te : the da i l y b i t ing ra te o f a female mosqui to ;
• human suscept ib i l i t y : the e f f ic iency wi th which an in fec t ive mosqui to in fec ts a human;
• mosqui to suscept ib i l i t y : the chance that an un in fec ted mosqui to acqui res in fec t ion f rom b i t ing an in fec t ious person;
• the probabi l i t y o f da i l y sur v iva l o f the mosqui to ; and
• the incubat ion per iod for the paras i te ins ide the mosqui to .
Vector ia l capac i t y is most sens i t i ve to changes in the parameters that are present as squared terms (b i t ing ra te) or as exponen t ia lterms (mosqui to mor ta l i t y and paras i te in t r ins ic incubat ion per iod) . These are among the parameters that are most sens i t i ve toc l imate , espec ia l l y temperature . Th is is the proper t y that makes vector-borne d iseases so sens i t i ve to even smal l changes inc l imat ic condi t ions .
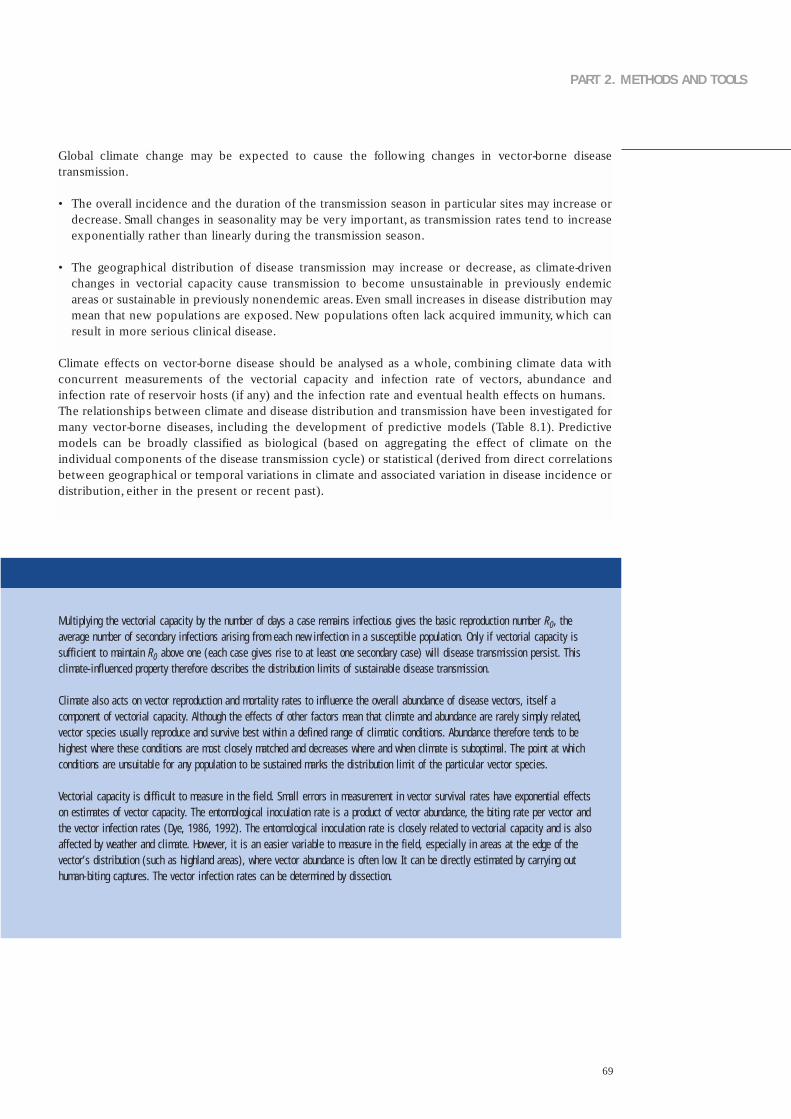
69
PART 2. METHODS AND TOOLS
Mult ip ly ing the vector ia l capac i t y by the number o f days a case remains in fec t ious g ives the bas ic reproduct ion number R0 , theaverage number o f secondary in fec t ions ar is ing f rom each new in fec t ion in a suscept ib le popula t ion . On ly i f vec tor ia l capac i t y issuf f ic ient to main ta in R0 above one (each case g ives r ise to a t least one secondary case) wi l l d isease t ransmiss ion pers is t . Th isc l imate- in f luenced proper t y therefore descr ibes the d is t r ibu t ion l imi ts o f susta inab le d isease t ransmiss ion .
C l imate a lso acts on vector reproduct ion and morta l i t y ra tes to in f luence the overa l l abundance of d isease vectors , i tse l f acomponent o f vector ia l capac i t y . A l though the e f fec ts o f o ther fac tors mean that c l imate and abundance are rare ly s imply re la ted ,vector spec ies usual ly reproduce and sur v ive best wi th in a def ined range of c l imat ic condi t ions . Abundance therefore tends to beh ighest where these condi t ions are most c lose ly matched and decreases where and when c l imate is subopt imal . The po in t a t whichcondi t ions are unsu i tab le for any popula t ion to be susta ined marks the d is t r ibu t ion l imi t o f the par t icu lar vector spec ies .
Vector ia l capac i t y is d i f f icu l t to measure in the f ie ld . Smal l errors in measurement in vector sur v iva l ra tes have exponent ia l e f fec tson est imates o f vector capac i t y . The entomolog ica l inocu la t ion ra te is a product o f vector abundance , the b i t ing ra te per vector andthe vector in fec t ion ra tes (Dye , 1986, 1992) . The entomolog ica l inocu la t ion ra te is c lose ly re la ted to vector ia l capac i t y and is a lsoaf fec ted by weather and c l imate . However, i t is an eas ier var iab le to measure in the f ie ld , espec ia l l y in areas a t the edge of thevector ’s d is t r ibu t ion (such as h igh land areas) , where vector abundance is o f ten low. I t can be d i rec t ly es t imated by carr y ing outhuman-b i t ing captures . The vector in fec t ion ra tes can be determined by d issect ion .
Global climate change may be expected to cause the following changes in vector-borne diseasetransmission.
• The overall incidence and the duration of the transmission season in particular sites may increase ordecrease. Small changes in seasonality may be very important, as transmission rates tend to increaseexponentially rather than linearly during the transmission season.
• The geographical distribution of disease transmission may increase or decrease, as climate-drivenchanges in vectorial capacity cause transmission to become unsustainable in previously endemicareas or sustainable in previously nonendemic areas. Even small increases in disease distribution maymean that new populations are exposed. New populations often lack acquired immunity, which canresult in more serious clinical disease.
Climate effects on vector-borne disease should be analysed as a whole, combining climate data withconcurrent measurements of the vectorial capacity and infection rate of vectors, abundance andinfection rate of reservoir hosts (if any) and the infection rate and eventual health effects on humans.The relationships between climate and disease distribution and transmission have been investigated formany vector-borne diseases, including the development of predictive models (Table 8.1). Predictivemodels can be broadly classified as biological (based on aggregating the effect of climate on theindividual components of the disease transmission cycle) or statistical (derived from direct correlationsbetween geographical or temporal variations in climate and associated variation in disease incidence ordistribution, either in the present or recent past).

70
Mapping disease in time and space
Demonstrated climate effects on the abundance and distributions of vectors either now or in the recentpast constitute indirect evidence that they have been,or could be,affected by climate change.The recentincrease in affordable computing power and the advent of geographical information system software hasfacilitated the mapping of available data on vector abundance and distributions. New ground andsatellite-based sensors have allowed these data to be matched against increasingly accurate climatemeasurements.
Many vectors are collected using a variety of different trapping methods, applied with varying effortover time and space, so that obtaining standardized measurements of abundance is often difficult.Withsome notable exceptions, most studies therefore centre on analysing patterns of presence versusabsence (that is, distributions), which are relatively more robust and less data-intensive.The correlationbetween climatic variables and the distribution of vectors may be analysed using either explicitlystatistical techniques (Rogers & Randolph, 1991) or semiquantitative climate-matching methods such asthe CLIMEX model (Sutherst, 1998). Factors other than climate may significantly influence distributionpatterns (such as variation in natural vegetation, land use or natural or artificial barriers to speciesdispersal) and, as far as possible, their effects should be tested and included in multivariate modelsexploring climate effects.
In general, the mapping studies that have so far been carried out confirm the importance of climate asa limiting factor in the distribution of many vectors. Such confirmations suggest that their distributionsare likely to change as climate change progresses.These studies have been reviewed elsewhere (Kovatset al., 2000; McMichael et al., 2003b).
Geographical information system
Geographical information systems are extremely important tools in assessing the impact of climatechange. A geographical information system is essentially a system for linking together geographicalinformation (such as the geographical coordinates of a specific point or the outline of a defined
8. Vector-borne diseases
TABLE 8.1. VECTOR-BORNE DISEASES CONSIDERED TO BE SENSITIVE TO CLIMATE CHANGE
Vector
Mosqui toes
Sandf l ies
Tr ia tomines
Ixodes t icks
Tsetse f l ies
Black f l ies
Diseases
Malar ia , f i lar ias is , dengue fever, ye l low fever, West N i le fever
Le ishmanias is
Chagas ’ d isease
Lyme d isease , t ick-borne encephal i t is
Af r ican t r ypanosomias is
Onchocerc ias is
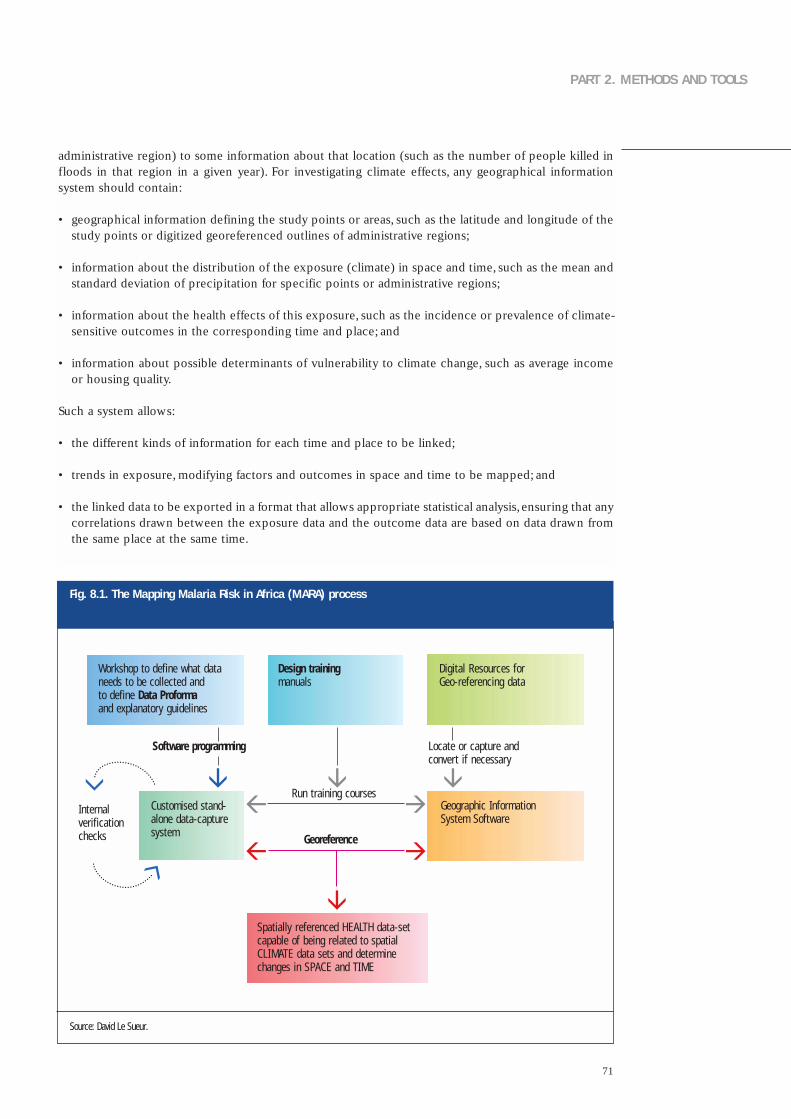
71
PART 2. METHODS AND TOOLS
administrative region) to some information about that location (such as the number of people killed infloods in that region in a given year). For investigating climate effects, any geographical informationsystem should contain:
• geographical information defining the study points or areas, such as the latitude and longitude of thestudy points or digitized georeferenced outlines of administrative regions;
• information about the distribution of the exposure (climate) in space and time, such as the mean andstandard deviation of precipitation for specific points or administrative regions;
• information about the health effects of this exposure, such as the incidence or prevalence of climate-sensitive outcomes in the corresponding time and place; and
• information about possible determinants of vulnerability to climate change, such as average incomeor housing quality.
Such a system allows:
• the different kinds of information for each time and place to be linked;
• trends in exposure, modifying factors and outcomes in space and time to be mapped; and
• the linked data to be exported in a format that allows appropriate statistical analysis,ensuring that anycorrelations drawn between the exposure data and the outcome data are based on data drawn fromthe same place at the same time.
Source: David Le Sueur.
Fig. 8.1. The Mapping Malaria Risk in Africa (MARA) process
Design trainingmanuals
Workshop to define what dataneeds to be collected and to define Data Proformaand explanatory guidelines
Spatially referenced HEALTH data-setcapable of being related to spatialCLIMATE data sets and determinechanges in SPACE and TIME
Customised stand-alone data-capture system
Software programming
Georeference
Run training courses
Locate or capture andconvert if necessary
Geographic InformationSystem Software
Digital Resources forGeo-referencing data
Internalverificationchecks

72
The process outlined in this section is based on how the Mapping Malaria Risk in Africa (MARA)collaboration was operationalized. Fig. 8.1 illustrates the process undertaken to establish a robustdatabase capable of supporting studies of climate change and/or variability. Such a database also hasbroader application in epidemiological research and disease control programmes. Implementationrequires selecting strategically placed data collection centres that can take responsibility for datacollection for a defined geographical area.This is most easily achieved by linking to existing researchinstitutions at which key individuals are identified as partners and then trained.
An important characteristic of the system described is that a large part of it is generic in terms of itsapplication to multiple diseases.Thus, although MARA was designed for malaria, a large part of the effortis in the capture of digital information that is used to position (latitude and longitude) the disease dataand in training individuals in geographical information system skills.Thus, the system makes capturingdata for other climate-related diseases much easier. Such systems may initially seem potentially costly.However, when their broader application is considered, especially in terms of reduced morbidity ormortality, then they are easily justifiable.
8. Vector-borne diseases
Box 8.2. MARA LITe
One of the cha l lenges for the MARA co l laborat ion was to d isseminate the database in a format that made i t easy to use forser v ice personnel invo lved in d is t r ic t hea l th management and contro l . MARA L ITe (Low-end In format ion Tool) was deve lopedas a s tand-a lone query sys tem of the MARA database . D isseminat ion was in C D format . MARA L ITe has numerous capabi l i t iesin terms of ex t rac t ing countr y data for a def ined geographica l reg ion . Data may be ext rac ted and summar ized a t e i thercountr y , prov ince or d is t r ic t leve l .
MARA L ITe has modules that d isp lay MARA maps , ca lcu la tes popula t ions a t r isk and he lps wi th s ta t is t ica l des ign in terms ofsur veys to assess the impact o f contro l measures . In terms of c l imate-re la ted s tud ies , i ts va lue l ies in the ab i l i t y to eas i l yex t rac t re t rospect ive data and to ca lcu la te a long- term mean of expected preva lence for a g iven reg ion . Se lec t ing “ca lcu la te”wi l l prov ide a summary o f the mean , range , s tandard dev ia t ion , sample s ize , conf idence in ter va l e tc . I t thus fac i l i ta tes thecreat ion o f a base l ine agains t which fu ture increases or decreases in d isease f rom c l imate change can be quant i f ied .
Interannual climate variability, El Niño and epidemic disease
The El Niño Southern Oscillation cycle is irregular and varies in length from 2 to 7 years. Several studieshave identified associations between disease risk and El Niño or La Niña events. Extreme weather cantrigger disease outbreaks. Such outbreaks are often attributed to the El Niño Southern Oscillation whenthe weather pattern is consistent with its known effects. However, only a consistent associationobserved across several El Niño events using time–series methods can be considered strong evidence ofa true association between the El Niño Southern Oscillation and disease in a given population (Kovatset al., 2003a).
Statistical analysis is needed to assess how disease incidence or epidemics vary over time with the ElNiño Southern Oscillation cycle. This requires a long data series (at least 20 years) because El NiñoSouthern Oscillation events are infrequent. Such analyses should demonstrate that disease incidence orepidemics vary over time with the local weather pattern (such as rainfall) that is associated with the ElNiño Southern Oscillation.The analyses should take into account potential confounding factors over thetime period that may account for the observed association, such as changes in land use that may affectvector abundance. Confounding factors are unlikely to vary coincidentally with the El Niño SouthernOscillation cycle over long periods, and the likelihood of confounders explaining the observed
73
PART 2. METHODS AND TOOLS
relationship is therefore greater for short time–series or single-event case studies. Populationvulnerability to climate variability may also change.For example,changes in public health infrastructure,including changes in vector control, may change vulnerability and therefore enhance or reduce themagnitude of the relationship.
Parameters of El Niño Southern Oscillation that are used in time–series studies include: identification ofan El Niño “year”; the Southern Oscillation Index; and sea surface temperatures in specific regions in thePacific. Additional considerations for the quantitative analyses include the following (Kovats et al.,2003b).
• Variability in the climate series (such as year-to-year) should correspond to variability in the healthtime–series.
• Both time–series and spatial analyses of correlations between climate and health outcomes shouldadjust for temporal autocorrelation. Failure to do so will tend to overestimate the effect of climatevariables.
• Quoted statistical significance values for the association between temporal variation in climate andhealth outcomes should clearly distinguish between the effects of (in increasing order of relevance)seasonal variation, interannual variation and long-term trends in climate.
• Analyses should take into account, as far as possible, other changes that have occurred over the sametime period that could plausibly account for any observed association with climate.
The use of monthly data to lengthen the time–series should be avoided as it begins to merge withseasonal phenomena that can impede the interpretation of results.As with all climate health studies, the climate drivers of any association with the El Niño SouthernOscillation should be identified and the biological plausibility of the observed relationship considered.
If a relationship between the El Niño Southern Oscillation and disease is established, then it providegood evidence that the disease system is sensitive to climate factors.However, this observed relationshipis not recommended to be used directly to infer the potential impact of climate change. It is importantto understand whether the relationship between the El Niño Southern Oscillation and disease is drivenprimarily by changes in rainfall or temperature. For example, if the effect is driven by drought, then itshould be assessed whether climate change is projected to increase the risk of drought in this area.
Methods for estimating future health impact if the disease is already present
Changes in the spatial distribution of diseases are clearly important as new populations are exposed torisk. Such populations lack immunity, and morbidity and mortality can therefore be significantly higherthan in populations in which the disease is endemic. Populations may also lack health expertise andmechanisms with which to respond to the disease. For example, the spread of malaria from areas ofconstant endemic transmission (and therefore high levels of immunity) to regions where the disease hadnot been experienced before is likely to lead to epidemic transmission with great effects on publichealth.
Distributional fringe areas such as highlands and deserts are the areas most likely to show the influenceof climate factors on malaria transmission. Highland areas are of interest because the climate (mainlytemperature) varies significantly over a small geographical area. Temperature decreases as altitudeincreases. Temperature thresholds in highland regions are dynamic and highly variable over shortdistances, so that altitude on its own is not a reliable predictor of environmental temperature.Both large-scale factors, such as latitude and proximity to the ocean, and local factors, such as aspect and proximityto large water bodies, have important influences on local climate. The transmission factors that aredirectly or indirectly affected by altitude are of epidemiological significance, rather than altitude itself.

74
Most modelling of the effects of climate change has focused on malaria and to a lesser extent on denguefever and some tick-borne diseases (see below). Assessments should address areas in which climatechange might decrease, as well as increase, the risk of transmission of a specific disease.
The following outcomes can be addressed when assessing the potential impact of climate change:
• evidence of the current distribution of disease cases and the main vector species;
• climate-driven changes in the potential distribution of disease and vector species for a specifiedclimate scenario;
• the additional population at risk due to climate change under specified population and climatescenarios;
• the additional person–months at risk due to climate change under specified population and climatescenarios; and
• the additional cases of disease or deaths due to climate change under specified scenarios forpopulation, climate and adaptive capacity.
Strategies, policies and measures implemented in other sectors can affect health status. For example,water resource developments should be evaluated for the implications for vector-borne diseasetransmission.Water storage practices can affect the prevalence of the dengue vectors, as studies havepreviously shown that increased water storage during droughts can increase dengue transmission.
The health effects of wetlands regeneration should be assessed. Wetlands provide breeding sites formany mosquito vectors. Natural or planned changes in wetland areas may have implications for localtransmission of disease.
The impact of climate change on livestock and herd animals may be important if they are an importantreservoir or host. Modelling of pest species of plants and livestock may provide useful information forpotential effects on insect and tick vectors.
Biological models of vector-borne disease transmission
Biological models of malaria are based on the relationships between temperature and the extrinsicincubation period of the parasite, and therefore the probability of completing the transmission cycle.These relationships are derived from laboratory data and are assumed to apply to all areas.Although validfor their original purpose as sensitivity analyses for relative changes in risk, these models are not idealfor defining the most probable changes either in geographical distribution or in disease burden withinendemic areas.Both outputs require the calculation of absolute rather than relative values of R0 (see Box8.1), so as to identify areas in which R0 > 1, allowing disease transmission to persist. In these models,such calculations depend in part on parameter values that are arbitrarily defined in the absence ofempirical data (Rogers & Randolph, 2000). Factors such as vector abundance are difficult to measure atthe national scale.
The biological models are based on temperature relationships derived from studies on vectors in thelaboratory.The relationships may therefore not be appropriate to conditions in the wild.The models alsoassume that climate input data accurately represent the climatic conditions that mosquitoes andparasites experience in the field, disregarding the possibility that vectors might exploit microhabitatsthat are very different from those in meteorological stations.The outputs from biological models shouldtherefore be validated against current disease distributions to provide useful information for a nationalassessment.
8. Vector-borne diseases
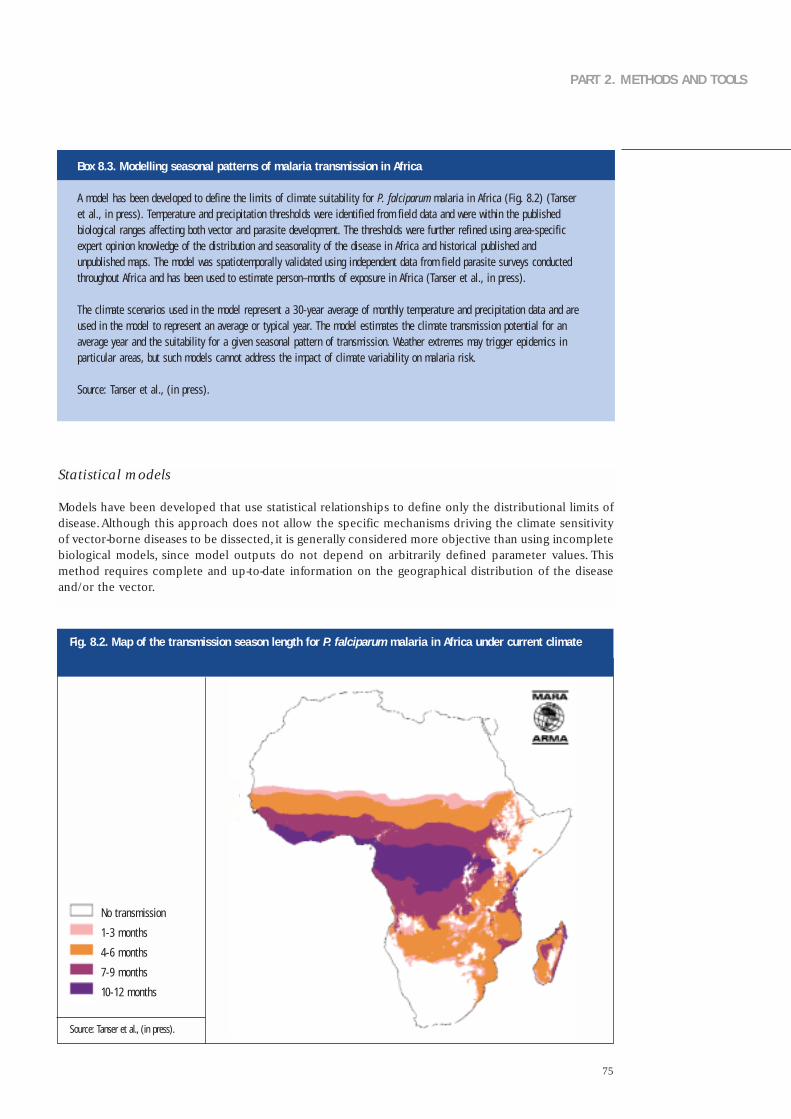
75
PART 2. METHODS AND TOOLS
Statistical models
Models have been developed that use statistical relationships to define only the distributional limits ofdisease.Although this approach does not allow the specific mechanisms driving the climate sensitivityof vector-borne diseases to be dissected, it is generally considered more objective than using incompletebiological models, since model outputs do not depend on arbitrarily defined parameter values. Thismethod requires complete and up-to-date information on the geographical distribution of the diseaseand/or the vector.
Box 8.3. Modelling seasonal patterns of malaria transmission in Africa
A model has been deve loped to def ine the l imi ts o f c l imate su i tab i l i t y for P. fa lc iparum malar ia in A f r ica (F ig . 8 .2) (Tanseret a l . , in press) . Temperature and prec ip i ta t ion thresholds were ident i f ied f rom f ie ld data and were wi th in the publ ishedbio log ica l ranges a f fec t ing both vector and paras i te deve lopment . The thresholds were fur ther re f ined us ing area-spec i f icexper t op in ion knowledge of the d is t r ibu t ion and seasonal i t y o f the d isease in A f r ica and h is tor ica l pub l ished andunpubl ished maps . The model was spat io tempora l l y va l ida ted us ing independent data f rom f ie ld paras i te sur veys conductedthroughout A f r ica and has been used to es t imate person–months o f exposure in A f r ica (Tanser e t a l . , in press) .
The c l imate scenar ios used in the model represent a 30-year average of month ly temperature and prec ip i ta t ion data and areused in the model to represent an average or t yp ica l year. The model es t imates the c l imate t ransmiss ion potent ia l for anaverage year and the su i tab i l i t y for a g iven seasonal pat tern o f t ransmiss ion . Weather ex t remes may t r igger ep idemics inpar t icu lar areas , but such models cannot address the impact o f c l imate var iab i l i t y on malar ia r isk .
Source: Tanser e t a l . , ( in press) .
Fig. 8.2. Map of the transmission season length for P. falciparum malaria in Africa under current climate
No transmission
1-3 months
4-6 months
7-9 months
10-12 months
Source: Tanser et al., (in press).
76
Malaria
Malaria is transmitted by mosquitoes of the genus Anopheles.About 70 species are vectors of malariaunder natural conditions.These species vary considerably in their ability to transmit malaria.AlthoughAnopheles mosquitoes are most abundant in tropical or subtropical regions, they are also found intemperate climates.
Malaria is caused by four species of protozoa that invade human red blood cells. Only the two mainspecies (accounting for 90–95% of all cases) are considered: Plasmodium vivax and P. falciparum.Parasites differ in the minimum temperature for parasite development and in current health impact anddistribution.The assessment of the impact of climate change on malaria should therefore be presentedseparately for P. vivax and P. falciparum.
P. falciparum malaria is unusual in that several research groups have independently modelled therelationships between climate and disease distribution at the global, regional and local level (Martens etal., 1999; Rogers & Randolph, 2000). Malaria models can be used to estimate the populations at risk orperson–months at risk for a range of climate and population scenarios.
The MARA collaboration developed a climate-driven model for Africa (Craig et al., 1999). The modelrepresents uncertainty around the edges of the distribution of endemic malaria.The model was validatedby comparison with current and historical distribution maps that were apparently independent of themodel-building process.The main limitations of this model are (1) the reliance on laboratory data and asmall number of field studies to define climate cutoffs, (2) apparent subjectivity in at least one parameterestimate: the proportion of mosquitoes that need to survive the sporogonic cycle to maintaintransmission, which defines the precise value of the lower temperature cutoff, (3) the need to make anassumption about the shape of the “fuzzy membership curve” and (4) validation by visual comparisonrather than calculating diagnostic statistics.
A model that has already been developed and validated for the relevant geographical area isrecommended to be used in the national assessment. If this is not possible, then the development of anew model may be limited by the data that are available.Any model must be formally validated againstthe current geographical and, if possible, seasonal distribution of the disease.
Dengue
Dengue is transmitted by two species of mosquitoes, Aedes aegypti and Aedes albopictus.The denguevirus (a flavivirus) has four distinct serotypes (designated DEN-1, -2, -3, and -4). Climate affects theseasonal abundance and distribution of Aedes mosquitoes and seasonal patterns of dengue transmission.Several studies have explored the relationship between climate and the intensity of denguetransmission. Most were derived from a series of biological models that relate climate variables todeterminants of the population biology of Aedes vectors and dengue transmission (Focks et al., 1995).Global dengue models have been developed that use biological (Jetten & Focks, 1997) or statisticalmethods (Hales et al., 2002).
Biological dengue models have been used to estimate the future change in transmission potentialassociated with climate scenarios. Mosquito survival, human biting habits and the duration of humaninfectiousness were set as temperature-independent constants,with parameter values defined using fielddata from a number of sites.As stated above, applying a biological model requires validation with localdata. An increase in seasonal temperature (as in all climate scenarios) will indicate an increase intransmission potential. However, interpreting this indicator in relation to actual cases of disease isdifficult.
An alternative method of estimating the impact of climate change on dengue is to use current data tomap its distribution within a statistical model. Several indicators have been developed to measureinfestation of the A. aegypti mosquito: ecological index, house (premises) index and Breteau index
8. Vector-borne diseases

77
PART 2. METHODS AND TOOLS
(WHO Regional Office for South-East Asia,2003).Describing the current seasonal pattern of transmissionand, if possible, quantifying the effects of temperature and precipitation are important. Dengue isprimarily an epidemic disease, and the risk of epidemics is linked to complex patterns such as hostimmunity.A temperature rise may be expected to increase transmission intensity and lead to loweringof the average ages of primary and secondary infections and thereby significantly increase theproportion of secondary infections occurring among infants and adolescents, the ages thought to beespecially susceptible to dengue haemorrhagic fever and shock syndrome.
Box 8.4. Tools for modelling dengue: CIMSiM and DENSiM
C I MSiM is a weather- and habi ta t -dr iven entomolog ica l dynamic s imula t ion model that produces mean-va lue est imates o fvar ious parameters for a l l cohor ts o f a s ing le spec ies o f Aedes mosqui to wi th in a representa t i ve 1-hectare area (Focks e ta l . , 1995) . C I MSiM mainta ins in format ion on abundance , age , deve lopment wi th respect to temperature and s ize , weight ,fecundi t y and gonotroph ic s ta tus . Deve lopment t imes of eggs , lar vae , pupae and the gonotroph ic cyc le are based ontemperature us ing an enz yme k inet ics approach . Da i l y weather data are used in C I MSiM.
Microc l imate is a key determinant o f sur v iva l and deve lopment for a l l s tages . Adu l t microc l imate is assumed to be the sameas the da i l y loca l weather. For mosqui to immatures , however, C I MSiM ca lcu la tes da i l y water temperatures and water ga insand losses for each o f the representa t i ve conta iners based on loca l weather and conta iner character is t ics and locat ion . Themodel can be va l ida ted for a spec i f ic popula t ion i f loca l in format ion is obta ined through a pupal and demographic sur vey .The D E N SiM model is the corresponding s imula t ion model o f human popula t ion dynamics dr iven by countr y and age-spec i f icb i r th and death ra tes . The outcome of C I MSiM prov ides input to D E N SiM, and an in fec t ion model accounts for thedeve lopment o f v i rus wi th in ind iv idua ls and i ts passage between both popula t ions (see Annex 2 for web s i te wi th moredeta i ls) .
Schistosomiasis
Schistosomiasis, caused by five species of the trematode (flat worm) Schistosoma, requires water snailsas an intermediate host. The worldwide prevalence has risen since the 1950s largely because of theexpansion of irrigation systems in hot climates where viable snail populations can survive and theparasite can find human carriers (Brown, 1994).
The distribution of the snail hosts is focal and has been mapped in relation to climate and environmentalfactors.All three genera of intermediate hosts (Bulinus, Biomphalaria and Oncomelania) can toleratea wide temperature range. Life-table experiments indicate that the optimum temperature is 25 ± 2 °C.At low temperatures, snails are effectively dormant, fecundity is virtually zero but survival is good; athigh temperatures, egg production increases but so, too, does mortality. Snails are mobile and can moveto avoid extreme temperatures within their habitats: water can act as an efficient insulator.
Mechanisms to be considered include the following.
• In highland areas, global climate change might allow schistosomiasis transmission to extend its rangeto higher altitudes.
• Increasing temperatures at sea level could be lethal unless the snails can move to cooler refuges.Theprecise conditions within water bodies that should be taken into account depend on numerousfactors related to the local geology and topography, the general hydrology of the region, the presenceor absence of aquatic vegetation and local agricultural usage.

78
• An increase in heavy, local or widespread thunderstorms, could flush snails out of many of theirhabitats.
• Prolonged or persistent flooding might increase the number of potential snail habitats downstream.
• Reduced rainfall could reduce snail populations, and prolonged drought may eliminate the snailpopulation altogether.
The potential impact of climate change on the distribution of schistosomiasis has been modelled in anendemic country (Moodley et al., in press). Schistosomiasis is currently endemic in KwaZulu-Natalprovince and is present in several other provinces in South Africa. The distribution of the disease isassociated with climate factors (mainly temperature), geomorphology and habitat stability.Two modelswere developed to map the current and future distributions.The models projected that Schistosomahaematobium could extend its distribution inland and estimated the additional population at risk(restricted to those aged 5–14 years) under a medium-range climate scenario.
Although snails reproduce relatively rapidly, they do not disperse rapidly, either actively or passively.However, Schistosoma parasites themselves may be rapidly and widely transmitted within human hostsand may infect new snail species in previously risk-free areas. Schistosomiasis may therefore expand intonewly climatically suitable areas. However, given the relative immobility of the snail hosts, climatechange may be expected to have greater short- and medium-term effects on the local distribution andabundance than on the global distribution of suitable vectors.
Tick-borne diseases
Ticks may live for 3 years. Their year-round survival, egg-hatching and development from larvae intonymphs and finally adults depend on the presence of certain ecological as well as climatic conditions.The environment and climate determine (1) the limits of the spatial distribution for the distribution ofticks according to latitude and altitude, (2) the daily variability in the risk of infective tick bites; (3) theseasonal patterns in the risk of infective tick bites, (4) interannual variability in the risk of infective tickbites and (5) long-term trends (WHO Regional Office for Europe, in press).Tick activity patterns varybetween years and between locations depending on both climate variability and habitat vegetation. Incentral Europe, the developmental cycle is 2–3 years and is considerably affected by the microclimateof the habitat and long-term changes in weather.The number of days per season with temperature andhumidity favourable for tick activity,development and year-round survival directly affect tick abundance.Tick density,and subsequent disease risk,during a specific year has been linked to seasonal daily climaticconditions during two successive years previous to the one studied (Lindgren, 1998; Lindgren et al.,2000; Lindgren & Gustafson, 2001).
The possible effects of future climate risks can be assessed by models based on current spatialassociations between the incidence of tick-borne encephalitis and climate or by quantifying temporalpatterns in tick-borne encephalitis with climate, including interannual variability and long-term trends.The key question for Europe, for example, is whether the apparent increase in cases reported per yearsince the 1980s in the Baltic countries (Estonia, Finland, Latvia, Lithuania, Poland and Sweden) and incentral Europe (the Czech Republic,Germany,Slovakia and Switzerland) can be attributed to the climatechange during that time. Some of this upward trend could result from changes in reporting proceduresor in changes in human activity patterns leading to greater exposure. However, no such increasing trendhas been observed in the most southerly countries of the tick-borne encephalitis range, where climatechange is more likely to lead to a reduction in incidence: Croatia, Hungary and Slovenia (Randolph,2000).
The possible impact of future climate change on the distribution of Lyme disease (borreliosis) in Europe,for example, can be investigated by quantifying the role of climate on the observed spatial and temporalpatterns described above. Much research has been undertaken on Ixodes ricinus of the activity andthresholds for metamorphosis as well as the effect of climate variables on tick survival. Such knowledge
8. Vector-borne diseases
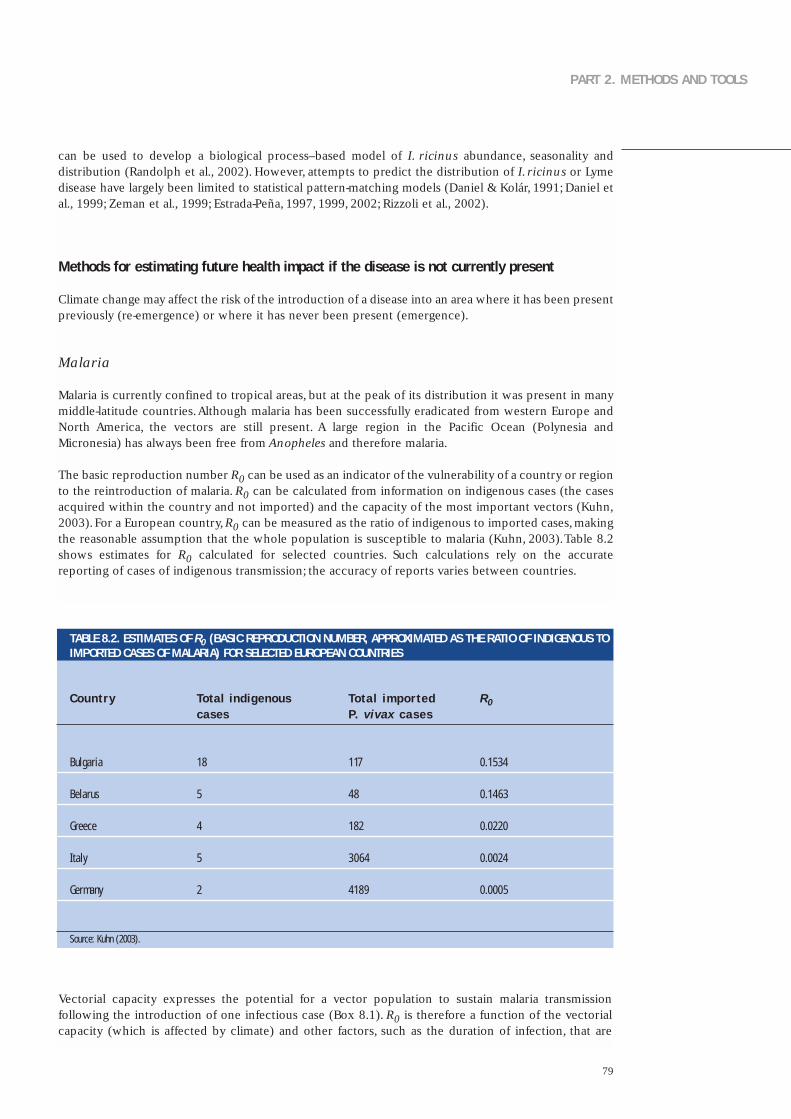
79
PART 2. METHODS AND TOOLS
can be used to develop a biological process–based model of I. ricinus abundance, seasonality anddistribution (Randolph et al., 2002). However, attempts to predict the distribution of I. ricinus or Lymedisease have largely been limited to statistical pattern-matching models (Daniel & Kolár, 1991; Daniel etal., 1999; Zeman et al., 1999; Estrada-Peña, 1997, 1999, 2002; Rizzoli et al., 2002).
Methods for estimating future health impact if the disease is not currently present
Climate change may affect the risk of the introduction of a disease into an area where it has been presentpreviously (re-emergence) or where it has never been present (emergence).
Malaria
Malaria is currently confined to tropical areas, but at the peak of its distribution it was present in manymiddle-latitude countries.Although malaria has been successfully eradicated from western Europe andNorth America, the vectors are still present. A large region in the Pacific Ocean (Polynesia andMicronesia) has always been free from Anopheles and therefore malaria.
The basic reproduction number R0 can be used as an indicator of the vulnerability of a country or regionto the reintroduction of malaria. R0 can be calculated from information on indigenous cases (the casesacquired within the country and not imported) and the capacity of the most important vectors (Kuhn,2003). For a European country,R0 can be measured as the ratio of indigenous to imported cases, makingthe reasonable assumption that the whole population is susceptible to malaria (Kuhn, 2003).Table 8.2shows estimates for R0 calculated for selected countries. Such calculations rely on the accuratereporting of cases of indigenous transmission; the accuracy of reports varies between countries.
TABLE 8.2. ESTIMATES OF R0 (BASIC REPRODUCTION NUMBER, APPROXIMATED AS THE RATIO OF INDIGENOUS TOIMPORTED CASES OF MALARIA) FOR SELECTED EUROPEAN COUNTRIES
R0
0.1534
0.1463
0.0220
0.0024
0.0005
Total indigenous cases
18
5
4
5
2
Total impor tedP. v ivax cases
117
48
182
3064
4189
Source: Kuhn (2003).
Vectorial capacity expresses the potential for a vector population to sustain malaria transmissionfollowing the introduction of one infectious case (Box 8.1). R0 is therefore a function of the vectorialcapacity (which is affected by climate) and other factors, such as the duration of infection, that are
Country
Bulgar ia
Belarus
Greece
I ta ly
Germany
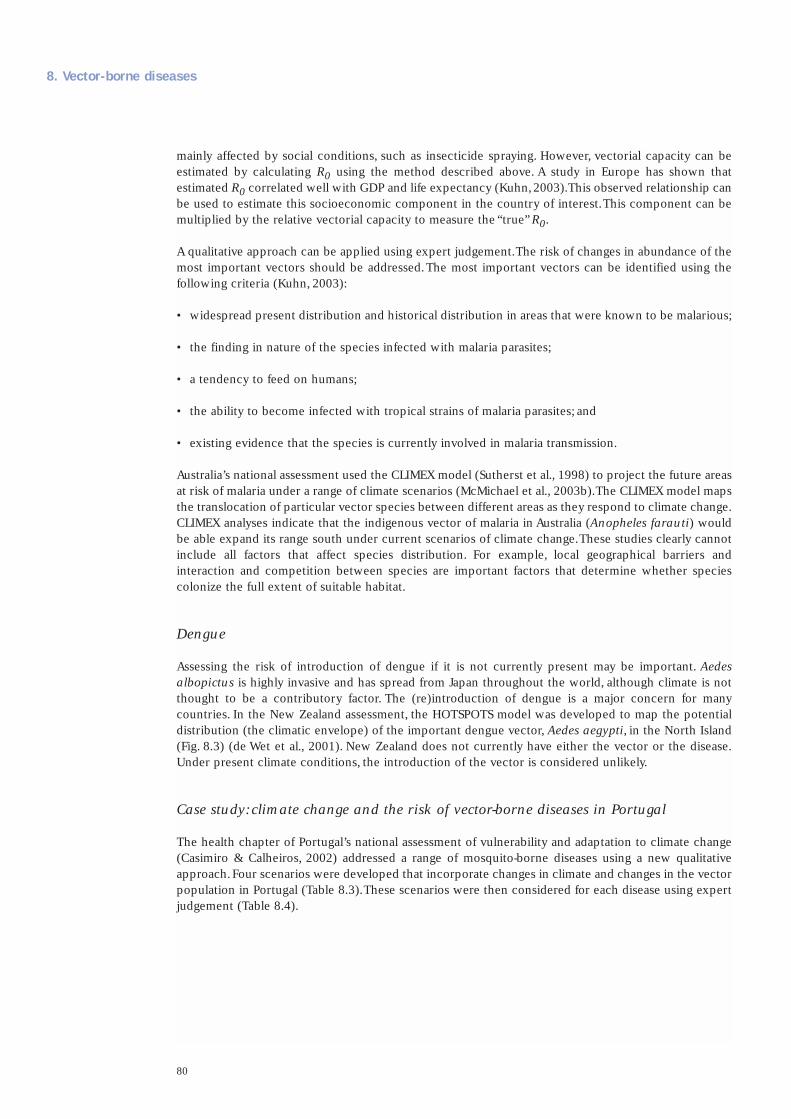
80
mainly affected by social conditions, such as insecticide spraying. However, vectorial capacity can beestimated by calculating R0 using the method described above. A study in Europe has shown thatestimated R0 correlated well with GDP and life expectancy (Kuhn,2003).This observed relationship canbe used to estimate this socioeconomic component in the country of interest.This component can bemultiplied by the relative vectorial capacity to measure the “true” R0.
A qualitative approach can be applied using expert judgement.The risk of changes in abundance of themost important vectors should be addressed.The most important vectors can be identified using thefollowing criteria (Kuhn, 2003):
• widespread present distribution and historical distribution in areas that were known to be malarious;
• the finding in nature of the species infected with malaria parasites;
• a tendency to feed on humans;
• the ability to become infected with tropical strains of malaria parasites; and
• existing evidence that the species is currently involved in malaria transmission.
Australia’s national assessment used the CLIMEX model (Sutherst et al., 1998) to project the future areasat risk of malaria under a range of climate scenarios (McMichael et al., 2003b).The CLIMEX model mapsthe translocation of particular vector species between different areas as they respond to climate change.CLIMEX analyses indicate that the indigenous vector of malaria in Australia (Anopheles farauti) wouldbe able expand its range south under current scenarios of climate change.These studies clearly cannotinclude all factors that affect species distribution. For example, local geographical barriers andinteraction and competition between species are important factors that determine whether speciescolonize the full extent of suitable habitat.
Dengue
Assessing the risk of introduction of dengue if it is not currently present may be important. Aedesalbopictus is highly invasive and has spread from Japan throughout the world, although climate is notthought to be a contributory factor. The (re)introduction of dengue is a major concern for manycountries. In the New Zealand assessment, the HOTSPOTS model was developed to map the potentialdistribution (the climatic envelope) of the important dengue vector, Aedes aegypti, in the North Island(Fig. 8.3) (de Wet et al., 2001). New Zealand does not currently have either the vector or the disease.Under present climate conditions, the introduction of the vector is considered unlikely.
Case study: climate change and the risk of vector-borne diseases in Portugal
The health chapter of Portugal’s national assessment of vulnerability and adaptation to climate change(Casimiro & Calheiros, 2002) addressed a range of mosquito-borne diseases using a new qualitativeapproach.Four scenarios were developed that incorporate changes in climate and changes in the vectorpopulation in Portugal (Table 8.3).These scenarios were then considered for each disease using expertjudgement (Table 8.4).
8. Vector-borne diseases
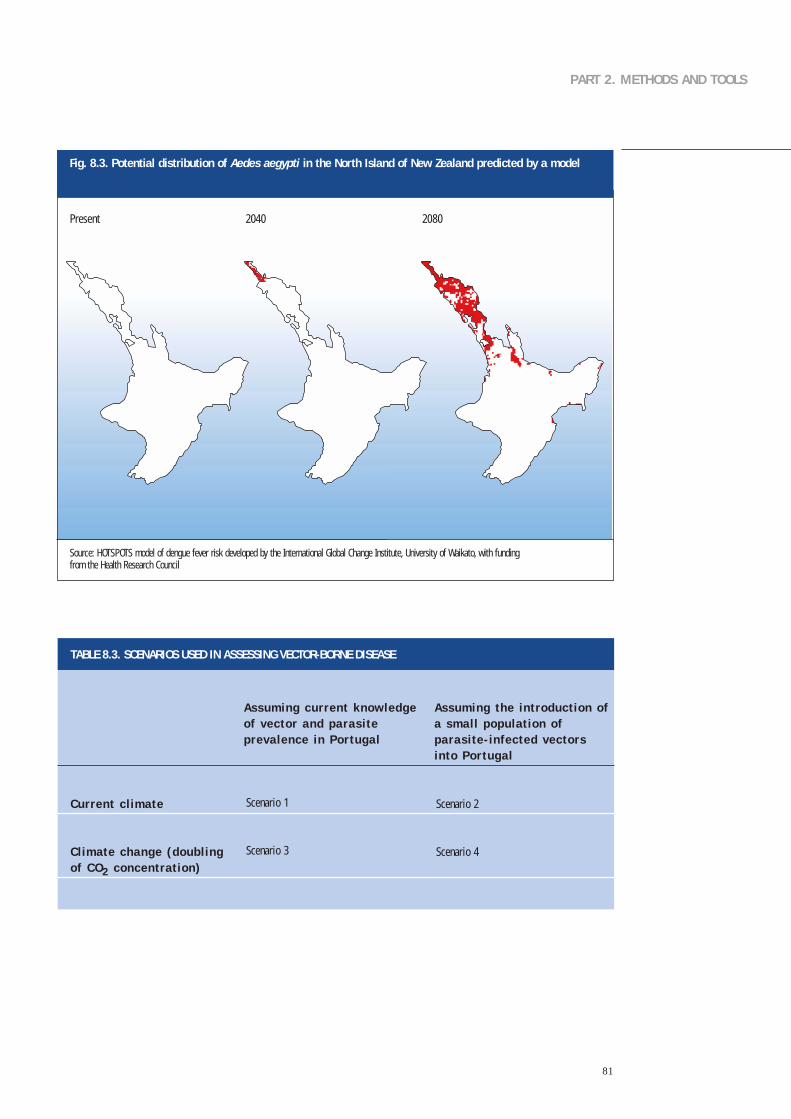
81
PART 2. METHODS AND TOOLS
TABLE 8.3. SCENARIOS USED IN ASSESSING VECTOR-BORNE DISEASE
Current c l imate
Cl imate change (doubl ing of CO2 concentrat ion)
Scenar io 1
Scenar io 3
Scenar io 2
Scenar io 4
Assuming current knowledge Assuming the introduct ion of of vector and parasi te a smal l populat ion of prevalence in Por tugal parasi te- infected vectors
into Por tugal
Fig. 8.3. Potential distribution of Aedes aegypti in the North Island of New Zealand predicted by a model
Source: HOTSPOTS model of dengue fever risk developed by the International Global Change Institute, University of Waikato, with fundingfrom the Health Research Council
Present 2040 2080
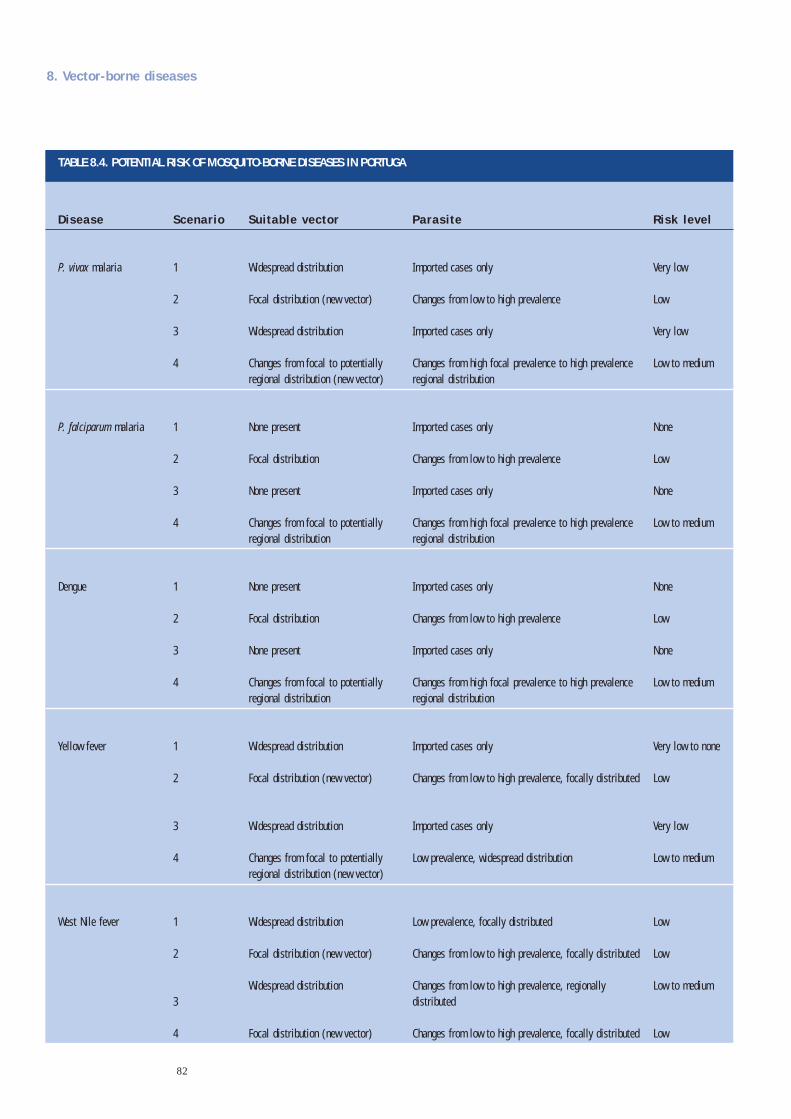
82
8. Vector-borne diseases
TABLE 8.4. POTENTIAL RISK OF MOSQUITO-BORNE DISEASES IN PORTUGA
Disease
P. v i vax malar ia
P. fa lc iparum malar ia
Dengue
Yel low fever
West N i le fever
Risk level
Very low
Low
Very low
Low to medium
None
Low
None
Low to medium
None
Low
None
Low to medium
Very low to none
Low
Very low
Low to medium
Low
Low
Low to medium
Low
Suitable vector
Widespread d is t r ibu t ion
Focal d is t r ibu t ion (new vector)
Widespread d is t r ibu t ion
Changes f rom foca l to potent ia l l yreg iona l d is t r ibu t ion (new vector)
None present
Foca l d is t r ibu t ion
None present
Changes f rom foca l to potent ia l l yreg iona l d is t r ibu t ion
None present
Foca l d is t r ibu t ion
None present
Changes f rom foca l to potent ia l l yreg iona l d is t r ibu t ion
Widespread d is t r ibu t ion
Focal d is t r ibu t ion (new vector)
Widespread d is t r ibu t ion
Changes f rom foca l to potent ia l l yreg iona l d is t r ibu t ion (new vector)
Widespread d is t r ibu t ion
Focal d is t r ibu t ion (new vector)
Widespread d is t r ibu t ion
Focal d is t r ibu t ion (new vector)
Parasi te
Impor ted cases on ly
Changes f rom low to h igh preva lence
Impor ted cases on ly
Changes f rom h igh foca l preva lence to h igh preva lencereg iona l d is t r ibu t ion
Impor ted cases on ly
Changes f rom low to h igh preva lence
Impor ted cases on ly
Changes f rom h igh foca l preva lence to h igh preva lencereg iona l d is t r ibu t ion
Impor ted cases on ly
Changes f rom low to h igh preva lence
Impor ted cases on ly
Changes f rom h igh foca l preva lence to h igh preva lencereg iona l d is t r ibu t ion
Impor ted cases on ly
Changes f rom low to h igh preva lence , foca l l y d is t r ibu ted
Impor ted cases on ly
Low preva lence , widespread d is t r ibu t ion
Low preva lence , foca l l y d is t r ibu ted
Changes f rom low to h igh preva lence , foca l l y d is t r ibu ted
Changes f rom low to h igh preva lence , reg iona l lyd is t r ibu ted
Changes f rom low to h igh preva lence , foca l l y d is t r ibu ted
Scenario
1
2
3
4
1
2
3
4
1
2
3
4
1
2
3
4
1
2
3
4

83
PART 2. METHODS AND TOOLS
Detecting early evidence of climate change effects
Assessment should also address whether climate change has had a role in the emergence or re-emergence of disease within the country (see the example of tick-borne encephalitis above). Earlydetection of climate change effects could be facilitated by careful selection of indicators, following thecriteria already developed for non-health outcomes (Parmesan, 1996; Ahmad & Warrick, 2001). Suitableindicators may measure either risks to health or the health states themselves.The indicators should showhigh climate sensitivity and vulnerability (little intentional or unintentional adaptation to climate changeeffects) and have few plausible alternative explanations. Kovats et al., (2000) have suggested apreliminary stratification of possible indicators for climate change effects on vector-borne disease. Ofthe candidate variables, almost all are highly climate-sensitive: however, they vary significantly invulnerability and the plausibility of alternative explanations.Among the most suitable are the length ofactivity seasons and the altitude distribution of vectors in pristine environments. Among the leastsuitable are changes in the incidence of controllable diseases, transmitted in and around houses. Resultsfrom non-health studies suggest that monitoring the most suitable indicators could be expected todemonstrate clear effects of climate change within the next decade or two, assuming similar rates ofchange to those observed in recent years.
Adaptation: strategies, policies and measures
Assessment of adaptation generates a range of strategies, policies and measures to address the potentialhealth impact of vector-borne diseases. Ideally, this list will range from interventions that aretheoretically possible at some future date to those that can be implemented practically in the short term.Policy-makers and decision-makers should be aware of possible interventions that could be available inthe future to address vector-borne diseases so that appropriate action can be taken. This includesestablishing research programmes to encourage the development of interventions that are not yettechnically feasible or are too costly, instituting trials of the effectiveness of promising butundemonstrated interventions or changing policies or public attitudes for desirable interventions thatare currently not socially acceptable.
The interventions policy-makers choose to implement need to satisfy a number of requirements,including being effective in reducing the burden of disease, technically and economically feasible,socially acceptable and compatible with current policies.Typically, cost–benefit analysis is conducted todemonstrate the value of the intervention. In addition, having coordination and collaboration acrossregions or countries on interventions such as vector-control activities when the vector and pathogen areproblems across boundaries may be desirable.
The following section briefly discusses some of the interventions that aim to reduce morbidity andmortality from vector-borne diseases; this is intended only to illustrate some approaches.Theappropriateness of a particular intervention depends on local circumstances, including the agedistribution of the population, the degree of immunity to the disease, the level and distribution ofeconomic resources in the population, the proportion of the population that lives in areas at risk andthe effectiveness of current vector control measures.
The presence of vector-borne diseases depends on vector control measures. Malaria epidemics are focalin nature and may often be controlled by limited application of safe and effective residual insecticides.Parasite resistance to antimalarial agents is a threat to malaria control programmes and drug sensitivitymust therefore be reviewed regularly.At the personal level, insecticide-protected fabrics such as bednetshave been shown to be effective against infective mosquito bites.

84
Dengue vector control
The vector mosquito in Asia and the Americas breeds primarily in human-made containers such asbarrels and other water storage containers. Elements of a global strategy to control dengue include:
• conducting surveillance of vector density and disease transmission;
• developing selective and sustainable vector control, including preparedness for emergency control;
• strengthening local capacity for assessing the social, cultural, economic and environmental factorsthat lead to increased vector density and increased transmission of disease;
• ensuring early diagnosis and prompt treatment of dengue haemorrhagic fever in disease management;
• conducting research in vector control; and
• mobilizing other sectors to incorporate dengue control into their goals and activities.
Epidemic preparedness
Malaria prevention illustrates approaches to adaptation that apply to other vector-borne disease threats.Human populations must take adaptive measures to reduce the increased risks of malaria. Althoughchanges in weather or socioeconomic conditions may trigger malaria epidemics, many health servicesfail to monitor these variables because the indicators of risk for epidemic-prone areas have not beendetermined.
Malaria surveillance and epidemic preparedness may benefit from recently developed tools that predictthe seasonality and risk of epidemics using satellite or ground-based meteorological data (Githeko &Ndegwa, 2001;WHO, 2001a). New approaches to mapping the distribution of malaria vectors over largeareas may facilitate species-specific vector control activities. In western Kenya, the risk of malariatransmission in the highlands can be predicted using a simple predictive model dependent on rainfalland temperature.
Integrated environmental management
The incidence of certain waterborne and vector-borne infections can be reduced by severalenvironmental measures. Experience with the WHO/FAO/UNEP/UNCHS (United Nations Centre forHuman Settlements) Panel of Experts on Environmental Management for Vector Control has shown thatearly consultations between the health and agricultural sectors can greatly reduce the burden of vector-borne diseases such as malaria and schistosomiasis in large-scale irrigation projects (Birley, 1991).Climate change is likely to amplify the challenge of pest control because new ecological niches willappear that may sustain exotic pathogens and disease vectors.
The recent establishment of the Environmental Risk Management Authority in New Zealand is anexample of a strategy of collaboration between the health, forestry, environment and conservationsectors (Woodward et al., 2001). New Zealand is especially vulnerable to invading species.The Authorityprovides an integrated approach with a wide-ranging brief that includes regulation of importation,investigation of incidents and emergencies and review of existing hazards.The Authority has formal linkswith many sectors, must consider public input from diverse interest groups and reports directly to asenior minister who holds both the environment and biosecurity portfolios.
8. Vector-borne diseases

85
PART 2. METHODS AND TOOLS
What is the evidence that climate change could affect the burden of diarrhoeal disease?
Many infectious diseases are sensitive to either temperature or rainfall, showing strong seasonal variationin numerous sites. Many diarrhoeal diseases (infectious intestinal disease) peak in cases during thehottest months of the year.This is true for Salmonella infections in Europe and for Shigella infectionsin South Asia.Temperature and relative humidity directly influence the rate of replication of bacterialand protozoan pathogens and the survival of enteroviruses in the environment. Rainfall, and especiallyheavy rainfall events, may affect the frequency and level of contamination of drinking-water.
Diarrhoeal disease have multiple modes of transmission, such as via water, food, insects or contactbetween humans.The relative importance of the various pathogens that cause diarrhoea varies betweenlocations and is greatly influenced by the level of sanitation. Several studies have described climateeffects on specific diarrhoea pathogens (Campbell-Lendrum et al., 2003). Pathogens vary in the severityof clinical symptoms and the likelihood that they will be reported to health services.The numbers ofcases reported either through clinics or laboratory-based surveillance therefore only represent a smallproportion of the total disease burden, especially for diseases that are not severe. Further, relationshipsbetween climate and disease derived from passive reporting may differ from those based on othermethods of surveillance.
Climate change could greatly influence water resources and sanitation in situations where water supplyis effectively reduced. Drought events can lead to an increased concentration of pathogenic organismsin raw water supplies. In addition, water scarcity may necessitate using sources of fresh water of poorerquality, such as rivers, which are often contaminated. Increases in rainfall may cause flooding andoverwhelm sewerage systems.All these factors could result in an increased incidence of disease.
Methods for estimating the health impact of weather
Time–series methods can be used to quantify an association between variation (daily, weekly ormonthly) in diarrhoea outcomes and environmental temperature. The seasonal cycle and other long-term patterns should be removed from the data series to address non-temperature-related seasonalfactors (see Chapter 5). Other confounders should be taken into account in the modelling process.Theeffect of high temperatures may be only apparent after 1–2 weeks, as delay is inherent between the timeof infection, the onset of symptoms and when disease is recorded through routine surveillance. Thefollowing factors should be considered:
• Health data may be available from routine surveillance (laboratory-confirmed cases by pathogen) orthe records of infectious intestinal illness at primary care clinics or hospitals.
• The date of onset of illness (or admission) should be reasonably accurately recorded, and data shouldbe available at the weekly or daily resolution. Analysis of aggregate monthly data may lead tooverestimation of a temperature effect because the potential to control for the effects of non-climatefactors (such as seasonal confounding) is limited.
• If the model is based on a relationship derived from a different population, then justifying thisextrapolation is important, especially if the other population differs in climate and the burden ofdiarrhoeal disease.
• A climate relationship with a specific diarrhoea pathogen can be used to estimate the effects on thetotal burden of diarrhoeal disease if information is also obtained on (1) their relative contribution to
9. Waterborne and foodborne diarrhoeal disease

86
overall disease incidence and (2) equivalent data on climate-sensitivity and relative prevalence for allother diarrhoea pathogens.
Methods for estimating future health impact
Modelling the effects of changes in temperature
Very few studies have estimated the potential impact of climate change on diarrhoeal disease.The WHOassessment of the global burden of disease restricted their estimates to the effect of increasingtemperatures on the incidence of all-cause diarrhoea and made no prediction of the effect of changingrainfall patterns (Campbell-Lendrum, 2003). The relationship between temperature and diarrhoealdisease was derived from two published studies.
• Time–series analysis was used to correlate measurements of temperature and relative humidity withdaily hospital admissions at a single paediatric clinic for diarrhoeal disease in Lima, Peru (Checkley etal., 2000). Admissions increased by 4% (95% confidence interval 2–5%) for each 1 °C increase intemperature during the hotter months and 12% per 1 °C (95% confidence interval 10–14%) increasein the cooler months, averaging an 8% increase per 1 °C (95% confidence interval 7–9%) over thecourse of the study.
• Time–series analysis was used to correlate the monthly reported incidence of diarrhoea throughoutFiji with variation in temperature, after allowing for the effects of seasonal variation and long-termtrend (Singh, 2001). The reported incidence increased by about 3% (95% confidence interval1.2–5.0%) for each 1 °C increase in temperature.
Studies have also been undertaken in industrialized countries that quantify the relationship betweentemperature and reported cases of salmonellosis.
• Time–series analyses was used to estimate the relationship between weekly reports of cases ofsalmonellosis and weekly mean temperature in several European countries (Kovats et al., 2003c), afterallowing for the effects of seasonal variation, trend and the effect of public holidays on the diseasereporting.
• Poisson regression was used to estimate the association between monthly variation in Salmonellainfection and temperature in five cities in Australia (D’Souza et al., in press).
The potential impact of an increase in temperatures depends on the burden of disease at that time.Theestimated relative increase (relative risk) can be applied to appropriate projections of diarrhoeal diseasefor the population that is the focus of the assessment. These baseline levels independent of climatechange are likely to change over time with development, tending to decrease with economicdevelopment and improved sanitation in developing countries (see the discussion of socioeconomicscenarios in Chapter 4).
Modelling the effects of changes in rainfall
The potential impact of changes in rainfall on waterborne disease is clearly very important. However,little epidemiological research has addressed the role of rainfall in either triggering individual outbreaksor in the overall burden of waterborne disease. Potential mechanisms include the following.
• Heavy precipitation causes sewers to overflow and people come into contact with pathogens andfaecal matter.
• Heavy rainfall causes contamination of surface or coastal water if the sewers are used as storm drains.
9. Waterborne and foodborne diarrhoeal disease
87
PART 2. METHODS AND TOOLS
• Heavy rainfall leads to agricultural runoff contaminated with livestock faeces into surface water,which reaches the public water supply or direct contact with humans.
• Heavy rainfall leads to failure in a wastewater-treatment plant.
• Drought reduces the amount of surface water and groundwater, leading to increasing concentrationsof pathogens and the use of alternative sources of water that are less potable.
Methods are much less well developed to undertake risk assessment of the impact of changes in rainfallassociated with climate change.There are several reasons for this. It may only be possible to identifyreported disease outbreaks and assess the role of weather or extreme rainfall. Most industrializedcountries have few outbreaks of waterborne disease.
Adaptation: strategies, policies and measures
The most important adaptive measure is to ensure equal access to safe, clean potable water andsanitation. The sanitation infrastructure should be evaluated in the context of an increased risk ofextreme precipitation events (including droughts and floods).
Assessment of adaptation generates a range of strategies, policies and measures to address the potentialhealth impact of water- and foodborne diseases. Ideally, this list will range from interventions that aretheoretically possible at some future date to those that can be implemented practically in the short term.Policy-makers and decision-makers should be aware of possible interventions that could be available inthe future to address water- and foodborne diseases so that appropriate action can be taken. Thisincludes establishing research programmes to encourage the development of interventions that are notyet technically feasible or are too costly, instituting trials of the effectiveness of promising butundemonstrated interventions or changing policies or public attitudes for desirable interventions thatare currently not socially acceptable.
The interventions that policy-makers choose to implement need to satisfy a number of requirements,including being effective in reducing the burden of disease, technically and economically feasible,socially acceptable and compatible with current policies. Typically, cost–benefit analysis will beconducted to demonstrate the value of the intervention.
The following section briefly discusses some of the interventions that aim to reduce morbidity andmortality from waterborne and foodborne diseases; this is intended only to illustrate some approaches.The appropriateness of a particular intervention depends on local circumstances, including the agedistribution of the population, the level and distribution of economic resources in the population andthe degree of access to clean drinking-water and sanitation.
The most important adaptive measure is to ensure universal access to clean potable water andsanitation. Further, the sanitation infrastructure should be evaluated to determine its vulnerability toextreme precipitation events (including droughts and floods).
Other adaptation measures include improving structures for water control and processing; waterresource planning at sub-watershed levels; education campaigns to encourage the use of soap and waterfor handwashing;and temporary measures to reduce the pathogen concentration in drinking-water, suchas chlorine tablets, boil-water alerts and using sari cloth as a filter.

88
Stratospheric ozone depletion is a quite distinct process from the accumulation of greenhouse gases inthe lower atmosphere (troposphere). Stratospheric ozone has been depleted in both hemispheres, fromthe polar regions to middle latitudes.The ozone layer is expected to recover and will be back to pre-industrial levels by 2050 if compliance is achieved on the banned ozone-depleting substances.The problem is often considered alongside climate change for the following three reasons.
• Several of the greenhouse gases (especially chlorofluorocarbons) also damage stratospheric ozone.
• Cooling in the upper stratosphere associated with global warming can potentially increase theseasonal rate of ozone depletion.
• Absorption of solar radiation by stratospheric ozone influences the heat budget in the loweratmosphere.
Stratospheric ozone depletion is included here as it is a concern for some countries and often includedin national assessment of the impact of climate on human health.
The UNEP/WMO scientific assessment of ozone depletion 2002 (UNEP, 2002) concluded as follows.
• Observations in the stratosphere indicate that total chlorine abundance is at or near its peak, whereasbromine abundance is probably still increasing.
• Springtime Antarctic ozone depletion (the ozone hole) has increased in area throughout the lastdecade, but not as rapidly as it did in the 1980s.
• A future Arctic ozone hole similar to that observed in the Antarctic appears unlikely.
• Springtime Antarctic ozone levels will begin recovering by 2010 because of projected decreases ofozone-depleting substances in the stratosphere.
What is the evidence that stratospheric ozone depletion could affect human health?
Stratospheric ozone absorbs part of the sun’s incoming UV radiation, including much of the UVBradiation and all of the highest-energy UVC radiation. Sustained exposure to UVB radiation harmshumans and many other organisms (UNEP,2002). It can damage the genetic (DNA) material of living cellsand can induce skin cancer in experimental animals. UVB is implicated in causing human skin cancerand lesions of the conjunctiva, cornea and lens; it may also impair the body’s immune system (WHO,1994; Goettsch et al., 1998; Longstreth et al., 1998).
Solar radiation has been consistently implicated in causing nonmelanocytic skin cancer in fair-skinnedhumans. Malignant melanoma arises from the pigment-producing cells of the skin. Although solarradiation is substantially involved in melanoma causation, the relationship is less straightforward than fornonmelanocytic skin cancer; exposure in early life appears to be a major source of increased risk.Themarked increases in the incidence of melanoma in industrialized countries over the past two decadesreflect increases in personal exposure to solar radiation caused by changes in patterns of recreation,clothing and occupation and not necessarily increases in background UV radiation.
10. Stratospheric ozone depletion

89
PART 2. METHODS AND TOOLS
Methods for estimating the health impactof ground-level UV radiation
The effects of ozone depletion on health havebeen assessed quantitatively for skin cancer andcataract where adequate data exist (Feenstra etal., 1998; Longstreth et al., 1998).
Information on the general relationshipbetween solar exposure and skin cancer isavailable from a large body of epidemiologicalresearch. It provides estimates of riskincrements associated with different amountsof time, by stage of life, spent exposed to solarradiation. Measuring an individual’s actualradiation exposure has not generally beenpossible (especially retrospectively); theexposure has been expressed in terms of suchindices as person–time outdoors, frequency ofsevere exposure episodes or category ofoccupation. The risk gradients associated withobserved levels of exposure to UV radiationmust be estimated to estimate the impact ofchanges in UV irradiation on skin cancerincidence. These may be derived from broadpopulation-level epidemiological studies thatdescribe the relationship between averageambient local exposure levels and local skincancer rates.
Scenarios of ozone depletion have beendeveloped based on future projections of theemissions of ozone-depleting substancesassuming compliance with the variousamendments to the Montreal Protocol onSubstances that Deplete the Ozone Layer – theinternational agreement that restricts theemissions of ozone-depleting substances (Fig.10.1). Full compliance with the latestamendment is projected to lead to a peak instratospheric chlorine concentration and ozonedepletion in the first decade of the 21stcentury.
Fig. 10.1. Scenarios for stratospheric ozone depletion and associatedprojections of excess cases of skin cancer
Source: Fahey et al., (2003).
Montreal 1987: the Montreal Protocol on Substances that Deplete the Ozone Layer. London 1990: amendmentsagreed in 1990. Copenhagen 1992: amendments agreed in 1992. Beijing 1999: amendments agreed in 1999.
1980
500
400
300
200
100
0
20.000
15.000
10.000
5.000
0
Year
Year
2000 2020 2040 2060 2080 2100
1980 2000 2020 2040 2060 2080 2100
Excess skin cancer cases
Effective stratospheric chlorine
Effect of the Montreal Protocol
No protocol
Montreal1987
London1990
Copenhagen1992
Case
s pe
r m
illio
n pe
ople
per
yea
rPr
edic
ted
abun
danc
e (p
arts
per
tril
lion)
No protocol
Montreal1987
London1990
Copenhagen1992
Beijing1999 Zero emissions
90
One assessment has estimated that the full-compliance scenario would lead to a peak in excess skincancer of about 5–10% by about 2050 (Slaper et al., 1996).The model incorporates a delay (lag) becausethe incidence of skin cancer depends on the cumulative UVB exposure and the time it takes for cancerto develop (cancer latency).The United States Environmental Protection Agency (1988) has developeda risk assessment model and estimated excess cases of cataracts under a range of ozone depletionscenarios (UNEP, 1998). However, the epidemiological evidence underlying the exposure–responserelationships for cataracts and UV radiation is less certain than for skin cancer outcomes.
The models are limited by uncertainty in the validity of the dose–response relationship, and especiallythe role of personal exposure. As the outcomes occur primarily in certain age groups, age-specificscenarios of population growth should be included in any modelling exercise. Such models could beadapted for a specific population using published epidemiological studies. Estimates have beenpublished for selected latitudes and selected countries.
Adaptation: strategies, policies and measures
In response to Agenda 21,WHO in collaboration with UNEP,WMO, the International Agency on CancerResearch and the International Commission on Non-Ionizing Radiation Protection set up INTERSUN,WHO’s Global UV Project “to reduce the burden of disease resulting from exposure to UV radiation”.INTERSUN encourages and evaluates research and develops an appropriate response throughguidelines, recommendations and disseminating information. Specifically, INTERSUN aims:
• to collaborate with specialist agencies in implementing key research needs;
• to develop reliable predictions of the health and environmental consequences of changes in exposureto UV radiation with stratospheric ozone depletion;
• to develop practical ways of monitoring change in UV-induced health effects over time in relation toenvironmental and behavioural change; and
• to provide practical advice and information to national authorities on the health and environmentaleffects of exposure to UV radiation, means of efficiently disseminating this information and measuresto protect the general public, workers and the environment against the adverse effects of increasinglevels of UV radiation.
Campaigns to reduce personal exposure to sunlight have been implemented in many industrializedcountries.These have been successful and rely on health promotion and education campaigns.A globalUV index has also been developed to enhance education about sun protection (WHO, 2002b).
10. Stratospheric ozone depletion

91
PART 2. METHODS AND TOOLS
Food security remains one of the main political concerns of climate change. High seasonal and year-to-year variability in food supplies, often the result of unreliable rainfall and insufficient water for crop andlivestock production, is a major contributor to chronic undernutrition and food insecurity. Droughtaffects health through several pathways. In the most extreme case, famine, the number of deathsassociated with insufficient food consumption, increases substantially. Famine often occurs when a pre-existing situation of malnutrition worsens.Although food yields and agriculture has been a main focusof research on the impact of climate change, surprisingly little work has been done on how climatechange may affect health through changes in the food supply.
What is the evidence that climate change will affect the food supply and thereby health?
Climate change could affect food production in several ways:
• geographical shifts and yield changes in agriculture;
• reduction in the quantity of water available for irrigation;
• loss of land through rising sea level and the associated salinization; and
• effects on fisheries productivity through rising sea level and changes in water temperatures, currents,freshwater flows and nutrient circulation.
The IPCC Third Assessment Report (McCarthy et al., 2001) was reasonably optimistic that, at the globallevel, the agricultural system could adapt to climate change in the near term. However, the distributionof vulnerability among regions and populations will be uneven. For example, in some tropical areas,crops are already near their maximum temperature tolerance. In dryland areas, non-irrigated agriculturalproduction is likely to be sensitive to even small changes in precipitation. Poor people, and especiallythose living in marginal environments, are most vulnerable to climate-induced food insecurity (Downing& Parry, 1994).The following groups may be most at risk (McCarthy et al., 2001):
• rural smallholder producers
• pastoralists
• rural wage labourers
• urban poor people
• refugees and displaced people.
Hunger and malnutrition are already among the most devastating problems facing countries. FAO (2002)estimated that 840 million people were undernourished in 1998–2000.This figure includes 11 millionin industrialized countries, 30 million in countries in transition and 799 million in developing countries.This latest figure of 799 million represents a decrease of only 20 million since 1990–1992, thebenchmark period used at the World Food Summit. Nearly half the people in countries in central,southern and eastern Africa are undernourished. Environmental factors, both natural and those resultingfrom human activities, can limit agricultural potential.These include extremely dry or cold climate, poorsoil, erratic rainfall, steep slopes and severe land degradation. FAO (2002) further states thatundernutrition and malnutrition prevail in regions where environmental economic and other factorsexpose the population to a high risk of impoverishment and food insecurity.
11. Food security
92
FAO (2002) estimates of food insecurity are based on calculations of the amount of food available in eachcountry (national dietary energy supply) and a measure of inequality in distribution derived fromhousehold income and expenditure surveys.Alternative methods of estimating food insecurity rely ondata from a range of sources: household expenditure surveys; individual food intake surveys;anthropometric surveys on children and adults; and qualitative and indicative self-assessment surveys(such as the measure of food insecurity in the United States). The strengths and weaknesses of eachmethod have been actively debated and assessed in the production of global assessments ofundernutrition. Stunting and wasting are indicators commonly used in epidemiological studies tomeasure undernutrition.The stunting rate is defined as the proportion of children younger than 5 yearswho have a low height for age when measured or compared with the normal height for the age group.The wasting rate is defined as the proportion of children younger than 5 years who have a low weightfor height when measured or compared with the normal weight for height for the age group.
Countries that currently have problems with food security would be especially vulnerable to thepotential impact of climate change on food supplies. However, very few national assessments haveaddressed the potential impact of climate change on malnutrition. Zambia was concerned about thispotential outcome of climate change (Phiri & Msiska, 1998).
Methods for estimating future health impact
National assessments have used models that simulate the effects of climate scenarios (and otherscenarios) on crop yields and food-related outcomes. Predicting the impact of climate change on cropand livestock yields is complex. Agricultural production is sensitive to the direct effects of climate,especially extreme weather events. It is also sensitive to the indirect effects of climate on soil quality, theincidence of plant diseases and weed and insect (including pest) populations. In particular, irrigatedagriculture would be affected by changes in water resources.
Few studies have mapped climate, environment and nutritional outcomes at the national or local level.Temporal studies can also reveal vulnerability to interannual climate variability or the effect of the ElNiño Southern Oscillation.A study in Papua New Guinea has shown that women living in poorer-qualityenvironments produce less food, suffered chronic malnutrition and had children with lower birthweight (Allen,2002).The sporadic occurrence of El Niño was associated with sharp and severe shortagesof food in both the favoured and poorer environments.
At the global and regional scale, integrated assessment of the impact of climate change of populationsat risk of hunger has been attempted (Parry et al., 1998).The population at risk of hunger is defined asthe population with an income insufficient to either produce or procure their food requirements, basedon methods developed by FAO. Regionally based crop yield models are first used to simulate the effectsof climate change (a scenario based on the global climate model) and increased CO2 (which has afertilization effect) on the yield of the major cereal crops.An established world food trade model (theBasic Linked System) is then used to simulate the economic consequences of yield changes, includingchanges in world food output and in world food prices. Projections assume a 50% liberalization of tradeby 2020 and an annual increase in cereal yields of just under 1%. Some consider these assumptions tobe optimistic, but they are consensus best estimates.
National and regional assessments of the impact of climate change on agricultural productivity may beavailable at the national or subnational level, as agriculture is an important economic sector in manycountries. Studies focus on model simulations for changes in crop yield and agricultural risk but providelimited information on future vulnerability to undernutrition. The application of a scenario-drivenapproach requires a sophisticated approach to the development of non-climate scenarios (see Chapter4).
Non-scenario-driven approaches have been developed that address vulnerability and coping capacity atthe local level. Current methods are being developed within the UNDP Adaptation Policy Frameworkthat will be available in 2004.See the UNDP web site (http://www.undp.org/cc) for further information.
11. Food security

93
PART 2. METHODS AND TOOLS
Adaptation: strategies, policies and measures
Assessment of adaptation generates a range of strategies, policies and measures to address the potentialhealth impact of food security. Ideally, this list will range from interventions that are theoreticallypossible at some future date to those that can be implemented practically in the short term.
Governments incorporate most of the nutrition activities on which WHO focuses – whether concerningmicronutrient deficiencies, protein and energy malnutrition or the development of food-based dietaryguidelines – in national nutrition policies or plans of action for nutrition.The World Declaration and Planof Action for Nutrition (WHO, 1992f) obligates countries to develop and implement coherent nationalplans and policies to tackle nutritional problems comprehensively.Countries should consider the impactof future global environmental changes that affect nutrition, especially global climate change, within acomprehensive national food policy.
A crop failure can lead to a disaster in many communities in developing countries, requiring emergencyfood relief. In such a case, timely and sufficient access to international aid agencies and distributionalnetworks will determine the magnitude of the event.
94
Many effects are not disease specific but address more broad questions for human health (Woodward etal., 1998). In addition to the “direct” health effects, losses are anticipated from forced migration causedby rising sea level, impact on production activities and food insecurity. As land areas suitable forcultivation of key staple crops or productive fishing grounds undergo geographical shifts in response toclimate change, they may become the subject of political conflict. Competing demands for water mayalso cause conflict in semi-arid areas – although such claims are often considered controversial(McCarthy et al., eds., 2001).
Depending on the scope and purpose of the assessment,other groups that may be specifically addressedinclude:
• indigenous populations and native peoples
• nomadic populations
• elderly people
• children
• chronically ill people
• people with a low income
• homeless people.
An assessment report should state clearly why specific groups are considered more vulnerable to thepotential health impact associated with climate change.
Population displacement
The IPCC (1990) noted that “the greatest effect of climate change may be on human migration asmillions of people will be displaced due to shoreline erosion, coastal flooding and agriculturaldisruption”. Refugees represent a very vulnerable population with significant health problems. Large-scale migration is likely in response to flooding, drought and other natural disasters associated withclimate change. Both the local ecological disturbance caused by extreme events and the circumstancesof population displacement and resettlement would affect the risk of outbreaks of infectious disease.Anincrease in the magnitude and frequency of extreme events would also disrupt political stability.Displacement caused by longer-term cumulative environmental deterioration (such as land degradationand water scarcity) is also associated with many health effects.
Tuvualu is a small island that is predicted to lose much of its land area in the coming decades. TheGovernment of Tuvalu has accepted the inevitable and has appealed to the neighbouring governmentsto help in the managed relocation of Tuvalu’s population.An agreement was reached with New Zealand,and the managed relocation of inhabitants is now in progress. Programmes must be developed tosupport the settlement and cultural adaptation of the displaced people.
There is concern not only about the source of displaced people but also about countries that mayreceive the displaced people. The New Zealand national health impact assessment addressed thepotential impact of climate change on regional stability (Woodward et al., 2001).The impact of climatechange and rising sea level on Pacific Island countries would have implications for the planning and
12. Vulnerable populations

95
PART 2. METHODS AND TOOLS
provision of health services in New Zealand.This assessment was based on expert assessment, and moreformal methods were not developed.
Indigenous populations
Indigenous populations (Box 12.1) have been identified as especially vulnerable to climate changebecause such populations:
• are more likely to rely on subsistence farming or hunter–gathering and are therefore more vulnerableto climate-related changes in food supplies;
• are more likely to inhabit land that may be affected by climate change or sea level rise;
• often have lower socioeconomic status and poorer health status;
• have less infrastructure to cope; and
• are often socially marginalized from access to services, including reduced access to health care.
The United States national assessment included a chapter on the potential consequence of climatevariability and change for native peoples and homelands in the United States (National AssessmentSynthesis Team, 2001:351–377).A key concern was the health and welfare implications of an increase inthe frequency of extreme events, mainly heat-waves, given the type of housing and reduced access tohealth care facilities for these populations.
Box 12.1. Climate change and health in Nunavik and Labrador
Cl imate change is pro jec ted to s ign i f icant ly a f fec t the d is t r ibu t ion o f sea ice and ecosystems in the Arc t ic reg ion , and thereis some ev idence that th is is a l ready occurr ing . A pro jec t was under taken to deve lop bet ter unders tand ing o f c l imate changeprocesses and potent ia l hea l th impact in two Inu i t popula t ions in Canada (Furga l e t a l . , 2002) . The methods used were arev iew of the heal th sc iences , inc lud ing env i ronmenta l , medica l and t rad i t iona l knowledge l i tera ture , consu l ta t ion wi th exper tsand focus groups wi th exper ienced hunters , e lders and women in Nunav ik and Labrador. The par t ic ipants repor ted s ign i f icantchanges in the env i ronment in the past 20–30 years and descr ibed the impact o f these changes , inc lud ing:
• abi l i t y and safe t y to t rave l a t cer ta in t imes of the year ;• abi l i t y to f ind and hunt cer ta in t ypes o f food; and• abi l i t y to ga in access to potab le water whi le pract is ing t rad i t iona l pursu i ts .
In a l l cases , changes were not repor ted to be tak ing p lace in iso la t ion but s imul taneous ly wi th o ther env i ronmenta l changes .Adapt ive s t ra teg ies that were be ing deve loped to cope wi th these changes were a lso ident i f ied .

96
Ahmad QK, Warrick RA (2001). Methods and tools. In: McCarthy JJ et al., eds. (2001). Climate change2001. Impacts, adaptation and vulnerability. Contribution of Working Group II to the ThirdAssessment Report of the Intergovernmental Panel on Climate Change. Cambridge, CambridgeUniversity Press.
Allen BJ (2002). Birthweight and environment at Tari. PNG Medical Journal, 45(1):88–98.
Arnell NW et al., (2002). The consequences of CO2 stabilization for the impacts of climate change.Climatic Change,53:413–446.
Arnell NW et al., (in press). Socio-economic scenarios for climate change impact assessments:characterising the SRES storylines. Global Environmental Change.
Barker T,Srivastava L (2001).Sector costs and ancillary benefits of mitigation. In:Metz B et al., ed.Climatechange 2001: mitigation. Contribution of Working Group III to the Third Assessment Report of theIntergovernmental Panel on Climate Change. Cambridge, Cambridge University Press.
Barrow EM,Hulme M (1996).The changing probabilities of daily temperature extremes in the UK relatedto future global warming and changes in climate variability. Climate Research, 6:21–31.
Bernard SM, Ebi KL (2001). Comments on the process and product of the health (Suppl. 2) assessmentcomponent of the national assessment of the potential consequences of climate variability andchange for the United States. Environmental Health Perspectives, 109(Suppl. 2):177–184.
Birley MH (1991). Guidelines for forecasting the vector-borne disease implications of water resourcesdevelopment. 2nd ed. Geneva, World Health Organization (Joint WHO/FAO/UNEP/UNCHS Panel ofExperts on Environmental Management for Vector Control (PEEM) Guidelines Series, No. 2;http://www.who.int/water_sanitation_health/resources/peem2/en, accessed 30 October 2003).
Brown D (1994). Freshwater snails of Africa and their medical importance. London,Taylor and Francis.
Bruzzi P, Green SB, Byar DP (1985). Estimating the population attributable risk for multiple risk factorsusing case–control data. American Journal of Epidemiology, 122(5):904–914.
Campbell-Lendrum DH, Prüss-Üstün A, Corvalan C (2003). How much disease could climate changecause? In: McMichael AJ et al., ed. Climate change and health: risks and responses. Geneva,WorldHealth Organization.
Carter TR et al., (1994). IPCC technical guidelines for assessing climate change impacts andadaptations. London, Department of Geography, University College London.
Casimiro E, Calheiros JM (2002). Human health. In: Santos FD, Forbes K, Moita R, eds. Climate change inPortugal: scenarios, impacts, and adaptation measures – SIAM project. Lisbon, Gradiva:241–300.
Checkley W et al., (2000). Effect of El Niño and ambient temperature on hospital admissions fordiarrhoeal diseases in Peruvian children. Lancet, 355: 442–450.
Committee on the Medical Effects of Air Pollution (1998). Quantification of the effects of air pollutionon health in the United Kingdom. London,The Stationery Office.
References

97
REFERENCES
Corvalan CF, Kjellstrom T, Smith KR (1999). Health, environment and sustainable development:identifying links and indicators to promote action. Epidemiology, 10:656–660.
Corvalan C, Briggs D, Zielhuis G, eds. (2000). Decision making in environmental health: from evidenceto action. London, E&F Spon.
Craig MH,Snow RW,le Sueur D (1999).A climate based distribution model of malaria transmission in sub-Saharan Africa. Parasitology Today, 15:104–105.
Curriero F et al., (2002).Temperature and mortality in 11 cities of the eastern United States. AmericanJournal of Epidemiology, 155:80–87.
Daniel M, Kolár J (1991). Using satellite data to forecast the occurrence of the common tick Ixodesricinus. Modern Acarology, 1:191–196.
Daniel M et al., (1999). Tick-borne encephalitis and Lyme borreliosis: comparison of habitat riskassessments using satellite data (an experience from the Central Bohemian region of the CzechRepublic). Central European Journal of Public Health, 7(1):35–39.
Davies DL, Krupnick AJ, McGlynn G, eds. (2000). Ancillary benefits and costs of greenhouse gasmitigation: proceedings from an IPCC Co-sponsored Workshop, 27–29 March 2000, WashingtonDC. Paris, Organisation for Economic Co-operation and Development.
Dessai SR (2002). The Special Climate Change Fund: origins and prioritisation assessment. Norwich,Tyndall Centre of Climate Change Research (Tyndall Briefing Note No. 5).
de Wet N et al., (2001) Use of a computer model to identify potential hotspots for dengue fever in NewZealand. New Zealand Medical Journal, 11:420–422.
Downing TE, Parry ML (1994). Climate change and world food security. Food Policy, 19:99–104.
Downing TE, Tol RS, Olsthroon AA (1996). Climate change and extreme events: altered risk, socio-economic impacts and policy responses. Oxford, Environmental Change Unit, University of Oxford.
D'Souza RM et al., (in press). Does ambient temperature affect foodborne disease? Epidemiology.
Dye C (1986).Vectorial capacity: must we measure all its components? Parasitology Today, 2:203–209.
Dye C (1992). The analysis of parasite transmission by bloodsucking insects. Review of Entomology,37:1–19.
Ebi KL et al., (forthcoming). Adaptation to climate variability and change from a public healthperspective. In: Ebi KL, Smith J, Burton I, eds. Integration of public health with adaptation toclimate change: lessons learned and new directions.
Estrada-Peña A (1997). Epidemiological surveillance of tick populations: a model to predict thecolonization success of Ixodes ricinus (Acari:Ixodidae). European Journal of Epidemiology,13(5):573–580.
Estrada-Peña A (1999). Geostatistics as predictive tools to estimate Ixodes ricinus (Acari: Ixodidae)habitat suitability in the western Palearctic from AVHRR satellite imagery. Experimental and AppliedAcarology, 23(4):337–349.
Estrada-Peña A (2002). Increasing habitat suitability in the United States for the tick that transmits Lymedisease: a remote sensing approach. Environmental Health Perspectives, 110(7):635–640.

98
Ezzati M et al., (2002).Selected major risk factors and global and regional burden of disease.ComparativeRisk Assessment Collaborating Group. Lancet, 360:1347–1360.
Fahey DW et al., (2003). Twenty questions and answers about the ozone layer: scientific assessmentof ozone depletion: 2002. Geneva,World Meteorological Organization (Global Ozone Research andMonitoring Project – Report No. 47).
FAO (2002). The state of food insecurity in the world 2002. Rome, Food and Agriculture Organizationof the United Nations.
Feenstra JF et al., ed. (1998a). Handbook on methods for climate change impact assessment andadaptation strategies.Nairobi,United Nations Environment Programme and Amsterdam, Institute forEnvironmental Studies.
Few R (2003). Flooding, vulnerability and coping strategies: local responses to a global threat. Progressin Development Studies, 3:43–58.
Focks DA et al., (1995).A simulation model of epidemiology of urban dengue fever: literature analysis,model development, preliminary validation, and samples of simulation results. American Journal ofTropical Medicine and Hygiene, 53(5):489–506.
Furgal CM et al., (2002). Climate change and health in Nunavik and Labrador: what we know fromscience and Inuit knowledge.Beauport,QC,WHO/PAHO Collaborating Center on Environmental andOccupational Health Impact Assessment and Surveillance, Centre hospitalier universitaire deQuébec.
Garrett-Jones C (1964). Prognosis for interruption of malaria transmission through assessment of themosquito’s vectorial capacity. Nature, 204:1173–1175.
Gawith MJ, Downing TE, Karacostas TS (1999). Heat waves in a changing climate. In: Downing TE,Olsthoorn AA,Tol RS, ed. Climate, change and risk. London, Routledge:279–307.
German Advisory Council on Global Change (1997). World in transition: the research challenge. Berlin,Springer.
Githeko AK, Ndegwa W (2001). Predicting malaria epidemics using climate data in Kenyan highlands: atool for decision makers. Global Change and Human Health, 2:54–63.
Glantz MH, ed. (2002). Once burned, twice shy? Lessons learned from the 1997/98 El Niño. Tokyo,United Nations University.
Glass RI, Noji EK (1992). Epidemiologic surveillance following disasters. In: Halperin WE, Baker EL,Monson RR, eds. Public health surveillance. New York,Van Nostrand Reinhold:195–205.
Goettsch W et al., (1998).Risk assessment for the harmful effects of UVB radiation on the immunologicalresistance to infectious diseases. Environmental Health Perspectives, 106:71–77.
Hales S et al., (2002).Potential effect of population and climate changes on global distribution of denguefever: an empirical model. Lancet, 360:830–834.
Houghton JT et al., eds. (2001). Climate change 2001: the scientific basis. Contribution of WorkingGroup I to the Third Assessment Report of the Intergovernmental Panel on Climate Change.Cambridge, Cambridge University Press.
Huq S et al., (2003). Mainstreaming adaptation to climate change in least developed countries(LDCs). London, International Institute for Environment and Development.
99
REFERENCES
Hulme M et al., (2002). Climate change scenarios for the United Kingdom: the UKCIP02 scientificreport. Norwich, Tyndall Centre for Climate Change Research, School of Environmental Sciences,University of East Anglia.
Huynen M and Menne B. (2003). Phenology and human health: allergic disorders. Copenhagen,WHORegional Office for Europe Report of a meeting, 16–17 January, Rome, Italy.
IPCC (1990). Impacts assessment of climate change – report of Working Group II. Canberra,AustralianGovernment Publishing Service.
IPCC (1996). Climate change and human health: an assessment prepared by a Task Group on behalfof the World Health Organization, the World Meteorological Organization and the United NationsEnvironment Programme. Geneva,World Health Organization.
Jetten TH, Focks DA (1997). Potential changes in the distribution of dengue transmission underclimate warming.American Journal of Tropical Medicine and Hygiene, 57(3):285–287.
Jones PD et al., (1999). Surface air temperature and its changes over the past 150 years. Reviews ofGeophysics, 37:173–199.
Karacostas TS, Downing TE (1996). Heat wave events in a changing climate. In: Downing TE, OlsthoornAA,Tol RS,eds.Climate change and extreme events:altered risk, socio-economic impacts and policyresponses.Amsterdam, Institute for Environmental Studies:139–156.
Koppe C et al., (in press). Heat-waves: impacts and responses. Copenhagen,WHO Regional Office forEurope (Health and Global Environmental Change Series, No. 3).
Kovats RS, Bouma MJ, Haines A (1999). El Niño and health. Geneva, World Health Organization(WHO/SDE/PHE/99.4;http://www.who.int/environmental_information/Climate/el_nino_and_health_contents.htm,accessed 30 October 2003).
Kovats RS et al., (2000). Climate and vector borne disease: an assessment of the role of climate inchanging disease patterns. Maastricht, ICIS, University of Maastricht.
Kovats RS et al., (2003a). National assessments of health impacts of climate change: a review. In:McMichael AJ et al., eds. Climate change and health: risks and responses. Geneva, World HealthOrganization.
Kovats RS et al., (2003b). El Niño and health. Lancet, 362:1481–1489.
Kovats RS et al., (2003c). Environmental temperature and foodborne disease in 8 European countries.Epidemiology, 14(5):S15.
Kuhn K (2003). Environmental determinants of malaria risk in Europe: past, present and future.Dissertation. London, University of London.
Last JM (1998). Public health and human ecology. London, Prentice Hall International.
Lehto J,Ritsatakis A (1999).Health impact assessment as a tool for intersectoral health policy.Conferenceon Health Impact Assessment: from Theory to Practice, Gothenburg, Sweden, 28–31 October 1999.
Lindgren E. Climate and tickborne encephalitis. Conservation Ecology, 2(1):5(http://www.consecol.org/Journal/vol2/iss1/art5, accessed 30 October 2003).

100
Lindgren E, Gustafson R (2001). Tick-borne encephalitis in Sweden and climate change. Lancet,358:16–18.
Lindgren E,Tälleklint L, Polfeldt T (2000). Impact of climatic change on the northern latitude limit andpopulation density of the disease-transmitting European tick, Ixodes ricinus. Environmental HealthPerspectives, 108(2):119–123.
Longstreth J et al., (1998). Health risks. Journal of Photochemistry and Photobiology B: Biology,46:20–39.
Maheepala S, Perera C (2003). Climate change and reliability of urban water supply systems. WaterScience and Technology, 47:101–108.
Martens P et al., (1999). Climate change and future populations at risk from malaria. GlobalEnvironmental Change, 9:S89–S107.
McCarthy JJ et al., eds. (2001). Climate change 2001. Impacts, adaptation and vulnerability.Contribution of Working Group II to the Third Assessment Report of the Intergovernmental Panelon Climate Change. Cambridge, Cambridge University Press.
McMichael AJ, Githeko AK (2001). Human population health. In: McCarthy JJ et al., eds. Climate change2001. Impacts,adaptation and vulnerability.Contribution of Working Group II to the Third AssessmentReport of the Intergovernmental Panel on Climate Change. Cambridge, Cambridge UniversityPress:453–485.
McMichael AJ et al., (1996). Human population health. In:Watson RT et al., eds. Climate change 1995:impacts, adaptations and mitigation of climate change. Scientific-technical analyses. Cambridge,Cambridge University Press:563–584.
McMichael A et al., (2003a). International study of temperature and heat waves on urban mortalityin low and middle income countries. London, London School of Hygiene and Tropical Medicine.
McMichael AJ et al., eds. (2003b).Climate change and health: risks and responses.Geneva,World HealthOrganization.
McMichael AJ et al., (in press). Climate change. In: Ezzati M et al., ed. Comparative quantification ofhealth risks: global and regional burden of disease due to selected major risk factors. Geneva,World Health Organization.
Metz B et al., ed. (2001). Climate change 2001: mitigation. Contribution of Working Group III to theThird Assessment Report of the Intergovernmental Panel on Climate Change. Cambridge,Cambridge University Press.
Moodley I et al., (in press).Temperature-suitability maps for schistosomiasis in South Africa. Annals ofTropical Medicine and Parasitology.
Moss RH, Schneider SH (2000). Uncertainties in the IPCC TAR: recommendations to authors for moreconsistent assessment and reporting. In: Pachauri R,Taniguchi T,Tanaka K, eds. Guidance papers onthe cross cutting issues of the Third Assessment Report of the IPCC. Tokyo, Global Industrial andSocial Progress Research Institute:33–51 (http://www.ipcc.ch/pub/xcutting.pdf, accessed 30October 2003).
Nakicenovic N, Swart R, eds. (2000). Emissions scenarios.A special report of Working Group III of theIntergovernmental Panel on Climate Change. Cambridge, Cambridge University Press.
101
REFERENCES
National Assessment Synthesis Team (2001).Climate change impacts on the United States: the potentialconsequences of climate variability and change. Cambridge, Cambridge University Press:1–620.
National Research Council (1989). Improving risk communication.Washington, DC, National AcademyPress.
Ohl CA,Tapsell S (2000). Flooding and human health. British Medical Journal, 321:1167–1168.
Palmer TN, Raisenen J (2002). Quantifying the risk of extreme events in a changing climate. Nature,415:512–514.
Pan American Health Organization (1981). Emergency health management after natural disasters.Washington, DC, Pan American Health Organization.
Parker DE, Folland CK, Jackson M (1995). Marine surface temperature: observed variations and datarequirements. Climatic Change, 31:559–600.
Parmesan C (1996). Climate and species range. Nature, 382:765–766.
Parry ML,Carter TR (1998).Climate impact and adaptation assessment:a guide to the IPCC approach.London, Earthscan Publications.
Parry ML et al., (1998). Climate change and world food supply: a global perspective. London, JacksonEnvironment Institute, University College London.
Pattenden S, Nikiforov B,Armstrong B (2003). Mortality and temperature in Sofia and London. Journal ofEpidemiology and Community Health, 57:628–33.
Patz JA et al., (2000).The potential health impacts of climate variability and change for the United States:executive summary of the report of the health sector of the U.S.National Assessment.EnvironmentalHealth Perspectives,108(4): 367–376.
Petschel-Held G et al., (1999). Syndromes of global change: a qualitative modelling approach to assistglobal environmental management. Environmental Modeling Assessment, 4:295–314.
Phiri JS, Msiska DB (1998). Zambia–USA, climate change country study.Vulnerability and adaptationstudies and health impact assessments. Lusaka, Environment Council of Zambia.
Randolph SE (2000). Ticks and tick-borne disease systems in space and from space. Advances inParasitology, 47:217–243.
Randolph SE et al., (2002).An empirical quantitative framework for the seasonal population dynamics ofthe tick Ixodes ricinus. International Journal of Parasitology, 32(8):979–989.
Rizzoli A et al., (2002). Geographical information systems and bootstrap aggregation (bagging) of tree-based classifiers for Lyme disease risk prediction in Trentino, Italian Alps. Journal of MedicalEntomology, 39(3):485–492.
Rogers DJ, Randolph SE (1991). Mortality rates and population density of tsetse flies correlated withsatellite imagery. Nature, 351:739–741.
Rogers DJ, Randolph SE (2000). The global spread of malaria in a future, warmer world. Science,289:1763–1765.
Samet J, Schnatter R, Gibb H (1998). Epidemiology and risk assessment. American Journal ofEpidemiology, 148:929–936.
102
Schwartz J et al., (1996). Methodological issues in studies of air pollution and daily counts of death orhospital admissions. Journal of Epidemiology and Community Health, 50:S3–S11.
Sear C et al., (2001). The impacts of global climate change on the UK overseas territories. Technicalreport and stakeholder survey. Tyndall, Natural Resources Institute/Tyndall Centre of ClimateChange Research.
Singh RBK et al., (2001). The influence of climate variation and change on diarrhoeal disease in thePacific islands. Environmental Health Perspectives, 109:155–159.
Slaper H et al., (1996). Estimates of ozone depletion and skin cancer incidence to examine the ViennaConvention achievements. Nature, 384:256–258.
Smit B, Pilifosova O (2001).Adaptation to climate change in the context of sustainable development andequity. In: McCarthy JJ et al., eds. Climate change 2001. Impacts, adaptation and vulnerability.Contribution of Working Group II to the Third Assessment Report of the Intergovernmental Panelon Climate Change. Cambridge, Cambridge University Press:877–912.
Sutherst RW (1998). Implications of global change and climate variability for vector-borne diseases:generic approaches to impact assessments. International Journal of Parasitology, 28:935–945.
Tanser FC, Sharp B, le Sueur D (in press). Malaria seasonality and the potential impact of climate changein Africa. Lancet.
Tol RS, Dowlatabadi H (2001). Vecter-borne disease, development and climate change. IntegratedAssessment, 2:173–181.
Treasury Board of Canada Secretariat (2001). Integrated risk management framework.Ottawa,TreasuryBoard of Canada Secretariat (http://www.tbs-sct.gc.ca/pubs_pol/dcgpubs/RiskManagement/rmf-cgr01-1_e.asp, accessed 30 October 2003).
UNEP (1998). Environmental effects of ozone depletion: 1998 assessment. Nairobi, United NationsEnvironment Programme.
UNEP (2002). UNEP/WMO scientific assessment of ozone depletion 2002. Nairobi, United NationsEnvironment Programme.
UNFCCC (1999). UNFCCC reporting guidelines on national communications. In: Review of theimplementation of commitments and of other provisions of the Convention nationalcommunications from Parties included in Annex I to the Convention.Addendum: guidelines forthe preparation of national communications by Parties included in Annex I to the Convention.Part II. Bonn, United Nations Framework Convention on Climate Change (FCCC/CP/1999/L.3/Add.1;http://unfccc.int/resource/docs/cop5/l03a01.pdf, accessed 30 October 2003).
United Kingdom Department of Health (2002). Health effects of climate change in the UK. London,Department of Health.
United States Environmental Protection Agency (1988).Regulatory impact analysis: protection ofstratospheric ozone.Washington, DC, Stratospheric Protection Program, Office of Air and Radiation,United States Environmental Protection Agency.
Wagner D (1999).Assessment of the probability of extreme weather events and their potential effects inlarge conurbations. Atmospheric Environment, 33:4151–4155.

103
REFERENCES
Watson RT, Zinyowera MC, Moss RH, eds. (1997). The regional impacts of climate change: anassessment of vulnerability. A special report of IPCC Working Group II. Cambridge, CambridgeUniversity Press.
Watson RT et al., eds. (2001). IPCC Third Assessment Report climate change 2001: synthesis report.Geneva, IPCC.
WHO (1994). Ultraviolet radiation: an authoritative scientific review of environmental and healtheffects of UV, with reference to global ozone layer depletion. Geneva, World Health Organization(Environmental Health Criteria 160,WHO/EHG/95.16).
WHO (2001a). Malaria early warning systems, concepts, indicators and partners: a framework forfield research in Africa. Geneva,World Health Organization(http://whqlibdoc.who.int/hq/2001/WHO_CDS_RBM_2001.32.pdf, accessed 30 October 2003).
WHO (2001b). WHO strategy on air quality and health. Geneva, World Health Organization(http://www.who.int/docstore/peh/air/Strategy.pdf, accessed 30 October 2003).
WHO (2002a). World health report 2002: reducing risks, promoting healthy life. Geneva,World HealthOrganization (http://www.who.int/whr/en, accessed 30 October 2003).
WHO (2002b). Global solar UV index – a practical guide. Geneva, World Health Organization(http://www.who.int/peh-uv/Solar_UV_Index_Guide_Final.pdf, accessed 30 October 2003).
WHO European Centre for Environment and Health (2001). Monitoring health impacts of climatechange in Europe. Report of a WHO meeting, London, United Kingdom, 29–30 March 2001. Rome,WHO European Centre for Environment and Health (EUR/01/502 6360;http://www.who.dk/globalchange/Monitoring/20020627_5, accessed 30 October 2003).
WHO Regional Office for Europe (2000). Quantification of the health effects of exposure to airpollution. Report of a WHO working group. Copenhagen, WHO Regional Office for Europe(http://www.who.dk/air/Activities/20020628_5, accessed 30 October 2003).
WHO Regional Office for Europe (2002). Floods: climate change and adaptation strategies for humanhealth. Report of a WHO/LSHTM meeting, London, United Kingdom, 30 June–2 July 2002.Copenhagen,WHO Regional Office for Europe (EUR/01/503 6813;http://www.who.dk/document/E77096.pdf, accessed 30 October 2003).
WHO Regional Office for Europe (in press). Vector-borne diseases and climate change. Copenhagen,WHO Regional Office for Europe (Health and Global Environmental Change Series).
WHO Regional Office for South-East Asia (2003). Management of dengue epidemics. New Delhi,WHORegional Office for South-East Asia (SEA/DEN/1; http://w3.whosea.org/Den1/an4f.htm, accessed 30October 2003).
Willows RI, Connell RK, eds. Climate adaptation: risk uncertainty and decision-making. Oxford,United Kingdom Climate Impacts Programme, 2003(http://www.ukcip.org.uk/risk_uncert/main_risk_uncert.htm, accessed 30 October 2003).
Woodward A, Hales S,Weinstein P (1998). Climate change and human health in the Asia Pacific region:who will be the most vulnerable? Climate Research, 11:31–38.
Woodward A, Hales S, deWet N (2001). Climate change: potential effects on human health in NewZealand.Wellington, Ministry of the Environment.
104
Yassi A et al., (2001). Basic environmental health. Oxford, Oxford University Press.
Yohe G, Ebi KL (forthcoming).Approaching adaptation: parallels and contrasts between the climate andhealth communities. In: Ebi KL, Smith J, Burton I, eds. Integration of public health with adaptationto climate change: lessons learned and new directions.
Yohe G,Tol RS (2002). Indicators for social and economic coping capacity: moving toward a workingdefinition of adaptive capacity. Global Environmental Change, 12:25–40.
Zeman P, Januska J (1999). Epizootic background of dissimilar distribution of human cases of Lymeborreliosis and tick-borne encephalitis in a joint endemic area. Comparative Immunology,Microbiology & Infectious Disease, 22:247–260.

105
ANNEX 1
Adaptation is the strategies, policies and measures undertaken now and in the future to reducepotential adverse health impact of climate change.
Adaptive capacity describes the general ability of institutions, systems and individuals to adjust topotential damages, to take advantage of opportunities or to cope with the consequences of climatechange in the future.
Attr ibutable bur den is the reduction in current burden that would have been observed if past levelsof exposure to a risk factor had been reduced to zero.The attributable burden is the attributable riskmultiplied by the disease burden.
Attr ibutable r isk is the proportion of disease burden in an exposed population that can be attributedto a specific risk factor.
Climate change is defined as a statistically significant variation in either the mean state of the climateor in its variability, persisting for an extended period (typically decades or longer).
Climate is the average state of the atmosphere and the underlying land or water in a specific regionover a specific time scale.
Climate-sensitive disease is a disease that is sensitive to weather or climate factors, with the currentspatial distribution and seasonal transmission being affected.
Comparative r isk assessment is defined by WHO as the systematic evaluation of the changes inpopulation health that result from modifying the population’s exposure to a risk factor or a group ofrisk factors.
Coping capacity describes the ability to implement new strategies, policies and measures to minimizepotential damage from climate variability and change.
Envir onmental bur den of disease is the burden of disease caused by environmental factorsestimated using methods described by WHO.
Relative r isk describes the ratios of incidence in the exposed population compared with theunexposed population.
Stabilization scenar io is one in which greenhouse gas emissions have been reduced such that theconcentration of carbon dioxide in the atmosphere is stable at a given point in time and at a levelthat avoids some level of effects from climate change.
Vulnerability is defined as the degree to which individuals and systems are susceptible to or unable tocope with the adverse effects of climate change, including climate variability and extremes.
Weather describes the day-to-day changes in atmospheric conditions in a specific place at a specifictime. More simply, climate is what you expect and weather is what you get.
Annex 1. Key terms used in this report
106
Adaptation to climate change in developing countries
• UNDP Adaptation Policy Framework: www.undp.org
• United Nations Framework Convention on Climate Change and national adaptation programmes ofaction (NAPA): www.unfccc.int
• Pacific Islands Climate Change Program (PICCAP):http://unfccc.int/resource/ccsites/marshall/activity/piccap.htm
• AIACC Program (Assessments of Impacts and Adaptations to Climate Change in Multiple Regions andSectors). This web site facilitates access to extensive data, software and bibliographical resourcesrelated to climate impact, adaptation and vulnerability across multiple sectors.http://sedac.ciesin.columbia.edu/aiacc/index.html
Calculating the environmental burden of disease
• World Health Organization: method of assessing the environmental burden of disease:http://www.who.int/peh/burden/methods.htm
Risk management frameworks
• Focardi S, Jonas C.Risk management: framework,methods, and practice.New York, John Wiley & Sons,1998.
• Food administration in New Zealand.A risk management framework for food safety.Auckland,Ministryof Health and Ministry of Agriculture and Forestry of New Zealand, 2000 (http://www.nzfsa.govt.nz/policy-law/harmonisation/rmgmtpr.pdf, accessed 30 October 2003).
• Pittinger CA, ed.A multi-stakeholder framework for ecological risk management: summary of a SETACTechnical Workshop. Brussels, Society of Environmental Toxicology and Chemistry (SETAC), 1999.
• Framework for environmental health risk management. Final report. Volume 1. Washington, DC,Presidential/Congressional Commission on Risk Assessment and Risk Management, 1997(http://www.riskworld.com/Nreports/1997/risk-rpt/html/epajana.htm, accessed 30 October 2003).
• Sparrow A. A theoretical framework for operational risk management and opportunity realization.2000 (New Zealand Treasury Working Paper; http://www.treasury.govt.nz/workingpapers/2000/00-10.asp, accessed 30 October 2003).
• Risk management – policies and publications: policies and guidelines. Ottawa, Treasury Board ofCanada Secretariat, 1999 (http://www.tbs-sct.gc.ca/pubs_pol/dcgpubs/RiskManagement/siglist_e.asp, accessed 30 October2003).
• Integrated risk management framework. Ottawa, Treasury Board of Canada Secretariat, 2001(http://www.tbs-sct.gc.ca/pubs_pol/dcgpubs/RiskManagement/rmf-cgr_e.asp, accessed 30 October2003).
Annex 2. Sources of data and information
107
ANNEX 2
• Framework for cumulative risk assessment. Washington, DC, Office of Research and Development,National Center for Environmental Assessment, United States Environmental Protection Agency, 2003(Document EPA/600/P-02/001F; http://cfpub.epa.gov/ncea/raf/recordisplay.cfm?deid=54944,accessed 30 October 2003).
• Willows RI, Connell RK, eds. Climate adaptation: risk uncertainty and decision-making. Oxford, UnitedKingdom Climate Impacts Programme, 2003 (http://www.ukcip.org.uk/risk_uncert/main_risk_uncert.htm, accessed 30 October 2003).
Literature sources
• PubMed: http://www.pubmedcentral.nih.gov
• WHO initiative on access to journals: http://www.healthinternetwork.net
Climate change and scenario data
IPCC’s Data Distribution Centre – socioeconomic data: http://sres.ciesin.columbia.edu/tgciaIPCC Data Distribution Centre – climate data: http://ipcc-ddc.cru.uea.ac.ukFor sources of observed (instrumental) climate data, please contact your national meteorological andhydrological agency.
• Climatic Research Unit: http://www.cru.uea.ac.uk/cru/data
• Center for International Earth Science Information Network (CIESIN):http://www.ciesin.columbia.edu
Health – climate assessment tools
MARA LITe: http://www.mara.org.za/lite/information.htm
The objective of this tool was to develop a user-friendly front-end that facilitates the querying of theMARA database of malaria prevalence and populations at risk in sub-Saharan Africa. Comprehensiveonline help files exist for all aspects of the tool.At present the tool has the following broad functionality.For any specified target geographical area, down to district level (within Africa), the following queriescan be made.
• The time series of data points can be queried and displayed graphically or as a table.
• The prevalence database can be queried and relevant information displayed in graphical and tabularformat. Conditions such as the size of a survey, age group, survey period and season can be specified.Summary statistics can then be displayed with both weighted and unweighted means.
• Populations at risk can be queried. Conditions such as geographical area, age category and risk leveland pregnancy can be specified.
• Provide summary statistics and population sampling procedures for measuring the impact ofinterventions.This process uses the summary statistics of the existing MARA prevalence database fora given geographical area (such as a province or district) as a baseline. The target or estimatedreduction in transmission can then be specified as well as the required confidence limit.The modulewill then provide a range of sampling alternatives with different sample sizes, depending on thenumber of clusters. In the absence of MARA data, estimated values may be entered.

108
• Provide a bibliographic summary of the data source of all data points for a given geographical area.
• Display MARA products such as seasonality and transmission intensity maps.
All output can be printed or exported. The MARA database itself is a complex relational databasecomprising 29 separate tables.Thus, the tool converts MARA databases into a flat structure.This tool iscurrently available as a CD-ROM.DENSiM and CIMSiM: http://daac.gsfc.nasa.gov/IDP/models/index.html
111
For more information please contact
WHOWorld Health Organization
20 avenue AppiaCH-1211 Geneva 27
SwitzerlandTel: +41 22 791 21 11Fax: +41 22 791 31 11
www.who.int For climate change: www.who.int/peh
Climate Change and Health Office Health Canada
Sir Charles Tupper Building 2720 Riverside Drive
Ottawa, Ontario Canada
K 1A 0K9 Tel: +1 613-954-9676 Fax: +1 613-957-1886 http://hc-sc.gc.ca/cc
WMOWorld Meteorological Organization
7 bis Abenue de la PaixCH-1211 Geneva 2
SwitzerlandTel: +41 22 730 81 11Fax: +41 22 730 81 81
www.wmo.ch
UNEPUnited Nations Environment Programme
P.O Box 30552Nairobi
KenyaTel: +254-2 623246Fax: +254-2 62386
www.unep.org
Addresses of WHO Regional Offices
Regional Office for Afr ica (AFRO) Cite du DjoueP.O. Box 06Brazzaville, CongoTel: +242 839 100 / +47 241 39100Fax: +242 839 501 / +47 241 39501andParirenyatwa HospitalP.O. Box BE 773Harare, ZimbabweTel: +263 4 706 951 / +47 241 38244Fax: +263 4 253 731 / +47 241 38020www.afro.who.int
Regional Office for the Amer icas / PanAmer ican Health Or ganization(AMRO/PAHO)525, 23rd Street, N.W.Washington, DC 20037USATel: +1 202 974 3000Fax: +1 202 974 3663www.paho.org
Regional Office for South-East Asia(SEARO)World Health House, Indraprastha EstateMahatma Gandhi RoadNew Delhi 110002 IndiaTel: +91 112 337 0804Fax: +91 112 337 0197www.whosea.org
Regional Office for Eur ope (EURO) 8, ScherfigsvejDK-2100 Copenhagen 0DenmarkTel: +45 39 171 717Fax: +45 39 171 818www.euro.who.intFor climate change:www.euro.who.int/globalchange
Regional Office for the Easter nMediter ranean (EMRO) WHO Post OfficeAbdul Razzak Al Sanhouri Street,(opposite Children's Library)Nasr City, Cairo 11371 EgyptTel: +202 670 2535Fax: +202 670 2492www.emro.who.int
Regional Office for the Wester nPacific (WPRO) P.O. Box 29321000 ManilaPhilippinesTel: +632 528 8001Fax: +632 521 1036www.wpro.who.int

Regional Office for Eur ope (EURO)WHO8, ScherfigsvejDK-2100 Copenhagen øDenmarkTel: +45 39 17 17 17Fax: +45 39 17 18 18
For this publication:www.euro.who.int/globalchange
ISBN 92 890 1090 8