methods of analysis by the u.s. geological survey … of analysis by the u.s. geological survey...
TRANSCRIPT

Methods of Analysis by the U.S. Geological Survey National Water Quality Laboratory—Evaluation of Alkaline Persulfate Digestion as an Alternative to Kjeldahl Digestion for Determination of Total and Dissolved Nitrogen and Phosphorus in Water______________________________________________________________________
Water-Resources Investigations Report 03–4174
U.S. Department of the Interior U.S. Geological Survey

Methods of Analysis by the U.S. Geological Survey National Water Quality Laboratory—Evaluation of Alkaline Persulfate Digestion as an Alternative to Kjeldahl Digestion for Determination of Total and Dissolved Nitrogen and Phosphorus in Water
By Charles J. Patton and Jennifer R. Kryskalla______________________________________________________________________
U.S. Geological SurveyWater-Resources Investigations Report 03–4174
Denver, Colorado2003

U.S. DEPARTMENT OF THE INTERIORGale A. Norton, Secretary
U.S. GEOLOGICAL SURVEYCharles G. Groat, Director
The use of trade, product, or firm names in this report is for descriptive purposes only and does not imply endorsement by the U.S. Government._____________________________________________________________________________For additional information write to: Copies of this report can be purchased from:
U.S. Geological Survey U.S. Geological SurveyChief, National Water Quality Laboratory Branch of Information ServicesBox 25046, Mail Stop 407 Box 25286Federal Center Federal CenterDenver, CO 80225-0046 Denver, CO 80225-0286
Contents iii
CONTENTS
Abstract ............................................................................................................................................................... 1Introduction .......................................................................................................................................................... 2
Purpose and scope .......................................................................................................................................... 3Acknowledgments.......................................................................................................................................... 3
Analytical method ............................................................................................................................................... 41. Application .............................................................................................................................................. 42. Method summary and considerations...................................................................................................... 43. Interferences ............................................................................................................................................ 54. Instrumentation and auxiliary analyses ................................................................................................... 85. Apparatus................................................................................................................................................. 96. Reagents .................................................................................................................................................. 107. Calibrants and quality-control solutions.................................................................................................. 128. Sample preparation.................................................................................................................................. 149. Instrument performance........................................................................................................................... 15
10. Calibration ............................................................................................................................................... 1511. Procedure and data evaluation................................................................................................................. 1512. Calculations ............................................................................................................................................. 1713. Reporting results...................................................................................................................................... 1814. Detection levels, bias, and precision ....................................................................................................... 18
Analytical performance and comparative results ................................................................................................. 20Summary and conclusions.................................................................................................................................... 26References cited ................................................................................................................................................... 32
FIGURES1. Analytical cartridge diagram for the air-segmented continuous flow analyzer (Alpkem RFA-300)
used to automate photometric determination of nitrate + nitrite in alkaline persulfate digests with a cadmium-reduction, Griess reaction method ........................................................................................... 6
2. Analytical cartridge diagram for the air-segmented continuous flow analyzer (Alpkem RFA-300) used to automate photometric determination of orthophosphate in alkaline persulfate digests with a reduced phosphoantimonylmolybdenum blue reaction method .............................................................. 7
3. Typical calibration graph for total nitrogen determined as nitrate in alkaline persulfate digests ............ 164. Typical calibration graph for total phosphorus determined as orthophosphate in
alkaline persulfate digests ........................................................................................................................ 165. Percent recovery of nitrogen from a series of 2.5 mg NH4
+-N solutions that contained increasing concentrations of organic carbon (OC) as glucose .................................................................................. 22
6. Histogram of postdigestion weight loss expressed as a percent of initial digest weight for one batch of 80 alkaline persulfate digests......................................................................................... 23
7. Logarithmic scatter plot of nitrate-corrected NAlkP concentrations (x-axis) and KN concentrations (y-axis) around the line of equal relation for 2,066 data pairs combined from large-scale validation experiments .................................................................................................. 24
8. Concentration differences between nitrate-corrected alkaline persulfate digestion nitrogen (NAlkP) and Kjeldahl digestion nitrogen (KN) plotted about the line of zero difference as a function of nitrate concentration .............................................................................................................. 25

iv Contents
9. Boxplots of concentration differences between nitrate-corrected alkaline persulfate nitrogen (NAlkP) and Kjeldahl nitrogen (KN) for surface- and ground-water samples collected during nominally high- and low-flow condition ...................................................................................... 26
10. Logarithmic scatter plot of PAlkP concentrations (x-axis) and KP concentrations (y-axis) around the line of equal relation for 2,093 data pairs combined from large-scale validation experiments ......... 29
TABLES1. Laboratory, parameter, and method codes for U.S. Geological Survey alkaline persulfate
digestion total nitrogen and total phosphorus methods I-2650-03 and I-4650-03 ................................... 42. Data from a study of arsenate and arsenite interference in alkaline persulfate total
phosphorus determinations....................................................................................................................... 83. Settings and operational details of Alpkem RFA-300 continuous flow analyzers used
for this study............................................................................................................................................. 94. Volumes of mixed calibrant and amendment solution required to prepare working
calibrants and blanks for determination of total nitrogen and phosphorus by the alkalinepersulfate digestion method...................................................................................................................... 12
5. Volumes of Environmental Resource Associates (ERA) DemandTM nutrient concentrate used to prepare 1-liter volumes of check standards used in this study..................................................... 13
6. Suggested rack protocol for alkaline persulfate digest preparation ........................................................ 147. Suggested analyzer sample tray protocol for automated determination of nitrate and
orthophosphate in alkaline persulfate digests........................................................................................... 178. Data and calculations used to estimate method detection limits (MDL) for nitrogen and
phosphorus in unacidified (FCC) and acidified (WCA) samples following alkaline persulfate digestion................................................................................................................................... 19
9. Most probable values and standard deviations for reference samples 9987L, 9987H, and 9987VH along with averages and standard deviations of these reference materials that were included in every rack of alkaline persulfate digests................................................................ 19
10. Spike recoveries of glycine and glycerophosphate in randomly selected high-flow and low-flow samples that were included in every rack of alkaline persulfate digests .................................. 20
11. Concentration differences between selected samples prepared and analyzed in duplicate in each block of alkaline persulfate digests .......................................................................................................... 20
12. Recovery of inorganic and organic nitrogen from representative compounds......................................... 2113. Recovery of organic phosphorus from representative compounds by alkaline persulfate and
low-level acid persulfate digestion methods ............................................................................................ 2114. Results of paired t-tests for nitrate-corrected alkaline persulfate dissolved nitrogen and
Kjeldahl dissolved nitrogen concentrations determined in filtered-water samples.................................. 2715. Results of paired t-tests for nitrate-corrected alkaline persulfate total nitrogen and Kjeldahl
total nitrogen concentrations determined in acidified whole-water samples ........................................... 2816. Results of paired t-tests for dissolved and total phosphorus concentrations determined in
filtered and acidified whole-water samples by alkaline persulfate digestion (PAlkP) and Kjeldahl digestion methods..................................................................................................................................... 30

Contents v
CONVERSION FACTORS AND ABBREVIATED WATER-QUALITY UNITS
Degrees Celsius (°C) may be converted to degrees Fahrenheit (°F) by using the following equation:
°F = (1.8 × °C) + 32.
ABBREVIATIONS AND ACRONYMS
A/D analog-to-digital converter ASTM American Society for Testing and Materials CCV continuing calibration verification DI deionized water DNAlkP alkaline persulfate dissolved nitrogen DPAlkP alkaline persulfate dissolved phosphorus FCA filtered, chilled, acidified (bottle type for USGS dissolved nutrient samples) FCC filtered, chilled (bottle type for USGS dissolved nutrient samples) FW formula weight h hour Hz hertz i.d. inside diameter KDN Kjeldahl dissolved nitrogen KDP Kjeldahl dissolved phosphorus KN used collectively for KDN and KTN KTN Kjeldahl total nitrogen KTP Kjeldahl total phosphorus lb/in2 pounds per square inch LRL laboratory reporting level
Multiply By To obtain
Length
centimeter (cm) 3.94 x 10⁻¹ inchmicrometer (µm) 3.94 x 10⁻⁵ inch millimeter (mm) 3.94 x 10⁻² inchnanometer (nm) 3.94 x 10⁻⁸ inch
Volume
liter (L) 2.64 x 10⁻¹ gallon liter (L) 33.81 ounce, fluid
microliter (µL) 2.64 x 10⁻⁷ gallon milliliter (mL) 2.64 x 10⁻⁴ gallon
Mass
gram (g) 3.53 x 10⁻² ounce, avoirdupoismilligram (mg) 3.53 x 10⁻⁵ ounce, avoirdupois
Pressure
kilopascal (kPa) 1.45 x 10⁻¹ pounds per square inch

vi Contents
mg-As/L milligrams arsenic per liter mg-C/L milligrams carbon per liter mg-N/L milligrams nitrogen per liter mg/L milligrams per liter mg-P/L milligrams phosphorus per liter M molarity (moles per liter) max maximum MDL method detection limit MPV most probable value N normality (equivalents per liter) NAlkP used collectively for DNAlkP and TNAlkP NED N-(1-Naphthyl)ethylenediamine dihydrochloride reagent NOM natural organic matter NWQL National Water Quality Laboratory OC organic carbon OWQ Office of Water Quality o.d. outside diameter PC personal computer PBCdR packed-bed cadmium reactor P/N part number PTFE polytetrafluoroethylene TNAlkP alkaline persulfate total nitrogen TPAlkP alkaline persulfate total phosphorus QC quality control s second sp. gr. specific gravity SAN sulfanilamide reagent SLS sodium lauryl sulfate SOP standard operating procedure SRWS U.S. Geological Survey Standard Reference Water Sample STD CAL standard calibration control; adjusts absorbance range of photometric
detectors used in this study USEPA U.S. Environmental Protection Agency USGS U.S. Geological Survey v/v volume per volume w/v weight per volume WCA whole water, chilled, acidified (bottle type for USGS whole-water nutrient samples) = equivalent to > greater than < less than ≤ less than or equal to ≈ nearly equal to ± plus or minus

Abstract 1
Methods of Analysis by the U.S. Geological Survey National Water Quality Laboratory—Evaluation of Alkaline Persulfate Digestion as an Alternative to Kjeldahl Digestion for Determination of Total and Dissolved Nitrogen and Phosphorus in Water
By Charles J. Patton and Jennifer R. Kryskalla
Abstract
Alkaline persulfate digestion was evaluated and validated as a more sensitive, accurate, and less toxic alternative to Kjeldahl digestion for routine determination of nitrogen and phosphorus in surface- and ground-water samples in a large-scale and geographically diverse study conducted by U.S. Geological Survey (USGS) between October 1, 2001, and September 30, 2002. Data for this study were obtained from about 2,100 surface- and ground-water samples that were analyzed for Kjeldahl nitrogen and Kjeldahl phosphorus in the course of routine operations at the USGS National Water Quality Laboratory (NWQL). These samples were analyzed independently for total nitrogen and total phosphorus using an alkaline persulfate digestion method developed by the NWQL Methods Research and Development Program. About half of these samples were collected during nominally high-flow (April-June) conditions and the other half were collected during nominally low-flow (August-September) conditions. The number of filtered and whole-water samples analyzed from each flow regime was about equal.
By operational definition, Kjeldahl nitrogen (ammonium + organic nitrogen) and alkaline persulfate digestion total nitrogen (ammonium + nitrite + nitrate + organic nitrogen) are not equivalent. It was necessary, therefore, to reconcile this operational difference by subtracting nitrate + nitrite concentra-tions from alkaline persulfate dissolved and total nitrogen concentrations prior to graphical and statistical comparisons with dissolved and total
Kjeldahl nitrogen concentrations. On the basis of two-population paired t-test statistics, the means of all nitrate-corrected alkaline persulfate nitrogen and Kjeldahl nitrogen concentrations (2,066 paired results) were significantly different from zero at the p = 0.05 level. Statistically, the means of Kjeldahl nitrogen concentrations were greater than those of nitrate-corrected alkaline persulfate nitrogen concentrations. Experimental evidence strongly suggests, however, that this apparent low bias resulted from nitrate interference in the Kjeldahl digestion method rather than low nitrogen recovery by the alkaline persulfate digestion method. Typically, differences between means of Kjeldahl nitrogen and nitrate-corrected alkaline persulfate nitrogen in low-nitrate concentration (< 0.1 milligram nitrate nitrogen per liter) subsets of filtered surface- and ground-water samples were statistically equivalent to zero at the p = 0.05 level.
Paired analytical results for dissolved and total phosphorus in Kjeldahl and alkaline persulfate digests were directly comparable because both digestion methods convert all forms of phosphorus in water samples to orthophosphate. On the basis of two-population paired t-test statistics, the means of all Kjeldahl phosphorus and alkaline persulfate phosphorus concentrations (2,093 paired results) were not significantly different from zero at the p = 0.05 level. For some subsets of these data, which were grouped according to water type and flow conditions at the time of sample collection, differences between means of Kjeldahl phosphorus and alkaline persulfate phosphorus concentrations were not equivalent to zero

2 EVALUATION OF ALKALINE PERSULFATE DIGESTION AS AN ALTERNATIVE TO KJELDAHL DIGESTIONFOR DETERMINATION OF TOTAL AND DISSOLVED NITROGEN AND PHOSPHORUS IN WATER
at the p = 0.05 level. Differences between means of these subsets, however, were less than the method detection limit for phosphorus (0.007 milligram phosphorus per liter) by the alkaline persulfate digestion method, and were therefore analytically insignificant.
This report provides details of the alkaline persulfate digestion procedure, interference studies, recovery of various nitrogen- and phosphorus-containing compounds, and other analytical figures of merit. The automated air-segmented continuous flow methods developed to determine nitrate and orthophosphate in the alkaline persulfate digests also are described. About 125 microliters of digested sample are required to determine nitrogen and phosphorus in parallel at a rate of about 100 samples per hour with less than 1-percent sample interaction. Method detection limits for nitrogen and phosphorus are 0.015 milligram nitrogen per liter and 0.007 milligram phosphorus per liter, respectively.
INTRODUCTION
Semiautomated, batch Kjeldahl digestion methods used at the U.S. Geological Survey (USGS) National Water Quality Laboratory (NWQL) for simultaneous nitrogen and phosphorus determinations in filtered- and whole-water samples (Patton and Truitt, 1992, 2000) are rapid and robust, but they suffer from several drawbacks, including:
• health and safety risks posed by concentrated acids, toxic reagents (mercury), and high temperatures (370°C);
• environmental effects and cost associated with processing and disposing of the mercury-containing waste stream;
• propensity of acidic digests to trap and become contaminated by ammonia vapors in ambient laboratory air; and
• laboratory reporting limits (0.1 mg-N/L; 0.04 mg-P/L) higher than those of other inorganic nitrogen- and phosphorus-containing species, which limit the precision of mass balance estimates.
Alkaline persulfate digestion (Valderrama, 1981; Hosomi and Sudo, 1986; D’Elia and others, 1987; Ameel and others, 1993; D’Elia and others, 1997) provides a safer and more environmentally benign alternative to Kjeldahl digestion for routine, single-digest nitrogen and phosphorus determinations in
water. Desirable characteristics of alkaline persulfate digestion compared to Kjeldahl digestion include:
• reagents that contain no mercury;• fume hoods and acid scrubbers are not needed
because digestion occurs in sealed tubes inside an autoclave;
• post-digestion contamination by ambient ammonia vapors is not a problem because all nitrogen-containing compounds are oxidized to and determined as nitrate;
• laboratory reporting limits (0.03 mg-N/L; 0.01 mg-P/L) are similar to those of inorganic nitrogen- and phosphorus-containing nutrients; and
• waste-stream processing and disposal are straightforward.
During the past 15 years, alkaline persulfate digestion methods have been widely applied for estuarine and marine water analysis in preference to Kjeldahl digestion methods. Kjeldahl digestion methods continue to be widely applied for freshwater analysis, possibly because alkaline persulfate digestion methods are not approved for National Pollution Discharge Elimination System (NPDES) and Safe Drinking Water Act (SDWA) compliance monitoring. Nonetheless, an alkaline persulfate digestion method for total nitrogen determination (method 4500-N C, which does not include determination of phosphorus) is included in the 20th Edition of Standard Methods (American Public Health Association, 1998b, p. 4-102 and 4-103). Note, however, that the method described in this report differs in two important respects from method 4500-N C. First, method 4500-N C states “samples preserved with acid cannot be analyzed […].” The method described in this report is applicable to acidified nutrient samples—USGS FCA (filtered, chilled, acidified) and WCA (whole water, chilled, acidified) bottle types—provided that they have been processed according to USGS field manual protocols (Wilde and others, 1998). Second, nitrogen and phosphorus are recovered quantitatively from digests prepared by the method described in this report as explained in section 2.2. Furthermore, manual post-digestion pH adjustment prior to colorimetric determinations required by other previously published alkaline persulfate digestion methods (Valderrama, 1981; Hosomi and Sudo, 1986; D’Elia and others, 1987; Ameel and others, 1993; D’Elia and others, 1997) is not necessary in the method described in this report. This modification reduces digest preparation

Introduction 3
time substantially. Hopefully, methodological improvements and comparative data in this report in concert with publication of Standard Methods method 4500-N C will encourage analysts and regulators to consider potential benefits of more widespread application of alkaline persulfate digestion as an alternative to Kjeldahl digestion for nitrogen and phosphorus determinations in freshwater regimes.
This report provides complete details of the large-scale and geographically diverse study conducted by the USGS between October 1, 2001, and September 30, 2002, to evaluate and validate alkaline persulfate digestion as a more sensitive, accurate, and less toxic alternative to Kjeldahl digestion for routine determination of nitrogen and phosphorus in surface- and ground-water samples.
Purpose and Scope
This report describes USGS methods I-2650-03 and I-4650-03 for determining total nitrogen and total phosphorus in filtered and whole-water alkaline persulfate digests, respectively. All aspects of the methods are described, including sample preparation and digestion, colorimetric determinations of nitrate and orthophosphate in alkaline persulfate digests, calculation of results, bias, precision, and repeatability of results, and conventions for reporting results. These methods supplement other methods of the USGS for determination of inorganic substances in water that are described by Fishman and Friedman (1989) and Fishman (1993). Primary objectives of this study were as follows:
1. To eliminate hazards and toxic wastes associated with Kjeldahl nitrogen and Kjeldahl phosphorus determinations.
2. To ascertain if and under what conditions alkaline persulfate digestion methods can be applied to samples preserved by acidification.
3. To develop an alkaline persulfate digestion procedure that is amenable to automation and less labor intensive than existing Kjeldahl digestion procedures.
4. To achieve lower detection limits for total and dissolved nitrogen than can be achieved by typical Kjeldahl digestion methods.
5. To evaluate statistical equivalence of dissolved and total nitrogen concentrations determined
by Kjeldahl and alkaline persulfate digestion methods
6. To evaluate statistical equivalence of dissolved and total phosphorus concentrations determined by Kjeldahl and alkaline persulfate digestion methods.
7. To establish guidelines for interpreting dissolved and total nitrogen and phosphorus concentrations that result from alkaline persulfate digestion in relation to those that result from Kjeldahl digestion.
8. To verify that alkaline persulfate digestion is a more sensitive, accurate, and environ-mentally responsible alternative to Kjeldahl digestion for routine, simultaneous determination of nitrogen and phosphorus in surface and ground water—the conclusion of several previously published, smaller scale studies—on the basis of a large, geographically and seasonally diverse data set and to demonstrate the method's applicability for compliance monitoring and water-quality assessment studies.
Acknowledgments
The authors gratefully acknowledge Carolyn Keefe and Carl Zimmermann at the Chesapeake Biological Laboratory Nutrient Analytical Services Laboratory (NASL) in Solomons, Md., who informally reviewed a preliminary version of this report. They also kindly shared technical and operational details of NASL's long-established alkaline persulfate digestion nitrogen and phosphorus methods that have been widely applied in nutrient studies of the Chesapeake Bay. We also thank Richard Axler and John Ameel at the University of Minnesota–Duluth Center for Water and the Environment—major participants in validation of the alkaline persulfate digestion method for determination of dissolved and total nitrogen published in the 20th edition of Standard Methods—who reviewed this report. Their comments were consistently insightful and helped us focus the Introduction and Conclusions sections. Tom Maddox at the University of Georgia Stable Isotope Laboratory in Athens also provided helpful discussions and several literature citations about applying alkaline persulfate digestion methods to soil and sediment analysis.

4 EVALUATION OF ALKALINE PERSULFATE DIGESTION AS AN ALTERNATIVE TO KJELDAHL DIGESTIONFOR DETERMINATION OF TOTAL AND DISSOLVED NITROGEN AND PHOSPHORUS IN WATER
Ron Antweiler, USGS National Research Program, provided helpful discussions about applying t-tests to statistical method comparison data in this report. Tom Bushly and Richard Husband, Information Technology Section at the USGS National Water Quality Laboratory (NWQL) performed several large data-base queries and designed custom reports that streamlined sample selection and data analysis. This report also benefited from technical reviews by Colleen Gupta and Mary Cast (USGS, NWQL) and Peter Rogerson (USGS, Office of Water Quality). We also thank Jon W. Raese (USGS, NWQL) for editorial review and Barbara L. Kemp (USGS, NWQL) for manuscript preparation.
ANALYTICAL METHOD
Inorganic Constituents and Parameter Codes (see table 1): Nitrogen and phosphorus, total dissolved, I-2650-03 (mg/L as N or P); nitrogen and phosphorus, total whole water, I-4650-03 (mg/L as N or P)
1. Application
These methods are intended for determination of total nitrogen (organic nitrogen + ammonium + nitrate + nitrite) and phosphorus (all forms) in filtered and whole-water samples by alkaline persulfate digestion. They were validated for determination of total nitrogen and total phosphorus in drinking water, wastewater,
and water-suspended sediment. Their applicability to bottom materials was not investigated. Analytical ranges are 0.03 to 5.00 mg-N/L for dissolved and total nitrogen and 0.01 to 2.00 mg-P/L for dissolved and total phosphorus.
2. Method Summary and Analytical Considerations
2.1 Filtered and whole-water samples are dispensed into glass culture tubes, dosed with alkaline persulfate reagent, capped tightly, and digested in an autoclave at 250ºF (121ºC) and 17 lb/in2 (117.2 kPa) for 1 hour. The alkaline persulfate digestion procedure oxidizes all forms of inorganic and organic nitrogen to nitrate and hydrolyzes all forms of inorganic and organic phosphorus to orthophosphate. Nitrate and orthophosphate in alkaline persulfate digests are determined in parallel with a 2-channel photometric, air-segmented continuous flow analyzer.
2.2 Digest preparation protocols and reagent formulations were adapted from previously published procedures (Valderrama, 1981; Hosomi and Sudo, 1986; Ameel and others, 1993; D’Elia and others, 1997; American Public Health Association, 1998b). Two other reports (Nydahl, 1978; Cabrera and Beare, 1993) provided insight into the potential for low nitrogen recovery in samples containing high concentrations of dissolved and particulate organic carbon.
Quantitative recovery of nitrogen and phosphorus by alkaline persulfate digestion depends critically on a
Table 1. Laboratory, parameter, and method codes for U.S. Geological Survey alkaline persulfate digestion total nitrogen and total phosphorus methods I-2650-03 and I-4650-03
[Lab, laboratory; FCC, filtered chilled container; FCA, filtered, chilled, acidified; WCA, whole water, chilled, acidified; µm, micrometer; mL, milliliter; USGS, U.S. Geological Survey]
Codes Description
Lab Parameter Method Bottle type
Nitrogen, total dissolved, alkaline persulfate digestion......................... 2754 62854 A FCC1
Nitrogen, total dissolved, alkaline persulfate digestion, acidified........ 2755 62854 B FCA2
Nitrogen, total whole-water, alkaline persulfate digestion, acidified.... 2756 62855 A WCA2
Phosphorus, total dissolved, alkaline persulfate digestion.................... 2757 00666 I FCC1
Phosphorus, total dissolved, alkaline persulfate digestion, acidified.... 2758 00666 J FCA2
Phosphorus, total whole-water, alkaline persulfate digestion, acidified 2759 00665 H WCA2
1FCC samples must be processed through 0.45-µm filters at collection sites.
2FCA and WCA samples must be amended with 1 mL of 4.5 N H2SO4 solution (USGS water-quality field supply number
Q438FLD) per 120 mL of sample at collection sites.

Analytical Method 5
progressive decrease in pH (initial pH >12, final pH ≤ 2.2) during the 1-hour course of the digestion (Hosomi and Sudo, 1986). These dynamic reaction conditions are achieved by formulating the digestion reagent with approximately equimolar concentrations of persulfate and hydroxide ions—0.05 M, initial pH >12 after 1 + 2 dilution by samples in this method. Under these initially alkaline conditions, dissolved and suspended nitrogen in samples oxidize to nitrate. As the digestion proceeds, bisulfate ions resulting from thermal decomposition of persulfate first neutralize and then acidify the reaction mixture by the following chemical reaction:
After all of the persulfate has decomposed, the digest mixture pH approaches 2, and under these acidic conditions, dissolved and suspended phosphorus hydrolyze to orthophosphate. The foregoing discussion indicates that analysis of samples with variable and unknown acidity or alkalinity by alkaline persulfate digestion methods will be problematic. Users of this method are cautioned that amending FCA and WCA samples with concentrations of sulfuric acid other than those specified in USGS field manual protocols (Wilde and others, 1998) likely will result in undetected method failure and possible reporting of erroneous results. See section 3.1.4 of this report for additional details.
As is the case for Kjeldahl digestion, alkaline persulfate digestion converts all forms of phosphorus to orthophosphate. Thus alkaline persulfate digestion dissolved and total phosphorus (DPAlkP and TPAlkP) concentrations can be compared directly with Kjeldahl digestion dissolved and total phosphorus (KDP and KTP) concentrations by graphical and statistical analysis. This is not the case, however, for Kjeldahl dissolved and total nitrogen (KDN and KTN) concentrations and alkaline persulfate digestion dissolved and total nitrogen (DNAlkP and TNAlkP) concentrations. In principle, organic nitrogen, but not nitrate or nitrite, is reduced to ammonium during Kjeldahl digestion. Determining ammonium in Kjeldahl digests, therefore, measures organic nitrogen + ammonium. Alkaline persulfate digestion oxidizes all forms of nitrogen to nitrate. Determining nitrate + nitrite in alkaline persulfate digests, therefore, measures total nitrogen (organic nitrogen + ammonium
+ nitrite + nitrate). To reconcile this difference between the two methods, nitrate + nitrite concentrations were subtracted from DNAlkP and TNAlkP concentrations prior to graphical and statistical comparisons with KDN and KTN concentrations throughout this report. For this purpose and as a quality-control (QC) check, all filtered and whole-water samples selected for alkaline persulfate digestion also were analyzed for dissolved nitrate + nitrite, ammonium, and orthophosphate on the same day that digests were prepared. Particulates were removed from acidified, whole-water samples (WCA bottle type) by 0.45-µm filtration prior to dissolved nutrient determinations, as described in section 4.6 of this report.
2.3 A 2-channel, air-segmented continuous flow analyzer was configured for simultaneous photometric determination of nitrate + nitrite and orthophosphate in alkaline persulfate digests. Nitrate + nitrite was determined by a cadmium-reduction, Griess-reaction method (Wood and others, 1967) equivalent to U.S. Environmental Protection Agency (USEPA) method 353.2 (U.S. Environmental Protection Agency, 1993) and U.S. Geological Survey (USGS) method I-2545-90 (Fishman, 1993, p. 157) except that sulfanilamide and N-(1-naphthy)ethylenediamine reagents were separate rather than combined. The analytical cartridge diagram is shown in figure 1. Orthophosphate was determined by a phosphoantimonylmolybdenum blue method (Murphy and Riley, 1962; Pai and others, 1990), which is equivalent to the 2-reagent variants (separate molybdate and ascorbic acid reagents) of USEPA method 365.1 (U.S. Environmental Protection Agency, 1993) and USGS method I-2601-90 (Fishman, 1993). The analytical cartridge diagram is shown in figure 2.
3. Interferences
3.1 Alkaline Persulfate Digestion3.1.1 Chloride concentrations up to 1,000
mg/L (the highest tested for this report) do not interfere. Furthermore, because good results are obtained for seawater in 2 + 1 mixture with digestion reagent (D’Elia and others, 1997), chloride concentrations of about 10,000 mg/L apparently are tolerated provided that calibrants are matrix matched. Higher chloride concentrations, however, are likely to interfere because of reaction with persulfate to form oxychlorides or chlorine that might deplete persulfate required to oxidize inorganic and organic nitrogen
2- - 12 8 2 4 22S O + H O 2 HSO + O⎯⎯→

6 EVALUATION OF ALKALINE PERSULFATE DIGESTION AS AN ALTERNATIVE TO KJELDAHL DIGESTIONFOR DETERMINATION OF TOTAL AND DISSOLVED NITROGEN AND PHOSPHORUS IN WATER
FLO
W R
ATE
colo
r cod
e (m
illilit
ers
per m
inut
e)
*A 5
mg-
N/L
nitr
ate
plu
s ni
trite
ca
libra
nt p
rod
uces
a p
eak
he
igh
t of
ab
out 9
0 pe
rce
nt o
f fu
ll sc
ale
whe
n th
e
phot
ome
ter
stan
dard
ca
libra
tion
con
tro
l is
set a
t ≈ 1
.1.
5-tu
rn
coil
10-tu
rn
coil
25-tu
rn
coil
Air
SAN
NED
Was
h So
lutio
n Air
Buffe
r
Sam
ple
10-m
illim
eter
* flo
w c
ell
540
nano
met
ers
Was
te
1 P
BCdR
Deb
ubbl
er
3 1
oran
ge/y
ello
w
(0.1
18)
oran
ge/o
rang
e (0
.287
) or
ange
/yel
low
(0.1
18)
oran
ge/g
reen
(0
.074
)
yello
w/b
lue
(0.7
22)
oran
ge/g
reen
(0
.074
) or
ange
/gre
en
(0.0
74)
PUM
P
gree
n/gr
een
(0.9
47)
2
1 2 3
EXP
LAN
ATIO
N
Air
bar,
90 b
ubbl
es p
er m
inut
e
Dua
l inj
ectio
n fit
ting,
P/N
303
-010
7
Deb
ubbl
er fi
tting
, P/N
303
-010
3
Rea
gent
add
ition
tee,
P/N
303
-010
2
Fig
ure
1.
Ana
lytic
al c
artr
idge
dia
gram
for
the
air-
segm
ente
d co
ntin
uous
flow
ana
lyze
r (A
lpke
m R
FA
-300
) us
ed to
aut
omat
e ph
otom
etric
det
erm
inat
ion
of
nitr
ate
+ n
itrite
in a
lkal
ine
pers
ulfa
te d
iges
ts w
ith a
cad
miu
m-r
educ
tion,
Grie
ss r
eact
ion
met
hod.

Analytical Method 7
FLO
W R
ATE
colo
r cod
e (m
illilite
rs p
er m
inut
e)
5-tu
rn
coil
5-tu
rn
coil
5-tu
rn
coil
37 ° C
2
milli
liters
Air
Asco
rbic
Aci
d
Was
h So
lutio
n
SLS
Dilu
ent
Sam
ple
Acid
Mol
ybda
te
Insu
late
d 15
-milli
met
er*
flow
cel
l 88
0 na
nom
eter
s
Was
te
1 2
2 3
oran
ge/y
ello
w
(0.1
18)
oran
ge/g
reen
(0
.074
) or
ange
/gre
en
(0.0
74)
gree
n/gr
een
(0.9
47)
blac
k/bl
ack
(0.2
26)
oran
ge/w
hite
(0
.166
)
*A 2
mg-
P/L
ort
hoph
osph
ate
calib
rant
pro
duce
s a
peak
hei
ght
of a
bout
90
perc
ent o
f ful
l sca
le w
hen
the
phot
omet
er s
tand
ard
calib
ratio
n co
ntro
l is
set a
t ≈ 1
.5.
1 2
EXPL
ANAT
ION
Air b
ar, 9
0 bu
bble
s pe
r min
ute
Dual
inje
ctio
n fit
ting,
P/N
303
-010
7
Reag
ent a
dditi
on te
e, P
/N 3
03-0
102
3 Th
e 0.
034-
inch
(0.0
86 c
m) i
nsid
e di
amet
er (i
.d.)
poly
-
eth
ylen
e tu
bing
that
con
nect
s th
e he
at b
ath
coil
o
utle
t to
the
flow
cell
is th
erm
ally
insu
late
d by
she
athi
ng it
with
a p
iece
of 0
.10-
inch
(0.2
5 cm
) i.d
.
pol
yvin
yl c
hlor
ide
trans
mis
sion
tubi
ng.
Also
the
flow
cell
barre
l is
ther
mal
ly in
sula
ted
by s
tretc
h-
w
rapp
ing
it w
ith s
ever
al la
yers
of t
hin
foam
pla
stic
.
Fig
ure
2.
Ana
lytic
al c
artr
idge
dia
gram
for
the
air-
segm
ente
d co
ntin
uous
flow
ana
lyze
r (A
lpke
m R
FA
-300
) us
ed to
aut
omat
e ph
otom
etric
de
term
inat
ion
of o
rtho
phos
phat
e in
alk
alin
e pe
rsul
fate
dig
ests
with
a r
educ
ed p
hosp
hoan
timon
ylm
olyb
denu
m b
lue
reac
tion
met
hod.

8 EVALUATION OF ALKALINE PERSULFATE DIGESTION AS AN ALTERNATIVE TO KJELDAHL DIGESTIONFOR DETERMINATION OF TOTAL AND DISSOLVED NITROGEN AND PHOSPHORUS IN WATER
species to nitrate. Resulting active chlorine species also can interfere in colorimetric reactions used to determine nitrate and orthophosphate in digests.
3.1.2 Sulfate concentrations up to 1,000 mg/L (the highest tested for this report) do not interfere.
3.1.3 Organic carbon concentrations greater than 150 mg/L interfere because of reaction with persulfate to form carbon dioxide, thus depleting persulfate required to oxidize inorganic and organic nitrogen species to nitrate.
3.1.4 Overacidification of FCA and WCA samples at collection sites can result in low recovery of inorganic and organic nitrogen at the NWQL. The possibility of overacidification can be avoided by exclusive use of the sulfuric acid field-amendment solution—one vial containing 1 mL of 4.5 N H2SO4 (One Stop Shopping number FLD-438) per 120 mL of sample—which is specified in the USGS National Field Manual (Wilde and others, 1998). See the first note in section 6.1 of this report for additional details.
3.1.5 Nitrate and nitrite do not contribute to KDN and KTN concentrations in principle, but in practice, positive and negative interferences by these ions are well known—see, for example, American Public Health Association, 1998c; Patton and Truitt, 2000. This interference can confound comparison of KN and NAlkP concentrations when dissolved nitrate concentrations are greater than about 0.1 mg NO3
--N/L.3.1.6 Suspended particles remaining in
digests must be removed by sedimentation and decantation or filtration prior to colorimetric analyses.
3.2 Colorimetric Nitrate + Nitrite Determination3.2.1 Typically, concentrations of
substances with potential to interfere in cadmium-reduction, Griess-reaction nitrate + nitrite methods are negligible in ambient surface- and ground-water samples. For specific details of inorganic and organic compounds that might interfere in the color reaction, see Norwitz and Keliher (1985, 1986), as well as more general information by the American Public Health Association (1998a).
3.2.2 Sulfides, which are often present in anoxic water and well known to deactivate cadmium reduction reactors, are oxidized during the alkaline persulfate digestion and are unlikely to interfere.
3.3 Colorimetric Orthophosphate Determination3.3.1 Barium, lead, and silver can interfere
by forming insoluble phosphates, but their
concentrations in natural-water samples usually are less than the interference threshold (Fishman, 1993)
3.3.2 Interference from silicate, which also can form reduced heteropoly acids with molybdenum (Zhang and others, 1999), is negligible under reaction conditions used for this report.
3.3.3 Arsenate, AsO43-—but not arsenite,
AsO33-—can interfere by forming reduced heteropoly
acids analogous to those formed by orthophosphate (Johnson, 1971). Because of the possibility that arsenite might be oxidized to arsenate by persulfate, both species at concentrations up to 20 mg-As/L in deionized water were digested and analyzed. With reference to table 2, it is apparent that a major fraction of arsenite is oxidized to arsenate during alkaline persulfate digestion and that interference by either species up to 1 mg-As/L is negligible.
4. Instrumentation and Auxiliary Analyses
4.1 RFA-300™, third-generation, air-segmented continuous flow analyzers (Alpkem) were used to automate photometric determination of nitrate + nitrite and orthophosphate in alkaline persulfate digests and dissolved ammonium, nitrate + nitrite, and orthophosphate in filtered- and whole-water samples prior to digestion. Modules in these systems include 301 samplers, 302 peristaltic pumps, 313 analytical cartridge bases, 314 power modules, 305A photometers, and a personal computer (PC)-based data acquisition and processing system. Alternative instrumentation—flow injection analyzers, sequential injection analyzers, other second- or third-generation continuous flow analyzers, or automated batch analyzers—also could be used to automate photometric finishes.
Table 2. Data from a study of arsenate and arsenite interference in alkaline persulfate total phosphorus determinations
[mg-As/L, milligrams of arsenic per liter; mg-P/L, milligrams of phosphorus per liter; nd, not detected; ≈, nearly equal to; ±, plus or minus]
AsO4
3- added
mg-As/L
PO4
3- found
mg-P/L
AsO3
3- added
mg-As/L
PO4
3-
found mg-P/L
0.5 nd 0.5 nd 1.0 nd 1.0 nd 2.0 ≈ 0.05 2.0 nd 5.0 0.32 ± 0.01 5.0 0.29 ± 0.04
10.0 1.14 ± 0.13 10.0 0.91 ± 0.06 20.0 off scale 20.0 off scale

Analytical Method 9
4.2 Photometric data were acquired and processed automatically using FASPac™ version 1.34 software (Astoria-Pacific, Clackamas, Ore.). This software operates under Microsoft Windows on a PC platform and includes a model 350 interface box that controls the sampler and digitizes analog photometer outputs with 16-bit resolution. Other data acquisition systems could be used provided that the A/D converter has 16-bit resolution and is capable of acquiring data at frequencies ranging from 0.5 to 2 Hz, that is, from 30 points/min to 120 points/min. As a general rule, data acquisition frequencies for air-segmented continuous flow analyzers should match the roller lift-off frequency of the peristaltic pump (Patton and Wade, 1997), that is, 0.5 Hz for Technicon AutoAnalyzer II ™ and 1.5 Hz for Alpkem RFA-300 equipment. Data acquisition frequencies in the range of 2 to 5 Hz are suitable for photometric flow-injection analyzers.
4.3 Operating characteristics for this equipment are listed in table 3.
4.4 Dissolved ammonium, nitrate + nitrite, and orthophosphate in undigested samples were determined photometrically by USGS automated continuous flow methods I-2522-90, I-2545-90 (2-reagent variant), and I-2601-90 (2-reagent variant), respectively. These methods are described in Fishman (1993).
4.5 The pH of WCA samples was estimated with narrow range (0–2.5) colorimetric pH-indicating test strips to detect improperly acidified samples that had pH values outside the expected range of 1.6 to 1.9.
4.6 WCA samples were processed through 5-mL capacity UniPrep™ syringeless filters equipped with 0.45-µm nylon membranes (Whatman, Clifton, N.J.) to remove suspended solids prior to determination of dissolved ammonium, nitrate + nitrite, and orthophosphate. These syringeless filters also were used to remove suspended solids from WCA-sample digests prior to photometric analysis when simple sedimentation and decantation into analyzer cups failed to do so.
5. Apparatus
5.1 Samples were digested in an autoclave (model number STME, Market Forge Industries, Inc., Everett, Mass.) operated at 250ºF (121ºC) and 17 lb/in2
(117.2 kPa) for 1 hour.5.2 Filtered and chilled sample (FCC bottle type)
digests were prepared robotically using a large-scale, syringe-pump-based x-y-z sample dispenser/diluter module (model number ML-4200, Hamilton Company, Reno, Nev.). This system is equipped with four probes and four 10-mL syringe pumps that operate in tandem under control of DOS-based Eclipse™ software (Hamilton Company, Reno, Nev.). Custom modifications to the ML-4200 system, including a pneumatically actuated probe expander, fixtures, and a variety of bottle and test-tube racks, were obtained from another vendor (Robotics Plus, Houston, Tex.).
5.3 Whole-water (WCA bottle type) sample digests were prepared manually using EDP Plus™
Table 3. Settings and operational details of Alpkem RFA-300 continuous flow analyzers used for this study
[nm, nanometer; mm, millimeter; mg-N/L, milligrams nitrogen per liter; mg-P/L, milligrams phosphorus per liter; ≈, nearly equal to; min, minute; mL, milliliter; –, not applicable; °C, degrees Celsius; s, second; h, hour]
Instrumental conditions Nitrate + nitrite Orthophosphate
Analytical wavelength 540 nm 880 nm
Flow cell path length 10 mm 15 mm
Calibration range 0.05 to 5.0 mg-N/L 0.01 to 2.0 mg-P/L
Standard calibration control setting ≈1.1 ≈1.5
Segmentation rate (bubbles min-1) 90 90
Heated reaction coil volume None used 2 mL
Heated reaction coil temperature – 37°C
Dwell time (seconds) 140 260
Sample time (volume) 25 s (95 µL) 25 s (31 µL)
Wash time (volume) 10 s (38 µL) 10 s (12 µL)
Analysis rate, sample-to-wash ratio ≈103/h, 5:2 ≈103/h, 5:2

10 EVALUATION OF ALKALINE PERSULFATE DIGESTION AS AN ALTERNATIVE TO KJELDAHL DIGESTIONFOR DETERMINATION OF TOTAL AND DISSOLVED NITROGEN AND PHOSPHORUS IN WATER
electronic, digital pipets (Rainin Instruments, Emeryville, Calif.) equipped with a 10-mL liquid end.
5.4 Digestion vessels were 20 x 150 mm Pyrex®, screw-cap culture tubes (VWR 53283-810; Fisher 14-957-76E or 14-959-37C; or equivalent), and 18-415 linerless polypropylene caps (Comair Glass, Inc., Vineland, N.J.—Part number 14-0441-004).
6. Reagents
This section provides detailed instructions for preparing digestion and colorimetric reagents. All references to deionized water (DI) refer to NWQL in-house DI water, which is equivalent to ASTM type I DI water (American Society for Testing and Materials, 2001, p. 107–109) for nutrient analysis. All volumetric glassware and reagent and calibrant storage containers should be triple rinsed with dilute (≈5 percent v/v) hydrochloric acid and DI water just prior to use. Additionally storage containers for reagents and calibrants should be triple rinsed with small portions of the solutions before they are filled.
6.1 Digestion Reagents
NOTE: The alkaline persulfate digestion reagent for FCA and WCA samples (section 6.1.4) contains an additional amount of sodium hydroxide that is calculated to neutralize the sulfuric acid added to these samples at collection sites.
6.1.1 Sodium hydroxide, 1.5 M (for FCC samples): Dissolve 60 g of sodium hydroxide (NaOH, FW=40.0) in about 800 mL of DI water in a 1-L volumetric flask. [Caution: When NaOH dissolves in water, heat is released.] After dissolution is complete, allow the resulting solution to cool and dilute it to the mark with DI water. Transfer this reagent to a plastic bottle in which it is stable at room temperature for 6 months.
6.1.2 Sodium hydroxide, 2.3 M (for FCA and WCA samples): Dissolve 92 g of sodium hydroxide (NaOH, FW=40.0) in about 800 mL of DI water in a 1-L volumetric flask. [See caution in 6.1.1.] After dissolution is complete, allow the resulting solution to cool and dilute it to the mark with DI water. Transfer this reagent to a plastic bottle in which it is stable at room temperature for 6 months.
6.1.3 Alkaline persulfate digestion reagent (for FCC samples): Add 18.0 g of potassium persulfate (K2S2O8, FW=270.33) and 45 mL of 1.5 M sodium
hydroxide solution to about 350 mL of DI water in a graduated 500-mL Pyrex™ media bottle (Corning number 1395-500 or equivalent). Cap the bottle, swirl its contents, and place it in an ultrasonic bath until potassium persulfate dissolution is complete (about 10 minutes). Remove the bottle from the ultrasonic bath, dry its outer surfaces, and then add enough DI water to bring the volume to 450 mL. (Make a line on the side of the bottle that indicates this volume to within ±5 mL.) Swirl the bottle to mix its contents and then divide the resulting solution among four, 125-mL clear plastic bottles used with the robotic digest preparation system. Prepare this reagent daily.
6.1.4 Alkaline persulfate digestion reagent (for FCA and WCA samples): Add 18.0 g of potassium persulfate (K2S2O8, FW=270.33) and 45 mL of 2.3 M sodium hydroxide solution to about 350 mL of DI water in a graduated 500-mL Pyrex™ media bottle (Corning number 1395-500 or equivalent). Then complete preparation of this reagent exactly as described in 6.1.3. Prepare this reagent daily.
NOTE: Reagent volumes in 6.1.3 and 6.1.4 (450 mL) are sufficient to prepare 80 digests plus a 15-percent excess for rinsing and providing a liquid level in the 125-mL bottles necessary to prevent air aspiration during robotic dispensing operations. For manual digest preparation, a 400-mL volume of digestion reagent should be sufficient.
6.2 Colorimetric Reagents6.2.1 Sampler wash reservoir solution (0.05
M sodium bisulfate): Dissolve 6.9 g of sodium bisulfate (NaHSO4•H2O, FW=138.08) in about 800 mL of DI water in a graduated 1-L Pyrex™ media bottle. Dilute this solution to the mark with DI water, mix it well, and store it tightly capped at room temperature.
NOTE: This solution matches the matrix of sample digests. Use it as the matrix for continuing calibration verification (CCV) solutions and any other undigested check samples.
6.3 Orthophosphate Determination6.3.1 Stock potassium antimony tartrate
reagent: Dissolve 3.0 g of antimony potassium tartrate [K(SbO)C4H4O7•½ H2O, FW=333.93] in about 800 mL of DI water in a 1-L volumetric flask. Dilute this solution to the mark with DI water and mix it well.

Analytical Method 11
Transfer this reagent to a plastic bottle in which it is stable for 6 months at room temperature.
6.3.2 Stock ascorbic acid reagent: Dissolve 4.5 g of ascorbic acid (C6H8O6, FW=176.1) in about 200 mL of DI water in a 250-mL volumetric flask. Dilute this solution to the mark with DI water, mix it well, and transfer to a 250-mL glass bottle that has been previously rinsed with 5 percent (v/v) hydrochloric acid solution and DI water. This reagent is stable for 2 weeks at 4°C.
6.3.3 Stock sodium lauryl sulfate reagent (15 percent w/w): Add 340 mL of DI water to 60 g of sodium lauryl sulfate [SLS, CH3(CH2)11OSO3Na, FW=288.38] in a 500-mL Pyrex™ media bottle. Cap the bottle and place it in an ultrasonic bath until the SLS dissolves completely (about 30 minutes). Manual inversion of the bottle at 5-minute intervals speeds dissolution. Transfer this solution to a plastic bottle in which it is stable indefinitely at room temperature.
6.3.4 Acidic molybdate-antimony reagent: Using a graduated cylinder, cautiously add 72 mL of concentrated sulfuric acid (H2SO4, sp. gr. 1.84) to about 700 mL of DI water in a 1-L volumetric flask. Work in a hood and manually swirl or magnetically stir the flask during each addition of sulfuric acid. Next add 7.7 g of ammonium molybdate [(NH4)6Mo7O24•4H2O, FW=1235.86] to the hot sulfuric acid solution. Manually swirl or magnetically stir the contents of the flask until the ammonium molybdate dissolves. Then add 50 mL of stock antimony potassium tartrate solution (6.3.1) and again mix the contents of the flask thoroughly. After the resulting solution has cooled, dilute it to the mark with DI water, mix it well, and transfer it to a clean 1-L plastic bottle in which it is stable for 1 year at room temperature.
6.3.5 Sodium lauryl sulfate diluent reagent: Use a 100-mL graduated cylinder to dispense 10 mL of stock SLS (6.3.3) and 90 mL of DI water into a small plastic bottle. Manually swirl the bottle to mix its contents. Prepare this reagent daily.
6.3.6 Ascorbic acid reagent: Use a 50-mL graduated cylinder to dispense 5 mL of the stock ascorbic acid reagent (6.3.2) and 25 mL of DI water into an amber glass reagent bottle. Manually swirl the bottle to mix its contents. Prepare this solution daily.
6.3.7 Startup/shutdown solution: Add 1 mL of stock SLS reagent to 100 mL of DI water in a small plastic bottle. Thoroughly rinse the bottle and prepare a fresh solution every few days or as needed.
6.4 Nitrate Determination
6.4.1 Copper (II) sulfate reagent (2 percent w/v): Dissolve 20 g of copper sulfate pentahydrate (CuSO4•5H2O, FW=249.7) in about 800 mL of DI water in a 1-L volumetric flask. Dilute this solution to the mark with DI water, mix it well, and transfer it to a 1-L plastic bottle. This reagent is stable for several years at room temperature.
6.4.2 Imidazole buffer, 0.1 M, (pH 7.5): In a hood, cautiously add 5.0 mL of concentrated hydrochloric acid (HCl, ∼12 M) and 1.0 mL of 2 percent copper sulfate solution to 1,600 mL of DI water in a 2-L volumetric flask. Mix the contents of the flask thoroughly and then add 13.6 g of imidazole (C3H4N2, FW=68.08). Again swirl or shake the flask until the imidazole dissolves. Dilute the resulting solution to the mark with DI water, mix it well, and transfer it into two 1-L plastic bottles. This reagent is stable for 6 months at room temperature.
NOTE: Add 250 µL of Brij-35 surfactant to 250 mL of imidazole buffer each time its container is refilled on the continuous flow analyzer. Do not add Brij-35 to the bulk buffer solution.
6.4.3 Packed bed cadmium reactor: Cadmium reactors are prepared by slurry packing 40- to 60-mesh, copperized cadmium granules into 6-cm lengths of PTFE Teflon™ tubing (1.6 mm i.d. × 3.2 mm o.d.). Cadmium granules are retained in the column with hydrophilic plastic frits (40-µm nominal pore size). Detailed instructions for preparing copperized cadmium granules and packing them into columns can be found in NWQL standard operating procedure (SOP) IM0384.0 (or subsequent revisions; available on request).
6.4.4 Sulfanilamide reagent (“SAN”): Use a graduated cylinder to dispense 100 mL of concentrated hydrochloric acid (HCl, 36.5–38.0 percent, ≈12 M) into about 700 mL of DI water in a 1-L volumetric flask. Work in a hood and manually swirl or magnetically stir the flask during each addition of HCl. Add 10.0 g of SAN (C6H8N2O2S, FW=172.20) to the warm hydrochloric acid solution. Manually shake, sonicate, or magnetically stir the contents of the flask until the SAN dissolves. After the resulting solution has cooled, dilute it to the mark with DI water, mix it well, and transfer it to a clean 1-L plastic bottle in which it is stable for 1 year at room temperature.
6.4.5 N-(1-Naphthyl)ethylenediamine dihydrochloride reagent (“NED”): Dissolve 1.0 g
12 EVALUATION OF ALKALINE PERSULFATE DIGESTION AS AN ALTERNATIVE TO KJELDAHL DIGESTIONFOR DETERMINATION OF TOTAL AND DISSOLVED NITROGEN AND PHOSPHORUS IN WATER
NED (C12H14N2•2HCl, FW=259.2) in about 800 mL of DI water in a 1-L volumetric flask. Dilute the resulting solution to the mark with DI water and mix well by manually shaking the flask. Transfer this reagent to a 1-L amber glass bottle in which it is stable for 6 months at room temperature.
6.4.6 Startup/shutdown solution: Add 250 µL of Brij-35 surfactant to 250 mL of DI water in a plastic bottle. Thoroughly rinse the bottle and prepare a fresh solution every few days or as needed.
7. Calibrants and Quality-Control Solutions
This section provides detailed instructions for preparing calibrants, matrix spike solution, quality- control check solutions, and digestion check solution.
7.1 Potassium nitrate stock calibrant solution, 1 mL =2.5 mg-N: Dissolve 1.805 g of potassium nitrate (KNO3, FW=101.1) in about 80 mL of DI water in a 100-mL volumetric flask. Dilute this solution to the mark with DI water and mix it thoroughly by manual inversion and shaking. Transfer the stock calibrant to a 100-mL Pyrex™ media bottle in which it is stable for 6 months at 4°C.
7.2 Potassium di-hydrogen phosphate stock calibrant solution, 1 mL =1.0 mg-P: Dissolve 0.4394 g potassium di-hydrogen phosphate (KH2PO4, FW=136.09) in about 80 mL of DI water in a 100-mL volumetric flask. Dilute this solution to the mark with DI water and mix it thoroughly by manual inversion
and shaking. Transfer the stock calibrant to a 100-mL Pyrex™ media bottle in which it is stable for 6 months at 4°C.
7.3 Sulfuric acid ≈1.8 M: Use a 25-mL graduated cylinder to dispense 10 mL of concentrated sulfuric acid (H2SO4, sp. gr. 1.84) into about 75 mL of DI water in a 100-mL volumetric flask. After the solution cools, dilute it to the mark with DI water, mix it well, and transfer it to a 125-mL plastic bottle. Make a new batch of this acid each time acidified working calibrants and blanks are prepared and use the remainder to prepare acidified blank solution as needed.
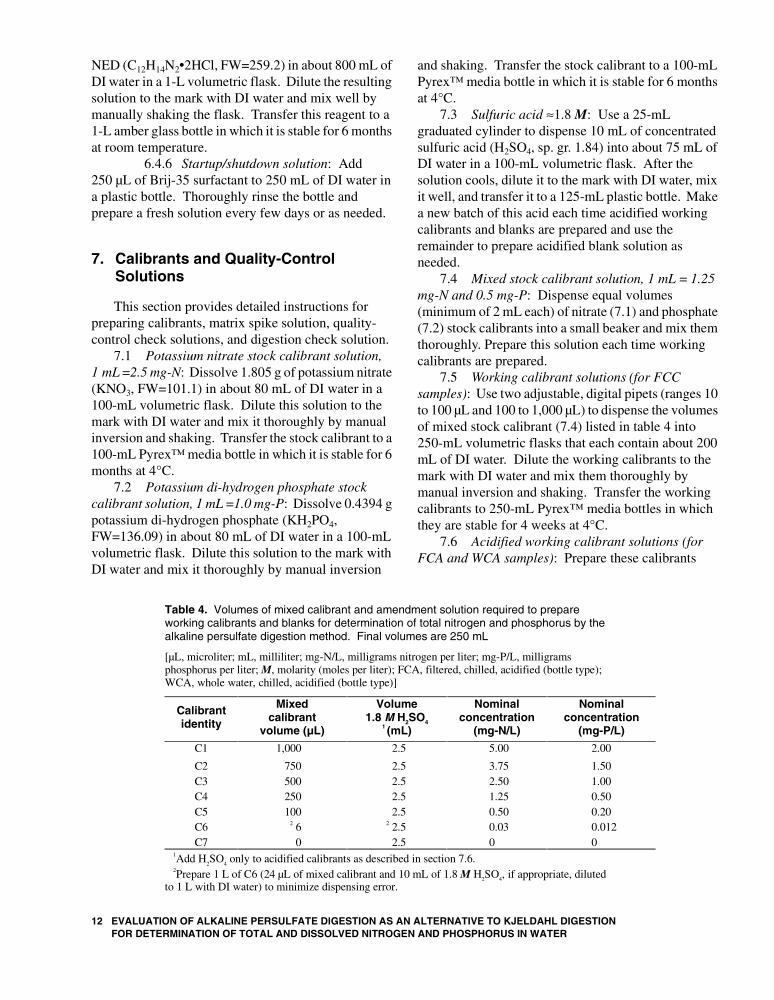
7.4 Mixed stock calibrant solution, 1 mL = 1.25 mg-N and 0.5 mg-P: Dispense equal volumes (minimum of 2 mL each) of nitrate (7.1) and phosphate (7.2) stock calibrants into a small beaker and mix them thoroughly. Prepare this solution each time working calibrants are prepared.
7.5 Working calibrant solutions (for FCC samples): Use two adjustable, digital pipets (ranges 10 to 100 µL and 100 to 1,000 µL) to dispense the volumes of mixed stock calibrant (7.4) listed in table 4 into 250-mL volumetric flasks that each contain about 200 mL of DI water. Dilute the working calibrants to the mark with DI water and mix them thoroughly by manual inversion and shaking. Transfer the working calibrants to 250-mL Pyrex™ media bottles in which they are stable for 4 weeks at 4°C.
7.6 Acidified working calibrant solutions (for FCA and WCA samples): Prepare these calibrants
Table 4. Volumes of mixed calibrant and amendment solution required to prepare working calibrants and blanks for determination of total nitrogen and phosphorus by the alkaline persulfate digestion method. Final volumes are 250 mL
[µL, microliter; mL, milliliter; mg-N/L, milligrams nitrogen per liter; mg-P/L, milligrams phosphorus per liter; M, molarity (moles per liter); FCA, filtered, chilled, acidified (bottle type); WCA, whole water, chilled, acidified (bottle type)]
Calibrant identity
Mixed calibrant
volume (µL)
Volume 1.8 M H2SO4
1 (mL)
Nominal concentration
(mg-N/L)
Nominal concentration
(mg-P/L)
C1 1,000 2.5 5.00 2.00
C2 750 2.5 3.75 1.50 C3 500 2.5 2.50 1.00 C4 250 2.5 1.25 0.50 C5 100 2.5 0.50 0.20 C6 2 6 2 2.5 0.03 0.012 C7 0 2.5 0 0
1Add H2SO
4 only to acidified calibrants as described in section 7.6.
2Prepare 1 L of C6 (24 µL of mixed calibrant and 10 mL of 1.8 M H2SO4, if appropriate, diluted to 1 L with DI water) to minimize dispensing error.

Analytical Method 13
identically to those described in section 7.5, except add 2.5 mL of 1.8 M H2SO4 to each flask before diluting it to the mark with DI water.
7.7 Check standards (for FCC samples): Check standards in three concentration ranges, which were designated Low, High, and Very high, were prepared from a concentrated commercial nutrient QC mixture (Demand™, Environmental Resource Associates, Arvada, Colo.), as listed in table 5. Transfer check standards to 1-L Pyrex™ media bottles in which they are stable for 2 months at 4ºC. Each of these check standards was dispensed, digested, and analyzed along with every batch of filtered and whole-water samples analyzed for this study.
7.8 Acidified check standards (for FCA and WCA samples): Prepare these check standards identically to those described in section 7.7, except add 10.0 mL of 1.8 M H2SO4 to the flasks before diluting them to the mark with DI water.
7.9 Spike Solutions7.9.1 Nitrogen stock spike solution
(1 mL = 0.50 mg-N): Dissolve 0.955 g ammonium chloride (NH4Cl, FW=53.49) in about 400 mL of DI water in a 500-mL volumetric flask. Dilute this solution to the mark with DI water and mix it thoroughly by manual inversion and shaking. Transfer the stock spike solution to a 500-mL Pyrex™ media bottle in which it is stable for 6 months at 4°C.
7.9.2 Phosphorus stock spike solution (1 mL = 0.20 mg-P): Dissolve 0.439 g potassium dihydrogen phosphate (KH2PO4, FW=136.1) in about 400 mL of DI water in a 500-mL volumetric flask. Dilute this solution to the mark with DI water and mix it thoroughly by manual inversion and shaking. Transfer the stock spike solution to a 500-mL Pyrex™ media bottle in which it is stable for 6 months at 4°C.
7.9.3 Mixed spike solution (100 µL = 0.005 mg-N and 0.002 mg-P): Dispense 1 mL each of
ammonium chloride and orthophosphate stock spike solutions into a 10-mL volumetric flask and dilute to the mark with DI water. Transfer the mixed spike solution to a 15-mL, screw-cap polyethylene centrifuge tube in which it is stable for 2 weeks at 4°C.
NOTE: An equivalent mixed spike solution can be prepared more conveniently from stock calibrants (sections 7.1 and 7.2) by diluting 500 µL of each to 25 mL in a volumetric flask.
7.10 Digest-Check Stock Solutions7.10.1 Glycine digest-check stock solution
(1 mL = 1.0 mg-N): Dissolve 3.98 g glycine (C2H5NO2•HCl, FW=111.5) in about 400 mL of DI water in a 500-mL volumetric flask. Dilute this solution to the mark with DI water and mix it thoroughly by manual inversion and shaking. Transfer the stock digest-check solution to a 500-mL Pyrex™ media bottle in which it is stable for 6 months at 4°C.
7.10.2 Glycerophosphate digest-check stock solution (1 mL = 0.4 mg-P): Dissolve 1.976 g glycerophosphate (C3H7O6PNa2•5H2O, FW=306.1) in about 400 mL of DI water in a 500-mL volumetric flask. Dilute this solution to the mark with DI water and mix it thoroughly by manual inversion and shaking. Transfer the stock digest-check solution to a 500-mL Pyrex™ media bottle in which it is stable for 6 months at 4°C.
7.10.3 Glucose digest-check stock solution (1 mL = 1.25 mg-C): Dissolve 1.564 g glucose (C6H12O6, FW=180.2) in about 400 mL of DI water in a 500-mL volumetric flask. Dilute this solution to the mark with DI water and mix it thoroughly by manual inversion and shaking. Transfer the stock digest-check solution to a 500-mL Pyrex™ media bottle in which it is stable for 6 months at 4°C.
Table 5. Volumes of Environmental Resource Associates (ERA) Demand™ nutrient concentrate used to prepare 1-liter volumes of check standards used in this study
� �������������������������� -N/L, milligrams nitrogen per liter; mg-P/L, milligrams phosphorus per liter]
Check standard identity
ERA Demand™
volume (µL)
Volume 1.8 M H2SO4
1 (mL)
Nominal concentration
(mg–N/L)
Nominal concentration
(mg–P/L)
Low 100 10.0 0.22 0.11
High 500 10.0 1.09 0.54 Very high 1,000 10.0 2.20 1.08
1Add H2SO4 only to acidified check standards as described in section 7.8.

14 EVALUATION OF ALKALINE PERSULFATE DIGESTION AS AN ALTERNATIVE TO KJELDAHL DIGESTIONFOR DETERMINATION OF TOTAL AND DISSOLVED NITROGEN AND PHOSPHORUS IN WATER
7.10.4 Mixed digest-check solution (for FCC samples—nominal concentration 4 mg-N/L, 1.6 mg-P/L, and 50 mg-C/L): Dispense 1 mL each of glycine and glycerophosphate stock digest-check solutions and 10 mL of the glucose digest-check stock solution into a 250-mL volumetric flask that contains about 200 mL of DI water. Dilute the contents of the flask to the mark with DI water and mix it thoroughly by manual inversion and shaking. Transfer the stock digest-check solution to a 250-mL Pyrex™ media bottle in which it is stable for 1 month at 4°C.
7.10.5 Acidified mixed digest-check solution (for FCA and WCA samples): Prepare this digest-check solution identically to the one described in section 7.10.4, except add 2.5 mL of 1.8 M H2SO4 to the flask before diluting its contents to the mark with DI water. Transfer the acidified mixed digest-check solution to a 250-mL Pyrex™ media bottle in which it is stable at 4°C for 1 month.
8. Sample Preparation
8.1 Alkaline persulfate digests are prepared by dispensing samples and digestion reagent into 30-mL, screw-cap, Pyrex™ culture tubes in the volume ratio of 2 + 1. For filtered samples (FCC bottle types) that were prepared robotically, 9.5-mL volumes of samples, blanks, calibrants, and reference materials were dosed
with 4.75-mL volumes of alkaline persulfate digestion reagent (see section 6.1.3). This is the maximum sample volume that could be delivered by the robotic dispenser/diluter system's 10.000-mL syringes because 0.500 mL of their capacity is expended in the creation of air gaps that minimize interaction between samples and the DI water carrier fluid. Whole-water samples (WCA bottle types) that require vigorous shaking (and in a few cases, continuous magnetic stirring) just prior to dispensing operations were prepared manually with conventional, high-precision, hand-held electronic pipets (Rainin EDP Plus™). Here dispensed volumes of sample and digestion reagent (see section 6.1.4) were 10.000 and 5.000 mL, respectively. After robotic or manual sample and reagent-dispensing operations are complete, 100 µL of mixed spike solution (see section 7.9.3) is added manually to the designated tube. Then all tubes are capped tightly and mixed thoroughly either by manual inversion (three times) or with a vortex mixer (3, 5-second cycles). The capped tubes positioned in a purpose-built, 80-position stainless-steel rack then are placed in an autoclave where they are digested at 121ºC and 117.2 kPa for 1 hour. Table 6 lists the rack protocol suggested for a batch of 80 tubes consisting of up to 64 samples plus six calibrants, four blanks, three quality-control (QC) check solutions, one digest-check solution, one duplicate sample, and one spiked sample. A step-by-step procedure for
Table 6. Suggested rack protocol for alkaline persulfate digest preparation
[ID, identification; QC, quality control; yyyy, year; ddd, Julian day]
Tube number ID Tube
number ID Tube number ID Tube
number ID
1 C1 21 yyyyddd0007 41 yyyyddd0027 61 yyyyddd0047 2 C2 22 yyyyddd0008 42 yyyyddd0028 62 yyyyddd0048 3 C3 23 yyyyddd0009 43 yyyyddd0029 63 yyyyddd0049 4 C4 24 yyyyddd0010 44 yyyyddd0030 64 yyyyddd0050 5 C5 25 yyyyddd0011 45 yyyyddd0031 65 yyyyddd0051 6 C6 26 yyyyddd0012 46 yyyyddd0032 66 yyyyddd0052 7 C7 (blank) 27 yyyyddd0013 47 yyyyddd0033 67 yyyyddd0053 8 blank 28 yyyyddd0014 48 yyyyddd0034 68 yyyyddd0054 9 blank 29 yyyyddd0015 49 yyyyddd0035 69 yyyyddd0055
10 blank 30 yyyyddd0016 50 yyyyddd0036 70 yyyyddd0056 11 QC low 31 yyyyddd0017 51 yyyyddd0037 71 yyyyddd0057 12 Digest check 32 yyyyddd0018 52 yyyyddd0038 72 yyyyddd0058 13 QC high 33 yyyyddd0019 53 yyyyddd0039 73 yyyyddd0059 14 QC very high 34 yyyyddd0020 54 yyyyddd0040 74 yyyyddd0060 15 yyyyddd0001 35 yyyyddd0021 55 yyyyddd0041 75 yyyyddd0061 16 yyyyddd0002 36 yyyyddd0022 56 yyyyddd0042 76 yyyyddd0062 17 yyyyddd0003 37 yyyyddd0023 57 yyyyddd0043 77 yyyyddd0063 18 yyyyddd0004 38 yyyyddd0024 58 yyyyddd0044 78 yyyyddd0064 19 yyyyddd0005 39 yyyyddd0025 59 yyyyddd0045 79 Duplicate 20 yyyyddd0006 40 yyyyddd0026 60 yyyyddd0046 80 Spike
Analytical Method 15
alkaline persulfate digest preparation is provided in NWQL SOP IM0384.0 (available on request).
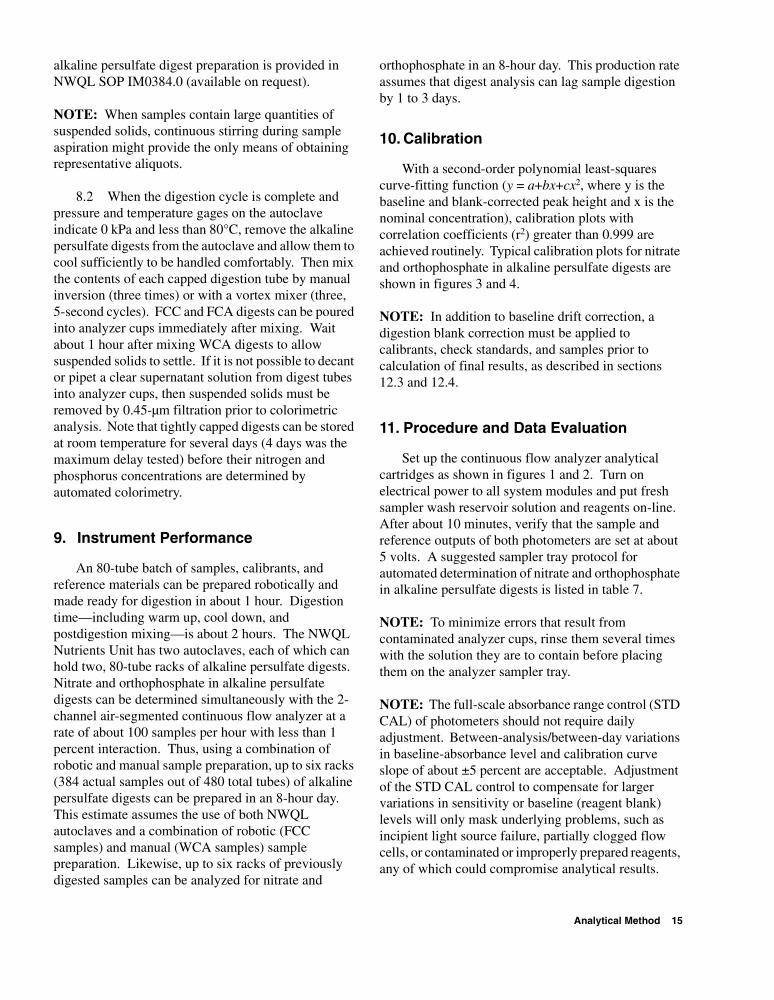
NOTE: When samples contain large quantities of suspended solids, continuous stirring during sample aspiration might provide the only means of obtaining representative aliquots.
8.2 When the digestion cycle is complete and pressure and temperature gages on the autoclave indicate 0 kPa and less than 80°C, remove the alkaline persulfate digests from the autoclave and allow them to cool sufficiently to be handled comfortably. Then mix the contents of each capped digestion tube by manual inversion (three times) or with a vortex mixer (three, 5-second cycles). FCC and FCA digests can be poured into analyzer cups immediately after mixing. Wait about 1 hour after mixing WCA digests to allow suspended solids to settle. If it is not possible to decant or pipet a clear supernatant solution from digest tubes into analyzer cups, then suspended solids must be removed by 0.45-µm filtration prior to colorimetric analysis. Note that tightly capped digests can be stored at room temperature for several days (4 days was the maximum delay tested) before their nitrogen and phosphorus concentrations are determined by automated colorimetry.
9. Instrument Performance
An 80-tube batch of samples, calibrants, and reference materials can be prepared robotically and made ready for digestion in about 1 hour. Digestion time—including warm up, cool down, and postdigestion mixing—is about 2 hours. The NWQL Nutrients Unit has two autoclaves, each of which can hold two, 80-tube racks of alkaline persulfate digests. Nitrate and orthophosphate in alkaline persulfate digests can be determined simultaneously with the 2-channel air-segmented continuous flow analyzer at a rate of about 100 samples per hour with less than 1 percent interaction. Thus, using a combination of robotic and manual sample preparation, up to six racks (384 actual samples out of 480 total tubes) of alkaline persulfate digests can be prepared in an 8-hour day. This estimate assumes the use of both NWQL autoclaves and a combination of robotic (FCC samples) and manual (WCA samples) sample preparation. Likewise, up to six racks of previously digested samples can be analyzed for nitrate and
orthophosphate in an 8-hour day. This production rate assumes that digest analysis can lag sample digestion by 1 to 3 days.
10. Calibration
With a second-order polynomial least-squares curve-fitting function (y = a+bx+cx2, where y is the baseline and blank-corrected peak height and x is the nominal concentration), calibration plots with correlation coefficients (r2) greater than 0.999 are achieved routinely. Typical calibration plots for nitrate and orthophosphate in alkaline persulfate digests are shown in figures 3 and 4.
NOTE: In addition to baseline drift correction, a digestion blank correction must be applied to calibrants, check standards, and samples prior to calculation of final results, as described in sections 12.3 and 12.4.
11. Procedure and Data Evaluation
Set up the continuous flow analyzer analytical cartridges as shown in figures 1 and 2. Turn on electrical power to all system modules and put fresh sampler wash reservoir solution and reagents on-line. After about 10 minutes, verify that the sample and reference outputs of both photometers are set at about 5 volts. A suggested sampler tray protocol for automated determination of nitrate and orthophosphate in alkaline persulfate digests is listed in table 7.
NOTE: To minimize errors that result from contaminated analyzer cups, rinse them several times with the solution they are to contain before placing them on the analyzer sampler tray.
NOTE: The full-scale absorbance range control (STD CAL) of photometers should not require daily adjustment. Between-analysis/between-day variations in baseline-absorbance level and calibration curve slope of about ±5 percent are acceptable. Adjustment of the STD CAL control to compensate for larger variations in sensitivity or baseline (reagent blank) levels will only mask underlying problems, such as incipient light source failure, partially clogged flow cells, or contaminated or improperly prepared reagents, any of which could compromise analytical results.

16 EVALUATION OF ALKALINE PERSULFATE DIGESTION AS AN ALTERNATIVE TO KJELDAHL DIGESTIONFOR DETERMINATION OF TOTAL AND DISSOLVED NITROGEN AND PHOSPHORUS IN WATER
0.00 1.25 2.50 3.75 5.00
0.00
1.00
2.00
3.00
4.00
AB
SO
RB
AN
CE
, IN
VO
LT
S
NITROGEN CONCENTRATION, IN MILLIGRAMS PER LITER
mg-N/L Volts
5.00 4.322
3.75 3.272
2.50 2.175
1.25 1.122
0.50 0.469
0.10 0.091
0.00 0.000
y = a + bx + cx2
Parameter Value Error r2
a 0.010 0.010 0.99994
b 0.886 0.013
c -0.005 0.003
0.0 0.5 1.0 1.5 2.0
0.00
1.00
2.00
3.00
4.00
PHOSPHORUS CONCENTRATION, IN MILLIGRAMS PER LITER
AB
SO
RB
AN
CE
, IN
VO
LT
S
y = a + bx + cx2
Parameter Value Error r2
a 0.005 0.006 0.99998
b 2.132 0.018
c 0.024 0.009 mg-P/L Volts
2.00 4.368
1.50 3.256
1.00 2.154
0.50 1.083
0.20 0.446
0.04 0.084
0.00 0.000
Figure 4. Typical calibration graph for total phosphorus determined as orthophosphate in alkaline persulfate digests.
Figure 3. Typical calibration graph for total nitrogen determined as nitrate in alkaline persulfate digests.

Analytical Method 17
12. Calculations
12.1 Instrument calibration requires preparing a set of solutions (calibrants) in which the analyte concentration is known. These calibrants are digested along with samples and used to establish a calibration function that is estimated from a least-squares fit of nominal calibrant concentrations (x) in relation to peak absorbance (y). A second-order polynomial function (y = a+bx+cx2) usually provides improved concentration estimates at the upper end of the calibration range than a more conventional linear function (y = a+bx). Accuracy is not lost when a second-order fit is used, even if the calibration function is strictly linear, because, in this case, the value estimated for the quadratic parameter c will approach zero.
12.2 Before the calibration function can be estimated, the baseline absorbance component of measured peak heights, including drift (continuous
increase or decrease in the baseline absorbance during the course of an analysis), if present, needs to be removed. Baseline absorbance in continuous flow analysis is analogous to the reagent blank absorbance in batch analysis. Correction for baseline absorbance is an automatic function of most data acquisition and processing software sold by vendors of continuous flow analyzers.
NOTE: These correction algorithms are based on linear interpolation between initial and intermediate or final baseline measurements, and so they do not accurately correct for abrupt, step-changes in baseline absorbance that usually indicate partial flow-cell blockage. It is prudent, therefore, to reestablish baseline absorbance at intervals of 20 samples or so.
Table 7. Suggested analyzer sample tray protocol for automated determination of nitrate and orthophosphate in alkaline persulfate digests
[#, number; ID, identification; SYNC, synchronization peak; CO, carry-over peak; W, wash; UB, undigested blank; DB, digested blank; CCV, continuing calibration verification; QC, quality control; yyyy, year; ddd, Julian day]
Cup # ID Cup # ID Cup # ID Cup # ID
1 SYNC 24 yyyyddd0006 47 yyyyddd0029 70 yyyyddd0050 2 CO (C6) 25 yyyyddd0007 48 yyyyddd0030 71 yyyyddd0051 3 (C6) 26 yyyyddd0008 49 yyyyddd0031 72 yyyyddd0052 4 W 27 yyyyddd0009 50 yyyyddd0032 73 yyyyddd0053 5 C1 28 yyyyddd0010 51 UB 74 yyyyddd0054 6 C2 29 yyyyddd0011 52 W (DB) 75 yyyyddd0055 7 C3 30 yyyyddd0012 53 yyyyddd0033 76 yyyyddd0056 8 C4 31 yyyyddd0013 54 yyyyddd0034 77 yyyyddd0057 9 C5 32 yyyyddd0014 55 yyyyddd0035 78 yyyyddd0058
10 C6 33 yyyyddd0015 56 yyyyddd0036 79 yyyyddd0059 11 C7 34 yyyyddd0016 57 yyyyddd0037 80 yyyyddd0060 12 W 35 yyyyddd0017 58 yyyyddd0038 81 yyyyddd0061 13 CCV 36 yyyyddd0018 59 yyyyddd0039 82 yyyyddd0062 14 UB
1 37 yyyyddd0019 60 yyyyddd0040 83 yyyyddd0063
15 QC low2 38 yyyyddd0020 61 yyyyddd0041 84 yyyyddd0064
16 Digest check3 39 yyyyddd0021 62 yyyyddd0042 85 duplicate
17 QC high2 40 yyyyddd0022 63 yyyyddd0043 86 Spike 18 QC very high
2 41 yyyyddd0023 64 yyyyddd0044 87 UB
19 yyyyddd0001 42 yyyyddd0024 65 yyyyddd0045 88 CCV 20 yyyyddd0002 43 yyyyddd0025 66 yyyyddd0046 89 UB 21 yyyyddd0003 44 yyyyddd0026 67 yyyyddd0047 90 W (DB) 22 yyyyddd0004 45 yyyyddd0027 68 yyyyddd0048 23 yyyyddd0005 46 yyyyddd0028 69 yyyyddd0049
1Undigested blank (sampler wash reservoir solution, see section 6.2.1).
2NWQL Check Standard, see sections 7.7 and 7.8.
3Digest-check sample; see sections 7.10.4 and 7.10.5.

18 EVALUATION OF ALKALINE PERSULFATE DIGESTION AS AN ALTERNATIVE TO KJELDAHL DIGESTIONFOR DETERMINATION OF TOTAL AND DISSOLVED NITROGEN AND PHOSPHORUS IN WATER
12.3 After peaks are baseline corrected, they need to be digestion-blank corrected.
This correction can be applied in several ways:1. Subtract the baseline-corrected absorbance of
the digestion blank—compute an average concentration if multiple digested blanks are included in each block—from the baseline-corrected absorbance of all calibrants, check standard, and samples in the block. Then estimate regression parameters (a, b, and c terms) for the calibration function by using a second-order polynomial least-squares algorithm. For second and higher order calibration functions, use the Newton-Raphson successive approximations algorithm (Draper and Smith, 1966; Swartz, 1976, 1977, 1979) to convert corrected peak heights into concentrations.
2. Designate digestion blanks as a calibrant with a nominal concentration of zero. In this case the resulting calibration function will have a positive y-intercept that approximates the baseline-corrected absorbance of the digestion blank. If this method is used, be sure that the curve-fitting algorithm does not force a zero y-intercept by including one or more “dummy” (0,0) points in the data set used for calibration.
3. Designate digested blanks as baseline correction samples—that is, “W” in the FasPac™ software used to acquire and process data at the NWQL. In this case initial, intermediate (if included), and final baselines are interpolated between digested blank peak maxima. Thus, baseline and digestion blanks are corrected in a single operation.
NOTE: Digestion blanks were corrected for data in this report by using method 3. However, analytical results calculated by the other two methods should be equivalent. Regardless of the blank correction algorithm chosen, make sure that it is documented in the SOP and that analysts understand it. The SOP for these methods must be updated whenever any changes in data acquisition and processing software or in calculation algorithms are implemented.
12.4 Most software packages provide a data base for entering appropriate dilution factors. Usually these factors can be entered before or after samples are
analyzed. If dilution factors are entered, reported concentrations will be compensated automatically for the extent of dilution. The dilution factor is the number by which a measured concentration must be multiplied to obtain the analyte concentration in the sample prior to dilution. For example, dilution factors of 2, 5, and 10 indicate that sample and diluent were combined in proportions of 1+1, 1+4, and 1+9, respectively.
13. Reporting Results
Total nitrogen (lab codes 2754, 2755, 2756)• 2 decimal places for concentrations up to 5.00
mg-N/L• 2 significant figures for concentrations greater
than 5.00 mg-N/LTotal phosphorus (lab codes 2757, 2758, 2759)• 2 decimal places for concentrations up to 2.00
mg-P/L• 2 significant figures for concentrations greater
than 2.00 mg-P/L
14. Detection Levels, Bias, and Precision
14.1 Method detection limits (MDL) for composited, low-concentration FCC and WCA samples (five of each) were estimated using the U.S Environmental Protection Agency (1997) protocol—see table 8. Target concentrations for nitrogen and phosphorus in FCC and WCA composite samples were 0.05 mg-N/L and 0.02 mg-P/L, respectively. The MDL for nitrogen was 0.015 mg-N/L and for phosphorus was 0.007 mg-P/L. Laboratory reporting levels (LRL) will be about twice the MDL concentrations.
14.2 Table 9 lists the average and standard deviation of 9987L, 9987H, and 9987VH QC check solutions that were included in every rack of alkaline persulfate digests. Most probable values (MPVs) and standard deviations in table 9 were published by the USGS Branch of Quality Systems for the 2002 water year (12-month period ending September 30 each year is called the “water year”). In all cases, total nitrogen and total phosphorus concentrations determined for these reference materials by the alkaline persulfate digestion method were tightly centered around published MPVs and well within published control limits.
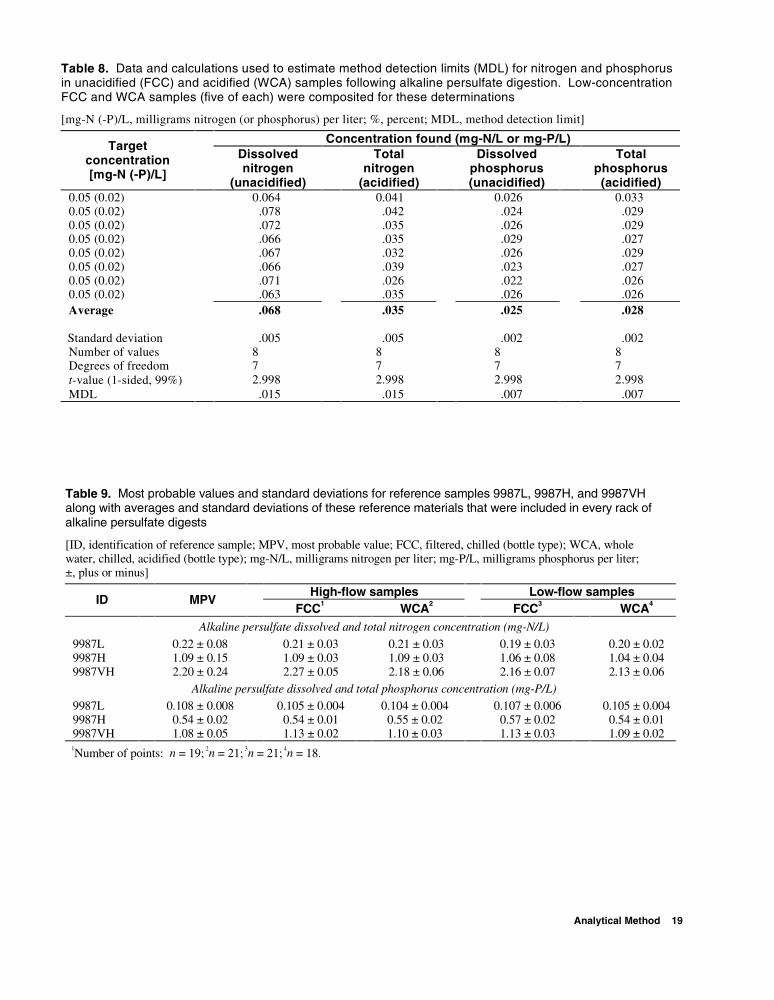
Analytical Method 19
Table 8. Data and calculations used to estimate method detection limits (MDL) for nitrogen and phosphorus in unacidified (FCC) and acidified (WCA) samples following alkaline persulfate digestion. Low-concentration FCC and WCA samples (five of each) were composited for these determinations
[mg-N (-P)/L, milligrams nitrogen (or phosphorus) per liter; %, percent; MDL, method detection limit]
Concentration found (mg-N/L or mg-P/L) Target concentration [mg-N (-P)/L]
Dissolved nitrogen
(unacidified)
Total nitrogen
(acidified)
Dissolved phosphorus (unacidified)
Total phosphorus (acidified)
0.05 (0.02) 0.064 0.041 0.026 0.033 0.05 (0.02) .078 .042 .024 .029 0.05 (0.02) .072 .035 .026 .029 0.05 (0.02) .066 .035 .029 .027 0.05 (0.02) .067 .032 .026 .029 0.05 (0.02) .066 .039 .023 .027 0.05 (0.02) .071 .026 .022 .026 0.05 (0.02) .063 .035 .026 .026 Average .068 .035 .025 .028 Standard deviation
.005
.005
.002
.002
Number of values 8 8 8 8 Degrees of freedom 7 7 7 7 t-value (1-sided, 99%) 2.998 2.998 2.998 2.998 MDL .015 .015 .007 .007
Table 9. Most probable values and standard deviations for reference samples 9987L, 9987H, and 9987VH along with averages and standard deviations of these reference materials that were included in every rack of alkaline persulfate digests
[ID, identification of reference sample; MPV, most probable value; FCC, filtered, chilled (bottle type); WCA, whole water, chilled, acidified (bottle type); mg-N/L, milligrams nitrogen per liter; mg-P/L, milligrams phosphorus per liter; ±, plus or minus]
High-flow samples Low-flow samples ID
MPV FCC1 WCA2 FCC3 WCA4
Alkaline persulfate dissolved and total nitrogen concentration (mg-N/L)
9987L 0.22 ± 0.08 0.21 ± 0.03 0.21 ± 0.03 0.19 ± 0.03 0.20 ± 0.02 9987H 1.09 ± 0.15 1.09 ± 0.03 1.09 ± 0.03 1.06 ± 0.08 1.04 ± 0.04 9987VH 2.20 ± 0.24 2.27 ± 0.05 2.18 ± 0.06 2.16 ± 0.07 2.13 ± 0.06
Alkaline persulfate dissolved and total phosphorus concentration (mg-P/L)
9987L 0.108 ± 0.008 0.105 ± 0.004 0.104 ± 0.004 0.107 ± 0.006 0.105 ± 0.004 9987H 0.54 ± 0.02 0.54 ± 0.01 0.55 ± 0.02 0.57 ± 0.02 0.54 ± 0.01 9987VH 1.08 ± 0.05 1.13 ± 0.02 1.10 ± 0.03 1.13 ± 0.03 1.09 ± 0.02 1Number of points: n = 19; 2n = 21; 3n = 21; 4n = 18.
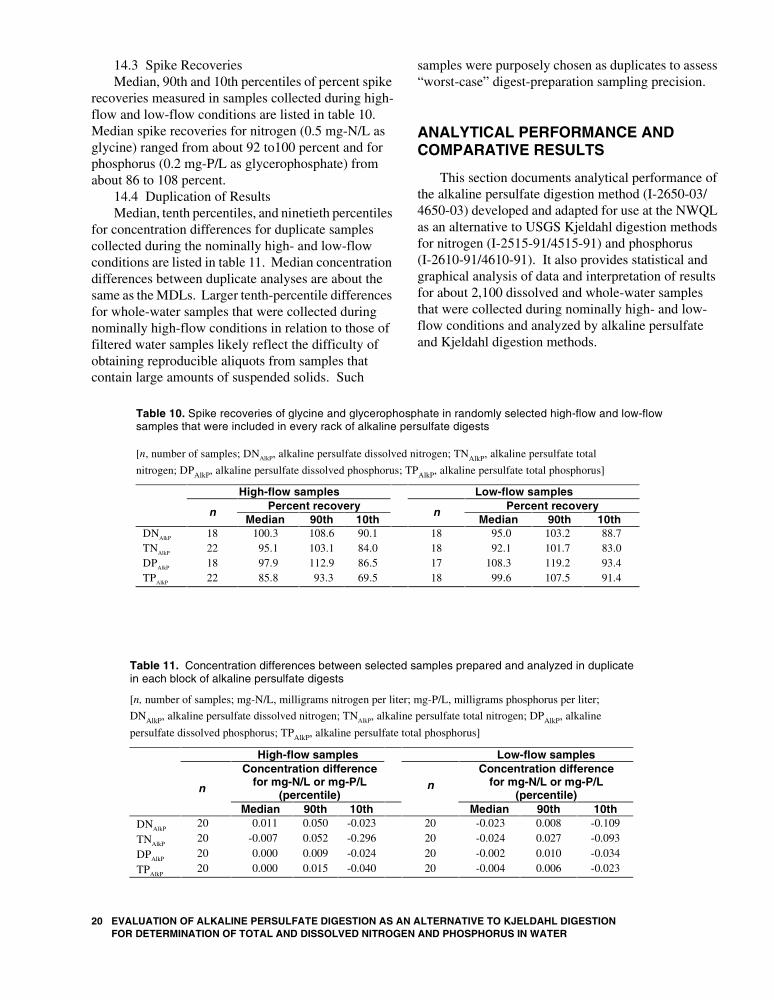
20 EVALUATION OF ALKALINE PERSULFATE DIGESTION AS AN ALTERNATIVE TO KJELDAHL DIGESTIONFOR DETERMINATION OF TOTAL AND DISSOLVED NITROGEN AND PHOSPHORUS IN WATER
14.3 Spike RecoveriesMedian, 90th and 10th percentiles of percent spike
recoveries measured in samples collected during high-flow and low-flow conditions are listed in table 10. Median spike recoveries for nitrogen (0.5 mg-N/L as glycine) ranged from about 92 to100 percent and for phosphorus (0.2 mg-P/L as glycerophosphate) from about 86 to 108 percent.
14.4 Duplication of ResultsMedian, tenth percentiles, and ninetieth percentiles
for concentration differences for duplicate samples collected during the nominally high- and low-flow conditions are listed in table 11. Median concentration differences between duplicate analyses are about the same as the MDLs. Larger tenth-percentile differences for whole-water samples that were collected during nominally high-flow conditions in relation to those of filtered water samples likely reflect the difficulty of obtaining reproducible aliquots from samples that contain large amounts of suspended solids. Such
samples were purposely chosen as duplicates to assess “worst-case” digest-preparation sampling precision.
ANALYTICAL PERFORMANCE AND COMPARATIVE RESULTS
This section documents analytical performance of the alkaline persulfate digestion method (I-2650-03/4650-03) developed and adapted for use at the NWQL as an alternative to USGS Kjeldahl digestion methods for nitrogen (I-2515-91/4515-91) and phosphorus (I-2610-91/4610-91). It also provides statistical and graphical analysis of data and interpretation of results for about 2,100 dissolved and whole-water samples that were collected during nominally high- and low-flow conditions and analyzed by alkaline persulfate and Kjeldahl digestion methods.
Table 10. Spike recoveries of glycine and glycerophosphate in randomly selected high-flow and low-flow samples that were included in every rack of alkaline persulfate digests
[n, number of samples; DNAlkP, alkaline persulfate dissolved nitrogen; TNAlkP, alkaline persulfate total
nitrogen; DPAlkP, alkaline persulfate dissolved phosphorus; TPAlkP, alkaline persulfate total phosphorus]
High-flow samples Low-flow samples Percent recovery Percent recovery
n Median 90th 10th
n Median 90th 10th
DNAlkP 18 100.3 108.6 90.1 18 95.0 103.2 88.7 TNAlkP 22 95.1 103.1 84.0 18 92.1 101.7 83.0 DPAlkP 18 97.9 112.9 86.5 17 108.3 119.2 93.4 TPAlkP 22 85.8 93.3 69.5 18 99.6 107.5 91.4
Table 11. Concentration differences between selected samples prepared and analyzed in duplicate in each block of alkaline persulfate digests
[n, number of samples; mg-N/L, milligrams nitrogen per liter; mg-P/L, milligrams phosphorus per liter;
DNAlkP, alkaline persulfate dissolved nitrogen; TNAlkP, alkaline persulfate total nitrogen; DPAlkP, alkaline
persulfate dissolved phosphorus; TPAlkP, alkaline persulfate total phosphorus]
High-flow samples Low-flow samples Concentration difference
for mg-N/L or mg-P/L (percentile)
Concentration difference for mg-N/L or mg-P/L
(percentile)
n
Median 90th 10th
n
Median 90th 10th DNAlkP 20 0.011 0.050 -0.023 20 -0.023 0.008 -0.109
TNAlkP 20 -0.007 0.052 -0.296 20 -0.024 0.027 -0.093
DPAlkP 20 0.000 0.009 -0.024 20 -0.002 0.010 -0.034
TPAlkP 20 0.000 0.015 -0.040 20 -0.004 0.006 -0.023

Analytical Performance and Comparative Results 21
Analytical Performance
Prior to beginning the large-scale evaluation and validation study with samples collected during nominally high- and low-flow conditions, preliminary experiments were performed to establish performance of the alkaline persulfate digestion method. Recoveries of nitrogen and phosphorus from individual nitrogen- and phosphorus-containing compounds that were prepared in deionized water are listed in tables 12
and 13. Inspection of table 12 reveals greater than 95-percent recovery of nitrogen for compounds tested. The somewhat lower recoveries obtained for phosphorus compounds listed in table 13 result from the lower purity of test compounds (phenyl phosphate and phytic acid ≤95 percent according to vendor labels; ATP was purchased and first opened in 1991). Comparable, though slightly higher, phosphorus recoveries for these compounds by acid persulfate digestion (USEPA method 365.1—the generally accepted reference method for total phosphorus determinations), which also are shown in table 13,
substantiate this assertion. Other researchers (Ebina and others, 1983; Hosomi and Sudo, 1986; Ameel and others, 1993), who used alkaline persulfate digestion methods similar to the one developed at the NWQL, reported phosphorus recoveries greater than 95 percent for a variety of phosphorus-containing compounds, including ATP.
Results from an experiment to assess nitrogen recovery in the presence of organic carbon (OC) are shown in figure 5. In these experiments a series of solutions containing 2.5 mg NH4
+-N/L and increasing concentrations of OC (as glucose) were digested and analyzed for nitrogen. Data plotted in figure 5 indicate that complete oxidation of ammonium to nitrate was achieved for OC concentrations up to 150 mg/L. Similar results have been reported previously (Langer and Hendrix, 1982; Cabrera and Beare, 1993). OC in surface- and ground-water samples analyzed at the NWQL rarely exceeds 150 mg/L. Note, however, that nitrogen recovery in Kjeldahl digests is quantitative at OC concentrations 10 to 20 times greater than the 150-mg/L limit typical for alkaline persulfate digestion methods (Ebina and others, 1983).
During preliminary validation work, the cause of low nitrogen recovery in about 10 WCA samples was traced to overacidification at collection sites. When these samples were dosed with alkaline persulfate reagent, the resulting pH was less than 7. As discussed previously in section 2.2, an initial pH greater than 12 is necessary for complete oxidation of ammonium and organic nitrogen to nitrate. For this reason the pH of all WCA samples was checked with narrow range colorimetric test strips during the large-scale evaluation and validation study. Nitrogen
Table 12. Recovery of inorganic and organic nitrogen from representative compounds
[mg-N/L, milligrams nitrogen per liter; ±, plus or minus]
Nitrogen compound
Nominal concen-tration
(mg-N/L)
Found (mg-N/L)
Recovery (percent)
Ammonia 2.5 2.51 ± 0.05 100.5 Urea 2.5 2.50 ± 0.06 100.0 Nicotinic acid 2.5 2.47 ± 0.04 98.7 Glycine 2.5 2.50 ± 0.07 97.9
Table 13 Recovery of organic phosphorus from representative compounds by alkaline persulfate and low-level acid persulfate digestion methods
[mg-P/L, milligrams phosphorus per liter; ±, plus or minus]
Alkaline persulfate method Acid persulfate method
Compound
Nominal concen-tration
(mg-P/L) Found
(mg-P/L) Recovery (percent) Found
(mg-P/L) Recovery (percent)
0.200 0.166 ± 0.000 83.0 0.176 ± 0.001 88.0 Adenosine tri-phosphate (ATP) 1.000 0.87 ± 0.03 86.8 0.200 0.196 ± 0.007 100.2 0.204 ± 0.002 102.1 Glycerophosphate 1.000 1.019 ± 0.008 101.9 0.200 0.168 ± 0.004 84.2 0.179 ± 0.000 89.5 Phenyl Phosphate 1.000 0.872 ± 0.002 87.2 0.200 0.177 ± 0.002 88.4 0.180 ± 0.001 91.8 Phytic Acid
1.000 0.906 ± 0.009 90.6

22 EVALUATION OF ALKALINE PERSULFATE DIGESTION AS AN ALTERNATIVE TO KJELDAHL DIGESTIONFOR DETERMINATION OF TOTAL AND DISSOLVED NITROGEN AND PHOSPHORUS IN WATER
concentration results for WCA samples with pH outside the expected range of 1.6 to 1.9 were disqualified. For more information, see section 3.1.4. About 150 results for samples with medium codes other than 6 (ground water) and 9 (surface water)—specifically, Q (quality-assurance sample, artificial), R (quality-assurance sample, surface water), S (quality-assurance sample, ground water), 2 (leachate), and 5 (elutriation)—also were not included in graphical and statistical analyses.
In Kjeldahl digestion procedures, digests are evaporated to near dryness and then resolvated with DI water prior to analytical determinations. Variation in the postdigestion volume of DI water added to each tube—and therefore in estimated mass-per-unit volume nitrogen and phosphorus concentrations in resolvated digests—is a function of the DI water dispenser precision, typically 2 to 3 percent. Alkaline persulfate digests, in contrast, are tightly capped and lose little water during digestion. After digestion, nitrogen and phosphorus are determined directly without volume adjustment. It was of interest, therefore, to assess the
variation in liquid loss during alkaline persulfate digestion. To this end, pre- and postdigestion weights for one, 80-tube batch of prepared alkaline persulfate digests were measured to the nearest 0.01 g and recorded. A weight of 15 g (10 mL of sample + 5 mL of digestion reagent) was assumed in percent weight-loss calculations using equation 1 below. The results from this experiment, which indicate a weight loss of 3 percent or less for 85 percent of all tubes, are shown in figure 6. The maximum percent weight loss observed was 6 percent.
Comparative Results for Nitrogen
In discussions that follow, the designations KDN and KTN apply to Kjeldahl digestion dissolved nitrogen (ammonium + organic nitrogen determined in filtered-water digests) and Kjeldahl digestion total nitrogen (ammonium + organic nitrogen determined in acidified, whole-water digests), respectively. When filtered- and whole-water samples are considered
0 150 300 450 600
0
20
40
60
80
100
AM
MO
NIU
M R
EC
OV
ER
Y,
IN P
ER
CE
NT
GLUCOSE CONCENTRATION, IN MILLIGRAMS CARBON PER LITER
Figure 5. Percent recovery of nitrogen from a series of 2.5 mg NH4+-N solutions that
contained increasing concentrations of organic carbon (OC) as glucose. See text for additional details.
(1)Percent weight loss =
Digest weightinitial Digest weightfinal–
15g------------------------------------------------------------------------------------------------ 100×
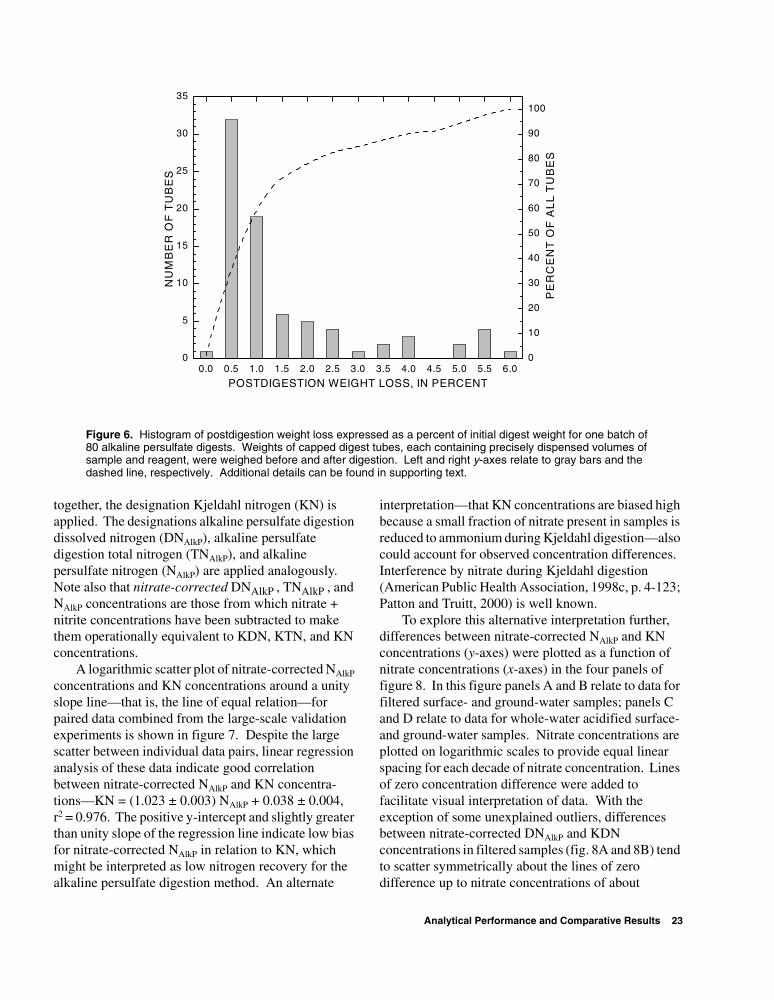
Analytical Performance and Comparative Results 23
together, the designation Kjeldahl nitrogen (KN) is applied. The designations alkaline persulfate digestion dissolved nitrogen (DNAlkP), alkaline persulfate digestion total nitrogen (TNAlkP), and alkaline persulfate nitrogen (NAlkP) are applied analogously. Note also that nitrate-corrected DNAlkP , TNAlkP , and NAlkP concentrations are those from which nitrate + nitrite concentrations have been subtracted to make them operationally equivalent to KDN, KTN, and KN concentrations.
A logarithmic scatter plot of nitrate-corrected NAlkP concentrations and KN concentrations around a unity slope line—that is, the line of equal relation—for paired data combined from the large-scale validation experiments is shown in figure 7. Despite the large scatter between individual data pairs, linear regression analysis of these data indicate good correlation between nitrate-corrected NAlkP and KN concentra-tions—KN = (1.023 ± 0.003) NAlkP + 0.038 ± 0.004, r2 = 0.976. The positive y-intercept and slightly greater than unity slope of the regression line indicate low bias for nitrate-corrected NAlkP in relation to KN, which might be interpreted as low nitrogen recovery for the alkaline persulfate digestion method. An alternate
interpretation—that KN concentrations are biased high because a small fraction of nitrate present in samples is reduced to ammonium during Kjeldahl digestion—also could account for observed concentration differences. Interference by nitrate during Kjeldahl digestion (American Public Health Association, 1998c, p. 4-123; Patton and Truitt, 2000) is well known.
To explore this alternative interpretation further, differences between nitrate-corrected NAlkP and KN concentrations (y-axes) were plotted as a function of nitrate concentrations (x-axes) in the four panels of figure 8. In this figure panels A and B relate to data for filtered surface- and ground-water samples; panels C and D relate to data for whole-water acidified surface- and ground-water samples. Nitrate concentrations are plotted on logarithmic scales to provide equal linear spacing for each decade of nitrate concentration. Lines of zero concentration difference were added to facilitate visual interpretation of data. With the exception of some unexplained outliers, differences between nitrate-corrected DNAlkP and KDN concentrations in filtered samples (fig. 8A and 8B) tend to scatter symmetrically about the lines of zero difference up to nitrate concentrations of about
0.0 0.5 1.0 1.5 2.0 2.5 3.0 3.5 4.0 4.5 5.0 5.5 6.00
5
10
15
20
25
30
35
NU
MB
ER
OF
TU
BE
S
POSTDIGESTION WEIGHT LOSS, IN PERCENT
0
10
20
30
40
50
60
70
80
90
100
PE
RC
EN
T O
F A
LL
TU
BE
S
Figure 6. Histogram of postdigestion weight loss expressed as a percent of initial digest weight for one batch of 80 alkaline persulfate digests. Weights of capped digest tubes, each containing precisely dispensed volumes of sample and reagent, were weighed before and after digestion. Left and right y-axes relate to gray bars and the dashed line, respectively. Additional details can be found in supporting text.

24 EVALUATION OF ALKALINE PERSULFATE DIGESTION AS AN ALTERNATIVE TO KJELDAHL DIGESTIONFOR DETERMINATION OF TOTAL AND DISSOLVED NITROGEN AND PHOSPHORUS IN WATER
1 mg-N/L. At higher nitrate concentrations, differences between nitrate-corrected DNAlkP and KDN concentrations increase about the line of zero difference—erratically for filtered ground water and negatively for filtered surface water. In contrast, concentration differences between nitrate-corrected TNAlkP and KTN for unfiltered, acidified samples (fig. 8C and 8D) are predominately negative with differences becoming more negative as nitrate concentrations increase. This trend is particularly evident for unfiltered, acidified surface water.
The result of sorting data from each panel in figure 8 according to nominal flow conditions at the time of sample collection and recasting them as box plots is shown in figure 9. In this figure, concentration differences between nitrate-corrected NAlkP and KN for samples collected during nominally high-flow (HF) and low-flow (LF) conditions are grouped into three nitrate concentration ranges: NO3
--N ≤ 0.1 mg/L, 0.1 mg/L < NO3
--N ≤ 1.0 mg/L, and NO3--N > 1.0 mg/L.
Figure 9 further substantiates the hypothesis that concentration differences between nitrate-corrected
NAlkP and KN likely result from the well known, though poorly characterized, high-temperature reactions between nitrate and natural organic matter (NOM) that can produce positive (reduction of nitrate to ammonium) or negative (oxidation of ammonium to nitrous oxide) interference in Kjeldahl nitrogen determinations (see section 3.1.5 and Patton and Truitt, 2000). Positive nitrate interference in KN concentrations predominates for surface-water samples and is greater for whole-water samples than for filtered-water samples. This result is consistent with typically larger NOM concentrations in whole-water samples than in filtered-water samples. Nitrate appears to interfere positively and negatively in KN concentrations for ground-water samples, although the trends are less clear than for surface-water samples. In general, differences between nitrate-corrected NAlkP and KN concentrations were least for samples with nitrate concentrations less than 0.1 mg NO3
--N/L—a finding consistent with nitrate interference during Kjeldahl digestion. Complete two-population, paired t-test results for subsets of nitrate-corrected DNAlkP and
0.01 0.1 1 100.01
0.1
1
10
Line of equal relation
n = 2066
KJE
LD
AH
L N
ITR
OG
EN
, IN
MIL
LIG
RA
MS
NIT
RO
GE
N P
ER
LIT
ER
ALKALINE PERSULFATE NITROGEN MINUS
NITRATE, IN MILLIGRAMS NITROGEN PER LITER
Figure 7. Logarithmic scatter plot of nitrate-corrected NAlkP concentrations (x-axis) and KN concentrations (y-axis) around the line of equal relation for 2,066 data pairs combined from large-scale validation experiments. The linear regression equation for these data is y = (1.023 ± 0.003) x + 0.038 ± 0.004, with a correlation coefficient (r2) of 0.976.

Analytical Performance and Comparative Results 25
KDN concentrations in filtered-water samples are listed in table 14. Nitrate-corrected TNAlkP and KTN concentrations in acidified whole-water samples are listed in table 15.
Comparative Results for Phosphorus
A logarithmic scatter plot of PAlkP concentrations (x-axis) and KP concentrations (y-axis) around a unity slope line for 2,093 data pairs combined from high- and low-flow phases of validation experiments is shown in figure 10. This plot reveals good correlation among phosphorus concentrations determined by the PAlkP and KP digestion methods. The slope and y-intercept of the linear least squares regression of these data—KP = (0.994 ± 0.002) PAlkP + 0.0003 ± 0.0005; correlation
coefficient (r2) = 0.994 closely approximate 1 and 0. A two-population, paired t-test confirmed the null hypothesis that the difference between means of phosphorus concentrations for these 2,093 paired results determined by the PAlkP and KP digestion methods were not significantly different from zero at the p = 0.05 level. Differences between means of alkaline persulfate phosphorus and Kjeldahl phosphorus concentrations for some subsets of these data, which were grouped according to water type and flow conditions at the time of sample collection, were statistically different from zero at the p = 0.05 level. In all such cases, however, differences between means were less than method detection limits—0.007 mg-P/L for PAlkP and 0.02 mg-P/L for KP—and therefore were not analytically significant. Complete results for these t-tests are listed in table 16.
-1 .0
-0.5
0.0
0.5
1.0A
Filtered S urface W ater (n = 543)
B
Filte red G round W ater (n = 453)
0 .01 0 .1 1 10 50
-1.0
-0.5
0.0
0.5
1.0C
(NA
lkP -
NO
3
- -N)
- K
N,
IN M
ILL
IGR
AM
S N
ITR
OG
EN
PE
R L
ITE
R
N ITR A T E C O N C E N TR A TIO N , IN M ILL IG R A M S N ITR O G E N P E R LITE R
Unfiltered, acid ified surface water (n = 959)
0 .01 0 .1 1 10 50
D
U nfilte red, acidified ground w ater (n = 111)
Figure 8. Concentration differences between nitrate-corrected alkaline persulfate digestion nitrogen (NAlkP) and Kjeldahl digestion nitrogen (KN) plotted about the line of zero difference as a function of nitrate concentration.

26 EVALUATION OF ALKALINE PERSULFATE DIGESTION AS AN ALTERNATIVE TO KJELDAHL DIGESTIONFOR DETERMINATION OF TOTAL AND DISSOLVED NITROGEN AND PHOSPHORUS IN WATER
SUMMARY AND CONCLUSIONS
An alkaline persulfate digestion method and automated colorimetric finishes for simultaneous nitrogen and phosphorus determinations in filtered and whole-water acidified water samples were developed and validated. This method is more sensitive, accurate, and uses less toxic reagents than Kjeldahl digestion methods, such as U.S. Geological Survey (USGS) I-2515/4515-91 and U.S. Environmental Protection Agency (USEPA) 351.2 for nitrogen and USGS I-2610/4610-91 and USEPA 365.4 for phosphorus. Data in this report result from about 2,100 filtered and
whole-water samples that were analyzed for alkaline persulfate dissolved and total nitrogen (DNAlkP and TNAlkP), Kjeldahl dissolved and total nitrogen (KDN and KTN), alkaline persulfate dissolved and total phosphorus (DPAlkP and TPAlkP), and Kjeldahl dissolved and total phosphorus (KDP and KTP). All filtered and whole-water samples analyzed by the alkaline persulfate digestion method also were analyzed for dissolved nitrate + nitrite, ammonium, and orthophosphate on the same day that digests were prepared. Results of these analyses were compared by statistical and graphical methods. About half the data
HF LF HF LF HF LF-0.30
-0.15
0.00
0.15
0.30
n = 42
n = 64n = 75
n = 136n = 131n = 95
Filtered Surface W ater
HF LF HF LF HF LF
n = 71 n = 82 n = 60n = 60
n = 63
n = 117
Filtered Ground Water
HF LF HF LF HF LF
-0.45
-0.30
-0.15
0.00
0.15
n = 97
n = 115
n = 177
n = 237n = 217
n = 116
Unfiltered, acidified surface water
HF LF HF LF HF LF
NO 3
--N≤0.1 0.1<NO 3
--N≤1.0 NO 3
--N>1.0NO 3
--N≤0.1 0.1<NO 3
--N≤1.0 NO 3
--N>1.0
(NA
lkP -
N0
3
- -N)
- K
N,
IN M
ILL
IGR
AM
S N
ITR
OG
EN
PE
R L
ITE
R
n = 8
n = 5
n = 7
n = 21
n = 48
n = 23
Unfiltered, acid ified ground water
Figure 9. Boxplots of concentration differences between nitrate-corrected alkaline persulfate nitrogen (NAlkP) and Kjeldahl nitrogen (KN) for surface- and ground-water samples collected during nominally high- and low-flow conditions. Data in each panel are grouped according to nominal flow conditions (HF = high-flow; LF = low-flow) at the time of sample collection and dissolved nitrate concentrations (milligram nitrogen per liter). In each boxplot, open squares, hinges, gates and whiskers indicate average, median, 75th and 25th percentiles, and 90th and 10th percentiles for differences between nitrate-corrected NAlkP and KN.

Summary and Conclusions 27
Tab
le 1
4. R
esul
ts o
f pai
red
t-te
sts
for n
itrat
e-co
rrec
ted
alka
line
pers
ulfa
te d
isso
lved
nitr
ogen
and
Kje
ldah
l dis
solv
ed n
itrog
en c
once
ntra
tions
det
erm
ined
in fi
ltere
d-w
ater
sa
mpl
es.
Dis
trib
utio
ns o
f nitr
ate
conc
entr
atio
ns fo
r ea
ch s
ubgr
oup
are
show
n in
the
right
mos
t thr
ee c
olum
ns
[mg-
N/L
, mill
igra
ms
nitr
ogen
per
lite
r; D
NA
lkP,
alk
alin
e pe
rsul
fate
dig
estio
n di
ssol
ved
nitr
ogen
; KD
N, K
jeld
ahl d
iges
tion
dis
solv
ed n
itro
gen;
n, n
umbe
r of
sam
ples
; max
, max
imum
; 75
th, 7
5th
perc
entil
e; <
, les
s th
an; ≤
, les
s th
an o
r eq
ual t
o; >
, gre
ater
than
]
1 p cal
c is
the
prob
abil
ity
that
pop
ulat
ion
mea
ns o
f ni
trat
e-co
rrec
ted
DN
Alk
P a
nd K
DN
con
cent
rati
ons
are
the
sam
e—th
at is
, dif
fere
nce
betw
een
the
popu
latio
n m
eans
is s
tati
stic
ally
equi
vale
nt to
zer
o—on
the
basi
s of
cal
cula
ted
pair
ed t-
test
s. D
iffe
renc
e be
twee
n po
pula
tion
mea
ns is
sig
nifi
cant
at t
he 9
5-pe
rcen
t con
fide
nce
leve
l (p 0
.05)
whe
n p c
alc i
s le
ss th
an 0
.05
and
at th
e 99
-per
cent
con
fide
nce
leve
l (p 0
.01)
whe
n p c
alc
is le
ss th
an 0
.01.
Mea
n
(mg
-N/L
)
Var
ian
ce (
mg
-N/L
)
S
ign
ific
ance
1
Nit
rate
(m
g-N
/L)
Filt
ered
g
rou
nd
wat
er
DN
Alk
P
KD
N
Dif
fere
nce
(m
g–N
/L)
DN
Alk
P
KD
N
n
pca
lc
p0.
05
p0.
01
M
edia
n
Max
75
th
All
0.
340
0.33
3
0.00
7
2.38
7 2.
397
45
3
0.38
6 no
no
0.51
3 50
3.
289
Hig
h-fl
ow
All
0.
415
0.39
0
0.02
5
5.15
3 5.
179
19
4
0.01
2 ye
s no
0.21
2 50
1.
875
NO
3- < 0
.1
0.
446
0.45
6
-0.0
10
0.
526
0.53
5
71
0.
341
no
no
0
0.09
4 0.
007
0.1
< N
O3- ≤
1.0
0.12
5 0.
106
0.
019
0.
029
0.02
0
60
0.
229
no
no
0.
372
0.98
4 0.
795
NO
3- > 1
.0
0.
657
0.58
8
0.06
9
15.2
78
15.3
75
63
0.00
4 ye
s ye
s
3.53
6 50
6.
27
Low
-flo
w
All
0.
283
0.29
0
-0.0
07
0.
319
0.32
1
259
0.
540
no
no
0.
674
48
3.96
N
O3- <
0.1
0.46
6 0.
494
-0
.027
0.70
8 0.
698
82
0.01
8 ye
s no
0.02
0.
084
0.04
0.
1 <
NO
3- ≤ 1
.0
0.
107
0.10
0
0.00
7
0.09
6 0.
099
60
0.30
3 no
no
0.46
7 0.
988
0.62
8
NO
3- > 1
.0
0.
245
0.24
4
0.00
0
0.12
4 0.
127
11
7
0.99
3 no
no
4.22
2 48
8.
6
Filt
ered
su
rfac
e w
ater
All
0.
41
0.43
5
-0.0
25
0.
191
0.22
6
543
<
0.00
1 ye
s ye
s
0.18
2 16
.88
0.88
3 H
igh-
flow
A
ll
0.38
5 0.
393
-0
.008
0.07
8 0.
088
29
5
0.21
no
no
0.35
8 16
.88
0.92
2 N
O3- <
0.1
0.36
5 0.
34
0.
025
0.
082
0.08
8
95
0.
041
yes
no
0.
016
0.09
6 0.
053
0.1
< N
O3- ≤
1.0
0.40
3 0.
401
0.
002
0.
073
0.08
1
136
0.
836
no
no
0.
329
1.54
7 0.
541
NO
3- > 1
.0
0.
388
0.45
6
-0.0
68
0.
084
0.09
6
64
0.
002
yes
yes
2.
111
16.8
8 3.
199
Low
-flo
w
All
0.
44
0.48
4
-0.0
44
0.
325
0.38
7
248
<
0.00
1 ye
s ye
s
0.08
4 9.
76
0.47
5 N
O3- <
0.1
0.43
6 0.
462
-0
.026
0.22
6 0.
232
13
1
<0.
001
yes
yes
0.
009
0.09
8 0.
027
0.1
< N
O3- ≤
1.0
0.35
9 0.
374
-0
.015
0.14
0.
128
75
0.34
2 no
no
0.23
6 0.
967
0.46
8
NO
3- > 1
.0
0.
599
0.74
8
-0.1
49
0.
95
1.27
9
42
<
0.00
1 ye
s ye
s
2.23
8 9.
757
3.81
9

28 EVALUATION OF ALKALINE PERSULFATE DIGESTION AS AN ALTERNATIVE TO KJELDAHL DIGESTIONFOR DETERMINATION OF TOTAL AND DISSOLVED NITROGEN AND PHOSPHORUS IN WATER
Tab
le 1
5. R
esul
ts o
f pai
red
t-te
sts
for
nitr
ate-
corr
ecte
d al
kalin
e pe
rsul
fate
tota
l nitr
ogen
and
Kje
ldah
l tot
al n
itrog
en c
once
ntra
tions
det
erm
ined
in a
cidi
fied
who
le-w
ater
sa
mpl
es.
Dis
trib
utio
ns o
f nitr
ate
conc
entr
atio
ns fo
r ea
ch s
ubgr
oup
are
show
n in
the
right
mos
t thr
ee c
olum
ns
[mg-
N/L
, mill
igra
ms
nitr
ogen
per
lite
r; T
NA
lkP,
alk
alin
e pe
rsul
fate
dig
estio
n to
tal n
itro
gen;
KT
N, K
jeld
ahl d
iges
tion
tota
l nitr
ogen
; n, n
umbe
r of
sam
ples
; max
, max
imum
; 75
th, 7
5th
perc
enti
le; <
, les
s th
an; <
, les
s th
an o
r eq
ual t
o; >
, gre
ater
than
]
1p c
alc
is th
e pr
obab
ility
that
pop
ulat
ion
mea
ns o
f ni
trat
e-co
rrec
ted
TN
Alk
P an
d K
TN
con
cent
rati
ons
are
the
sam
e—th
at is
, dif
fere
nce
betw
een
the
popu
lati
on m
eans
is s
tatis
tical
ly
equi
vale
nt to
zer
o—on
the
basi
s of
cal
cula
ted
pair
ed t-
test
s. D
iffe
renc
e be
twee
n po
pula
tion
mea
ns is
sig
nifi
cant
at t
he 9
5-pe
rcen
t con
fide
nce
leve
l (p 0
.05)
whe
n p c
alc
is le
ss th
an 0
.05
an
d at
the
99-p
erce
nt c
onfi
denc
e le
vel (
p 0.0
1) w
hen
p cal
c is
less
than
0.0
1.
Mea
n
(mg
-N/L
)
Var
ian
ce (
mg
-N/L
)
S
ign
ific
ance
1
Nit
rate
(m
g-N
/L)
Un
filt
ered
g
rou
nd
wat
er
TN
Alk
P
KT
N
Dif
fere
nce
(m
g-N
/L)
TN
Alk
P
KT
N
n
pca
lc
p0.
05
p0.
01
M
edia
n
Max
75
th
All
0.51
4 0.
577
-0
.063
0.31
9 0.
362
111
<
0.00
1 ye
s ye
s
0.02
2 16
.04
0.85
9 H
igh
-flo
w
All
0.50
9 0.
53
-0
.021
0.17
8 0.
179
48
0.
135
no
no
0.
498
16.0
4 0.
868
NO
3- < 0
.1
0.
242
0.27
7
-0.0
35
0.
162
0.18
1 23
0.00
1 ye
s ye
s
0.01
0 0.
052
0.01
7 0.
1 <
NO
3- ≤ 1
.0
0.
821
0.79
5
0.02
6
0.03
4 0.
032
21
0.
096
no
no
0.
864
0.90
4 0.
872
NO
3- > 1
.0
0.
414
0.59
3
-0.1
79
0.
135
0.28
5 4
0.
185
no
no
4.
164
16.0
4 8.
613
Low
-flo
w
All
0.51
8 0.
613
-0
.095
0.43
1 0.
503
63
<
0.00
1 ye
s ye
s
0.01
7 6.
962
0.05
2 N
O3- <
0.1
0.59
6 0.
679
-0
.083
0.51
0.
613
48
<
0.00
1 ye
s ye
s
0.01
5 0.
062
0.02
2 0.
1 <
NO
3- ≤ 1
.0
0.
429
0.57
5
-0.1
46
0.
114
0.09
7 7
0.
127
no
no
0.
344
0.88
5 0.
866
NO
3- > 1
.0
0.
092
0.21
1
-0.1
19
0.
062
0.06
2 8
<
0.00
1 ye
s ye
s
1.79
7 6.
962
5.37
6
Un
filt
ered
su
rfac
e w
ater
All
0.72
8 0.
820
-0
.092
0.91
1 1.
007
95
9
<0.
001
yes
yes
0.
215
61.6
5 0.
874
Hig
h-f
low
A
ll
0.
677
0.74
4
-0.0
67
0.
608
0.69
4
468
<
0.00
1 ye
s ye
s
0.34
5 11
.74
0.99
3 N
O3- <
0.1
0.65
4 0.
655
-0
.001
0.56
0 0.
517
11
6
<0.
001
no
no
0.
020
0.09
5 0.
054
0.1
< N
O3- ≤
1.0
0.57
3 0.
625
-0
.052
0.33
1 0.
380
23
7
<0.
001
yes
yes
0.
349
0.99
9 0.
585
NO
3- > 1
.0
0.
914
1.08
0
-0.1
66
1.
160
1.38
5
115
<
0.00
1 ye
s ye
s
2.11
9 11
.74
3.12
5 L
ow-f
low
A
ll
0.
778
0.89
2
-0.1
14
1.
197
1.29
7
491
<
0.00
1 ye
s ye
s
0.13
4 61
.65
0.80
7 N
O3- <
0.1
0.89
8 0.
974
-0
.076
1.30
3 1.
374
21
7
<0.
001
yes
yes
0.
034
0.09
9 0.
057
0.1
< N
O3- ≤
1.0
0.58
8 0.
689
-0
.101
0.29
9 0.
395
17
7
<0.
001
yes
yes
0.
330
0.97
4 0.
557
NO
3- > 1
.0
0.
855
1.07
6
-0.2
21
2.
524
2.68
1
97
<
0.00
1 ye
s ye
s
2.38
0 61
.65
4.64
8
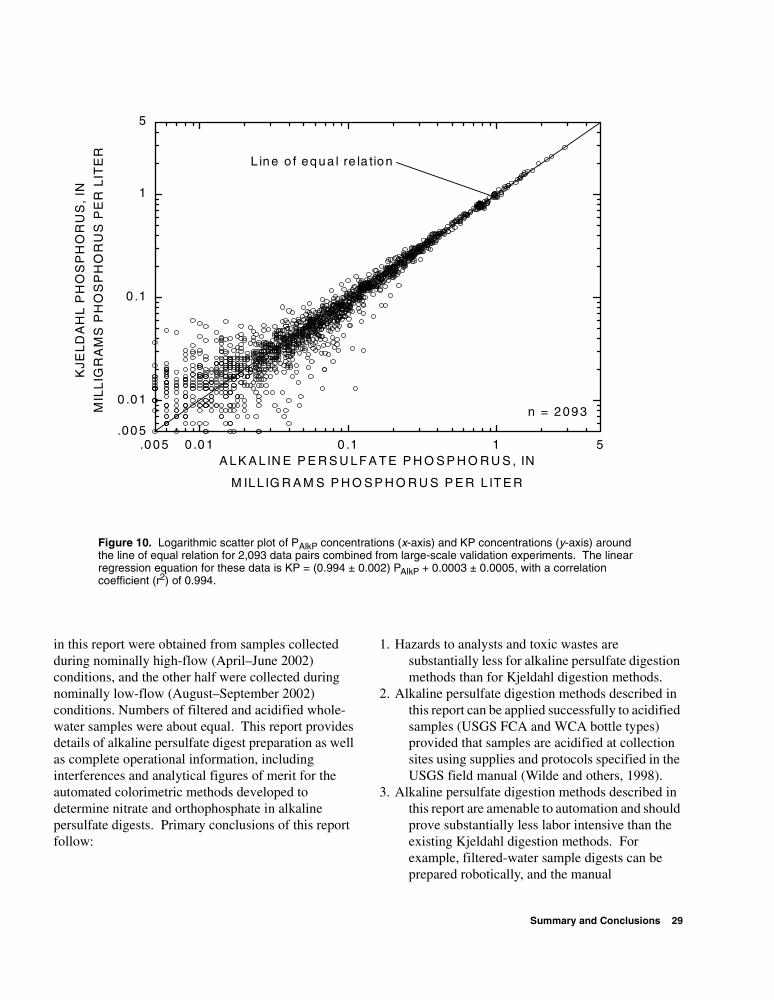
Summary and Conclusions 29
in this report were obtained from samples collected during nominally high-flow (April–June 2002) conditions, and the other half were collected during nominally low-flow (August–September 2002) conditions. Numbers of filtered and acidified whole-water samples were about equal. This report provides details of alkaline persulfate digest preparation as well as complete operational information, including interferences and analytical figures of merit for the automated colorimetric methods developed to determine nitrate and orthophosphate in alkaline persulfate digests. Primary conclusions of this report follow:
1. Hazards to analysts and toxic wastes are substantially less for alkaline persulfate digestion methods than for Kjeldahl digestion methods.
2. Alkaline persulfate digestion methods described in this report can be applied successfully to acidified samples (USGS FCA and WCA bottle types) provided that samples are acidified at collection sites using supplies and protocols specified in the USGS field manual (Wilde and others, 1998).
3. Alkaline persulfate digestion methods described in this report are amenable to automation and should prove substantially less labor intensive than the existing Kjeldahl digestion methods. For example, filtered-water sample digests can be prepared robotically, and the manual
.005 0 .01 0 .1 1 5.005
0 .01
0 .1
1
5
L ine o f equa l re la tion
n = 2093
KJE
LD
AH
L P
HO
SP
HO
RU
S,
IN
MIL
LIG
RA
MS
PH
OS
PH
OR
US
PE
R L
ITE
R
A LK A L IN E P E R S U LF A T E P H O S P H O R U S , IN
M ILL IG R A M S P H O S P H O R U S P E R L IT E R
Figure 10. Logarithmic scatter plot of PAlkP concentrations (x-axis) and KP concentrations (y-axis) around the line of equal relation for 2,093 data pairs combined from large-scale validation experiments. The linear regression equation for these data is KP = (0.994 ± 0.002) PAlkP + 0.0003 ± 0.0005, with a correlation coefficient (r2) of 0.994.

30 EVALUATION OF ALKALINE PERSULFATE DIGESTION AS AN ALTERNATIVE TO KJELDAHL DIGESTIONFOR DETERMINATION OF TOTAL AND DISSOLVED NITROGEN AND PHOSPHORUS IN WATER
Tab
le 1
6. R
esul
ts o
f pai
red
t-te
sts
for
diss
olve
d an
d to
tal p
hosp
horu
s co
ncen
trat
ions
det
erm
ined
in fi
ltere
d an
d ac
idifi
ed w
hole
-wat
er s
ampl
es b
y al
kalin
e pe
rsul
fate
di
gest
ion
(PA
lkP)
and
Kje
ldah
l dig
estio
n (K
P)
met
hods
[mg-
P/L
, mil
ligra
ms
phos
phor
us p
er li
ter;
n, n
umbe
r of
sam
ples
; FC
C, f
ilter
ed, c
hill
ed (
bottl
e ty
pe f
or s
ampl
es);
WC
A, w
hole
wat
er, c
hille
d, a
cidi
fied
(bo
ttle
type
for
sam
ples
); M
C 6
, gr
ound
wat
er m
ediu
m c
ode;
MC
9, s
urfa
ce w
ater
med
ium
cod
e; H
F, h
igh
flow
; LF,
low
flo
w; <
, les
s th
an]
1 p cal
c is
the
prob
abili
ty th
at p
opul
atio
n m
eans
of
P Alk
P a
nd K
P c
once
ntra
tion
s ar
e th
e sa
me—
that
is, d
iffe
renc
e be
twee
n th
e po
pula
tion
mea
ns is
sta
tistic
ally
equ
ival
ent t
o ze
ro—
on
the
basi
s of
cal
cula
ted
pair
ed t-
test
s. D
iffe
renc
e be
twee
n po
pula
tion
mea
ns is
sig
nifi
cant
at t
he 9
5-pe
rcen
t con
fide
nce
leve
l (p 0
.05)
whe
n p c
alc
is le
ss th
an 0
.05
and
at th
e 99
-per
cent
co
nfid
ence
leve
l (p 0
.01)
whe
n p c
alc
is le
ss th
an 0
.01.
M
ean
(m
g-P
/L)
Var
ian
ce (
mg
-P/L
)
S
ign
ific
ance
1 W
ater
ty
pe
P
Alk
P
KP
Dif
fere
nce
(m
g-P
/L)
P
Alk
P
KP
n
p
calc
p0.
05
p0.
01
All
0.13
4 0.
133
0.
001
0.
061
0.06
0
2,09
3
0.24
2 no
no
A
ll F
CC
0.10
0 0.
103
-0
.003
0.06
3 0.
062
1,
115
<
0.00
01
yes
yes
All
WC
A
0.
171
0.16
7
0.00
4
0.05
5 0.
056
97
8
<0.
0001
ye
s ye
s A
ll M
C 6
0.08
4 0.
087
-0
.003
0.04
5 0.
045
64
5
<0.
0001
ye
s ye
s A
ll M
C 9
0.15
5 0.
154
0.
002
0.
066
0.06
6
1,44
8
<0.
0005
ye
s ye
s H
igh-
flow
A
ll
0.
123
0.12
3
0.00
0
0.04
5 0.
046
99
0
0.64
0 no
no
F
CC
, MC
6
0.
068
0.06
9
-0.0
01
0.
026
0.02
8
204
0.
557
no
no
FC
C, M
C 9
0.12
6 0.
131
-0
.006
0.05
9 0.
061
32
0
<0.
0001
ye
s ye
s W
CA
, MC
6
0.
296
0.29
7
-0.0
01
0.
124
0.12
5
49
0.
787
no
no
WC
A, M
C 9
0.12
7 0.
123
0.
004
0.
028
0.02
9
417
<
0.00
01
yes
yes
Low
-flo
w
All
0.14
3 0.
142
0.
001
0.
075
0.07
3
1,10
3
0.04
3 ye
s no
F
CC
, MC
6
0.
046
0.05
0
-0.0
04
0.
023
0.02
2
337
<
0.00
05
yes
yes
FC
C, M
C 9
0.16
6 0.
166
0.
000
0.
141
0.13
5
254
0.
833
no
no
WC
A, M
C 6
0.19
0 0.
193
-0
.003
0.11
6 0.
119
55
0.14
0 no
no
W
CA
, MC
9
0.
196
0.19
0
0.00
6
0.06
2 0.
063
45
7
<0.
0001
ye
s ye
s

Summary and Conclusions 31
post-digestion, pH adjustment step typical in previously reported alkaline persulfate digestion procedures (Ameel and others, 1993; D’Elia and others, 1997) has been eliminated.
4. Method detection limits (MDLs) for the alkaline persulfate digestion dissolved and total nitrogen (0.015 mg-N/L) and phosphorus (0.007 mg-P/L) are substantially less than those of USGS methods I-2515/4515/91 for dissolved and total Kjeldahl nitrogen (0.05 mg-N/L) and USGS methods I-2610/4610/91 for dissolved and total Kjeldahl phosphorus (0.02 mg-P/L) methods. The lower nitrogen and phosphorus MDLs of alkaline persulfate digestion methods described in this report improve the precision of nutrient-mass balance estimates.
5. On the basis of two-population, paired t-test statistics, the means of all nitrate-corrected alkaline persulfate digestion nitrogen (NAlkP) and Kjeldahl digestion nitrogen (KN) concentrations (2,066 paired results) were significantly different from zero at the p = 0.05 level. Statistical and graphical analyses of experimental data indicate that concentration differences between nitrate-corrected NAlkP and KN result from nitrate interference in the Kjeldahl digestion method rather than incomplete recovery of nitrogen by the alkaline persulfate digestion method. Alkaline persulfate digestion, therefore, provides more accurate estimates of total nitrogen concentrations in samples that contain nitrate concentrations greater than about 0.1 mg NO3
--N/L. For some subsets of these data, the means were not different from zero at the p = 0.05 level, typically in ground-water samples or in surface-water samples with nitrate concentrations less than 0.1 mg-N/L.
6. On the basis of two-population, paired t-test statistics for 2,093 paired results, the means of all Kjeldahl digestion phosphorus concentrations determined by USGS method I-2610/4610-91 (similar to USEPA method 365.4) and those determined by the alkaline persulfate digestion method reported here were not significantly different from zero at the p = 0.05 level. For some subsets of these data, the means were different from zero at the p = 0.05 level, but in such cases differences were less than the method detection limit (0.007 mg-P/L) for the alkaline persulfate digestion method and were not analytically
significant. Changing from Kjeldahl digestion to alkaline persulfate digestion, therefore, does not affect comparisons with historical dissolved and total phosphorus concentrations.
7. Data and analysis provided in this report establish guidelines necessary to interpret total and dissolved nitrogen and phosphorus concentrations that result from alkaline persulfate digestion methods in relation to those that result from Kjeldahl digestion methods. Specifically—a. Systematic differences between DNAlkP /KDN
and TNAlkP /KTN concentrations are expected for samples with dissolved nitrate concentrations greater than or equal to 0.1 mg-N/L.
b. Concentration differences between NAlkP and historical KN data are likely to increase in proportion to dissolved nitrate concentrations in samples. Whether concentration differences are positive or negative depend on water type in ways that were not possible to describe fully. (1) Negative differences between KN and NAlkP were found most often for surface-water samples and unfiltered ground-water samples. (2) Differences between KN and NAlkP in filtered ground water are as likely to be negative as positive.
c. Samples with organic carbon (OC) concentrations greater than about 150 mg/L are not amenable to NAlkP determinations unless OC concentrations are diluted below this threshold prior to digestion.
d. As nitrate concentrations increase, NAlkP
digestion provides better estimates of total and dissolved nitrogen than KN digestion, which suffers from positive and negative interference by nitrate. On the other hand, estimating organic nitrogen concentrations as the small difference between two large numbers when dissolved nitrate, and therefore NAlkP , concentrations are large also can be problematic.
e. Systematic concentration differences between PAlkP and historical KP data are not expected.
8. One major conclusion of this report—that alkaline persulfate digestion is a more sensitive, accurate, and environmentally responsible alternative to

32 EVALUATION OF ALKALINE PERSULFATE DIGESTION AS AN ALTERNATIVE TO KJELDAHL DIGESTIONFOR DETERMINATION OF TOTAL AND DISSOLVED NITROGEN AND PHOSPHORUS IN WATER
Kjeldahl digestion for routine, simultaneous determination of nitrogen and phosphorus in surface and ground water—is consistent with previously published studies that are cited throughout this report. In comparison to these earlier studies, however, conclusions of this report are based on a much larger and geographically diverse sample population collected during high-flow and low-flow conditions. Furthermore, samples were collected, preserved, stored, and analyzed by rigorously controlled protocols established and documented by the USGS. In these respects, this report describes the most comprehensive study to date supporting applicability of the alkaline persulfate digestion method as a superior alternative to the time honored, but operationally flawed, Kjeldahl digestion method.
REFERENCES CITED
Ameel, J.J., Axler, R.P., and Owen, C.J., 1993, Persulfate digestion for determination of total nitrogen and phosphorus in low-nutrient waters: American Environmental Laboratory, v. 1, no. 8, p. 10–11.
American Public Health Association, 1998a, Standard methods for the examination of water and wastewater (20th ed.): Washington, D.C., American Public Health Association, p. 4-114– 4-122.
_____1998b, Standard methods for the examination of water and wastewater (20th ed.): Washington, D.C., American Public Health Association, p. 4-102 and 4-103.
_____1998c, Standard methods for the examination of water and wastewater (20th ed.): Washington, D.C., American Public Health Association, p. 4-123.
American Society for Testing and Materials, 2001, Annual book of ASTM standards, Section 11, Water (D1193, Standard specification for reagent water): West Conshohocken, Pa., v. 11.01, p. 107–109.
Cabrera, M.L., and Beare, M.H., 1993, Alkaline persulfate oxidation for determining total nitrogen in microbial biomass extracts: Soil Science Society of America Journal, v. 57, p. 1007–1012.
D’Elia, C.F., Steudler, P.F., and Corwin, N., 1977, Determination of total nitrogen in aqueous
samples using persulfate digestion: Limnology and Oceanography, v. 22, p. 760–764.
D’Elia, C.F., Magnien, R.E., Zimmermann, C.F., Vaas, P.A., Kaumeyer, N.L., Keefe, C.W., Shaw, D.V., and Wood, K.V., 1987, Nitrogen and phosphorus determinations in estuarine waters: A comparison of methods used in Chesapeake Bay monitoring: University of Maryland Center for Environmental and Estuarine Studies, publication number UMCEES 87-19 CBL, 26 p.
D’Elia, C.F., Connor, E.E., Kaumeyer, N.L., Keefe, C.W., Wood, K.V., and Zimmermann, C.F., 1997, Nutrient analytical services laboratory—Standard operating procedures: Chesapeake Biological Laboratory, University of Maryland Center for Environmental Science, technical support series no. 158-97, p. 29–34.
Draper, N.R., and Smith, Harry, 1966, Applied regression analysis: New York, Wiley, 407 p.
Ebina, J., Tsutsui, T., and Shirai, T., 1983, Simultaneous determination of total nitrogen and total phosphorus in water using peroxodisulfate oxidation: Water Research, v. 17, p. 1721–1726.
Fishman, M.J., ed., 1993, Methods of analysis by the U.S. Geological Survey National Water Quality Laboratory—Determination of inorganic and organic constituents in water and fluvial sediments: U.S. Geological Survey Open-File Report 93-125, 217 p.
Fishman, M.J., and Friedman, L.C., eds., 1989, Methods for determination of inorganic substances in water and fluvial sediments: U.S. Geological Survey Techniques of Water-Resources Investigations, book 5, chap. A1, 545 p.
Hosomi, Masaaki, and Sudo, Ryuichi, 1986, Simultaneous determination of total nitrogen and total phosphorus in freshwater samples using persulfate digestion: International Journal of Environmental Studies, v. 27, p. 267–275.
Johnson, 1971, Simultaneous determination of arsenate and phosphate in natural waters: Environmental Science & Technology, v. 5, p. 411–414.
Langer, C.L., and Hendrix, P.F., 1982, Evaluation of a persulfate digestion method for particulate nitrogen and phosphorus: Water Research, v. 16, p. 1451–1454.
Murphy, J., and Riley, J.P., 1962, A modified single solution method for the determination of phosphate in natural waters: Analytica Chemica Acta, v. 27, p. 31–36.

References Cited 33
Norwitz, George, and Keliher, P.N., 1985, Study of interferences in the spectrophotometric determination of nitrite using composite diazotization-coupling reagents: Analyst, v. 110, p. 689–694.
_______1986, Study of organic interferences in the spectrophotometric determination of nitrite using composite diazotization-coupling reagents: Analyst, v. 111, p. 1033–1037.
Nydahl, Folke, 1978, On the peroxodisulfate oxidation of total nitrogen in waters to nitrate: Water Research, v. 12, p. 1123–1130.
Pai, Su-Cheeng, Yang, Chung-Cheng, and Riley, J.P., 1990, Effects of acidity and molybdate concentration on the kinetics of the formation of the phosphoantimonylmolybdeum blue complex: Analytica Chemica Acta, v. 229, p. 115–120.
Patton, C.J., and Truitt, E.P., 1992, Methods of analysis by the U.S. Geological Survey National Water Quality Laboratory—Determination of total phosphorus by a Kjeldahl digestion method and an automated photometric finish that includes dialysis: U.S. Geological Survey Open-File Report 92-146, 39 p.
_____2000, Methods of analysis by the U.S. Geological Survey National Water Quality Laboratory—Determination of ammonium plus organic nitrogen by a Kjeldahl digestion method and an automated photometric finish that includes digest cleanup by gas diffusion: U.S. Geological Survey Open-File Report 00-170, 31 p.
Patton, C.J., and Wade, A.P., 1997, Continuous flow analyzers, in Ewing, Galen, ed., Analytical instrumentation handbook (2d ed.): New York, Marcel Dekker, p. 125–220.
Swartz, L.M., 1976, Nonlinear calibration curves: Analytical Chemistry, v. 48, no. 14, p. 2287–2290.
________1977, Nonlinear calibration: Analytical Chemistry, v. 49, no. 13, p. 2062–2068.
________1979, Calibration curves with nonuniform variance: Analytical Chemistry, v. 51, no. 6, p. 723–727.
U.S. Environmental Protection Agency, 1993, Methods for the determination of inorganic substances in environmental samples: Cincinnati, Ohio, Environmental Monitoring and Support Laboratory, USEPA-600/R-93/100, August 1993, 79 p.
________1997, Guidelines establishing test procedures for the analysis of pollutants (App. B, Part 136, Definition and procedures for the determination of the method detection limit): U.S. Code of Federal Regulations, title 40, revised as of July 1, 1997, p. 265–267.
Valderrama, J.C., 1981, The simultaneous analysis of total nitrogen and total phosphorus in natural waters: Marine Chemistry, v. 21, p. 109–122.
Wilde, F.D., Radtke, D.B., Gibs, Jacob, and Iwatsubo, R.T., 1998, Preparations for water sampling, in National field manual for the collection of water-quality data: U.S. Geological Survey Techniques of Water-Resources Investigations, book 9, chap. A1, accessed March 13, 2003, at http://pubs.water.usgs.gov/twri9A1.
Wood, E.D., Armstrong, F.A.J., and Richards, F.A., 1967, Determination of nitrate in seawater by cadmium-copper reduction to nitrite: Journal of Marine Biology Association, United Kingdom, v. 47, p. 23–31.
Zhang, J.-Z., Fischer, C.J., and Ortner, P.B., 1999, Optimization of performance and minimization of silicate interference in continuous flow phosphate analysis: Talanta, v. 49, p. 293–304.