methods human body composition: advances in models and
TRANSCRIPT

See discussions, stats, and author profiles for this publication at: https://www.researchgate.net/publication/13978826
Human Body Composition: Advances in Models and
Methods
Article in Annual Review of Nutrition · February 1997
DOI: 10.1146/annurev.nutr.17.1.527 · Source: PubMed
CITATIONS
240READS
3,027
4 authors, including:
Some of the authors of this publication are also working on these related projects:
Breast Cancer Health Disparities Study View project
Pharmacoepidemiology View project
Steven B Heymsfield
Pennington Biomedical Research Center
1,034 PUBLICATIONS 61,287 CITATIONS
SEE PROFILE
Zimian Wang
Columbia University
58 PUBLICATIONS 4,320 CITATIONS
SEE PROFILE
Richard Neil Baumgartner
University of Louisville
297 PUBLICATIONS 22,102 CITATIONS
SEE PROFILE
All content following this page was uploaded by Richard Neil Baumgartner on 04 June 2014.
The user has requested enhancement of the downloaded file.

P1: NBL/MBL/rkc P2: MBL/mkv QC: MBL/bs T1: MBL
May 5, 1997 15:40 Annual Reviews AR033-24
Annu. Rev. Nutr. 1997. 17:527–58Copyright c© 1997 by Annual Reviews Inc. All rights reserved
HUMAN BODY COMPOSITION:Advances in Models and Methods
Steven B. Heymsfield and ZiMian WangObesity Research Center, Department of Medicine, St. Luke’s-Roosevelt HospitalCenter, Columbia University College of Physicians and Surgeons, New York,New York 10025; e-mail: [email protected]
Richard N. BaumgartnerClinical Nutrition Research Center, Surge Building, Room 215, Universityof New Mexico School of Medicine, Albuquerque, New Mexico 87133
Robert RossSchool of Physical and Health Education, Queen’s University, Kingston, Ontario,Canada K7L 3N6
KEY WORDS: bioimpedance analysis, computerized axial tomography, dual-energy X-ray ab-sorptiometry, magnetic resonance imaging, neutron activation analysis
ABSTRACT
The field of human body composition research is reaching a mature stage inits development: The three interconnected areas that define body compositionresearch—models and their rules, methodology, and biological effects—are well-defined and are actively investigated by scientists in diverse disciplines from manydifferent nations; and methods are available for measuring all major atomic,molecular, cellular, and tissue-system level body composition components inresearch, clinical, and epidemiological settings. This review summarizes mainbody composition research concepts, examines new component-measurementmethodologies, and identifies potential areas of future research.
CONTENTS
INTRODUCTION . . . . . . . . . . . . . . . . . . . . . . . . . . . . . . . . . . . . . . . . . . . . . . . . . . . . . . . . . . . 528
SCOPE OF BODY COMPOSITION RESEARCH. . . . . . . . . . . . . . . . . . . . . . . . . . . . . . . . . . 528
ATOMIC LEVEL . . . . . . . . . . . . . . . . . . . . . . . . . . . . . . . . . . . . . . . . . . . . . . . . . . . . . . . . . . . . 530Components and Their Relationships. . . . . . . . . . . . . . . . . . . . . . . . . . . . . . . . . . . . . . . . . 530
5270199-9885/97/0715-0527$08.00

P1: NBL/MBL/rkc P2: MBL/mkv QC: MBL/bs T1: MBL
May 5, 1997 15:40 Annual Reviews AR033-24
528 HEYMSFIELD ET AL
Measurement Methods. . . . . . . . . . . . . . . . . . . . . . . . . . . . . . . . . . . . . . . . . . . . . . . . . . . . . 532MOLECULAR LEVEL . . . . . . . . . . . . . . . . . . . . . . . . . . . . . . . . . . . . . . . . . . . . . . . . . . . . . . . 538
Components and Their Relationships. . . . . . . . . . . . . . . . . . . . . . . . . . . . . . . . . . . . . . . . . 538Measurement Methods. . . . . . . . . . . . . . . . . . . . . . . . . . . . . . . . . . . . . . . . . . . . . . . . . . . . . 540
CELLULAR LEVEL . . . . . . . . . . . . . . . . . . . . . . . . . . . . . . . . . . . . . . . . . . . . . . . . . . . . . . . . . 548Components and Their Relationships. . . . . . . . . . . . . . . . . . . . . . . . . . . . . . . . . . . . . . . . . 548Measurement Methods. . . . . . . . . . . . . . . . . . . . . . . . . . . . . . . . . . . . . . . . . . . . . . . . . . . . . 549
TISSUE-SYSTEM LEVEL . . . . . . . . . . . . . . . . . . . . . . . . . . . . . . . . . . . . . . . . . . . . . . . . . . . . 549Components and Their Relationships. . . . . . . . . . . . . . . . . . . . . . . . . . . . . . . . . . . . . . . . . 549Measurement Methods. . . . . . . . . . . . . . . . . . . . . . . . . . . . . . . . . . . . . . . . . . . . . . . . . . . . . 550
METHOD SELECTION . . . . . . . . . . . . . . . . . . . . . . . . . . . . . . . . . . . . . . . . . . . . . . . . . . . . . . 554Reference Method. . . . . . . . . . . . . . . . . . . . . . . . . . . . . . . . . . . . . . . . . . . . . . . . . . . . . . . . 554Study Method. . . . . . . . . . . . . . . . . . . . . . . . . . . . . . . . . . . . . . . . . . . . . . . . . . . . . . . . . . . . 555
CONCLUSION. . . . . . . . . . . . . . . . . . . . . . . . . . . . . . . . . . . . . . . . . . . . . . . . . . . . . . . . . . . . . . 555
INTRODUCTION
A daily growth hormone injection increases fat-free body mass in patients withacquired immune deficiency syndrome (AIDS) (46). What does this mean?Does the increase in fat-free body mass reflect the well-known anabolic effectsof growth hormone, or does it represent the equally well-characterized fluid-retaining properties of the hormone and closely related insulin-like growthfactor-1 (58)?
In elderly subjects, regular exercise increases strength and, to a small butstatistically significant extent, cross-sectional thigh muscle area (21). Doesthe increase in skeletal muscle area, measured by magnetic resonance imag-ing (MRI), indicate exercise-mediated net muscle protein synthesis, or is theenlarged muscle area secondary to augmented glycogen and water retention?
These and other questions are at the center of a rapidly expanding fieldreferred to as body composition research. This review describes importantrecent advances in this field, with an emphasis on examining the questions andissues posed by modern nutritional, exercise, and pharmacological therapies.
SCOPE OF BODY COMPOSITION RESEARCH
Although more than a century old, the field of body composition research hasemerged only recently as a distinct area of scientific inquiry. The main body ofknowledge in this expanding area of human biology can be found in the over3900 research articles, 18 books, and 4 international symposia proceedingsrelated to body composition published since the early 1960s (77).
This vast and growing body of information can be organized into three dis-tinct, interconnected areas: body composition rules; methodology; and bio-logical effects (77). That each area interacts with the others (for example,the biological action of growth hormone on expanding extracellular fluid has

P1: NBL/MBL/rkc P2: MBL/mkv QC: MBL/bs T1: MBL
May 5, 1997 15:40 Annual Reviews AR033-24
BODY COMPOSITION 529
Figure 1 Some of the main components at the first four body composition levels. (From Reference39 with permission.)
important effects on the validity of methods used to estimate total body fat) is acentral concept that should be considered when interpreting body compositionresearch.
The body composition rule area organizes the more than 30 main body com-ponents into five distinct levels of increasing complexity: atomic, molecular,cellular, tissue system, and whole body (77). Some of the main componentsat the first four body composition levels are shown in Figure 1. Within thisresearch area, investigators establish the various characteristics of body com-ponents and their quantitative relationships to one another, the “rules.” Severalcommonly applied rules are that 16% of protein is nitrogen (14), 77% of fat iscarbon (45), and approximately two thirds of excess body weight in adults isfat (22).
An important concept when considering the five-level model is that compo-nents at successively higher body composition levels are composed of lower-level components. A classic example is that adipose tissue, a tissue-systemlevel component, includes components such as adipocytes at the cellular level,lipids at the molecular level, and carbon at the atomic level (Figure 1). Loss orgain of adipose tissue with a new intervention reflects changes in correspondingcomponents at the cellular, molecular, and atomic levels.
Another important concept is the existence of a body-composition steadystate. During stable periods, such as with maintenance of body weight andfluid homeostasis, there are relations between components that are constant orrelatively constant within an individual and between different individuals. For

P1: NBL/MBL/rkc P2: MBL/mkv QC: MBL/bs T1: MBL
May 5, 1997 15:40 Annual Reviews AR033-24
530 HEYMSFIELD ET AL
Table 1 Body composition levels and some relevant measurement methods
Recently developed or improvedLevel methods Other methods
Atomic Neutron activation analysis Whole-body40K countingTracer dilution
Molecular Bioimpedance analysis Underwater weighingDual energy X-ray absorptiometry Infrared interactanceMulticompartment models Tracer and gas dilution
Cellular Tracer dilutionTissue system Computerized axial tomography Ultrasound
Magnetic resonance imaging 24-h urinary creatinine and3-methyl histidine excretion
Whole body Anthropometry
example, even though fat and adipose tissue are molecular and tissue-systemlevel components, respectively, there exists a reasonably stable relationshipbetween the two, both within and between subjects (i.e. fat mass= ∼0.80×adipose tissue mass) (72). This fundamental concept is central to developmentof body composition methods. That is, provided with a measured propertyor component, the investigator can estimate an unknown component based onassumed stable property-component or component-component relations.
In the following sections, we provide a description of each body composi-tion level, followed by an overview of measurement methods and componentrelationships. Our methodology focus is on improved or recently developedtechnologies (Table 1).
ATOMIC LEVEL
Elements are the fundamental building blocks of all biological organisms.About 50 of the 106 elements found in nature are also found in the humanbody, and many of these are required by humans for growth and health main-tenance (77). Today, all 50 of these elements can be measured in vivo alongwith additional nonessential and toxic elements such as Hg, Al, Cd, and Pb.
Components and Their RelationshipsFour elements—O, C, H, and N—account for over 95% of body mass and withan additional seven—Na, K, P, Cl, Ca, Mg, and S—comprise over 99.5% ofbody mass (72, 77).
Elements maintain stable or relatively stable associations with other ele-ments and with components at higher levels (Table 2). Several of these asso-ciations are (kg/kg): S/N= 0.062; N/protein= 0.16; C/triacylglycerol=

P1: NBL/MBL/rkc P2: MBL/mkv QC: MBL/bs T1: MBL
May 5, 1997 15:40 Annual Reviews AR033-24
BODY COMPOSITION 531
Table 2 Examples of body composition modelsa
Level/level Model
Atomic/atomic TBS= 0.062× TBNAtomic/atomic TBP= 0.456× TBCa+ 0.555× TBKAtomic/molecular TBCa= 0.364× MoAtomic/molecular TBN= 0.16× proteinAtomic/molecular TBK= 0.00266× fat-free body massAtomic/molecular Carbon= 0.774× fatAtomic/molecular TBS= 0.010× proteinAtomic/cellular TBK = 0.00469× body cell massAtomic/whole body TBH= 0.10× BWMolecular/molecular TBW= 0.732× fat-free body massMolecular/molecular Glycogen= 0.044× proteinWhole body/atomic BW= O+ C+ H + N+ Ca+ P+ S+ K + Na+ Cl + MgWhole body/molecular BW= lipids+ water+ protein+ Mo + Ms+ glycogenWhole body/molecular BW= fat+ fat-free body massWhole body/cellular BW= cell mass+ extracellular fludis+ extracellular solidsWhole body/tissue system BW= adipose tissue+ skeletal muscle+ bone
+ viscera+ blood+ RWhole body/whole body BW= head+ neck+ trunk+ lower extremities
+ upper extremities
aAll units are in kilograms. Abbreviations: TB, total body; Mo, bone mineral: BW, bodyweight; Ms, soft tissue mineral; R, residues.
0.77; K/intracellular water= 150 mmol/liter; and H/body weight= 0.10 (65,72). These known relationships, or rules, allow development of body composi-tion models for estimating unknown components, such as protein= measuredN/0.16 or N× 6.25 (14). Associations between components based on chem-ical bonds (i.e. covalent and ionic) are among the most stable used in bodycomposition research and often form the basis of reference methods. For ex-ample, in humans, the proportion of bone as mineral is relatively stable, evenin patients with osteoporosis (38). The main constituent of bone mineral iscalcium hydroxyapatite, and calcium is therefore a stable proportion of bonemineral and bone (39). As less than 1% of total body calcium is found in softtissues, measurement of calcium provides an accurate means of quantifyingbone mineral in vivo.
Nonchemical elemental associations, such as the concentration of potassiumin intracellular water, are relatively stable in healthy individuals but may showlarger deviations with some diseases. Accordingly, total body potassium canbe used to estimate intracellular water volume and body cell mass in healthyadults and in patients with stable fluid and electrolyte balance (57). On the otherhand, intracellular potassium concentrations may undergo large alterations in

P1: NBL/MBL/rkc P2: MBL/mkv QC: MBL/bs T1: MBL
May 5, 1997 15:40 Annual Reviews AR033-24
532 HEYMSFIELD ET AL
end-stage diseases and in conditions in which severe electrolyte disturbancesare present. This underscores the important interactions between the areas ofmethodology and biological effects in body composition research. For example,one could not rely on measured total body potassium for estimating body cellmass in an end-stage AIDS patient in whom severe diarrhea and malnutritionproduced serious acid-base and electrolyte disturbances.
Measurement MethodsElements are typically quantified for the whole body or in specific regions. Theexchangeable (e) mass of some elements can also be measured, such as forsodium (Nae) and potassium (Ke) (22). The exchangeable compartment of anelement is typically defined as the element’s volume of distribution, usuallymeasured with a radioisotope, over a specified period of equilibration. Lastly,it is possible to measure the distribution volume of some exogenously admin-istered elements, as for example bromide (Br−), which has a dilution volumesimilar to the more-difficult-to-measure endogenous chloride distribution vol-ume (67).
The 11 main elements and exogenously administered elements such as bro-mide can be measured in vivo by one or more methods. All in vivo humanbody composition methods, including those for elements, are ultimately basedon measurable and relevant radioactive, electromagnetic, and physiologicalproperties (76).
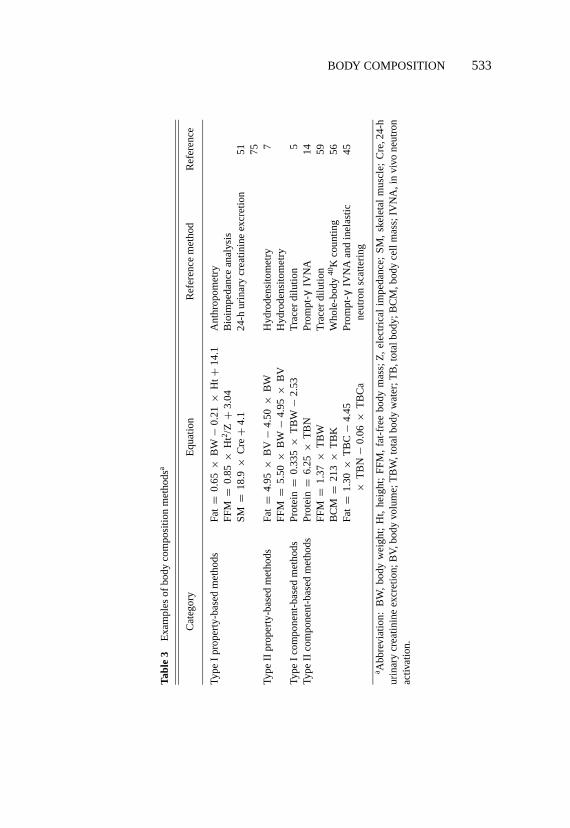
Once measured, a property must be mathematically transformed into thecomponent mass of interest. The transformation process requires use of amathematical function, and two main types can be arbitrarily defined (10a, 76).The first function type is based on an empirically derived relationship betweenthe component and measured property. A reference method is used to estimatethe component in a well-defined subject group in whom the property is alsomeasured. A statistically derived component-prediction equation is developedand then cross-validated in a new subject group. We refer to these component-prediction equations as descriptive or type I mathematical functions (10a, 76).There are a large number of property-based prediction formulas for atomic levelcomponents (20).
The second type of mathematical function is based on stable relationshipsbetween properties and components, many of which can be understood in termsof their underlying biological basis. We refer to this category as mechanistic ortype II mathematical functions (76), and there are many examples for atomicand higher level components. Some stable associations used in atomic andhigher level component estimation formulas are summarized in Table 3. Thedevelopment and validation of type II models is one of the most active areas ofbody composition research.
P1: NBL/MBL/rkc P2: MBL/mkv QC: MBL/bs T1: MBL
May 5, 1997 15:40 Annual Reviews AR033-24
BODY COMPOSITION 533
Tabl
e3
Exa
mpl
esof
body
com
posi
tion
met
hods
a
Cat
egor
yE
quat
ion
Ref
eren
cem
etho
dR
efer
ence
Type
Ipr
oper
ty-b
ased
met
hods
Fat
=0.
65×
BW
−0.
21×
Ht+
14.1
Ant
hrop
omet
ryFF
M=
0.85
×H
t2 /Z+
3.04
Bio
impe
danc
ean
alys
isSM
=18
.9×
Cre
+4.
124
-hur
inar
ycr
eatin
ine
excr
etio
n51 75
Type
IIpr
oper
ty-b
ased
met
hods
Fat
=4.
95×
BV
−4.
50×
BW
Hyd
rode
nsito
met
ry7
FFM
=5.
50×
BW
−4.
95×
BV
Hyd
rode
nsito
met
ryTy
peI
com
pone
nt-b
ased
met
hods
Prot
ein
=0.
335
×T
BW
−2.
53T
race
rdi
lutio
n5
Type
IIco
mpo
nent
-bas
edm
etho
dsPr
otei
n=
6.25
×T
BN
Prom
pt-
IVN
A14
FFM
=1.
37×
TB
WT
race
rdi
lutio
n59
BC
M=
213
×T
BK
Who
le-b
ody
40K
coun
ting
56Fa
t=
1.30
×T
BC
−4.
45Pr
ompt
-gγIV
NA
and
inel
astic
45×
TB
N−
0.06
×T
BC
ane
utro
nsc
atte
ring
a Abb
revi
atio
n:B
W,
body
wei
ght;
Ht,
heig
ht;
FFM
,fa
t-fr
eebo
dym
ass;
Z,
elec
tric
alim
peda
nce;
SM,
skel
etal
mus
cle;
Cre
,24-
hur
inar
ycr
eatin
ine
excr
etio
n;B
V,b
ody
volu
me;
TB
W,t
otal
body
wat
er;T
B,t
otal
body
;BC
M,b
ody
cell
mas
s;IV
NA
,in
vivo
neut
ron
activ
atio
n.
gγ

P1: NBL/MBL/rkc P2: MBL/mkv QC: MBL/bs T1: MBL
May 5, 1997 15:40 Annual Reviews AR033-24
534 HEYMSFIELD ET AL
A classic type II property-based atomic level method, and a good example, isestimation of total body potassium from the measuredγ -ray decay of naturallyoccurring40K (22). Potassium is predominantly nonradioactive39K, although asmall proportion (0.0118%) consists of radioactive40K. This mixture of potas-sium isotopes also occurs in human tissues, and the 1.46-MeVγ -decay of40Kcan be measured in whole-body counters of variable design. Once the sub-ject’s 40K amount is known, total body potassium (TBK, in millimoles) can beestimated as TBK= 40K/0.0118% (22).
Some atomic and higher level components can be estimated from other knowncomponents by using type I or type II mathematical functions. These arereferred to as component-based methods, and there are a number of them forestimating the 11 main atomic level elements (76). Representative examplesof types I and II property- and component-based methods are presented inTable 3.
IN VIVO NEUTRON ACTIVATION ANALYSIS The most important development inmeasuring atomic level components occurred with accidental radiation expo-sure following nuclear reactor accidents in 1945 and 1946 (40). Ten subjectswere exposed to neutron andγ -ray bursts, following which induced24Na intheir bodies was used as a measure of radiation exposure. Anderson and col-leagues subsequently used controlled neutron irradiation for estimating totalbody Na and Cl in vivo (2). A number of methods have collectively descendedfrom these seminal studies; they are referred to as in vivo neutron activation(IVNA) analysis (5, 12, 13, 18, 20).
As with accidental radionuclide exposure, controlled neutron irradiation in-duces release ofγ -rays from tissue nuclei, and theseγ -rays have element-specific detectable energies. Neutron activation analysis methods can quantifyall of the main elements found in vivo, including total body H, C, N, O, Na, Ca,P, and Cl (52). Total body K can be measured with40K whole-body counting,a procedure included as part of some IVNA protocols.
Neutrons (n) are uncharged nuclear particles with a mass of 1. A number ofmethods produce controlled neutron beams of varying energy that are usefulin IVNA systems. An important feature of neutrons is their intensity, usuallyestimated as the amount of energy per unit of time crossing a unit of area,expressed as kilo electron volts per square meter per second. Neutrons can becharacterized as fast or high energy (>10 keV to 20 MeV) and low energy orthermal (0.2 eV to 10 keV). Fast neutrons are optimum for tissue penetrationand favor some forms of neutron-nuclear interactions. Most neutron-nuclearinteractions of importance to IVNA methods, however, occur with thermalneutrons. Neutron activation systems, therefore, include a fast-neutron sourceand rely on neutron thermalization with tissue interactions.

P1: NBL/MBL/rkc P2: MBL/mkv QC: MBL/bs T1: MBL
May 5, 1997 15:40 Annual Reviews AR033-24
BODY COMPOSITION 535
While there are many possible IVNA neutron sources, several exampleswill provide an overview of general concepts. An important neutron source is238PuBe, which spontaneously undergoes the so-calledα–n reaction:
238Pu→234 U+ α(4He)→9Be+ α(4He)→12 C+ n.→
Alpha particles, consisting of two neutrons and two protons, are equivalent tothe helium nucleus. The resulting fast neutrons are∼3.5 MeV (13).
Another approach is available for generating fast neutrons with a miniatureaccelerator (45). Deuterons, the nucleus (neutron+proton) of the stable isotopedeuterium (2H2O), are accelerated inside a small sealed tube until they reach atritium (3H2O) target. The deuterium-tritium fusion reaction results in heliumproduction and release of 14 MeV neutrons. The neutron generator tube mustbe replaced when component isotopes are exhausted.
Produced fast neutrons interact with tissue nuclei and are absorbed or theyescape from the system through free surfaces (66). Some neutrons lose energyby scattering as they collide with tissue elemental nuclei. The main scatter-ing reaction is elastic, primarily with abundant hydrogen nuclei, and part of theneutron’s kinetic energy is transferred to the incident nucleus and the remainderremains with the recoiling neutron. This reaction is denoted (n, n′) as incidentparticle and emitted particle. Elastic scattering reactions transfer a large pro-portion of neutron energy to incident hydrogen protons as hydrogen is the mostabundant nucleus, the two particles are similar in mass, and hydrogen has alarge collision cross section. Higher energy neutrons, those at or above about6 MeV, also can undergo inelastic scattering, in which some of the neutron’skinetic energy is converted to internal nuclear energy and in the process excitesthe incident nucleus with rapidγ -ray release (n, n′γ ).
Fast neutrons flowing across tissues, thus, are either absorbed or moderatedby a series of elastic and inelastic collisions until thermal equilibrium is reached.The produced thermal neutrons rapidly diffuse through tissues and are capturedwithin a few hundred microseconds by elemental nuclei. This radiative captureincreases the element’s mass by one nucleon and results inγ -ray release atenergies specific to the incident element (12). This important reaction is denoted(n, γ ) in the physics literature.
Two types of neutron-nuclear interactions, thus, produceγ -rays that areuseful in IVNA: inelastic scattering with fast neutrons, and radiative capturewith thermal neutrons. Three representative systems in use at BrookhavenNational Laboratory (BNL), Long Island, provide good examples of the mainIVNA methods in current use (17, 52).

P1: NBL/MBL/rkc P2: MBL/mkv QC: MBL/bs T1: MBL
May 5, 1997 15:40 Annual Reviews AR033-24
536 HEYMSFIELD ET AL
Prompt-γ , neutron activation The BNL prompt-γ neutron activation systemis currently used to measure total body H and N (17, 52). Neutrons with averageenergy,∼3.5 MeV, are released by a collimated238PuBe source positionedbeneath the recumbent subject. A deuterium premoderator ensures uniformityof neutron flux. Radiative thermal neutron capture for14N produces activated15N∗
∼10−15 s
14N+ n −→ 15N∗−→ 15N (stable)+ Eγ (10.83 MeV).
Activated15N∗ decays rapidly, producing stable15N and releasing in the processa characteristic 10.83 MeVγ -ray. γ -Rays produced in the reaction are countedsimultaneously with irradiation, and because their release is rapid (∼10−15 s),the method is referred to as prompt-γ in vivo neutron activation analysis.Sodium iodide detectors quantify producedγ -rays. Two spectral peaks aremeasured, H at 2.223 MeV and N at 10.83 MeV.
Prior to IVNA evaluation, the subject’s total body water is measured bytritium or deuterium dilution. Anthropometric measurements are also made,and equations are then used to estimate the subject’s total body H (17, 52, 66).Hydrogen is then used as an internal standard to estimate total body N. Usinghydrogen as an internal standard eliminates some of the technical concernsrelated to body habitu´es.
Scans are typically carried out from shoulder to knee and require about1 h for completion. The coefficient of variation (CV) for repeated phantommeasurements is 2.8% for total body N with a radiation exposure of 80 mrem.
Delayed-g neutron activationSome thermal neutron capture reactions pro-duce radionuclides with relatively short half-lives. The decay of these radionu-clides with consequentγ -ray emission can be measured within a short timeinterval (∼5–20 min) following irradiation. This approach is referred to asdelayed-γ neutron activation analysis because counting occurs following irra-diation.
The BNL delayed-γ neutron activation system is currently used to measuretotal body Ca, P, Na, and Cl (17, 52). Fast neutrons of∼3.5 MeV are generatedwith 14 encapsulated238PuBe sources positioned above and below the recum-bent subject, who rests for 5 min inside the irradiation chamber. The subject isirradiated with fast neutrons and the reaction for calcium, for example, is
+β −48Ca + n → 49Ca → 49Sc → 49Sc + Eγ (3.084 MeV).→*
The notation for this reaction is given as [48Ca(n, g)49Sc] for [target nucleus

P1: NBL/MBL/rkc P2: MBL/mkv QC: MBL/bs T1: MBL
May 5, 1997 15:40 Annual Reviews AR033-24
BODY COMPOSITION 537
(incident particle, emitted particle) residual nucleus]. The irradiated subjectis then moved to a counting area within 5 min, where the 3.084-MeVγ -raysfrom 49Ca decay are measured in the shielded BNLγ -ray spectrometer overan∼8-min period. Measured counts are converted to absolute total body Cavalues by calibration with an anthropomorphic phantom with enclosed artificialskeleton. The phantom is designed for analysis of components, such as totalbody Ca, that are not uniformly distributed throughout the body.
The CV for total body Ca measurement by delayed-γ neutron activationanalysis is 1.5%, with a radiation exposure of 575 mrem. The delayed-γ BNLsystem also allows measurements of total body Cl, Na, and P with CVs of 1.7%,1.6%, and 2.5%, respectively.
Inelastic neutron scattering The inelastic neutron scattering system at BNLis used for measuring total body C and O. Incoming fast neutrons that interactwith matter by inelastic collisions result in prompt nuclear deexcitation withγ -ray release (n, n′γ ). The reaction for carbon is
n′12C + n → 12C 12C + Eγ (4.44 MeV).→→*
Increasing the energy of produced neutrons augments the probability of in-elastic scattering reactions, such as this one for carbon, that have fast-neutronthresholds.
The BNL inelastic neutron scattering system is based on a miniature D,Tsealed-tube, pulsating (4–10 kHz) neutron generator positioned beneath therecumbent subject. The 4.44-MeVγ -rays produced by inelastic scattering of Care detected by two bismuth germanate crystals positioned on each side of thesubject. Detected counts measured over 30 min as the subject moves over theneutron cloud in both supine and prone positions are converted to total body Cbased on reference phantom calibrations. The BNL inelastic neutron scatteringsystem CV is 3.0% for total body C, with a radiation exposure of 50 mrem.
Representative protocolThe three BNL IVNA systems and whole-bodycounter are all located near each other. Subjects arrive in the early morn-ing and are given an informed consent to sign. They are then evaluated fortotal body K in the whole-body counter and for tritium dilution volume. Theestimate of tritium dilution volume is used in developing the total body watercomponent for multicompartment models and also contributes with anthropo-metric measurements to derivation of total body H. The subject’s predicted totalbody H is used as an internal standard for total body N estimation by prompt-γ
neutron activation analysis. The three IVNA studies are then completed, and

P1: NBL/MBL/rkc P2: MBL/mkv QC: MBL/bs T1: MBL
May 5, 1997 15:40 Annual Reviews AR033-24
538 HEYMSFIELD ET AL
subjects are discharged in the early afternoon. The collective studies allowmeasurement of total body H, C, N, Na, K, Ca, Cl, and P.
The BNL systems are representative of IVNA installations throughout theworld (5, 6, 12, 13, 66). Each system has special characteristics, although allare based onγ -ray release with neutron tissue-matter interactions.
Role in body composition researchNeutron activation systems are costly andrequire a skilled group of investigators to maintain and operate. As a result, thereare only a few centers in the world that have resources similar to those at BNL.The importance of these facilities is that elemental analysis allows reliable andreproducible reconstruction of molecular level components such as total bodyfat, protein, and mineral (38). This important characteristic of IVNA methodspositions them as uniquely qualified to serve as reference methods, particularlyin conditions in which unstable component associations render many currentlyavailable methods inaccurate.
MOLECULAR LEVEL
Molecular level body composition components are integral to research in manynutrition areas, including energy, protein, and lipid metabolism, bone mineralhomeostasis, and water balance.
Components and Their RelationshipsThe many different chemical compounds found in the human body can beclassified into five main groups: lipids, water, proteins, carbohydrates (i.e.glycogen), and minerals (Figure 2) (77). Subfractions of components can alsobe defined, as for example the triacylglycerol or fat portion of lipid, the extraand intracellular portions of total body water, and bone and soft-tissue minerals.
Lipids are defined as chemical compounds that are soluble in lipid solventssuch as diethyl ether and chloroform (29). The most abundant lipid species inhumans are the triacylglycerols, which generically are often referred to as fats.Some authors inaccurately use the term fat in reference to total lipids, addingsome confusion to the published literature. The non-fat lipids include phospho-lipids, sphingolipids, and steroids. In humans triacylglycerols or nonessentiallipids are energy storage compounds, while the remaining lipid species areessential in various biochemical and physiological processes.
Water is mixed with electrolytes in vivo and bound ionically to varyingdegrees with protein, glycogen, and other polar chemical compounds. Wateris distributed into the intracellular and extracellular compartments, and theextracellular water compartment includes five subcompartments: interstitial,plasma, connective tissue, bone, and gastrointestinal tract (22, 76).

P1: NBL/MBL/rkc P2: MBL/mkv QC: MBL/bs T1: MBL
May 5, 1997 15:40 Annual Reviews AR033-24
BODY COMPOSITION 539
Figure 2 Molecular level components.
There are many different families of proteins, but noninvasive body compo-sition methods are available only for estimation of total protein (14) and muscleand non-muscle proteins (13).
There is less than 1 kg of glycogen in healthy adults; the remaining carbohy-drates are considered negligible (16, 72). The two main intracellular glycogenpools are in liver (∼1% wet weight) and skeletal muscle (∼2% wet weight)(72). Until recently, most of the available information on glycogen in vivo wasobtained with biopsies of selected muscle groups. The growing availability ofnuclear magnetic resonance spectroscopy systems for human use is providingnew noninvasively obtained information on the amount of and dynamic changesin intracellular glycogen (44).
Minerals comprise about 5% of body weight in healthy adults and are dis-tributed in two main compartments: bone minerals and non-bone or soft-tissueminerals. The main constituent of bone minerals is calcium hydroxyapatite[Ca3(PO4)2]3Ca(OH)2 (38), with small contributions made by Na, K, Mg,and Cl. Soft-tissue minerals include well-known ions such as Na+, K+, Cl−,HPO4
2−, and HCO3− (38).
Although there are five main molecular level components, it is common tocombine components in order to develop body composition methods. For exam-ple, the molecular level can be described as any of the following combinations:a two-compartment model in which body weight (BW)= fat+ fat-free body

P1: NBL/MBL/rkc P2: MBL/mkv QC: MBL/bs T1: MBL
May 5, 1997 15:40 Annual Reviews AR033-24
540 HEYMSFIELD ET AL
mass, and BW= lipid + lipid-free body mass; a three-compartment model inwhich BW = fat+ water+ residual (i.e. the sum of glycogen, minerals, andprotein) (76), and BW= fat + bone mineral+ lean soft tissue; and a four-compartment model in which BW= fat+ water+ minerals+ residual (i.e.the sum of glycogen and protein). There still remains some uncertainty in thesevarious models on inclusion of the nontriacylglycerol essential lipid component.
Many stable relationships recognized for the molecular level are integral tothe body composition methodology area (Table 1). One of the most importantfeatures of molecular level components from the methodology perspective istheir physical density. This is because whole-body density is relatively easy tomeasure accurately in most children and healthy adults (26), and many molec-ular level models are based on density or closely related body volume (39, 49).Three components—water, glycogen, and triacylglycerols (i.e. fat)—are ho-mogeneous or approach homogeneous chemical moieties from the body com-position viewpoint. Accordingly, their densities at body temperature were eas-ily established by early investigators using conventional gravimetric methods.Protein, bone mineral, and soft-tissue mineral are heterogeneous with respectto composite amino acids, minerals, and electrolytes, and their densities weremore difficult to estimate. Representative bone samples, for example, can beexposed to>500◦C for a prolonged period, and the density of the remainingash can be measured with gravimetric methods (38).
The density of combined components such as fat-free body mass can becalculated by assuming relatively stable proportions among the various con-stituent chemical components (7). The calculated and assumed constant densi-ties of combined molecular level components are the basis of two-, three-, andfour-component molecular level models, which are formulated on body densityor volume measured with underwater weighing (7) or newer air displacementplethysmograph systems (55).
Other important stable relationships at the molecular level include the hy-dration (59) and potassium content (22) of fat-free body mass (Table 2).
Measurement MethodsThere are many methods for estimating molecular level components. As someof these methods are reviewed in detail elsewhere (62), we concentrate on recentmethodological developments.
Some measurable body properties—such as impedance to an electrical cur-rent, attenuation of X-rays, and ultrasonic waves, body weight, and bodyvolume—can be used in developing molecular level methods (22). We now ex-amine several of these methods, with the aim of reviewing their underlying phys-ical basis and application in the broader area of body composition methodology.

P1: NBL/MBL/rkc P2: MBL/mkv QC: MBL/bs T1: MBL
May 5, 1997 15:40 Annual Reviews AR033-24
BODY COMPOSITION 541
BIOIMPEDANCE ANALYSIS Bioimpedance analysis (BIA), the subject of an ex-tensive multi-author publication organized by the Nutrition Coordinating Centerat the National Institutes of Health, has important potential as a field body com-position method (23). Most body composition methods are costly and difficultto transport and require specialized teams for their maintenance and optimumperformance. In contrast, BIA systems are usually inexpensive, easy to carryfrom one site to another, and simple to operate. BIA, therefore, is a usefulsupplement to anthropometry.
In the BIA method, an alternating current at one or more frequencies isintroduced via electrodes across a tissue bed, and impedance (voltage drop) toelectrical flow is detected. Impedance is the opposition of tissue to current flowand is the inverse of conductance. Electrolyte-rich fluids such as body waterpose the least impedance to electrical flow, while lipids and bone mineralsprovide the most (3). Accordingly, impedance and its two main components,resistance and reactance, are primarily determined by the volume of fluid presentin the electrical pathway. Many BIA prediction formulas at specific electricalfrequencies are available for estimation of total body water and its two mainsubcompartments, extracellular and intracellular water (23). Fluids and waterform relatively stable relationships with other components, and BIA methodsare often designed to quantify fat-free body mass and, indirectly, fat (i.e. bodyweight minus fat-free body mass). All currently used BIA approaches are typeI, which are reference-method dependent.
In the standard whole-body BIA method, electrodes are placed on the handand foot, although increasing attention is focusing on segmental measurements,since impedance appears to be determined mainly by the arms and legs. Strin-gent measurement conditions are recommended for BIA, and prediction formu-las must always be validated (23). There is growing use of BIA in field studies ofbody composition, and a rapidly expanding area is the use of impedance meth-ods for clinically evaluating subjects with altered hydration, such as dialysispatients (23).
An important limitation of BIA methods is that many underlying assumptionsare required, and some of these either have not yet been adequately exploredor are known to be inaccurate. For example, traditional BIA methods employa geometric model that assumes the component of interest is homogeneous incomposition and uniform in cross-sectional area (50, 51). The typical electricalpathways used with BIA in humans fail to conform to such idealized conditions.
Similar concerns related to BIA validity are now undergoing critical analysisby investigators actively engaged in body composition research. Bioimpedancemethods, therefore, should be used only under appropriate and carefully con-trolled conditions.

P1: NBL/MBL/rkc P2: MBL/mkv QC: MBL/bs T1: MBL
May 5, 1997 15:40 Annual Reviews AR033-24
542 HEYMSFIELD ET AL
DUAL ENERGY X-RAY ABSORPTIOMETRY Francis Moore, one of the pioneersin body composition research, tried with limited success 30 years ago to es-timate skeletal weight in vivo (57). The introduction of IVNA for total bodycalcium measurement in 1964 (2) led to the first analysis of bone in livingsubjects. However, IVNA exposes subjects to radiation, and studies in healthychildren and young women are not usually recommended. A new strategy forestimating bone mineral was introduced in 1963 by Cameron & Sorenson (11).A radionuclide source was placed on one side of a subject’s wrist, a locationwith minimal soft tissue, and a photon detector was placed on the opposite sideof the wrist. Atomic interactions between radionuclide-emitted photons andelements within bone mineral attenuated the photon beam, and reduced fluxwas measured in the photon detector. The technique, which became known assingle photon absorptiometry, was an important development in the assessmentof wrist bone mineral content.
The bone mineral content of the hip and spine are also important in the study ofosteoporosis. Photons passing through soft tissues overlying hip and vertebralbones are attenuated not only by bone minerals but by soft tissues as well.The problem of non-bone photon attenuation was solved by treating the photonpathway as a two-component mixture consisting of bone minerals and softtissue. Two photon energies, typically provided by radionuclide sources, wereused to estimate the bone mineral and soft-tissue content of each pixel. Knownoriginally as dual-photon absorptiometry, the recent use of X-ray photon sourcesled to methods collectively referred to as dual energy X-ray absorptiometry(DXA) (54). Moore’s hope of measuring the skeleton has been fulfilled ona wide scale. Most large hospitals in the United States have available DXAsystems for whole-body and regional bone mineral evaluation.
In order to solve for pixel bone mineral, DXA systems must also establishattenuation characteristics of overlying soft tissues. These characteristics, ex-panded upon in the following sections, also allow estimation of fat and fat-freesoft tissues. Most DXA systems with appropriate software are therefore nowcapable of estimating whole-body and regional bone mineral, fat, and fat-freesoft tissues (Figure 3). As extremity fat-free soft tissue is mainly muscle, ex-cept for a small amount of skin and connective tissue, DXA also is capable ofproviding appendicular skeletal muscle mass estimates (37).
The DXA physical concept is not complicated, although actual implementa-tion and software development is complex. The system X-ray source producesa polychromatic photon spectrum. Two main energy peaks are then createdusing one of two strategies: electrically pulsing the X-ray tube, or allowingthe X-rays to pass across a rare earth cerium or samarium k-edge filter (73).Exponential attenuation of photons occurs as they pass across the subject’stissues secondary to two main types of interaction, Compton scattering and

P1: NBL/MBL/rkc P2: MBL/mkv QC: MBL/bs T1: MBL
May 5, 1997 15:40 Annual Reviews AR033-24
BODY COMPOSITION 543
Figure 3 DXA molecular level model. The lean component as shown in the figure is equivalentto fat-free body mass. (From Reference 60 with permission.)
photoelectric effect (42, 43, 73, 78). Diminished photon intensity for each ofthe energies is recorded by appropriately positioned detectors. The attenuationcharacteristics are used to estimate the fraction of each component in the eval-uated pixel: soft tissue plus bone mineral in pixels with bone; and fat plus leansoft tissue in pixels with soft tissue alone.
X-ray attenuation in human tissues at typical DXA energies is related mainlyto the type and proportion of elements present and to photon energy (28).Elements with low atomic numbers (e.g. H and C) minimally attenuate photons,while elements with higher atomic numbers (e.g. Ca and P) strongly attenuatephotons. As photon energy is increased, there is less photon attenuation.
The degree to which an element attenuates photons can be expressed as anexperimentally measured constant referred to as the mass attenuation coeffi-cient. Each element has a characteristic mass attenuation coefficient (µ/ρ) atany specified photon energy. It can be shown mathematically that the ratio ofphoton attenuation at DXA’s two main energies for any element is equivalent tothe ratio of the element’s energy-specific mass attenuation coefficients. Massattenuation coefficients can also be calculated for chemical level componentsaccording to their elemental composition.
A convenient expression that relates attenuation at the two DXA energies istheR value, which is the ratio of attenuation at the low- to high-energy peak

P1: NBL/MBL/rkc P2: MBL/mkv QC: MBL/bs T1: MBL
May 5, 1997 15:40 Annual Reviews AR033-24
544 HEYMSFIELD ET AL
(28). For example, theRvalue for a hypothetical pure hydrogen tissue would beequal to the ratio of hydrogen’s energy-specific mass attenuation coefficients.At typical energies, such as 40 and 70 keV,µ/ρ for hydrogen are 0.3458 and0.3175 with anR value of 1.0891. For complex mixtures, such as are presentwith real tissues, the measuredRvalue reflects the mass fraction of each elementpresent (60).
In concept, DXA systems measure theRvalue of each pixel (27, 60). Whenconsidering only those pixels with soft tissue, fat has a relatively large amountof lower-Rcarbon (R = 1.2199), whereas lean soft tissue has a relatively largeamount of higher-Roxygen (R= 1.4167), nitrogen(R = 1.3043), and residualelectrolytes and minerals (Figure 4). For the Reference Man (72), the theoret-ical R values for fat and lean soft tissue at 40 and 70 keV are 1.21 and 1.37,respectively. Fat and lean, thus, have different elemental proportions andRval-ues. A phantom, consisting of animal soft tissues, can be made with varyingamounts of fat and lean. When scanned, there will be a highly significant corre-lation between measuredRand the proportion of phantom soft tissue as fat (60).
Figure 4 Mass fraction of main elements in lean soft tissues, fat, and bone mineral based onReference Man (72). Residual mass represents the sum of Na, Mg, P, S, Cl, K, Ca, and traceelements. The respective calculatedR values at 40 and 70 keV for fat, lean, and bone mineral are1.21, 1.37, and 2.86, respectively (60).

P1: NBL/MBL/rkc P2: MBL/mkv QC: MBL/bs T1: MBL
May 5, 1997 15:40 Annual Reviews AR033-24
BODY COMPOSITION 545
Thus, the phantom, or some other similar calibration standard, can be used todevelop either anRvalue prediction equation or by extrapolation specific purefat and leanRvalues. Alternatively, prediction equations based on measuredRvalues can be developed in vivo for body fat or closely related adipose tissue.How to appropriately calibrate and cross-validate DXA systems is an importantquestion now receiving the attention of a number of investigators. CalibratedDXA systems can thus provide estimates of fat and lean for soft tissue pixels.
Pixels that contain bone require a different analytical strategy. There exist ineach of these pixels three components: fat, lean soft tissue, and bone mineral.With two energies, DXA in theory can only resolve a two-component mixture,as was shown for soft tissue. TheR value for pure bone mineral is easilyascertained from human bone or other similar phantoms. However, soft-tissuecomposition is variable in fat, and therefore theRvalue for soft tissue overlyingbone cannot be assumed constant. In the first analytical step following theDXA scan, pixels with and without bone are easily identified by using severalmathematical procedures, including the recognition that bone minerals have ahigh R value and that measured pixels with highR values most likely containbone. TheRvalue for soft tissue overlying bone is estimated using mathematicalmodeling procedures and is based on the measured soft-tissueRon either sideof the bone (60). With the soft-tissue and bone mineralRvalues now known, theamount of fat, lean soft tissue, and bone mineral in the pixel can be ascertained.This DXA analytical strategy thus allows estimation of three components basedon measured attenuation of two main energy peaks.
Although there are many variable characteristics of DXA systems, all share incommon the assumed elemental proportions of fat, lean, and bone mineral com-ponents, each with known and constant attenuation characteristics (Figure 4).Thus, DXA is a property-based type II method.
Many studies have now examined DXA accuracy and reproducibility in bothanimals and humans. With respect to accuracy, DXA fat and bone mineralestimates in species ranging widely in body size are highly correlated withcorresponding criterion estimates, such as chemical analysis of cadavers andIVNA. In some cases there exists bias between DXA and criterion estimates, al-though this problem is often considered a correctable calibration problem. Bodycomposition estimates by DXA usually are highly reproducible, with repeatedmeasurements over one day in the same subject demonstrating CVs of about 1%for total body bone mineral, 2% for fat-free soft tissue, and 0.8% for fat (56).
MULTICOMPARTMENT MODELS Until recently, whole-body chemical analysisof human cadavers was required for establishing the accuracy of in vivo meth-ods and for exploration of relationships between components. Cadaver analy-sis remains important, but investigators are increasingly able to simultaneously

P1: NBL/MBL/rkc P2: MBL/mkv QC: MBL/bs T1: MBL
May 5, 1997 15:40 Annual Reviews AR033-24
546 HEYMSFIELD ET AL
measure several chemical compartments in an individual subject by using mul-ticompartment models.
There are many published multicompartment models, and more are possi-ble. All multicompartment models share in common their development fromsimultaneous equations, which may include two or more unknown compo-nents. As a general rule, for each unknown component estimated there mustbe one independent equation that includes the unknown component, the knowncomponent, and/or the measurable property. Measurable molecular level com-ponents include total body water by isotope dilution (22), total body protein byneutron activation of total body nitrogen (13), glycogen (regional) by nuclearmagnetic resonance spectroscopy (44), and bone and soft-tissue minerals byactivation of total body calcium (5, 18, 65), whole-body40K counting (22), andDXA (54). Measurable properties used in developing molecular level multi-component models include body weight and body volume.
A representative model for estimating total body fat from measured carbonand other elements begins with the following basic formula:
Total body C= 0.77× fat+ 0.53× protein+ 0.444× glycogen
+ C in bone mineral.
This model links atomic level carbon to molecular level components. Thecoefficients are assumed proportions of molecular level components as carbon.The next two models assume that protein is 16% nitrogen and that the ratio ofglycogen to protein is constant, respectively:
Protein= 6.25× total body nitrogen,
and
glycogen= 0.044× protein.
This fourth model assumes that the ratio of bone mineral carbon to bone mineralcalcium is constant:
Bone mineral in carbon= 0.05× bone mineral calcium.
These four formulas can then be solved for fat mass as (45)
fat= 1.30× TBC− 4.45× TBN− 0.065× TBCa.
There are two important families of multicompartment models. The first ofthese, in vivo neutron activation analysis multicompartment models, evolvedfrom the relatively simple four-compartment model: BW= water+ protein+mineral+ fat (32). Water in this model is usually estimated from tritium or deu-terium dilution volumes. Protein and mineral are estimated from models based

P1: NBL/MBL/rkc P2: MBL/mkv QC: MBL/bs T1: MBL
May 5, 1997 15:40 Annual Reviews AR033-24
BODY COMPOSITION 547
Table 4 Models for estimating total body fat mass based on measured body weight and volumea
Measurable KnownModel properties components(s) Reference
2-CompartmentFat = 4.95× BV − 4.50× BW BV, BW none 7
3-CompartmentFat = 2.057× BV − 0.786× TBW − 1.286× BW BV, BW TBW 70
4-CompartmentFat = 6.386× BV + 3.961× mineral− 6.09× BW BV, BW mineral 48Fat = 2.75× BV − 0.714× TBW + 1.148× mineral BV, BW TBW, mineral 4
− 2.05× BWFat = 2.75× BV − 0.714× TBW + 1.129× Mo BV, BW TBW, Mo 68
− 2.037× BWFat = 2.513× BV − 0.739× TBW + 0.947× Mo BV, BW TBW, Mo 39
− 1.79× BW
aAbbreviations: BV, body volume (liters); BW, body weight (in kilograms); TBW, total body water (inkilograms) Mo, bone mineral.
on total body N and Ca, respectively. Fat is usually an unknown componentand is considered the difference between body weight and the three estimatedcomponents. Over the years this simple model was refined by investigators to in-clude separate estimates for bone and soft-tissue minerals and glycogen (32, 38).One of the more recent advances is the addition of total body fat estimates fromtotal body carbon using a similar model to the one presented above (38).
A good example of neutron activation analysis model implementation isthe BNL six molecular level–compartment model. Over the course of about4 h, subjects complete whole-body counting, tritium dilution, and prompt-γ ,delayed-γ , and inelastic scattering neutron activation analysis studies. Elevenelements are measured or calculated, as noted earlier, and from these elementssix molecular level compartments are derived (fat, protein, glycogen, water,soft-tissue mineraals, and bone minerals).
The second family of molecular level multicompartment models, those basedon body volume estimation, derives from the observation that physical densi-ties of molecular level components are known and relatively constant at bodytemperature. Examples of these models that are used to estimate total body fatare presented in Table 4.
Behnke and his colleagues in 1942 first introduced the modern underwaterweighing method as a means of estimating body density (7). Behnke and otherswho followed developed two-compartment models for estimating fat and fat-free body mass from measured body volume and body weight. The model wasexpanded to three compartments by Siri in 1961, who added total body waterestimates to measured body volume and weight to derive fat and residual mass(i.e. protein, glycogen, and minerals) (70). The introduction of dual photonmethods for estimating bone minerals in the past decade allowed development

P1: NBL/MBL/rkc P2: MBL/mkv QC: MBL/bs T1: MBL
May 5, 1997 15:40 Annual Reviews AR033-24
548 HEYMSFIELD ET AL
of four-compartment models (i.e. fat, water, minerals, and combined proteinplus glycogen), some of which are summarized in Table 4.
A typical four-compartment study requires several hours for completion,usually beginning with isotope dilution for total body water and measurementof body weight. Underwater weighing and DXA studies then follow for bodyvolume and bone mineral estimation, respectively. Four measured variables—total body water, body weight, body volume, and bone mineral mass—are thenused to calculate total body fat. The mass of glycogen is often considerednegligible in four-component calculations, as the amount present, particularlyafter an overnight fast, is relatively small. The underwater weighing techniquerequired for developing multicompartment body volume models are found inmany centers throughout the world.
Multicompartment models are used in body composition research when in-vestigators are interested in examining the effects of physiological or otherprocesses on several compartments. Another application is when accuratecomponent estimates are desired, particularly in unstable or non–steady stateconditions. Fat estimates by the conventional two-compartment model wouldnot be accurate following an intervention that produces disproportionate fluidaccumulation. This is because the two-compartment model assumes stable fat-free body mass hydration. In contrast, some models used in multicompartmentmethods tend to be more stable and are usually insensitive to altered fluid bal-ance and other similar effects. For example, the method of estimating totalbody fat from carbon, nitrogen, and calcium is unaltered in accuracy regardlessof the subject’s hydration. Multicompartment models are also used at otherbody composition levels.
CELLULAR LEVEL
There are over 1018cells in the human body that are bathed in extracellular fluidand supported by a framework of extracellular solids. The cell level’s impor-tance is centered primarily on the protoplasmic or intracellular compartment,which is the site of most metabolic processes.
Components and Their RelationshipsThe traditional cellular level model consists of three components: cell mass, ex-tracellular fluid, and extracellular solids (Figure 1). The extracellular solids arenot of much clinical interest, as they consist mainly of bone minerals and col-lagen, reticular, and elastic fibers (77). Extracellular fluid is slightly larger thatextracellular water, also a molecular level component, as it includes dissolvedelectrolytes and proteins. The cell mass component is of interest primarily forthe metabolically active protoplasm that includes cytoplasmic organelles andmitochondria found within the intracellular space. Adipocytes, and to a small

P1: NBL/MBL/rkc P2: MBL/mkv QC: MBL/bs T1: MBL
May 5, 1997 15:40 Annual Reviews AR033-24
BODY COMPOSITION 549
extent other cells, store triacylglycerols within the intracellular compartment.Moore and his colleagues in the 1960s introduced the body cell mass conceptas a means of quantifying the metabolically active fat-free portion of the intra-cellular space (57). Today the most widely used cellular level model is BW=fat+ extracellular fluid+ extracellular solids+ body cell mass.
There a many relatively stable cellular-level relationships that are used inbody composition research, and some of the more important of these are asfollows: K/intracellular water= 159 mmol of K /kg of H2O = 6.22 g of K/kgof H2O; K/body cell mass= 4.69 g/kg; Ca/extracellular solids= 0.177 kg/kg;and extracellular water/extracellular fluid= 0.92.
Measurement MethodsBody cell mass is the most important measurable component at the cellularlevel. Conceptually, body cell mass consists of two portions: an intracellularfluid component, and an intracellular solid component. There are no methodsavailable for estimating intracellular solids. The usual approach in estimatingbody cell mass is to assume a stable relationship between measurable intracel-lular fluid and unmeasurable intracellular solids. Alternatively, investigatorsreport only their measurements of intracellular fluid as an index of the bodycell mass component.
Two strategies are employed for intracellular fluid measurement. The first is toassume that potassium is distributed mainly into the intracellular compartmentand maintains a relatively constant concentration of 150 mmol/liter. There arethree main methods of quantifying body potassium: whole-body40K counting;dilution of 42K or 43K; and as the exchangeable component estimated fromtotal body water, exchangeable sodium, and serum water/electrolytes (69). Thesecond approach is to calculate intracellular water by using multicomponentmodels based on total body water and extracellular water estimates. A number ofdilution methods are available for estimating total body and extracellular watercomponents (22). Calculation of body cell mass from intracellular fluid or waterassumes a constant proportion of body cell mass as intracellular solids. Theclassic body cell mass formula of Moore et al (57), which is based on totalbody or exchangeable K, assumes that all of measured K is intracellular, thatthe K/intracellular water is 150 mmol/liter, and that intracellular water/bodycell mass is about 0.80. Accordingly, body cell mass= total body K (mmol)× 0.0083.
TISSUE-SYSTEM LEVEL
Components and Their RelationshipsThe main tissue-system level components are adipose tissue, skeletal mus-cle, bone, visceral organs, and brain. Adipose tissue is further divided into

P1: NBL/MBL/rkc P2: MBL/mkv QC: MBL/bs T1: MBL
May 5, 1997 15:40 Annual Reviews AR033-24
550 HEYMSFIELD ET AL
subcutaneous, visceral, yellow marrow, and interstitial subcomponents (72,77).
Some reasonably stable relations at the tissue-system level include: skeletalmuscle/adipose tissue free body mass= 0.54 (for men) or 0.49 (for women);K/skeletal muscle= 3 g/kg; fat/adipose tissue= 0.8; and bone mineral/bone= 0.54 (72).
Measurement MethodsTHREE-DIMENSIONAL IMAGING Until recently, estimation of tissue-systemlevel components was accomplished with relatively inaccurate methods such asanthropometry. Today, both computerized axial tomography (CT) and MRI canquantify all major tissue-system level components (Figure 1). Two-dimensionalstandard radiography was first used to capture adipose tissue and skeletal mus-cle shadows by Stuart and colleagues in the early 1940s (74). By the beginningof the 1950s, radiogrammetry, as it was called, allowed investigators to estimatesubcutaneous adipose tissue layer thickness and muscle widths (25). Hounsfieldintroduced three-dimensional CT for brain imaging in 1971 and first reportedhis seminal observations in 1973 (41). The method proliferated rapidly, andby the late 1970s, CT systems were installed in most major medical centers.Heymsfield and colleagues between 1979 and 1981 reported the use of CT tomeasure skeletal muscle mass, visceral organ volumes, and visceral adiposetissue (31, 33–35). Borkan and his group reported their classic visceral adiposetissue studies with CT in 1982 (10), and in 1986, Kvist et al published for thefirst time assessment of whole-body adipose tissue volumes with multislice CT(47). The method reported by Kvist et al in Sweden involved preparation of22 or more cross-sectional CT images at well-defined anatomic locations fol-lowed by calculating total volumes of various body composition componentsby integration of appropriate slice areas and distance between slices.
MRI and its precursor, nuclear magnetic resonance spectroscopy, originatedwith the fundamental studies of Bloch et al (9) and Purcell et al (61), reported in1946. By the early 1970s, Damadian was preparing images of phantoms usingproton nuclear magnetic resonance signals (15). Early clinical applications ofMRI using small bore magnets were first reported in 1978, and within a fewyears, several researchers described a variety of MRI procedures using whole-body large bore magnets (53). The utility of MRI to discriminate betweenanatomical structures in both the abdomen and the musculoskeletal regionswas first reported in the early 1980s. By the mid-1980s, MRI systems becameavailable in hospitals throughout North America.
Foster at al (23a) were the first to use MRI in body composition researchwhen, in 1984, they demonstrated in cadavers that MRI could distinguish be-tween adipose tissue and skeletal muscle. Hayes and colleagues in 1988 first

P1: NBL/MBL/rkc P2: MBL/mkv QC: MBL/bs T1: MBL
May 5, 1997 15:40 Annual Reviews AR033-24
BODY COMPOSITION 551
characterized with MRI subcutaneous adipose tissue distribution in human sub-jects (30). In 1991, Fowler et al obtained 28 MRIs over the whole body (24),and in 1992, Ross et al reported a 41-image model for measuring adipose andlean tissue distribution (64). Both CT and MRI are now widely used for regionaland whole-body analysis of tissue-system level components.
CT and MRI are composed of picture elements, pixels, which are usuallysquares 1 mm× 1 mm and which have a third dimension related to slice thick-ness. Volume elements are referred to as voxels. Voxels have a gray scale thatreflects tissue composition and provides image contrast. Component estimatesby both CT and MRI are expressed as volumes unless they are subsequentlyconverted to mass units by assuming constant tissue densities (e.g. 0.92 kg/literfor adipose tissue and 1.04 kg/liter for skeletal muscle).
CT systems consist of a rotating X-ray tube and detector, which move in a per-pendicular plane to the subject. The CT X rays are attenuated as they penetratetissues and Fourier analysis or filtered back-projection are used in reconstructingthe image. The CT number, assigned to each pixel, is a measure of photon atten-uation relative to air and water (71). Air [−1000 Hounsfield units (HU)], adi-pose tissue (−90 to−30 HU), non-adipose lean tissues (−29 to+151 HU), andskeleton (+152 to+2500 HU) pixels all have characteristic CT number rangesthat allow their separation into specific tissue areas within a cross-sectionalimage. Tissue areas can be used in monitoring the same subject over time or incomparing subjects to each other. Combining information from multiple slicesallows reconstruction of a whole organ or whole-body tissue volume.
The fundamental MRI concept is based on interaction between nuclei ofabundant hydrogen atoms and magnetic fields produced and controlled by thesystem’s instrumentation. Protons, the hydrogen nucleus, have a magnetic mo-ment that causes them to function as small magnets. Under usual conditions inthe earth’s weak magnetic field, these magnetic moments are randomly oriented,and they tend to cancel each other. When a subject is placed inside the scanner’shigh-field strength magnet proton, magnetic moments tend to align themselveslongitudinally to the external magnet’s field. A pulsed radio-frequency (RF)field is then applied to body tissues, causing some of the aligned hydrogen pro-tons to absorb energy. Switching off the RF field allows protons to graduallyassume their original positions and to release in the process absorbed energy.This signal generated by energy release is used to create MRIs.
The time (T ) it takes for the protons to return to their original positions isa function of two parameters, longitudinal relaxation time (T1) and transverserelaxation time (T2). The longitudinal relaxation time is a constant that isdependent on the interaction between relaxing proton spin and the surroundingmedium. TheT1 for protons in fat is much shorter (∼1/4) when comparedwith T1 values for protons in water, and therefore it is possible to generate

P1: NBL/MBL/rkc P2: MBL/mkv QC: MBL/bs T1: MBL
May 5, 1997 15:40 Annual Reviews AR033-24
552 HEYMSFIELD ET AL
images with good adipose and non-adipose tissue contrast. Optimum imagecontrast requires selection of an RF pulse sequence that properly exploits theT1differences between the two tissues. This is accomplished by varying what areknown as the RF pulse time-to-repeat (TR) and time-to-echo (TE) parameters.One such sequence, spin-echo, varies theTR parameter to take advantage ofT1 differences and, thus, provides the tissue contrast required to generate high-quality images. TheT1-weighted spin-echo RF pulse sequence is commonlyused in body composition research.
TheT2 parameter is a time constant related to the interaction between relaxingproton spins. TheT2-weighted images are used to characterize the acute effectsof exercise on skeletal muscle (36).
To obtain MRI data, the subject is positioned in the magnet’s bore in either aprone or a supine position. Typically, a 320-mm region of the body is imagedin a single acquisition. The time required to obtain multiple (i.e. seven) imagesis the same as that required to obtain a single image. Therefore, in most MRIstudies, multiple images of a given region are obtained in a single acquisition.The procedures typically are used to acquire MRI data over the whole body,and an example of images obtained in the abdomen and appendicular regionsare presented in Figure 5. Note that the MRI pulse-sequence used to image the
Figure 5 Three magnetic resonance images in a healthy adult, one from the abdomen and twofrom the appendicular region. The images were acquired using aT1-weighted, spin-echo pulsesequence. With this protocol, adipose tissue appears white and non-adipose tissue is dark on allimages.

P1: NBL/MBL/rkc P2: MBL/mkv QC: MBL/bs T1: MBL
May 5, 1997 15:40 Annual Reviews AR033-24
BODY COMPOSITION 553
abdominal region requires 26 s. During this time the subject is asked to hold hisor her breath, a procedure that substantially reduces respiratory motion artifacts.
In the published literature, MRI data appear either as areas (square centime-ters), obtained from a single image, or as volumes (cubic centimeters), derivedby using tissue area measurements from multiple images. The first step in tissuearea measurement is to count the number of pixels that make up the tissue ofinterest (36). The tissue area is subsequently determined by multiplying thenumber of pixels by their known area. The volume of a tissue for the wholebody or a given region is derived in two steps. First, the volume for each imageis obtained by multiplying the area of the tissue by image thickness. Whole-body or regional volume is then calculated by using a mathematical formulathat sums truncated cone volumes defined by pairs of consecutive images.
The CV for repeated measures of subcutaneous adipose tissue ranges from1% to 10% (36). The CV for visceral adipose tissue estimates is higher, 6% to11%, as a result of measurement errors associated with respiratory motion. Forskeletal muscle, the CV for repeated measurements in the appendicular regionranges from 0.3% to 2.3%.
Validation There are extensive validation studies for CT and MRI, whichinclude phantoms and human and animal cadavers. In this section, we provideseveral representative examples of CT and MRI validation experiments.
Imaging methods can be evaluated in phantoms and excised organs and tis-sues. Water-filled balloons, excised human kidneys, livers, and spleens, andorgans from two human cadavers were examined by multislice CT (31, 33–35). The mean absolute difference between actual weight and CT-derivedweight was 2.6%, 4.6%, and 5.6% for balloons, excised organs, and in situorgans, respectively. In another cadaver experiment, Rossner and colleagues(65) compared adipose tissue estimates by CT with corresponding planimetrymeasurements of corresponding band-sawed slices from two male cadavers.There were strong correlations between the two types of area estimates (r =0.77–0.94). Human cadavers were also used by Abate et al (1) to examine thevalidity of MRI abdominal subcutaneous and visceral adipose tissue estimates.The overall agreement between dissection weight and MRI-estimated adiposetissue weights was 6%.
There are many animal CT and MRI validation studies. For example, Rosset al examined whole-carcass chemically extracted lipid in rodents and founda good correlation with MRI-adipose tissue mass (r = 0.97,P < 0.01) (63).There are also CT and MRI validation studies in larger animals, such as pigs,and here, too, the overall agreement between chemical analysis and imagingmethod is good.
Taken collectively, these studies support the validity of regional and total-body CT and MRI tissue-system level estimates.

P1: NBL/MBL/rkc P2: MBL/mkv QC: MBL/bs T1: MBL
May 5, 1997 15:40 Annual Reviews AR033-24
554 HEYMSFIELD ET AL
Interpretation The recent study of Bhasin and colleagues demonstrates someimportant aspects of CT and MRI data interpretation (8). The investigatorsinduced skeletal muscle growth with supraphysiologic doses of testosteronein normal men. Hormone-treated men showed a significant increase in anMRI-measured quadriceps cross-sectional area (P < 0.001), whereas musclearea changes were nonsignificant in placebo-treated men. While the inferenceof these observations is that the observed increase in quadriceps muscle areareflects anabolic effects of androgens in stimulating deposition of new myofib-rilar proteins, there are other possibilities as well. For example, the increase inquadriceps muscle area might represent expansion of the muscle glycogen pooland water volume. A full interpretation of MRI-detected increase in skeletalmuscle area would require additional studies of body composition and, poten-tially, chemical analysis of skeletal muscle biopsies.
METHOD SELECTION
Reference MethodAn important quest in body composition research is to find the best referencemethod, or the gold standard. Although weighing of organs or chemical analysisof human cadavers provides the most accurate measure of most components,only a few complete cadaver analyses have been carried out, and there are manytechnical problems with this approach.
The next consideration in selecting a reference method is that it must beappropriate for the body composition level and component under study. Forexample, fat is a molecular level component and adipose tissue is a tissue-system level component. Adipose tissue measured by MRI would therefore notbe expected to serve as a reference comparison against which fat estimates bya method such as underwater weighing are compared.
Type I body composition methods are developed against established refer-ence methods. For example, anthropometry, BIA, infrared interactance, andultrasound include error from the reference method. Type I methods, therefore,are not acceptable reference standards.
Type II body composition methods, such as some neutron activation analy-sis methods, DXA, underwater weighing, and MRI are often cited as in vivoreference standards. Judging the suitability of a reference method requires ananalysis of errors arising from two main sources, model and technical. Somemodels are extremely stable whereas others are not (77). For example, modelsbased on chemical relationships (e.g. N/protein= 0.16) are very stable underalmost all circumstances. Models developed with nonchemical relationships(e.g. total body water/fat-free body mass= 0.732) are less stable and are

P1: NBL/MBL/rkc P2: MBL/mkv QC: MBL/bs T1: MBL
May 5, 1997 15:40 Annual Reviews AR033-24
BODY COMPOSITION 555
often influenced by disease, pregnancy, and other conditions that deviate from“normal.” There are many sources of technical error, and a few examples areinstrument calibration, instrument stability, subject participation, and observervariation. Weighing the contribution of these many factors to total method erroris a very difficult but important task.
The final consideration is that reference body composition methods must beavailable to investigators if they are to be useful. There are thus many factorsto consider when choosing a reference body composition method.
Study MethodThe method selected for a specific project depends mainly on the study hypoth-esis or clinical application. Is the method suitable for individual or group eval-uations? Will the method give accurate component results in the group underinvestigation? That is, are prediction equations for type I methods appropriatefor the study population? Are models used in type II methods appropriate for usein the study population? Are regional or whole-body measurements needed?Is the method sufficiently reliable to detect hypothesized changes over time?Important additional considerations in method selection include instrument orreagent cost, safety, and portability (e.g. laboratory or field study). Informa-tion beyond that presented in this review can be found in body compositiontextbooks (22, 62).
CONCLUSION
Remarkable progress is evident in the field of body composition research. Whilenot long ago only a few components could be measured in vivo, today mostmajor components at the first four levels of body composition can be accuratelymeasured in an individual subject. The timing of these advances is opportune,as major nutritional questions require body composition estimates for their fullexamination.
ACKNOWLEDGMENTS
We acknowledge the suggestions of Drs. Ruimei Ma and Angelo Pietrobelliin manuscript preparation. This work was supported by National Institutes ofHealth Grant RO1-AG 13021.
Visit the Annual Reviews home pageathttp://www.annurev.org.

P1: NBL/MBL/rkc P2: MBL/mkv QC: MBL/bs T1: MBL
May 5, 1997 15:40 Annual Reviews AR033-24
556 HEYMSFIELD ET AL
Literature Cited
1. Abate N, Burns D, Peshock RM, Garg A,Grundy SM. 1994. Estimation of adiposetissue mass by magnetic resonance imag-ing: validation against dissection in hu-man cadavers.J. Lipid Res.35:1490–96
2. Anderson J, Osborn SB, Tomlinson RWS,Newton D, Rundo J, et al. 1964. Neutron-activation analysis in man in vivo: anew technique in medical investigation.Lancet2:1201–5
3. Baumgartner RN, Chumlea WC, RocheAF. 1990. Impedance for body composi-tion. Exerc. Sport Sci. Rev.18:193–224
4. Baumgartner RN, Heymsfield SB, Licht-man S, Wang J, Pierson RN. 1991. Bodycomposition in elderly people: effect ofcriterion estimates on predictive equa-tions.Am. J. Clin. Nutr.53:1345–53
5. Beddoe AH, Hill G. 1985. Clinical mea-surement of body composition using invivo neutron activation analysis.J. Par-ent. Enter. Nutr.9:504–20
6. Beddoe AH, Stereat SJ, Hill GL, KnightGS. 1985. New approaches to clinical as-sessment of lean body tissues. InBodyComposition Assessments in Youth andAdults,ed. AF Roche, pp. 62–72. Colum-bus, OH: Ross Labs.
7. Behnke AR, Feen BG, Welham WC.1942. The specific gravity of healthy men.J. Am. Med. Assoc.118:495–98
8. Bhasin S, Stores TW, Berman N, Cal-legari C, Clevenger B, et al. 1996. Theeffects of supraphysiologic doses oftestosterone on muscle size and strengthin normal men.N. Engl. J. Med.335:1–7
9. Bloch F, Hansen WW, Packard ME. 1946.Nuclear introduction.Phys. Rev.70:460–74
10. Borkan GA, Gerzof SG, Robbins AH,Hults DE, Silbert CK, Silbert JE. 1982.Assessment of abdominal fat content bycomputerized tomography.Am. J. Clin.Nutr. 36:172–77
10a. Brown D, Rothery P. 1993.Models in Bi-ology: Mathematics, Statistics and Com-puting,p. 13. Sussex, UK: Wiley
11. Cameron JR, Sorenson J. 1963. Measure-ment of bone mineralin vivo. Science42:230–32
12. Chettle DR, Fremlin JH. 1984. Tech-niques of in vivo neutron activation anal-ysis.Phys. Med. Biol.29:1011–43
13. Cohn SH. 1981. In vivo neutron activa-tion analysis: state of the art and futureprospects.Med. Phys.8:145–53
14. Cunningham J. 1994. N× 6.25: recog-nizing a bivariate expression for protein
balance in hospitalized patients.Nutrition10:124–27
15. Damadian R. 1971. Tumor detectionby nuclear magnetic resonance.Science171:1151–53
16. Diem K. 1962.Documenta Geigy Scien-tific Tables,Geigy Pharmaceuticals. NewYork: Ardsley. 778 pp.
17. Dilmanian FA, Weber DA, Yasumura S,Kamen Y, Lidofsky L, et al. 1990. Perfor-mance of the neutron activation systems atBrookhaven National Laboratory. InAd-vances in Vivo Body Composition Studies,ed. S Yasumura, KG McNeill, AD Wood-head, FA Dilmanian. New York: Plenum
18. Dutton J. 1991. In vivo analysis of bodyelements and body composition.Univ.Wales Sci. Tech. Rev.8:19–30
19. Ellis KJ. 1990. Reference man andwoman more fully characterized. Varia-tions on the basis of body size, age, andrace.Biol. Trace Elem. Res.26-27:385–400
20. Ellis KJ. 1996. Whole-body counting andneutron activation analysis. See Ref. 62,pp. 45–62
21. Fielding RA. 1996. Effects of exercisetraining in the elderly: impact of progres-sive resistance training on skeletal mus-cle and whole-body protein metabolism.Proc. Nutr. Soc.54:665–75
22. Forbes GB. 1987.Human Body Compo-sition.New York: Springer-Verlag
23. Foster KR, Lukaski HC. 1996. Whole-body impedance—what does it measure?Am. J. Clin. Nutr.64:S388–96
23a. Foster MA, Hutchison JMS, Mallard JR,Fuller M. 1984. Nuclear magnetic reso-nance pulse sequence and discriminationof high- and low-fat tissues.Magn. Reson.Imaging2:187–92
24. Fowler PA, Fuller MF, Glasby CA, Fos-ter MA, Cameron GG, et al. 1991. To-tal and subcutaneous AT distribution inwomen: the measurement of distributionand accurate prediction of quantity by us-ing magnetic resonance imaging.Am. J.Clin. Nutr.54:18–25
25. Garn SM. 1957. Roentgenogrammetricdetermination of body composition.Hum.Biol. 29:337
26. Going SB. 1996. Densitometry. See Ref.62, pp. 3–24
27. Gotfredsen A, Borg J, Christiansen C,Mazess RB. 1984. Total body bone min-eral in vivo by dual photon absorptiom-etry. I. Measurement procedures.Clin.Physiol.4:343–55

P1: NBL/MBL/rkc P2: MBL/mkv QC: MBL/bs T1: MBL
May 5, 1997 15:40 Annual Reviews AR033-24
BODY COMPOSITION 557
28. Gotfredsen A, Jensen J, Borg J, Chris-tiansen C. 1986. Measurement of leanbody mass and total body fat using dualphoton absorptiometry.Metab. Clin. Exp.35:88–93
29. Gurr MI, Harwood JL. 1991.Lipid Bio-chemistry.London: Chapman & Hall. 4thed.
30. Hayes PA, Sowood PJ, Belyavin A, Co-hen JB, Smith FW. 1988. Subcutaneousfat thickness measured by magnetic reso-nance imaging, ultrasound, and calipers.Med. Sci. Exerc.20:303–9
31. Heymsfield SB, Fulenwider T, NordlingerB, Balow R, Sones P, Kutner M. 1979.Accurate measurement of liver, kidney,and spleen volume and mass by computer-ized axial tomography.Ann. Intern. Med.90:185–87
32. Heymsfield SB, Lichtman S, Baumgart-ner RN, Wang J, Kamen Y, et al. 1990.Body composition of humans: compar-ison of two improved four-compartmentmodels that differ in expense, technicalcomplexity, and radiation exposure.Am.J. Clin. Nutr.52:52–58
33. Heymsfield SB, Noel R. 1981. Radio-graphic analysis of body composition bycomputerized axial tomography. InNutri-tion and Cancer,ed. N Ellison, G Newell,17:161–72. New York: Raven
34. Heymsfield SB, Noel R, Lynn M, KutnerM. 1979. Accuracy of soft tissue densitypredicted by CT.J. Comput. Assist. To-mogr.3:859–60
35. Heymsfield SB, Olafson RP, Kutner MH,Nixon DW. 1979. A radiographic methodof quantifying protein-calorie undernutri-tion. Am. J. Clin. Nutr.32:693–702
36. Heymsfield SB, Ross R, Wang ZM,Frager D. 1997. Imaging techniques ofbody composition: advantages of mea-surement and new uses. InEmergingTechnologies for Nutrition Research,pp.1-25. Washington, DC: Natl. Acad. Press.In press
37. Heymsfield SB, Smith R, Aulet M,Bensen B, Lichman S, et al. 1990. Ap-pendicular skeletal muscle mass: mea-surement by dual-photon absorptiometry.Am. J. Clin. Nutr.52:214–18
38. Heymsfield SB, Waki M, Kehayias J,Lichtman S, Dilmanian FA, et al. 1991.Chemical and elemental analysis of hu-mans in vivo using improved body com-position models.Am. J. Physiol.261:E190–98
39. Heymsfield SB, Wang ZM, Withers R.1996. Multicomponent molecular-levelmodels of body composition analysis. SeeRef. 62, pp. 129–48
40. Hoffman JG, Hempelmann LH. 1957. Es-timation of whole-body radiation dosesin accidental fission bursts.Am. J.Roentgenol.77:144–60
41. Hounsfield GN. 1973. Computerizedtransverse axial scanning (tomography).Br. J. Radiol.46:1016
42. Hubbell JH. 1969. Photon cross sections,attenuation coefficients, and energy ab-sorption coefficients from 10 keV to 100GeV. In US Natl. Bur. Stand., The Supt.Doc.,pp. 1–85. Washington, DC: US Gov.Print. Off.
43. Hubbell JH. 1982. Photon mass attenu-ation and energy-absorption coefficientsfrom 1 KeV to 20 MeV.J. Appl. Radiat.Isot.33:1269–90
44. Jue T, Rothman DL, Shulman GI, TavitianBA, DeFronzo RA, Shulman RG. 1989.Direct observation of glycogen synthesisin human muscle with13C NMR. Proc.Natl. Acad. Sci.USA 86:4489–91
45. Kehayias JJ, Heymsfield SB, LoMonteAF, Wang J, Pierson RN Jr. 1991. Invivo determination of body fat by measur-ing total body carbon.Am. J. Clin. Nutr.53:1339–44
46. Krentz AJ, Koster FT, Crist DM, Finn K,Johnson LZ, et al. 1993. Anthropomet-ric, metabolic, and immunological effectsof recombinant human growth hormonein AIDS and AIDS-related complex.J.Acquired Immune Defic. Syndr.6:245–51
47. Kvist H, Sjostrom L, Tylen U. 1986.Adipose tissue volume determinations inwomen by computed tomography: tech-nical consideration.Int. J. Obes.10:53–67
48. Lohman TG. 1986. Applicability of bodycomposition techniques and constants forchildren and youths.Exerc. Sport Sci. Rev.14:325–57
49. Lohman TG. 1992.Advances in BodyComposition Assessment.Champaign,IL: Hum. Kinet.
50. Lukaski H. 1989. Applications of bioelec-tric impedance analysis: a critical review.In In Vivo Body Composition Studies: Re-cent Advances,ed. S Yasumura, JE Harri-son, KE McNeill, AD Woodhead, FA Dil-manian, pp. 365–74. New York: Plenum
51. Lukaski HC, Johnson PE, BolonchukWW, Lykken GI. 1985. Assessment of fat-free mass using bioelectrical impedancemeasurement of the human body.Am. J.Clin. Nutr.41:810–17
52. Ma R, Dilmanian FA, Rarback H, Sta-matelatos IE, Meron M, et al. 1993. Re-cent upgrade of the IVNA facility at BNL.In Human Body Composition, In VivoMethods, Models, and Assessment,ed. KJ

P1: NBL/MBL/rkc P2: MBL/mkv QC: MBL/bs T1: MBL
May 5, 1997 15:40 Annual Reviews AR033-24
558 HEYMSFIELD ET AL
Ellis, JD Eastman, pp. 345–50. New York:Plenum
53. Mansfield P, Pykett IL, Morris PG. 1978.Human whole body line-scan imaging byNMR. Br. J. Radiol.51:921–22
54. Mazess RB, Barden HS, Bisek JP, Han-son J. 1990. Dual-energy X-ray absorp-tiometry for total-body and regional bone-mineral and soft-tissue composition.Am.J. Clin. Nutr.51:1106–12
55. McCrory MA, Gomez TD, Bernauer EM,Mole PA. 1995. Evaluation of a new airdisplacement plethysmograph for mea-suring human body composition.Med.Sci. Sports Exerc.27:1686–91
56. Modlesky CM, Lewis RD, Yetman KA,Rose B, Rosskopf LB, et al. 1996. Com-parison of body composition and bonemineral measurements from two DXA in-struments in young men.Am. J. Clin. Nutr.64:669–76
57. Moore FD, Oleson, KH, McMurray, JD,Parker HV, Ball MR, et al. 1963.The BodyCell Mass And Its Supporting Environ-ment.Philadelphia: Saunders
58. Ogle GD, Rosenberg AR, Kainer G. 1992.Renal effects of growth hormone. II. Elec-trolyte homeostasis and body composi-tion. Pediatr. Nephrol.6:483–89
59. Pace N, Rathbun EN. 1945. Studies onbody composition. III. The body waterand chemically combined nitrogen con-tent in relation to fat content.J. Biol.Chem.158:685–91
60. Pietrobelli A, Formica C, Wang ZM,Heymsfield SB. 1996. Dual-energy X-rayabsorptiometry body composition model:review of physical concepts.Am. J. Phys-iol. 271:E941–51
61. Purcell EM, Torrey HC, Pound RV. 1946.Resonance absorption by nuclear mag-netic moments in a solid.Phys. Rev.69:37–38
62. Roche AF, Heymsfield SB, Lohman TG,eds. 1996.Human Body Composition.Champaign, IL: Hum. Kinetics. 366 pp.
63. Ross R, L´eger L, Guardo R, dDe GuiseJ, Pike BG. 1991. Adipose tissue volumemeasured by magnetic resonance imagingand computerized tomography in rats.J.Appl. Physiol.70:2164–72
64. Ross R, L´eger L, Morris D, de Guise J,Guardo R. 1992. Quantification of adi-pose tissue by MRI: relationship with an-thropometric variables.J. Appl. Physiol.72:787–95
65. Rossner S, Bo WJ, Hiltbrandt E, Hin-son W, Karstaedt N, et al. 1990. Adiposetissue determinations in cadavers: a com-parison between cross-sectional planime-try and computed tomography.Int. J.
Obes.14:893–90266. Ryde SJS, Birks JL, Morgan WD, Evans
CJ, Dutton J, et al. 1993. A five-compart-ment model of body composition ofhealthy subjects assessed using in vivoneutron activation analysis.Eur. J. Clin.Nutr. 47:863–74
67. Schoeller DA. 1996. Hydrometry. SeeRef. 62, pp. 25–44
68. Selinger A. 1977.The Body as a ThreeComponent System.PhD thesis. Univ. Ill.,Urbana
69. Shizgal HM, Spanier AH, Humes J, WoodCD. 1977. Indirect measurement of totalexchangeable potassium.Am. J. Physiol.233:F253–59
70. Siri WE. 1961. Body composition fromfluid spaces and density: analysis ofmethods. InTechniques for MeasuringBody Composition,ed. J Brozek, A Hen-schel, pp. 223–44. Washington, DC: Natl.Acad. Sci. Natl. Res. Counc.
71. Sjostrom L. 1991. A computer-tomo-graphy based multicomponent body com-position technique and anthropometricpredictions of lean body mass, total andsubcutaneous adipose tissue.Int. J. Obes.15:19–30
72. Snyder WM, Cook MJ, Nasset ES,Karhausen LR, Howells GP, Tipton IH.1975.Report of the Task Group on Refer-ence Man.Oxford: Pergamon
73. Sprawls P Jr. 1977.The Physical Princi-ples of Diagnostic Radiology.Baltimore:Univ. Park
74. Stuart HC, Hill P, Shaw C. 1940. Thegrowth of bone, muscle and overlyingtissue as revealed by studies of roent-genograms of the leg area.Monogr. Soc.Res. Child Dev.5(No. 3, Ser. 26):1–190
75. Wang ZM, Gallagher D, Nelson ME,Matthews DE, Heymsfield SB. 1996. To-tal body skeletal muscle mass: evalua-tion of 24-h urinary creatinine excretionby computerized axial tomography.Am.J. Clin. Nutr.63:863–69
76. Wang ZM, Heshka S, Pierson RN Jr,Heymsfield SB. 1995. Systematic organi-zation of body composition methodology:overview with emphasis on component-based methods.Am. J. Clin. Nutr.61:457–65
77. Wang ZM, Pierson RN Jr, Heymsfield SB.1992. The five level model: a new ap-proach to organizing body compositionresearch.Am. J. Clin. Nutr.56:19–28
78. White DR, Peaple LHJ, Crosby TJ. 1980.Measured attenuation coefficients at lowphoton energies (9.88–59.32 keV) for44 materials and tissues.Radiat. Res.84:239–52
View publication statsView publication stats