methods - furman centerfurmancenter.org/files/sotc/soc2014_methods.pdf · · 2015-08-11for...
TRANSCRIPT

1 8 0 N Y U F U R M A N C E N T E R • @ F U R M A N C E N T E R N Y U
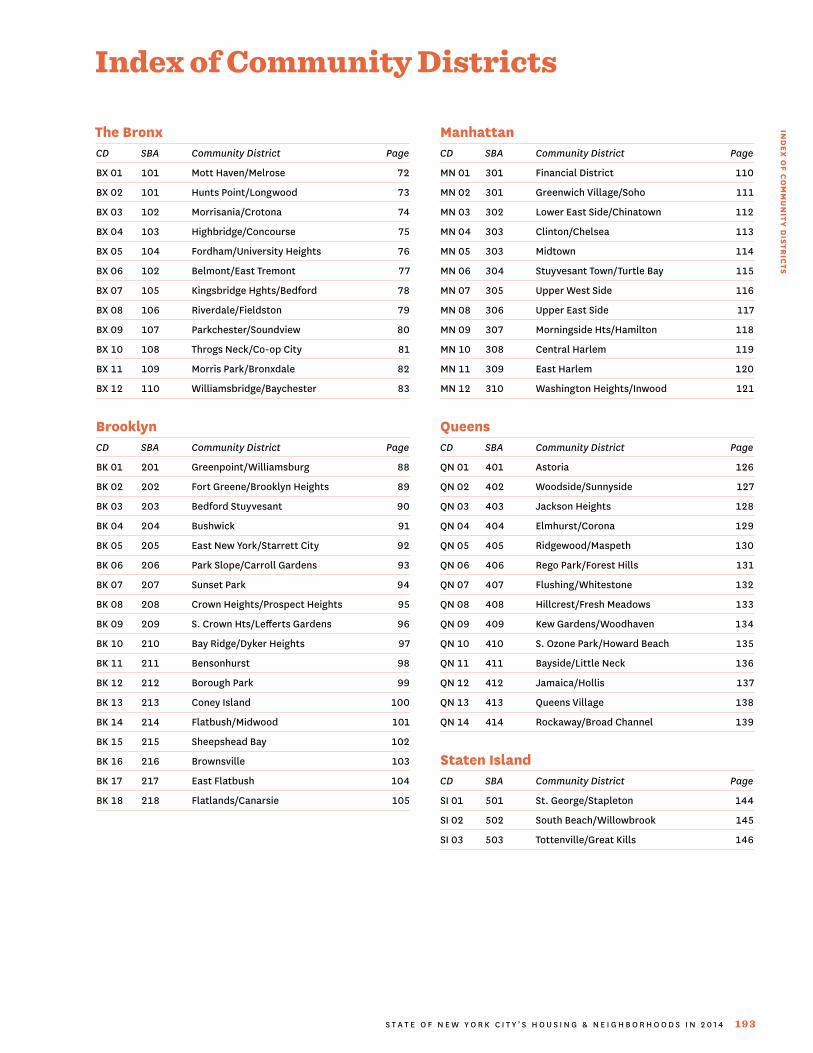
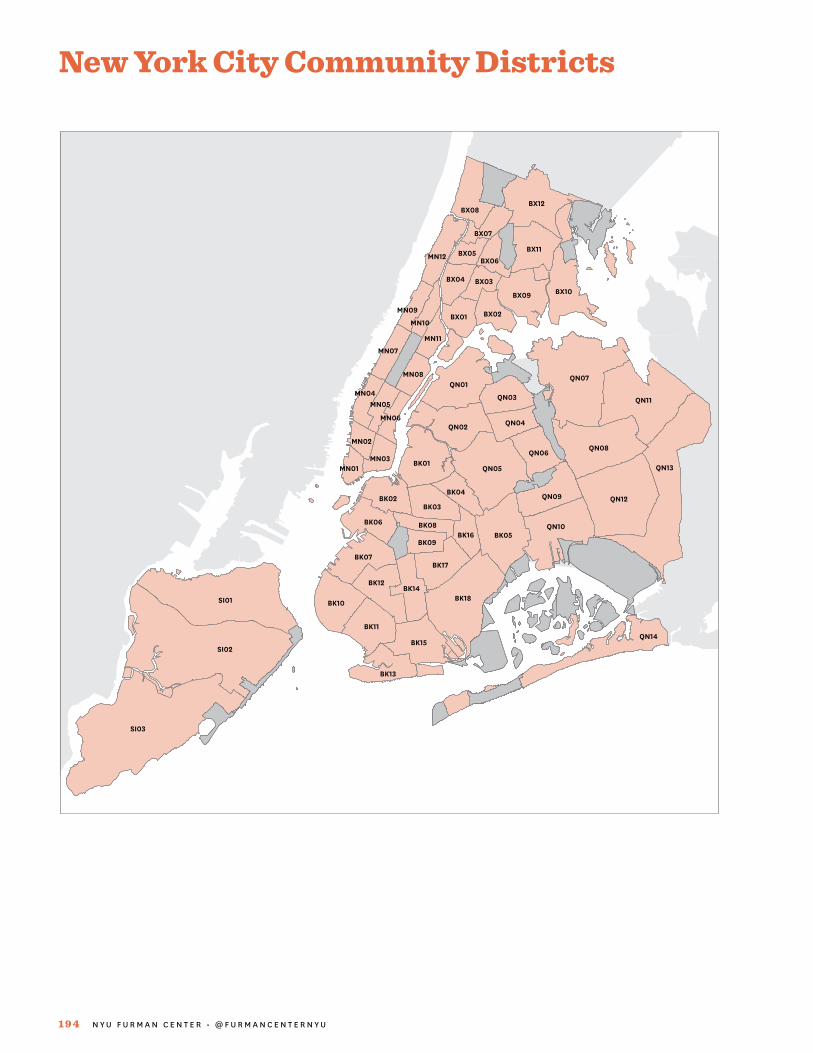
Geographic DefinitionsThis report presents information for the entire City of New
York, for each of the five boroughs, and for the neighborhoods
within each borough. The city defines neighborhoods by
dividing the boroughs into 59 community districts (CDs);
the U.S. Census Bureau, however, divides the boroughs into
55 sub-borough areas (SBAs). This report provides data for
community districts where available but otherwise employs
data at the sub-borough level. The term neighborhood is
used in this report to refer to both community districts and
sub-borough areas even though they are larger than what
many consider to be neighborhoods.1 We have included
reference maps for community districts and sub-borough
areas following this chapter.
BoroughNew York City consists of five boroughs: the Bronx, Brooklyn,
Manhattan, Queens, and Staten Island. Each borough is
represented by a borough president, an elected official who
advises the mayor on issues related to his or her borough and,
along with the borough board, makes recommendations
concerning land use and the allocation of public services.
Each borough is also a county. Counties are legal entities
with boundaries defined by state law.
Community District (CD)Community districts are political units unique to New York
City. Each of the 59 community districts has a commu-
nity board. Half of the community board’s members are
appointed by the borough president and half are nominated
by the City Council members who represent the district. The
community boards review applications for zoning changes
and other land use proposals and make recommendations
for budget priorities.
Each community board is assigned a number within its
borough. The borough and this number uniquely identify
each of the 59 community districts. Therefore, we designate
each community district with a two-letter borough code
and a two-digit community board code. For example, BK
02 is the community district represented by Community
Board 2 in Brooklyn.
1 In Part 1: Focus on Density, we also use neighborhood to refer to Census tracts but not sub-borough areas.
Sub-Borough Area (SBA)Sub-borough areas are geographic units created by the U.S.
Census Bureau for the administration of the New York City
Housing and Vacancy Survey and were designed to have
similar boundaries to those of community districts. These
same areas are also defined by the U.S. Census Bureau as
Public Use Microdata Areas (PUMAs), so we are able to
use the two terms interchangeably. Sub-borough areas are
referred to using a three-digit number, where the first digit
signifies the borough (we number boroughs in alphabetical
order, with the Bronx being 1 and Staten Island being 5).
There are 59 community districts in New York City but
only 55 sub-borough areas. The U.S. Census Bureau com-
bined four pairs of community districts in creating the
sub-borough areas to improve sampling and protect the
confidentiality of respondents. These pairs are Mott Haven/
Melrose (BX 01) and Hunts Point/Longwood (BX 02) in the
Bronx (combined into SBA 101), Morrisania/Crotona (BX 03)
and Belmont/East Tremont (BX 06) in the Bronx (combined
into SBA 102), the Financial District (MN 01) and Greenwich
Village/Soho (MN 02) in Manhattan (combined into SBA
301), and Clinton/Chelsea (MN 04) and Midtown (MN 05)
in Manhattan (combined into SBA 303).
Because sub-borough areas are constructed from Census
tracts, their boundaries do not coincide precisely with com-
munity district boundaries, which generally follow major
streets. However, they are similar enough that we use them
interchangeably throughout this report. The U.S. Census
Bureau periodically updates its geographic boundaries for
each decennial Census, and so the shapes of sub-borough
areas changed slightly between the 2011 and 2012 releases
of the American Community Survey. Although we treat
these different vintages of sub-borough areas as being con-
sistent over time, we advise some caution when comparing
estimates from 2011–2013 to earlier years.
RankingsThis report includes rankings of the five boroughs and all
59 community districts or 55 sub-borough areas for each
indicator. The neighborhood ranked first has the highest
number or percentage for the measure, even if lower values
of measure are considered “better” (such as with crime rates).
When possible, we rank all 59 community districts, though
we present ranks for the 55 sub-borough areas for those
Methods

ME
THO
DS
S T A T E O F N E W Y O R K C I T Y ’ S H O U S I N G & N E I G H B O R H O O D S I N 2 0 1 4 1 8 1
indicators—including all indicators drawn from U.S. Census
Bureau and Home Mortgage Disclosure Act sources—that
aggregate easily to the sub-borough area level. In addition,
a few indicators are not available for all neighborhoods,
so we provide rankings for a subset of neighborhoods. For
instance, we report the median sale price per unit at the
community district level for only the predominant housing
type in that district. Therefore, for each housing type, we
present rankings only for the subset of community districts
where that housing type predominates.
Visualization in Geographic Information SystemsMaps displaying New York City-specific administrative and
political boundaries use base map data provided by the
New York City Department of City Planning’s Bytes of the
Big Apple program. These boundaries include boroughs,
community districts, zoning boundaries, public streets,
police precincts, school districts, and individual proper-
ties. Maps displaying data in geographic areas defined by
the U.S. Census Bureau—such as sub-borough areas, tracts,
and ZIP-code tabulation areas—use base map data from
Census TIGER products.
United States Census SourcesA number of the indicators presented in the State of New
York City’s Housing and Neighborhoods are derived from
five data sources collected by the U.S. Census Bureau. These
sources are described below along with a discussion of issues
of comparability across sources.
Decennial Census (Census)From 1970 through 2000, the decennial Census consisted of
two parts: the “short form” that collected information from
every person and about every housing unit in the country,
and the “long form” of additional questions asked of a sample
of people and households. The short form collected infor-
mation on age, race, Hispanic or Latino origin, household
relationship, sex, tenure, and vacancy status. The long
form provided more in-depth information about personal
and housing characteristics such as income, employment
status, and housing costs. In this edition of the State of
New York City’s Housing and Neighborhoods, we use data
from the decennial Census short and long forms to derive
demographic, economic, and housing measures for the
years 1970, 1980, 1990, and 2000. To create most of these
indicators, we use summary Census data reported at the
city, borough, and sub-borough area levels.
In 2010, the decennial Census only included the short
form since most of the data that had previously been included
in the long form were now reported in the American Com-
munity Survey (see below). While much of the decennial
Census’s short-form data is also found in the American
Community Survey (such as the count of households), the
two sources often report differing numbers for statistical
and methodological reasons. Whenever possible, we report
data from the decennial Census with one exception: the
rental vacancy rate in 2010.
American Community Survey (ACS)The American Community Survey is an annual survey that
collects data similar to those formerly collected by the Census
long form described above. As with the long form, the ACS
covers only a sample of individuals and housing units. How-
ever, the ACS uses a smaller sample: the long form covered one
out of every six housing units while the ACS only covers one
in 40 housing units each year. The U.S. Census Bureau began
developing the ACS in 1996, but reliable annual estimates
for geographic areas with a population of 65,000 or more
only became available in 2005. In December 2008, the U.S.
Census Bureau began releasing three-year rolling estimates
for all geographic areas with populations of 20,000 or more.
In December 2010, the U.S. Census Bureau began releasing
five-year rolling estimates for geographic areas as small as
block groups. Multiyear estimates (whether three- or five-
year) are referred to by the whole range of years covered (for
example, 2011–2013) and should be interpreted as a measure
of the conditions during the whole range; due to space con-
straints, however, multiyear estimates presented in tables
in Part 3 are, where noted, labeled using only the final year
of the range (that is, an indicator from the 2011–2013 ACS is
listed under the heading “2013”).
Most of the indicators from the ACS in this edition
are derived from pre-compiled summary tables reported
by the U.S. Census Bureau for the city as a whole, indi-
vidual boroughs, and PUMAs, which, as discussed above,
are identical to New York City’s sub-borough areas (and
which are often referred to in this report as neighborhoods).
1 8 2 N Y U F U R M A N C E N T E R • @ F U R M A N C E N T E R N Y U
For city- and borough-level indicators, we report figures
derived from one-year estimates from the ACS. However,
due to the small sample size at the SBA level, one-year
estimates can be prone to volatility and sampling error,
which can make it difficult to reliably discern whether an
indicator’s change from one year to the next represents a
real change or a statistical anomaly. In order to reduce this
uncertainty and draw valid conclusions from differences
over both time and space, we report indicators derived
from three-year ACS estimates when presenting findings
at the SBA level. Please see the Sampling section below for
recommendations about making comparisons over time
and across geographic levels.
New York City Housing and Vacancy Survey (HVS)The New York City Housing and Vacancy Survey is conducted
every three years by the U.S. Census Bureau under contract
with the City of New York. The New York City Department
of Housing Preservation and Development sponsors and
supervises the HVS. The primary purpose of the HVS is
to satisfy the city’s statutory requirement to measure the
rental vacancy rate in order to determine if rent regulation
will continue. In addition to the housing unit information,
the survey collects other information about the household
and the individual answering the questionnaire.
In this edition of the State of New York City’s Housing and
Neighborhoods, we use HVS data to construct one indicator
that is specific to New York City and therefore not captured
in the ACS: the number of units that are rent stabilized or
rent controlled. At the time of this writing, the public-use
2014 HVS data were not available, so therefore we could not
report the percentage of rental units that were rent stabilized
or rent controlled. This indicator will be updated when the
public-use data become available.
Public Use Microdata Samples (PUMS)While most decennial Census- and ACS-derived indicators
use pre-tabulated summary data that are already reported
at a given geography, we calculate some indicators by aggre-
gating person- and household-level data to the desired
geographic level. The U.S. Census Bureau makes individual-
level data available in Public Use Microdata Samples (PUMS),
which are censored extracts from the confidential microdata
that the U.S. Census Bureau uses in its own calculations for
the decennial Census, the ACS, and the HVS. We use PUMS
data to calculate the household income distribution, income
diversity ratio, median rent for recent movers, severe rent
burden (low-income renters), moderate rent burden (low-
income renters), rent-stabilized or rent-controlled units,
and several indicators in the State of New Yorkers section.
The only geographic areas that ACS PUMS data identify
for a household are its state and PUMA. In order to deter-
mine the city and metropolitan area of a household, we
use crosswalk files from the Missouri Census Data Center
that match states and PUMAs to their respective cities and
metropolitan areas. New York City’s PUMAs are completely
coterminous with its city boundaries.
Comparisons Between U.S. Census Bureau ProductsThe U.S. Census Bureau makes continual adjustments to
the decennial Census and the ACS to improve the coverage
of the surveys and accuracy of the results. These adjust-
ments often make cross-year comparisons difficult. Below
is a discussion of the key areas where changes in sampling,
question construction, or other methods might affect the
comparability of indicators that we report in the State of
New York City’s Housing and Neighborhoods over time. More
information about comparability between U.S. Census
Bureau data sources is available at: http://www.census
.gov/acs/www/guidance_for_data_users/comparing_data/.
Sampling
Because both the ACS and HVS are sample surveys, not
censuses, all data derived from them are estimates, not
exact counts.2 The ACS sample includes approximately three
million housing units nationwide, including about 66,000
in New York City, while the HVS samples 18,000 housing
units (all of which are in New York City). The sample for the
HVS is designed primarily to achieve acceptable reliability
in estimating the rental vacancy rate for the entire city, so
estimates for smaller geographic units such as sub-borough
areas are subject to potentially large sampling errors.
Readers should treat all estimates with some skepticism
and be aware that the true value may differ from the reported
2 Censuses have their own methodological problems, of course, and may systemically under- or over-count certain populations.

ME
THO
DS
S T A T E O F N E W Y O R K C I T Y ’ S H O U S I N G & N E I G H B O R H O O D S I N 2 0 1 4 1 8 3
estimate. This is especially important when comparing
small year-to-year changes in sample-derived estimates or
with estimates that are derived from a reduced sample. For
example, the median rent does not use the entire sample but
just the subset of respondents who are renters. The median
rent for recent movers draws on an even smaller sample.
Comparisons Between Different Sampling Intervals
In order to report more reliable estimates of ACS-derived
indicators for smaller geographies (such as sub-borough
areas) or small populations (such as people aged 16 to 19
for the disconnected youth indicator), we use multiyear
ACS estimates. The U.S. Census Bureau recommends using
one-year estimates for areas with populations of at least
65,000; all sub-borough areas have populations that are
above 100,000, but in some cases certain subsamples (for
example, homeowners or low-income renters) are consider-
ably smaller. Three-year estimates reflect data from three
full years of surveys, allowing for more robust and accurate
estimates at the expense of being slightly less current. Five-
year estimates are even more reliable but less current.
Multiyear estimates should be interpreted as describing
the conditions that existed during the full sample range,
and therefore should not be compared directly to single-
year estimates for any of the individual years in the range.
For example, the median household income in SBA 201
(Greenpoint/Williamsburg in Brooklyn) was $51,450 (in 2014
dollars) according to the 2011–2013 ACS. In Brooklyn as a
whole, the median household income was $48,149 accord-
ing to the 2013 ACS. Since the estimate for SBA 201 is for the
entire period from 2011 to 2013, it is not strictly comparable
to the borough-wide number, which comes from 2013 alone;
if incomes in Greenpoint/Williamsburg and in Brooklyn
as a whole increased substantially between 2011 and 2013,
the estimate for SBA 201 would include the lower median
income in 2011 as well as the higher median income in 2013,
while the borough-wide estimate would only use data from
after the increase. (And, if incomes decreased during 2012,
vice versa.) It is appropriate, however, to compare multiyear
estimates to estimates for a single year that falls outside
the multiyear range. For example, one could compare a
2011–2013 estimate to an estimate for 2010, since 2010 is
not within the range of 2011–2013.
Multiyear estimates can be compared to other multiyear
estimates of the same duration as long as the ranges do not
overlap. So, the 2011–2013 estimates for one sub-borough
area can be compared to the 2008–2010 estimates for that
sub-borough area and to the 2011–2013 estimates for other
sub-borough areas. To compare a neighborhood’s multiyear
ACS estimate to the rest of the city, it is more effective to
use its ranking than to compare its multiyear neighborhood
estimate to the city’s single-year estimate.
Income and Rent
Question construction and data collection for income infor-
mation differs between the decennial Census and the ACS.
The 1990 Census asked for the respondent’s 1989 income,
and similarly, the 2000 Census asked for the respondent’s
1999 income; thus incomes reported in 1990 and 2000 are
all for one fixed period of time (calendar years 1989 and 1999
respectively). In contrast, the ACS asks for the respondent’s
income over the “past 12 months.” As the U.S. Census Bureau
collects ACS responses on an ongoing basis throughout the
year, these estimates are not directly comparable; for example,
a 2013 ACS respondent who was interviewed in January of
2013 would report income that was mostly earned in 2012,
while a respondent who was interviewed in December of
2013 would report income that was mostly earned in 2013.
The U.S. Census Bureau notes that a comparison study
of the 2000 Census and the 2000 ACS found that incomes
reported in the Census were about four percent higher than
the incomes reported in the ACS. Because of the data collec-
tion methods mentioned above, adjacent years of ACS data
may have reference months in common; thus comparisons of
income data between adjacent ACS years (for example, 2010
and 2011) should not be interpreted as precise comparisons of
economic conditions in those years. The indicators that draw
on the ACS income data include the income diversity ratio
(from PUMS data), median household income, poverty rate,
and poverty rate by age. As a result, year-to-year changes in
these indicators should be interpreted with caution.
Except for the gross rent distribution charts on the city,
borough, and community district data pages in Part 3, and
where otherwise noted, we adjust all dollar figures for infla-
tion (to constant 2014 dollars) from the nominal dollar values
reported by the U.S. Census Bureau (see below for more
on how we adjust for inflation). However, such nominal

1 8 4 N Y U F U R M A N C E N T E R • @ F U R M A N C E N T E R N Y U
dollar values are generated by the U.S. Census using differ-
ent methods depending on the source of the data. For ACS
estimates that are included in the pre-tabulated summary
data, the U.S. Census Bureau reports dollar amounts that
have been inflated to the annual average for the survey year
(for example, calendar year 2013 for the 2013 ACS) based on
the monthly Consumer Price Index (CPI). Thus, respondents’
incomes (and rents) are adjusted to account for the fact that
some are interviewed early in the year and others are inter-
viewed later in the year. Such an adjustment, however, may
not fully account for changes in the state of the economy
over the course of the year. For example, if unemployment
were higher in 2012 than in 2013, respondents interviewed
in January of 2013 would be more likely to report zero earn-
ings in the last twelve months than similar respondents
interviewed in December of 2013, independent of the price
level in the economy as measured by the CPI.
In order to ensure the anonymity of individual responses
in the PUMS data, however, the U.S. Census Bureau does not
adjust each respondent’s income (or rent) for inflation based
upon the month in which they were interviewed; instead, the
identical adjustment is applied for all respondents, whether
they were interviewed early or late in the year. If the rate
of inflation changed over the course of the year, the dollar
figures from PUMS could be biased. Since rent and income
are recorded at the same time, the moderate and severe rent
burden for low-income renters, which are also calculated
from PUMS data, should not exhibit this bias.
Indicator NotesRental Housing Units by Regulation and Subsidy StatusBecause so much of New York City’s rental housing stock is
subject to rent regulation or housing subsidy, we document
changes and differences in the number of units participating
in these programs. Throughout this report, we may refer to
four major types of regulation or subsidy: rent stabilized or
rent controlled, public housing, other subsidized (income-
restricted), and market rate (the absence of rent regulation
and income-restricted subsidies). Several different agencies
enforce the regulations of different programs: The New York
City Department of Housing Preservation and Development
(HUD), New York State Homes and Community Renewal, and
the U.S. Department of Housing and Urban Development
all regulate different housing programs. Thus, no single
agency or organization has an authoritative count of the
units participating across all statuses, although several data
sets track certain subsets of those units, particularly the
HVS, the New York City Housing Authority (NYCHA), and
the NYU Furman Center’s Subsidized Housing Information
Project (SHIP). We employ a general method that rectifies
unit counts from these sources.
Our general method starts by identifying a total num-
ber of rental units, both vacant and occupied. Because
the availability of data sources has changed over time,
the source of the total number of rental units varies by
year. For the total rental stock in 2012, we use the citywide
estimate from the ACS.
For the number of public housing units for the boroughs
and the city as a whole, we report the number of “current
apartments” listed in the Summary of Developments sec-
tion of the annual Development Data Books released by
NYCHA.3 We derive the total number of public housing
units for sub-borough areas using a file of all public housing
developments spatially joined to sub-borough areas, which
includes slightly more units than NYCHA’s Development
Data Book for 2012.
The number of income-restricted, subsidized rental units
beyond public housing comes from the SHIP Database, and
reflects the number of units subsidized by at least one of
four types of programs: HUD financing or insurance, HUD
Project-Based Rental Assistance, the Low-Income Housing
Tax Credit (LIHTC), or the Mitchell-Lama program. These
four types of programs are unique in that they are the four
largest subsidy programs used in New York City and all
require means testing of residents. For 2012, we count the
number of units that are “currently affordable.” We generally
treat our estimate of the number of other subsidized units
as a lower-bound estimate of the city’s stock of privately
owned, publicly subsidized rental units. For a property to
be cataloged in the SHIP Database, it must have at least
one of the four subsidies listed above. The city and state
administer some other programs that are not explicitly
captured in the SHIP Database because they do not require
3 Available from http://www.nyc.gov/html/nycha/html/resources/development-data-book.shtml.
ME
THO
DS
S T A T E O F N E W Y O R K C I T Y ’ S H O U S I N G & N E I G H B O R H O O D S I N 2 0 1 4 1 8 5
means testing (e.g. LAMP, 8A, PLP). Those units are gen-
erally subject to rent stabilization and so are classified as
rent stabilized as described below.
Our estimate of rent-stabilized or rent-controlled units
is an adjustment of totals reported in the HVS. First, we sum
the number of rent-stabilized and rent-controlled units as
indicated in the New Control Status Recode field. A defi-
ciency of the HVS is that it does not track units subsidized
with LIHTC. Instead those units are classified by the other
subsidies they receive or the other regulations to which they
are subject. Some LIHTC units technically are governed by
rent stabilization because they also receive a city property
tax incentive, though the LIHTC rent regulations are stricter
than the rent stabilization regulation. Thus, we assume
that these LIHTC units are classified as rent-stabilized in
the HVS. Because public-use HVS data for 2014 were not yet
available as of this writing, we do not present the percentage
of rental units that were rent stabilized or rent controlled
in this version of the report. We will update this indicator
when those data become available.
The general method above applies to totals presented
at the city and borough levels. When we perform this
analysis at the neighborhood level, we aggregate to the
sub-borough area (SBA, the smallest geographic area avail-
able in the HVS). We also employ a few small additional
changes to the method. Because the total number of rental
units reported in the ACS can be subject to volatility, we
generally use the number of residential units reported in
the New York City Department of City Planning’s PLUTO
data for 2012, and multiply that total by one minus the
homeownership rate of that SBA as reported in the 2011–2013
ACS. The PLUTO estimates for seven SBAs—104 (Fordham/
University Heights), 105 (Kingsbridge Heights/Mosholu), 107
(Soundview/Parkchester), 109 (Morris Park/Bronxdale), 303
(Chelsea/Clinton/Midtown), 306 (Upper East Side), and 414
(Rockaways)—were deemed unreliable, so we replaced them
with the total rental units from the ACS. Several properties
cataloged in the SHIP do not have spatial coordinates and
we cannot assign them to an SBA, so our SBA-level counts of
privately owned, income-restricted, subsidized rental units
may be slightly understated.
U.S. Department of Housing and Urban Development Income and Rent LimitsThe U.S. Department of Housing and Urban Development
(HUD) defines income eligibility limits for its Section 8 and
HOME programs based on the area median income (AMI)
in a metropolitan area. HUD determines three general
income limits at 30, 50, and 80 percent of AMI for various
household sizes. HUD does not publish income guidelines
for households with more than eight members, although
its methodology allows for their calculation. To ease com-
putation, we apply the eight-person limits to these larger
households. As of fiscal year 2014, HUD assigned category
names to ranges of the area median income:
• Extremely low-income households fall
at or below 30 percent of AMI
• Very low-income households have incomes
above 30 and at or below 50 percent of AMI
• Low-income households have incomes above 50
and at or below 80 percent of AMI (although this
report uses “low-income” as shorthand for any house-
hold earning at or below the 80 percent limit, which
described 63.5% of renter households and 35.2% of
owner-occupied households in New York City in 2013)
We employ HUD’s general method to calculate 130 and
165 percent of the area median income for various household
sizes. While HUD does not set category names for higher
income ranges, we define moderate-income households as
those making more than 80 and up to 130 percent of AMI,
and middle-income households as earning more than 130
and up to 165 percent of AMI.4 Table M.1 displays these
income limits in nominal terms by household size for for fis-
cal year 2013, along with the concomitant maximum afford-
able rents, which are calculated as 30 percent of the income
limits. For more information about HUD’s method and their
published guidelines, refer to individual years’ guidelines
at http://www.huduser.org/portal/datasets/il.html.
4 The forthcoming report Renting in America’s Largest Cities: NYU Furman Center/Capital One National Affordable Rental Housing Landscape uses similarly named income category names but defines them using a different methodology. Therefore, any indicators shown by household income—particularly, rates of rent burden and shares of units affordable at certain income levels—in that report are not compa-rable to similar indicators in the State of New York City’s Housing and Neighborhoods.

1 8 6 N Y U F U R M A N C E N T E R • @ F U R M A N C E N T E R N Y U
In order to calculate the share of rental units that are
affordable to households of various income levels, we need
to take household size into account, since the definition of
income limits (and thus maximum affordable housing costs)
vary by household size. For a rental unit with n bedrooms,
we classify it as affordable at X% of AMI if its gross rent is
less than the maximum affordable rent specified by HUD
for a household of size n+1; that is, a studio (i.e. a unit with
zero bedrooms) is classified according to the maximum rent
values for single-person households, a one-bedroom is clas-
sified according to the maximum rent values for two-person
households, a two-bedroom is classified according to the
maximum rent values for three-person households, and a
unit with three or more bedrooms is classified according to
the maximum rent values for four-person households. This
method makes assumptions about the composition of the
households that occupy each unit. Therefore, this indicator
should be interpreted with some caution.
Index of Housing Price AppreciationThe index of housing price appreciation is a measure of
relative change in property values over time. We construct
housing price appreciation indices for four different prop-
erty types (condominiums, one-family buildings, two- to
four-family buildings, and multifamily rental buildings
with five or more units) for New York City as a whole and
for each borough and community district. Estimating
price indices separately for different types of properties
allows for different market valuations and fluctuations
within each property type. However, since many commu-
nity districts lack a sufficient number of properties of cer-
tain types (for example, there are very few single-family
buildings in the Financial District) to be able to estimate
reliable housing price indices for those property types,
we report a price index covering the combination of all
the above-listed residential property types in each com-
munity district and for the two predominant residential
property types in each borough.
The data used to construct the price index come from two
sources, both obtained from the New York City Department
of Finance. The first data set is an annual sales file, which we
receive under an exclusive arrangement. The second data set
is the Automated City Register Information System (ACRIS)
sales data, which is available online from the Department
of Finance. Both data sets contain information on address,
price, and date of sale for all transactions involving sales
of apartment buildings, condominiums, and single- and
multifamily homes in New York City between 1974 and 2014.
While the ACRIS data are updated daily, the system contains
less information on the circumstances of the sale than the
Table M.1: HUD Section 8 and HOME Program Income Guidelines and Maximum Affordable Rents by Household Size, New York City, Fiscal Year 2013
Income Extremely Very Low- Moderate- Middle- Category Low-Income Low-Income Income Income IncomePercentage of HUD Area Median Income 30% 50% 60% 80% 100% 130% 165%
Number of People in Household Income Limits (Nominal 2013$)1 $18,050 $30,100 $36,100 $48,100 $60,150 $78,150 $99,2002 $20,600 $34,400 $41,250 $55,000 $68,700 $89,350 $113,4003 $23,200 $38,700 $46,400 $61,850 $77,300 $100,500 $127,5504 $25,750 $42,950 $51,550 $68,700 $85,900 $111,650 $141,7505 $27,850 $46,400 $55,650 $74,200 $92,750 $120,600 $153,0506 $29,900 $49,850 $59,800 $79,700 $99,650 $129,550 $164,4007 $31,950 $53,300 $63,900 $85,200 $106,500 $138,450 $175,7508 $34,000 $56,700 $68,050 $90,700 $113,400 $147,400 $187,100
Maximum Affordable Rent (Nominal 2013$)1 $451 $753 $903 $1,203 $1,504 $1,954 $2,4802 $515 $860 $1,031 $1,375 $1,718 $2,234 $2,8353 $580 $968 $1,160 $1,546 $1,933 $2,513 $3,1894 $644 $1,074 $1,289 $1,718 $2,148 $2,791 $3,5445 $696 $1,160 $1,391 $1,855 $2,319 $3,015 $3,8266 $748 $1,246 $1,495 $1,993 $2,491 $3,239 $4,1107 $799 $1,333 $1,598 $2,130 $2,663 $3,461 $4,3948 $850 $1,418 $1,701 $2,268 $2,835 $3,685 $4,678Sources: U.S. Department of Housing and Urban Development, NYU Furman Center
ME
THO
DS
S T A T E O F N E W Y O R K C I T Y ’ S H O U S I N G & N E I G H B O R H O O D S I N 2 0 1 4 1 8 7
annual sales file. The ACRIS data are used only if the sale
is not recorded by the time we receive our annual sales file.
The repeat sales price indices are created using statistical
regression techniques. Economists use two basic approaches
to estimate housing price indices: the hedonic regression
(which tries to predict prices based on measurements of the
quality of the unit as well as conditions of the surrounding
neighborhood) and the repeat sales method. Both of these
approaches estimate temporal price movement controlling
for the variation in the types of homes sold from period to
period. Each method has its own strengths and weaknesses.
The repeat sales method controls for housing character-
istics by using data on properties that have sold more than
once. An attractive feature of this method is that, unlike
the hedonic approach, it does not require the (necessarily
imperfect) measurement of house quality; it only requires
that the quality of individual houses in the sample did not
vary over time. The most important drawback of the repeat
sales method is that it is based only on properties that have
sold more than once in the study period. Moreover, proper-
ties that have been sold more than once may not be repre-
sentative of all properties in the market, raising concerns
about sample selection bias. However, as the index period
lengthens, the proportion of properties that have changed
hands multiple times increases. This reduces sample selec-
tion bias but exacerbates another problem: Case and Shiller
(1989) present evidence that homes with longer intervals
between sales have more volatile changes in price, since
the longer the time between sales, the more likely it is that
some external shock to the property itself or the surrounding
buildings has, independent of the price level of housing in
the neighborhood, significantly affected prices.
This report overcomes most of the problems associated
with the repeat sales method. Specifically, the data set used
here is quite large, so we lose little precision by eliminating
properties that sold only once: in the 40 years captured by
our data, 61 percent of residential lots changed hands at
least twice by the end of 2012.
In addition, we use the three-step procedure suggested
by Case and Shiller (1989) and modified by Quigley and
Van Order (1995) to account for the possibility that price
changes are more volatile (that is, have higher variances)
for properties that are sold less frequently.
In the first stage, the difference between the log price of
the second sale and the log price of the first sale is regressed
on a set of dummy variables, one for each year in the sample
except for the base year (2000, when our index is set to
equal 100). For each pair of sales for a property, the dummy
variables have values of +1 for the year of the second sale, -1
for the year of the first sale, and zeros otherwise.
In the second stage, we calculate the squared difference
between the sale price predicted by the first stage and the
actual sale price and regress it on a constant term, the time
interval between sales, and that time interval squared.
This allows us to predict the variance of the differences
between the prices predicted by the stage-one regression
and the actual prices. In other words, we can predict how
reliably the change in prices for a single property reflects
price changes for properties overall.
In the third stage, the stage-one regression is reestimated
by generalized least squares, weighting each observation by
the inverse of the square root of the variance predicted by
the stage-two regression. Essentially, we give lower weight to
price changes for properties that, because there was a large
time interval between sales, are more likely to reflect some
fundamental change in the quality of the property itself or the
immediately surrounding neighborhood and thus less likely
to accurately reflect changes in the housing market overall.
Affordability Analysis of Home PurchasesIn State of Homeowners and Their Homes in Part 2, we pres-
ent an analysis of the down payment and monthly payments
required to purchase homes at various prices using both a
conforming loan and a Federal Housing Administration
(FHA) loan. In both cases we use a 30-year fixed-rate loan.
We base our monthly payment estimate on the following
general annuity formula:
payment =
principal * rate (1 + rate) term
(1 + rate) term -1
Where payment is the monthly mortgage payment, prin-
cipal is the amount of the loan, rate is the monthly interest
rate (or the annual interest rate divided by 12), and term is
the number of monthly payments. We calculate monthly
mortgage payments for a 30-year loan, so the term equals
360 monthly payments. We implement this formula differ-
ently for each loan type.
1 8 8 N Y U F U R M A N C E N T E R • @ F U R M A N C E N T E R N Y U
Under the conforming loan scenario, we assume that the
buyer will make a 20 percent down payment and finance 80
percent of the price of the home. The principal will then be
80 percent of the purchase price. The source of our effec-
tive interest rate for conforming loans is the Freddie Mac
Primary Mortgage Market Survey annual average com-
mitment rate for 30-year fixed-rate mortgages.5 For our
2014 analysis for conforming loans, we used the annual
average rate of 4.17 percent.
Homebuyers using FHA loans may make a down pay-
ment as small as 3.5 percent of the purchase price. Thus, to
estimate an upper-bound estimate of the monthly mortgage
payment under an FHA loan, we assume the purchaser will
make a down payment of 3.5 percent of the purchase price
and finance the remaining 96.5 percent of the purchase
price. The principal will then be 96.5 percent of the home’s
price. Our effective interest rate for FHA loans is the sum
of the FHA interest rate and the FHA mortgage insurance
premium. The source of our FHA interest rate for 2014 is
HSH Associates. From average monthly rates for 30-year
fixed-rate FHA mortgages, we calculated an annual aver-
age mortgage rate for 2014 of 4.36 percent. FHA mortgage
insurance premiums differ based on the percentage of the
purchase price being financed (that is, the loan-to-value
ratio) and the size of the loan. The U.S. Department of Hous-
ing and Urban Development also periodically sets new
insurance premiums. For a loan financing 96.5 percent of
a home’s purchase price during 2014, the annual mortgage
insurance premium was 135 basis points (1.35%) for a loan up
to $625,000 and 155 basis points (1.55%) for a loan of more than
$625,000.6 Due to the larger principal and higher effective
interest rate, monthly payments for an FHA mortgage with
a 3.5 percent down payment will be higher than monthly
payments for a conforming mortgage with a 20 percent
down payment, all else being equal.
Housing Choice VouchersWe use estimates of housing choice vouchers reported by
the U.S. Department of Housing and Urban Development’s
Picture of Subsidized Households data set to calculate the
percentage of renter households in privately owned units
who use such vouchers to subsidize their rent. The Picture
5 Available at http://www.freddiemac.com/pmms/pmms30.htm.
6 U.S. Department of Housing and Urban Development, “Mortgagee Letter 2013-04,” http://portal.hud.gov/hudportal/documents/huddoc?id=13-04ml.pdf.
of Subsidized Households provides tract-level estimates of
the number of units that voucher holders occupy, which we
sum for sub-borough areas (SBAs), boroughs, and the city
overall. Rather than use all rental units as the denominator
for this indicator, we instead choose occupied, privately
owned rental units, because tenants cannot use housing
choice vouchers for public housing units.
We compute the denominator by subtracting the total
number of public housing units from the number of renter-
occupied units in the city. The American Community Survey
(ACS) reports the total number of renter-occupied housing
units, and we obtain the total number of public housing units
from a data set covering all public housing developments
from the New York City Housing Authority.
Consistent with our use of ACS data (described in more
detail above), we use single-year estimates of occupied rental
units at the city and borough levels and three-year estimates
for SBAs. For SBAs, we match annual voucher totals to the
middle year of the three-year ACS estimate of rental units.
For example, we match the number of vouchers in 2010 with
the estimated number of privately-owned rental units from
2009-2011. Because 2012-2014 ACS estimates are not yet avail-
able, we match 2013 voucher estimates with estimated counts
of privately owned rental units from 2011-2013 ACS data.
Mortgage Lending IndicatorsThe Federal Home Mortgage Disclosure Act (HMDA) requires
financial institutions with assets totaling at least $42 million
as of 2013 to report information on loan applications and
originations if they have originated or refinanced any first-
lien home purchase loans on one- to four- family properties
(including condominium and co-op units) in the previous
year. Thus, the HMDA data capture most, but not all, one- to
four- family residential mortgage lending activity. We use
this dataset to calculate the home purchase loan rate, the
refinance loan rate, and a number of derivative indicators.
All figures in our analysis are based on non-business-
related loans on owner-occupied, one- to four- family prop-
erties (including condominiums). We exclude from our
analysis any loans for manufactured or multifamily rental
housing (with five or more units), loans on properties that are
not owner-occupied, and any loans deemed to be business
related (classified as those loans for which a lender reports
an applicant’s ethnicity, race, and sex as “not applicable”).
ME
THO
DS
S T A T E O F N E W Y O R K C I T Y ’ S H O U S I N G & N E I G H B O R H O O D S I N 2 0 1 4 1 8 9
The loans that we consider constituted about 85 percent of
all loan originations in New York City in 2013.
Beginning in 2004, HMDA requires lenders to report
when the spread between the annual percentage rate (APR)
of a loan and the rate of Treasury securities of comparable
maturity is greater than three percentage points for first-
lien loans and five percentage points for junior-lien loans.
In this report, all loans with an APR above this threshold
are referred to as higher-cost loans.
Loan applicants were assigned to a racial/ethnic group
for purposes of our research based on the first reported race
of the primary applicant. However, if the applicant reported
his or her ethnicity as “Hispanic” the applicant was classi-
fied as Hispanic, regardless of the applicant’s reported race.
When an applicant provided information to the lender via
mail, internet, or telephone and did not provide information
on their race, we assigned those loans to the “not reported”
racial category. These loans were included in our city and
borough level analyses but were omitted when calculating
racial shares for our State of New Yorkers table in the New
York City section in Part 3.
Notices of Foreclosure (Lis Pendens)We receive data on lis pendens (LP) filings from a private
vendor, Public Data Corporation. An LP may be filed for
a host of reasons unrelated to a mortgage foreclosure, so
we use a variety of screening techniques to identify only
those LPs related to a mortgage. These techniques include
searching for words within either of the party names and
dropping any LPs that relate to a tax lien or a mechanic’s lien,
or that are originated by a government agency. If the same
property receives any additional LPs within 90 days of the
initial LP, the additional LPs are not included in our rate to
avoid counting the same foreclosure twice.
Properties that Entered REOThe data for this indicator come from two sources—LPs
from Public Data Corporation and residential sales data
from the New York City Department of Finance. Each of
these datasets identifies properties using a unique borough,
block, and lot number (BBL). Starting with the set of all LPs,
we use BBLs to match each LP issued since 1993 with the
most recent sale of that property prior to the LP (if the sale
happened in 1974 or later). We then match the LP to any
sales that occurred within three years from the date of the
LP, and assume that the first such sale was undertaken in
response to the foreclosure filing. To identify transfers into
REO, we search the grantee name field of the first sale after
the LP for the word “bank” or the name of any large bank
or subsidiary. Finally, we check if the name of the grantee
matches the name of the LP servicer. If this is the case we
classify the sale as a transfer into REO.
Units Authorized by New Residential Building PermitsThis indicator measures the number of residential units
in proposed developments approved by the New York City
Department of Buildings (DOB). We compile this indicator
from job filings and permit approvals from DOB, which are
publicly available on DOB’s website for full years starting in
2004.7 In New York City, developers file a job with DOB early
in the development process. These records include many
details about development projects including its extent (for
example, if a project is a new building or alters an existing
one) and, for residential projects, the number of housing
units it will contain when complete. Because developers
can file jobs long before DOB allows construction to begin,
and our source of job filings rarely includes the date that a
project is fully permitted, we must also collect permit data.
Permits, which are associated with jobs, represent partial
or entire approvals of development projects. Permits allow
us to count only the projects in which DOB has approved
structural work, so construction of those buildings is likely
to occur. Because permits lack certain information about
projects—the number of proposed housing units, in par-
ticular—we must merge some detail from jobs to permits.
We consider only permits that meet the following criteria:
• The project will result in a new building
(job type is “NB”);
• The permit authorizes structural work
(permit type is “NB”);
• The development includes residential uses;
• The permit does not renew a previously approved
permit (filing status is “initial”);
• No other permit was filed for the same site
during the previous calendar year.
7 Available at http://www.nyc.gov/html/dob/html/codes_and_reference_materials/statistics.shtml.

1 9 0 N Y U F U R M A N C E N T E R • @ F U R M A N C E N T E R N Y U
When multiple permits on the same site (with the same
building identification number, or BIN) meet these criteria,
we count just the most recently issued permit. Thus, each
permit we retain should represent a unique residential
building project.
The matching process for permits and jobs is somewhat
imperfect. We are able to link most but not all permits to their
associated jobs, because our data source does not include all
job filings. When we cannot find a permit’s matching job, we
instead match the permit to the most recently filed job on the
same BIN as the permit, as long as the job was filed no more
than four years before the permit, and the job includes the
number of units proposed for the site. In 2014, we counted
1,644 permits approved for new residential buildings; of that
number, we matched 1,396 permits to their associated job
and 164 permits to a recently filed job on the same site. We
could not match 84 permits to jobs and therefore did not
find the number of units proposed for those developments.
Accordingly, our measure may somewhat understate the
number of units in the construction pipeline.
Housing Unit Weighting FormulaSeveral indicators included in this report are provided at
geographic levels other than the community district level—
such as police precincts, school districts, or zip codes. We
aggregate data to the community district level, weighting
observations by the distribution of housing units.
For instance, when aggregating the student proficiency
rates from the 32 school districts to the 59 community dis-
tricts, we first calculate the rate for each of the 32 school
districts. If a community district only contains one school
district, then that rate is directly used for the community
district. If multiple community districts fall within the
same school district, we assign the same proficiency rate
to each. If a community district contains portions of more
than one school district, we weight the proficiency rate
from each school district based on the share of all hous-
ing units within the community district that are in that
particular school district.
For example, if community district 1 contains three
school districts, A, B, and C, and of the 100 housing units
in community district 1, 50 are in school district A, 30 are
in school district B, and 20 are in school district C, then the
proficiency rate from school district A would have weight
50/100, the rate from school district B would have weight
30/100, and rate from school district C would have weight
20/100. The proficiency rate for community district 1 would
thus be given by:
rateCD1 = rateA * .5 + rateB * .3 + rateC * .2
Halfway through 2013, a new precinct (the 121st) was cre-
ated in Staten Island from portions of the 120th and 122nd
precincts. Before weighting crime rates from the precinct
to the community district level for 2013, we estimated the
number of crimes for the 121st district as if it had existed for
all of 2013 by multiplying the NYPD data for that precinct
(which represented six months of data) by two. We then
subtracted that number of crimes from the 120th and 122nd
precincts based upon the ratio of crimes attributed to each
precinct from the first half of 2013.
Calculating Distances to ParksFor New York City, each borough, and each community
district, we report the percentage of housing units within
one-quarter mile of a park. To calculate this, we first obtained
a shapefile from the New York City Department of Parks and
Recreation (updated in September of 2014 and available
online through New York City’s open data portal) describ-
ing the geographies of “functional parkland” overseen by
the department.8 We then combine this with a shapefile
we received from the New York State Office of Parks, Rec-
reation, and Historic Preservation containing the geogra-
phies of state-owned parks. Any park the city categorizes
as “undeveloped,” a “lot,” a “mall,” a “parkway,” or a
“strip” is excluded from the analysis, as are parks smaller
than a quarter of an acre.
Because neither the city’s nor the state’s datasets contain
information on the location of park entrances, we identify
entrance points along each park’s perimeter that constitute
our best approximation of actual park entrances and then
calculate walking distances from those entrance points. For
parks with an area of less than two acres, we assume each
vertex of the park polygon approximates a park entrance;
since these parks are small, the actual location of entrances
does not have a large effect on the walkshed (that is, the area
reachable by walking a quarter mile or less along pedestrian
8 Avaliable at https://data.cityofnewyork.us/City-Government/Functional-Parkland/e3uq-vht9.

ME
THO
DS
S T A T E O F N E W Y O R K C I T Y ’ S H O U S I N G & N E I G H B O R H O O D S I N 2 0 1 4 1 9 1
rights-of-way starting at any of a park’s entrance points).
For parks of two acres or larger, the vertices may be too far
apart to realistically approximate actual park entrances; for
example, the four corners of Central Park are a very poor
estimation of the entrances to the park. Thus, we instead
find all the intersections of pedestrian rights-of-way that
fall within 150 feet of the perimeter of these larger parks to
approximate the entrance points. We obtained the pedes-
trian rights-of-way data from the New York City Department
of City Planning’s LION geodatabase of public streets.
After we generate approximate park entrance points, we
use Esri ArcMap’s Network Analyst tool to generate walk-
sheds estimating the areas along pedestrian rights-of-way
that are located within a quarter mile of a park entrance
point. In ArcMap we then select all building lots (which we
get from the New York City Department of City Planning’s
MapPLUTO data) that fall within these walksheds and sum
the total number of residential units on such lots and divide
that number by the total number of residential units in a
given geographic area.
Inflation AdjustmentsUnless stated otherwise, when reporting dollar-denomi-
nated indicators, we adjust amounts to 2014 dollars using
the Consumer Price Index for All Urban Consumers (Current
Series) without seasonal adjustments from the Bureau of
Labor Statistics over all major expenditure classes for the
relevant metropolitan area. This allows for more consistent
comparisons across years for individual indicators. The
inflation-adjusted values include median monthly rent,
median household income, and median price per unit. One
notable exception is the gross rent distribution figures on
the city, borough, and community district data pages in
Part 3; in order to report more reliable data, we used the
pre-compiled summary tables for 2011–2013 and 2013 gross
rent from the American Community Survey, which are listed
in nominal 2013 dollars.

1 9 2 N Y U F U R M A N C E N T E R • @ F U R M A N C E N T E R N Y U
IND
EX
OF C
OM
MU
NITY
DISTR
ICTS
S T A T E O F N E W Y O R K C I T Y ’ S H O U S I N G & N E I G H B O R H O O D S I N 2 0 1 4 1 9 3
The Bronx CD SBA Community District Page
BX 01 101 Mott Haven/Melrose 72
BX 02 101 Hunts Point/Longwood 73
BX 03 102 Morrisania/Crotona 74
BX 04 103 Highbridge/Concourse 75
BX 05 104 Fordham/University Heights 76
BX 06 102 Belmont/East Tremont 77
BX 07 105 Kingsbridge Hghts/Bedford 78
BX 08 106 Riverdale/Fieldston 79
BX 09 107 Parkchester/Soundview 80
BX 10 108 Throgs Neck/Co-op City 81
BX 11 109 Morris Park/Bronxdale 82
BX 12 110 Williamsbridge/Baychester 83
Brooklyn CD SBA Community District Page
BK 01 201 Greenpoint/Williamsburg 88
BK 02 202 Fort Greene/Brooklyn Heights 89
BK 03 203 Bedford Stuyvesant 90
BK 04 204 Bushwick 91
BK 05 205 East New York/Starrett City 92
BK 06 206 Park Slope/Carroll Gardens 93
BK 07 207 Sunset Park 94
BK 08 208 Crown Heights/Prospect Heights 95
BK 09 209 S. Crown Hts/Lefferts Gardens 96
BK 10 210 Bay Ridge/Dyker Heights 97
BK 11 211 Bensonhurst 98
BK 12 212 Borough Park 99
BK 13 213 Coney Island 100
BK 14 214 Flatbush/Midwood 101
BK 15 215 Sheepshead Bay 102
BK 16 216 Brownsville 103
BK 17 217 East Flatbush 104
BK 18 218 Flatlands/Canarsie 105
ManhattanCD SBA Community District Page
MN 01 301 Financial District 110
MN 02 301 Greenwich Village/Soho 111
MN 03 302 Lower East Side/Chinatown 112
MN 04 303 Clinton/Chelsea 113
MN 05 303 Midtown 114
MN 06 304 Stuyvesant Town/Turtle Bay 115
MN 07 305 Upper West Side 116
MN 08 306 Upper East Side 117
MN 09 307 Morningside Hts/Hamilton 118
MN 10 308 Central Harlem 119
MN 11 309 East Harlem 120
MN 12 310 Washington Heights/Inwood 121
QueensCD SBA Community District Page
QN 01 401 Astoria 126
QN 02 402 Woodside/Sunnyside 127
QN 03 403 Jackson Heights 128
QN 04 404 Elmhurst/Corona 129
QN 05 405 Ridgewood/Maspeth 130
QN 06 406 Rego Park/Forest Hills 131
QN 07 407 Flushing/Whitestone 132
QN 08 408 Hillcrest/Fresh Meadows 133
QN 09 409 Kew Gardens/Woodhaven 134
QN 10 410 S. Ozone Park/Howard Beach 135
QN 11 411 Bayside/Little Neck 136
QN 12 412 Jamaica/Hollis 137
QN 13 413 Queens Village 138
QN 14 414 Rockaway/Broad Channel 139
Staten IslandCD SBA Community District Page
SI 01 501 St. George/Stapleton 144
SI 02 502 South Beach/Willowbrook 145
SI 03 503 Tottenville/Great Kills 146
Index of Community Districts
1 9 4 N Y U F U R M A N C E N T E R • @ F U R M A N C E N T E R N Y U
New York City Community Districts
SI01 BK10
BK11
BK13
BK15
BK18
BK17
BK14BK12
BK07
BK06
BK02
BK01
QN02
QN01
QN03
QN04
QN05
QN06
QN07
BX10
BX11
BX12BX08
BX07
BX05BX06
BX09
BX02BX01
BX03BX04
MN12
MN09
MN10
MN11
MN07
MN04MN05
MN06
MN02
MN01MN03
MN08
QN11
QN13
QN12
QN08
QN09
QN10
QN14
BK09
BK08
BK03
BK04
BK16 BK05
SI02
SI03

CO
MM
UN
ITY D
ISTRIC
TS AN
D SU
B-B
OR
OU
GH
AR
EA
S
S T A T E O F N E W Y O R K C I T Y ’ S H O U S I N G & N E I G H B O R H O O D S I N 2 0 1 4 1 9 5
New York City Sub-Borough Areas
503
502
413
501
407
218
411
412
414
408
405
110
410205
402
108
401
409
102
215
107
101
207
403
206
201
210
211
404
109
106
213
305
212
202
217
303
214
310
406
216
204
301
203
208
103
306
302
209
104
309
307
304
105
308