methods for visitor monitoring in recreational and
TRANSCRIPT

Monitoring and Management of Visitor Flows in Recreational and Protected AreasConference Proceedings ed by A. Arnberger, C. Brandenburg, A. Muhar 2002, pages 1-6
1
Methods for Visitor Monitoring in Recreational and Protected Areas:An Overview
Andreas Muhar, Arne Arnberger, Christiane Brandenburg
Institute for Landscape Architecture and Landscape Management,Bodenkultur University, A-1190 Vienna, Austria
Email: [email protected]
Abstract: The objective of this paper is to present a systematic overview on methods used forvisitor monitoring in recreational areas. Emphasis is given on quantitative methods such asdirect observation, video observation, counting devices and registration books. The variousapproaches are discussed with regard to practical, legal and organisational aspects, such ascosts, maintenance requirements, dependence on infrastructure (e.g. electricity), risk ofvandalism or suitability for remote and ecologically sensitive locations.For the design of a visitor monitoring scheme in a specific recreational area it is necessary todetermine the best combination of devices and methods, depending on the objectives of themonitoring program. This relates also to the temporal resolution of monitoring activities(permanent, periodic, selective). In areas where the recreational use is largely depending onexternal factors such as weather, daytime and season, the representativity of a sampling schemebecomes crucial for the statistic validity of the obtained data.As visitor monitoring can also be regarded as an interference with the privacy of the personsbeing monitored, ethic aspects of the application of the various methods must also beaddressed.
INTRODUCTION
Monitoring of vegetation and wildlife inrecreational and protected areas has a long tradition.In particular in national parks, the scientific interestin creating inventories and in observing thedevelopment of ecosystems has often been a drivingforce for the establishment of monitoring schemes.In many countries, systematic long-term researchprograms are seen as part of the duty of a nationalpark service.
Opposed to that, a systematic monitoring ofrecreational uses and visitor flows is rarely carriedout. This is particularly true for the situation in mostEuropean countries, where visitor monitoring, if atall done, is usually organised on an ad-hoc basiswithout systematic planning. Very often, resultsfrom improvised one-day countings are beingextrapolated and used for management decisionwithout consideration of the significance of theresults.
The design of a monitoring project has toconsider many practical, organisational, financialand also legal aspects:
Why should be monitored?The goal of a monitoring scheme has to be
clearly defined. Very often, it is unclear, whether amonitoring campaign is carried out to identifyspecific problems within a protected area, e.g.overuse, or simply to justify funding requests.Other goals could be to check the adherence to
limitations of use, to minimise conflicts betweenuser groups or to collect comprehensible data forplanning decisions such as the allocation ofinfrastructure and services. Every such goal willrequire a different mix of monitoring methods.
What should be monitored?From the definition of the goals of a monitoring
scheme the measurement units can be determined:Number of visitsNumber of (individual) visitorsVisitor load (e.g. visitor hours)Visitor flow (e.g. persons/hour/direction)Visitor density (e.g. persons/length unit of trails)Visitor activities etc.In many cases it will be essential to register notonly the visitors themselves and their activities butalso some external factors which might have aneffect on the visitation such as weather conditions,special events (e.g. sports competitions) or holidays.
Who should be monitored?Not every person encountered in a park or
recreation area is a visitor. The typical motives of avisitor are outdoor recreation or culturalappreciation (Hornback & Eagles 1999). Personsjust passing through (e.g. by car on their way towork) or persons working in a recreational areasuch as forest workers, farmers or park employeesshould therefore not be considered as visitors. Inorder to report visitor numbers, they should not beincluded in use statistics. This distinction is only

MUHAR ET AL.: METHODS FOR VISITOR MONITORING IN RECREATIONAL AND PROTECTED AREAS:AN OVERVIEW
2
feasible in remote areas, whereas in urbanrecreation areas it is almost impossible to identifythe motive of a person entering a park.
In any case, if the goal of a monitoring schemeis to quantify the interactions between humans andthe ecosystem, the total number of persons has to beaccounted, independent from the reasons of theirpresence.
Where should be monitored?Very often, monitoring is primarily carried out
at entrance points (e.g. park gates, parking grounds)or visitor centers. These are also the locations wherecounting stations can easily be installed (electricitysupply, security etc.). This leads to an over-representation of short-time users or users withminimal activity radius (e.g. picnickers) in theusage statistics. If the goal of the monitoringactivities is to quantify interactions between visitorsand the ecosystems, visitor monitoring in the coreareas of a park is essential.
It might be easy to select counting points inrecreational areas with a limited number of entrancepoints or key attractions. In the European context,the more typical situation is an open road or trailnetwork with multiple entrance points. This isparticularly the case in urban forests. In suchsituations, numerous pre-tests will be necessary todetermine the most significant nodes in the trailnetwork for the placement of counting stations.
When should be monitored?In most European countries, systematic long-
term visitor monitoring is hardly ever carried out.The most frequent type of counting activities aresingle-day countings. Very often, expected peakvisitation days (e.g. Sundays in early summer) areselected for counting campaigns, and the resultsfrom these days are then being used to alarm thepublic because of excessive use-levels.
From numerous monitoring projects both inurban and in remote locations we learnt that for theunderstanding of the dynamics of recreational usesit is essential to have data which cover all seasonsand all other external influences such as weather,daytime etc. However, this does not mean thatevery single visitor has to be recorded: For ourtime-lapse video monitoring projects we found thatin heavily used recreational areas a sampling timeof 15 minutes per hour is sufficient (Brandenburg2001).
MONITORING TECHNIQUES
Numerous techniques are available for themonitoring of visitor flows in recreational areas. Inthe following section a short description of eachapproach will be given. A summary of thetechniques and their fields of application is given inTable 1 (see also Watson et al. 2000).
InterviewsOral and written interviews are an integral part
of visitor monitoring concepts. They provide mainlyqualitative information about the needs andmotivations of visitors, their origin, their habits andactivities as well as their routes within arecreational area. When combined with quantitativedata from counting stations, important conclusionscan be drawn for the management.
Direct observationRoaming observers: In many national parks,
rangers also records of the number of people theymeet during their inspections of the area. These datacan be used as additional information within a datagathering process, in particular in remote areas, butneed to be treated cautiously, unless the roaming isset up in a systematic way.
Fixed counting stations: Specific mannedcounting stations are usually only set up for shortobservation periods. However, personnel working atinformation booths, souvenir shops etc. can also beintegrated in a long-term monitoring concept,provided that the circumstances are clearlydescribed (keeping of records also at peak timesetc.).
Indirect observationAutomatic cameras, time-lapse video: Video
recordings or photographs are an excellent source ofinformation for visitor monitoring. In order tomaximise the operating time without maintenance(change of tapes), time-lapse video recorders can beused, which take images at fixed intervals (e.g. 5seconds). Most of the devices availablecommercially had been developed for securitysurveillance of homes, public buildings, factoriesetc. and usually depend on standard electricitysupply.
The main cost factor is the interpretation of thevideo images, in particular, if not only the numberof persons has to be recorded but also other aspectssuch as group size, mode of transport (hiking,biking), direction of movement etc. First attempts toautomate the interpretation with the help of digitalimage analysis had been promising (Muhar et al.1995), yet the calibration of the system for differentlocations and under different seasonal and weatherconditions turned out to be very difficult.
Current development directions areindependence from standard electricity supply (e.g.solar panels with buffer batteries) and wirelesstransmission of image data. There are alreadycommercial systems available which can transmitimage data over a short distance via an infraredinterface, a combination with mobile telephonesseems also possible.
Arial, satellite imagery: Airphotos can only beused for the detection of users in open areas such asbeaches, lakes, grassland, or roads. New high-

MUHAR ET AL.: METHODS FOR VISITOR MONITORING IN RECREATIONAL AND PROTECTED AREAS:AN OVERVIEW
3
resolution satellite images such as those from theIKONOS project will probably take over the role ofconventional airphotos in many fields ofapplication. However, both types of images offeronly a single snapshot of the recreational use, theacquisition of a time series is usually far tooexpensive.
Counting of access permits and ticketsWhere access to an area is restricted either by a
quota or by selling entrance tickets, it is very easyto keep records of the permits or tickets issued tovisitors.
Records from commercial facilities such ascable-cars, ferries, or even restaurants (number ofmeals served) also form a good source ofinformation, provided that private enterprises andpark administrations are willing to cooperate.
Counting devicesAs counting of persons in the field is very
labour-intensive, automatic counting devices areoften applied in order to reduce costs. Some thesedevices have originally been developed for roadtraffic counting and are of limited use for non-roadtraffic.
Turnstiles: The use of turnstiles is usuallylimited to entrance situation of areas with restrictedaccess (e.g. fenced areas) and high visitor numbers.Visitor numbers derived from turnstile countingsare very often over-estimated, in particular whenthe devices are not permanently guarded (childrenlove to play with turnstiles) and serviced (unwantedfreewheeling).
Photoelectric counters: Light barriers, active orpassive infrared sensors, linked with data loggersare very useful counting devices. Their energyconsumption is relatively low, therefore they can beinstalled as battery-supplied counting stations evenin remote locations.
A big challenge for all types of counting devicesis the site-specific set-up and calibration of thecounting station: A counting signal can be triggerednot only by visitors, but also by wildlife or - onwindy days - by twigs. Visitors walking in groups,even visitors with very dark or light clothing mightalso be wrongly recorded (Gasvoda 1999). In ourown projects, we found good correlations betweenmonthly or daily sums of visitors and thecorresponding sensor signals, however, on anhourly basis, the correlation was sometimes weaker.The results illustrated in Fig.1 could only beachieved after a long calibration phase.
A big disadvantage of most of these devices isthat they usually only record the number of visitorsbut not their direction. Differential approaches (e.g.two light barriers at short distance) work only insettings with low use levels.
Fig.1: Correlation between light barrier signals and dailynumbers of visitors at 16 counting days in the DanubeFloodplains National Park
Pressure sensitive devices (Pneumatic tubes,mats): Various types of pneumatic tubes and otherpressure sensitive devices have been developed,mainly for the detection of road traffic. When usedfor counting hikers, there is again a need for a goodcalibration to infer from the number of signals tothe real number of persons (bikers will trigger atube twice etc.).
Inductive loop sensors: These devices areextensively used for the monitoring of road traffic.As the signal is triggered by the movement ofmetallic objects, their application makes sense onlyfor vehicle counting within a recreational area(including bike travel; also horseshoes might triggera signal).
Self-registrationTrail registers: There are two types of trail
registers: In many American parks trail registers areplaced at trailheads on order to monitor the numberof visitors, to check for permits and sometimes alsoto provide information for rescue teams about theintentions of a group. These data can be used todetermine the number of persons entering an areaand their routes, provided that the ratio between thetotal number of visitors and the number of personsactually registering can be estimated (Leatherberry& Lime 1981).
In European countries, registers at trailheads areuncommon, however, registers are sometimesplaced in climbing routes, usually at the end of themost difficult section. They are then a good sourceof information on the number of persons actuallymastering a route.
Summit books: It is again more a (Central)European tradition to place books on summits. Theprimary function of these books is not visitorregistration but rather the provision of a “guestbook”. It is very difficult to determine thepercentage of persons actually signing theses books.As a general rule, the higher the number of visitors,the lower will be the percentage of registration. Onthe other hand, on “famous” peaks, more peoplewill like to have their names in these books than on“normal” hikes.
R2 = 0,94
0
200
400
600
800
0 200 400 600 800 1000observed persons
coun
ter s
igna
ls

MUHAR ET AL.: METHODS FOR VISITOR MONITORING IN RECREATIONAL AND PROTECTED AREAS:AN OVERVIEW
4
Hut or campground registers: In many areas it iscompulsory to register in a hut or campgroundwhen staying overnight. Therefore data derivedfrom these registers can be quite reliable. Theregistration usually also includes data on the originof the visitor and the next destination. Therefore,they can be a useful source for the determination oftypical routes (Muhar 2001).
In some areas e.g. of the Alps, also day visitorsregister in huts, but the percentage of registeredvisitors can vary from hut to hut, depending on theplacement of the register within the hut, the policyof the warden and also the weather: In dubiousweather situations, more hikers would register in ahut and leave information on their next destinationin order to be found by rescue teams.
Mapping of traces of useAlthough it is obvious that there is a correlation
between the intensity of recreational use and“traces” left by the users in the landscape, it is verydifficult to conclude from the mapping of thesetraces to actual visitor numbers (Coch & Hirnschal1998).
Garbage: The amount of garbage left either inbins or in the landscape certainly is not onlycorrelated to visitor numbers, but also to individualbehaviour and local traditions.
Trail deterioration, damage to vegetation: Longlasting effects of recreational use are often seen asan indicator for overuse, however, there are somany other factors that contribute to this (e.g. traildesign). Also, once a trail is already damaged,deterioration will continue even with lower uselevels.
Footprints and sandbeds: Footprint data are usedextensively in wildlife monitoring. In areas with
low use levels human footprints can also becounted. As the age of a footprint is difficult todetermine, it would, again similar to a techniqueapplied in wildlife studies (Angold et al. 1999), bepossible to provide sandbeds which are checked andraked at regular intervals.
USEFUL COMBINATIONS OF METHODS
It is obvious, that in the design of a monitoringscheme a mix of methods will be considered inorder to compensate for the disadvantages of singlecounting techniques and to derive additionalinformation from comparisons and correlations.
As an example, temporally selective counting atmany different locations can be combined withpermanent video observation on a few selectedsites. Once the correlation between the variouslocations has been established, an extrapolation ofthe number of visitors can be performed.
Also visitor counting at selected locations canbe combined with qualitative interviews on themotivation of visitors and their routes in order todetermine the visitor load in different sections ofthe area (Arnberger et al. 2000).
One of the big advantages of combinedmonitoring schemes is the possibility to crosscheckdata from one method with data from a differentmethod. Fig.2 shows the results of differentapproaches to determine the percentage of dogskept on leash in the Danube Floodplains NationalPark. In this park it is compulsory to keep dogs onleash.
ora l in te rv iew s x x x x x xw ritten in te rv iew s x x x x x xroam ing o bserv e rs (x ) (x ) (x ) (x ) (x ) (x ) (x )fixed cou n ting s ta tio ns x x x x x xau to m a tic cam eras x x x x x xtim e-lapse v ideo x x x x x xaria l, sa te llite im agery (x ) (x ) (x ) (x ) (x )ticke ts so ld xperm its issue d x xtu rn s tiles x (x ) (x )pho toe lec tric c oun te rs x (x ) (x )p ress ure sens itive m a ts x (x )pneum atic tubes x (x )ind uc tiv e loop se nsors (x ) (x )tra il reg is te rs x x (x ) xsum m it b ooks x x x xhu t reg is te rs x x x xgarbag e x (x )tra il d e te rio ra tion x (x )dam age to ve ge ta tion (x ) (x )foo tp rin ts x (x ) (x )sandb ed x (x )
se lf-reg is tra tion
d irec t m e thods
ind ire c t m e thods
m app ing o f trac es o f use
d irec t obse rva tio n
ind irec t observa tion
cou n ting o f a cces s perm its
in te rv iew s
cou n ting dev ic es
Table 1: Techniques for visitor monitoring and their fields of application

MUHAR ET AL.: METHODS FOR VISITOR MONITORING IN RECREATIONAL AND PROTECTED AREAS:AN OVERVIEW
5
People were interviewed at a visitor informationboth about their willingness to accept this rule. Atthe same location the actual number of dogs onleash was counted. The results were almostidentical. However, the data from a hidden videoobservation station a few minutes away from theinformation booth show a much lower percentagefor the same day. On days when the informationboth was not manned, the percentage was evenlower.
Fig.2: Rate of dogs kept on leash in the Danube FloodplainsNational Park, determined from different data gatheringmethods (Brandenburg 2001)
DISCUSSION
Ethic aspectsSome visitor monitoring methods can be seen as
an intrusion into the private sphere of a visitor. Thisis true for most methods where images are taken(video recordings, automatic cameras), but also forother methods of hidden observation (humanobservers), in particular in remote locations, wherevisitors do not expect to be watched: In urbanenvironments, people are already quite familiar withvideo surveillance, and it can even bee seen as amotive to visit remote areas, that one can behavethere more freely, without being monitored.
However, as discussed in Fig.2, data on thebehaviour of visitors derived from hiddenobservation can be much more realistic than fromopen observation (see also Vanderstoep 1986)
For our own research projects, we established arule that every observation station (video camera)should be set up in a way, that it is not possible toidentify individual persons in these images. Theimage resolution is just fine enough to count peopleand to identify e.g. their direction of movement, butnot to identify the individual. As a secondprecaution, we do not use persons from the studyareas as interpreters, who might be able to inferfrom identifiable behaviour to certain locally knownpersons. Nevertheless, we think that park managersshould be very cautious when installing videocameras in remote locations; wherever possible,alternative solutions should be considered.
VandalismCounting devices in unguarded situations are of
course exposed to vandalism. The mildest form of
vandalism is the manipulation of devices so thatthey report no or wrong results, but sometimes gearwill also be completely destroyed. We found thatlight barriers are in particular attracting vandals,even when we had the impression that they werewell hidden. In such cases the application of totallyburied counters (pressure sensitive devices) mightbe a useful alternative.
Costs vs. accuracyMany devices currently used for visitor
monitoring are mass products from the securitysurveillance sector. Therefore the hardware costsare no longer a big issue. The main cost factor arelabour costs, for the installation and maintenance ofcounting devices, for conducting interviews or forthe analysis of data (e.g. video interpretation). It iscrucial for the success of a monitoring concept thatfrom the beginning the required accuracy level isclearly identified. Reasonable accuracy can bedefined as the level which is good enough to detectchanges that are significant for managementdecisions (Hendee et al. 1990).
CONCLUSIONS AND OUTLOOK
A large number of techniques and methodshave been developed for visitor monitoring.
From our point of view there are three keyissues for the future developments in visitormonitoring:
Awareness of decision makers: First of all, thereis still not enough awareness of the needs of visitormonitoring and management. At least in theEuropean context, there is a big gap between theimportance of recreation for the public and theresources invested into the management ofrecreational and protected areas as well as intoresearch activities.
Standardisation of methods: It is very difficult tocompare results from different areas when alsodifferent methods are applied. While for examplewithin the US Forest Service a nation-widemonitoring program with standardised methods hasbeen installed (English et al. 2001), not much hasbeen done at the European level. On aninternational level, there are initiatives to establishstandardised guidelines for visitor monitoring(Hornback & Eagles 1999). However, theseinitiatives did not have much response yet atnational level.
Development of more reliable automaticsensors: As discussed above, privacy of visitorsmust be respected. Video monitoring, althoughwell-tried, and delivering excellent results forfurther analysis, will always remain a criticisabletechnique in this context. We hope that in the futuremore reliable automatic counting devices withbetter options for analyses (e.g. direction ofmovement) will be available.
52
53
32
25
- 20 40 60 80 100
stated in interview
observed by visible count ingperson
observed by hidden video oncount ing day
yearly mean of video observat ion
percentage of dogs kept on leash

MUHAR ET AL.: METHODS FOR VISITOR MONITORING IN RECREATIONAL AND PROTECTED AREAS:AN OVERVIEW
6
REFERENCES
Angold, P.G., J.E. Underhill, A. Sangwine (1999). A Method toAssess the Extent of Road Avoidance by Wildlife on RoadVerges in Deciduous Woodland Habitat in the UK. In: Proc.Fifth International Conference on Roads And Wildlife,Missoula, Montana, USA 16-19 September 1999.
Arnberger, A., Ch.Brandenburg, A.Muhar (in print): Anintegrative concept for visitor monitoring in a heavily usedconservation area in the vicinity of a large city: the Danubefloodplains National Park, Vienna. Proc. North-EasternRecreation Research Symposium 2001, Bolton Landing NY
Arnberger, A., Brandenburg, C., Cermak, P., & Hinterberger, B.(2000): Besucherstromanalyse für den Wiener Bereich desNationalpark Donau-Auen/Lobau: GIS-Implementierungund erste Ergebnisse. [Analysis of visitor flows in theViennese part of the Danube Floodplains National Park –GIS implementation and first results] In: Strobl, J.,Blaschke, T., & Griesebner, G., Eds., AngewandteGeographische Informationsverarbeitung XII AGITSymposium 2000. Wichmann Verlag, Heidelberg, 216-227.
Brandenburg, C. (2001): Erfassung und Modellierung vonBesuchsfrequenzen in Erholungs- und Schutzgebieten.[Registration and Modeling of Visitor Loads in Recreationaland Protected Areas], PhD thesis, Institut fürFreiraumgestaltung und Landschaftspflege, Universität fürBodenkultur, Vienna.
Coch, Th., & Hirnschal, J. (1998): Besucherlenkungskonzepte inSchutzgebieten [Visitor management concepts in protectedareas]. Naturschutz und Landschaftspflege 30, 382-388
English, D.B.K., S.M.Kocis, S.J. Zamoch, J.R. Arnold (2001):Forest Service National Visitor Use Monitoring Process:Research Method Documentation. http://www.fs.fed.us/recreation/recuse/methods/methods052001.rtf
Gasvoda, D. (1999): Trail Traffic Counters Update. UnitedStates Department of Agriculture; Forest ServiceTechnology & Development Program; Missoula, MontanaDocument #9924-2835-MTDC. http://www.sctrails.net/trails/fspubs/trafficcounter/index.htm
Hendee, J.C., G.H.Stankey, R.C.Lucas (1990): WildernessManagement. North American Press, Golden, Colorado.
Hornback, K.E., P.F.J. Eagles (1999): Guidelines for Public UseMeasurement and Reporting at Parks and Protected Areas.IUCN, Gland, Switzerland
Leatherberry E.C., & Lime, D. (1981): Unstaffed TrailRegistration Compliance in a Backcountry Area, in:Research Paper NC-214, North Central Forest ExperimentStation, St. Paul.
Muhar, A., R.Zemann, M.Lengauer (1995): Permanent time-lapse video recording for the quantification of recreationalactivities. Proc. Decision support systems 2001/ResourceTechnology 94; Am.Soc.Photogrammetry and RemoteSensing, Bethesda, pp.219-229
Muhar, A. (2001). Erholungsnutzung und Besucherlenkung. In:LIFE-Projekt Wildnisgebiet Dürrenstein, ForschungsberichtBegleitforschung 1997-2001. [Recreational use and visitormanagement in the Dürrenstein Wilderness Area] Amt derNÖ. Landesregierung, St.Pölten, pp. 285-313
Vanderstoup, G.A. (1986): The Effect of PersonalCommunication and Group Incentives on DepreciativeBehaviour by Organized Groups in a National Park, PhDthesis, Texas A&M University
Watson, A.E., D.N.Cole, D.L.Turner, P.S.Reynolds (2000):Wilderness Recreation Use Estimation: A Handbook ofMethods and Systems. USDA, General Technical ReportRMRS-GTR-56

Monitoring and Management of Visitor Flows in Recreational and Protected AreasConference Proceedings ed by A. Arnberger, C. Brandenburg, A. Muhar 2002, pages 7-13
7
Visitor Structure of a Heavily Used Conservation Area:The Danube Floodplains National Park, Lower Austria
Arne Arnberger, Christiane Brandenburg
Institute for Landscape Architecture and Landscape Management, Bodenkultur University,1190 Vienna, Austria
Email: [email protected]
Abstract: National parks in close proximity to large conurbations are not subject to the normalconflicts between conservation and ecological tourism but to those between conservation andurban recreational requirements. The Danube Floodplains National Park, Lower Austria issituated to the east of Vienna, the capital city of Austria, with a population of 1.6 million.Between June 2000 and May 2001, visitors were monitored in the Lower Austrian part of theNational Park. An analysis of the results of the interviews, as well as their integration with theresults obtained using long-term video monitoring, counts by human observers and routeanalysis, led to the identification of specific visitor categories with individual behavioralpatterns and spatio-temporal distribution. In particular, regular recreational visitors fromadjacent residential areas were very concerned about overcrowding and would react to the highvisitor frequency through a change in their habits. This alteration of visiting habits would leadto grave problems for the environmental management of the National Park.
INTRODUCTION
Conservation areas, such as national parks, inclose proximity to large conurbations presentmanagers and researchers with a variety ofchallenging problems, due to the high number ofvisitors and the multifaceted visitor structure(Heywood, 1993). The visitor structure ischaracterized by a high percentage of visitors whocome from the adjacent suburbs and villages usingthe park for everyday spare-time activities, such aswalking the dog, jogging, and picking flowers. Onlya low number of tourists explicitly wants to visitconservation areas to experience nature (Arnberger,Brandenburg 2001). The temporal stress on suchareas is not limited to the weekends or particularseasons; due to the varying motives visitors havefor visiting the protected areas, there is a continualhigh daily visitor stress throughout the year. Themanagement of protected areas is made even moredifficult if a recreational area, which has existed fordecades and been used intensively, is converted intoa national park. Traditional behavior patterns, long-established claims regarding its use and excellentlocal knowledge make management measures,limiting its use for leisure time activities, eventhough inevitable from the conservation standpoint,more difficult. These national parks, therefore, arenot subject to the normal conflicts betweenconservation and ecological tourism but to thosebetween conservation and urban recreationalrequirements.
If there are particular attractions at one locationwithin an already highly-frequented conservationarea, such as a well-developed recreationalinfrastructure (parking sites, easy accessibility) or
natural features, visitors will be attracted for avariety of reasons and needs. If visits by theseindividual groups coincide also temporally this canlead to conflicts between the groups, due to theirspecific individual requirements and high numbers,as well as to negative influences on the nature of thearea. In order to develop strategies to mitigatenegative consequences associated with use,managers must be able to quantify the types andamount of use that occur. Some sound knowledgeof the visitor structure is, therefore, one of the mostimportant challenges and tasks in the developmentof national parks.
The Danube Floodplains National Park standsbetween these two fields of interest - conservationand the requirements of an urban population fornearby recreational possibilities. Taking the mostfrequented access point of the National Park as amodel example, a discussion follows on the visitorstructure and the resulting problems for themanagement of the area. This visitor monitoringstudy (Arnberger, Brandenburg, in press), whichcombines long-term monitoring and survey data,was commissioned by the Danube FloodplainsNational Park Administration, Lower Austria.

ARNBERGER, BRANDENBURG: VISITOR STRUCTURE OF A HEAVILY USED CONSERVATION AREA:THE DANUBE FLOODPLAINS NATIONAL PARK, LOWER AUSTRIA
8
Fig. 1: The Danube Floodplains National Park, (the Lower-Austrian section is outlined in black)
STUDY AREA
The Danube Floodplains National Park issituated to the east of Vienna, the capital city ofAustria, with a population of 1.6 million. TheLower-Austrian section of the National Park, withan area of 6.900 hectares, extends about 38kilometers along the Danube river from Vienna tothe border of Slovakia. In 1997, the DanubeFloodplains, Lower Austria, were declared aNational Park, and received internationalrecognition, IUCN category II.
The location "Orth Uferhaus" is the mostfrequently used entrance. This entry point lies onthe north bank of the Danube, south of the village ofOrth, with a population of approximately 1,800.Orth is only 15 kilometers distant from the Viennacity limits. It is easy to reach this location by car -public transportation, on the other hand, is notoptimal. The entrance "Orth Uferhaus" offers thevisitors an abundance of attractions and manifoldpossibilities for recreation in the attractiveenvironment of the Danube with its old arms. The"Orth Uferhaus" is well known for the followingreasons:
� a traditional excursion restaurant withexcellent cooking,
� a large parking area only a short distancefrom Vienna and the National Park,
� close to highly frequented transnationalbiking routes,
� close to the village of Orth,� starting or meeting point for excursions into
the National Park,� hiking trails, possibilities for swimming,
children's playgrounds, renovated mills,� the only ferry across the Danube east of
Vienna,� boat rentals and a small yacht harbor.
METHODS
Between June 2000 and May 2001, visitors weremonitored in the Lower Austrian part of theNational Park. As the quality of data collected inshort-term monitoring campaigns is heavily affected
by statistical variations, the use of long-termmonitoring is a very important complement toshort-term, in-depth visitor observation andinterviews. Therefore, the combination of long-term monitoring and survey data, obtained usingvarious methods, permitted a thorough analysis ofvisitor activities.
Permanent time-lapse video recording: Video-cameras were installed at two access points tomonitor recreational activities (see Leatherberry &Lime 1981) year round, from dawn to dusk. For theanalysis, only 15-30 minutes of observations perhour were taken into account, but this had nonegative impact upon the significance of the results(Brandenburg 2001, Muhar, Zemann & Lengauer1995). Given the type of video system installed, itwas not possible to identify individual persons, soanonymity can be guaranteed.
Interviews: At 11 main entrance points into thePark, visitors were interviewed on eight days; theinterviews took place on a Thursday and theimmediately following Sunday, in March, June,August and September. The survey was conductedon days with fine weather, to permit the collectionof as much data as possible. The total sample sizefor this study was 394.
Personal observations: Additionally, at 11 mainentrance points to the Park and on the days of thesurvey, visitors were counted; the results ofcounting were combined with video data forextrapolating the total number of visitors per year.
Analysis of the visitor routes (frequency maps):As part of the survey, visitors were asked to markthe route through the National Park which theytook, or planned to take, on a simple map. Bylinking the data from the interviews, with the helpof an Access database, an analysis by topic waspossible and the respective routes could be madevisible via GIS (Arnberger, Hinterberger et al.2000).
Infrared Sensors: Infrared sensors wereinstalled at six (entrance) points to monitorrecreational activities, year round. The sensorswere properly calibrated by test series and bycounting persons.

ARNBERGER, BRANDENBURG: VISITOR STRUCTURE OF A HEAVILY USED CONSERVATION AREA:THE DANUBE FLOODPLAINS NATIONAL PARK, LOWER AUSTRIA
9
June 00–May01
Long-termvideo
monitoring
Permanentregistration by
infrared sensors
8 days
2 entrancepoints
6 entrancepoints
June 00–May 01
InterviewsRoute
registrations
Extent of recreational use of an area
Temporallyselectivecounts
6 entrancepoints
8 Days
6 entrancepoints
Fig. 2. Methods of Data-collection
OVERVIEW OF RECREATIONAL USAGE INTHE LOWER-AUSTRIAN SECTION OF THE
NATIONAL PARK
From the video monitoring and counting data itcould be calculated that there were close to 400,000visits to the Lower-Austrian section of the NationalPark in the year of the study. The visitor densitywas calculated as 55 visits per year/per hectare.May was the month with the most visits, the fewestwere registered in December. Sunday afternoonswere the most highly frequented periods. One thirdof recreationists visited the national park at leastonce a week. The main users of the national parkenjoyed biking and hiking, and a minority wentjogging and canoeing. Only 4% of recreationistsinterviewed came due to motives focusing on theNational Park (see fig. 3). More than 50% of thevisitors to the National Park arrived in private cars.
4%
16%
35%
7%
28%
5%
6%
0% 10% 20% 30% 40%
Other reasons
National park
Close to residence
Local gastronomy
Sport
Recreation
Nature
Proportion
Fig. 3: Main reason for visit (n = 231)
QUANTIFICATION AND TEMPORALDISTRIBUTION OF LEISURE-TIME
ACTIVITIES AT THE MAIN ACCESS POINT"ORTH UFERHAUS"
The video observation of the access road to thelocation "Orth Uferhaus" showed 224,000 visitorsentering the National Park, either on foot or using avehicle, during the year of our research. The highseason for visiting this location was the periodbetween April and August. In May, 30,000 visitswere registered. Itemized, according to the time ofthe year, we see that visitors using bicycles ormotorbikes only arrive during the warm season.
0
5.000
10.000
15.000
20.000
25.000
30.000
35.000
Jan 0
1
Feb 0
1
Mar 0
1
Apr 0
1
May 0
1
Jun 0
0
July
00
Aug 0
0
Sept
00
Oct 0
0
Nov 0
0
Dec 0
0
Numb
er of
Visi
tors
Cars Bikers Motorbikes Bus Hikers
Fig. 4:Yearly progression of visitors according to means oftransportation (Video-recording)
The highest visitor frequency was recorded onSundays and public holidays. All user groups wereconcentrated on the weekends.
0
200
400
600
800
1.000
1.200
1.400
Mond
ay
Tues
day
Wed
nesd
ay
Thur
sday
Frida
y
Satu
rday
Sund
ay
Holid
ay
Aver
age N
umbe
r of V
isito
rs pe
r day
Car Biker Motorbike Bus Hiker
Fig. 5: Weekly progression of visitors according to means oftransportation (Video-recording)
As can be seen, the highest frequency of visitorsoccurred on the weekends of the spring andsummer. The daily results showed a peaking atnoon and in the afternoon.
CATEGORY OF VISITORS AT THELOCATION " ORTH UFFERHAUS"
An analysis of the results of the interviews, aswell as their integration with the results obtainedusing video, counts and route analysis, led to theidentification of five specific visitor categories withindividual behavioral patterns and spatio-temporaldistribution at this area. The linkage of video datawith the data from our questionnaires concerned,principally, the choice of the means of transport(see fig. 6). Based on the results of a year-longvideo-observation the number of visits, werequantified according to the category of visitor.

ARNBERGER, BRANDENBURG: VISITOR STRUCTURE OF A HEAVILY USED CONSERVATION AREA:THE DANUBE FLOODPLAINS NATIONAL PARK, LOWER AUSTRIA
10
0% 20% 40% 60% 80% 100%
Nature
Sport
Recreation
Proximity toresidence
Gastronomy
Proportion
On foot Bike Car Public transport (bus) Motorbike
Fig. 6: Principal reason for visiting / according to means oftransportation (n = 231)
The person interested in nature as visitor to theNational Park
This person usually arrives by car or,sometimes, by bicycle to visit this natural regionand/or the National Park. The main visiting periodsare the weekends and spring.
The gastronomic- visitorThe gastronomic-visitor chooses this entrance
solely because of the specialties offered in the"Ufergasthaus" restaurant. The National Park doesnot play a role in his decision-making process.
This category of visitor predominantly arrivesby car, concentrated at noon (see fig.7). A hikethrough the national park is unusual.
0
5
10
15
20
25
30
6 8 10 12 14 16 18 20
Time
Aver
gae n
umbe
r of c
ars a
nd m
otorb
ikes p
er
hour
s
Inn closed (Wed.) Inn open (Mo., Tu., Th., Fr.)
Fig. 7: Average daily progression, on workdays, of the numberof cars and motorbikes travelling towards Orth, for the periodOctober 2000 until Mai 2001. Video-observation.
The sporty, active typeThis category of visitor usually arrives in the
Danube Floodplains by bicycle or are joggers. Thepeak season is between April and August.
The person seeking recreationThe person seeking recreation predominantly
arrives in the Danube Floodplains by car or bicycle.Weekend afternoons in spring and summer are theprincipal periods.
Characteristics Interested innature andNational Parkvisitor
Recreation seeker Gastronomicvisitor
Sporty, active Visitors forwhom theNational Park isa part of theimmediateenvironment
Access Car, bicycle (publictransport)
Car, bicycle Car (Motorbike, onfoot, bicycle)
Bicycle, car, on foot On foot, bicycle,car
Relativepercentage at thelocation "OrthUferhaus"
33 % 23 % 19 % 15 % 10 %
Main reason forvisiting
To experiencenature and thelandscape, NationalPark
Recreation Gastronomy Sport Proximity to homeRecreation
Origin Vienna, provinces East Austria Vienna Proximity to theNational Park,abroad
Settlementsbordering on theNational Park
Duration More than 2 hours Approx. 2 hours Less than 2 hours More than 2 hours Less than 2 hoursRegularity ofvisiting
At least once amonth
At least once amonth
Less than once amonth
Less than once amonth
At least onceweekly
Main day of visit Weekend Weekend During the weekand also at theweekend
During the weekand also at theweekend
During the weekand also at theweekend
Time of theNational Park visit
All day At noon and in theafternoon
At noon All day Early and late inthe day
Average distancecovered
7,6 km 10,6 km 3,4 km 16,5 km 8,2 km
Main season Year-round, withpeak in spring
Year-round, withpeak in spring
Year-round, withpeak in spring
Bicyclist betweenMay and August,Joggers year-round
Year-round, withpeaks in springand early summer.
Table 1: Categories of visitors at the location Orth Uferhaus. Source: Surveys (n = 394(76)), Surveys of the route, counting, video-observation

ARNBERGER, BRANDENBURG: VISITOR STRUCTURE OF A HEAVILY USED CONSERVATION AREA:THE DANUBE FLOODPLAINS NATIONAL PARK, LOWER AUSTRIA
11
Persons for whom the National Park is a part oftheir immediate environment
This group, from the nearby settlements (up to1,5 km from the National Park), arrives in theNational Park on foot, by bicycle or by car. Theduration of their stay is the shortest of all visitorcategories. They visit the National Park at theweekend and also during the week.
Due to the many possibilities offered, thelocation "Orth Uferhaus" is a center of attraction forvisitors of the most varied categories.Approximately only one-third is really interested inthe environment or the National Park. One hundredand fifty thousand visitors have other motives fortheir visit.
Motive for visit visits/aNature: 56.000National Park: 18.000Total 74.000
Motive for visit visits/aRecreation: 51.000Gastronomy: 43.000Sports activities: 34.000Close to area: 22.000Total 150.000
33 %of all visits are nature
and national park related
67 %of all visits are not natureand national park related
Fig. 8: Categories of visitors and frequencies at the main accesspoint to the National Park
EFFECTS OF THE HIGH NUMBER OFVISITORS
Within the scope of our survey, visitors werealso asked to give their views on the number ofvisitors. One-third was of the opinion of all visitorsthat the frequency was very high, particularly in thevicinity of the "Orth Uferhaus" and here,particularly at weekends in spring and in summer.Every second person interviewed at the access point"Orth Uferhaus" thought that there were a greatnumber of or too many visitors. In particular,regular recreational visitors from adjacentresidential areas were very concerned aboutovercrowding (see table 2).
Residenceadjacent toNational Park
Residence inEasternAustria
Residence inWesternAustria orabroad
Appropriatenumber ofvisitors in theNP
49 % 71 % 83 %
Very many ortoo manyvisitors in theNP
51 % 29 % 17 %
Table 2: Occurrence of visitors with residence (n = 385;PearsonChi-Square: Value: 25,347, df: 2, Sig. 0,000)
Those seeking recreation were asked to explaintheir reactions to the large number of visitors. Thisquestion is of particular importance for themanagement of the area because a spatial ortemporal modification of the visitors to the byroadsor to the evening or morning hours would lead toadditional stress being placed on the animal worldthrough leisure time activities. More than half ofthe interviewed groups, who stated that there weretoo many visitors in the National Park, alter theirbehavior. A change of their itinerary or othervisiting times are the most common reactions to thehigh number of visitors (see fig. 8).
2%
2%
3%
22%
45%
27%
0% 10% 20% 30% 40% 50%
I use area in anotherway
Other reactions
I go to otherrecreation areas
I use other trails
I come at other times
No reaction
Proportion
Fig. 9: Reactions to the large number of visitors (n = 125)
Above all, recreationists living in the vicinity orcoming regularly, would react to the high visitorfrequency through a change in their habits. Ofthose members of this group, 60% change the habitsof their visits (see fig. 9).
60% 56%
14%0%
15%
30%
45%
60%
75%
Residence adjacentto National Park
Residence in East-Austria
Residence in West-Austria or abroad
Prop
ortio
n
Altered visiting behavior due to overcrowding
Fig. 10: Visitor reactions according to place of residence(n = 125)
This shows that visitors from Vienna and theother Austrian provinces partially oust the localpopulation from their traditional surroundings. Thisalteration of visiting habits would lead to graveproblems for the environmental management of theNational Park. Due to the existing pressure,resulting from the large number of visitors, there arehardly any rest areas or rest periods for the

ARNBERGER, BRANDENBURG: VISITOR STRUCTURE OF A HEAVILY USED CONSERVATION AREA:THE DANUBE FLOODPLAINS NATIONAL PARK, LOWER AUSTRIA
12
endangered species. If there was an alteration in thehabits of those seeking recreation, these animalswould be concentrated into even smaller areas andtheir rest periods would be even more reduced. Thispressure would lead to the environmental potentialof the National Park not being optimally utilized, inrespect to the number of species and individualanimals (see also Sterl et al., in print). The extreme,permanent recreation pressure seems particularlycritical from the point of view of wildlife ecologistsas the National Park represents the only remainingmigratory corridor between the Alps andCarpathians (Völk 2001). Therefore, overcrowdingis one of the main, principal challenges for the parkmanagement.
CONCLUSIONS
The high visitor frequency at the location "OrthUferhaus" and in the entire National Park is onlycaused, to a minor extent, by visitors to the NationalPark and other nature areas. The necessity forrecreation, along with the traditional recreationalhabits of the Viennese, leads to high stress beingplaced on this conservation area. Seeing thatsuitable areas for this group of visitors to theNational Park do not exist within the urban area ofVienna, or that these have already reached theirsocial carrying capacities (e.g., the upper section ofthe Lobau in the Viennese section of the NationalPark), other nearby recreational areas arefrequented. Urban inhabitants are now highlymobile and can, therefore, take advantage of moredistant recreational offers. This is accompanied bytraffic problems, particularly during the weekends,and an exceeding of the social and ecologicalcarrying capacity of some sections of the NationalPark, such as near the entrance "Orth Uferhaus".Measures to regulate visitors in the area arenecessary and can only be precisely targeted usingthe information on the types of visitor availablefrom the visitor monitoring of the National Park.
In the neighboring residential areas, building isproceeding rapidly, an increasing number of citydwellers is looking for recreation in natural areasand motorization is increasing. It can, therefore, beassumed that there will be an intensification ofrecreational activities in the National Park. Inaddition, advertising and improvements to therecreational infrastructure (visitor centers) will alsoincrease the reputation of the National Park. Thiswill lead to visitors to the National Park beingincreasingly, explicitly addressed. These additionalvisitors will affect the quality of the outdoorexperience of others and their own needs were notsatisfied.
The National Park is not able to solve thesedescribed problems and tendencies by itself, a formof co-operation with the City of Vienna and theGovernment of Lower Austria is essential in orderto establish sustainable measures in the areas ofurban, regional and traffic planning which can be
kept within, more or less, acceptable ecological andsocial limits. Measures taken at the source itself,such as improvements to the housing environmentthrough the establishment of convenient greenareas, in addition to a buffer zone around theNational Park - particularly around the Viennesearea - would be some possible approaches to areduction of visitor pressure (Arnberger,Brandenburg 2001).
PERSPECTIVES
Through the linkage of data on year-long visitorfrequency with the survey results and weather data(Brandenburg 2001) it is possible to develop aspatio-temporal model for the prediction of the flowof visitors to the National Park combined with theircategories. This would be a proactive approach tomanaging carrying capacity. The realization thatvisitor behavior changes due to higher visitordensity makes research into the social carryingcapacity, as well as on crowding issues (Shelby &Heberlein 1986, Manning 1999), based on the typesof visitors and in combination with long-term videodata seem absolutely imperative. Additionally, dataon visitor flow forms the basis for studies on theeffects of recreational usage on the fauna (see Sterlet al. in press), particularly in respect to wildlifeecology and the flora.
REFERENCES
Arnberger, A., Brandenburg, C., (in press): Besuchermonitoringim Nationalpark Donauauen, Niederösterreichischer Anteil[Visitor Monitoring in the Danube Floodplains NationalPark, Lower Austria], Forschungsbericht im Auftrag derDonau-Auen GmbH, Institut für Freiraumgestaltung undLandschaftspflege, Universität für Bodenkultur, Vienna.
Arnberger, A., Brandenburg, C. (2001). Der Nationalpark alsWohnumfeld und Naherholungsgebiet - Ergebnisse derBesucherstromanalyse im Wiener Anteil des NationalparkDonau-Auen [The National Park as Residential Environmentand Regional Recreation Area - Analysis Results of VisitorFlows in the Viennese Section of the Danube FloodplainsNational Park ] In: Naturschutz und Landschaftsplanung 33(5), 157-161.
Arnberger, A., Brandenburg, C., Cermak, P., & Hinterberger, B.(2000). Besucherstromanalyse für den Wiener Bereich desNationalpark Donau-Auen/Lobau: GIS-Implementierungund erste Ergebnisse. [Analysis of visitor flows in theViennese part of the Danube Floodplains National Park –GIS implementation and first results] In: Strobl, J.,Blaschke, T., & Griesebner, G., Eds., AngewandteGeographische Informationsverarbeitung XII AGITSymposium 2000. Wichmann Verlag, Heidelberg, 216-227.
Brandenburg, C. (2001). Erfassung und Modellierung vonBesuchsfrequenzen in Erholungs- und Schutzgebieten –Anwendungsbeispiel Nationalpark Donau-Auen, TeilgebietLobau. [Registration and Modeling of Visitor Loads inRecreational and Protected Areas], Institut fürFreiraumgestaltung und Landschaftspflege, Universität fürBodenkultur, Vienna.
Heywood, J. (1993). Behavioral Conventions in Higher Density,Day Use Wildland/ Urban Recreation Settings: APreliminary Case Study, in Journal of Leisure Research,Vol. 25, No. 1, 39-52.
Leatherberry E.C., & Lime, D. (1981). Unstaffed TrailRegistration Compliance in a Backcountry Area, in:

ARNBERGER, BRANDENBURG: VISITOR STRUCTURE OF A HEAVILY USED CONSERVATION AREA:THE DANUBE FLOODPLAINS NATIONAL PARK, LOWER AUSTRIA
13
Research Paper NC-214, North Central Forest ExperimentStation, St. Paul.
Manning, R.E. (1999). Studies In Outdoor Recreation, Searchand Research for Satisfaction, Oregon State UniversityPress.
Muhar, A., Zemann, R., & Lengauer, M. (1995). Permanenttime-lapse video recording for the quantification ofrecreational activities. In Proceedings Decision Support-2001 Volume 1, Bethesda, Maryland, 219-229.
Shelby, B., & Heberlein, T.A. (1986). Carrying Capacity inRecreation Settings. Oregon State University Press, Oregon.
Sterl, P., Wagner, S., Arnberger, A. (in press). Water SportsActivities and their Effects on the Avifauna of the DanubeFloodplain National Park, Austria - First Results,Proceedings of the international Conference on Monitoringand Management of Visitor Flows in Recreational andProtected Areas, Institute for Landscape Architecture andLandscape Management, University for AgriculturalSciences, Vienna.
Völk, F. (2001). Die Donau-Auen – Seidenfaden am Alpen-Karpaten-Korridor, Institut für Wildbiologie undJagdwirtschaft, Universität für Bodenkultur, ÖsterreichischeBundesforste, Vienna

Monitoring and Management of Visitor Flows in Recreational and Protected AreasConference Proceedings ed by A. Arnberger, C. Brandenburg, A. Muhar, 2002 pages 14-20
14
Developing New Visitor Counters and their Applications forManagement
Gordon Cessford, Stuart Cockburn, and Murray Douglas
Science and Research Unit, Department of Conservation,PO Box 10420, Wellington, New Zealand
Email: [email protected]
Abstract: Developing visitor flow models for managing visitors to conservation areas is notpossible without accurate visitor count data from the field. However, obtaining such counts in areliable and cost-effective manner has proven to be more difficult than may be expected.Reasons for this are reviewed, and the features that park managers want in their visitorcounting tools are discussed. Based on these demands, development of new visitor counters isunderway, along with integrated systems for systematic collection and management of the datathey provide. However, more effective direction is required from visitor flow models to guidethe deployment of these new counter systems. This is an ongoing programme, and thepresentation provided here summarises background information and progress to date.
INTRODUCTION
Information on visitor numbers is essential for avariety of strategic and operational planning tasks inpark management, such as that carried out by theDepartment of Conservation (DOC). These mayinclude:• justification for visitor facility, service and staff
provision;• design standards for some visitor facilities and
services;• performance reporting on visitor service
provision;• relating use-levels to social and physical
impacts;• identifying demand trends and making
forecasts;• scheduling of maintenance tasks, staff
allocations and resource provision; and• linking particular sites into wider systems of
visitor flow and impact modelling.These are only some of the many management
outcomes supported by visitor count data(Hornback and Eagles, 1998; AALC, 1994; Watsonet al., 2000; DOC, 1992; AALC, 2000). Theimportant point is that visitor monitoring isconcerned with more than counting methods andtechnology - it is about providing fundamentalvisitor management data. The more reliable the datafrom visitor counting techniques and systems, thebetter the outcomes from its applications inprocesses such as visitor flow modelling. Withoutreliable data, no matter how good a model isdeveloped, the old saying always applies - ‘garbagein-garbage out’.
OBTAINING VISITOR COUNT DATA
Collection of visitor count data in conservationareas is not an easy task, given that many of themare remote, have few roads or towns, have manyentry and exit points, do not have electricity supply,and usually have few staff present on-site.Moreover, visitor counting practice across parkmanagement agencies has generally beenaccompanied by uncertain specification ofmonitoring objectives, a wide variety of countingand sampling methodologies, and few examples ofstructured visitor monitoring frameworks tointegrate count data and apply the information tomanagement. In this context, visitor monitoring canoften be characterised as an opportunistic exercise,involving a mix of different counting methods andtechiques, and a strategic sampling of visitor sitesthat optimises data needs and site conditions withresourcing capacities.
Management agencies have a wide variety ofcounting techniques available to them (Table 1), ofthree broad types:• Direct observations – using staff observers or
camera recordings at sites• On-site counters – devices to record visitor
presence and store the counts at sites• Inferred counts – other data counts used to
provide on-site estimatesManagement agencies will use some
combinations of these counting approaches,depending on their particular information needs,visitor use patterns, site characteristics, operationalresource capacities and staff capabilities. In anextensive interview study, Cope et al. (2000)summarised a wide variety of monitoring approachestaken by land management agencies in the UKcountryside. In a previous study of the sameagencies, Cope and Hill (1997) found that a high

CESSFORD ET AL.: DEVELOPING NEW VISITOR COUNTERS AND THEIR APPLICATIONS FOR MANAGEMENT
15
proportion of managers were undertaking some sortof visitor monitoring, but that the methods used werewidely varied from place to place. Overall, theseapproaches were not co-ordinated or systematic, andmany relied on on-site questionnaire surveys or carcounts. With reference to more remote settings, asurvey of over 400 US wilderness managers inmultiple agencies (McClaran &Cole, 1993) foundthat 63% relied on ‘best guess’ estimates of visitoruse and 21% used ‘frequent field observation’. Only16% had any systematic procedure for deriving theirestimates (permits or counts). In a survey of 308managers from across the four main parkmanagement agencies in the US, Washburne(1981:165) found that the techniques for measuringuse-levels fell into four classes: ‘best guesses’ basedon informal observations, trail registers, trail registerscalibrated by visitor counters, and agencyadministered permits. Almost 40% were using the‘best guess’ informal observations, although thisapproached 80% for the Fish and Wildlife Service,reflecting their more highly dispersed sites and lowvisitor use profile. Permits were used by about 40%overall, although this approached 70% in theNational Park Service, reflecting their more definedvisitor sites and extensive use of permit systems.Australian experience perhaps sums up this situationbest. When reviewing the status of visitor monitoringin the several parks comprising the Australian AlpsNational Parks, the AALC (1994:29) stated that,“with the exception of Namadgi National Park,existing visitor monitoring systems are more‘opportunistic’ than ‘systematic’”.
In more recent times, other technology optionshave developed. For example, most use-levelestimates in the US National Parks Service nowcome from vehicle counters located on key accessroads (Street, 2000). The higher population levelspresent in and around UK natural areas have allowedgreater use of manual counting and visitor surveytechniques (Cope and Hill, 1997; Cope et al., 2000).Many different counting techniques are used acrossdifferent park systems in Australia (AALC, 1994),with the most common being – automatic counters,ranger observation and fee collection (McIntyre,1999). Most agencies develop a blend of thesedifferent techniques, and some interesting newpossibilities can be developed. For example, whilevehicle counts are the most common techniqueacross the State Parks of Victoria, in some places useestimates based on car counts were highly related toparticular weather conditions. An inferential weather-based model and associated use-estimation formulaewere applied, releasing the expensive car counters foruse elsewhere (Zanon, 2001). In other cases,stratified sampling for visitor counts usingobservational surveys, combined with probabilitycalculations and associated projections, may be usedrather than monitoring by onsite counting devices(e.g. Gregorie & Buhyoff, 1999).
CHOICE OF COUNTER OPTIONS
All of these methods have advantages anddisadvantages (Table 1), and the final selection of avisitor counting approach and technique will alwaysbe based on a necessary compromise between needfor accuracy and practical capacity to measure.Assuming that appropriate management objectiveshave been determined for a visitor monitoringsystem, there are three main factors that willdetermine what combinations of countingtechniques and sampling approaches are used:visitor use patterns, physical settings, andavailability of resources.
Visitor Use PatternsVisitor use patterns vary at different places and
times, including the number of visitors, theactivities they are engaged in, group sizes, and theareas and facilities that they use. These variationshave different implications for counting strategies,depending on the scale of the monitoring systemrequired. Many examples exist of differentmonitoring systems developed for application toindividual parks as stand-alone units (e.g. Cope etal., 2000). This may be a relatively simple exerciseof identifying strategic points where visitors can becounted such as key access roads or trails.Sometimes particular facilities such as visitorcentres or accommodation sites can give strategiccounts.
However, once visitors are within a park and areentering more remote locations, their activity tendsto be widespread and diverse. Counting optionsbecome more limited, with techniques such asperiodic observation combined with visitor counterdevices being more applicable. These counters willnot generally pick up distinctions between differentvisitor types and activity groups, (e.g. bikers andwalkers). So in particular cases of need, specificobservation programmes may be required tocomplement the raw visitor counts. However,collections of parks and other protected areas maybe considered together, and strategic locations mustbe determined to represent the whole system. Thestrategy recommended by AALC (1995) is that amodest number of priority sites should be selectedacross the park system, which may be:• places of specific management concern• places where specific management actions are
under consideration• places which are considered representative of
broader management issues.Overall this suggests some hierarchy of visitor
counts is required through a series of key indexcount locations, allowing some flexibility toundertake different site- and issue-specific countingas required. To maintain the internal integrity of avisitor counting system over time and allow

CESSFORD ET AL.: DEVELOPING NEW VISITOR COUNTERS AND THEIR APPLICATIONS FOR MANAGEMENT
16
Observation Descriptions – including advantages (+) and disadvantages (-)
Fieldobservers
Onsite recording of visit numbers by staff using hand counters or recording forms. (+) - Accurate, flexible andmobile, can include descriptive data, can be permanent in some staffed sites, preferred means for calibration ofother counts. (-) Costly in staff time, competing staff tasks and priorities, often used in unsystematic andopportunistic ways, less feasible away from permanent sites or key access ways.
Camerarecordings
Film/video onsite and visitors count carried out when returned to base. Sometimes time-lapse photography isused to give sample shots. Special cases have used aerial photograph survey samples. (+) - Accurate, flexibleand mobile, can include descriptive data, main alternative to observations for calibration of other counts. (-) -Costly and vulnerable equipment to use and maintain, staff time needed to interpret films, power requirementsmean not a long-term option, less feasible away from permanent sites or key access ways, privacy issues.
Counters
Mechanical Physical displacement/movement triggering an attached mechanical count device (e.g. hinged boardwalks,turnstiles, gates, doors, stiles). In some cases, the displacement of paired magnets has been used to generatecounts. (+) - Simple to build and maintain, low cost, built in to existing structures, long history of staff use andexperience, can be linked to electronic loggers. (-) - Moving parts susceptible to wear, water, deformationand/or blockage, associated high maintenance, often detectable and subject to vandalism or false counts, nodate/time references, specific on-site structures required.
Pressure Direct pressure triggering a sensor, transmitting a count to a data recording devices (e.g. pneumatic tubes,sensor cables, pressure pads, strain gauges). (+) - Wide variety of technology for people and vehicles, canconnect to variety of devices (electronic loggers, camera, video), easy to conceal, small size and weight, easierto protect from weathering, low power use, adjustable sensitivity and interval to exclude some false counts, canget time and date data. (-) - Needs careful sensitivity calibration when constructed, maybe temperature variable,limited battery life, subject to integrity of electronics, usually requires being built in to a structure.
Seismic andvibration
Vibrations from direct pressure triggering a buried sensor, transmitting a count to a data recording devices(e.g. buried mats or tubes linked to sensor, geophones). Sonic vibrations have been investigated. (+) - Easy toconceal, small size and weight, easier to protect from weathering, low power use, can get time and date data. Nostructures are needed, can be buried in paths, may identify bicycles. (-) - Soil type, compaction, moisturecontent, freezing and bury-depth can all affect sensitivity, as can footfall weight. Needs very careful sensitivitycalibration at each site used. May undercount groups.
Active optical Light beams interrupted by visitor passing, transmitting a count to a data recording device (e.g. active infra-red, visible light beam). (+) - Small size and weight, inexpensive, accurate, not temperature sensitive, longrange, adjustable sensitivity and interval to exclude some false counts, can get time and date data. (-) - Needscareful alignment of transmitter and receiver (or reflector if not a through-beam system), alignment sensitive todisturbance, hard to conceal so susceptible to vandalism, lenses/reflectors may be obscured or soiled, higherpower consumption, light-beam counters maybe highly visible.
Passiveoptical
Change in infra-red signature triggering a count, transmitted to a sensor (e.g. passive infra-red). (+) - Smallsize and weight, inexpensive, accurate, adjustable sensitivity and interval to exclude some false counts, can gettime and date data, low power consumption. (-) - Variable detection range depending on object infra-redcharacteristics relative to background, may undercount groups if distance large, large sudden lighting changesmay trigger false counts, lenses may be obscured or soiled.
Magneticsensing
Changes in magnetic fields from passing metallic objects, trigger a count to a data recording devices (e.g.induction loops, magnetic pads, countcards). (+) - Small size and weight, inexpensive, loop/pad sensors buriedso not easily detected, other sensor boxes/cards sometimes buried (or on surface), can get time and date data,can indicate vehicle type, adjustable sensitivity and interval to exclude some false counts. (-) - Primarily forvehicle detection (including bicycles), need sensitivity adjustment and calibration for different vehicle types andloadings, possibly needs specialised interpretative software, relatively expensive for sensor and downloadinterface units.
Microwavesensing
Detects changes in reflected radio waves from moving objects. (+) - Small, can be set to detect vehicles orpeople, can be set to detect direction, can get time and date data, adjustable sensitivity and interval to excludesome false counts. (-) - Usually for vehicles, needs clear line of sight, set high making it hard to conceal, willundercount groups, cannot distinguish vehicle type, high power consumption, relatively expensive, not muchpark application to date.
Inferred
Visit registers Voluntary self-registration of visits (e.g. track registers, hut books, visitor books). (+) - Flexible and low cost,simple, can gather basic extra data, can link with safety check in/out processes, good indicator if well calibrated.(-) - Limited by voluntary basis, requires ongoing calibration, sites vulnerable to vandalism, response rates varywith site location, presentation, maintenance and advocacy, regular maintenance and checking required.
PermitsBookingsFees/charges
Records from site or trip permits, facility or trip bookings, and of fee payments for facilities/trips. (+) - Flexibleand low cost, simple, accurate, can gather considerable extra data, can link with safety management processes,can cover concession activity clients. (-) - Permits not required in most NZ sites, non-permit visitors missed(day users, other activity groups, non-compliant visitors), applicable for areas/activities only where permitsrequired. Bookings not required in most NZ sites, other visitors missed (day users, other activity groups),applicable only for areas, activities or facilities where bookings required. Fees only required for some facilities(huts/camps), other visitors missed (day users, other activity groups), applicable only for areas, activities orfacilities where fees required, often major fee-compliance problems.
Indicativecounts
Counts of elements linked to visitor use (e.g. carpark use, accommodation, public transport, weather indexesand many other options). (+) - May offer local calibration advantages if suitable option available. (-) - Highlyopportunistic and variable potential at different sites.
Table 1: The main visitor counting options

CESSFORD ET AL.: DEVELOPING NEW VISITOR COUNTERS AND THEIR APPLICATIONS FOR MANAGEMENT
17
calibration and indexing functions, some count sitesshould be permanent, some periodically rotatingaccording to identified need, and others allowed ona case-by-case basis to meet particular short-termneeds. This diversity of function indicates that avariety of count techniques should be available tomanagers.
Physical settingsThe physical settings used by the visitors, and
their behaviours within them will also affect whatcounting options are available to managers. Roadsand tracks are obvious channels where visitorcounts can be carried out, particularly if they arekey access points. For some counting devices,locations where visitors are confined to single fileare also required. Sometimes the physical layout ofa visitor use system needs to be modelled to identifywhere different types of counts can be used.
When counter devices are being applied as thepreferred counting option, as is often the case inNew Zealand, climatic elements are also animportant consideration. Water penetration hasproven to be a particular problem for most kinds ofcounter devices, corroding metallic components anddestroying electronics. If combined with sub-zerotemperatures, the freeze-thaw cycles can seriouslydamage the structural integrity of counters. Whilelow temperatures can reduce battery life, hightemperatures may cause warping and deformationof structures holding counters. Sometimesmechanical parts may be jammed through soil or iceintrusion, or count sensitivity reduced by snow orrun-off soil cover, leading to serious under-counting. And where such counters can not easilybe concealed (e.g. unforested settings) problemswith vandalism and tampering have been commonlyidentified.
Overall, the physical demands placed oncounters in outdoor environments require that theybe water-resistant, discreet, robust and include fewif any moving parts.
Availability of resourcesThe main limitation to developing a visitor
counting system will be the availability of staff andfunding resources to operate a system. In the pastmany agencies have not identified the systematiccollection of visitor data as being as high a priorityas the collection of other biophysical data (AALC,1994; Cope et al., 2000; Loomis, 2000;). Thissituation is changing as the importance of visitordata is being more widely recognised, and it’scollection is more often systematically planned. Forexample, a very specific implementation programhas been developed and applied incrementally in theAustralian Alps National Parks over the last 10years (AALC, 1994; 1995).
No matter how much funding is made available,the high number and diversity of places used byvisitors across park management systems means
that some compromise, in the form of a samplingsolution, will always be required. Improvedefficiency in counting accuracy, operational costs,strategic sampling strategies and data managementprocesses will maximise the utility of a visitormonitoring system. The important point is that thevisitor counting task must be seen as being only onecomponent of a complete visitor data managementsystem driven by a series of specific managementobjectives (AALC, 1994; 1995; Hornback &Eagles, 1998; McIntyre, 1999; Watson et al.,2000;). Such a system, based on traffic counts, hasbeen established over the last five years in SouthAustralia. This features a central reporting system, astandardised set of traffic counters, customisedsoftware interfaces, staff training procedures, andthe capacity to integrate data from other monitoringmodules when developed (NPW, 1999).
PREFERRED COUNTER FEATURES
Once the three main factors above have beenaddressed, the questions for managers then becomewhich counting options to use. Given the nature ofvisitor use of New Zealand conservation areas,where permit and fee systems are rare, staff andresources are widely spread, electricity supply isabsent, vehicle access is limited and environmentalconditions are often harsh and variable, there isparticular emphasis on having good visitor countersin the field. While the requirements of the overallvisitor management system are the keydeterminants of data needs, sampling strategies, andthe associated resource allocations for locatingmonitoring effort, park managers in New Zealandhave also developed considerable experience in theactual operation of such counters. When asked whatfeatures they consider important in visitor counterhardware, their responses have been largelyconsistent (Raine & Maxey, 1996), and inaccordance with similar managers overseas(Gaveda, 1999; Watson et al., 2000). The desiredfeatures commonly include:• high portability• lightweight construction• accurate counts• low maintenance• low cost• robust• easily concealed• low power consumption• water resistance• tolerant of temperature variations• minimal moving parts or electronics.
Simplicity was a consistent theme. In somecases reservations were expressed about the valueof having more sophisticated systems collectingmore detailed data, due to the greater vulnerabilityof the hardware and software involved. “Theresponses also suggested that complex systems withcameras and date-stamps are not in demand”
CESSFORD ET AL.: DEVELOPING NEW VISITOR COUNTERS AND THEIR APPLICATIONS FOR MANAGEMENT
18
(Gaveda, 1999:3). Furthermore, “The mostsurprising result of the survey was that enthusiasmfor more sophisticated data collection came quitelow on the series of priorities for counterperformance. DOC staff cared much less fordirection-of-travel and time-based data logging thanthey did for accurate, reliable performance” (Raine& Maxey, 1996:9).
Such preference for simplicity and reliabilityreflects the previous experience of managers withcounter development. Manager accounts of theirexperiences with different types of counters (Raine& Maxey, 1996) show a highly variable successrate, with many examples of hardware and softwarefailure. Manager preference for simple systems istherefore understandable, and there is oftenwarranted scepticism about the promise of betterresults from new technology.
In addition, the purpose of the counts has notalways been clearly specified, nor has anyintegrated data management system usually beenavailable to collate count data and provide reportingoptions back to park managers, or to other potentialusers of the data. This failure to ensure datadelivery back to managers in a practically usefulway has added to scepticism about the value ofvisitor counting, counting devices and countmodelling systems, and sometimes reducedcommitment to their applications.
Recent developments indicate that this situationis changing, as shown by the development of newcounter options and more integrated datamanagement systems in Australia (NPW, 1999),and New Zealand. The remainder of this paperdescribes recent progress made in New Zealand indeveloping visitor counters and an integratedcounting system.
NEW DEVELOPMENTS IN NEW ZEALAND
Two separate streams of work in the DOC haveconverged to provide the basis for an integratedvisitor counting and reporting system. The first hasbeen development of the Visitor Asset ManagementSystem (VAMS). The second has been initiation ofa visitor counter development project within theScience and Research Unit of the DOC. Both arerequired to provide an adequate basis for theapplication of any visitor flow modelling tools.
Data integration through the VAMSThe VAMS is an interactive database based on
key management information about theapproximately 4000 designated visitor sitesthroughout the 30% of New Zealand’s land areamanaged by the DOC. Each specific site may bereferenced individually from the database, and thereis extensive site-specific information attached toeach site. This includes the physical condition of thesite and any facilities provided at it, the recreationalsetting and social values associated with it, and any
management prescriptions and task schedulingrequired. The system is designed to allow newinformation fields to be added as required,including visitor count information. This provides apractical template for storing, accessing andreporting on visitor count data. Data may also beaccessed in different ways from the central databaseto allow wider analysis processes.
Current development of these data managementprocesses in VAMS accompanied by developmentof new visitor counter hardware, and associateddata download and transfer software. Thisdownload and transfer function is provided througha handheld data logger (PSION Walkabout) towhich count data may be downloaded from countersin the field, and transferred to the central VAMSdatabase.
New Visitor Counter DevelopmentBased on literature review, personal experience,
and feedback from park managers, many of whomhad experience of developing their own countingoptions in the past, the preference was fordeveloping on-site counters as the basis for acounting system. Four distinct types of counterunits were identified as being necessary forcovering the general range of DOC visitor countingneeds (Table 2). Where necessary for countercalibration checks and count projections usingvisitor flow models, these could be supplementedby other counting options, as described in Table 1.
A need for case-specific counter options wasalso identified for meeting more specialisedmanagement information needs, such as finding uselevels for particular facility types (e.g. toilets) orvisitor groups (e.g. mountain bikes). However,these were considered secondary priorities in thecounter development process, and will be addressedon a case-by-case basis as required.
Developing the step counterThe step-counter was the first unit to be
developed, and this has incorporated developmentof most of the data logging and VAMS integrationsoftware that will be required for operation of theother units. It is simply a modified wooden boardincorporating a pressure sensor, and is placed ontracks as a frontboard in the lowest step in earth-filled or fully wooden step sequences (Figure 1).Its’ development was based on video recordings,field observations and research generalisations (e.g.Irvine et al., 1990; Templar, 1992; Crosbie, 1996),that in a series of steps in a stairway:

CESSFORD ET AL.: DEVELOPING NEW VISITOR COUNTERS AND THEIR APPLICATIONS FOR MANAGEMENT
19
CounterUnits
Proposed Setting and options
Step-Counter
Pressure-sensor built in to the verticalfront-board of a back-filled earth step ormulti-step structure. On a wide range oftracks from frontcountry to remotebackcountry.Development action –design new unit
Boardwalk-Counter
Pressure/strain-sensor built in to aboardwalk path or bridge structure. On arange of tracks - mainly in the high-usefrontcountry and the more developedbackcountry areas.Development action – design new unit
Path-Counter
Pressure/vibration sensor buried under ahard path surface, or infra-red detectionacross it. On high use tracks with priorityon full access (e.g. wheelchairs, prams,disabled, elderly - steps or boardwalks notpresent).Development action – new application ofexisting units
Vehicle-Counter
Pressure, vibration or inductive loop-sensor buried under road surface, or builtinto road structures such as bridges orculverts on strategic roads.Development action – assess new designor new application of existing units
Table 2: Counter types, settings and development options.
• Almost all walkers stand on the leading edge ofthe last step down, and almost none extendtheir stride to stretch over the leading edgefrom further back on the stair tread.
• Most walkers use the first step up and stand onthe leading edge, and both these behavioursincrease with increased stair height.
• Walkers scan ahead and hesitate to adjust theirstride to the first step in an up-stair sequence.
• Preferred stair heights are 20-22cm, withgreater step height increasing ‘hits’ by peopleon the leading edge.
The simple design and installation requirementsof the step-counter has resulted in a robust unit thatis simple, water proof, has no moving parts, and isrelatively cheap (under € 300). Yet it also includeselectronic capacity to store many thousands ofrecords, including the date and time of each countmade. When installed and operated according toinstructions, the counter has proved to consistentlyand reliably produce a high ‘hit rate’ of counts.From visual and video-based field observations,around 95% of people descending, and 80%ascending consistently stepped on the counter. Thisgives an effective overall ‘hit-rate’ between 85-90%. Based on these observations, and feedbackfrom field managers, the contact area on the leadingedge of the step was increased in width to increasethe hit-rate further.
Figure 1: Step Unit construction and placement
While it must be acknowledged that such acounter can never be 100% accurate, the key pointis that any discrepancy will be largely constant, andcan be estimated using field calibrations. As long asany error is found to be consistent, its size is lessimportant.
Other counters and applicationsWork is underway on a counter design to be
installed in the wooden boardwalks that arecommonly used to protect sensitive soils andvegetation, or are provided as bridges over smallstreams. With the availability of step counters, andnew boardwalk counters, a practical visitor counteroption will be available for most of the tracksprovided in natural areas by the DOC. In addition,passive infra-red detection units are currently beingevaluated as the basis for development of a path-counter option. These will provide coverage ofthose more developed tracks where steps andboardwalks are not required. Work on vehiclecounters has not yet commenced, as commercialunits are available, and some count data can also beobtained from road management agencies.However, more site-specific information needs ataccess points to natural areas will require furtherdevelopment of more cost-effective vehiclecounters.
The component software required for countlogging, data downloading, integration into theVAMS database, and output reporting is beingcompleted. This provides a complete link betweencounts taken in the field and data being availableonline to park managers. As the other counteroptions become available (e.g. path and vehicle),the effective coverage of visitor counting needs willincrease to a wider range of sites. These

CESSFORD ET AL.: DEVELOPING NEW VISITOR COUNTERS AND THEIR APPLICATIONS FOR MANAGEMENT
20
developments will be reported on as they arecompleted.
CONCLUSIONS
The development of new counter units andassociated data management systems is providing amore reliable and practical mechanism for parkmanagers to collect visitor count data. However,even with correct counter installation, some error incounts is inevitable. These are acceptable as long asthey are checked using field calibrations ofobserved and logged counts, the error levels foundare relatively constant, and that the appropriatecorrections are applied to the counts.
All of this work represents development andrefinement of the counting mechanisms. However,only a small sample of the sites managed by theDOC can practically be monitored with thesemechanisms. These must be selected according to adeployment strategy that provides representativecoverage, and allows indexing and extrapolation ofcounts into wider visitor flow systems. This is theother main stream of work required to provide acomprehensive visitor counting system to parkmanagers, and is currently being investigated.
REFERENCES
AALC, 1994. Visitor Monitoring Strategy. Australian AlpsLiaison Committee. Environment Science and Services.
AALC, 1995. Review of Visitor Monitoring in the AustralianAlps. Australian Alps Liaison Committee. Leonie Wyld.
AALC, 2000. Visitor Monitoring in National Parks: Notes froma Workshop. Australian Alps Liaison Committee. Civil, K.& Renwick, C. (eds.).
Chown, G.A. 1993. Stair design and stair safety. StandingCommittee on Housing and Small Buildings, CanadianCommission on Building and Fire Codes, National ResearchCouncil Canada.
Cope, A. & Hill, A. 1997. Monitoring the Monitors. CountrysideRecreation News, Vol. 5, No. 2: 10-11.
Cope, A.; Doxford, D. & Probert, P. 2000. Monitoring Visitorsto UK Countryside Resources: The Approaches. Of Landand Recreation Resource Management Organisations toVisitor Monitoring. Land Use Policy, Vol. 17, No. 1: 59-66.
Crosbie, J. 1996. Step adjustment during negotiation of kerbs: acovert study. Gait and Posture, Vol. 4, No. 2:192-198.
DOC, 1992. Visitor Monitoring Manual: Methods to Count,Record and Analyse Information about Visitor Numbers.Resource Use and Recreation Division, Department ofConservation, Wellington.
Gasvoda, D. 1999. Trail Traffic Counters: Update. USDA ForestService, Technology and Development Program, Missoula,Montana. Report 9923-2835-MTDC
Gibson, D. 1994. A Caver Counter. Cave Radio and ElectronicsJournal No. 15. British Cave Research Association.
Gregorie, T.G. & Buhyoff, G.J. 1999. Sampling and EstimatingRecreational Use. USDA Forest Service, General TechnicalReport PNW-TGR-456. Pacific Northwest Research Station,Portland, Oregon.
Hageman, P.A. 1995. Gait characteristics of healthy elderly: aliterature review. Issues on Aging, Vol. 18, No. 2:
Hornback K.E. and Eagles P.F.J. 1998. Guidelines for PublicUse Measurement and Reporting at Parks and Protected
Areas. World Commission on Protected Areas, WorldConservation Union (IUCN), Gland, Switzerland.
Irvine, C.H.; Snook, S.H. and Sparshatt, J.H. 1990. Stairwayrisers and treads: acceptable and preferred dimensions.Applied Ergonomics, Vol. 21, No. 3: 215-225.
Loomis, J.B. 2000. Counting on Recreation Use Data: A Call forLong-Term Monitoring. Journal of Leisure Research, Vol.32, No. 1: 93-96.
Maclaran, M.P. & Cole, D.N. 1993. Packstock in Wilderness:Use, Impacts, Monitoring and Management. USDA ForestService, General Technical Report INT-301. IntermountainResearch Station, Ogden, Utah.
McIntyre, N., 1999. Towards Best Practise in Visitor useMonitoring Processes: A Case Study of Australian ProtectedAreas. Parks and Leisure, Sept. 1999: 24-29.
NPW, 1999. Visitor Data System: Project Overview. NationalParks and Wildlife Service, South Australia.
Raine J.K. and Maxey N.G., 1996. Refinement of Track CounterDesign. Department of Mechanical Engineering, TechnicalReport No. 53, University of Canterbury, Christchurch.Report to Science and Research Unit, Department ofConservation, Wellington.
Street, B. 2000. Pers.com. Manager and Specialist, VisitorCounting, US National Park Service
Templar, J.A. 1992. The Staircase: studies of hazards, falls andsafe design. Massachusetts Institute of Technology.
Washburne, R.F. 1981. Carrying Capacity Assessment andRecreational Use in the National Wilderness PreservationSystem. Journal of Soil and Water Conservation, Vol. 36,No. 3: 162-166.
Watson, A.E.;,Cole, D.N., Turner, D.L. and Reynolds, P.S. 2000.Wilderness Recreation Use Estimation: A Handbook ofMethods and Systems. USDA Forest Service, GeneralTechnical Report RMRS-GTR-56. Rocky MountainResearch Station, Ogden, Utah.
Zanon, D., 2001, Pers. com. Visitor Research Leader, ParksVictoria, Australia

Monitoring and Management ofVisitor Flows in Recreational and Protected AreasConference Proceedings ed by A. Arnberger, C. Brandenburg, A. Muhar 2002, pages 21-27
21
Predicting transgressions of the social capacity of natural areas
Sjerp de Vries, Martin Goossen
Alterra, Green World ResearchP.O. Box 47, 6700 AA Wageningen, The Netherlands
Email: [email protected]
Abstract: Within the urbanized Dutch society, the social function of forests and nature areas isbecoming more and more important. The same holds for agricultural areas. However, planningand management tools for this social function are almost absent. This paper presents a tool tobe used by policy makers at regional and higher levels. By means of a normative analysis thelocal supply of and demand for nature-based recreation are confronted with each other.Because of its normative nature, the analysis does not offer a good description or prediction ofactual recreational behavior. However, it does offer insight into where, according to the policynorms, the local supply of nature-based recreation opportunities cannot accommodate localdemands. The method has been applied nation-wide and outcomes are momentarily used tosubstantiate spatial claims to develop new recreation areas.
INTRODUCTION
Besides their ecological function, the socialfunction of forests and nature areas is becomingmore and more important in the Netherlands. This issignified by the title of the new act for naturemanagement: "Nature for people, people for nature"(LNV, 2000). Also agricultural areas are changingfrom production to consumption spaces. However,data, norms, and planning tools for the socialfunction are almost absent. This makes it difficultfor policy makers to do justice to this function,especially in the Netherlands, where spatial claimsfor different functions often exceed the availableamount of land. In this paper we will describe thedevelopment and use of a planning tool for therecreational function of forests and nature areas, aswell as agricultural areas. The tool is intended toserve policy makers at regional and higher levels.
In this paper we will limit ourselves to the twomost popular outdoor-recreational activities in theNetherlands: walking and cycling. Although theseactivities sometimes take place in a built-upenvironment, green environments are generallypreferred. This is why in Dutch recreation policiesthe accommodation of the desire to undertake thistype of activity in a green or natural environment isa common goal. Moreover, since it is seen as abasic type of amenity, this desire should beaccommodated at a local level. Furthermore,meeting local demands at a local level is thought tohelp to minimize leisure mobility (by car).
The above policy goal raises the question whenthe local supply of nature-based recreationopportunities may be considered sufficient to coverthe local demand for this type of opportunity. In thispaper a method to answer this question is described,as well as its nation-wide application. For an
extensive description of the method the reader isreferred to De Vries and Bulens (2001).
The structure of the paper is as follows. Tobegin with, the inventory of the local supply ofnature-based recreation opportunities is presented.This includes the normative determination of itssocial capacity. Second is the presentation of thelocal demand assessment, especially on the normday: the day on which supply and demand should bein equilibrium. This is followed by the procedurefor the confrontation of supply and demand. Fourththe outcomes of a nation-wide application of themethod will be reported. Finally, the method andthe practical usability of its outcomes will bediscussed.
THE SUPPLY INVENTORY
The basis of the supply inventory is the GIS-database on land use of Statistics Netherlands(CBS). In this database 33 types of land use aredistinguished. However, not all of these types havea reception capacity for nature-based recreation inthe form of walking and/or cycling. Criteria thatwere used to decide which land use types had apositive capacity for land-based outdoor recreationare the following:- it should be a predominantly green area with
some significance for outdoor recreation- by and large the type of land use should be
publicly accessible- 'man-made' attractions should not dominate the
area; it should be a resource-based facility- the reception capacity of the area should be
significantAll infrastructure types were assigned zero capacity,even dirt roads. The latter may be of recreationalsignificance, but capacities are assigned to areas(that may include recreational infrastructure). Area-
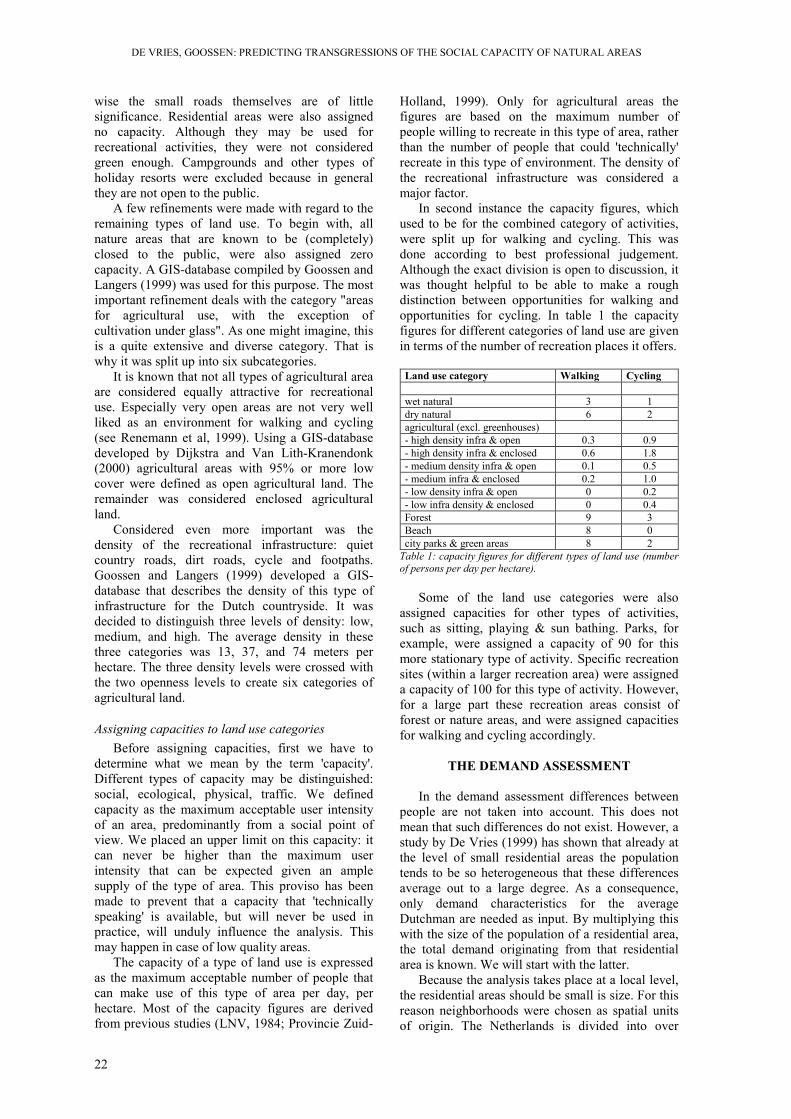
DE VRIES, GOOSSEN: PREDICTING TRANSGRESSIONS OF THE SOCIAL CAPACITY OF NATURAL AREAS
22
wise the small roads themselves are of littlesignificance. Residential areas were also assignedno capacity. Although they may be used forrecreational activities, they were not consideredgreen enough. Campgrounds and other types ofholiday resorts were excluded because in generalthey are not open to the public.
A few refinements were made with regard to theremaining types of land use. To begin with, allnature areas that are known to be (completely)closed to the public, were also assigned zerocapacity. A GIS-database compiled by Goossen andLangers (1999) was used for this purpose. The mostimportant refinement deals with the category "areasfor agricultural use, with the exception ofcultivation under glass". As one might imagine, thisis a quite extensive and diverse category. That iswhy it was split up into six subcategories.
It is known that not all types of agricultural areaare considered equally attractive for recreationaluse. Especially very open areas are not very wellliked as an environment for walking and cycling(see Renemann et al, 1999). Using a GIS-databasedeveloped by Dijkstra and Van Lith-Kranendonk(2000) agricultural areas with 95% or more lowcover were defined as open agricultural land. Theremainder was considered enclosed agriculturalland.
Considered even more important was thedensity of the recreational infrastructure: quietcountry roads, dirt roads, cycle and footpaths.Goossen and Langers (1999) developed a GIS-database that describes the density of this type ofinfrastructure for the Dutch countryside. It wasdecided to distinguish three levels of density: low,medium, and high. The average density in thesethree categories was 13, 37, and 74 meters perhectare. The three density levels were crossed withthe two openness levels to create six categories ofagricultural land.
Assigning capacities to land use categoriesBefore assigning capacities, first we have to
determine what we mean by the term 'capacity'.Different types of capacity may be distinguished:social, ecological, physical, traffic. We definedcapacity as the maximum acceptable user intensityof an area, predominantly from a social point ofview. We placed an upper limit on this capacity: itcan never be higher than the maximum userintensity that can be expected given an amplesupply of the type of area. This proviso has beenmade to prevent that a capacity that 'technicallyspeaking' is available, but will never be used inpractice, will unduly influence the analysis. Thismay happen in case of low quality areas.
The capacity of a type of land use is expressedas the maximum acceptable number of people thatcan make use of this type of area per day, perhectare. Most of the capacity figures are derivedfrom previous studies (LNV, 1984; Provincie Zuid-
Holland, 1999). Only for agricultural areas thefigures are based on the maximum number ofpeople willing to recreate in this type of area, ratherthan the number of people that could 'technically'recreate in this type of environment. The density ofthe recreational infrastructure was considered amajor factor.
In second instance the capacity figures, whichused to be for the combined category of activities,were split up for walking and cycling. This wasdone according to best professional judgement.Although the exact division is open to discussion, itwas thought helpful to be able to make a roughdistinction between opportunities for walking andopportunities for cycling. In table 1 the capacityfigures for different categories of land use are givenin terms of the number of recreation places it offers.
Land use category Walking Cycling
wet natural 3 1dry natural 6 2agricultural (excl. greenhouses)- high density infra & open 0.3 0.9- high density infra & enclosed 0.6 1.8- medium density infra & open 0.1 0.5- medium infra & enclosed 0.2 1.0- low density infra & open 0 0.2- low infra density & enclosed 0 0.4Forest 9 3Beach 8 0city parks & green areas 8 2
Table 1: capacity figures for different types of land use (numberof persons per day per hectare).
Some of the land use categories were alsoassigned capacities for other types of activities,such as sitting, playing & sun bathing. Parks, forexample, were assigned a capacity of 90 for thismore stationary type of activity. Specific recreationsites (within a larger recreation area) were assigneda capacity of 100 for this type of activity. However,for a large part these recreation areas consist offorest or nature areas, and were assigned capacitiesfor walking and cycling accordingly.
THE DEMAND ASSESSMENT
In the demand assessment differences betweenpeople are not taken into account. This does notmean that such differences do not exist. However, astudy by De Vries (1999) has shown that already atthe level of small residential areas the populationtends to be so heterogeneous that these differencesaverage out to a large degree. As a consequence,only demand characteristics for the averageDutchman are needed as input. By multiplying thiswith the size of the population of a residential area,the total demand originating from that residentialarea is known. We will start with the latter.
Because the analysis takes place at a local level,the residential areas should be small is size. For thisreason neighborhoods were chosen as spatial unitsof origin. The Netherlands is divided into over
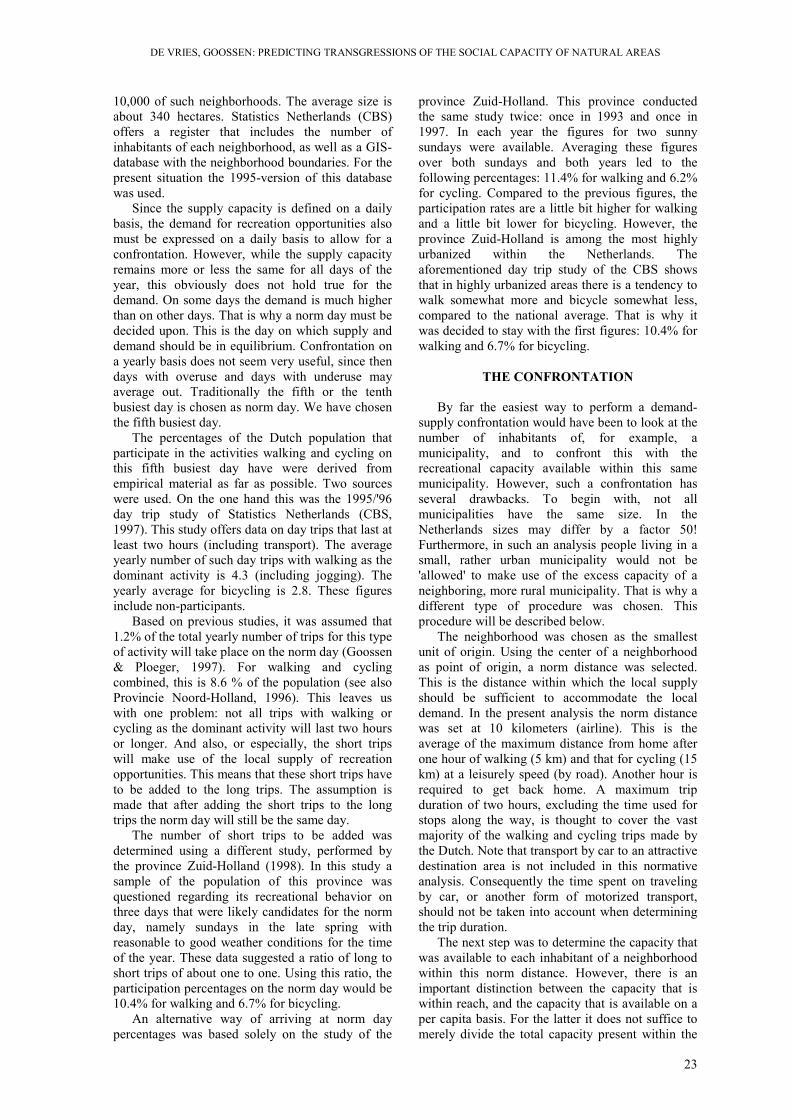
DE VRIES, GOOSSEN: PREDICTING TRANSGRESSIONS OF THE SOCIAL CAPACITY OF NATURAL AREAS
23
10,000 of such neighborhoods. The average size isabout 340 hectares. Statistics Netherlands (CBS)offers a register that includes the number ofinhabitants of each neighborhood, as well as a GIS-database with the neighborhood boundaries. For thepresent situation the 1995-version of this databasewas used.
Since the supply capacity is defined on a dailybasis, the demand for recreation opportunities alsomust be expressed on a daily basis to allow for aconfrontation. However, while the supply capacityremains more or less the same for all days of theyear, this obviously does not hold true for thedemand. On some days the demand is much higherthan on other days. That is why a norm day must bedecided upon. This is the day on which supply anddemand should be in equilibrium. Confrontation ona yearly basis does not seem very useful, since thendays with overuse and days with underuse mayaverage out. Traditionally the fifth or the tenthbusiest day is chosen as norm day. We have chosenthe fifth busiest day.
The percentages of the Dutch population thatparticipate in the activities walking and cycling onthis fifth busiest day have were derived fromempirical material as far as possible. Two sourceswere used. On the one hand this was the 1995/'96day trip study of Statistics Netherlands (CBS,1997). This study offers data on day trips that last atleast two hours (including transport). The averageyearly number of such day trips with walking as thedominant activity is 4.3 (including jogging). Theyearly average for bicycling is 2.8. These figuresinclude non-participants.
Based on previous studies, it was assumed that1.2% of the total yearly number of trips for this typeof activity will take place on the norm day (Goossen& Ploeger, 1997). For walking and cyclingcombined, this is 8.6 % of the population (see alsoProvincie Noord-Holland, 1996). This leaves uswith one problem: not all trips with walking orcycling as the dominant activity will last two hoursor longer. And also, or especially, the short tripswill make use of the local supply of recreationopportunities. This means that these short trips haveto be added to the long trips. The assumption ismade that after adding the short trips to the longtrips the norm day will still be the same day.
The number of short trips to be added wasdetermined using a different study, performed bythe province Zuid-Holland (1998). In this study asample of the population of this province wasquestioned regarding its recreational behavior onthree days that were likely candidates for the normday, namely sundays in the late spring withreasonable to good weather conditions for the timeof the year. These data suggested a ratio of long toshort trips of about one to one. Using this ratio, theparticipation percentages on the norm day would be10.4% for walking and 6.7% for bicycling.
An alternative way of arriving at norm daypercentages was based solely on the study of the
province Zuid-Holland. This province conductedthe same study twice: once in 1993 and once in1997. In each year the figures for two sunnysundays were available. Averaging these figuresover both sundays and both years led to thefollowing percentages: 11.4% for walking and 6.2%for cycling. Compared to the previous figures, theparticipation rates are a little bit higher for walkingand a little bit lower for bicycling. However, theprovince Zuid-Holland is among the most highlyurbanized within the Netherlands. Theaforementioned day trip study of the CBS showsthat in highly urbanized areas there is a tendency towalk somewhat more and bicycle somewhat less,compared to the national average. That is why itwas decided to stay with the first figures: 10.4% forwalking and 6.7% for bicycling.
THE CONFRONTATION
By far the easiest way to perform a demand-supply confrontation would have been to look at thenumber of inhabitants of, for example, amunicipality, and to confront this with therecreational capacity available within this samemunicipality. However, such a confrontation hasseveral drawbacks. To begin with, not allmunicipalities have the same size. In theNetherlands sizes may differ by a factor 50!Furthermore, in such an analysis people living in asmall, rather urban municipality would not be'allowed' to make use of the excess capacity of aneighboring, more rural municipality. That is why adifferent type of procedure was chosen. Thisprocedure will be described below.
The neighborhood was chosen as the smallestunit of origin. Using the center of a neighborhoodas point of origin, a norm distance was selected.This is the distance within which the local supplyshould be sufficient to accommodate the localdemand. In the present analysis the norm distancewas set at 10 kilometers (airline). This is theaverage of the maximum distance from home afterone hour of walking (5 km) and that for cycling (15km) at a leisurely speed (by road). Another hour isrequired to get back home. A maximum tripduration of two hours, excluding the time used forstops along the way, is thought to cover the vastmajority of the walking and cycling trips made bythe Dutch. Note that transport by car to an attractivedestination area is not included in this normativeanalysis. Consequently the time spent on travelingby car, or another form of motorized transport,should not be taken into account when determiningthe trip duration.
The next step was to determine the capacity thatwas available to each inhabitant of a neighborhoodwithin this norm distance. However, there is animportant distinction between the capacity that iswithin reach, and the capacity that is available on aper capita basis. For the latter it does not suffice tomerely divide the total capacity present within the
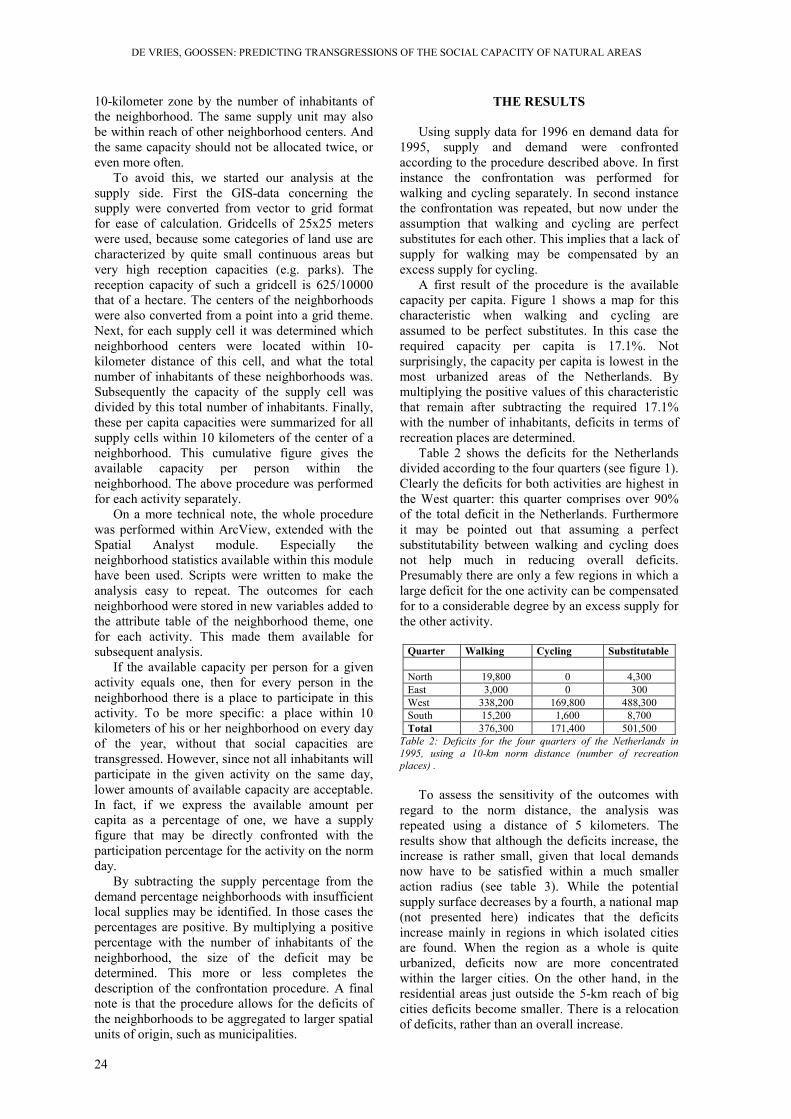
DE VRIES, GOOSSEN: PREDICTING TRANSGRESSIONS OF THE SOCIAL CAPACITY OF NATURAL AREAS
24
10-kilometer zone by the number of inhabitants ofthe neighborhood. The same supply unit may alsobe within reach of other neighborhood centers. Andthe same capacity should not be allocated twice, oreven more often.
To avoid this, we started our analysis at thesupply side. First the GIS-data concerning thesupply were converted from vector to grid formatfor ease of calculation. Gridcells of 25x25 meterswere used, because some categories of land use arecharacterized by quite small continuous areas butvery high reception capacities (e.g. parks). Thereception capacity of such a gridcell is 625/10000that of a hectare. The centers of the neighborhoodswere also converted from a point into a grid theme.Next, for each supply cell it was determined whichneighborhood centers were located within 10-kilometer distance of this cell, and what the totalnumber of inhabitants of these neighborhoods was.Subsequently the capacity of the supply cell wasdivided by this total number of inhabitants. Finally,these per capita capacities were summarized for allsupply cells within 10 kilometers of the center of aneighborhood. This cumulative figure gives theavailable capacity per person within theneighborhood. The above procedure was performedfor each activity separately.
On a more technical note, the whole procedurewas performed within ArcView, extended with theSpatial Analyst module. Especially theneighborhood statistics available within this modulehave been used. Scripts were written to make theanalysis easy to repeat. The outcomes for eachneighborhood were stored in new variables added tothe attribute table of the neighborhood theme, onefor each activity. This made them available forsubsequent analysis.
If the available capacity per person for a givenactivity equals one, then for every person in theneighborhood there is a place to participate in thisactivity. To be more specific: a place within 10kilometers of his or her neighborhood on every dayof the year, without that social capacities aretransgressed. However, since not all inhabitants willparticipate in the given activity on the same day,lower amounts of available capacity are acceptable.In fact, if we express the available amount percapita as a percentage of one, we have a supplyfigure that may be directly confronted with theparticipation percentage for the activity on the normday.
By subtracting the supply percentage from thedemand percentage neighborhoods with insufficientlocal supplies may be identified. In those cases thepercentages are positive. By multiplying a positivepercentage with the number of inhabitants of theneighborhood, the size of the deficit may bedetermined. This more or less completes thedescription of the confrontation procedure. A finalnote is that the procedure allows for the deficits ofthe neighborhoods to be aggregated to larger spatialunits of origin, such as municipalities.
THE RESULTS
Using supply data for 1996 en demand data for1995, supply and demand were confrontedaccording to the procedure described above. In firstinstance the confrontation was performed forwalking and cycling separately. In second instancethe confrontation was repeated, but now under theassumption that walking and cycling are perfectsubstitutes for each other. This implies that a lack ofsupply for walking may be compensated by anexcess supply for cycling.
A first result of the procedure is the availablecapacity per capita. Figure 1 shows a map for thischaracteristic when walking and cycling areassumed to be perfect substitutes. In this case therequired capacity per capita is 17.1%. Notsurprisingly, the capacity per capita is lowest in themost urbanized areas of the Netherlands. Bymultiplying the positive values of this characteristicthat remain after subtracting the required 17.1%with the number of inhabitants, deficits in terms ofrecreation places are determined.
Table 2 shows the deficits for the Netherlandsdivided according to the four quarters (see figure 1).Clearly the deficits for both activities are highest inthe West quarter: this quarter comprises over 90%of the total deficit in the Netherlands. Furthermoreit may be pointed out that assuming a perfectsubstitutability between walking and cycling doesnot help much in reducing overall deficits.Presumably there are only a few regions in which alarge deficit for the one activity can be compensatedfor to a considerable degree by an excess supply forthe other activity.
Quarter Walking Cycling Substitutable
North 19,800 0 4,300East 3,000 0 300West 338,200 169,800 488,300South 15,200 1,600 8,700Total 376,300 171,400 501,500
Table 2: Deficits for the four quarters of the Netherlands in1995, using a 10-km norm distance (number of recreationplaces) .
To assess the sensitivity of the outcomes withregard to the norm distance, the analysis wasrepeated using a distance of 5 kilometers. Theresults show that although the deficits increase, theincrease is rather small, given that local demandsnow have to be satisfied within a much smalleraction radius (see table 3). While the potentialsupply surface decreases by a fourth, a national map(not presented here) indicates that the deficitsincrease mainly in regions in which isolated citiesare found. When the region as a whole is quiteurbanized, deficits now are more concentratedwithin the larger cities. On the other hand, in theresidential areas just outside the 5-km reach of bigcities deficits become smaller. There is a relocationof deficits, rather than an overall increase.

DE VRIES, GOOSSEN: PREDICTING TRANSGRESSIONS OF THE SOCIAL CAPACITY OF NATURAL AREAS
25
Figure 1: Available capacity per inhabitant for walking and cycling (when substitutable) in 1995, within a 10-km distance (byneighborhood).
Quarter Walking Cycling Substitutable
North 28,200 4,900 22,400East 21,200 2,600 14,800West 378,400 188,300 535,600South 40,000 9,900 37,700Total 467,800 205,800 610,500
Table 3: Deficits for the four quarters of the Netherlands in1995, using a 5-km norm distance (number of recreation places).
In first instance the deficits are expressed interms of recreation places. They may be translatedinto deficits in terms of hectares. The conversionratio depends on the type of land use. Suppose weuse forests, as one of the most efficient land usetypes, to reduce the deficits that result when using a10-km norm distance. In that case the amount ofnew forests required to eliminate all deficits withinthe Netherlands for walking & cycling under thesubstitutability assumption is (501,500/12 =) about41,800 hectares. One should remember, of course,that usually new forests are not located on newland, but replace another type of land use. Therecreational capacity of the afforestation areaaccording to its present type of land use should besubtracted to get the correct figure for the gain thatis realized.
DISCUSSION
In this paper a method to assess to what extentthe local supply of recreation opportunities canaccommodate the local demand for such activitieshas been presented. An important criterion to judgeany new method, is its validity. Are the outcomesgenerated by the method valid? In answering thisquestion it should be kept in mind that the presentanalysis is a normative one: it does not aim todescribe actual recreation behavior as accurately aspossible. This implies that empirical figuresregarding actual behavior are not the ultimatecriterion to decide on the validity of the method.Moreover, to the degree that the method isdescriptive of actual behavior, it may becomeimpossible to detect deficits: ‘ought’ and ‘is’ willcoincide more and more.
On the other hand, if large deficits have noeffect on the local population whatso ever, one mayquestion the reason to match local supply with localdemand. Although the latter is a policy issue ratherthan a scientific one, we would like to suggest anumber of possible effects. We will only discuss‘direct’ effects, i.e. concerning recreationalexperiences and behavior. To begin with,recreational behavior may not be affected by thesupply to demand ratio. In that case more peoplethan is considered desirable will make use of the
Capacity per capita (%)2.45 - 7.67.61 - 12.312.31 - 17.0917.1 - 2525.01 - 50> 50
Quarter
20 0 20 40 60 80 Kilometers N

DE VRIES, GOOSSEN: PREDICTING TRANSGRESSIONS OF THE SOCIAL CAPACITY OF NATURAL AREAS
26
local supply of opportunities. This may affect thequality of the recreational experience. Quietness isknown to be highly valued aspect of the outdoorrecreational experience (Reneman et al., 1999).
Recreational behavior may be affected by a badlocal supply situation in at least two ways. Peoplemay participate less often, or they may decide torecreate further away from home. Empiricalevidence from a study by De Vries (1999) clearlyshows that a bad local supply situation (accordingto objective criteria) leads to a significant increasein car mobility. Moreover, the areas that show thelargest deficits in the present study are by and largethe same ones that are judged as poorly by Dutchcitizens in this previous study. In this respect theface validity of the method seems high.
Other aspects of validity are robustness andreliability. To start with the latter, the method ishighly reliable as far as the supply input data areconcerned. The land use database is fairly accurate.As for the capacities assigned to each type of landuse, this is a normative choice, not an empiricalfact. The demand input data are somewhat lessreliable. This is not because of the number ofinhabitants of a neighborhood, but because of theparticipation rates on the norm day. Although theCBS day trip study is thought to yield reliableresults, this study only deals with day trips that lastat least two hours (including transport). The numberof trips shorter than two hours had to be estimated.However, since two procedures to arrive at the totalnumber of trips generated quite similar results, wefeel confident that the demand input data are quiteacceptable.
As for the choice of the fifth busiest day asnorm day, once again this is a normative choice.However, indications based on a study byVisschedijk (1997) suggest that using the 10-thbusiest day would not have led to drastically lowerparticipation rates. For several forests, the numberof visits on the 10-th busiest day seem to rangebetween 0.85 and 0.90 of that on the 5-th busiestday. Of course, this not only benefits the reliabilityof the method, but also its robustness. Regardingthis robustness, in this paper it was shown thathalving the norm distance did not affect theoutcomes as much as one might have expectedbeforehand.
Probably the method is the most sensitive tochanges in the capacity assigned to the sixcategories of agricultural land use. As a whole, thecategory of agricultural land use is by far the largestin terms of the number of hectares concerned.Consequently, changing the capacity of this type ofland use a little will already have a large impact onthe supply capacity in many areas. For example,according the figures used here, the averagecapacity per hectare of agricultural land in theprovince of Zuid-Holland for walking and cycling is0.8. The province itself uses a figure of 1.7(Provincie Zuid-Holland, 1999). This results in a
difference of more than 100,000 recreation places,or more than 8,000 hectares of forest.
The assigned capacities are normative figures:they are thought to indicate the social capacity of anarea. However, the fact that they are normative,does not mean that the values are arbitrary. Thelogic is mainly based on the (expected) density ofthe recreational infrastructure and the visibility ofother (recreational) users of the area. This is thereason for the high capacity figure for forests: ahigh density of infrastructure, combined with a lowvisibility of other users. This line of reasoning hasalso led to wet nature areas having a lower capacitythan dry nature areas. However, the exact figures tobe used remain open for discussion.
It may be noted that the method described hereonly deals with a quantitative confrontation ofsupply and demand. It gives an answer to thequestion whether there is enough space toaccommodate the local demand for recreationopportunities. It tells us little about the quality, orattractiveness, of this space. In general a highercapacity per hectare is not meant to indicate ahigher attractiveness. This is only the case for openversus enclosed agricultural areas, because heresupply may easily exceed demand. Apart from this,recreation places are assumed to be substitutableregardless of the type of land use that generatesthem. Of course the method could be refined. Forexample, we could demand that at least 50% of thedemand has to be satisfied by recreation placesgenerated by forests and nature areas. This wouldbe a first start to bring quality considerations intothe play. Differences in attractiveness within aspecific land use category are more difficult to takeinto consideration: these would require additiondata.
After having discussed the validity and thelimitations of our method, a next question is itspractical usability. It it of use to our target group:policy makers and spatial planners at regional andhigher levels? We are confident that it is. In a smallcountry such as the Netherlands the spatial claimsof different sectors (housing, infrastructure,industry, agriculture, nature, recreation) oftenexceed the available amount of land. This makes itimportant to be able to substantiate these spatialclaims. It is also important to be able to quantify theclaims. This is exactly what our method offers. Forthis reason the outcomes of a prognosis for the year2020 according to this method, are being used bythe Dutch Ministry of Agriculture, NatureManagement, and Fisheries, under whosecompetency outdoor recreation falls.
Furthermore the method also shows where thesupply deficits are largest. This makes it possible toevaluate the efficiency of spatial plans in reducingthese deficits. This efficiency is not only affected bythe type of area (land use), but also by the locationof the new areas. Momentarily such an evaluation isperformed for the province of Noord-Holland.Preliminary results suggest that not all planned

DE VRIES, GOOSSEN: PREDICTING TRANSGRESSIONS OF THE SOCIAL CAPACITY OF NATURAL AREAS
27
recreation areas are optimally located in thisrespect.
In short, the fact that this newly developedmethod is already being used intensively, confirmsit is of practical use. This does not necessarilyimply that the method is a very good one (althoughwe tend to think it does pretty well). It is also thecase that up till now it is more or less the only onein its kind (as far as we know). Its use therefore alsodemonstrates the need for methods and tools to helppolicy makers and spatial planners to do justice tothe social function of green spaces.
REFERENCES
CBS (1997). Dagrecreatie 1995/'96. [Day trips 1995/'96]Voorburg/Heerlen: CBS (Statistics Netherlands)
De Vries, S. (1999). Vraag naar natuurgebonden recreatie inkaart gebracht; inclusief een ruimtelijke confrontatie met hetlokale aanbod. [Mapping the demand for nature-basedrecreation] Reeks Operatie Boomhut nr. 11/SC-rapport 674.Wageningen: Staring Center.
De Vries, S. & Bulens, J. (2001). Explicitering 300.000 ha, fasen1 en 2. Interne projectrapportage [Making the 300,000hectare claim explicit]. Wageningen: Alterra.
Dijkstra, H. & Lith-Kranendonk, J. van (2000).Schaalkenmerken van het landschap; Monitoring KwaliteitGroene Ruimte (MKGR). [Scale characteristics of thelandscape] Alterra-rapport 040. Wageningen: Alterra.
Goossen, C.M. & Langers, F. (1999). Bepaling indicatorrecreatie voor de Monitoring Kwaliteit Groene Ruimte(MKGR). [Assessment of the recreation indicator forMonitoring the Quality of the Green Space] Internemededeling 561. Wageningen: Staring Center.
Goossen, C.M. & Ploeger, B. (1997). Selectie vanrecreatievormen en indicatoren voor hetBeslissingondersteunend Evaluatiesysteem voor deLandinrichting. [Selection of recreation activities andindicators for the Decision Support System for Land UsePlanning] SC-rapport 588. Wageningen: Staring Center.
LNV (1984). Behoefteraming op het gebied van deopenluchtrecreatie; herziening 1984. [Need assessment foroutdoor recreation; revision 1984] Den Haag: LNV.
Provincie Noord-Holland (1996). Recreatievraag en -aanbod inWest-Friesland; een onderzoek naar land- en oeverrecreatie.[Recreation demand and supply in West-Friesland] Haarlem:provincie Noord-Holland.
Provincie Zuid-Holland (1998). Recreatiegedrag Zuid-Hollandsebevolking 1993-1997, delen 1 en 2. [Recreational behaviorof the population of the province Zuid-Holland, parts 1 and2] Den Haag/Wageningen: provincie Zuid-Holland/bureauGroenestein & Borst.
Provincie Zuid-Holland (1999). Recreatienota 2000+, HetPerspectief; een schets van verleden, heden en toekomst vande openluchtrecreatie in de provincie. [Policy document onrecreation 2000+, the perspective] Den Haag: provincieZuid-Holland.
Reneman, D., Visser, M., Edelmann, E. & Mors, B. (1999).Mensenwensen; de wensen van de Nederlanders ten aanzienvan natuur en groen in de leefomgeving. [People's desires;the desires of the Dutch regarding nature and green space intheir living environment] Reeks Operatie Boomhut nr. 6.Hilversum/Wageningen: Intomart/Staring Center.
Visschedijk, P.A.M. (1997). Pilotstudie gegevensverzamelingrecreatief gebruik SBB-terreinen. [Pilot study data collectionon the recreational use of areas managed by the State ForestService] Wageningen: Institute for Forestry and NatureResearch (IBN-DLO).

Monitoring and Management of Visitor Flows in Recreational and Protected AreasConference Proceedings ed by A. Arnberger, C. Brandenburg, A. Muhar 2002, pages 28-32
28
GIS-Supported Network Analysis of Visitor Flows in Recreational Areas
Beate Hinterberger, Arne Arnberger, Andreas Muhar
Institute for Landscape Architecture and Landscape ManagementBodenkultur University, A-1190 Vienna, Austria
Email: [email protected]
Abstract: The application of GIS tools for visitor monitoring facilitates a profound analysis ofvisitor flow patterns. Giving a visual impression of the distribution of visitors within an areavia maps, interpretation of visitor use data is much easier and better. Furthermore, a GIS alsoallows to determine and analyse quantitative parameters of visitor use such as trail and visitordensity. These parameters can also be used to characterise and compare different areas within apark. With a standardised approach, also comparisons between parks can be realised.Therefore, GIS is increasingly used in the area of visitor monitoring to assist recreationplanners and park managers in their everyday work. This paper demonstrates how a GIS-basedtrail network analysis was used in the framework of a visitor monitoring project in the DanubeFlood Plains National Park, Austria.
INTRODUCTION
Recreational areas located close to big cities areoften used by high numbers of visitors and show ahighly diverse visitor structure. As visitor numbersincrease, there is a simultaneous increase inenvironmental impacts, crowding, and conflictsbetween different recreational types and users.Additionally, modern leisure activities andbehaviour of visitors do often not fit traditionalconcepts of recreation. Therefore, an intensivemonitoring of visitors in these areas in needed, inorder to be used as prerequisite for successful andeffective management.
Network analyses based on GeographicInformation Systems (GIS) offer a possibility toanalyse spatially referenced data describing trafficflows. While they have been used in road trafficplanning for a long time, they have only rarely beenapplied to recreation planning and analysis. Here itis a very useful tool to trace out areas of potentialconflicts between recreational use by visitors andthe needs of fauna and flora (Volk, 1995, Roth etal., 2000), as well as conflicts between differentgroups of visitors having complementary interestsor simply crowding too much. Once these conflictsand their potentials are recognized, the recreationalinfrastructure and the management scheme can beadequately adopted.
STUDY AREA
The Danube Floodplains National Park issituated east of Vienna, the capital city of Austria,with a population of about 1.6 million. One part ofthe national park, the Lobau, actually lies within thecity boundaries of Vienna. The national parkextends about 50 kilometres along the Danube riverfrom Vienna to the border of Slovakia. In 1997, the
Danube Floodplains were declared a National Park,and received international recognition in the IUCNcategory II. The Park is used predominantly by theViennese and Lower Austrian population foreveryday recreation purposes.
In order to deal effectively with the high numberof visitors, the park management needs in-depthinformation on the leisure and recreational usage ofthe area. Therefore, the Institute for LandscapeArchitecture and Landscape Management atBodenkultur University Vienna, commissioned bythe Vienna City Council, forest department, and theNational Park Administration, collected data on thenumber and structure of the visitors to the area aswell as their spatial and temporal distribution.
METHODS
Investigations on the recreational use of theViennese (western) part of the national park wereconducted in 1998 and 1999. Between June 2000and May 2001, visitors were also monitored in theLower Austrian (eastern) part of the national park.Various different methods were applied for themonitoring of the visitor activities: permanent long-term video monitoring over one year, short-termvisitor observations, interviews as well as routeregistrations.
Permanent time lapse video recording, installedat highly frequented access points, gatheredinformation about the number of visitors enteringand leaving Lobau from dawn to dusk.
At the main access points into the park visitorswere interviewed about their motives, activities,expectations etc. The interviews took place oneither four or eight days, at each case a Thursdayand the following Sunday, once in each season. Inorder to obtain high data volumes, the survey wasconducted on days of fine weather. In addition, at

HINTERBERGER ET AL.: GIS-SUPPORTED NETWORK ANALYSIS OF VISITOR FLOWS IN RECREATIONAL AREAS
29
the same time also the total number of visitors at themain entrance points was determined. Thistemporally selective counting was combined withvideo monitoring data for extrapolating to the totalnumber of visitors per year.
As part of the survey, visitors were asked tomark in a simple map the route through the nationalpark, which they took or planned to take (see alsoWang et al. 2000). All the trails contained in theAustrian topographic map 1:50.000 wereconsidered. The trail network was digitised and theroute information from the interviews was spatiallyreferenced and stored into a database. In a first step,all records have been checked for topologicconsistency (e.g. contiguous route segments). Bylinking the route data and interview results with thehelp of the Access database, an analysis by topicwas possible and the respective number of visitorsper segment of trail could be made visible on mapsof the study area (Hinterberger, 2000).
RESULTS
Distribution of visitorsFigure 1 gives an overview of the spatial
distribution of visitors within the Lobau. The mapshows the parts of the park with high or low uselevels. Heavily frequented paths could easily beidentified and potential conflicts between usergroups as well as between nature conservation andrecreational goals were allocated. By linking theroute information with other interview data, ananalysis of routes by access point was possible.
Figure 1: Spatial distribution of visitors in the Viennese part ofthe Danube Floodplains National Park, on 8 counting days
Figure 2 shows the routes of the visitorsentering the Lobau at three selected entry points. Atthe entry point ‘Essling’ a settlement is very closeto the national park. The visitors entering there aremainly staying in the area very close to this accesspoint. The analysis of the questionnaire alsoshowed, that these people are predominantly hikersand regular visitors. At the access points ‘Uferhaus’and ‘Lausgrund’, in contrast, more bikers wereobserved. This is also reflected in the spatialpatterns of routes reported by visitors passing thesetwo observation points. The routes are fairly longand show high frequencies along the official biketrails within the national park. The videoobservation showed furthermore, that the numbersof visitors observed at these two stations are highlycorrelated, which is also represented in the routes.
Figure 2: Visitor flow patterns by entrance point

HINTERBERGER ET AL.: GIS-SUPPORTED NETWORK ANALYSIS OF VISITOR FLOWS IN RECREATIONAL AREAS
30
Figure 3: Visitor flow patterns by motivation
By linking the route data to other results of thequestionnaire, the spatial distribution ofrecreationists by visiting motive can be analysed.Figure 3 shows use concentrations of nature relatedvisits along the old branches, whereas visitorscoming from the settlements adjacent to the Lobautend to stay in the parts close their own residentialarea. Visitors who stated to use the Lobau forrecreational and sportive activities, show a widerdistribution over the study area.
Calculation of total visitor loadRoute data obtained from interviews were also
linked with visitor countings from permanent videorecording, thus facilitating an estimation of the totalvisitor load during the one-year period of videoobservation.
Figure 4: Combination of video data and route data
At the access point ‘Lausgrund’, for example,bikers were monitored by video recording as well asinterviewed. Therefore, one knows both the patternsof routes taken by the bikers and the temporaldistribution of bikers passing the station year round(see fig 5). This information can be combined inorder to do some first and simple calculations ofdistribution of cyclists within the study area duringthe year.
The number of cyclists in the study area isparticularly susceptible to the temperature, anincreasing number was observed between April andSeptember when the temperatures rise above 10°C(Brandenburg, Arnberger, in print). Consequently,also different spatial patterns of cyclists could beobserved between April and September.
0
5.000
10.000
15.000
20.000
25.000
JAN FEB MAR APR MAY JUN JUL AUG SEP OCT NOV DEC
Figure 5: Bikers at access point ‘Lausgrund’ per month
Indices of Public UseIt is quite difficult to compare the amount of
visitor use regarding pressure on resources indifferent parks due to different spatialcharacteristics such as size, shape and relief(Dawson 2000). Attempts have been undertaken tomake the usage and the recreational impacts onvarious wilderness areas somehow comparable bydefining indices of recreational infrastructure anduse.
Table 1 shows two such simple indices for thetwo parts of the Danube Floodplains National Park.By combining these indices with actual visitor datafrom both the route analysis and the visitorcounting, more refined parameters can be derived.
Video data,collected over one
year
Route data collectedon sample days
Spatio-temporal visualisation of visitor flowswithin the study area year round

HINTERBERGER ET AL.: GIS-SUPPORTED NETWORK ANALYSIS OF VISITOR FLOWS IN RECREATIONAL AREAS
31
Indices Viennese Partof National
Park - Lobau
Lower AustrianPart of National
Park
Entry points perkm²
0,9 0,8
Kilometres oftrail per km²
5,9 3,8
Table 1:Comparing study areas by representative numbers
Length of RoutesAnalysing visitor routes with the help of GIS
tools offers the possibility to explore also the lengthof routes. The shortest route reported in the Lobauwas only 163 meters long, leading from theentrance point to a water pond and return. Thelongest route (27.8 km) was reported by a biker,spending his time in the Lobau on a Sunday inspring.
Seasonal variations of the route length couldalso be observed. First of all, the skewness of thehistograms shows characteristic differences. Insummer, many visitors only come to the Lobau toswim in the old branches of the Danube. Thesevisitors tend to hike or bike only for a short distancein order to get to their favourite spot (Fig.6), wherethey often spend the whole day.
Figure 6: Distribution of route lengths in summer
Figure 7: Distribution of route lengths in spring
In contrast, the distribution of route lengths inspring (Fig.7) is more symmetric and many of thedistances are grouped around the mean route length.
This shows, in measurable numbers that in springpeople are moving around much more, spendingtime biking or walking instead of resting in oneplace for a long time. Also the means of thedistributions of routes are slightly different. Inspring the mean distance, taken by the visitors isbigger than in summer. As the number of visitorscounted in spring is about twice the number of thesummer visitors, the overall impact in spring issignificantly higher.
Visitor loadThe combination of video recording data with
the mean route length allows a calculation of thevisitor load, calculated as visitor kilometers per yearwithin the area. This parameter gives an idea of theuse intensity of recreational infrastructure, inparticular the trail system. The results are alsoindices in order to compare different recreationareas.
In the Viennese part of the National Park theaverage route length is 7.26 kilometers. With600,000 visits counted per year, this section of theNational Park is charged by 4,356,000 visitorkilometers per year. Opposed to that, the LowerAustrian part had 390,000 visits with 4,356,000visitor kilometers per year. Referring to the size, thetrail network of the Viennese part is stressed byvisitor kilometers more than three times as much asthe Lower Austrian part. As the Viennese trailnetwork is more dense, the visitor load perrespective trail segment is about twice as highcompared to the Lower Austrian part.
Study area Meanlength ofroutes /
totalvisitorsper year
Visitorkilometers per year
withinarea
Visitorkilometers per km²per year
Visitorkilomete
rs pertrail kmper km²per year
LowerAustrianpart of
NationalPark
9.04 km(n = 340)/ 390,000
3,525,600km
51,100km/km²
13,500km/km/
km²
Viennesepart of
NationalPark -Lobau
7.26 km(n = 511)/ 600,000
4,356,000km
181,500km/km²
30,800km/km/
km²
Table 2:Visitor kilometers per year within area
Trail Use ConcentrationOrdering the path segments by intensity of use
and plotting the total cumulative percent of visitormeters against the cumulative percent of trailmeters, results in a graph representing the density ofvisitor use within an recreational area (see alsoLucas, 1990).
In Lobau, for example, fifty percent of thevisitor kilometers refer to about fifteen percent ofthe total trail kilometers.

HINTERBERGER ET AL.: GIS-SUPPORTED NETWORK ANALYSIS OF VISITOR FLOWS IN RECREATIONAL AREAS
32
Cumu
lative
Visi
tors-k
m (%
)
Cumulative Trail-km (%)Figure 8: Graph of total travel in cumulative percent of visitorkilometers against cumulative percent of trail kilometersViennese part, Lobau
Cumulative Trail-km (%)
Cumu
lative
Visi
tors-k
m (%
)
Figure 9: Graph of total travel in cumulative percent of visitorkilometers against cumulative percent of trail kilometers, LowerAustrian part
In the Lower Austrian part, however, fiftypercent of the visitor kilometers refer to only ninepercent of the total trail kilometers, which indicatesan extremely high concentration of visitors on fewpath segments.
DISCUSSION AND OUTLOOK
The combination of data on visitor numbers,routes and visitor characteristics with the spatialfunctions of a GIS has proven to be a very usefulmethod to investigate and analyse visitor flows inrecreational areas.
One important next step will be to link our datawith road traffic data from areas close to theNational Park.
So far, our analyses were mostly explorative.Single models have been developed to predict totalvisitor loads (Brandenburg, Arnberger) dependingon weather factors; however, the next step will be toapply these models in a spatial context.
To achieve reasonable models, the data gainedfrom permanent video observation will play animportant role and the connection of these data tothe routes needs to be done very carefully. Thesemodels could also be improved by includinginformation about the directions of thevisitors´routes.
Concerning the conservation function of an area,the use of GIS in combination with quantitative data
of the recreational use can help exploring the effectson fauna and flora caused by people spending theirleisure time in recreational areas. Building morecomplex models of agents moving trough therecreational area (Itami et al., 2001), interactingwith their surrounding according to a bundle ofattributes they are applied with, should enablepredictions about changes in visitor flow, if certainpaths or entrances need to be closed.
Exploration of the visitors opinions in terms ofcomfort and attractiveness of paths will also becontributing to predictive models.
REFERENCES
Arnberger, A., Brandenburg, C., Cermak, P., & Hinterberger, B.(2000a): Besucherstromanalyse für den NationalparkDonau-Auen, Bereich Lobau. [Analysis of visitor flows inthe Viennese part of the Danube Floodplains National Park]Projektbericht, Institut für Freiraumgestaltung undLandschaftspflege, Universität für Bodenkultur, im Auftragder Magistratsabteilung 49, Forstamt der Stadt WienNationalpark - Forstverwaltung Lobau, Wien.
Brandenburg, C, Arnberger, A. (in press): The influence of theweather on recreational activities. International Journal ofBiometeorology. Springer –Verlag Berlin.
Dawson, C., Simon M., Orekes R., & Davis G. (2000): GreatGulf Wilderness Use Estimation: Comparisons From 1976,1989, and 1999, in Proceedings of the 2000 NortheasternRecreation Research Symposium. United States Departmentof Agriculture Forest Service 283-288
Hinterberger, B., Arnberger, A., Brandenburg, C.& Cermak, P.(2000b): Besucherstromanalyse für den Wiener Bereich desNationalpark Donau-Auen/Lobau: GIS-Implementierungund erste Ergebnisse. [Analysis of visitor flows in theViennese part of the Danube Floodplains National Park –GIS implementation and first results] In: Strobl, J.,Blaschke, T., & Griesebner, G., Eds., AngewandteGeographische Informationsverarbeitung XII AGITSymposium 2000. Wichmann Verlag, Heidelberg, 216-227.
Hinterberger, B. (2000): Besucherstromanalyse im WienerAnteil des Nationalpark Donau-Auen, der Lobau:Routenanalyse mit GIS. [Visitor Flow Analysis in theViennese part of the Danube Floodplains National Park, theLobau - Analysis of Routes using GIS]. Diploma Thesis,Institut für Freiraumgestaltung und Landschaftspflege,Universität für Bodenkultur, Wien.
Itami, R.M. & Gimblett, H.R. (2001): Intelligent recreationagents in a virtual GIS world. Complexity International,Volume 8, http://www.csu.edu.au/ci/.
Lucas, R.C. (1990): Wilderness Use and User: Trends andProjections. In Hendee, J.C., Stankey, G.H. & Lucas, R.C.:Wilderness Management, North American Press, Colorado.
Roth, R., Krämer, A. & Armbruster, F. (2000): GIS-gestützteSporttourismuskonzeption in naturnahenLandschaftsräumen. In: Strobl, J., Blaschke, T., &Griesebner, G., Eds., Angewandte GeographischeInformationsverarbeitung XII AGIT Symposium 2000.Wichmann Verlag, Heidelberg, 438-444.
Volk, H., Suchant, R.R. & Wossidlo R. (1995): Die Integrationvon Wintersport, Erholung und Naturschutz im Wald. InMitteilungen der Forstlichen Versuchs- undForschungsanstalt Baden-Württemberg 7800 Freiburg imBreisgau.
Wang, B., Manning, R.E., Lawson, S.R. & W.A. Valliere (2000):Estimating Social Carrying Capacity throuhg ComputerSimulation Modeling: An Application to Arches NationalPark, Utah. In Proceedings of the 2000 NortheasternRecreation Research Symposium, Bolton Landing, NewYork, General Technical Report NE-276, 193-200.

Monitoring and Management of Visitor Flows in Recreational and Protected AreasConference Proceedings ed by A. Arnberger, C. Brandenburg, A. Muhar 2002, pages 33-39
33
Spatial Requirements of Outdoor Sports in the Nature Park SouthernBlackforest – GIS-based Conflict Analysis and Solutions for Visitor Flow
Management
Alexander Krämer, Ralf Roth
Institute of Outdoor Sports and Ecology, German Sport University Cologne, Germany
INTRODUCTION
The fascination of outdoor-sports has beengrowing in recent years. The affected areas offernumerous experiences of nature and activity inwhich the image of an exclusive outdoor lifestyleplays an important role. A continuousdifferentiation of classic outdoor sports into variousnew types of outdoor sports, including a veryspecific use of the natural landscape structure, ischaracteristic for this growth.
From an ecological point of view, thisincreasing use of landscape related to space andtime, offers severe problems for the affected areas.Especially the multiple all-year of landscape bears ahigh ecological risk. The increasing pressure onnature and cultural landscape evokes numerousconflicts between protection and use of nature andlandscape. Nevertheless, all outdoor sports activitieshave one thing in common: They depend on anintact natural landscape that offers the basis for anexclusive experience connected to outdoor sportsactivities.
The aim of the project is to analyse thedifferentiation of classic types of outdoor sports andthe resulting utilisation of the specific types oflandscape and area. The requirements for the areaare defined from a sport scientific prospective andare judged from an ecological point of view. Thereare two important dimensions for the use of spacethrough outdoor sports: Apart from the solerequirement of space, it is also very important toconsider the time of use of the specific area. Themultiple use of specific areas is often a crucialpoint.
RESEARCH AREA AND AIMS OF THEPROJECT
The Nature Park Southern Blackforest in thesouthwest of Germany was founded in 1999 and,with its 3300 km2, it is the second largest naturepark of the country. The park consists of twogeologically different sections: The western part isrelatively steep and valleys are numerous. Theeastern part is more flat. The medium height of thenature parc is 780 metres above sea level. Thelowest regions are 222, the highest 1496 metres
above sea level. The parc is by far the mostimportant sports tourism region in southwestGermany. In the catchment area relevant for thedaily tourism (radius of 100 km) there live morethan 11 million people. Moreover, there is a highnumber of tourists from other parts of Germany andabroad. The Nature Park Southern Blackforestoffers an extensive infrastructure for various naturesports, in summer as well as in winter. At the sametime, major parts of the park are considered to beecologically valuable areas. This is evident becauseof the existence of many nature conservation areasas well as „Natura 2000“-areas. They alone come to40% of the nature park.
The development of an all-year sports tourismtherefore brings about partially massive impacts.This research project aims to develop strategies thatwill be consistent in the future and to proposemeasures that enable an attractive development ofoutdoor sports in the region. The objective is toconserve the opportunity for experience and sportsin an intact landscape and to suit the developmentof sports tourism to the needs of locals and guests.
METHODS
The methodology of the project can bestructured as follows:mapping out and enquiry of sports infrastructure
and data on nature conservation for the analysisof the status quo.
Count of visitors and enquiring participant profileswith the help of various methods
Development of a data base for the GIS-supportedanalysis of the collected data
Interpretation of the findings and implementation ofa strategic management
Evaluation and monitoring of the strategic goals.The use of geographical information systems
serves as a basis for all those steps.
Analysis of the status quoThe basis of a serious planning is the recording
of the infrastructure related to sports tourism andthe up-to-date use of sports- and leisureopportunities. All activities and structures relevantto sports tourism were recorded: hiking, cycling,mountain biking, alpine skiing, cross-country

KRÄMER, ROTH: SPATIAL REQUIREMENTS OF OUTDOOR SPORTS IN THE NATURE PARK BLACKFOREST– GIS-BASED CONFLICT ANALYSIS AND SOLUTIONS FOR VISITOR FLOW MANAGEMENT
34
skiing, water sports, climbing, paragliding, golf,trendsports and big sport events. At the same time,all relevant landscape ecological data has to berecorded (land use, digital terrain model, protectedareas, traffic infrastructure). The collection of datawas carried out by mapping out and questionnairesas well as by digitalising of maps. The aim was theimplementation of an extensive data base.
Count of visitors and participant profilesApart from the mere inquiry of the sports related
infrastructure, the basis for the next steps of theanalysis is the recording of the spatial and timerelated distribution of the visitors. Because of thesize of the park there could not be carried out anextensive count of visitors, so single model areaswere chosen. For the recording of visitor numbersthe outdoor activities hiking, mountain biking andcross country skiing were taken into account.Therefore, three different counting methods wereused. The participant profiles were recorded withquestionnaires.
Automatic count systemsThese immobile systems count the visitor
numbers at defined points or stretches. At the modelareas, three such systems were installed. Theyconsist of a light barrier and an electronic counter.All movements within a defined period of time arerecorded for that specific stretch. The data collectedallows the comparison of the visitor numbers ofdifferent days but does not give information on theoverall visitor number.
Complete countThe prospective of complete counts is the
recording of the overall number of visitors of anarea. For this purpose counting personell at everyparking place and every access counted everyvisitor and recorded their activities (hiking, biking,cross-country skiing, etc.).
Moment recordingBy this method developed by Karameris (1982
and 1987) it is possible to record the distribution ofvisitors in a specific area. For this, the footpaths,MTB-trails or cross-country ski runs are parted intoshort stretches. A person hikes, rides or skies on thespecific stretch and records the visitor number for aspecific period of time. Popular stretches and pointscan be recorded this way. With the momentrecordings average results are gathered whichcharacterise the relative importance of the singlestretches. Every stretch is only observed for a shortperiod of time, so normally the actual use is muchhigher. To be able to compare the intensity of use ofdifferent stretches, the moment recording has to becombined with a complete count.
Implementation of a landscape information systemThe gathering and preparation of spatial data,
their evaluation, linking and carrying out in astrategic management is nowadays unthinkablewithout the help of electronic data processing.Systems which are able to take into account thespatial dimension apart from the objectivedimension are mostly relevant for this purpose. Forthe strategic management of the nature park, mostdecisions made are based on spatial data. Becauseof this, the use of up-to-date geographicalinformation systems (GIS) is indispensable.
GIS enables to collect, edit and analyse arearelated data digitally and to visualize it numericallyor graphically. Additionally, apart from theadministration of thematic data (attributes, key data)and geometric data (position, shape, size) GIS alsoallows topologic data analysis (space related). Thisdata can be used for area overlay- and intersection-operations and complex terrain analysis.
For the Nature Park Southern Blackforest aspecific GIS user surface was developed andimplemented for the different requirements of theproject, which also supports the further work of theemployees of the nature park offices. All analysesdescribed in the following are GIS-based.
CONFLICT ANALYSIS
Intensity of useTo quantify the intensity of use, the results of
the gathered data, infrastructure, visitor counts andparticipant profiles (see 3.1 and 3.2), were related toeach-other.
For the evaluation, crucial points are the realnumber of visitors and the intensity of use due tothe specific activity.
The results suggest that beside the space andtime related use of the natural landscape by a singleactivity especially the multiple use of the samelandscape by several activities is one of the majorconflicts.
Furthermore there are significant differencesbetween the use in summer and winter. In summermostly the whole area of the nature parc is affected.The intensity of use is relatively low becausevisitors are widespread throughout the whole area.In contrast, in winter the visitors are concentratedon single spots which results in a high intensity ofuse at these specific locations. (Fig. 2)

KRÄMER, ROTH: SPATIAL REQUIREMENTS OF OUTDOOR SPORTS IN THE NATURE PARK BLACKFOREST– GIS-BASED CONFLICT ANALYSIS AND SOLUTIONS FOR VISITOR FLOW MANAGEMENT
35
Fig. 1: Time conflict between capercaillie and cross-country-skiers and capercaillie and mountainbikers.
The example of the capercaillien (Fig. 1)illustrates the importance regarding the time ofhuman activity compared to the time of animalactivity (time conflict). The capercaillie is a birdspecies active during the day with specific peaks ofactivity in morning and evening. If the time ofactivity of the visitor coincides with the peak of thecapercaillie’s activity, the disturbance is high. Onthe other hand, peaks in visitor activities coincidewith times of low activity, causes low levels ofdisturbance. Therefore different types of sportsactivities have different levels of disturbance oncapercaillie. Due to their large action radius,mountain bikers, for example, use the landscapealso after 7 p.m., a peak of capercaillie‘s activity. Inconsequence, capercaillies have to feed, mate andrear its young at times when mountain bikers usethe same territory.
Potential for sports tourism in the Nature ParkApart from the actual use of landscape through
sports tourism, potential areas were singled out. Asa result, areas were described which bear a highpotential for specific sports activities, either forsummer or for winter activities. These areas can bekept in mind for future planning.
Important factors for the usability for summersports are the variety of landscape, the slope and thealtitude. Variety of landscape can be measured bythe number of changes of landscape characteristics(vegetation, use of landscape by agriculture,forestry, settlement, etc.) in a defined area, forexample per km2.
The slope- and altitude-impact on the potentialis measured by the number and level of changes in
altitude per km2. High changes in altitude increasesthe number of potential sports activities in the area.The results suggest that almost the whole naturepark area is excellent for summer sports activities(Fig. 2).
For winter sports, especially the reliability onsnow is the most important factor. To calculate this,long-term data on precipitation and temperaturewere taken into account. In addition to this,morphologic parameters (altitude, slope, aspect)were regarded.
As expected, highest potential for winter sportscould be found along the central mountain rangewhich divides the park from north to south. Due tothe higher impact of continental climate, the easternparts of the park have a higher potential for wintersports than the western parts if the same altitudesare compared.

KRÄMER, ROTH: SPATIAL REQUIREMENTS OF OUTDOOR SPORTS IN THE NATURE PARK BLACKFOREST– GIS-BASED CONFLICT ANALYSIS AND SOLUTIONS FOR VISITOR FLOW MANAGEMENT
36
Fig. 2: GIS-based conflict analysis: calculation of visitor flow management areas for sport tourism.

KRÄMER, ROTH: SPATIAL REQUIREMENTS OF OUTDOOR SPORTS IN THE NATURE PARK BLACKFOREST– GIS-BASED CONFLICT ANALYSIS AND SOLUTIONS FOR VISITOR FLOW MANAGEMENT
37
Spatial conflictsTo figure out areas of conflict between nature
conservation and sports activities further overlayand intersection operations have to be done in GIS.
The theme sport in landscape consists asdescribed on two maps based on several layers:First the maps of the intensity of use, second themap of potential areas for sport activities (bothseparately for summer and winter; Fig. 2).
The theme nature conservation consists ofprotected areas and net habitats. For a large scaleview the highest ranks of protected areas,“Naturschutzgebiet” and “Natura 2000”-areas, arerespected. Net habitats are defined as areas, whichare not intersected by settlements or traffic routesand therefore could function as potential habitatsalso for more demanding species.
Via different punching tools and with the helpof different weight factors the themes are combinedand overlayed by GIS. As a result, areas can befigured out which have a high potential forconflicts: On the one hand these areas show a highintensity or potential of sports use and on the otherhand they are valuable areas for natureconservation.
Using this strategy our results display an area of236 km² in the Nature Park Southern Blackforestwith high potential for spatial conflicts. These arethe areas with the highest requirements for theimplementation of visitor flow managementsystems.
VISITOR FLOW MANAGEMENT FORSPORT TOURISM
Channelling sport activities in designated areaswith high potential for conflicts is a balance act. Onthe one hand the use of broad areas for sportactivities should be enabled also in a high qualityand on the other hand nature conservation has to beassured. Channelling measures have to be carefullyplanned and sometimes creativity is necessary todesign an appropriate measure. Goal is always tominimize conflicts.
The level of possible adverse effects of sport onnature and landscape is determined by the factorsintensity of use, kind of use, exact location, timeand duration of activity.
The strategy for these designated areas is tochannel and concentrate sport tourists by formingattractive sites for sport activities. Areas ofconcentration are either extraordinary resistantagainst impacts because of their naturalcharacteristics or parts of a site are released whichis the prize for protecting more valuable parts of thearea.
Important tools to concentrate activities areskiing slopes, tracks and trails. They are part of astrategy which could be described as “channellingby offering comfort”. Therefore the guidelines forthe Nature Park Südschwarzwald follow theprinciple “offerings are better then proscriptions”.
The components of a visitor flow managementfor sport tourism are shown in figure 3. Asdescribed, positive channelling measures are theheart of the strategy. Naturally it is important thatsport activities in conflict areas are proper plannedusing the methods of landscape planning.
Fig. 3: Different aspects of a visitor flow management systems for sport tourism: voluntary channelling measures must become thecentral feature; compulsory measures should only be enforced as a last resort.
Channelling activities
Landscape planning beforehand
Area development srategy Construction of infrastructure
Compulsory measures
Positive channellingAppeal startegy
Direct channelling measures Communication
SignpostsNotice boardsMaps
Removal of pathsErection of barriersComfortOffer of attractive alternativesAttractive Network of routes
Compulsory routesProhibitionsLegal restrictions
QualitySituationCapacity / demandEnvironmental compatibility study
Area development strategy - zoningSpatial functional seperation - taboo areasIntegrated spatial approaches

KRÄMER, ROTH: SPATIAL REQUIREMENTS OF OUTDOOR SPORTS IN THE NATURE PARK BLACKFOREST– GIS-BASED CONFLICT ANALYSIS AND SOLUTIONS FOR VISITOR FLOW MANAGEMENT
38
Compulsory measures are just the last solution.They should be used very careful for high sensibleareas or when other measures lead to no success.
Basis for a successful implementation of achannelling strategy is co-operation between publicauthorities, municipalities, sport, forestry and natureconservation. Sectoral thinking has to be abandonedfor an integrative approach.
EXAMPLES OF “GOOD PRACTISE” ANDCHECKING SUCCESS
To perform the results of the research indesignated conflict areas concrete projects havebeen initialised. Work groups were formed made upwith all parties involved. These work groupsescorted the implementation of the measures.
On basis of the carried out research on statusquo and conflicts (as described above)infrastructure for sport tourism was newly designed.When rebuilding of trails (hiking, cross-countryskiing, mountain biking) was done aspects of natureconservation and sport were respected. For examplein the model-area called “Rohrhardsberg” the yoreexisting system of trails was strongly shortened.Parallel, the quality of remaining infrastructure wasraised by offering new possibilities of trailcombinations, resulting in a more attractive site.
In stretches highly valuable for natureconservation trails were abandoned and blocked.The trails were displaced in neighbouring lesssensible zones.
Figure 4 shows an example of the application ofthe “ladder”-system used to create a new cross-country trail-system. With the help of shortconnection trails various skiing-possibilities arecreated and the disturbance-area can be minimized.
In the same time, in co-operation with the“Forstliche Versuchs- und Forschungsanstalt” (agovernmental forestry agency of the federal stateBaden-Württemberg), in the calmed down andvaluable zones measures for melioration of habitatswere planned and performed. Target species in thefirst line was the capercaillie. For a checking of thesuccess of these measures a monitoring program isnecessary. For this counts of visitors were done toproof the acceptance of the marked trail system.Simultaneously on basis of long term researchhabitat structures were mapped and analysed, aswell as a intensive estimation of the stock was done.
A large proportion of nature sports activists willallow themselves to be channelled by convenience.This means extremely good and functionalsignposting (no profusion of signs), attractive sportsopportunities (single trails for MTB, for example),concentrating and extending opportunities to allowthe user to choose his own sequence of shortercourse loops.
A good public relation and information could bereached by creating pleasing information materialand meaningful maps. These information campaignis essential to impart knowledge and acceptance forthe channelling measures.
Furthermore manuals exemplary for mountainbiking and hiking were made, serving as guidelineand information source for municipalities, sportorganisations and tourist service providers. Themanuals include (amongst other things) theecological compatible and attractive (in the view ofsport) installation of trails as well as sign postingand mapping of trails.
The manuals should help to implement theresults of the “good practise”-examples to the wholenature park area.
Einstieg 3 km Spur
6 km Spur11 km Spur
15 km Spur
18 km Spur
Zubringer-Loipe
Fig. 4: Cross-country trails as result of the application of the “ladder”-system.

KRÄMER, ROTH: SPATIAL REQUIREMENTS OF OUTDOOR SPORTS IN THE NATURE PARK BLACKFOREST– GIS-BASED CONFLICT ANALYSIS AND SOLUTIONS FOR VISITOR FLOW MANAGEMENT
39
REFERENCES
Armbruster, Ch. (2001): Multifaktorielle Wirkung vonFreizeitaktivitäten auf Auerwildlebensräume in ganzjähriggenutzten Erholungsgebieten. - Dissertation am Institut fürNatursport und Ökologie der Deutschen SporthochschuleKöln.
KARAMERIS, A. (1982): Analyse und Prognose derErholungsnachfrage in Wäldern als forstlicher Beitrag zurRaumplanung. Forstliche Forschungsberichte München, 50.
KARAMERIS, A. (1987): Die Landschaft als Bestimmungsfaktorfür die Erholungsnachfrage. Forstw. Cbl., 106, 2, S. 92-100.
Nöll, N. (2000): Mountainbiking im Naturpark Südschwarzwald.- Diplomarbeit am Institut für Natursport und Ökologie derDeutschen Sporthochschule Köln.
Polenz, R. (2000): Wandern im Naturpark Südschwarzwald. -Diplomarbeit am Institut für Natursport und Ökologie derDeutschen Sporthochschule Köln.
Roth, R., Krämer, A., Jakob, E., Polenz, R. & Czybulka, J.(2001): MTB-Handbuch für den Südlichen Schwarzwald.Ein Leitfaden für Kommunen, Sportorganisationen undtouristische Leistungsträger. - Selbstverlag DeutscheSporthochschule Köln
Roth, R., Krämer A. & Schäfer, A. (2001): Wanderhandbuch fürden Naturpark Südschwarzwald Ein Leitfaden fürKommunen, Sportorganisationen und touristischeLeistungsträger. - Selbstverlag Deutsche SporthochschuleKöln.
Roth, R. & Krämer, A. (2000): EntwicklungskonzeptionSporttourismus im Naturpark Südschwarzwald. –Selbstverlag Institut für Natursport und Ökologie, DeutscheSporthochschule Köln.
Roth, R., Krämer A. & Armbruster, F. (2000): GIS-gestützteSporttourismuskonzeption in naturnahenLandschaftsräumen. – In: Strobel, J., Blaschke, T. &Griesebner, G. (Hrsg.): Angewandte GeographischeInformationsverarbeitung XII. Beiträge zum AGIT-Symposium Salzburg 2000. – Herbert Wichmann Verlag,Heidelberg. – S. 438-444.
Monitoring and Management of Visitor Flows in Recreational and Protected AreasConference Proceedings ed by A. Arnberger, C. Brandenburg, A. Muhar 2002, pages 40-45
40
Observation as a Technique for Establishing the Use made of the WiderCountryside: a Welsh Case Study
Ian Keirle
Lecturer, Welsh Institute of Rural Studies, University of Wales Aberystwyth, LlanbadarnCampus, Aberystwyth, Ceredigion, SY23 3AL, Wales
Email: [email protected]
Abstract: Surveying the use made of the wider countryside for recreation is problematic due tothe scale of the area to be covered. In particular the distribution, numbers and activities ofcountryside visitors are difficult to ascertain using conventional methodologies such asquestionnaires and counters. This paper describes an observational methodology that has beenused investigate recreational activity in a 466 square kilometre area of Mid Wales. The resultsillustrate the countryside resources that are being utilised, the activities undertaken and thenumber of people involved. It is concluded that observation is a valuable tool in understandingthe nature of recreation in the wider countryside.
INTRODUCTION
The strategic planning of recreation in thecountryside is becoming increasingly important as ameans of ensuring that the demands of visitors tothe countryside are met whilst controlling anyadverse effects that recreation may have on theenvironment. Strategic planning normally involvesconsidering large areas of countryside such as thearea contained within a national park or within anadministrative boundary. Research has shown thatsuch strategic planning is often based uponinadequate levels of information regardingcountryside usage and is often based on nothingmore than presumption (Curry and Pack, 1993).
To plan countryside recreation strategically awide variety of information is required about thecountryside and the visitor. Informationrequirements include:• The countryside resources that are available for
countryside recreation• The constraining factors that may limit the use
of areas for recreation• The profiles of visitors• The number of visitors• The distribution of visitors• The activities carried out by visitors• The attitudes of visitors
Trends in visitor usage of the countrysideThere are a variety of established methodologies
for providing answers to many of these questions(such as questionnaires, focus groups and facilitiesaudits). Many of these methodologies work at alocalised site level but are not so effective when itcomes to larger countryside areas. In particular,present methodologies find it difficult to establishvisitor numbers, visitor distribution and theactivities carried out by visitors in open countryside
where visitor density may be low. This paperpresents an observational methodology that canestablish use, distribution and activities over areasof open countryside.
OBSERVATIONAL STUDIES
Observational studies, often labelled as‘naturalistic’ and sometimes referred to asbehavioural mapping, are characterised by thesystematic and unobtrusive observation andrecording of behaviour (Ely, 1981; Campbell, 1970;Glancy, 1986; Beer, 1987). When studying large orhighly mobile mammals to establish distribution,resource usage and behaviour, researchers areforced into an observational approach (mammalsare not known for their ability to fill inquestionnaires or sit on focus groups!). Can weadapt the methods used to survey mammals to studyHomo sapiens? An example of an observationalapproach is the national badger survey carried outin the United Kingdom by Professor Stephen Harrisof the University of Bristol (N.C.C., 1990, Wilson,Harris and McLaren, 1997). This survey wascarried out between 1985 and 1988 and repeatedbetween 1994 and 1997. This survey sought to findanswers to key questions concerning badgers suchas how many badgers there were in the countryside,their distribution (both at a national and habitatscale) and whether the population was changing(both in numbers and distribution)? Themethodology used for the national badger surveywas based upon systematic observation for signs ofbadgers within randomly selected one-kilometresquares, selected in proportion to land area asclassified by a land classification scheme, (Bunce,Barr, Clarke, Howard and Lane, 1996). Similarsurveys have also been carried out on bats (Walshand Harris, 1996a and b; Walsh, Harris and Hutson,1995).

KEIRLE: OBSERVATION AS A TECHNIQUE FOR ESTABLISHING THE USE MADE OF THE WIDER COUNTRYSIDE:A WELSH CASE STUDY
41
Figure 1. Map of the Aberystwyth area, showing the randomly chosen 52 Ordnance Survey one by one kilometre grid squares that weresurveyed for the study
There are therefore tried and tested methodologicalapproaches for systematic research through the useof observation, of mammal distribution, numbersand behaviour.
It can be noted that the issues the nationalbadger survey tried to answer are very similar to theissues identified for countryside recreation, that ofnumbers using the countryside and distribution.
OBSERVATIONAL STUDY OF NORTHCEREDIGION
This paper describes a methodology, adaptedfrom observational studies of mammals, that hasbeen used to investigate recreational activity in a466 square kilometre area of Mid Wales during thesummer of 1996. This survey in particular soughtto find out:
1. the activities people undertake ascountryside recreation
2. the exact types of access people use whenvisiting the countryside
3. the types of countryside people visit4. an estimate of the number of people using
the wider countryside
This study was carried out in North Ceredigionin Mid Wales. An area described by six adjacentOrdnance Survey ten by ten kilometre squares, in athree by two rectangle, (grid reference of the South
West corner being SN5/7) was selected, giving466 Ordnance Survey one-kilometre grid squarescontaining land above the high water mark. Fromwithin this 52 one-kilometre squares (11.2% of thestudy area) were chosen using random numbers(Figure 1). The survey was conducted between the4th and the 26th of August 1996. During this periodeach square was surveyed three times, once on aweekday, once on a weekend day and once over thethree days of the August Bank Holiday weekend.Surveys were carried out between 11.00 a.m. and6.00 p.m. with each surveyor covering no more thanthree squares in any one day.
INFORMATION GATHERING
Within each square all access routes consideredto be open to the public were walked to assess themost appropriate positions from which to observerecreationalists and to collect information regardingthe nature of the countryside within the square.
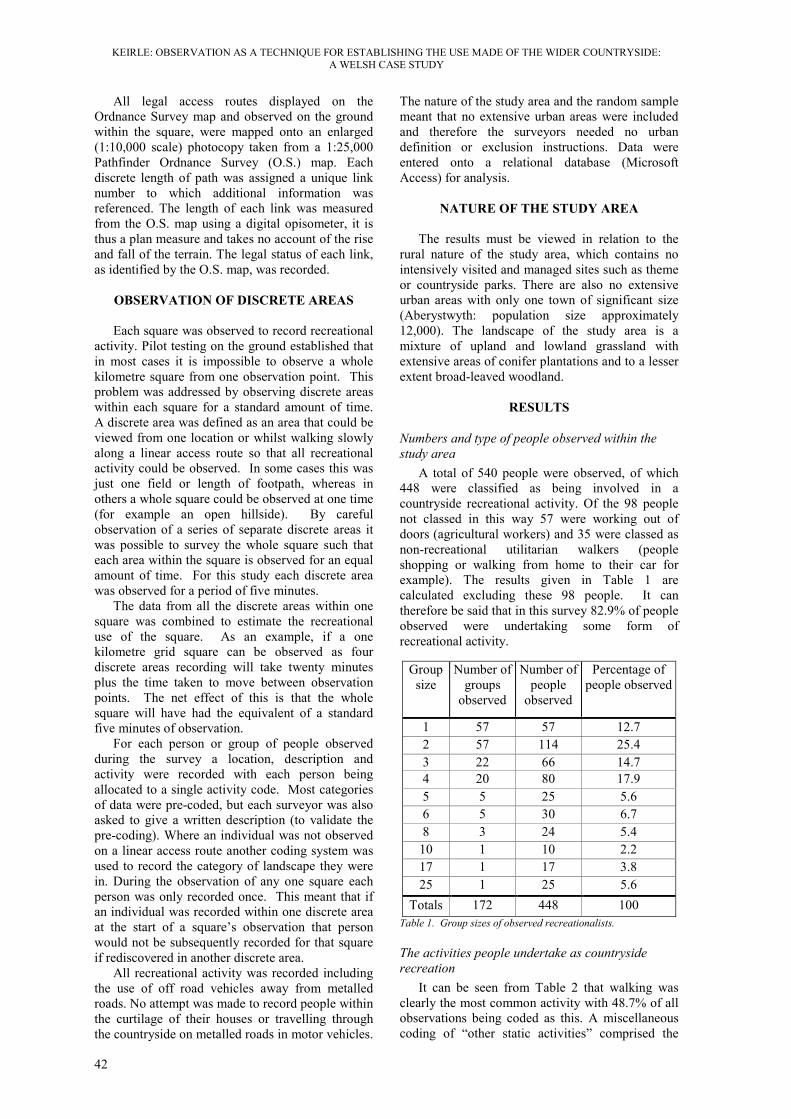
KEIRLE: OBSERVATION AS A TECHNIQUE FOR ESTABLISHING THE USE MADE OF THE WIDER COUNTRYSIDE:A WELSH CASE STUDY
42
All legal access routes displayed on theOrdnance Survey map and observed on the groundwithin the square, were mapped onto an enlarged(1:10,000 scale) photocopy taken from a 1:25,000Pathfinder Ordnance Survey (O.S.) map. Eachdiscrete length of path was assigned a unique linknumber to which additional information wasreferenced. The length of each link was measuredfrom the O.S. map using a digital opisometer, it isthus a plan measure and takes no account of the riseand fall of the terrain. The legal status of each link,as identified by the O.S. map, was recorded.
OBSERVATION OF DISCRETE AREAS
Each square was observed to record recreationalactivity. Pilot testing on the ground established thatin most cases it is impossible to observe a wholekilometre square from one observation point. Thisproblem was addressed by observing discrete areaswithin each square for a standard amount of time.A discrete area was defined as an area that could beviewed from one location or whilst walking slowlyalong a linear access route so that all recreationalactivity could be observed. In some cases this wasjust one field or length of footpath, whereas inothers a whole square could be observed at one time(for example an open hillside). By carefulobservation of a series of separate discrete areas itwas possible to survey the whole square such thateach area within the square is observed for an equalamount of time. For this study each discrete areawas observed for a period of five minutes.
The data from all the discrete areas within onesquare was combined to estimate the recreationaluse of the square. As an example, if a onekilometre grid square can be observed as fourdiscrete areas recording will take twenty minutesplus the time taken to move between observationpoints. The net effect of this is that the wholesquare will have had the equivalent of a standardfive minutes of observation.
For each person or group of people observedduring the survey a location, description andactivity were recorded with each person beingallocated to a single activity code. Most categoriesof data were pre-coded, but each surveyor was alsoasked to give a written description (to validate thepre-coding). Where an individual was not observedon a linear access route another coding system wasused to record the category of landscape they werein. During the observation of any one square eachperson was only recorded once. This meant that ifan individual was recorded within one discrete areaat the start of a square’s observation that personwould not be subsequently recorded for that squareif rediscovered in another discrete area.
All recreational activity was recorded includingthe use of off road vehicles away from metalledroads. No attempt was made to record people withinthe curtilage of their houses or travelling throughthe countryside on metalled roads in motor vehicles.
The nature of the study area and the random samplemeant that no extensive urban areas were includedand therefore the surveyors needed no urbandefinition or exclusion instructions. Data wereentered onto a relational database (MicrosoftAccess) for analysis.
NATURE OF THE STUDY AREA
The results must be viewed in relation to therural nature of the study area, which contains nointensively visited and managed sites such as themeor countryside parks. There are also no extensiveurban areas with only one town of significant size(Aberystwyth: population size approximately12,000). The landscape of the study area is amixture of upland and lowland grassland withextensive areas of conifer plantations and to a lesserextent broad-leaved woodland.
RESULTS
Numbers and type of people observed within thestudy area
A total of 540 people were observed, of which448 were classified as being involved in acountryside recreational activity. Of the 98 peoplenot classed in this way 57 were working out ofdoors (agricultural workers) and 35 were classed asnon-recreational utilitarian walkers (peopleshopping or walking from home to their car forexample). The results given in Table 1 arecalculated excluding these 98 people. It cantherefore be said that in this survey 82.9% of peopleobserved were undertaking some form ofrecreational activity.
Groupsize
Number ofgroups
observed
Number ofpeople
observed
Percentage ofpeople observed
1 57 57 12.72 57 114 25.43 22 66 14.74 20 80 17.95 5 25 5.66 5 30 6.78 3 24 5.4
10 1 10 2.217 1 17 3.825 1 25 5.6
Totals 172 448 100Table 1. Group sizes of observed recreationalists.
The activities people undertake as countrysiderecreation
It can be seen from Table 2 that walking wasclearly the most common activity with 48.7% of allobservations being coded as this. A miscellaneouscoding of “other static activities” comprised the

KEIRLE: OBSERVATION AS A TECHNIQUE FOR ESTABLISHING THE USE MADE OF THE WIDER COUNTRYSIDE:A WELSH CASE STUDY
43
second largest recreational category with 11.2% ofpeople being observed sunbathing, talking oradmiring the view. Cycling accounted for nearly6.9% of the observations, with road bicycles out-numbering mountain bicycles. However, all cyclistsseen were using metalled roads. A range of 14 otheractivities were observed. This illustrates the varietyof countryside recreational activities undertakenwithin the study area.
Activity Percentage ofobservations (n=448)
Walking 48.7Other static activity 11.2Sitting in a car 5.6Picnicking 5.4Cycling 6.9Off road motor vehicle 3.6Boating (sea) 3.6Children playing 2.7Horse riding 2.5Fishing 2.2Model plane flying 2.2Camping 2.2Swimming/paddling 1.3Horse and cart driving 0.4Collecting 0.4Shooting 0.4Kite flying 0.4Reading informationboard
0.2
Total 100Table 2. The activities ordered by percentage participation, thatcountryside recreationalists were undertaking when firstobserved.
Locations of recreationalists within the study areaThe locations of observed recreationalists can be
put into three categories with 148 people usingpublic rights of way, 106 people on roads(excluding 12 people observed on unclassifiedtracks) and 182 people observed away from linearaccess routes. Of these 182, 40.6% were found neartheir cars in car parks, on the side of roads or incaravan and camping grounds (which occurred in 7of the 52 sampled squares). The remainder wasrecorded in 6 categories with 37.9% being found onor near water bodies.
The linear access routes that people wereobserved using within the study area
To enable a comparison of the relative amountof use of different categories of linear access route,using analysis of variance, the data weretransformed using the formula log (x+1) to createan approximately normal distribution with avariance almost equal to the mean. The analysis
showed that there was no significant (at 95%)difference between the density of people (numbersper unit length) observed on public roads, publicfootpaths and the amalgamated category ofbridleways, roads used as public paths (RUPPs) andbyways open to all traffic (BOATs). These resultsshow that the use made by recreationalists of roads,footpaths and other public rights of ways are inproportion to their length and no significantpreference could be found (see Figure 1).
An estimate of the number of people using the widercountryside
For the observed squares an estimate of theaverage density of countryside recreationalists inany one five minute period of the study time framewas calculated at 2.87 people per km2. From this itmay be further estimated that 1,337 countrysiderecreationalists were at large in the widercountryside of the 466 square kilometres of thestudy area in any one five minute period between11.00am and 6.00pm during the August surveyperiod. However, this does not take account ofknown managed sites within the survey area thatwere not sampled or people touring in cars, but doesreflect the use made of the wider countryside.
Number ofrecreationalists
Expected percentage ofone km squares
0 21.31 12.32 9.13 7.34 6.15 5.16 4.47 3.88 3.39 2.9
10 2.615 1.420 0.8
Table 3. The probability (expressed as a percentage) of findingbetween 0 and 20 recreationalists within one by one kilometresquares within the study area of north Ceredigion.
From observations of the number of peoplefound in each surveyed square a negative binomialdistribution was found. From this data the expectednegative binomial distribution of people for all 466squares in the study was calculated (Fowler andCohen, 1998) from the observed (52 surveyedsquares) sample. The results from this calculationcan be seen in Table 3. This calculated datapredicts for example, that 21.3% of the surveyedone-kilometre squares contain no recreationalists atall and that 43.9% contains five or more.

KEIRLE: OBSERVATION AS A TECHNIQUE FOR ESTABLISHING THE USE MADE OF THE WIDER COUNTRYSIDE:A WELSH CASE STUDY
44
Figure 1. A comparison of the percentage of observed countryside recreationalists found on each category of linear access route andthe percentage that each access route comprises of the whole rights of way network within the observed squares.
DISCUSSION OF RESULTS
The results must be viewed in relation to therural nature of the study area which contains nointensively used and managed sites such as themeor countryside parks. There are also no extensiveurban areas with only one town of significant size(Aberystwyth: population size approximately12,000). It is also important to view eachobservation as one moment in time, as peoples’activities were coded using the activity in whichthey were first observed, which is often only a smallelement of their countryside trip. The results arerecords of observations of real behaviour andintroduce a spatial element and level of detail notnormally available to the countryside planner.
CRITIQUE OF METHODOLOGY
This study was undertaken to evaluate thepotential of observation as a method of collectingdata about countryside usage. While useful datawere collected, several refinements to themethodology may be identified. Difficulties wereexperienced in establishing the legal status of accessto certain areas. In particular, on O.S. maps accessroutes such as white roads do not have their statusshown and public rights of way may be recordedinaccurately. The development of survey mapsbased upon the definitive map and the highwaysregister held by the local authority would improvethe accuracy, by confirming the current legal statusand location of public rights of way. The status ofunclassified tracks or white roads is likely to be anarea of uncertainty until procedural or legal changesare made. In this survey no urban areas wereencountered, but future application of thismethodology is likely to include such areas. Theadoption of a definition of ‘countryside’ may berequired in these cases. A reliable definition is noteasily constructed although it is suggested that,
for convenience, areas of dense urban housing orindustrial areas, often with dedicated pedestrianwalkways or pavements are excluded. A clearand robust definition would be needed if futureobservational surveys were to be comparable.
The survey squares observed in this study wereselected in a purely random manner and did notdeliberately cover know busy recreational sites (infact the study area contains no known sites whichhave a large visitor pressure such as country ortheme parks or attractive villages). In futuresurveys it may be useful to ensure a large enoughproportion of squares are sampled to ensure that thestudies obtain a representative sample of heavilyused managed sites as well as the widercountryside. Another issue not encountered withinthis study is how to record large numbers of peoplethat may be observed at busy sites. It is suggestedthat one approach to this may be to subdivide thearea into smaller areas that will allow for accuraterecording.
CONCLUSION
It can be concluded that the use of observationof discrete areas of the countryside as outlined inthis paper is a viable and practical method foranalysing recreational behaviour of the widercountryside. It provides a truly systematic methodof recording real behaviour and distribution. Incomparison to other methods this type of surveyallows for the collection of information aboutcountryside usage which is beyond that collected bytraditional methods. As such it provides a valuableand additional tool to aid the understanding andplanning of countryside recreation. It is importantin any study of countryside usage to ensure that datacollected is comparable over time and space. Forfuture studies using this technique it is thereforeimportant to standardise the method and samplingframe used. Future studies using such a
0
5
10
15
20
25
30
35
40
45
Roads Footpath Bridleway, RUPP or BOAT
%
% of recreationalists observed (n=254, which excludes 12 peopleobserved on unclassified tracks)
% of the network length (Length ofnetwork sampled = 127.5km, whichexcludes 16.7 km of unclassifiedtracks)
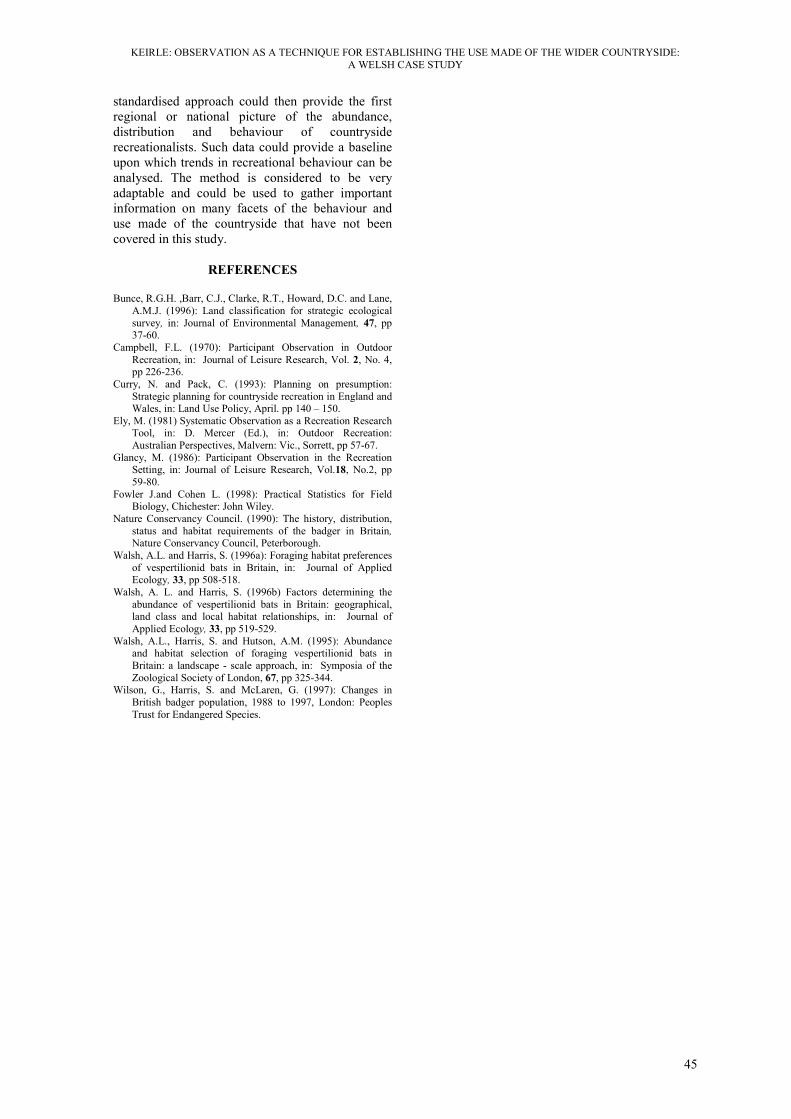
KEIRLE: OBSERVATION AS A TECHNIQUE FOR ESTABLISHING THE USE MADE OF THE WIDER COUNTRYSIDE:A WELSH CASE STUDY
45
standardised approach could then provide the firstregional or national picture of the abundance,distribution and behaviour of countrysiderecreationalists. Such data could provide a baselineupon which trends in recreational behaviour can beanalysed. The method is considered to be veryadaptable and could be used to gather importantinformation on many facets of the behaviour anduse made of the countryside that have not beencovered in this study.
REFERENCES
Bunce, R.G.H. ,Barr, C.J., Clarke, R.T., Howard, D.C. and Lane,A.M.J. (1996): Land classification for strategic ecologicalsurvey, in: Journal of Environmental Management, 47, pp37-60.
Campbell, F.L. (1970): Participant Observation in OutdoorRecreation, in: Journal of Leisure Research, Vol. 2, No. 4,pp 226-236.
Curry, N. and Pack, C. (1993): Planning on presumption:Strategic planning for countryside recreation in England andWales, in: Land Use Policy, April. pp 140 – 150.
Ely, M. (1981) Systematic Observation as a Recreation ResearchTool, in: D. Mercer (Ed.), in: Outdoor Recreation:Australian Perspectives, Malvern: Vic., Sorrett, pp 57-67.
Glancy, M. (1986): Participant Observation in the RecreationSetting, in: Journal of Leisure Research, Vol.18, No.2, pp59-80.
Fowler J.and Cohen L. (1998): Practical Statistics for FieldBiology, Chichester: John Wiley.
Nature Conservancy Council. (1990): The history, distribution,status and habitat requirements of the badger in Britain,Nature Conservancy Council, Peterborough.
Walsh, A.L. and Harris, S. (1996a): Foraging habitat preferencesof vespertilionid bats in Britain, in: Journal of AppliedEcology, 33, pp 508-518.
Walsh, A. L. and Harris, S. (1996b) Factors determining theabundance of vespertilionid bats in Britain: geographical,land class and local habitat relationships, in: Journal ofApplied Ecology, 33, pp 519-529.
Walsh, A.L., Harris, S. and Hutson, A.M. (1995): Abundanceand habitat selection of foraging vespertilionid bats inBritain: a landscape - scale approach, in: Symposia of theZoological Society of London, 67, pp 325-344.
Wilson, G., Harris, S. and McLaren, G. (1997): Changes inBritish badger population, 1988 to 1997, London: PeoplesTrust for Endangered Species.

Monitoring and Management of Visitor Flows in Recreational and Protected AreasConference Proceedings ed by A. Arnberger, C. Brandenburg, A. Muhar 2002, pages 46-52
46
Understanding Visitor Flows in Canada's National Parks: the Patterns ofVisitor Use Study in Banff, Kootenay, and Yoho National Parks1
Dave McVetty
Client Research Specialist, Parks Canada's Western & Northern Canada Service Centre145 McDermot Avenue, Winnipeg, Manitoba, Canada, R3B 0R9
E-mail: [email protected]
Abstract: Parks Canada and its stakeholders are seeking to better understand visitors’ movements,behaviour, and motives to support ecological integrity and sustainable tourism. Traditional marketresearch describes these dimensions one at a time, but few studies have focused on thesegmentation needed to addresses all three dimensions together. This study develops a complexvisit typology and compares its practical value to a more common segmentation approach: visitororigin. Results suggest that both approaches have practical value, but that the post hoc visit typeapproach is more useful as a management tool for describing visitor movements.
1 The author acknowledges the partnership between Parks Canada, Alberta Economic Development, and the Banff – Lake LouiseHotel Motel Association that sponsored the research described in this paper. Visit typologies were developed in conjunction with AccordResearch, University of Calgary.
INTRODUCTION
Canada's system national parks and parkreserves represents thirty-nine natural areas ofCanadian and global significance. The Governmentof Canada has given Parks Canada – the agency thatmanages the system – the mandate to protect thesespecial places as examples of those natural areas forpublic understanding, appreciation and enjoymentin ways that leave them unimpaired for futuregenerations.
Parks Canada has adopted the principle ofecological integrity to fulfil this broad mandate. Anecosystem is considered to have integrity "when itis deemed characteristic for its natural region" andits "native components (plants, animals and otherorganisms) and processes (such as growth andreproduction)" are intact (Parks Canada, 2000).
Together, the mandate and definition ofecological integrity are consistent with thedefinition of sustainable tourism as that which:
"...meets the needs of present tourists and hostregions while protecting and enhancingopportunities for the future... leading tomanagement of all resources in such a way thateconomic, social and aesthetic needs can befulfilled while maintaining cultural integrity,essential ecological processes, biological diversityand life support systems." World TourismOrganization (2001)
Parks Canada is developing an integratedscience strategy so that natural, social, and culturalsciences can work together in support its mandate.In the tourism area, this requires support fromexternal stakeholders because the agency does nothave jurisdiction over all aspects of a park’s tourismsystem. An effective social science strategy willneed to accommodate those perspectives, including:
• Physical/Spatial: Those with this perspectivefeel that tourism has an ecological basis, soplanning should be based on spatial patternsand capacities to minimise the negative impactsof tourism on the environment. Planning isused to redirect, concentrate, or disperse visitoruse to minimise impacts in sensitive areas.
• Economic Perspective: Those with thisperspective see tourism as a means to promotegrowth and development. Planning emphasiseseconomic benefits and ways to efficientlycreate income and employment benefits. It isseen as being equal to other industries.
• Community Perspective: Those with thisperspective see tourism in its social andpolitical context. The planner is a facilitatorwho helps host communities define desiredoutcomes in socio-cultural terms. Hostcommunities – on the “factory floor” of thetourism industry – thus acquire the control theyneed to help balance tourism development.

MCVETTY: UNDERSTANDING VISITOR FLOWS IN CANADA'S NATIONAL PARKS: THE PATTERNS OF VISITOR USESTUDY IN BANFF, KOOTENAY, AND YOHO NATIONAL PARKS
47
Getz (1987) proposed a theoretical perspectivethat integrates these approaches in a way that isconsistent with sustainable tourism and ecologicalintegrity:• Integrated Perspective: Tourism is a system
that should offer lasting and secure livelihoodswith minimal depletion of resources,degradation of the environment, culturaldisruption, or social instability. Planning isintegrated with other planning processes andwith its own implementation.
The Tourism Optimization Management Model(TOMM) is a recent innovation that operationalizesGetz’ integrated model (Manadis RobertsConsultants 1997; Jack 1999). It views tourism andvisitor use as a system and seeks to optimize itsoutcomes based on a broad understanding of itsfunction (McArthur, 2001).
Those with knowledge of a system's functioncan manipulate it in support of established aims(Bellinger et al, [n.d.]). In tourism, this requires anunderstanding of visitor volumes and visitorbehaviour. Research can foster an understanding oftourist activity, the patterns in visitors’ behaviour,and monitor and predict the change that touristactivity brings (Consulting and Audit Canada, 1994;McArthur, 1996).
The literature offers few studies that describevisitor use based on travel behaviour and spatialdistribution (Flognfeldt, 1999). Specifically, theoptimization literature does not suggest how best todescribe visitor behaviour in ways that relatedirectly to management of outcomes. This isimportant for protected heritage areas, wherevisitors' behaviour can have significant long-termimpacts on resources.
Recent literature has discussed the relative valueof demographic, geographic, psychological, andbehavioural segmentation bases (Moscardo, Pearce,and Morrison, 2001), but few studies havecompared of the effectiveness of differentsegmentation solutions to respond to the challengeof optimization.
Moscardo et al suggest that the traditionalapproach uses a priori demographic variables, orvariables that are chosen before the data areanalysed. They point to numerous studies that havefound significant relationships between visitors’origin and both travel behaviour and satisfaction.
While demographic descriptions are the norm,some argue, "Demography is not destiny" andadvocate post hoc segmentation, determined by thedata rather than by the researcher (Adams, 1997).These segments, then, can be described withgeographic variables (Moscardo et al, 2001).
Regardless of the approach, effective visitorsegmentation would describe visitor use reliably inseveral dimensions, producing segments that are:• homogeneous (unique from each other, but
internally consistent);• durable (over an extended period of time);
• measurable (can be identified and countedwith reasonable accuracy);
• responsive (a unique marketing approachrequired);
• relevant (to the organisation commissioningthe research);
• accessible (easily reached via one or moremedia);
• substantial (large enough to warrant attention);and
• compatible (with existing markets) (Moscardoet al, 2001).
The study by Moscardo et al compared the valueof geographic origin versus activity participation inAustralia’s Wet Tropics region. That studyfocused on visitors to the Australian rainforest, butthe study’s sample size was too small to make clearconclusions (n=549).
Like that study, this one compares the relativevalue of a priori visitor origin segments and a morecomplex post hoc approach to determine which ismost useful from several different perspectives.The post hoc approach is based on 1,127respondents’:• level of the pre-trip importance placed on
different visit opportunities;• activities in each of the parks' main visitor
nodes; and• parties' reported spending in Banff National
Park.Each base is compared against the eight criteria
for effectiveness to evaluate the two segmentationapproaches. It uses data collected in a study ofvisitors to Banff, Kootenay, and Yoho NationalParks of Canada in the summer and autumn of2000, but reports only the findings of the Banffsample.
BACKGROUND
Banff, Kootenay, and Yoho National Parks areamong the country's most recognised touristdestinations. Over six million visitors from Canada,the United States, and overseas enjoy the parks eachyear, spending hundreds of millions of dollars intheir hotels, restaurants, and stores. Yet, asrepresentative examples of Canada's naturalheritage – and as a World Heritage Site – theintegrity of their resources is an national andinternational issue.
Last year, three organisations joined together tostudy visitor use of Banff, Kootenay, and YohoNational Parks: Parks Canada; Alberta EconomicDevelopment; and the Banff Lake Louise HotelMotel Association. They wanted a single, reliablebase of commercial, economic, and ecological datato describe visitors’ movements in the parks and theoutcomes of visitor use.
Each organisation approaches tourism in theparks from a different perspective:

MCVETTY: UNDERSTANDING VISITOR FLOWS IN CANADA'S NATIONAL PARKS: THE PATTERNS OF VISITOR USESTUDY IN BANFF, KOOTENAY, AND YOHO NATIONAL PARKS
48
• The Banff - Lake Louise Hotel MotelAssociation works on behalf of the parks'tourism industry and the communities of Banffand Lake Louise to help achieve commoncommercial and political goals (Banff - LakeLouise Hotel Motel Association [n.d.]).
• Alberta Economic Development is theprovincial ministry that provides leadership forAlberta's economic development. Besidesseeking to stimulate growth in the tourismindustry, the ministry promotes trade and helpsto attract investment in the province (AlbertaEconomic Development, 2001).
• Parks Canada is the federal agencyresponsible for Canada's system of nationalparks and national historic sites. Its mandate isto ensure the ecological and commemorativeintegrity of the resources in its stewardship inways that foster understanding, appreciationand enjoyment by this and future generations.(Parks Canada, 2001).
DATA COLLECTION
The data for this study was collected in a studyof visitors to Banff, Kootenay, and Yoho NationalParks between June 12th and October 13th, 2000.Similar but separate research methods andinstruments were used to sample from threepopulations:• visitors travelling as part of a commercial tour,
including those in motor coaches and vans;• those travelling via scheduled carriers (trains
and buses); and• independent visitors (those travelling in
personal vehicles, on foot, or by bicycle).Brief personal interviews with a randomly
selected sample of group leaders establishedpopulation parameters (available in English andFrench; park residents, employees, and commutingworkers were excluded from the sample). A mail-back questionnaire collected more detailedinformation from selected respondents (available inEnglish, French, German, and Japanese).
This paper focuses only on independent visitorsto Banff National Park. These results are based5,405 personal interviews and 1,127 returnedquestionnaires (representing 41% of those whowere given a form).
Results were weighted to correct for responsebias by origin (local residents were under-represented in the up to the questionnaire) and toreflect the number of visitor party entries by gateand date. Thus, all results are presented as theactual number of independent visitors (or visitparties, where noted).
HYPOTHESIS
This study uses a null hypothesis: A priori andpost hoc segmentation will be equally useful asmarket segmentation techniques.
If there are no significant differences inusefulness, the results will suggest that traditionalsegmentation bases – like origin – can represent thecomplexity of visitor use.
But if the null hypothesis is rejected – and onetype is shown to be more useful than the other –thenthat approach may be a useful tool for:• defining a complex tourism system;• helping stakeholders understand the outcomes
of that system and the relationships betweenthose outcomes; and
• helping them cooperate in support ofsustainable tourism.
RESULTS
Defining A Priori Segments: Visitor OriginVisitors' origins were divided into seven
categories that reflect the proportions of visitors byorigin in previous research in the parks (see Figure1). Because the survey's unit of analysis is the visit-party, one questionnaire was distributed to eachparty in the sample. For this reason, Figure 1 alsoshows the origin of survey respondents.
The two are similar enough to be considered thesame, so this paper will substitute respondent originfor visitor origin.
Defining Post hoc Segments: Visit TypesTo develop meaningful visit types, three types
of information were analysed:• importance of 16 visit opportunities to
respondents' visit decision;• their reported activities in each of the parks’
visitor nodes; and• reported spending in Banff National Park.
The segmentation was a multi-step process.First, a principal component analysis was applied tothe respondents' reported importance levels. It useda varimax rotation and component scores werecalculated for the rotated components. Then ahierarchical cluster analysis was applied to thecomponents score using Ward's clustering methodwith squared Euclidean distances. A three-clustersolution was selected based on the agglomerationschedule. Finally, the cluster centres from thissolution were used as initial clusters for a 3-cluster,k-means cluster analysis.
MCVETTY: UNDERSTANDING VISITOR FLOWS IN CANADA'S NATIONAL PARKS: THE PATTERNS OF VISITOR USESTUDY IN BANFF, KOOTENAY, AND YOHO NATIONAL PARKS
49
Origin of all Visitors** Origin of Respondents++
Visitor OriginEstimated Number ofIndependent Visitors
Pct. ofVisitors
Estimated Number ofIndependent Visit Parties
Pct. ofVisit Parties
Alberta 336,774 21.4% 112,300 20.6%Other Canada 275,064 17.4% 93,260 17.1%
U.S.A. 523,669 33.2% 195,024 35.7%U.K. 94,063 6.0% 38,376 7.0%
Germany 115,573 7.3% 40,005 7.3%Other Europe 85,729 5.4% 18,288 3.3%
Other International 57,970 3.7% 34,239 6.3%Unreported 88,400 5.6% 14,841 2.7%
Total 1,577,242 100.0% 546,333 100.0%
** The survey asked for the origin of each visitor in the party. The first two columns illustrate the origin of all visitorsin the surveyed parties, weighted up to the estimated number of parties.++ One respondent (over the age of 16) was randomly selected from each visit party to answer on behalf of thegroup to minimize response bias on the basis of origin, age, and sex.
Figure 1: Origins of Visitors and Respondents
Visit Type
Est. No. ofIndependentVisit Parties
Pct. ofIndependentVisit Parties
Getaway Visit 241,462 44.2%Comfort Visit 188,656 34.5%
Camping Visit 116,215 21.3%Total 546,333 100.0%
Figure 2: Visit Types
Visit TypeGetaway Visit Comfort Visit Camping Visit Total
Est. # ofParties
% inType
Est. # ofParties
% inType
Est. # ofParties
% inType
Est. # ofParties
% inType
Alberta 102,537 42.5% 2,721 1.4% 7,043 6.1% 112,301 20.6%Other Canada 51,358 21.3% 22,441 11.9% 19,461 16.7% 93,260 17.1%
U.S.A. 59,583 24.7% 96,296 51.0% 39,145 33.7% 195,024 35.7%U.K. 10,388 4.3% 22,326 11.8% 5,662 4.9% 38,376 7.0%
Germany 4,830 2.0% 10,400 5.5% 24,775 21.3% 40,005 7.3%Other Europe 978 .4% 7,496 4.0% 9,814 8.4% 18,288 3.3%
OtherInternational
6,395 2.6% 18,752 9.9% 9,091 7.8% 34,238 6.3%
Total 241,462 100.0% 188,657 100.0% 116,214 100.0% 546,333 100.0%Figure 3: Relationship between Visitor Origin and Visit Typ
The resulting segments are presented in Figure 2and are briefly described below:• The largest proportion of park visits are
categorised as Getaway Visits (44%). Theseare often day trips or 2-3 day visits that thattends to focus on a specific activity or area.
• About one-third (35%) of the visits arecategorised as Comfort Visits. These visitstend to use the parks' hotels and restaurants...and its visitors spend the most money.
• The final visit type is Camping Visits. Inaddition to its range of accommodation andrestaurant opportunities, the parks offer anideal destination for camping and recreationalvehicle touring.
A chi-square analysis suggests that visit typeand respondent origin are strongly related (p=0.000,Goodman Kruskal tau = .209; see Figure 3).Getaway visit type parties are mainly from the hostProvince of Alberta, neighbouring BritishColumbia, and bordering American states. Half ofthe Comfort visit type parties are from the U.S.A.,
with almost no parties from the Province of Alberta.Finally, the Camping visit type is about one-thirdAmerican (34%) but features a disproportionatelylarge number of German visitors (21%).
Comparing the Two Segmentation ApproachesThe variables selected for the comparison were
selected for their relevance to the three fundingpartners for the study. Together, theseorganisations represent the interests of many of thestakeholders in the park’s operation. The variablesput into the analaysis are:• party-visit spending in Banff National Park• importance to visit decision of opportunities to
learn about Canada’s natural and historicheritage; and
• propensity to stay in a hotel, motel, or bed andbreakfast facility while in Banff National Park.
Table 4 compares the overall results, results foreach segmentation approach, and statistical analysisfor each item.

MCVETTY: UNDERSTANDING VISITOR FLOWS IN CANADA'S NATIONAL PARKS: THE PATTERNS OF VISITOR USESTUDY IN BANFF, KOOTENAY, AND YOHO NATIONAL PARKS
50
Party Visit Spending in Banff National ParkVisitor spending is the basis for analysing the
economic impact of tourism and visitor use. This isessential information for stakeholders who wish tounderstand the economic dimension of visitor use.
Visitors were asked for the total amount (inCanadian dollars) their party spent in BanffNational Park during their current visit, includingtaxes, tips, and prepaid expenses, using cash, creditcard, and debit card. They were then asked toindicate the proportion of this total that was spent ineach of nine categories. Note that only theaggregate total is used in this analysis.
International respondents report the highestparty spending, except for German respondents.Albertan respondents report the lowest amount.The differences are statistically significant, andETA squared results suggest that visitor originexplains 11.2% of the variance in spending.
Using the post hoc approach, Comfort Visitparties report the highest party spending. Albertanrespondents report the lowest amount. Thedifferences are statistically significant, and ETAsquared results suggest that visitor origin explains17.6% of the variance in spending.
Thus, for spending, results suggest that the posthoc visit type segments explain more of thedifferences between respondents.
Importance of Opportunities to Learn AboutCanada’s Natural and Historic Heritage
Parks Canada manages special examples ofCanada’s heritage for public benefit, includingpublic understanding, appreciation, and enjoymentof their significance. The agency wishes to betterunderstand the importance that visitors place onlearning to address the mandate in a client-focussedmanner.
Visitors indicated the importance of 16 differentopportunities on five-point scales where 1 was “Notat all important” and 5 was “Very important”. Twoof the opportunities relate directly to the ParksCanada mandate: opportunities to learn aboutCanada’s natural and historic heritage. Some otheritems on the list include: opportunities to enjoy timewith friends and/or family; see wildlife in its naturalenvironment; and mix outdoor experiences withmodern comforts.
Results suggest a significant relationshipbetween both items and the a priori originsegments. European respondents from outsideGermany report the highest importance scores forhistoric heritage, while all others report similarlevels of importance. The ETA squared resultssuggest that origin explains only 1.8% of thevariance. International visitors – especially thosefrom Germany – report the highest scores foropportunities to learn about Canada’s natural
heritage, whereas North Americans report relativelylow scores. In this case, origin explains 13.5% ofthe variance.
Using the post hoc approach, the segmentsreport similar levels of interest in opportunities tolearn about Canada’s historic heritage. Thedifferences are statistically significant, but visittypes explain less than 1% of the variance. There isa more pronounced difference for the importance oflearning about Canada’s natural heritage, but thesegments explain only 1.5% of the variance.
Thus, for the importance of learningopportunities, the a priori origin segmentationexplains is more effective.
Propensity to stay in commercial accommodationThe survey asked visitors to list their specific
activities in each of the park’s visitor nodes.The a priori origin approach illustrates
significant differences, with the segmentsexplaining 10.8% of the variance. Internationalrespondents report the highest propensity, althoughGerman respondents are only slightly higher thanCanadians.
The post hoc visit type approach also showssignificant differences, although the segmentsexplain 24.5% of the variance. Not surprisingly,Comfort Visit parties report the highest propensityto use commercial accommodation and CampingVisit parties report the lowest.
Thus, for spending, results suggest that the posthoc visit type segmentation explains more of thedifferences between respondents.
Assessing the Value of Each ApproachThe findings support those of Moscardo, Pearce,
and Morrison (2001), that each approach has itsmerits. This section compares the two approachesto the eight criteria established in the introduction.
Homogeneous: Both approaches developdistinct segments with little internal variation. Theorigin approach was more effective for visitmotives, but neither approach explained muchvariance. The visit type approach explained morevariance for spending and hotel use. Moscardo et alalso had mixed findings, although in different areas.That study found that activity-based segments weremore useful for describing participation, interests,and image; but that origin was more useful fordescribing transportation used, age, partycomposition, and visit history.
At first, the visitor origin approach seems to bemore durable and measurable, as most peoplechange residence infrequently and residence dataare simply captured and objectively reported. Visittypes, on the other hand, are based on more dataand the analysis is subject to judgement.

MCVETTY: UNDERSTANDING VISITOR FLOWS IN CANADA'S NATIONAL PARKS: THE PATTERNS OF VISITOR USESTUDY IN BANFF, KOOTENAY, AND YOHO NATIONAL PARKS
51
Mean Party Visit SpendingOverall Mean = $698 Standard Deviation = $1,122
Mean S.D. Mean S.D.Alberta $164 $424 Getaway Visit $290 $474
Other Canada $411 $578 Comfort Visit $1,308 $1,557U.S.A. $992 $1,300 Camping Visit $434 $469
U.K. $903 $651 Sig. < 0.001 ETA squared: 0.176Germany $296 $173
Other Europe $674 $863Other International $1,037 $1,338
Sig. < 0.001 ETA squared: 0.112
Importance of Opportunities to Learn about Canada’s Historic Heritage to Visit Decision1 = Not at all Important, 5 = Very Important
Overall Mean = 2.7 Standard Deviation = 1.2Mean S.D. Mean S.D.
Alberta 2.7 1.4 Getaway Visit 2.7 1.3Other Canada 2.8 1.3 Comfort Visit 2.8 1.1
U.S.A. 2.6 1.2 Camping Visit 2.8 1.2U.K. 3.2 1.2 Sig. < 0.001 ETA squared: 0.001
Germany 2.8 .9Other Europe 3.1 .9
Other International 2.7 .9Sig. < 0.001 ETA squared: 0.018
Importance of Opportunities to Learn about Canada’s Natural Heritage to Visit Decision1 = Not at all Important, 5 = Very Important
Overall Mean = 3.2 Standard Deviation = 1.3Mean S.D. Mean S.D.
Alberta 2.8 1.5 Getaway Visit 3.0 1.4Other Canada 2.9 1.4 Comfort Visit 3.3 1.2
U.S.A. 2.9 1.3 Camping Visit 3.5 1.4U.K. 3.6 1.0 Sig. < 0.001 ETA squared: 0.015
Germany 4.4 .8Other Europe 4.2 .9
Other International 3.9 1.0Sig. < 0.001 ETA squared: 0.135
Propensity to Stay in a Hotel or Motel During This VisitOverall Propensity = 37%
Propensity PropensityAlberta 12% Getaway Visit 23%
Other Canada 22% Comfort Visit 74%U.S.A. 48% Camping Visit 6%
U.K. 66% Sig. < 0.001 Goodman & Kruskal tau = .245Germany 27%
Other Europe 41%Other International 57%
Sig. < 0.001 Goodman & Kruskal tau = .108
Figure 4: Comparing Geographic and Visit Type Segments
Note, however, that the same visit typesemerged independently in both the summer andautumn samples, suggesting that the visit typeapproach has some stability. And the stability ofthe visitor origin approach may be questioned, sinceCalgary is one of Canada's fastest-growing cities(changing in size and composition); the proportion
of international visitors to the park has grownsignificantly in the past decade; and events likethose on September 11th can quickly change amarket’s composition. Visitor origin has anadvantage, but not by a wide margin. This supportsthe findings of Moscardo et al.

MCVETTY: UNDERSTANDING VISITOR FLOWS IN CANADA'S NATIONAL PARKS: THE PATTERNS OF VISITOR USESTUDY IN BANFF, KOOTENAY, AND YOHO NATIONAL PARKS
52
Responsive: The findings suggest that the mostuseful approach depends on the situation. The visittype segments explain much more behaviouralvariance and origin segments may possibly respondbetter to messages based on visit motives (althoughneither approach explained more than 10% of thevariance). Findings suggest that pre-tripinformation could be targeted at geographicsegments with messages that reflect their uniqueinterests patterns, but that activity information isbest targeted to on-site visit type segments. Thisdiffers from the findings of Moscardo et al, whofound that activity-based segments explained moremotive variance.
Relevance is in the eye of the beholder. Thosewho wish to appeal to visitors’ interests may be bestto pursue origin segments, but those interested invisitors’ activities in the park – and theirmovements through it – would find more value inthe visit type approach. Strategies to influence thetourism system may investigate similar post hocapproaches. Moscardo et al came to a similarconclusion, but for different reasons. In that study,activity segments were better predictors of visitmotives.
Accessible: Without these findings, visitororigin segments seem more practical for pre-tripand en route information and for buildingawareness. But with the results, it is clear that visittype segments are accessible – and more useful –for targeting on-site activity information. Resultssuggest where to find each segment, and whichactivities to target. Moscardo et al suggested thatvisitor origin segments were generally moreaccessible.
Substantial: Both approaches provide segmentsthat are large enough to warrant attention. In recentyears, data miners and proponents of 1:1 marketinghave suggested that new models may render thiscriterion obsolete. Many successful enterprisescater to individuals or to very small niches, orcreate new segments when the opportunity is trulyunique (Behrens, 1987). But, when faced with aneed to describe the outcomes of visitor use, marketsegmentation is still an appropriate activity. Thissupports the findings of Moscardo et al.
Assessing compatibility is beyond the scope ofthe variables used for this paper, although thesurvey did include items to help assess this criterion(e.g.: desire for solitude versus desire forcompanionship). Moscardo et al did find supportfor their activity-based segments on this criterion.
SUMMARY
Visit type segmentation was more useful forpredicting variables of relevance to thedevelopment of park tourism and management of itsfacilities. It should be more useful to managerswho wish to assess the size, competitiveness, andcompatibility of segments within the market. They
were also shown to be relatively stable andreasonably accurately measured.
The visitor origin segments performed well onaccuracy of measurement and pre-trip accessibility.They were also related to participation in specificactivities, but less than visit types.
REFERENCES
Adams, Michael (1997). Sex in the Snow: Canadian socialvalues at the end of the millennium. Viking Press, Toronto,Canada.
Banff - Lake Louise Hotel Motel Association (no date). "AboutUs", online at http://www.bllhma.com/about_us.htm
Bellinger, G., Castro, D., and Mills, A. (no date). "Data,Information, Knowledge, and Wisdom", online athttp://www.outsights.com/systems/dikw/dikw.htm
Behrens, C. (1987). “Bridging the Gap Between Research andStrategy.” In Proceedings of the Australian Travel ResearchWorkshop, November 5-6, 1987, Bunbury, WesternAustralia.
Copps, Sheila (2000). "Speech of the Minister of CanadianHeritage, Sheila Copps, on the occasion of the release of theReport of the Panel on the Ecological Integrity of Canada'sNational parks", online at www.parkscanada.gc.ca/EI-IE/speech.htm
Flognfeldt, T. (1999). “Traveler Geographic Origin and MarketSegmentation: The multi-trips destination case”, Journal ofTravel & Tourism Marketing, 8(1), 1999.
Government of Alberta (2001), Alberta Economic Development,Major Responsibilities, athttp://www2.gov.ab.ca/home/ministries/ministries_detail.cfm?MIN_ID=5
McArthur, Simon (2001). "Ditch finding a balance - go foroptimization", manuscript of a keynote address for TTRACanada 2001 conference, Niagara Falls, ON, October 14-16,2001.
Moscardo, G., Pearce, P., and Morrison, A. “EvaluatingDifferent Bases for Market Segmentation: A Comparison ofGeographic Origin versus Activity Participation forGenerating Tourist Market Segments”, Journal of Travel &Tourism Marketing, 10(1), 2001.
Parks Canada Agency (2001), "Our Mandate", online athttp://www.parkscanada.gc.ca/parks/main_e.htm
Parks Canada Agency (2001), "Panel on Ecological Integrity",online at http://www.parkscanada.gc.ca/EI-IE/index_e.htm
World Tourism Organization (2001), "Sustainable Developmentof Tourism, Concepts and Definitions", http://www.world-tourism.org/frameset/frame_sustainable.html
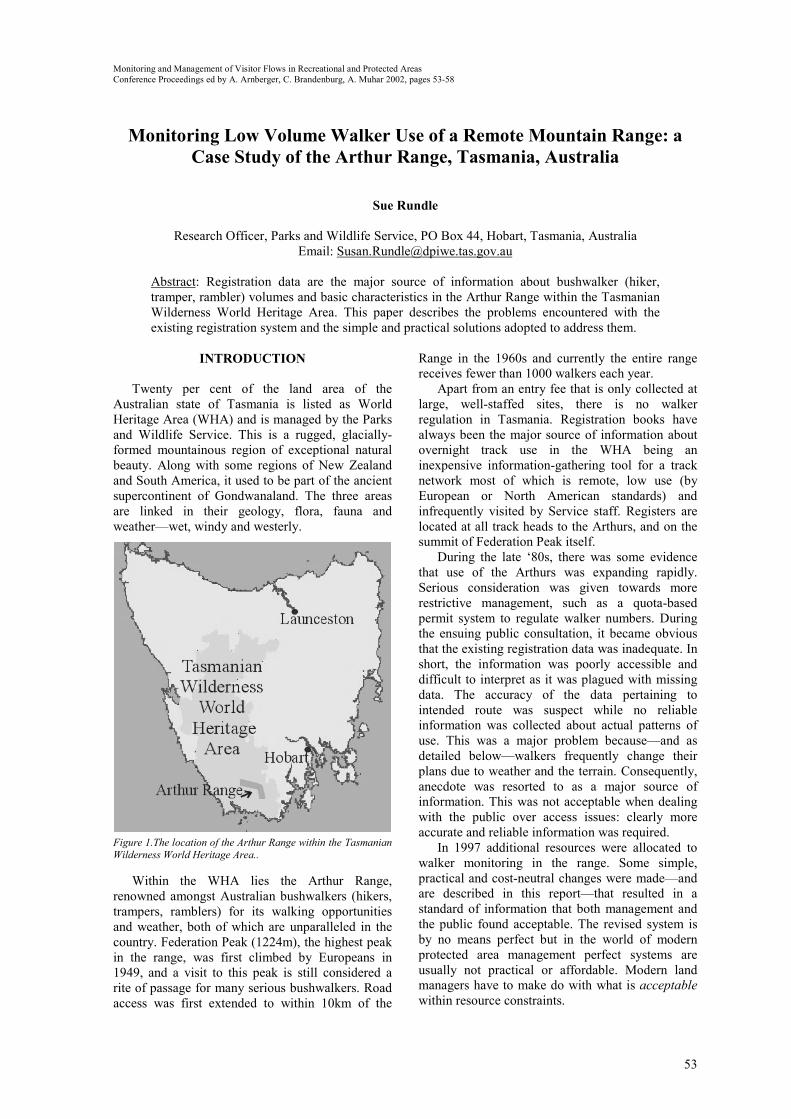
Monitoring and Management of Visitor Flows in Recreational and Protected AreasConference Proceedings ed by A. Arnberger, C. Brandenburg, A. Muhar 2002, pages 53-58
53
Monitoring Low Volume Walker Use of a Remote Mountain Range: aCase Study of the Arthur Range, Tasmania, Australia
Sue Rundle
Research Officer, Parks and Wildlife Service, PO Box 44, Hobart, Tasmania, AustraliaEmail: [email protected]
Abstract: Registration data are the major source of information about bushwalker (hiker,tramper, rambler) volumes and basic characteristics in the Arthur Range within the TasmanianWilderness World Heritage Area. This paper describes the problems encountered with theexisting registration system and the simple and practical solutions adopted to address them.
INTRODUCTION
Twenty per cent of the land area of theAustralian state of Tasmania is listed as WorldHeritage Area (WHA) and is managed by the Parksand Wildlife Service. This is a rugged, glacially-formed mountainous region of exceptional naturalbeauty. Along with some regions of New Zealandand South America, it used to be part of the ancientsupercontinent of Gondwanaland. The three areasare linked in their geology, flora, fauna andweather—wet, windy and westerly.
Figure 1.The location of the Arthur Range within the TasmanianWilderness World Heritage Area..
Within the WHA lies the Arthur Range,renowned amongst Australian bushwalkers (hikers,trampers, ramblers) for its walking opportunitiesand weather, both of which are unparalleled in thecountry. Federation Peak (1224m), the highest peakin the range, was first climbed by Europeans in1949, and a visit to this peak is still considered arite of passage for many serious bushwalkers. Roadaccess was first extended to within 10km of the
Range in the 1960s and currently the entire rangereceives fewer than 1000 walkers each year.
Apart from an entry fee that is only collected atlarge, well-staffed sites, there is no walkerregulation in Tasmania. Registration books havealways been the major source of information aboutovernight track use in the WHA being aninexpensive information-gathering tool for a tracknetwork most of which is remote, low use (byEuropean or North American standards) andinfrequently visited by Service staff. Registers arelocated at all track heads to the Arthurs, and on thesummit of Federation Peak itself.
During the late ‘80s, there was some evidencethat use of the Arthurs was expanding rapidly.Serious consideration was given towards morerestrictive management, such as a quota-basedpermit system to regulate walker numbers. Duringthe ensuing public consultation, it became obviousthat the existing registration data was inadequate. Inshort, the information was poorly accessible anddifficult to interpret as it was plagued with missingdata. The accuracy of the data pertaining tointended route was suspect while no reliableinformation was collected about actual patterns ofuse. This was a major problem because—and asdetailed below—walkers frequently change theirplans due to weather and the terrain. Consequently,anecdote was resorted to as a major source ofinformation. This was not acceptable when dealingwith the public over access issues: clearly moreaccurate and reliable information was required.
In 1997 additional resources were allocated towalker monitoring in the range. Some simple,practical and cost-neutral changes were made—andare described in this report—that resulted in astandard of information that both management andthe public found acceptable. The revised system isby no means perfect but in the world of modernprotected area management perfect systems areusually not practical or affordable. Modern landmanagers have to make do with what is acceptablewithin resource constraints.

RUNDLE: MONITORING LOW VOLUME WALKER USE, ARTHUR RANGE: A CASE STUDYOF THE ARTHUR RANGE, TASMANIA, AUSTRALIA
54
Figure 2. The division of the Arthur Range into Western and Eastern sections, as noted by the shading..
Topography of the rangeThere are three major track heads servicing the
range (Scotts Peak, Farmhouse Creek and Tahune,see figure 2). The range itself is divided into easternand western sections that are treated as two separatedestinations by most bushwalkers. Federation Peakis the major destination in the eastern section, and isaccessed by either routes L or M. In the WesternArthurs most walkers follow rough tracks along theskyline amongst the glacial lakes and small ruggedpeaks that feature on that part of the range. Mostwalkers access the range via route A, and there arethree further escape routes, E, K and R, along therange so a large number of permutations of routeare possible. Most tracks are formed, with theexception of routes E and R, which are pads orroutes only. Given the ruggedness of the range andthe ferocious scrub, walkers stay to tracks androutes so that prediction of movement through therange is straightforward if the access and egresspoints are known.
PROBLEMS AND SOLUTIONS
As stated in the introduction, there were fourproblem areas with the available informationpertaining to walker use of the Arthurs prior to
1997. These were problems with missing data; lackof knowledge of actual—as opposed to intended—patterns of use; perceived unreliability of existingintention information and poor accessibility of data.These problems were addressed by the simpleapplication of information management tools:through better coordination of field operations,changes in register design, data handling andreporting.
System coordination and administrationA district management boundary bisects the
range (figure 2). Both districts had differentoperational systems and maintenance and collationof registers in the two districts was undertakenindependently, even though walkers’ routes crossthese boundaries at will: many start at a track headin one district and end in the other. One districtchanged the registers over and collated data everymonth. The other changed the book over every yearand data collation was not undertaken in the districtat all.
Frequent field servicing of registers is desirableas this means that missing data due to theft ofregisters or their running out of pages is minimized.However this must be balanced against theconsiderable cost of travelling to the registerstations. In this example one district was expending

RUNDLE: MONITORING LOW VOLUME WALKER USE, ARTHUR RANGE: A CASE STUDYOF THE ARTHUR RANGE, TASMANIA, AUSTRALIA
55
too many resources in servicing registers, while theother district was expending too few. The optimumfor the two districts was quarterly servicing.
Prior to 1997, districts manufactured their ownregisters and this required many hours of tediousphotocopying and binding. Districts are nowsupplied with a stock of registers that are made upin head office, and all they need do now is swapover the register during the quarterly visit. This hasfreed time for district staff. It has also meant that allregisters meet a standard format and standard ofquality as office equipment in Head Office isusually a higher standard than in the district.Unused pages from old registers are recycled innew registers.
The major paradigm shift of the entire exercisewas the recognition that registers from differenttrack heads should not be treated as independententities, especially when there are through routesconnecting them. Failure to recognise this results inn-tuple overestimation of walkers on that throughroute, where n represents the number of registersservicing the route. That the registers should betreated independently was something that simplyevolved over the lifetime of the Service, but hasnow been eliminated from all walker monitoringsystems maintained by the Service.
Furthermore, prior to 1997 handling the datafrom the registers was treated as a clerical chore.Data was entered verbatim from the register todatabase without any data checking. Obtaining validinformation from the register requires that theperson working with the data is an experiencedwalker in the area.
What this meant in effect was that all datahandling became a head office task. Optimally,districts should be in control of their own datamanagement systems as they have first priority needfor the data. However in order to address theproblems described above, it was necessary that thework be done in Head Office. In fact, the districts
were happy to relinquish the task so long asinformation was accessible.
Register designA standard design was devised in 1992. This
required the registrant to sign across a row thatspanned two A4 pages. While a vast improvementon the blank-page, journal-style logbook it replaced,the ‘new’ format was contributing to the problem ofmissing data. Registrants were breaking rows acrossthe two pages; they overlooked columns and theywere frequently confronted with books where thewrong pages were bound next to each other.Changing the format to a single, landscapeorientated page (figure 3) resulted in bettercompliance for all items across the row. The widthof the page does limit the amount of informationthat can be requested, but that means that themanagement agency has to limit their data requeststo only the highest priority information.
Limit information requests to one item percolumn. Better compliance results when only oneitem of information is requested per column. In the1992 format, we asked for party leader’s name andaddress in the first column. After 1997, we askedfor party leader’s name in the first (for crossmatching parties for through routes) and origin inthe second. This resulted in an improvement incompliance from a yearly average of 75% (SD5.9%) of parties in the 5 years preceding the formatchange, to a yearly average of 98% (SD 1.0%) overthe 4 years since the new format was introduced.
Use unambiguous column headings. Usecolumn headings that cannot be misunderstood. Forinstance, ask for walk start date and finish daterather than ‘length of trip in days’ which peopleoften interpret as ‘number of nights’. Never say thatan item is optional, and never include ‘if’ in acolumn heading (see below).
Figure 3. Revised register format

RUNDLE: MONITORING LOW VOLUME WALKER USE, ARTHUR RANGE: A CASE STUDYOF THE ARTHUR RANGE, TASMANIA, AUSTRALIA
56
If you want information, ask for it. As alreadystated, one of the insurmountable problems with theArthurs walker data was not knowing what routeswere actually walked, as opposed to what wasintended. There was no provision within theregisters for that information. In 1992, the registersincluded a column for people to sign out and tostate where they started their walk (even though thedata was collected it was never systematicallyused). In 1994, this was expanded to include a datethat the trip was finished. Finally, in 1997, a furthercolumn was added which asked ‘if you changedyour walk from your intentions, list actual routehere’.
It was found that some registrants were filling inthe confirmation columns at the start of the walk.Also, the use of the word ‘if’ confused somewalkers. So, two further changes were made in1999: the confirmation block was made physicallyseparate from the intentions block in theregistration, and the column header was changed to‘where did you actually walk?’ (see figure 3). Thefew remaining entries where walkers fill in theconfirmation column at the start of the walk canusually be detected by the characteristics of thehandwriting.
Compliance with the ‘where did you walk’column was 90% in 1999/00 and 84% in 2000/1. Sofar, there has been no consistent associationbetween route walked and whether confirmationdetails are provided. However, of those who didprovide these details, about 45% walk a shorterroute than intended.
Installing a temporary register on route K for 15months between 1998 and 2000 validatedinformation obtained in the confirmation section ofthe register. Almost complete agreement wasobtained between details provided in theconfirmation columns in the track-head registersand the information collected in the temporaryregister. This confirmed that those people whoconfirmed a particular route on route K werephysically there. Furthermore, very close agreementhas been found between the Federation Peaksummit and track-head registers.
Use of auxiliary information in registration boothsMaps are located within each of the permanent
registration booths. The more frequently undertakenroutes in the area are drawn on the maps and each isgiven a code number. This can make registrationeasier for walkers as they just have to write in anumber rather than write the route out inpainstaking detail. This practice has been in placemany years.
For the track manager, however, route codes areonly useful if they accurately represent wherepeople are walking. Inappropriate route codes werein place in the Western Arthurs, which leadmanagers to believe that a certain pattern of useexisted when in reality it did not.
The map in the major booth (Scotts Peak) wasrenewed in September 1997. The old map containeda code that described a circuit that included routesA and E. Prior to 1997 it was believed that up to40% of registrants were attempting the A to Ecircuit. Route E is untracked and management wereconcerned to keep it that way, so the route code forA to E was deleted from the new map to deterpeople from using it. The results were surprising.
0
50
100
150
200
250
300
350
400
450
500
92/3 93/4 94/5 95/6 96/7 97/8 98/9 99/0 00/1
regi
stra
tions A-R
A-KA-E
Figure 4. Registrations by route for Western Arthurs, Novemberto March. The route code for A-E was removed from the booth inSeptember 1997.
Numbers registering for A-E route dropped from150 in 1996/7 to 20 in 1997/8 (figure 4). It becameclear over the next few years that substantialnumbers of walkers were walking to one of thelakes on the hardened route A and then returning onA, and not walking E at all.
Route codes can only be used where there arefew choices of route and those routes areunambiguous. Where there is any doubt, plenty ofspace should be provided to encourage walkers todescribe their route in detail.
Registration compliance ratesKnowing what proportion of the total visitor
population to the Arthur Ranges signs in theregisters is essential. Not knowing this in the past isone of the reasons why the data were treated withsuspicion.
Some of the ways that compliance can bedetermined (eg. Watson et al, 2000) simply are notappropriate for the area. For instance, one methodrequires an observer near the registration booth tosee who registers and who doesn’t. However,during the busiest time of the year—a couple ofweeks in January—the busiest booth will averagethree parties departing per day. Likewise, in orderto calibrate the track counter installed at the top ofroute A, an observer should watch parties walkingover the counter and compare counts. During thebusiest time of the year, it may take one week toobserve 40 passes. Movement-activated cameras, ofcourse, would be the ideal solution, but in thecurrent climate these are not politically acceptable.

RUNDLE: MONITORING LOW VOLUME WALKER USE, ARTHUR RANGE: A CASE STUDYOF THE ARTHUR RANGE, TASMANIA, AUSTRALIA
57
Figure 5. Schematic segment map of intended and actual passes in the Arthur Range. Not to scale. The upper of the pair of numbersadjacent to each arrow denotes the intended number of passes for that segment, and the lower, the actual number of passes asdetermined by registration confirmation details
The results of walker surveys conducted in asimilar areas of the WHA over the past three yearshave suggested that the registration compliance ratefor overnight walkers is 90% or higher.
ReportingInaccessibility of data was the final problem
identified with the Arthurs data. This was addressedin two ways.
Firstly, registration data is now publishedregularly as part of the routine yearly reportingcycle, along with frontcountry visitor numbers.Prior to this, data were published sporadically.While stating the obvious, if the data is not madeavailable, the data will not be used.
The more difficult problem is knowing what toreport, given the complexity of what is beingreported. A simple approach, that has been receivedvery favourably by managers and public alike, is atrack segment map of walkers and/or passes persegment. This illustrates how use is distributedacross the range, and how this differs when actualuse is compared to intended use.
Given that most walkers’ intended and actualroutes are known, and that those routes are linear, itis a simple matter of allocating the number ofpasses or walkers to each defined track segment bysome simple manipulations of the data (figure 5).These maps do not take registration compliance intoaccount. Also, for those who do not confirm theirroute, it is assumed that they completed what theyintended.
As a crude guide to the accuracy of the system,track counter readings can be compared againstpredicted number of actual passes. A seismiccounter is installed at the location identified infigure 5. The counter is only crudely calibrated, inthat Service staff check that it counts on singlewalker passes. Its behaviour under real lifeconditions is not known. These counters will recordanimal (wombat) passes as well, but these are not
taken into account. However, the agreementbetween the predicted value and the counter valueprovides some reassurance that our predictions arenot orders of magnitude in error, which is the firstobjective of the exercise.
LIMITATIONS OF THE REVISED SYSTEM
The system as described has proved to be usefulwhen monitoring areas where routes are linear.When routes are more complex, as is the case inmore open country where people do not stay ontracks, linear maps are not possible. However, zonemaps can be produced instead.
Track-head registration data is not useful inpredicting use of side-routes. Use of side-routesoccurs on the spur of the moment and depends onweather and group dynamics.
The system is labour intensive and is notappropriate for high use areas. Roughly speaking,office time required for data handling is about eighthours per 1000 walkers.
SUMMARY
This paper has described the process by whichthe walker monitoring system in the Arthur Rangewas improved by implementing some simple andpractical changes in system coordination, datahandling and reporting. Another round of publicconsultation relating to management of walkers inthe Arthur Range will proceed in 2002, and it isanticipated that the improved quality of datapertaining to use of the range will assist inproviding better environmental and recreationaloutcomes.
ACKNOWLEDGEMENTS
• Maps are provided courtesy of LandInformation Services and Planning Section,

RUNDLE: MONITORING LOW VOLUME WALKER USE, ARTHUR RANGE: A CASE STUDYOF THE ARTHUR RANGE, TASMANIA, AUSTRALIA
58
Department of Primary Industries, Water andEnvironment.
REFERENCES
Watson Alan E, Cole David N, Turner David L, & ReynoldsPenny S. 2000. Wilderness recreation use estimation: ahandbook of methods and systems. Gen. Tech. Rep. RMRS-GTR-56. Ogden UT: US Department of Agriculture, ForestService, Rocky Mountain Research Station. 198p
Monitoring and Management of Visitor Flows in Recreational and Protected AreasConference Proceedings ed by A. Arnberger, C. Brandenburg, A. Muhar 2002, pages 59-64
59
Monitoring of Recreation-Affected Forest Stands in the National ParkLosiny Ostrov
Mark Shapochkin1, Vera Kiseleva2
1 Deputy Director, National Park Losiny Ostrov, Poperecnyi prosek 1a, Moscow, 107113Russia
2 Head of the Division for Research and Coordination, National Park Losiny Ostrov,Poperecnyi prosek 1a, Moscow, 107113 Russia
Email: [email protected]
Abstract: The effect of recreation on the forests of National Park Losiny Ostrov located withinthe boundaries of Moscow is examined. The methods of monitoring of recreation-affectedforest stands are represented, and the preliminary results of their application for the revealingof the most damaged forest areas are discussed. Some practical measures are suggested in orderto redistribute visitor flows across the territory of the most visited part of the national park.
INTRODUCTION
The monitoring and management of visitorflows are very urgent for the National Park LosinyOstrov. Being organised in 1983, the park inheritedhigh recreation loads, which have always existed inthe forest massif of Losiny Ostrov, as it issurrounded by dwelling and industrial regions. Thepopulation of adjacent districts of Moscow reaches2 mln people and that of Mytishchi, Korolev,Balashikha, and Shchelkovo (other cities ofMoscow conurbation) exceeds 500 000 people. Letus take into account that new dwelling regions willbe built in the peripheral part of Moscow and thenearest suburban areas. Therefore, the population ofthe regions bordering with the national park isexpected to increase, as well as the recreation loads.
The major goal of the national park is topreserve the natural forest and wetland ecosystemsunder the conditions of an intensive dailyrecreation. For this purpose, a very accuratemonitoring of the status of natural ecosystems isneeded in order to detect and prevent theirdegradation at initial stages.
CHARACTERISTIC OF THE TERRITORYOF THE NATIONAL PARK LOSINY
OSTROV
The National Park Losiny Ostrov occupies theterritory of 120 km2. This is a whole forest andwetland massif, dissected by the Moscow CircleHighway. Approximately 35 km2 of forests arelocated within the boundaries of Moscow itself. Theterritory of Losiny Ostrov is a slightly wavy plainwith an absolute altitude of 140-165 m above thesea level. It includes the chain of low moraine hills,the glaciofluvial terraces of the Yauza River, andthe floodplain itself. The soil cover is representedby loamy or sandy-loamy soddy-podzolic and gleysoddy-podzolic soils (Podzoluvisols and Gleyic
Podzoluvisols, according to FAO Classification);Yauza floodplain is occupied by eutrophic bog soils(Histosols). The forests represent the mostimportant recreational resources of the nationalpark. They are quite diverse: lime, pine, andindigenous spruce forests constitute 11, 17, and24% of the territory, respectively. A significant partof the national park (41%) is occupied by secondarybirch forests. Despite the neighbourhood of urbanareas, the natural complexes of the national park,especially of its central part, possess a highbiological diversity: the list of plants found at theterritory of Losiny Ostrov includes approximately600 species, that of birds, more than 150 species,and that of mammals, almost 40 species. It is thisrelative wilderness of nature, which attractsmultiple visitors.
RECREATIONAL SITUATION IN THENATIONAL PARK LOSINY OSTROV
The direct calculations of visitor flows weremade in 1990s by the students of Moscow StateUniversity. The observations demonstrated that inpeak days, up to 150 000 visitors could be present atthe territory of the national park simultaneously(Butorina & Chizhova, 1996). The researchers fromthe International Forest Institute (Moscow)calculated the recreation carrying capacity of theterritory and real recreational loads on differentfunctional zones. The calculations revealed the 5-6-fold exceeding of the carrying capacity, especiallyin the peripheral part of the national park (Project ofForest Management, 1998).
High visitor flows cause multiple negativeeffects on the ecosystems of Losiny Ostrov. Someof them are listed in Table 1.

SHAPOCHKIN, KIESELEVA: MONITORING OF RECREATION-AFFECTED FOREST STANDSIN THE NATIONAL PARK LOSINY OSTROV
60
Recreationactivities
Character Effect Ecological consequences
Visitor flowsalong roads andpaths
Linear Introduction of non-typical plant species alongroads; waste
Picnics Point Logging, emergence ofnew fireplacessurrounded by severelydisturbed areas
Formation of multiple hot spots of forestdegradation
Spontaneous out-of-path recreation
Spatial Emergence of multiplenew unmanaged paths
Soil compaction, disturbance of soil aerationand moisture regime, losses of organic matter,disturbance of soil vegetation cover,enfeeblement of trees, and degradation of anecosystem as a whole
Recreation + dogairing
Linear orspatial
Disturbance of wildbirds and animals
Reduction of the number of ground-nestingbirds and small mammals, concentration ofanimals in the central part of the national park
Table 1. Ecological issues of mass recreation in the NP Losiny Ostrov
In addition, disturbed ecosystems loose theiraesthetic properties, which enhances the advance ofvisitor flows towards the central undisturbed part ofthe national park. As a result, the area of recreation-affected natural ecosystems enlarges.
In order to regulate the visitor flows, severalstrategies are used in the national park.
Functional zonation based on recreationintensity (Figure 1). The central part of the parkforms the nature conservation zone where theaccess is allowed to a limited number of visitors(mainly, researchers). This zone is designated tomaintain the ecological stability and biologicaldiversity of the whole national park. The mostvisited peripheral part forms the recreational zone,which is designated for a short-term outdoor restand recreation. The belt between them is a bufferzone designated for regulated recreation andecological education. However, at present, thefunctional zonation should be revised, because thereal recreational situation does not correspond to theexisting boundaries of functional zones. Figure 1demonstrates that some areas of the natureconservation zone are at the same time the mostvisited ones.
Ecological education. Together with preventingthe violations of the regime of the national park, theecological education helps to reduce the effect ofthe most aggressive human activities, such aslogging, fires, mechanical damage to trees, pickingup rare plant species, etc. Another important aim ofecological education is to transform spontaneousvisitor flows into organised groups. The effect ofsuch groups on the nature of the national park canbe controlled. At present, the national park offers 11ecological excursions; the summary carryingcapacity of the ecological roots is ca. 50 000visitors annually (calculated according toKalikhman et al., 1999). However, their realcarrying capacity is limited by the number ofrangers and level of management.
Figure 1. The territory of the National park Losiny Ostrov:(1) urban areas, (2) nature conservation zone, (3) excursionzone, (4) recreational zone, (5) areas with the highestrecreational loads, (6) visit-centres, (7) major pedestrian roads,and (8) rivers and streams
Management of the recreational zone and,especially, roads and paths. It should increase therecreational carrying capacity of the elements of NPterritory: paths, sport and playgrounds, banks ofponds, etc. In addition, the attraction of visitors tosome well-managed areas should remove the visitorflows from those parts of forest ecosystems, wherehigh recreational loads are not desirable.Unfortunately, the recreation infrastructure inLosiny Ostrov is very primitive and the level ofservice is very low. For example, there are nospecial service areas in our functional zonation.
The prospective goals of the management of therecreational zone are: (a) the maintenance of thebiodiversity and (b) the formation of recreation-resistant forest stands. This envisages a detailedanalysis of the structure of forest fund, thedetermination of the most and least damagedecosystems, and the alternation of species and agestructure of the forests of the recreational zone. Forthis purpose, the visitor flows and their effect on theecosystems should be evaluated.
Although the direct calculation of visitor flowsis the most widespread method, we avoided using itin our monitoring studies. There are several reasonsfor that.

SHAPOCHKIN, KIESELEVA: MONITORING OF RECREATION-AFFECTED FOREST STANDSIN THE NATIONAL PARK LOSINY OSTROV
61
The territory of the national park is paledfragmentarily, so there are many uncontrolledentrances and paths.
Significant length of park boundaries withdwelling regions, which are the sources of visitorflows, demands a large number of accountingpersons, so the work becomes too expensive.
The intensity of visitor flows varies with season,day of week, period of the day, weather conditionsand many other factors. As a result, an almostcontinuous account is needed to get reliable results.
Direct calculations give an absolute number ofvisitors, but not the spatial distribution of recreationeffect. At the most, it characterises the recreationloads on basic linear elements, while in the NPLosiny Ostrov, the spontaneous out-of-roadrecreation causes the greatest damage to forestecosystems.
However, we do not underestimate the results ofdirect account. They can be used successfully insociological studies and planning of thedevelopment of recreational and touristinfrastructure, especially in the most visited sites.
METHODS OF COMPLEX MONITORING
The programme of monitoring of recreation-affected forest stands is a part of the generalcomplex programme of forest monitoring in the NPLosiny Ostrov. The latter is based on the resultsobtained at permanent observation sites(Shapochkin and Lameborshai, 2000). However, thepermanent observation sites are point objects and donot characterise the spatial distribution of negativefactors. The recreational monitoring was initiated inorder to detect the most damaged forest areas andelaborate the strategy of redistribution of visitorflows across the territory of the NP. The works arerather ecosystem-oriented than visitor-oriented,therefore, the status of forest ecosystems was thegeneral criterion of acceptable visitor flows.
The current research programme partly includesthe traditional methods of evaluation of recreationeffect, which were elaborated in the former USSRin 1970s (Mukhina, 1972; Chizhova and Smirnova,1976; Kazanskaya et al., 1977). However, themethods of complex monitoring of recreation-affected forest stands elaborated by M. S.Shapochkin are much wider.
According to this complex approach, themonitoring studies include three stages.
1. Selection of monitoring objectsThe unit of monitoring is the forest inventory
unit, i.e., a forest area with a homogeneous speciesand age composition of the tree layer, soil, andvegetation cover. In order to characterise thestudied territory in a representative way, the forestinventory units are selected in proportion to theshare of each species and age class in the wholeforest fund of the territory and distributed evenly
across the territory. Hence, a statistically reliablesampling is made. Each forest inventory unit ischaracterised by several circle test sites. Thenumber of test sites (from 3 to 10) is determined inaccordance with unit size and density of foreststands. Within a unit, the test sites are locatedregularly with the interval of 25-30 m in alatitudinal or longitudinal direction, depending onunit configuration.
2. Field observationsThe tree layer, which determines the properties
of a forest ecosystem, was characterised by treespecies, considering the ecosystem biologicalproductivity expressed via the basal cover of treesand wood storage.
From the centre of each test site, the trees areaccounted using standard forest survey devices(angle gauge or prism). A qualitative characteristicof sanitary status of each accounted tree is givenaccording to a 6-gradation scale. The followinggradations are set: 1 – healthy, 2 – weakened, 3 –strongly weakened, 4 – declining, 5 – dead-standingtrees of a current year, and 6 – dead-standing treesof previous years. The centremost trees are used formore detailed observations, the predominatingspecies being represented by 3 and accompanyingspecies, by 1 tree each. For these test trees, theheight and diameter are measured, and the samplesof timber are bored out in order to determine theradial increment during the last 10 and 20 years.The distance from the site centre to the three nearesttrees is determined in order to calculate the numberof trees per hectare, which characterises bothecosystem productivity and aesthetic properties.
The lower layers of forest communities werecharacterised by Dr. V. I. Obydennikov and hiscolleagues from Moscow Forest University. Theundergrowth, grass, and moss layers of studiedforest inventory units are described using the seriesof small observation plots. The status ofundergrowth is evaluated quantitatively via thenumber of young trees per unit area andqualitatively, via its viability. It is a very importantcharacteristic of ecosystem self-reproductioncapacity. For grass and moss layers, the number andabundance of species and projective cover aredetermined. The decrease in projective cover andincreased percentage of photophilous species andweeds determine the degree of recreation effect.
Sometimes, the visual determination of thecategory of tree sanitary status is not reliable. Inconnection with this, visual observations andmeasurements of tree increment were completed byanatomic analysis of wood tissues, which wereconducted by the Assistant Professor of MoscowForest University V. D. Lomov. The samples ofwood tissues of the trees of different species andsanitary status were collected at the circle test sited.The tissues of trees growing under optimalecological conditions were regarded as control

SHAPOCHKIN, KIESELEVA: MONITORING OF RECREATION-AFFECTED FOREST STANDSIN THE NATIONAL PARK LOSINY OSTROV
62
samples. Wood samples are conserved for furtherxylotomic studies. The series of characteristics isdetermined, such as the width of annual layer, widthof early and late wood, thickness of tracheidmembranes, their lifetime, etc.
The recreation effect on soils is characterised bysoil compaction and changes in somemorphological and chemical properties. Thecompaction is measured by a durometre andexpressed in kg/cm2. Soil compaction is measuredboth under tree canopy, where the vegetation coverlooks undisturbed, and at disturbed fragments ofsoil cover of a circle test site, such as paths, areasaround fires, etc. The measurements are made in 3-5 replicates. The percent of bare soil surface(without vegetation cover and forest litter) isevaluated and considered as an important indicatorof the degree of recreational digression(Kazanskaya, 1972). The thickness of forest litterand upper humuc horizon is measured, the latterbeing sampled. The content of moisture, organicmatter, and base cations, and soil acidity are thendetermined.
The series of field measurements should berepeated each 5 years. For the most visited andendangered sites, the frequency of observations canbe increased.
3. Data ProcessingThe data of field observations provide an
integral characteristic of studied forest inventoryunits. For each unit, the following values arecalculated:• basal cover of trees by species and categories
of sanitary status,• mean weighed category of sanitary status,
which is an integer indicator of unfavourableecological conditions,
• radial increment of test trees, which is thenrecalculated into the volume increment, and thelosses of volume increment with time aredetermined, and
• mean weighed percentage of bare soil and soilcompaction.
These calculated parameters make it possible toreveal the critical areas of forest stands. Thefollowing critical values are set (Table 2).
Measured and calculated values are mapped,and the indirect characteristic of spatial distributionof the effect of visitor flows is obtained.
The losses of volume increment and organicmatter are used to calculate the ecological damage,which is represented in financial equivalent per unitarea. For this purpose, the computer programmecreated in the All-Russian Research Institute ofForestry is used.
Parameter Unit ofmeasure
Critical value
Mean weighedcategory of sanitary
status
none 2.5
Losses of annualincrement
% Exceeding normalvalues by the factor of 2
and more
Percent of bare soil % of testsite area
25
Stage ofrecreationaldigression
none transition from stage 3to stage 4
Table 2. Critical values assessed for the characteristics ofrecreation-affected forest stands.
DISCUSSION OF PRELIMINARYMONITORING RESULTS
In 2001, the first stage of field observations wasconducted in the recreational and excursion zonesof the city part of the national park. Here, thesecondary birch forests constitute approximately60% of the forest fund. The rest is represented bypine and lime forests, spruce and oak formingfragmentary stands. Twenty-seven forest inventoryunits subjected to the recreational loads of differentintensity were studied. Nineteen of them arerepresented by secondary birch forests and 6, bypine forests of both natural and artificial origin. Theage of examined forest stands varies from 30 to 150years and the relative density of stands, from 0.3 to0.9. The species composition of the tree layer iseither simple or complex, the predominating speciesconstituting from 30 to 100% of the stand. Tocharacterise this sampling, 127 circle test sites and455 test trees were examined.
The mean weighed category of sanitary status ofstudied units varies from 1.5 to 3.0. For the majorityof units, this index is between 1.5 and 2.5, i.e., theyare referred to the category of weakened. Two units,located at the distance of ca. 1 km from theboundaries of the national park at the intersection oftwo roads, are classified as strongly weakened.Seven of the rest 25 units comprise the fragments ofstrongly weakened forest stands. These areas shouldbe considered in the first turn, when theredistribution of visitor flows is planned. Healthyforest stands with the category of 1.4 were observedonly at 3 separate test sites at the distance of morethan 1.5 km from the park boundary, and nocompletely healthy forest inventory units werefound. That is, healthy stands occupy only 2% ofthe studied area. This points to a general trendtowards the decline of forests in the city part of thenational park. Hence, a very accurate monitoring oftheir status is needed in order to prevent theirdegradation.
The vegetation cover and upper soil horizons ofmany test sites are damaged. On paths, the forest

SHAPOCHKIN, KIESELEVA: MONITORING OF RECREATION-AFFECTED FOREST STANDSIN THE NATIONAL PARK LOSINY OSTROV
63
litter is destroyed completely, the thickness of thehumus horizon is reduced by 25-50%, and the soilis compacted significantly. Bare soil surfaceconstitutes up to 15-20% of the area of some testsites. At the same time, 25% of test sites have anundisturbed soil cover. When the percent of baresoil surface exceeds 5%, the compaction of theupper soil horizons is observed. The mean weighedsoil compaction of disturbed forest units is 3-4kg/cm2, while normally, it constitutes 1-2 kg/cm2 inforest soils. Soil compaction on paths and aroundfires reaches 15-20 kg/cm2. The spatial distributionof the percentage of bare soil and soil compactiondemonstrates that the forest stands located within a1-kilometer belt along the boundaries with dwellingregions are the most affected by recreation (Figures2 and 3).
At present, no forest stands with the 4th degreeof recreational digression were found, i.e. allstudied ecosystems have a potential for self-regulation and reproduction. However, the area witha pre-critical 3rd stage of recreational digressiondemands an immediate improvement. It shouldinclude:• the reconstruction of path net in order to make
the existing paths more comfortable for visitorsand concentrate the major visitor flows alongthese managed roads,
• the creation of a dense artificial undergrowth,which will prevent the penetration of visitorsinto the forest massif and give refuge to birds,and
• the organisation of some new playgrounds orlawns to attract the visitors there.
Figure 2. The area of bare soil, in % of the area of forestinventory units: (1) below 1%, (2) 1-5%, (3) 5-10%, and (4) 10-25%. Here and on Figure 3, solid lines represent majorpedestrian roads
In addition, some corrections in GIS layers mustbe made. For example, the area with the highestrecreational loads must be enlarged, as compared tothat represented at Figure 1.
The preliminary analysis of the composition ofvegetation cover demonstrates that typical forestspecies predominate at the majority of test sites.
Figure 3. Soil compaction, kg/cm2: (1) 1.0-2.0, (2) 2.0-2.5,(3) 2.5-3.0, and (4) >3.0
Meadow flora and weeds appear only along roads,broad paths, boundaries of playgrounds etc.
The coefficients of correlation between theexamined characteristics were determined in orderto reveal their interrelation. The coefficients provedto be low, which points to a complex character ofinterrelation among the intensity of recreation andthe status of forest ecosystems. The highestcoefficient of correlation (equal to 0.38 at P = 0.90)was found between the sanitary status of foreststands and the area of damages soil and vegetationcover.
We expect that the equations of multipleregression will make it possible to reveal the mostimportant factors determining the status of foreststands, and probably, to reduce the number ofmeasured parameters.
CONCLUSIONS
The monitoring studies indicated theappropriateness of the complex monitoring methodsfor the evaluation of visitor flow effect on the forestecosystems of the National Park Losiny Ostrov.
The results obtained can be used for thecompilation of thematic maps and new layers ofgeoinformational systems, as well as for thecalculations of ecological damage.
The first stage of monitoring studies revealedthe areas where the forest stands are in a pre-criticalstatus, according to the category of sanitary statusof trees and percent of disturbed soil and vegetationcover. Immediate measures reducing the recreationpress must be undertaken in these areas, includingthe improvement of roads and passes, creation ofartificial undergrowth, and translocation of visitorflows to other areas.
The analysis of increment losses, anatomicfeatures of wood tissues, and soil chemicalproperties is expected to provide a more detailedinformation about the status of recreation-affectedforest stands. The statistical treatment of obtaineddata will help to determine the leading factors of

SHAPOCHKIN, KIESELEVA: MONITORING OF RECREATION-AFFECTED FOREST STANDSIN THE NATIONAL PARK LOSINY OSTROV
64
forest degradation and the interrelations among thecharacteristics of forest stands and recreation effect.
REFERENCES
Butorina , N.N., & Chizhova, V.P. (1996): Rekreatsionnoeispol’zovanie natsional’nogo parka “Losiny Ostrov”[Recreational Usage of the National Park Losiny Ostrov], inVestn. MGU, Ser. Geogr., No. 1.
Chizhova, V.P., & Smirnova, E.D. (1976): Slovo ob otdykhe.Problema rekreatsii i okhrany prirody [A Word AboutRecreation. Problems of Recreation and NatureConservation], Moscow, Znanie.
Kalikhman, A.D., Pedersen, A.D., Savenkova T.P., & SuknevA.Ya. (1999): Metodika “predelov dopustimykh izmenenii”na Baikale – uchastke Vsemirnogo Naslediya UNESCO[Limits of Acceptable Change Methodology at Lake Baikal– UNESCO World Heritage Site], Irkutsk.
Kazanskaya, N.S. (1972): Izuchenie rekreatsionnoi digressiiestestvennykh gruppirivok rastitel’nosti [Studies ofRecreational Digression of Natural Plant Communities], inIzvestiya Akad. Nauk SSSR, Ser. Geogr., Vol. 1.
Kazanskaya, N.S., Lanina, V.V., & Marfenin, N.N. (1977):Rekreatsionnye lesa [Recreational Forests], Moscow.
Mukhina, L.I. (1972): Printsipy i metody tekhnologicheskoyotsenki prirodnykh kompleksov [Principles and Methods ofTechnological Evaluation of Natural Complexes], Moscow,Nauka.
Proekt organizatsii i vedeniya lesnogo khozyaistva v NP “LosinyOstrov” [Project of Forest Management in the NP LosinyOstrov] (1998), Moscow.
Shapochkin, M.S., & Lameborshai, S.Kh. (2000): Postoyannyeprobnye ploshchadi v lesnykh nasazhdeniyakh NP “LosinyOstrov” – osnova informatsionnogo obespecheniya lesnogomonitoringa [Permanent Observation Sites in the ForestStands of NP Losiny Ostrov as the Informational Basis ofForest Monitoring], in Ekologiya bol’shogo goroda, Vol. 4,Moscow, Prima-Press-M.

Monitoring and Management of Visitor Flows in Recreational and Protected AreasConference Proceedings ed by A. Arnberger, C. Brandenburg, A. Muhar 2002, pages 65-67
65
Recreation Monitoring at the Dutch Forest Service
drs. Peter A.M. Visschedijk & ir. René J.H.G. Henkens
Alterra, PO Box 47, 6700 AA Wageningen, NetherlandsE-mail: [email protected]
www.alterra.nl
Abstract: In 1996 the former Institute for Forestry and Nature Research (now Alterra) started todevelop a system to monitor the recreational use of forests and other grounds owned by theDutch forest service. The aim was to determine the number of visitors, their activities and thepercepted quality. This information provides a valuable management tool for targeting ofresources. The system uses three methods to gather the information:1. Monitoring vehicle and bicycle use at the sites by using traffic counters with induction loopsinstalled in the road (all year round).2. Visual counting of visitors at all entrances (on 12 days during the year).3. Survey of visitors (on 12 days during the year).When the system is fully implemented their will be a network of 48 sites. All of these will bemonitored by using this method once in every 10 years, on average 5 sites a year.
INTRODUCTION
Management of nature parks need data about therecreational use of their areas in order to control anddirect the flow of visitors. Several sociologicalfounding studies were carried out by the formerInstitute for Forestry and Nature Research, nowAlterra (Visschedijk 1997a, Visschedijk 1997b)before the set up of a recreation monitoring system(Visschedijk 1998a). The number of visitors to asite, the recreational use as well as the quality of theexperience are monitored. It serves as a knowledgebase for the future.
METHODS
The study was carried out in several areasmanaged by the Dutch forest service across theNetherlands, among which Ugchelen-Hoenderloo.This area serves as an example for this paper (fig 1).
Appelscha-Smilde
Spijk-Bremerberg
Ugchelen-Hoenderloo
Middenduin
Fig 1. Location of monitored forests.
1. Monitoring vehicle and bicycle use at the sites byusing traffic counters with induction loops installedin the road (all year round).
The use of traffic counters enables one to gatherinformation about the number of passing vehiclesand bicycles all year round. The countersautomatically register the numbers and also provideother details such as date, time and speed. With thisinformation it is possible to see the variation in usethroughout the year.
2. Visual counting of visitors at all entrances (on 12days during the year).
Counting all the site-entrances visually isessential for determining the exact number ofvisitors. With traffic counters is it impossible tocover the complete site, only cars and bicycles canbe counted and you don't know how many peopleare for instance in the vehicles. In combination withthe figures from the traffic counters it is possible tocalculate the number of visitors during a certainperiod of time.
3. Survey of visitors (on 12 days during the year).With the visitor surveys information is gathered
among other things about activities, use of facilities,number of visits a year, place of residence, durationof visits and last but not least the percepted qualityof the site.
The quality-score is generated by asking thevisitors their opinion about 17 items concerningoutdoor recreation. First through 17 thesis aboutrecreation in general in which the visitors are askedabout the importance of the items (generalimportance), in the next question the same thesis areasked in connection with the visited site (verdict).

VISSCHEDIJK, HENKENS:RECREATION MONITORING AT THE DUTCH FOREST SERVICE
66
Then the questions are combined, the answers aboutthe site itself are weighted by the answer about thegeneral importance of a certain subject. Table 1shows the weightfactors.
General importanceVeryunimportant
Unimportant
Neutral
Important
Veryimportant
Very negative -1 -2 -4 -6 -8Negative 0 -1 -2 -3 -4Neutral 0 0 0 0 0Positive 0 1 2 3 4
Verdict
Very positive 1 2 4 6 8Table 1. Quality-scores
When an item is being considered as veryimportant by the visitor, then his verdict about theitem in the visited site can raise a score between -8and +8. However, when an item is qualified asunimportant then a score is between -2 and +2.When an item raises a total average score of morethan 1 the quality is qualified as being sufficient.
Since this system of monitoring is only carriedout in 48 sites, there was a need to get informationabout all the other grounds of the Dutch forestservice. Since counting is too expensive to be donein all sites, in the sites not covered by themonitoring network visitors are going to be given aquestionnaire which they can fill out and send backby mail. Through extrapolation we try to predict theunknown factor, the number of visitors.
SOME SELECTED RESULTS
Results of traffic countersThe trafficcounters give year-round information
about the number of cars and bicycles. With thisinformation the 10th busiest day is determined. The10th busiest day in Ugchelen-Hoenderloo was the25th of July. Figure 2 shows the division of vehiclesper day where every bar represents a day. The blackbars indicate the days where interviews were heldand visual counting took place.
230898200998
260798300898
90898190798
5079840898
260998250798230698
6089860998
13099850898
190898120898
20898220998210998240698
1108987079823099818089811099813079870898
1089825099828069830898
270998100798
80898110798
180798170998270798
290798200798100898220798240798220898
7099880998210798
10998140798
0,0 10,0 20,0 30,0 40,0 50,0 60,0 70,0 80,0 90,0 100,0
Dat
e
Index
Fig 2.Number of vehicles per day where the busiest day is set at100.
Results of visual countingThe number of visitors on the 10th busiest day
was 2,093. As the size of the area is 1,814 ha thismeans an average visitor intensity of 1,15 per ha.The amount of facilities for recreation depends onthis number. Figure 3 shows the number of visitorspresent in the area during the day.
Fig 3. Number of visitors present in Ugchelen-Hoenderloo atcertain period of time.
Results of interviewsThe quality score showed a score lower than 1
for the number of benches and the chance of seeingbirds and other animals (Fig. 4). This should beimproved by management.
-2
-1
0
1
2
3
4
5
Parkingspace Diversity openspace-
woodland
Few peoplearound
Varietypathtypes
Size of forest Number ofbenches
Birds and otheranimals visible
Acessibility
Item
Scor
e
Fig 4. Quality-scores of Ugchelen-Hoenderloo
CONCLUSIONS AND OUTLOOK
The recreation monitoring system proved to be avaluable management tool.
At the moment Alterra is improving its systemof: combination of monitoring and smaller onsitesurveys through extrapolation of results(Visschedijk 1998b).
Besides Alterra is working on a model whichpredicts the number of visitors to a site based upon:Number of different sites in an areaQuality of the siteQuality of the routes leading to a siteNumber of inhabitants in an area of approx. 25 km
around the site.

VISSCHEDIJK, HENKENS:RECREATION MONITORING AT THE DUTCH FOREST SERVICE
67
REFERENCES
English abstracts available on request.
Visschedijk, P.A.M. 1997a. Pilotstudie gegevensverzamelingrecreatief gebruik SBB-terreinen, IBN-DLO, Wageningen.
Visschedijk, P.A.M. 1997a. Recreatiekwaliteit bij hetStaatsbosbeheer, notitie ten behoeve van studiedag van deCCOR, IBN-DLO, Wageningen.
Visschedijk P.A.M. gegevensverzameling recreatief gebruikSBB-terreinen 1998a. Instituut voor Bos en Natuur-onderzoek IBN-rapport 404.
Visschedijk, P.A.M. 1998b. Extrapolatiemethodiekbasismonitoring recreatie, IBN-DLO rapport 385,Wageningen.
Monitoring and Management of Visitor Flows in Recreational and Protected AreasConference Proceedings ed by A. Arnberger, C. Brandenburg, A. Muhar 2002, pages 68-73
68
Visitor Management by Visitor Monitoring?Methodological Approach and Empirical Results from the Wadden Sea
National Park in Schleswig-Holstein
Christiane Gätje1, Andrea Möller2, Mathias Feige3
1National Park Office Schleswig-Holstein Wadden Sea, 25832 Tönning, Germany,[email protected]
2 dwif, 80331 München, Germany3dwif Büro Berlin,12105 Berlin, Germany
Abstract: Even today monitoring in most large nature reserves is mainly concerned withecological environmental observations. Socio-economical parameters and special parametersconcerned with tourism are rarely part of such programmes. This is not the case in theSchleswig-Holstein Wadden Sea National Park (SH-WSNP). During an extensive ecosystemresearch project the necessary basis for a better understanding of the structure and dynamics ofthe Wadden Sea was made. The local population and economy of the Wadden Sea region,especially tourism, played an important role in the project right from the start. The knowledgegained by the project was used as a basis for the revision of the national park law and in theconcept for an interstate monitoring programme for the Wadden Sea. The three modules of thesocio-economic monitoring (SEM): SEM-Regional, SEM-Trend and SEM-Poll document the,for Germany, unique and thus innovative character of this monitoring programme which isorientated towards comprehensive data collection and assessment. Extensive experience withdifferent methods and results of the quantitative and qualitative monitoring of visitors weregathered during a three year test phase. The possible use of the results for an optimisation ofthe management of visitor flow in and adjacent to the National park and for more targetedinformation and public relations work are discussed.
INTRODUCTION
Monitoring2 is a well established tool inprotected areas and the field of environmentalissues. It can be regarded as an integrated part ofnational park or nature reserve management and itis vital in order to control i.e. the efficiency ofmanagement measures or the ecological situationfor endangered species and biotopes. The necessityof monitoring these ecological aspects can not bedoubted. However, the dominating concept ofmonitoring seems to consider man solely as animpact factor and in a more or less negative way.With respect to the Wadden Sea, Kellermann et al.(1994) define monitoring as repeated measurementof „parameters which indicate the status of theWadden Sea and of each of its compartments (...)or activities or natural and anthropogenic inputswhich may affect the quality of the environment orthe effects of such activities“.
On the other hand in research models such asMan and Biosphere projects (Kerner et al. 1991) orecosystem approaches as in the Wadden Sea Region(Leuschner 1988, Stock et al. 1996) social and 2 A short definition is given by BAYFIELD (1997) „Monitoringis to record change“, whereas HELLAWELL (1991) describesmonitoring more detailed as „intermittent (regular or irregular)surveillance carried out in order to ascertain the extent ofcompliance with a predetermined standard or the degree ofdeviation from an expected norm“.
economic systems are an integrated part. Theydefine the relationship between man and nature withreciprocal action. Thus the consequences andeffects on the anthropogenic system deriving fromthe natural system or its protection are equallyregarded.
It is this theoretical and empirical concept ofreciprocal action which actually seems to meetpractical management needs. To achieve protectionof nature against the will of people and visitors hasproved futile in many cases, at least it demands asteadily growing effort with extensive measures forcontrolling and prosecuting prohibited actions andbehaviour. To monitor attitudes of visitors and thelocal population towards nature protection cantherefore be very useful. Last but not least it is alsoa legally and politically fixed goal for naturereserves and National parks to inform their visitorsand to enable a special kind of nature experience(IUCN3 1994). Visitor management in a broadersense of the word therefore is more than justguiding people and keeping them away fromsensitive areas. Besides control and managementmeasures it comprises nature education,information, guidance, even tourist packages. Arising need for non governmental funds andsponsoring puts forward the need to know moreabout the visitors, their expectations and 3 International Union for Conservation of Nature

GÄTJE ET AL.: VISITOR MANAGEMENT BY VISITOR MONITORING? METHODOLOGICAL APPROACHAND EMPIRICAL RESULTS FROM THE WADDEN SEA NATIONAL PARK IN SCHLESWIG-HOLSTEIN
69
willingness-to-pay. This sums up to a monitoringconcept which also supplies information foradvanced visitor marketing.
The case of the Schleswig-Holstein Wadden SeaNational Park (SH-WSNP) illustrates the longprocess of putting these experiences into a workingsocio-economic monitoring system (SEM).Although the original research concept (Leuschner1988) for the area was already based on a reciprocalapproach, it took 6 years of socio-economic basicresearch within the ecosystem research program andanother 6 years from presentation of a monitoringconcept (1993) to establish SEM in the NationalPark office in Tönning (Möller & Feil, 1997).Today it is the most comprehensive socio-economicmonitoring system that includes a continuous visitormonitoring in nature reserves and national parks inGermany.
THE SEM – CONCEPT: AN HOLISTICAPPROACH ON MONITORING THE
ANTHROPOGENIC SYSTEM RELATED TOTHE WADDEN SEA NATIONAL PARK
The SEM – ModulesSocio-economic monitoring performed in the
region of the SH-WSNP consists of three modules(figure 1):• A basic monitoring "SEM Regional" describes
the development of the regional population andeconomic structure;
• A second module "SEM Trend" focusses onquantitative and qualitative data about parkvisitors, e.g. numbers, visitor structure,publicity and valuation of national parkattractions, attitudes and motivations;
• "SEM Poll" provides information onknowledge, profile and acceptance of the
national park within the region itself andnationwide.
VISITOR MONITORING – STRUCTURE ANDEMPIRICAL INSTRUMENTS OF THE
MODULES SEM TREND AND SEM POLL
SEM Trend combines visitor counts, surveys ofvisitor structure and visitor polls using face-to-faceinterviews at 16 locations (figure 2 – map of studyarea) which serve as entrances to the national park.The geographical situation – the landward boarderof the national park stretches along about 450 km ofcoastline and island shores, principally accessible atany time - required the selection of a few typicalsites for the counts and opinion polls. Their numberis also limited by financial and work resources.Selection of locations followed two criteria:• Locations on islands, Halligen and at the
coastal mainland along the national parkboarder;
• hot spots of tourism, locations with moderatevisitor frequency and day trip destinations.
An important precondition was the presence ofnational park service ranger at the respective coastalsection, who simultaneously carried out the countsand interviews at the selected locations. Workerswere thoroughly and repeatedly trained to minimiseprobable bias caused by the interviewers.
SEM Poll uses the instrument of representative(computer-aided) telephone interviews with randomsampling. Co-operation with a neighbouringuniversity of applied sciences was established in thecase of the opinion polls of local residents. Anindependent market research institution wascharged to carry out the nation wide poll.
SEM Regional SEM Trend SEM PollWe trace the economicdevelopment and futureperspectives of the region inorder to foster sustainable use
We watch the development ofvisitor numbers, type andintensity of leisure activities aswell as expectations and travelmotives of park visitors
We are interested in opinions,wishes and criticism of peoplewho live in the national parkregion as well as of holidaymakers from all over Germany
Official statistics and data of• population• regional economic structure• labour market• environmental trends
Performance of• counts• visitor polls• extrapolation
Representative sampling of• local residents• German citizens
Fig. 1: Modules of socio-economic monitoring
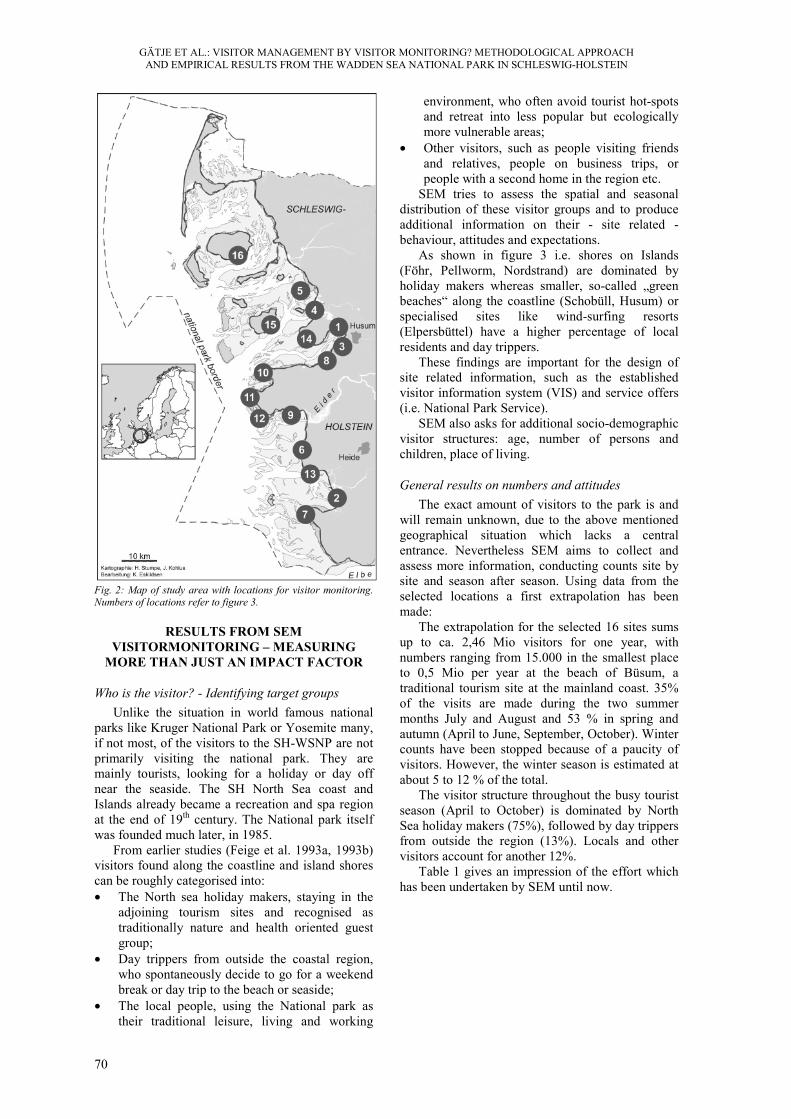
GÄTJE ET AL.: VISITOR MANAGEMENT BY VISITOR MONITORING? METHODOLOGICAL APPROACHAND EMPIRICAL RESULTS FROM THE WADDEN SEA NATIONAL PARK IN SCHLESWIG-HOLSTEIN
70
Fig. 2: Map of study area with locations for visitor monitoring.Numbers of locations refer to figure 3.
RESULTS FROM SEMVISITORMONITORING – MEASURING
MORE THAN JUST AN IMPACT FACTOR
Who is the visitor? - Identifying target groupsUnlike the situation in world famous national
parks like Kruger National Park or Yosemite many,if not most, of the visitors to the SH-WSNP are notprimarily visiting the national park. They aremainly tourists, looking for a holiday or day offnear the seaside. The SH North Sea coast andIslands already became a recreation and spa regionat the end of 19th century. The National park itselfwas founded much later, in 1985.
From earlier studies (Feige et al. 1993a, 1993b)visitors found along the coastline and island shorescan be roughly categorised into:• The North sea holiday makers, staying in the
adjoining tourism sites and recognised astraditionally nature and health oriented guestgroup;
• Day trippers from outside the coastal region,who spontaneously decide to go for a weekendbreak or day trip to the beach or seaside;
• The local people, using the National park astheir traditional leisure, living and working
environment, who often avoid tourist hot-spotsand retreat into less popular but ecologicallymore vulnerable areas;
• Other visitors, such as people visiting friendsand relatives, people on business trips, orpeople with a second home in the region etc.
SEM tries to assess the spatial and seasonaldistribution of these visitor groups and to produceadditional information on their - site related -behaviour, attitudes and expectations.
As shown in figure 3 i.e. shores on Islands(Föhr, Pellworm, Nordstrand) are dominated byholiday makers whereas smaller, so-called „greenbeaches“ along the coastline (Schobüll, Husum) orspecialised sites like wind-surfing resorts(Elpersbüttel) have a higher percentage of localresidents and day trippers.
These findings are important for the design ofsite related information, such as the establishedvisitor information system (VIS) and service offers(i.e. National Park Service).
SEM also asks for additional socio-demographicvisitor structures: age, number of persons andchildren, place of living.
General results on numbers and attitudesThe exact amount of visitors to the park is and
will remain unknown, due to the above mentionedgeographical situation which lacks a centralentrance. Nevertheless SEM aims to collect andassess more information, conducting counts site bysite and season after season. Using data from theselected locations a first extrapolation has beenmade:
The extrapolation for the selected 16 sites sumsup to ca. 2,46 Mio visitors for one year, withnumbers ranging from 15.000 in the smallest placeto 0,5 Mio per year at the beach of Büsum, atraditional tourism site at the mainland coast. 35%of the visits are made during the two summermonths July and August and 53 % in spring andautumn (April to June, September, October). Wintercounts have been stopped because of a paucity ofvisitors. However, the winter season is estimated atabout 5 to 12 % of the total.
The visitor structure throughout the busy touristseason (April to October) is dominated by NorthSea holiday makers (75%), followed by day trippersfrom outside the region (13%). Locals and othervisitors account for another 12%.
Table 1 gives an impression of the effort whichhas been undertaken by SEM until now.

GÄTJE ET AL.: VISITOR MANAGEMENT BY VISITOR MONITORING? METHODOLOGICAL APPROACHAND EMPIRICAL RESULTS FROM THE WADDEN SEA NATIONAL PARK IN SCHLESWIG-HOLSTEIN
71
1999 2000 2001 Total
Number of visitors counted1) 42.803 27.489 49.492 119.784
Registered visitor structure2)4.089 3.264 5.167 12.520
Number of visitors interviewed3) 572 670 1.019 2.261
Number of work days4) 84 116 112 3121)Counts without interview2)Short questionnaires, only visitor type, age, number of persons and children3)Interviews on attitudes, knowledge and expectations4)Appointed personnel x days of counting/interviewing
Table 1: SEM Trend effort from 1999-2001
9393
8288
807877
7068
6360
555251
4335
4
3
53
6
36
6
118
111116
1213
222023
1217
1713
12
2
3
2
2
33
14
125
7
2533
3
1510
17
44
302131
0% 20% 40% 60% 80% 100%
Föhr (16)
Pellworm (15)
Nordstrand (14)
Büsum (13)
St. Peter Badbrücke (12)
St. Peter Köhlbrand (11)
Westerhever (10)
Vollerwiek (9)
Simonsberg (8)
Friedrichskoog (7)
Hedwigenkoog (6)
Hamburger Hallig (5)
Lüttmoorsiel (4)
Husum Dockkoog (3)
Elpersbüttel (2)
Schobüll (1)
(North Sea Islands)
important traditional SHNorth Sea holiday destinations
small traditional SHNorth Sea holiday destinations
day visitor destinations
North Seaholiday makers
holiday makers from other regions(day trippers)
residents from other regions(day trippers)
localresidents
othervisitors
Fig. 3: Visitor structure at 16 locations at the Schleswig-Holstein Wadden Sea National Park in 2000 and 2001. Numbers of locationsrefer to figure 2
Change in visitor structures by managementmeasures – A-priori and ex-post analysis(Hamburger Hallig)
The Hamburger Hallig is a small island withinthe national park territory with a causeway to themainland. It could also easily be reached by caruntil 1996 when, after intensive negotiations, a toll-bar combined with an entrance fee was established.The national park office, in consensus with theadjoining community, who rejected a strict ban oncars, aimed to cut down car numbers in this way.
Counts of cars and visitors impressivelyillustrate the effects of this management measure:The number of registered car crossings to the Halligdeclined by one third between 1997 and 2000 (seefigure 4). Counts which also regarded the modalsplit show that in 1990 ca. 86% of the visitors cameby car. In the year 2000 visitors by car onlyrepresent 26% of the total. The bicycle has nowbecome the most important transport vehicle (48%in 2000, 6% in 1990).
0
2.000
4.000
6.000
8.000
10.000
12.000
14.000
1997 1998 1999 2000
num
ber o
f cro
ssin
gs b
y ca
r
Figure 4: Numbers of registered car crossings at HamburgerHallig 1997-2000
QUO VADIS?CONCLUSIONS AND PERSPECTIVES
Three years of continuous visitor monitoringhave improved the knowledge on visitors to thenational park and have built a solid basis ofinformation. Monitoring is not an end in itself, but

GÄTJE ET AL.: VISITOR MANAGEMENT BY VISITOR MONITORING? METHODOLOGICAL APPROACHAND EMPIRICAL RESULTS FROM THE WADDEN SEA NATIONAL PARK IN SCHLESWIG-HOLSTEIN
72
is designed to provide benefits. Three characteristicsteps mark the process of building up a qualifiedSEM in its way from visitor monitoring to visitormarketing (figure 5):
Step 1: Visitor MonitoringStep 1 comprises the construction of an
empirical and methodological framework withselection of locations for counting and interviewingas well as designing the sample, consideringespecially seasonal aspects. Because of the variety,number and different attractiveness of beaches,sites, harbours etc. This became quite a challenge incase of the SH-WSNP. This methodological stepmight prove much easier in other areas withdifferent preconditions.
Developing a standardised procedure forextrapolation of visitor numbers was a second task,which has to be continuously improved upon.Supplementary opinion polls of the regionalpopulation as well as representative polls servedadditional qualitative information on acceptance ofthe SH-WSNP, interest and behaviour concerningnature protection, the knowledge of its existenceand its potential for visitors.
Another future gain may be the multiple use ofmarket research instruments and data by differentregional stakeholders. The communities andtourism organisations are equally interested intourism data as is the national park office. The
linking-up and exchange of instruments andinformation will stimulate co-operation, synergeticeffects will result in more effective application offunds.
Step 2: Visitor ManagementStep 2 is made up of two parts. First of all
processing the collected information into visitorprofiles. This aims at identifying specific types ofattitudes and behaviour through socio-demographicand other attributes. These are useful for designingcustomer-oriented products, information andservices. SEM will, therefore, be able to provideuseful information for the improvement of thealready existing visitor information system (VIS).
Secondly we need analysis and a betterunderstanding of interrelations andinterdependencies. Up to now, we have only littlecomprehension of how i.e. weather conditionsmight influence visitor numbers and structures incertain sites and seasons. Successful visitormarketing requires a deepening of knowledgeconcerning influencing factors and their reciprocalrelationships. Especially interesting are the opinionson information offers and nature experience bydifferent types of visitors at varying sites. Detailedmarket research has to be conducted. With a specialkind of „Hot spot“-monitoring we also learn aboutconflicts and their implications for visitors.
The „Triple- VM“- Circle: From Visitor- Monitoringvia Visitor-Management to Visitor-Marketing
Target Group OrientedNational Park Marketing
Infrastructure Events Packages,Trips, Offers
Modular SEM- Concept
SEM-Regional
SEM Trend SEM Poll
Identification of Visitor Profiles
• Socio- demographic factors• Behaviour• Attitudes
Identification of Impacts forLocation Development, e.g.• Weather• Attactiveness of Leisure Facilities• Attactiveness of offers to experience nature
+
Visitor InformationSystem (VIS)
Hot SpotManagement (HSM)
Evaluation Basic Knowledge
Professionalization
Visitor-Marketing
Visitor-Monitoring
Visitor-Management
Figure 5: The "Triple-VM"-Circle: Three characteristic steps within the process of building up a qualified socio-economic monitoring(concept: M. Feige)

GÄTJE ET AL.: VISITOR MANAGEMENT BY VISITOR MONITORING? METHODOLOGICAL APPROACHAND EMPIRICAL RESULTS FROM THE WADDEN SEA NATIONAL PARK IN SCHLESWIG-HOLSTEIN
73
Step 3: Visitor MarketingSumming up all information and findings SEM
aims at a proactive and integrated visitor marketing.Of course there has always been some sort of visitormarketing. Nevertheless, it needs to become moreand more orientated toward the specific needs andattitudes of various types of visitors (sun and beach,bird watchers, families, senior travellers, singles,technical visits etc.). SEM helps to offer them anattractive SH-WSNP experience, simultaneouslysafeguarding nature protection needs and respectingregulations.
REFERENCES
Bayfield, N. (1997): Approaches to Monitoring for NatureConservation in Scotland. – In: Umweltbundesamt (FederalEnvironment Agency – Austria) (Ed.): Monitoring forNature Conservation.- Wien (Umweltbundesamt), p. 23-27.
Feige, M. Maschke, J., Möller, A. (1993a): Konzept zurNeuregelung der Strandbefahrung in St. Peter-Ording,Concept, München
Feige, M. Maschke, J., Möller, A. (1993b): Fremdenverkehrs-lenkungs- und Entwicklungsplan Hamburger Hallig,Concept, München
Hellawell, J.M. (1991): Development of a rationale formonitoring.- In: Goldsmith, F.B. (Ed.): Monitoring forConservation and Ecology.- London, New York, Tokyo,Melbourne, Madras. Chapman and Hall, p. 1-14.
IUCN (1994): Richtlinien für Management –Kategorien vonSchutzgebieten. – Nationalparkkommission mitUnterstützung des WMMC, IUCN, Gland, Schweiz undCambridge, Großbritannien, FÖNAD, Grafenau, 23 p.
Kellermann, A., Laursen, K., Riethmüller, R. Sandbeck, P.,Uyterlinde, R. & Wetering, V.D. (1994) Concepts for atrilateral Integrated Monitoring Program in the WaddenSea.- Ophelia Suppl. 6: 57-68.
Kerner, H.F., Spandau, L. & Köppel, J.G. (eds.) (1991):Methoden zur Angewandten Ökosystemforschungentwickelt im MAB-Projekt 6 "ÖkosystemforschungBerchtesgaden 1981-1991.- Abschlußbericht, MAB-Mitteilungen 35.1 und 35.2, Freising-Weihenstephan.
Leuschner, C. (1988): Ökosystemforschung Wattenmeer –Hauptphase Teil 1, Erarbeitung der Konzeption sowie derOrganisation des Gesamtvorhabens (Forschungsverbund).-UFO-Plan Forschungsbericht im Auftrag desUmweltbundesamtes und des Landesamtes für denNationalpark Schleswig-Holsteinisches Wattenmeer
Möller, A. & Feil, T. (1997): Konzept SozioökonomischesMonitoring im Nationalpark Schleswig-HolsteinischesWattenmeer, Report, München/Berlin
Stock, M., Schrey, E., Kellermann, A., Gätje, C., Eskildsen, K.,Feige, M., Fischer,. G., Hartmann, F., Knoke, V., Möller, A.Ruth, M., Thiessen, A. & R. Vorberg (1996):Ökosystemforschung Wattenmeer – Synthesebericht:Grundlagen für einen Nationalparkplan. - Schriftenreihe desNationalparks Schleswig-Holsteinisches Wattenmeer 8: 784pp.