methods for structural characterisation of quillaja...
TRANSCRIPT

Methods for Structural Characterisation of Quillaja Saponins
by Electrospray Ionisation Ion Trap Multiple-Stage Mass Spectrometry
Johan Bankefors Faculty of Natural Resources and Agricultural Sciences
Department of Chemistry Uppsala
Doctoral Thesis Swedish University of Agricultural Sciences
Uppsala 2008

Acta Universitatis agriculturae Sueciae
2008: 44
ISSN 1652-6880 ISBN 978-91-85913-77-0 © 2008 Johan Bankefors, Uppsala Tryck: SLU Service/Repro, Uppsala/Alnarp 2008

Abstract
Bankefors, J., 2008. Methods for structural characterisation of Quillaja saponins by electrospray ionisation ion trap multiple-stage mass spectrometry. Doctor’s dissertation. ISSN 1652-6880, ISBN 978-91-85913-77-0. This thesis describes methods for structural classification of Quillaja saponins based on high performance liquid chromatography hyphenated electrospray ionisation ion trap multiple-stage mass spectrometry, in combination with multivariate analysis. Quillaja saponins from the chromatographic fractions QH-A, QH-B, and QH-C as well as crude bark extract have been investigated. MS1-MS3 spectra in positive ion mode were analysed by multivariate methods such as PCA and PLS-DA. Fragmentation of saponins generally results in loss of fragments from the precursor ion. The essential part of the reported method is the referencing of mass spectral data that allows for comparison of structural features between saponin components based on multiple stage mass spectra. Peaks in the referenced spectra obtain a correlation to loss of common structural elements. The multivariate methods captured the variance corresponding to the common structural elements. Thus, the obtained models have the ability to predict new structures that share the common structural elements. In total 12 new saponin structures have been proposed based on ESI-IT-MSn measurements. In these investigations the reported multivariate method was helpful since the generated structural predictions solved either the full saponin structure or parts of it. The reported multivariate method is in compliance to HPLC on-line coupled MSn data and thus provides a rapid method for screening of saponins in either biologic or chromatographic fractions. Further, a chromatographic method suitable for metabolic fingerprinting of saponins is reported. Keywords: electrospray ionization ion trap multiple-stage mass spectrometry, Quillaja saponins, oligosaccharide sequencing, structural determination, PCA, PLS-DA. Authors address: Johan Bankefors, Department of Chemistry, SLU, PO Box 7015, SE-750 07 Uppsala, Sweden. E-mail: [email protected]

Flugfiske är inte enbart en sport, det är en konstart, en där skarp blick och koordination är nödvändiga. Flugfiskarens målarduk är vattnet, hans kritiker är fisken och hans belöning är i högsta grad gripbar.
-Stephen Windsor.

Table of Contents
General introduction ..........................................................................................9
Saponins............................................................................................................9 The saponin molecular structure ......................................................................9 Saponins used as adjuvants with vaccines......................................................10 Quillaja saponaria Molina saponins ..............................................................13 Structural elucidation of Quillaja saponins by ESI-IT-MSn ...........................16
Topic of this thesis ............................................................................................19
Applied analytical techniques ..........................................................................19
Introduction to mass spectrometry; sample detection ....................................19 Introduction to chemometrics .........................................................................24 Chromatography.............................................................................................29
Classification of saponins, proof of concept (Paper I) ...................................31
Differentiation of apiose from xylose as R4-substituent..................................35
Application of concept to new structural features (Paper II) .......................37
Structural classification of new saponin structures........................................39
Metabolic fingerprinting of Quillaja saponins in bark extract, Paper III ...42
Profiling new saponins by LC-MSn spectral data, Paper IV ........................46
Elucidation of new saponin components ........................................................48
Conclusions........................................................................................................51
Outlook ..............................................................................................................51
REFERENCES .................................................................................................53
Acknowledgements ...........................................................................................58

Appendix
Papers I-IV This thesis is based on the following papers, which will be referred to by their Roman numerals: I. “Structural classification of Quillaja saponins by electrospray ionization
ion trap multiple-stage mass spectrometry in combination with multivariate analysis”
Johan Bankefors, Lars I. Nord, Lennart Kenne. Published in Chemometrics and intelligent laboratory systems
II. “Structural classification of fatty acyl substituted Quillaja saponins by electrospray ionization ion trap multiple-stage mass spectrometry in combination with multivariate analysis”
Johan Bankefors, Lars I. Nord, Lennart Kenne. Submitted manuscript, Rapid communications mass spectrometry.
III. “Metabolic fingerprinting of Quillaja saponaria Molina saponins
obtained from a bark extract studied by high-performance liquid chromatography - mass spectrometry”
Johan Bankefors, Lars I. Nord, Lennart Kenne. In manuscript form.
IV. “Profiling of Quillaja saponaria Molina saponins by electrospray
ionization ion trap multiple-stage mass spectrometry and multivariate analysis”
Johan Bankefors, Lars I. Nord, Lennart Kenne. In manuscript form. Reprints were made with permission from the publishers

Abbreviations
1H Proton Ac Acetyl Api Apiose Ara Arabinose CCD Central composite design CID Collision-induced dissociation Di Discriminatory power Da Dalton DOE Design of experiment Fa Fatty acyl ESI Electrospray ionisation Fuc Fucose Gal Galactose GC Gas chromatography Glc Glucose GlcA Glucuronic acid ISCOM Immunonstimulating complex IT Ion trap LOO-CV Leave-one-out cross-validation LV Latent variable MALDI Matrix assisted laser desorption/ionisation TOF Time of flight Mi Modelling power MS Mass spectrometry MSn Multiple-stage mass spectrometry m/z Mass-to-charge-ratio NMR Nuclear magnetic resonance PC Principal component PCA Principal component analysis PLS Partial least squares projections to latent structures PLS-DA Partial least squares projections to latent structures-
discriminant analysis PRESS Predicted residual error sum of squares Q2
cv Squared correlation coefficient for cross-validation Q2
test-set Squared correlation coefficient for test-set predictions R2 Squared correlation coefficient for calibration-set fitting Rha Rhamnose RP-HPLC Reversed phase high performance liquid chromatography Spooled Pooled estimate of standard deviation SIMCA Soft independent modelling of class analogy SNV Standard normal variate correction UV Ultra violet Xyl Xylose

General introduction
Saponins Saponins, which derive their name from their ability to form stable, soap like foams in aqueous solution, are one of the largest groups of naturally occurring glycosides. They are mainly found in plant species but also in some lower marine animals [1]. Saponins are characterised by their rather complex molecular structure in which water-soluble (hydrophilic) sugars are attached to a lipid-soluble triterpene or steroid triterpene. This amphiphilic nature of a hydrophobic and hydrophilic part provides a series of physicochemical properties, such as wetting, emulsifying and foaming properties as well as being surface active as detergent. Due to these properties saponins have been used in manufacture of a large number of daily products such as toothpaste, shampoos and cosmetics. Saponins are present in many foods and have shown beneficial effects in humans [2]. Furthermore, saponins from Yucca (Yucca schidigera Roezl) and Quillaja (Quillaja saponaria Molina) are approved for use as additives in food and drinks by FDA (US Food an Drug Administration) [3]. Interest in these compounds has increased significantly during the last couple of decades because of their wide range of biological and pharmacological activities [1, 4-6]. They are main constituents of many plant derived drugs and traditional medicines. Saponins are said to make up the active major constituents of many well known plants such as yucca or ginseng. Some pharmacological properties they are considered responsible for are anti-inflammatory, anti-tumor, anti-viral and anti-fungal [4]. Although the overall number of reported saponin structures is very large many lack any significant pharmacological properties. The saponin molecular structure The saponin structure is composed of building blocks with monomers (sugars) attached to a non-sugar triterpene, and this construction results in a vast variety of structures combined of similar units. The common structure for all saponins consists of a non-sugar triterpene coupled to sugar chain units. These can be attached as one (monodesmosidic), two (bidesmosidic) or three (tridesmosidic) sugar chains which can be linear or branched. Typically, the sugar chain is a branched 2-5 monosaccharide residue but as long as 11 units has been reported [1]. Furthermore, the sugars can be acylated. The triterpene or non-saccharide part of the molecule is called the genin or sapogenin. Depending on structural features the sapogenin can be divided into two main classes; steroid or triterpene. The steroid triterpene consists of a 27 carbon skeleton whereas the triterpene triterpene consists of a 30 carbon skeleton. The number of functional groups on the triterpene backbone such as aldehyde, metyl, hydroxyl and carboxyl groups amongst others results in a very diverse group of compounds.
9

It is well recognised that plants usually possess a number of individual saponin structures -i.e., different plant species have their individual set of saponins, which can also vary depending on the part of plant studied. The possibility that saponin compounds from one plant contain similar and dissimilar structural elements creates a diversity of structures with a wide range of polarities making determination of individual saponin components very difficult. Saponins used as adjuvants with vaccines A field that has been growing rapidly during the last two decades is the use of saponins in vaccine applications. Vaccination is a means of creating an immunological memory. This memory is induced by an antigen, a term invented due to the ability of these compounds to cause antibody responses to be generated. An antigen is defined as any foreign agent capable of binding specifically to components of the immune response. If the antigen is immunogenic (able to trigger a response from the immune system) exposure will lead to a primary response from the immune system, creating a memory in terms of an increased number of long-lived lymphocytes with specific antigen receptors. A second exposure to the same antigen results in a secondary response. The most important difference between primary and secondary response is the much quicker onset and magnitude of the response from the immune system to a second exposure. Usually the best effect of a vaccine is reached by injection of inactivated or live attenuated viruses or bacteria. An alternative approach is to use a purified sub unit antigen, typically a protein or polysaccharide from a virus or bacteria that is recognised by the immune system as immunogenic. The latter approach is considered to be safer but usually induces less immune response. Therefore, adjuvants can be used to invoke for this loss of response. Adjuvants An adjuvant is an agent that stimulates the immune system and increases the response to a vaccine. Among the saponin containing plants the South American tree Quillaja saponaria Molina has shown the most promising adjuvant activities. Triterpene saponins extracted from the bark of the Quillaja saponaria Molina tree have long been used as adjuvants for veterinary vaccines [7, 8]. In most investigations crude preparations of Quillaja saponins have been added as adjuvants to increase the immune responses to a variety of antigens[8-10]. In addition, Quil A, a mixture of partially purified saponins from Q. saponaria, has been used as an adjuvant for several protein antigens, either alone [11] or associated with hydrophobic antigens and lipids in form of complexes termed ISCOMS (Immunostimulating complexes)[12-14]. ISCOMS are composed of antigen, cholesterol, phospholipids and saponins. Investigations of ISCOMS containing different chromatographic fractions (subgroups) of Quil A have shown different immuno-modulating activities and toxicities [15].
10

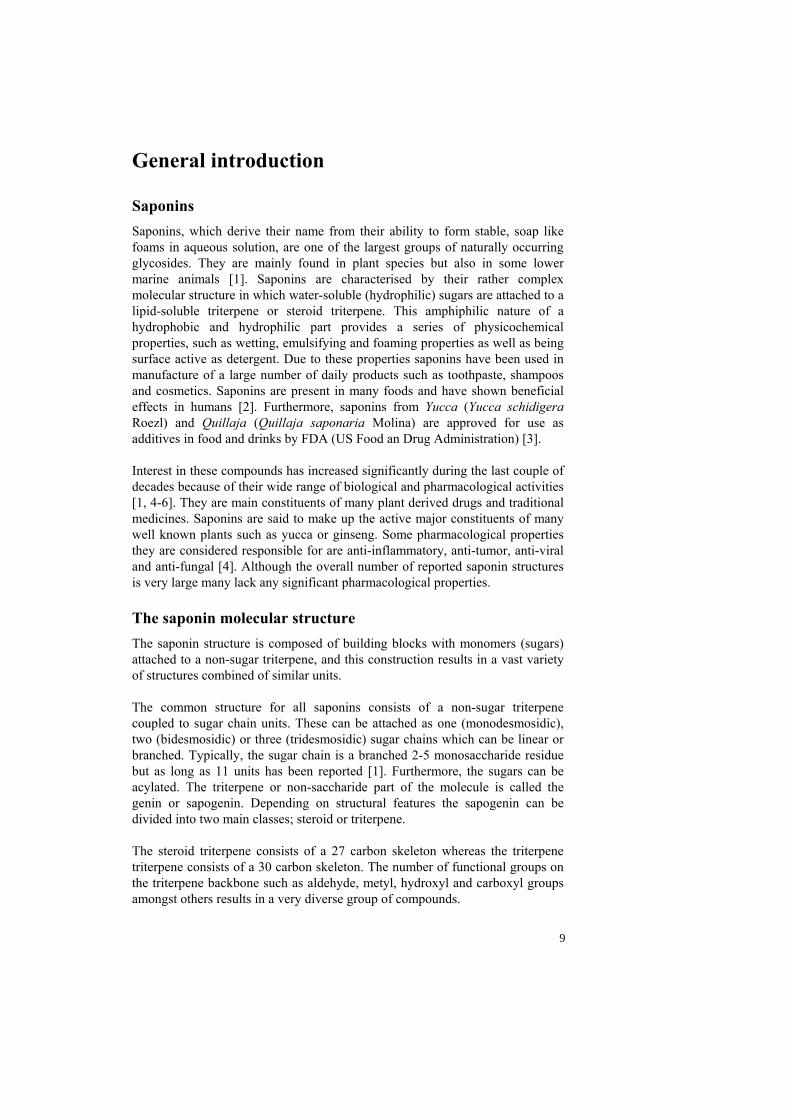
Rönnberg et al. separated Quil A using RP-HPLC and recovered three fractions which were designated QH-A, QH-B and QH-C due to their chromatographic order of elution. The toxicity and immunoenhancing capacity of the obtained fractions was tested in ISCOM matrix form (ISCOMS without the antigen) and QH-B was found to have a slightly higher immunoenhancing capacity but also a much higher toxicity compared to QH-C that showed considerable immunoenhancing capacity and a low toxicity. QH-A on the other hand induced a low antibody response but was in addition the least toxic fraction. In the following development of ISCOMS a mixture of QH-A and QH-C was tested. However, it is still hard to point out the exact structural features responsible for the toxic activity in these fractions since they still contain many saponin structures not yet investigated. A liquid chromatography hyphenated mass spectrometry ion map visualising sodium adducts of the molecules [M+Na]+ obtained in positive ion mode (Fig. 1) of the chromatographic fractions QH-B and QH-C reveal a large number of [M+Na]+ ions corresponding to potential saponin components.
11
Figure 1. LC/MS1 ion map of the chromatographic fractions QH-B and QH-C measured in positive ion mode. Each spot corresponds to the [M+Na]+ ion. In the two plots major compounds are visualised and the corresponding structures are listed in Fig. 3 It has been concluded that the structure is of importance to biological properties such as toxicity[16]. To obtain saponin fractions of Quillaja saponins that are less toxic but still potent it is of interest to study the composition of saponins and develop tools for separating and determining their structures. To decrease the toxicity Daalsgard et. al. [17] proposed the use of young plants less than 15 years old since these extracts were found to be less heterogeneous. Thus, by investigations of the metabolomics, concerning saponins, of the tree Quillaja saponaria Molina these processes may be better understood and the biological activity between different saponin structures investigated. Up till today, ISCOMS have shown to induce an antibody and cellular immune response in animals [9, 18] and show promising results for being developed into an effective human vaccine [16, 19].
12

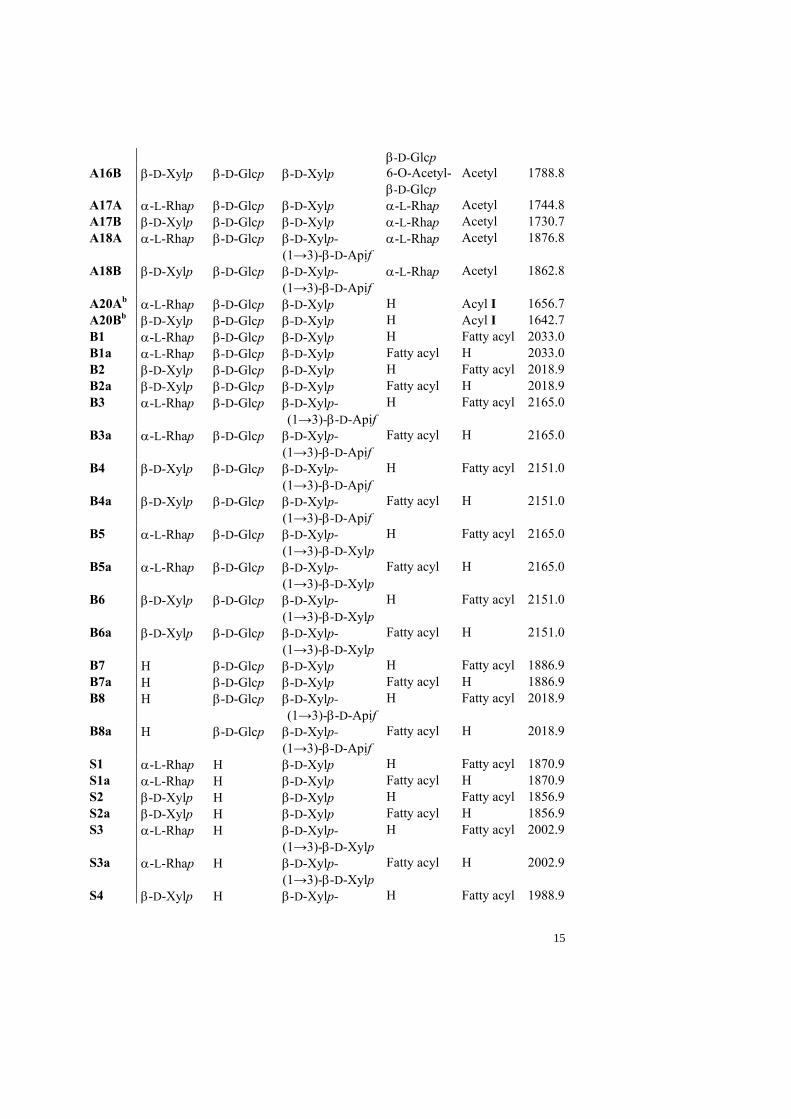
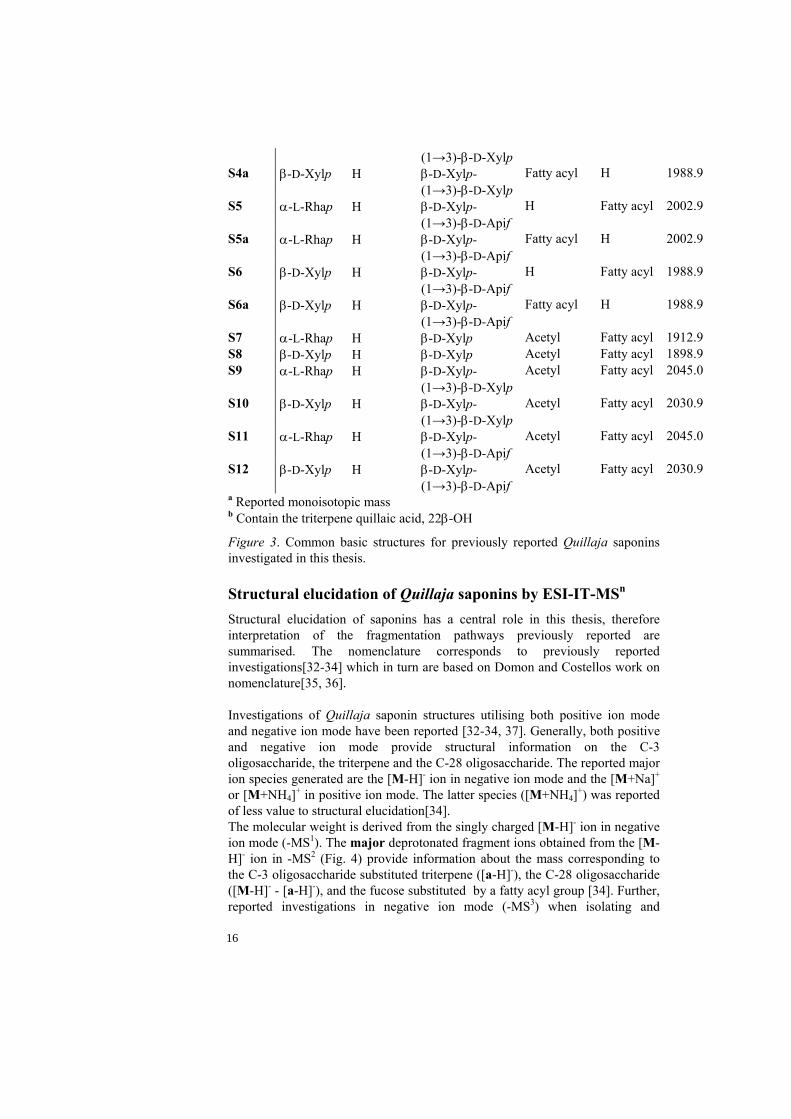
Quillaja saponaria Molina saponins The bark of Quillaja saponaria Molina has shown to contain the most potent adjuvants of several investigated plants[20]. The saponin content is about 5% by weight which makes it one of the richest natural sources of saponins available. The most common triterpenoid saponins from the bark of Quillaja saponaria Molina are those containing the quillaic acid aglycone (Fig. 2), however five other triterpene structures have also been reported which are 22β-hydroxyquillaic acid, gypsogenin, phytolaccagenic acid, echinocystic acid and 23-O-acetyl phytolaccagenic acid [21-25]
Triterpene R1 R2 R3 R4 Massa
Quillaic acid CHO OH H CH3 486 Gypsogenin CHO H H CH3 470 Phytolaccagenic acid CH2OH H H COOCH
3 516
Quillaic acid, 22β-OH CHO OH OH
CH3 502
Echinocystic acid CH3 OH H CH3 472 23-O-Ac Phytolaccagenic acid OCOCH
3 H H COOCH
3 558
a Monoisotopic molecular mass (Da)
Figure 2. Reported triterpenes from Quillaja saponaria Molina. The numbering of carbon atoms is given. The reported saponins[21, 22, 26-31] investigated in this thesis (Fig. 3) that origin from Quillaja saponaria Molina are bidesomsides ( the triterpene is substituted by two sugar chain units) with a C-3 di- or tri-saccharide and a C-28 oligosaccharide. The common structure of the C-3 oligosaccharide is either one of the branched trisaccharides β-D-Galp-(1→2)-[β-D-Xylp-(1→3)]-β-D-GlcpA, or β-D-Galp-(1→2)-[ α−L-Rhap]-β-D-GlcpA, or the disaccharide β-D-Galp-(1→2)- β-D-GlcpA. Most of the Quillaja saponins reported so far are a pair which consists of an identical triterpene and C-28 oligosaccharide structure but the C-3 oligosaccharide contains either Rhap or Xylp. The common structure of the C-28 substituted oligosaccharide of reported saponins consists of the
13
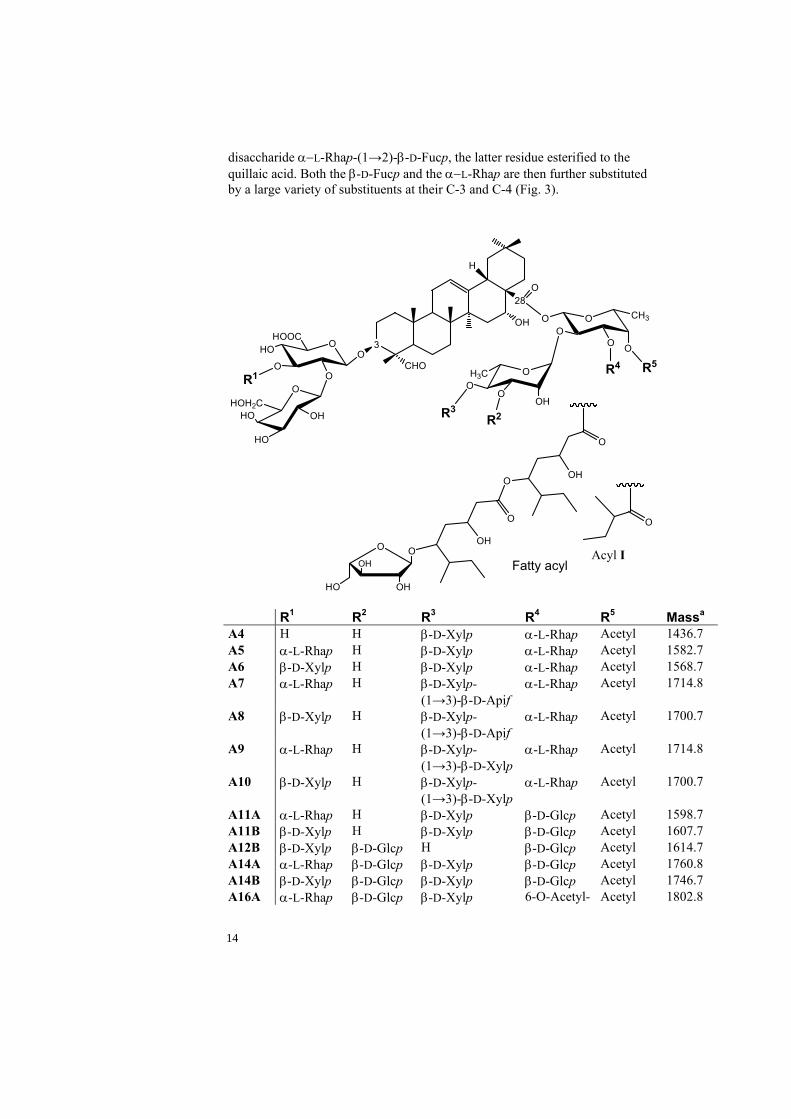
disaccharide α−L-Rhap-(1→2)-β-D-Fucp, the latter residue esterified to the quillaic acid. Both the β-D-Fucp and the α−L-Rhap are then further substituted by a large variety of substituents at their C-3 and C-4 (Fig. 3).
3O
H
28
OH
CHO
O
OHOOC
HO
OO
OHOH2C
HO
HO
OH
OO
O
OH3CO
OOH
CH3
O
O
R1
R3
R4
R2
R5
OH
O
O
O
OHO
OH
OH
O
HO
Fatty acyl
O
Acyl I
R1 R2 R3 R4 R5 Massa A4 H H β-D-Xylp α-L-Rhap Acetyl 1436.7 A5 α-L-Rhap H β-D-Xylp α-L-Rhap Acetyl 1582.7 A6 β-D-Xylp H β-D-Xylp α-L-Rhap Acetyl 1568.7 A7 α-L-Rhap H β-D-Xylp-
(1→3)-β-D-Apif α-L-Rhap Acetyl 1714.8
A8 β-D-Xylp H β-D-Xylp-(1→3)-β-D-Apif
α-L-Rhap Acetyl 1700.7
A9 α-L-Rhap H β-D-Xylp-(1→3)-β-D-Xylp
α-L-Rhap Acetyl 1714.8
A10 β-D-Xylp H β-D-Xylp-(1→3)-β-D-Xylp
α-L-Rhap Acetyl 1700.7
A11A α-L-Rhap H β-D-Xylp β-D-Glcp Acetyl 1598.7 A11B β-D-Xylp H β-D-Xylp β-D-Glcp Acetyl 1607.7 A12B β-D-Xylp β-D-Glcp H β-D-Glcp Acetyl 1614.7 A14A α-L-Rhap β-D-Glcp β-D-Xylp β-D-Glcp Acetyl 1760.8 A14B β-D-Xylp β-D-Glcp β-D-Xylp β-D-Glcp Acetyl 1746.7 A16A α-L-Rhap β-D-Glcp β-D-Xylp 6-O-Acetyl- Acetyl 1802.8
14
β-D-Glcp A16B β-D-Xylp β-D-Glcp β-D-Xylp 6-O-Acetyl-
β-D-Glcp Acetyl 1788.8
A17A α-L-Rhap β-D-Glcp β-D-Xylp α-L-Rhap Acetyl 1744.8 A17B β-D-Xylp β-D-Glcp β-D-Xylp α-L-Rhap Acetyl 1730.7 A18A α-L-Rhap β-D-Glcp β-D-Xylp-
(1→3)-β-D-Apif α-L-Rhap Acetyl 1876.8
A18B β-D-Xylp β-D-Glcp β-D-Xylp-(1→3)-β-D-Apif
α-L-Rhap Acetyl 1862.8
A20Ab α-L-Rhap β-D-Glcp β-D-Xylp H Acyl I 1656.7 A20Bb β-D-Xylp β-D-Glcp β-D-Xylp H Acyl I 1642.7 B1 α-L-Rhap β-D-Glcp β-D-Xylp H Fatty acyl 2033.0 B1a α-L-Rhap β-D-Glcp β-D-Xylp Fatty acyl H 2033.0 B2 β-D-Xylp β-D-Glcp β-D-Xylp H Fatty acyl 2018.9 B2a β-D-Xylp β-D-Glcp β-D-Xylp Fatty acyl H 2018.9 B3 α-L-Rhap β-D-Glcp β-D-Xylp-
(1→3)-β-D-ApifH Fatty acyl 2165.0
B3a α-L-Rhap β-D-Glcp β-D-Xylp-(1→3)-β-D-Apif
Fatty acyl H 2165.0
B4 β-D-Xylp β-D-Glcp β-D-Xylp-(1→3)-β-D-Apif
H Fatty acyl 2151.0
B4a β-D-Xylp β-D-Glcp β-D-Xylp-(1→3)-β-D-Apif
Fatty acyl H 2151.0
B5 α-L-Rhap β-D-Glcp β-D-Xylp-(1→3)-β-D-Xylp
H Fatty acyl 2165.0
B5a α-L-Rhap β-D-Glcp β-D-Xylp-(1→3)-β-D-Xylp
Fatty acyl H 2165.0
B6 β-D-Xylp β-D-Glcp β-D-Xylp-(1→3)-β-D-Xylp
H Fatty acyl 2151.0
B6a β-D-Xylp β-D-Glcp β-D-Xylp-(1→3)-β-D-Xylp
Fatty acyl H 2151.0
B7 Η β-D-Glcp β-D-Xylp H Fatty acyl 1886.9 B7a Η β-D-Glcp β-D-Xylp Fatty acyl H 1886.9 B8 Η β-D-Glcp β-D-Xylp-
(1→3)-β-D-ApifH Fatty acyl 2018.9
B8a Η β-D-Glcp β-D-Xylp-(1→3)-β-D-Apif
Fatty acyl H 2018.9
S1 α-L-Rhap Η β-D-Xylp H Fatty acyl 1870.9 S1a α-L-Rhap Η β-D-Xylp Fatty acyl H 1870.9 S2 β-D-Xylp Η β-D-Xylp H Fatty acyl 1856.9 S2a β-D-Xylp Η β-D-Xylp Fatty acyl H 1856.9 S3 α-L-Rhap Η β-D-Xylp-
(1→3)-β-D-Xylp H Fatty acyl 2002.9
S3a α-L-Rhap Η β-D-Xylp-(1→3)-β-D-Xylp
Fatty acyl H 2002.9
S4 β-D-Xylp Η β-D-Xylp- H Fatty acyl 1988.9
15
(1→3)-β-D-Xylp S4a β-D-Xylp Η β-D-Xylp-
(1→3)-β-D-Xylp Fatty acyl H 1988.9
S5 α-L-Rhap Η β-D-Xylp-(1→3)-β-D-Apif
H Fatty acyl 2002.9
S5a α-L-Rhap Η β-D-Xylp-(1→3)-β-D-Apif
Fatty acyl H 2002.9
S6 β-D-Xylp Η β-D-Xylp-(1→3)-β-D-Apif
H Fatty acyl 1988.9
S6a β-D-Xylp Η β-D-Xylp-(1→3)-β-D-Apif
Fatty acyl H 1988.9
S7 α-L-Rhap Η β-D-Xylp Acetyl Fatty acyl 1912.9 S8 β-D-Xylp Η β-D-Xylp Acetyl Fatty acyl 1898.9 S9 α-L-Rhap Η β-D-Xylp-
(1→3)-β-D-Xylp Acetyl Fatty acyl 2045.0
S10 β-D-Xylp Η β-D-Xylp-(1→3)-β-D-Xylp
Acetyl Fatty acyl 2030.9
S11 α-L-Rhap Η β-D-Xylp-(1→3)-β-D-Apif
Acetyl Fatty acyl 2045.0
S12 β-D-Xylp Η β-D-Xylp-(1→3)-β-D-Apif
Acetyl Fatty acyl 2030.9
a Reported monoisotopic mass b Contain the triterpene quillaic acid, 22β-OH
Figure 3. Common basic structures for previously reported Quillaja saponins investigated in this thesis. Structural elucidation of Quillaja saponins by ESI-IT-MSn Structural elucidation of saponins has a central role in this thesis, therefore interpretation of the fragmentation pathways previously reported are summarised. The nomenclature corresponds to previously reported investigations[32-34] which in turn are based on Domon and Costellos work on nomenclature[35, 36]. Investigations of Quillaja saponin structures utilising both positive ion mode and negative ion mode have been reported [32-34, 37]. Generally, both positive and negative ion mode provide structural information on the C-3 oligosaccharide, the triterpene and the C-28 oligosaccharide. The reported major ion species generated are the [M-H]- ion in negative ion mode and the [M+Na]+ or [M+NH4]+ in positive ion mode. The latter species ([M+NH4]+) was reported of less value to structural elucidation[34]. The molecular weight is derived from the singly charged [M-H]- ion in negative ion mode (-MS1). The major deprotonated fragment ions obtained from the [M-H]- ion in -MS2 (Fig. 4) provide information about the mass corresponding to the C-3 oligosaccharide substituted triterpene ([a-H]-), the C-28 oligosaccharide ([M-H]- - [a-H]-), and the fucose substituted by a fatty acyl group [34]. Further, reported investigations in negative ion mode (-MS3) when isolating and
16

fragmenting the [a-H]- ion provided fragments containing information on the triterpene and the C-3 oligosaccharide [33].
Figure 4. MS2 spectrum of compound B2 in negative ion mode. Glycosidic cleavages corresponding to the major fragment ions. All fragment ions are deprotonated. In positive ion mode (+MS1) the molecular weight can be derived from the singly charged [M+Na]+ ion (Fig. 5(a)). The major fragment ions obtained from the [M+Na]+ ion in +MS2 provide information about the mass corresponding to the C-3 oligosaccharide ([M+Na]+ - [A+Na]+), the triterpene ([A+Na]+ - [B+Na]+) and the C-28 oligosaccharide ([B+Na]+) (Fig. 5(b)). Detailed information on the fragmentation pathways of the C-28 oligosaccharide have been reported from the isolated and fragmented [B+Na]+ ion in +MS3 (Fig. 5(c)) [32, 33].
Figure 5. (a) MS1 spectrum in positive ion mode with the [M+Na]+ ion corresponding to compound A6 (b) MS2 spectrum of the isolated and fragmented ion [M+Na]+ visualising the two corresponding fragment ions ([A+Na]+ and [B+Na]+). (c) MS3 spectrum of the isolated and fragmented ion [B+Na]+. Important loss of fragments derived from the MS2 spectrum and diagnostic fragments obtained from the isolated and fragmented [B+Na]+ ion in MS3 are visualized for positive ion mode in Figure 6.
17

Figure 6. Proposed fragmentation pathways of Quillaja saponaria Molina studied in positive ion mode. The mass of all diagnostic fragments correspond to sodiated adducts. Dashed lines are connecting optional substituents. Loss of fragment is given in italics. Fragments given in parenthesis are not previously reported. Observed fragments obtained from the C-28 oligosaccharide are cleaved off from both the reducing end (referred to as ‘fucosyl residue fragments’) and non-
18
reducing end (referred to as ‘end fragments’). The fucosyl residue fragments provide sufficient information on loss of fragments to classify the saponin structures as is demonstrated in paper I and paper II, however, the end fragments obtained in +MS3 also provide valuable information and are thus important as diagnostic fragments in a structural investigation as well as in regression models as is suggested in paper IV.
Topic of this thesis
The scope of this thesis is to demonstrate methods that simplify metabolic profiling of Quillaja saponins in particular but these methods should also be applicable to other glyco-conjugates built of monomers or repeating units in general. Quillaja saponins have been investigated in this thesis due to their use as adjuvants with vaccines. The use of these saponins in humans calls for detailed knowledge about the different saponin structures in the fractionated purified bark extract. Thus a method useful for metabolic studies as well as for comparing different separation and extraction techniques is outlined and proposed as a resource saving tool in the structural analysis of saponin components. Finally, the use of mass spectrometry as a standard tool for detection in combination with multivariate analysis has greatly increased the selectivity of the described method which has proved necessary for studies of complex biological samples.
Applied analytical techniques
A plethora of techniques have been described in the literature for determining the structure of Quillaja saponin components. Some of the most widely used today are probably nuclear magnetic resonance spectroscopy (NMR) [26, 38-40] and mass spectrometry (MS) [33, 34] in combination with various separation techniques. The use of separation techniques such as solid phase extraction (SPE) and liquid chromatography (LC) [41, 42] is fundamental to the analysis of a complex mixture of saponins like the crude bark extract of Quillaja saponaria Molina. Introduction to mass spectrometry; sample detection Mass spectrometry is today widely used for studying different types of biomolecules[43-48] including glyco-conjugates [36]. The essence of mass spectrometry is to determine the molecular masses of individual compounds and sometimes also the masses of pieces of a compound. The molecular mass
19

provides information about the chemical composition and masses of subunits can yield structural information. Mass spectrometry typically requires much smaller amounts of sample than other approaches for structural elucidation. A mass spectrometer contains three major components: an ion source, a mass analyser and a detector[49] (Fig. 7). In the ion-source, analyte molecules are converted to ions of some charge state z. The mass analyser utilises electric or magnetic fields to separate ions according to their mass-to-charge ratio (m/z) prior to detection. The mass analyser can also be employed to isolate ions of a particular m/z value. The isolated ions can then be fragmented and the resulting fragment ions can be mass analysed. The ions formed are sub-groups related to the original molecular structure. By studying these fragments the original molecular structure (analyte) can be elucidated. Furthermore, the possibility to combine the mass spectrometer, as a detector, with a liquid chromatography system for increased selectivity enhances the potential for analysis of complex biological samples.
Figure 7. Schematic illustration of a mass spectrometer. The dashed circle illustrates the vacuum system. The ion source The ion source was for long the critical point in the history of development of mass spectrometry. This is due to the difficulties in converting non-volatile compounds, present in the liquid solutions or in a solid sample, to ions in the gas phase. Mass spectrometry was demonstrated in the beginning of the 20th century but did not reach broad applications until the 1960s when the GC-MS system was constructed for analysis of volatile analytes[49]. However, robust mass spectrometers, converting liquid or solid phase molecules into gas phase ions, were not available until the 1980s [50-54]. The methods of converting non-volatile analytes into gas-phase ions revolutionized the applicability of MS and created one of the most common bench top instruments for analytical purposes. At present, several atmospheric pressure ionization[55] (API) techniques are available but the most common is electro-spray ionisation (ESI)[56-59] which
20

often outperforms the other techniques (such as atmospheric pressure chemical ionization[60, 61] (APCI) and atmospheric pressure photoionisation[62] (APPI)) because of its ability to ionise a wider range of analytes -i.e. higher polarity and molecular mass. ESI is a soft ionisation technique by which the analyte is charged and transferred from a solution to the gas phase. The process involved (Fig. 8) in this formation of ions needs an electric field to the tip of a capillary containing a solution of electrolyte ions. Depending on the field a double layer will form with either positive or negative ions near the surface. When the capillary is positive, positive ions will be near the surface and thus destabilise the meniscus and a cone (Taylor cone) is formed. The cone will eventually break up into small multiply charged droplets and solvent evaporates from the droplets. The shrinking droplets lead to columbic repulsion and at a stage when the repulsion is high enough to overcome the surface tension droplet fission takes place. This process is a cycle and eventually very small droplets will form and in the end only ions remains in the gas phase, however the final formation of the ions formed by ESI is not fully understood. There exist two accepted mechanisms, the charged residue model and the ion evaporation model[56, 58].
Figure 8. Ion formation by electrospray ionisation, illustrating the Taylor cone. Another widely used soft ionization technique in glycoconjugate analysis is matrix-assisted laser desorption ionization (MALDI) [52, 63-65]. In MALDI (Fig. 9), the analyte is mixed with a solution of matrix molecules and while the solvent evaporates the analyte molecules co-crystallise with the matrix after which it can be introduced into the mass spectrometer in a solid state. There are different sample preparation protocols for MALDI, but in common the analyte is incorporated in a UV-light absorbing matrix e.g. 2,5-dihydroxybenzoic acid (DHB) [66], 2,4,6-trihydroxyacetophenone (THAP)[67]. In the MALDI ion source the matrix with the embedded analyte is repeatedly irradiated with a short duration UV-laser pulse (<10 ns). The irradiation energy is absorbed by the
21

matrix through electronic excitation and causes desorption of the analyte-matrix mixture. The ionisation process is not fully understood but it is assumed that ions are formed by means of proton transfer between matrix and analyte [49].
Figure 9. Schematic representation of the MALDI process After that the analyte has been converted into gas-phase ions these can be subjected to an array of different mass analysers depending on what information is requested. ESI and MALDI are both widely used techniques since they have made ionization of large bio-molecules possible. In this thesis MALDI has been used mostly to verify the composition of different saponin fractions whereas ESI has been the work-horse in multiple stage mass spectrometric analysis of saponin structures. The mass (m/z) analyser After the analyte has been transferred to the gas phase and ionised it can be manipulated by electric and magnetic fields, thus transported into a mass analyser. The basic function of a mass analyser is to measure the mass-to-charge ratios (m/z) of ions and provide a means of separating the ions. There are various types of different mass analysers available today and the optimal choice depends on information requirements of the actual analysis as well as the complexity of the sample. Some important characteristics of mass analysers are mass range, mass resolution and dynamic range. The mass range is the range of m/z over which a mass spectrometer can record a spectrum. The mass resolution is the ability to separate two neighbouring mass ions. Dynamic range involves more than one characteristic property depending on the application, for structural elucidation it is the range over which the m/z value can be determined accurately [68]. For quantification purposes it is the range over which the response is linear to the analyte concentration. Today, the most widely used mass analysers are quadrupole (Q), quadrupole ion trap (QIT) and time-of-flight (TOF). The Q and QIT are both examples on scanning mass analysers, in addition the QIT is capable of so called multiple-stage measurements where ions with a
22
specific m/z can be selected and studied. This feature is advantageous for structural investigations of molecules. The quadrupole analyser consists of four parallel rods with the opposing rods connected together electrically to radio frequency (RF) and direct current (DC) power sources. Ions are extracted from the ion source and accelerated into the central space between the rods by an electric field along the longitudinal axis, -i.e. ions are formed in the ion source and enter the space between the four rods where they are accelerated towards the detector. The ions can be manipulated during their flight path and for a fixed ratio of the RF amplitude and DC potential only ions of a specific m/z value are stable throughout their flight path to the detector and avoid collision with the rods. Therefore, only ions with a specific m/z will reach the detector. The quadrupole ion trap [69] is a three-dimensional analogue of the linear quadrupole. It consists of two end-cap electrodes and one ring electrode located between the end caps. The three dimensional construction has a hyperbolic cross-sectional surface consistent with that originally used in a quadrupole. Unlike the quadrupole, ions in the IT are affected by a three dimensional quadrupole field, which depending on the applied level of RF voltage stabilises ions of specific m/z values. Thus the IT acts as a storage device for ions. The operational pressure is rather high in an IT about ~10-1 Pa (compared to 10-4 Pa for a Q) allowing for better cooling of the ions. The pressure is maintained by a continuous flow of helium or argon gas into the IT. The scan sequence used to acquire a mass spectrum starts with clearance of the ion trap, and then continues by accumulation of ions which are trapped in the RF field. At this stage the ions can be ejected by increasing RF field strength and detected or ions of a specific m/z value can be isolated by applying RF potentials ejecting ions corresponding to all other m/z values. The selected and isolated ions can then be fragmented, which is achieved by increasing the kinetic energy of the ions. The ions collide more frequently with the inert gas present in the trap when the kinetic energy increases, and as a result the internal energy reaches to a level that causes the ion to fragment. By this procedure fragment ions originating from the precursor ion are formed and can be monitored (collision-induced dissociation, CID)[69]. Time-of-flight (TOF)[70] is another common analyser with the most outstanding feature of an unlimited mass range thus often combined with MALDI. The basic principle of ion separation by TOF mass spectrometry involves measuring the time required for an ion to travel from the ion source to a detector. This mass analyser consists of a long field free flight tube, usually between 1 and 2 meters, in which ions are separated on the basis of their velocity differences. A short pulse of ions of defined kinetic energy is generated in the ion source. Their velocity is proportional to (m/z)-1/2 and hence the lower m/z ions travel faster and reach the detector earlier than those with a higher m/z. For long the resolution of TOF analysers was limited, due to initial kinetic energy spread, initial angular spread and initial position of ion formation spread.
23

To increase the mass resolution of TOF analysers the ion mirror or reflectron was invented [71, 72]. This is an energy correcting device that refocuses the ions so that the arrival time distribution is reduced at the detector for ions of the same m/z. It is made up of an electrostatic field and the working principle is that more energetic ions (higher velocity ions of similar m/z) penetrate longer into the electrostatic field creating a longer flight path compared to low energetic ions before they are re-accelerated towards the detector. Detection of ions; the ion detector A detector provides information on the abundance of ions that exits the mass analyser. This is done by converting the beam of ions into an electrical signal. When a particle (ion) enters the detector it is set on a path to collide with a dynode surface, from which one or several electrons are emitted. These secondary electrons then hits a new dynode causing an emission of even more electrons, this so-called electron multiplication is repeated and eventually a cascade of electrons is created that finally results in a measurable current. These signals are amplified and recorded by a computer. Introduction to chemometrics The essence of chemometrics is to extract chemically relevant information, by transforming obtained measurement data into usable data and then display the result in an uncomplicated but comprehensive manner. To obtain this information, chemometrics comprises mathematical and statistical methods that guide the flow of chemical information relevant for the understanding of a system or analysis. Pattern recognition techniques are a branch of chemometrics and have frequently been applied to various types of data where the aim is to distinguish between two or more classes. Usually the underlying pattern provides information about the relations between objects (compounds) in one class. These relations are more or less similar within one class and dissimilar between classes. Two of the most common pattern recognition techniques used today are principal component analysis (PCA) [73]and partial least squares regression–discriminant analysis (PLS-DA)[74]. An important part of chemometrics is data pre-treatment; the relevant chemical information sought for can be suppressed by other phenomena in the data e.g. concentration differences or noise. The relevant information can therefore be improved by the use of filters, signal correction or different scaling techniques [75]. Data pre-treatment has been a central part of this thesis to remove differences in ion abundance due to concentration or ion suppression and to scale the data by referencing. Pattern recognition can be carried out in one or more steps, usually a PCA is first utilised to explore a new set of data. PCA has one major advantage over PLS when exploring a new data-set; it is an unsupervised technique which means that it is not tampered by any external constraints. Therefore, the captured
24

variance described by PCA truly is an underlying phenomenon of the investigated data. With PCA, a matrix X (M×N) (Fig. 10) is decomposed into a bilinear model according to X = t pT where t (M×Amax) is the orthogonal score matrix and p is the orthonormal loading matrix. The matrices (t and pT) are arranged so that the first PC describes most of the variance in X thus the columns of t are ordered with a descending variance. The value of Amax equals the maximum number of PCs which is equal to the rank of X. Due to noise Amax exceeds the number of PCs (A) that is necessary to reconstruct the relevant information in X. Thus it is possible to divide the principal components into primary (useful) and secondary (noise) components. Therefore the PCA model can be reduced into X = t pT + E Eq. 1 where E (M×N) form the residuals. When a model is obtained it is essential to find the optimal number of PCs, several test procedures have been suggested for this purpose [76]. The resulting model means a projection of X on so-called latent variables. The co-ordinates along these variables (PCs) form the score matrix t. Exploratory analysis and visualisation of results of large data-sets may be hard to achieve. In these situations PCA is helpful since it is a relatively straightforward method with the capability of presenting comprehensive results in the form of scatter plots [77]. A scatter plot is achieved by plotting the score vector of one PC vs. another. The plot obtained can then be used to find relations between the objects, e.g. for classification purposes. Similarly, loading plots can be used to relate the variables and visualise their contribution to the model.
Figure 10. A presentation of the matrices involved in PCA. X is the data from which the scores (t) and loadings (p) are calculated. E is the residual matrix containing the information not included in Xmodel. A geometrical interpretation of a principal component (PC) is visualised in Fig. 11. The direction of the PC (line) is defined by the loadings, the PC is orientated so that it describes as much of the original data as possible. Score
25
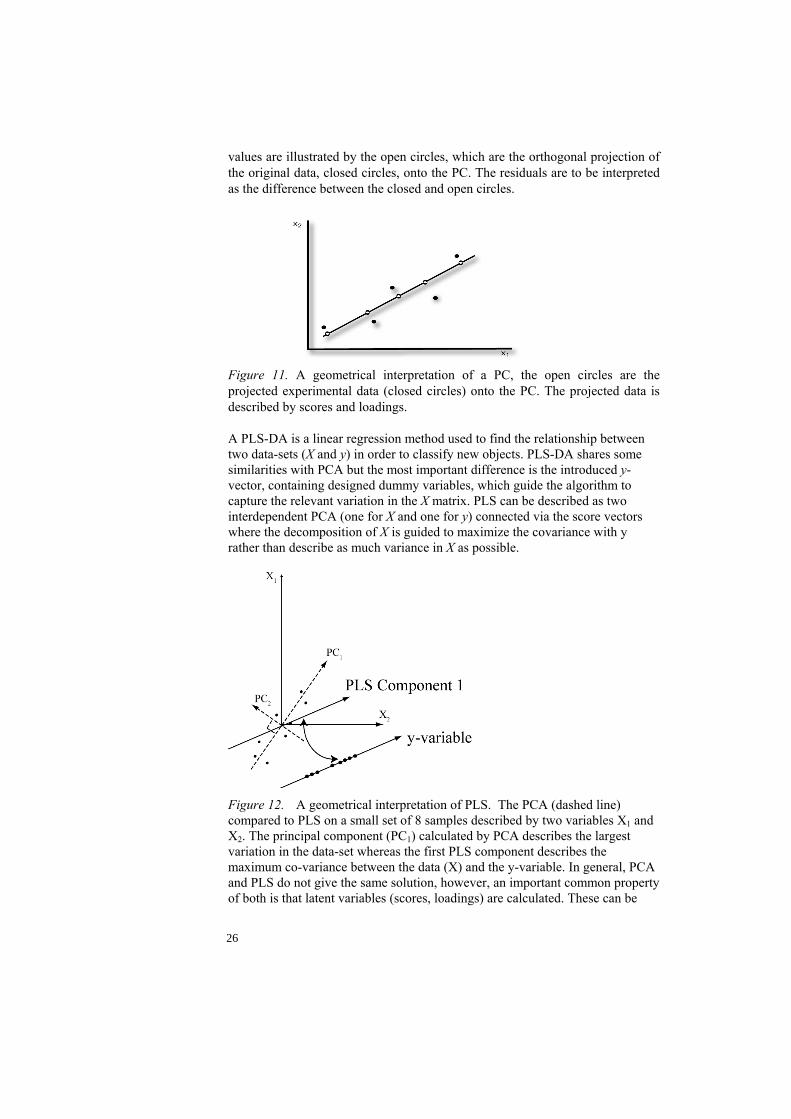
values are illustrated by the open circles, which are the orthogonal projection of the original data, closed circles, onto the PC. The residuals are to be interpreted as the difference between the closed and open circles.
Figure 11. A geometrical interpretation of a PC, the open circles are the projected experimental data (closed circles) onto the PC. The projected data is described by scores and loadings. A PLS-DA is a linear regression method used to find the relationship between two data-sets (X and y) in order to classify new objects. PLS-DA shares some similarities with PCA but the most important difference is the introduced y-vector, containing designed dummy variables, which guide the algorithm to capture the relevant variation in the X matrix. PLS can be described as two interdependent PCA (one for X and one for y) connected via the score vectors where the decomposition of X is guided to maximize the covariance with y rather than describe as much variance in X as possible.
Figure 12. A geometrical interpretation of PLS. The PCA (dashed line) compared to PLS on a small set of 8 samples described by two variables X1 and X2. The principal component (PC1) calculated by PCA describes the largest variation in the data-set whereas the first PLS component describes the maximum co-variance between the data (X) and the y-variable. In general, PCA and PLS do not give the same solution, however, an important common property of both is that latent variables (scores, loadings) are calculated. These can be
26

used for diagnostic purposes and for visualization of underlying phenomenon present in a data-set. It is important to understand that captured variance by PLS-DA can be quite different compared to the captured variance by PCA of the same data-set (Fig. 12). However, as mentioned earlier, the amount and relevance of the captured variance in X (PCA and PLS-DA), and ability to predict new samples (PLS-DA), must be validated so that the optimal numbers of PCs can be decided[73, 74, 76, 78]. There are multiple ways of assessing the appropriate number of PCs for a model; three methods have mainly been used in this study and are thus described below. Firstly, an elementary approach is to study the residuals of X (E in Fig 11.) that reveal if the systematic variation has been captured. Likewise the loading components of a PC can be studied and the break point between primary and secondary components could be found. This approach, nevertheless, may lead to an excessive number of included PCs because not even all the systematic variation might be of interest to a PLS-DA where only the maximum covariance between X and y is sought. Secondly, validation techniques such as leave-one-out cross-validation (LOO-CV) and test-set validation are used. The LOO-CV is helpful when a limited number of objects are available. The basic principle of LOO-CV is to split the data-set, object-wise, and one object (row, containing spectral data) is taken out at a time whilst a model is computed that is then used to predict a y-value for the left out object. This is repeated until all objects have been excluded. Predicted residual error sum of squares (PRESS) can then be calculated for each number of included PCs according to Eq. 2.
∑=
−=n
iobsyyPRESS
1
2pred )( Eq. 2
By this procedure the appropriate model can be decided when PRESS is at first minimum. Furthermore, a test-set is used to assure the appropriate number of latent variables. The squared sum of error of prediction (Q2) for the test-set can then be compared for each number of included latent variables. Typically, when comparing the three methods for assessment, the number of primary PCs decreases when going from investigating the residuals to LOO-CV and further to test-set. The coefficients R2, Q2, and captured X-variation provide important statistical aspects of a multivariate model and are thus important to consider. R2 (Eq. 3) describes the modeled (captured) variance of the y-vector compared to the total variance of the y-vector whereas Q2 (Eq. 4) describes the error of prediction of an unknown or cross-validated object. The captured X-variance is the amount of variance included in the model compared to the total variance of X (spectral data).
27

∑∑==
−−−=n
imeanobs
n
iobscalc yyyyR
1
2
1
22 )(/)(1 Eq. 3
2
1
2 )(/1 mean
n
iobs yyPRESSQ ∑
=
−−= Eq. 4
The purpose of PLS-DA is classification of unknown objects. This is done by calculating a predicted y-value when the measured spectrum of an unknown object (compound) is predicted. In order to arrange the predicted y-values as members or non-members class intervals must be set. Decision limits can be decided in several ways, in paper I and II the limits were based on the pooled variance of predictions according to Eq. 5 where S1 is the standard deviation and n1 the number of objects in members class and the prediction (S-1 and n-1 correspond to non-members). In paper IV only the standard deviation for the member class was calculated.
[ ] 2/1
11
211
211
)2()1()1(
⎭⎬⎫
⎩⎨⎧
−+−+−
=−
−−
nnSnSnS pooled Eq. 5
The interval was then set to 1.0 ± 3Spooled for membership and -1.0 ± 3Spooled for non-membership. Variable selection An approach from soft independent modeling of class analogy (SIMCA) for variable selection was applied to eliminate redundant information. SIMCA [79] is a modelling technique applied to objects related to soft classes. When two classes overlap they are considered to be soft. The actual classification technique is not applied in this investigation but the modelling power (Mi, Eq. 6) and discriminatory power (Di, Eq. 7), related to SIMCA, were calculated in order to scrutinise the X matrix.
irawiresiduali SSM /1−= Eq. 6 Modelling power is calculated in Eq. 6, where Siraw is the standard deviation of the variable in the original spectral data and Siresidual is the standard deviation of the variable in the residuals in E. The obtained values for each variable vary between one and zero, where variables with Mi close to zero are of little or no use for describing the underlying phenomenon.
28

2mod2mod
2mod2mod
iresidualelBclassB
iresidualelAclassA
iresidualelAclassB
iresidualelBclassA
i SSSSD
++
= Eq. 7
Discriminatory power (Di, Eq. 7) reveals the variables that discriminate between two classes. The objects (spectral data corresponding to each compound) must be split into two classes before Di can be calculated; the splitting must reflect the differences sought for. PCA is then carried out providing two models, one for each class. Thereafter all objects in the first class are fitted to both models and the squared standard deviation of each variable in E is inserted in Eq. 6 and likewise for the second class (B). Then Di is calculated and a larger value indicates a higher discriminatory power, the variables (spectral data points) holding the largest Di are most valuable to the discrimination between classes. Chromatography The complex mixtures of saponins examined were subjected to chromatographic separation prior to analysis. Liquid chromatography (LC) is today the first choice for polar, non-volatile aqueous samples. When a sample is subjected to LC the analytes (compounds) in the introduced sample are separated due to their partitioning between two phases: a mobile (liquid) phase and a stationary (solid) phase. Due to a specific compounds ability to dissolve in the mobile phases the time of migration through the stationary phase will differ. Thus the retention time, the time a compound travels between injector and detector in a chromatographic system, is decreased if its partitioning is shifted to the mobile phase. A wide variety of mobile phases as well as stationary phases are used that give rise to different separation modes such as reversed phase (RP), normal phase (NP) and ion-exchange chromatography (IXC) amongst others. Reversed phase is the most widely used for biological samples in combination with ESI-MS. The selectivity of the reversed phase mode is predominantly a function of the type of stationary phase in use. Generally, linear hydrocarbon chains (n-alkyl groups) are used in reversed phase applications meaning that components are separated due to their hydrophobicity -i.e., binding properties to the stationary phase. There is a number of frequently used stationary phases in RP mode such as C-18 (octadecylsilyl), C-8 (octylsilyl) and C-4 (butylsilyl). The length of the alkyl chain determines the hydrophobicity of the stationary phase -i.e., a shorter chain is less hydrophobic. The polarity of the stationary phase has to be matched by that of the mobile phase since the analyte can only migrate when dissolved. Therefore, using a mobile phase that almost completely dissolves the analytes renders a short retention time and vice versa. The C-18 stationary phase is well adopted to be utilized in combination with ESI-MS because of its hydrophobic nature which, in order to obtain an adequate separation, has to be matched by a relatively high concentration of organic modifier in the mobile phase, such as acetonitrile or methanol. A higher fraction
29

of organic modifier increases the efficiency of the ionization of the analyte in ESI, due to a lower surface tension. Today, high performance liquid chromatography (HPLC) is a standard instrumentation in analytical chemistry, but the next step has already been taken and is termed ultra high performance liquid chromatography (UHPLC) which is becoming more common. The terms LC, HPLC and UHPLC refer to the systems ability to handle pressure. HPLC is built to handle ~ 400 bar whereas UHPLC is set to handle ~ 1050 bar. In this work HPLC has been applied in RP mode using C-18 columns since the saponins studied have been adequately separated using this methodology.
30

Classification of saponins, proof of concept (Paper I)
The mass spectra were acquired for isolated compounds from the chromatographic fraction QH-A. The aim was to classify saponins based on their respective fragmentation pattern in multiple stage mass spectra. By manual interpretation of the saponin fragmentation pattern different structural features of the saponin structure were distinguished and the molecular structure could be elucidated [32-34]. Thus multivariate classification of these features by linking a specific fragmentation pattern to a structural feature was investigated. This is achievable if a unique fragmentation pattern can be obtained in terms of spectral information for compounds containing identical structural features. The isolated saponin components were introduced into the electrospray ion source via a syringe pump and data were recorded in positive ion mode (Fig. 11). The major ion observed in MS1 was the singly charged sodiated molecule [M+Na]+. In MS2 the [M+Na]+ was isolated and fragmented and the fragment ions [A+Na]+ and [B+Na]+ corresponding to the C-28 oligosaccharide linked to the triterpene (A) and the C-28 oligosaccharide (B) , respectively, were obtained. The [B+Na]+ ion was further isolated and fragmented to obtain fragment ions corresponding to the C-28 oligosaccharide in the MS3 spectrum. The variation of mass spectral data is due to e.g. molecular weight and fragmentation patterns of the compounds but also background noise, calibration of the instrument and concentration differences between samples. Therefore, both the m/z and the intensity-value axis need scaling prior to multivariate analysis. In this work scaling has been used to make spectral data comparable with respect to the intensity-value axis whereas the m/z variation from molecular weight and instrument calibration were levelled out by a proposed referencing procedure. Spectral data were imported into Matlab®, where all calculations were performed. The spectral referencing procedure is visualised in Fig. 13 were the position of the [M+Na]+ is the new reference on the m/z axis for MS2 spectra and [B+Na]+ for MS3 spectra. As a result of this procedure all m/z values previously corresponding to a sodiated fragment now correspond to ‘loss of fragment’ from the isolated ions [M+Na]+ and [B+Na]+, respectively. Thus, the constructed spectra remove the influence of molecular weight. Further, the spectra were subjected to normalisation and mean centring to remove irrelevant variation prior to PCA and PLS-DA. In the following exploratory analysis (PCA) it was found that the [M+Na]+ and [B+Na]+ residual peaks of the isolated and fragmented ions had a negative influence on the classification of compounds with respect to their structural elements why the mass units 0-(-10) were removed.
31
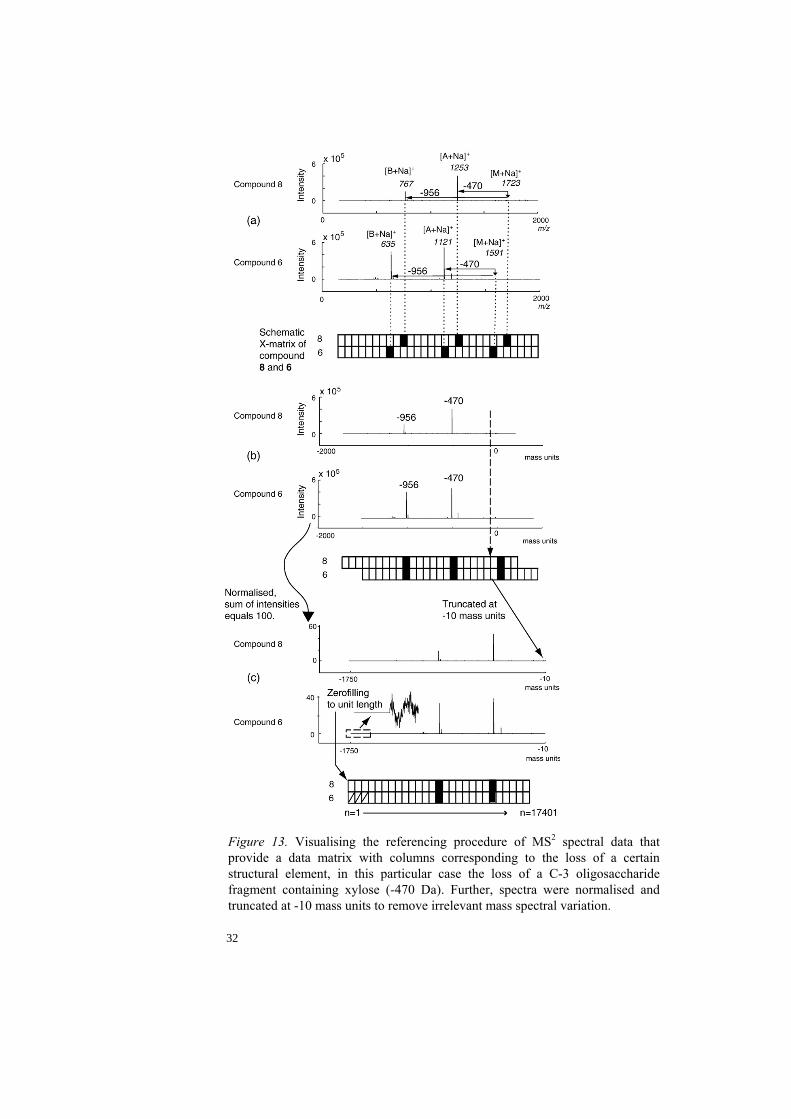
Figure 13. Visualising the referencing procedure of MS2 spectral data that provide a data matrix with columns corresponding to the loss of a certain structural element, in this particular case the loss of a C-3 oligosaccharide fragment containing xylose (-470 Da). Further, spectra were normalised and truncated at -10 mass units to remove irrelevant mass spectral variation.
32
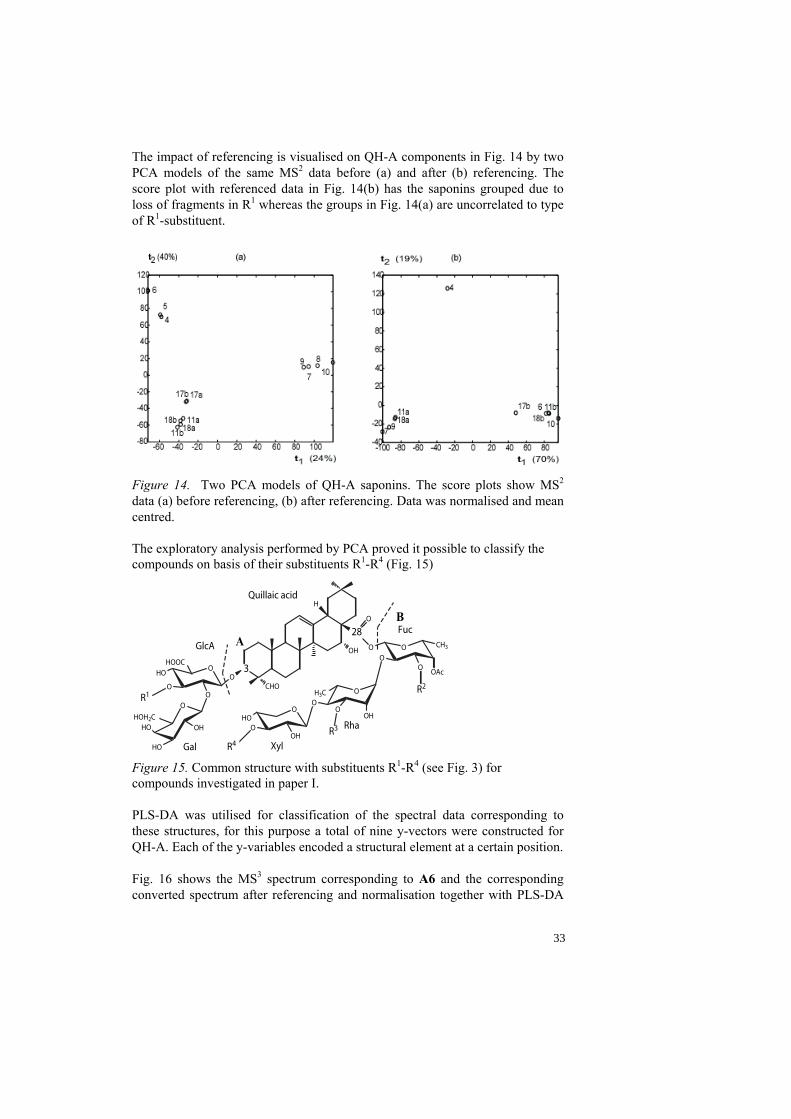
The impact of referencing is visualised on QH-A components in Fig. 14 by two PCA models of the same MS2 data before (a) and after (b) referencing. The score plot with referenced data in Fig. 14(b) has the saponins grouped due to loss of fragments in R1 whereas the groups in Fig. 14(a) are uncorrelated to type of R1-substituent.
Figure 14. Two PCA models of QH-A saponins. The score plots show MS2 data (a) before referencing, (b) after referencing. Data was normalised and mean centred. The exploratory analysis performed by PCA proved it possible to classify the compounds on basis of their substituents R1-R4 (Fig. 15)
Figure 15. Common structure with substituents R1-R4 (see Fig. 3) for compounds investigated in paper I. PLS-DA was utilised for classification of the spectral data corresponding to these structures, for this purpose a total of nine y-vectors were constructed for QH-A. Each of the y-variables encoded a structural element at a certain position. Fig. 16 shows the MS3 spectrum corresponding to A6 and the corresponding converted spectrum after referencing and normalisation together with PLS-DA
33
3O
H
28
OH
CHO
O
OHOOC
HO
OO
OHOH2C
HO
HO
OH
OO
O
O
OHO
OOH
H3CO
OOH
CH3
OAc
O
R1
R4 Xyl
Rha
Fuc
GlcA
Gal
Quillaic acid
R2
R3
A
B

loading plots. Loss of fragments is illustrated where the precursor ion [B+Na]+ was isolated and fragmented. The fragments important to classification are all pinpointed in the PLS-DA loading plots and the structure is visualised (Fig. 16(e)).
Figure 16. (a) Original MS3 spectral data of compound A6 with proposed fragments. (b) Pre-processed spectrum and (c) loading vector 1 and (d) loading vector 2 from a PLS-DA model. (e) Proposed fragmentation of the precursor ion [B+Na]+ ( m/z 635) from compound A6.
34
The obtained models were validated and the optimal number of PCs was decided with respect to PRESS, Q2
cv and Q2test-set. Validation results for PLS-DA
(Table 1) show the performance of the models. Table 1. Statistical summary for the nine PLS-DA models.
Model LVsa X (%)b R2 Q2cv Q2
test-set R1, H 3 93 1.00 N/Ac N/Ac
R1, Rha 3 93 0.99 0.85 0.97 R1, Xyl 3 92 0.99 0.87 0.99 R2, Rha 2 83 0.97 0.94 N/Ad
R2, Glc 2 83 0.97 0.94 N/Ad
R3, H 3 93 0.99 0.81 0.95 R3, Glc 3 93 0.99 0.81 0.95 R4, H 3 93 0.98 0.42 0.91 R4, Pentose 3 93 0.98 0.42 0.91 a Optimal number of latent variables used. b Amount of X variance captured. c Calculation could not be performed due to too few members in the class (R1 =
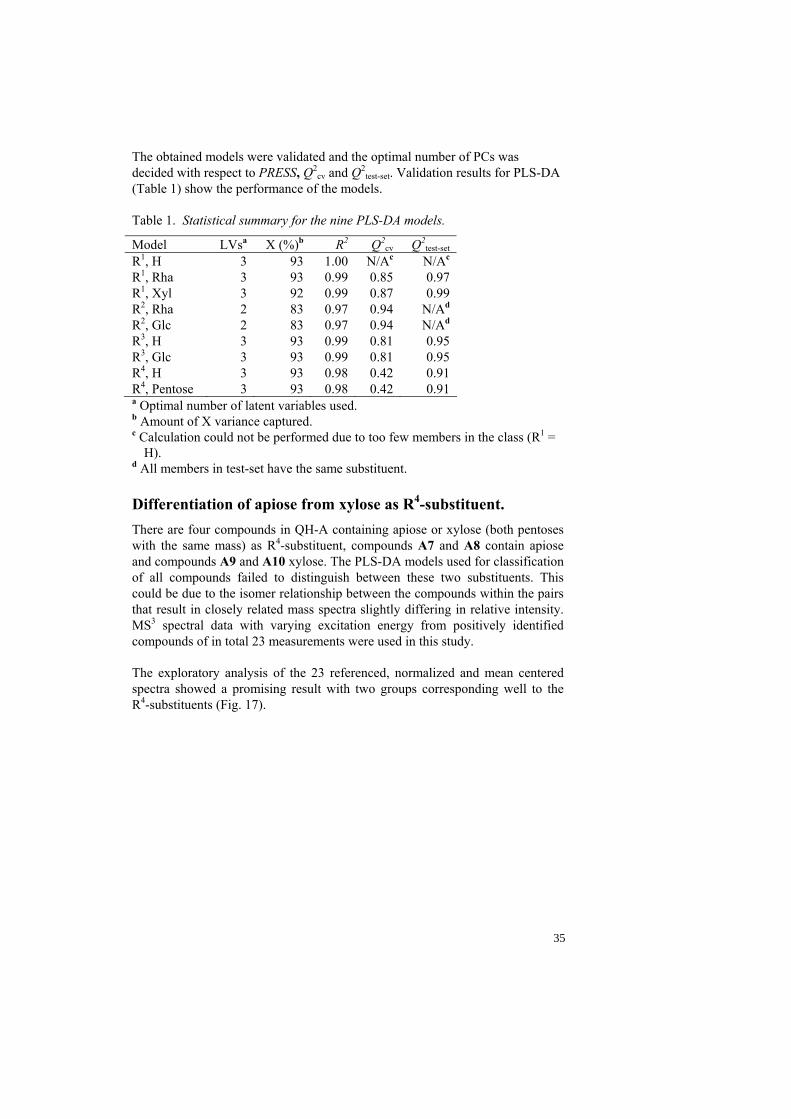
H). d All members in test-set have the same substituent. Differentiation of apiose from xylose as R4-substituent. There are four compounds in QH-A containing apiose or xylose (both pentoses with the same mass) as R4-substituent, compounds A7 and A8 contain apiose and compounds A9 and A10 xylose. The PLS-DA models used for classification of all compounds failed to distinguish between these two substituents. This could be due to the isomer relationship between the compounds within the pairs that result in closely related mass spectra slightly differing in relative intensity. MS3 spectral data with varying excitation energy from positively identified compounds of in total 23 measurements were used in this study. The exploratory analysis of the 23 referenced, normalized and mean centered spectra showed a promising result with two groups corresponding well to the R4-substituents (Fig. 17).
35
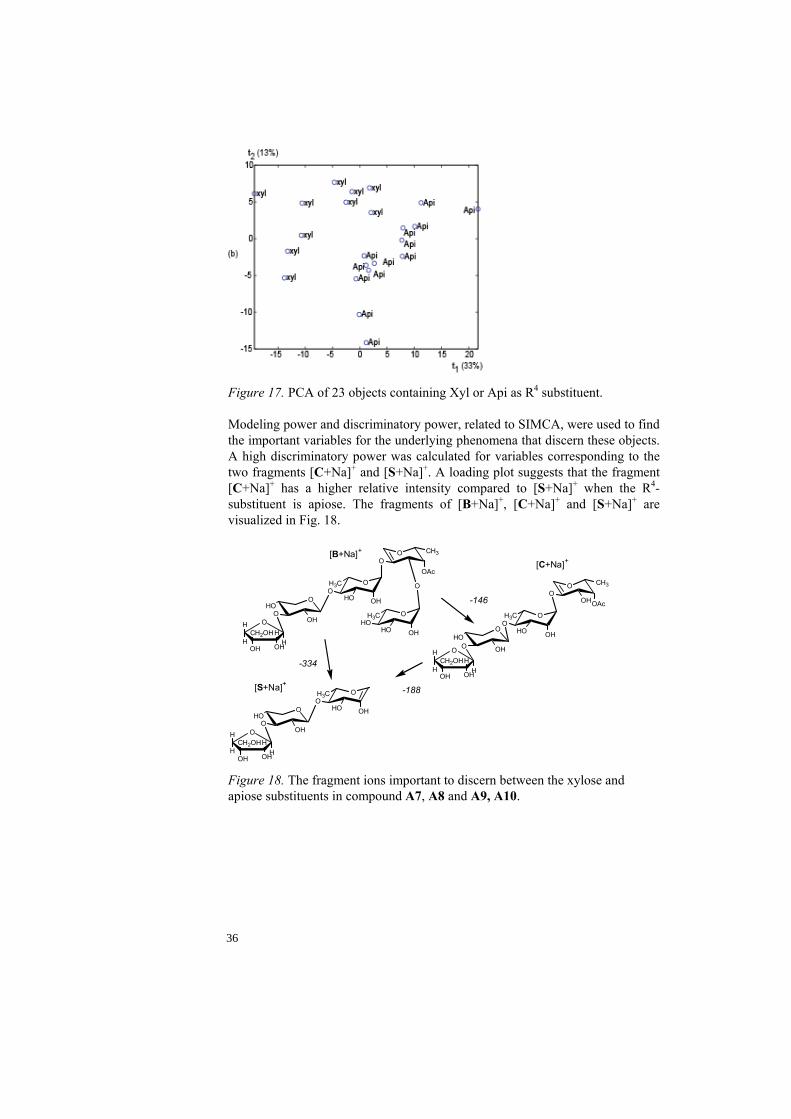
Figure 17. PCA of 23 objects containing Xyl or Api as R4 substituent. Modeling power and discriminatory power, related to SIMCA, were used to find the important variables for the underlying phenomena that discern these objects. A high discriminatory power was calculated for variables corresponding to the two fragments [C+Na]+ and [S+Na]+. A loading plot suggests that the fragment [C+Na]+ has a higher relative intensity compared to [S+Na]+ when the R4-substituent is apiose. The fragments of [B+Na]+, [C+Na]+ and [S+Na]+ are visualized in Fig. 18.
Figure 18. The fragment ions important to discern between the xylose and apiose substituents in compound A7, A8 and A9, A10.
OO
OO
OHO
OOH
H3CO
HO OH
CH3
OAc
OH3CHO
HO OH
OO
OH
O
OHO
O OH
H3CO
HO OH
CH3
OAc
[B+Na]+
-334
-146
HH
H
OH OH
CH2OH HO
HH
H
OH OH
CH2OHHO
O
OHO
OOH
H3CO
HO OH
HH
H
OH OH
CH2OHHO
-188[S+Na]+
[C+Na]+
36
Application of concept to new structural features (Paper II)
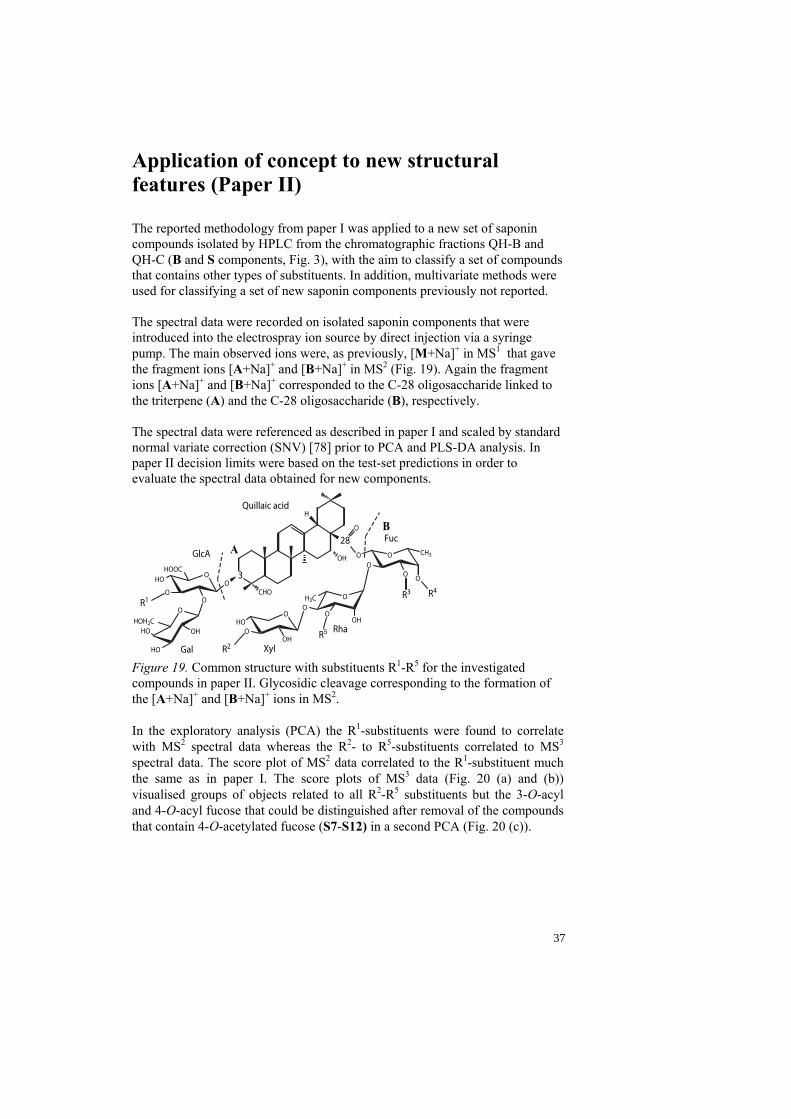
The reported methodology from paper I was applied to a new set of saponin compounds isolated by HPLC from the chromatographic fractions QH-B and QH-C (B and S components, Fig. 3), with the aim to classify a set of compounds that contains other types of substituents. In addition, multivariate methods were used for classifying a set of new saponin components previously not reported. The spectral data were recorded on isolated saponin components that were introduced into the electrospray ion source by direct injection via a syringe pump. The main observed ions were, as previously, [M+Na]+ in MS1 that gave the fragment ions [A+Na]+ and [B+Na]+ in MS2 (Fig. 19). Again the fragment ions [A+Na]+ and [B+Na]+ corresponded to the C-28 oligosaccharide linked to the triterpene (A) and the C-28 oligosaccharide (B), respectively. The spectral data were referenced as described in paper I and scaled by standard normal variate correction (SNV) [78] prior to PCA and PLS-DA analysis. In paper II decision limits were based on the test-set predictions in order to evaluate the spectral data obtained for new components.
Figure 19. Common structure with substituents R1-R5 for the investigated compounds in paper II. Glycosidic cleavage corresponding to the formation of the [A+Na]+ and [B+Na]+ ions in MS2. In the exploratory analysis (PCA) the R1-substituents were found to correlate with MS2 spectral data whereas the R2- to R5-substituents correlated to MS3 spectral data. The score plot of MS2 data correlated to the R1-substituent much the same as in paper I. The score plots of MS3 data (Fig. 20 (a) and (b)) visualised groups of objects related to all R2-R5 substituents but the 3-O-acyl and 4-O-acyl fucose that could be distinguished after removal of the compounds that contain 4-O-acetylated fucose (S7-S12) in a second PCA (Fig. 20 (c)).
37
3O
H
28
OH
CHO
O
OHOOC
HO
OO
OHOH2C
HO
HO
OH
OO
O
O
OHO
OOH
H3CO
OOH
CH3
O
O
R1
R2 Xyl
Rha
Fuc
GlcA
Gal
Quillaic acid
R3
R5
R4
A
B
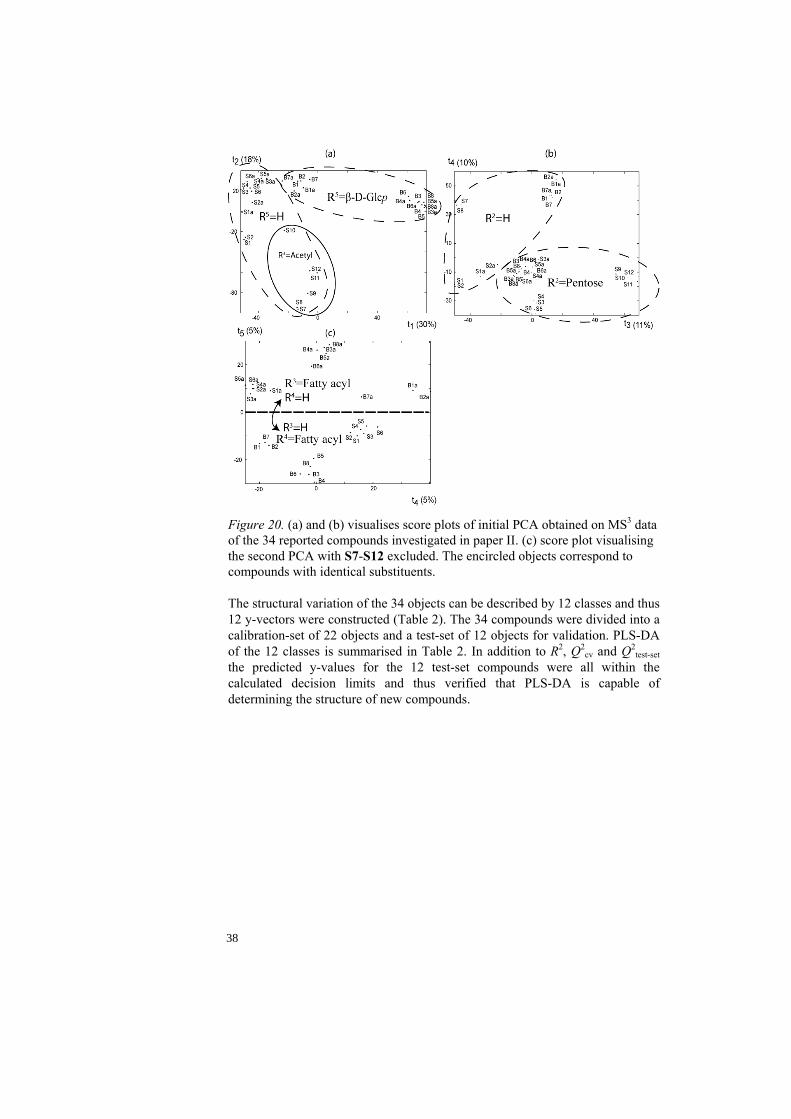
Figure 20. (a) and (b) visualises score plots of initial PCA obtained on MS3 data of the 34 reported compounds investigated in paper II. (c) score plot visualising the second PCA with S7-S12 excluded. The encircled objects correspond to compounds with identical substituents. The structural variation of the 34 objects can be described by 12 classes and thus 12 y-vectors were constructed (Table 2). The 34 compounds were divided into a calibration-set of 22 objects and a test-set of 12 objects for validation. PLS-DA of the 12 classes is summarised in Table 2. In addition to R2, Q2
cv and Q2test-set
the predicted y-values for the 12 test-set compounds were all within the calculated decision limits and thus verified that PLS-DA is capable of determining the structure of new compounds.
38
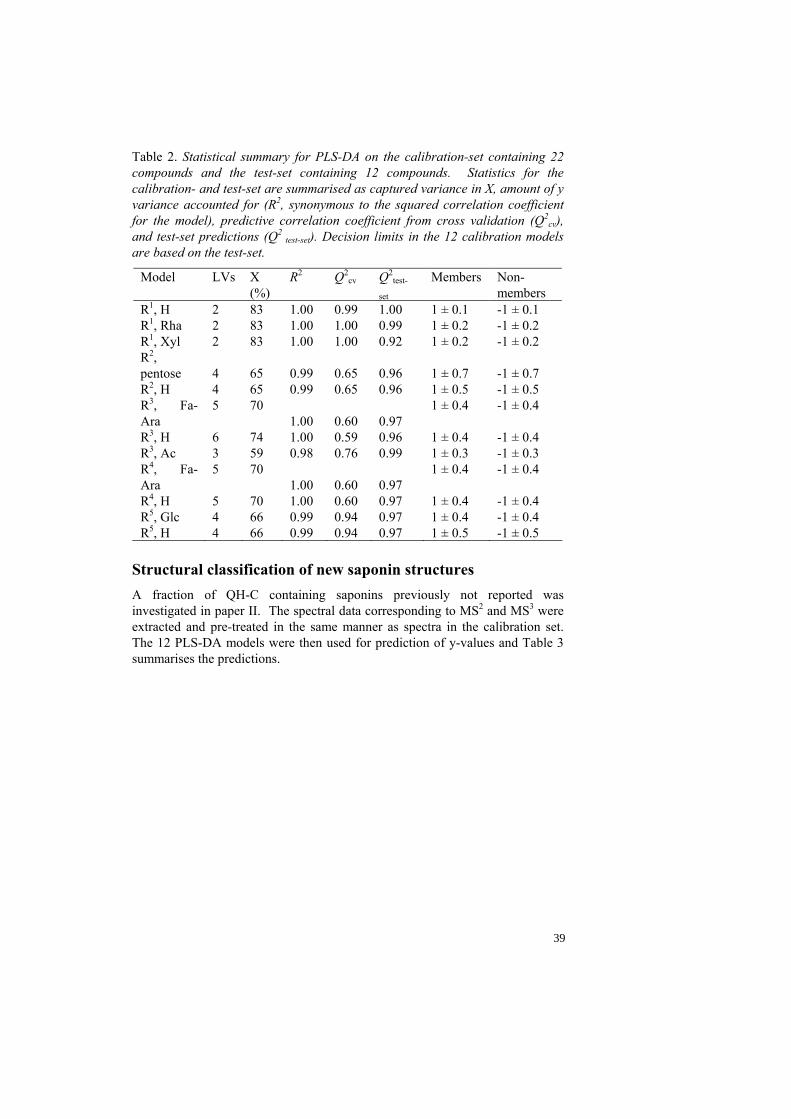
Table 2. Statistical summary for PLS-DA on the calibration-set containing 22 compounds and the test-set containing 12 compounds. Statistics for the calibration- and test-set are summarised as captured variance in X, amount of y variance accounted for (R2, synonymous to the squared correlation coefficient for the model), predictive correlation coefficient from cross validation (Q2
cv), and test-set predictions (Q2
test-set). Decision limits in the 12 calibration models are based on the test-set.
Model LVs X (%)
R2 Q2cv Q2
test-
set Members Non-
members R1, H 2 83 1.00 0.99 1.00 1 ± 0.1 -1 ± 0.1 R1, Rha 2 83 1.00 1.00 0.99 1 ± 0.2 -1 ± 0.2 R1, Xyl 2 83 1.00 1.00 0.92 1 ± 0.2 -1 ± 0.2 R2, pentose
4
65 0.99 0.65 0.96
1 ± 0.7
-1 ± 0.7
R2, H 4 65 0.99 0.65 0.96 1 ± 0.5 -1 ± 0.5 R3, Fa-Ara
5 70 1.00 0.60 0.97
1 ± 0.4 -1 ± 0.4
R3, H 6 74 1.00 0.59 0.96 1 ± 0.4 -1 ± 0.4 R3, Ac 3 59 0.98 0.76 0.99 1 ± 0.3 -1 ± 0.3 R4, Fa-Ara
5 70 1.00 0.60 0.97
1 ± 0.4 -1 ± 0.4
R4, H 5 70 1.00 0.60 0.97 1 ± 0.4 -1 ± 0.4 R5, Glc 4 66 0.99 0.94 0.97 1 ± 0.4 -1 ± 0.4 R5, H 4 66 0.99 0.94 0.97 1 ± 0.5 -1 ± 0.5
Structural classification of new saponin structures A fraction of QH-C containing saponins previously not reported was investigated in paper II. The spectral data corresponding to MS2 and MS3 were extracted and pre-treated in the same manner as spectra in the calibration set. The 12 PLS-DA models were then used for prediction of y-values and Table 3 summarises the predictions.
39
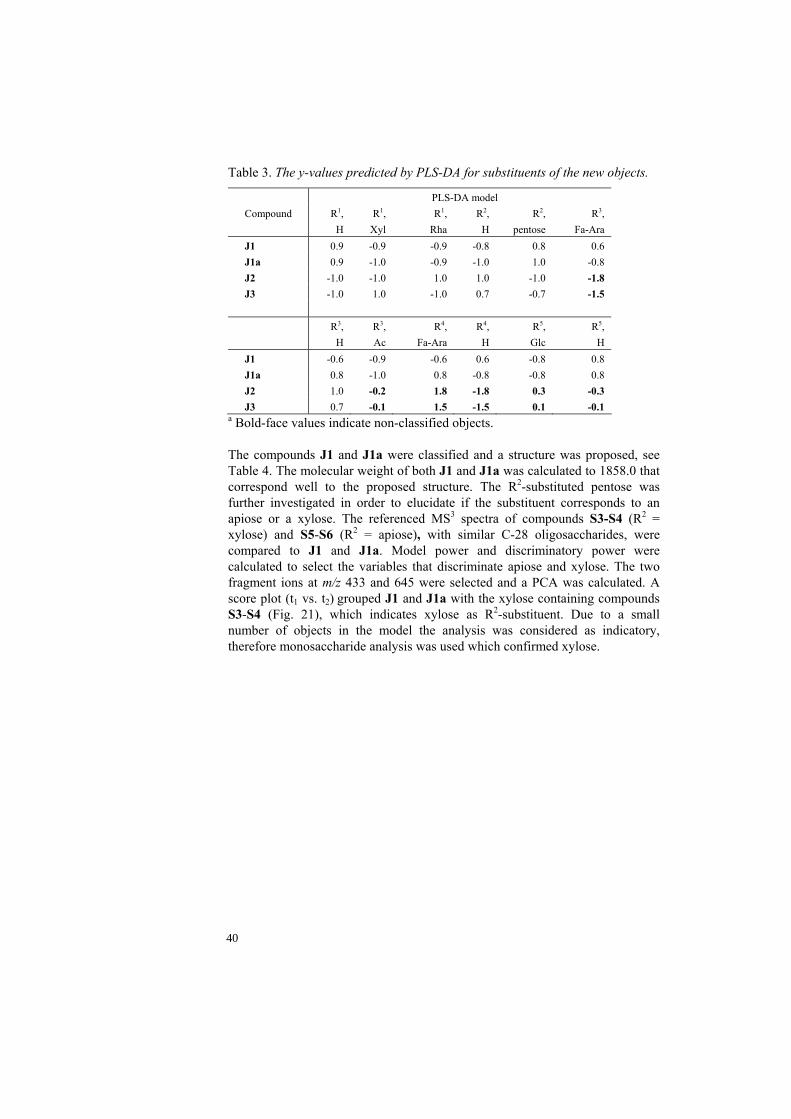
Table 3. The y-values predicted by PLS-DA for substituents of the new objects.
PLS-DA model Compound R1,
H R1,
Xyl R1,
Rha R2,
H R2,
pentose R3,
Fa-Ara J1 0.9 -0.9 -0.9 -0.8 0.8 0.6 J1a 0.9 -1.0 -0.9 -1.0 1.0 -0.8 J2 -1.0 -1.0 1.0 1.0 -1.0 -1.8 J3 -1.0 1.0 -1.0 0.7 -0.7 -1.5 R3,
H R3, Ac
R4, Fa-Ara
R4, H
R5, Glc
R5, H
J1 -0.6 -0.9 -0.6 0.6 -0.8 0.8 J1a 0.8 -1.0 0.8 -0.8 -0.8 0.8 J2 1.0 -0.2 1.8 -1.8 0.3 -0.3 J3 0.7 -0.1 1.5 -1.5 0.1 -0.1
a Bold-face values indicate non-classified objects. The compounds J1 and J1a were classified and a structure was proposed, see Table 4. The molecular weight of both J1 and J1a was calculated to 1858.0 that correspond well to the proposed structure. The R2-substituted pentose was further investigated in order to elucidate if the substituent corresponds to an apiose or a xylose. The referenced MS3 spectra of compounds S3-S4 (R2 = xylose) and S5-S6 (R2 = apiose), with similar C-28 oligosaccharides, were compared to J1 and J1a. Model power and discriminatory power were calculated to select the variables that discriminate apiose and xylose. The two fragment ions at m/z 433 and 645 were selected and a PCA was calculated. A score plot (t1 vs. t2) grouped J1 and J1a with the xylose containing compounds S3-S4 (Fig. 21), which indicates xylose as R2-substituent. Due to a small number of objects in the model the analysis was considered as indicatory, therefore monosaccharide analysis was used which confirmed xylose.
40
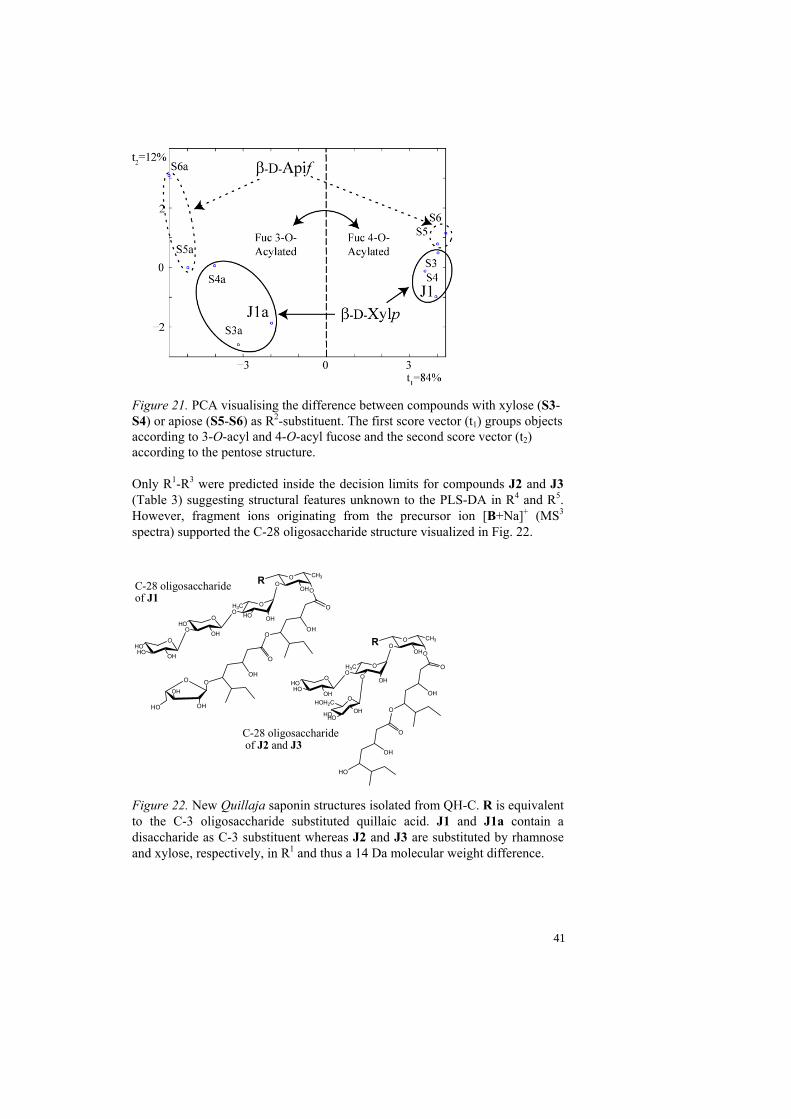
Figure 21. PCA visualising the difference between compounds with xylose (S3-S4) or apiose (S5-S6) as R2-substituent. The first score vector (t1) groups objects according to 3-O-acyl and 4-O-acyl fucose and the second score vector (t2) according to the pentose structure. Only R1-R3 were predicted inside the decision limits for compounds J2 and J3 (Table 3) suggesting structural features unknown to the PLS-DA in R4 and R5. However, fragment ions originating from the precursor ion [B+Na]+ (MS3 spectra) supported the C-28 oligosaccharide structure visualized in Fig. 22.
OO
OH
OH3CO HO OH
CH3
O
OHO
OOH
OH
O
O
O
OHO
OH
OH
O
HO
OHOHO
OH
C-28 oligosaccharide of J1
R
OO
OH
OH3CO O OH
CH3
O
OHOHO
OH OH
O
O
O
OH
HO
R
C-28 oligosaccharide of J2 and J3
O
HOHOOH
HOH2C
Figure 22. New Quillaja saponin structures isolated from QH-C. R is equivalent to the C-3 oligosaccharide substituted quillaic acid. J1 and J1a contain a disaccharide as C-3 substituent whereas J2 and J3 are substituted by rhamnose and xylose, respectively, in R1 and thus a 14 Da molecular weight difference.
41

Metabolic fingerprinting of Quillaja saponins in bark extract, Paper III
With the aim to authenticate or profile a complex saponin sample there is a need for adequate chromatographic resolution so that a sufficient number of saponin components can be detected and thus a “fingerprint” of a specific sample acquired. A bark sample originating from Quillaja saponaria Molina most likely contains hundreds of closely related saponin components. In order to distinguish between these structures a rather large amount of information is needed that can be structurally related, a chromatographic system supported by mass spectrometry detection is capable to provide this information. The use of a two step chromatographic method with mass spectrometric detection provides much needed resolving power but for a metabolic analysis structural information is of interest to confirm the structure as being a saponin. For this purpose isolation and fragmentation of ion species can be obtained and their building blocks can be elucidated by MS2. Previous investigations [32-34, 37] have utilised mass spectral data in both positive and negative ion mode. MS2 spectral data in negative mode provides more information about the nature of the fatty acyl domain in the C-28 oligosaccharide, compared to positive ion mode (Fig. 22), but less information about the C-3 oligosaccharide structure since there are no ions detected derived from cleavage of the glycosidic bond between the C-3 oligosaccharide and the quillaic acid. Thus variation in the C-3 and triterpene structures is not possible to allocate. The sensitivity is significantly better in positive ion mode which has also been reported [34]. MS2 spectra in positive ion mode provide essentially the same structural information as negative ion mode, occasionally including minor fragments indicating a 3-O- or 4-O-acyl substituted fucose (Fig. 22). In addition, the C-3 oligosaccharide and the C-28 oligosaccharide are cleaved off forming the fragment ions [A+Na]+ and [B+Na]+ that allow for the mass of the triterpene, the C-3- and the C-28-oligosaccharide to be determined separately. For these reasons positive ion mode was chosen for detection in the metabolic fingerprinting study. Collecting MS/MS data by manual selection of generated ion species is a very time consuming task. Therefore, using the instrumental options for surveying ions (‘Auto-MS/MS’ mode) in a specified spectral region, to make isolation and fragmentation of ions as compounds elute, is a much more attractive approach. This, however, requires the scan speed of the instrument and the chromatographic separation of compounds to match so that the instrument has sufficient time for detection and recording. Furthermore, the chromatographic properties of saponins on a C-18 phase column have been reported to vary with methanol or acetonitrile as organic modifier [40, 80] why this was further studied. C-18 phase columns were chosen for this investigation since the eluent is appropriate for mass spectrometry detection and supports the ionisation process.
42

Recently, a method with a parallel approach using two consecutive hydrophilic interaction liquid chromatography (HILC) columns was reported [37] but except from this study no previously reported method provided chromatographic resolution adequate for a metabolic fingerprint study. The metabolic fingerprinting study was carried out on a bark extract obtained from Berghausen (Cincinnati, OH, USA). The extract was separated by HPLC using a C-18-phase column and the selectivity was compared between eluents containing water mixed with methanol or acetonitrile at near neutral or acidic pH. The selectivity differed with type of organic and acidic modifiers whereas the overall separation is similar between the four investigated eluents, but somewhat enhanced by the use of methanol at a near neutral pH according to the ion map. To further increase the chromatographic resolution a second HPLC step was introduced to achieve a reasonably short chromatographic overall method. An Ascentis® Express 3 × 50 mm column was applied with a 20 minutes long gradient program. Combinations of the above eluents were tested and a gradient program with water and methanol at near neutral pH in the first step followed by acetonitrile and water at acidic pH was found to provide adequate separation (Fig. 23(c)). An effect of a two step chromatographic procedure is that compounds with the fucose 3-O- and 4-O-acyl migration can be detected twice since both HPLC-steps separate compounds containing these structural features. For this reason a size exclusion based separation could be preferable as a first step separation, nonetheless, application of such a technique was problematic which may possibly be linked to the micelle forming properties of saponins. However, much of the problem with double detection of the fucose 3-O- and 4-O-acyl migration products can be avoided by setting the threshold of the mass spectrometer for peak selection at a level where only some of the major compounds have ion abundances large enough to be detected twice.
The obtained information provides a fingerprint consisting of two chromatographic retention times (Fraction number in first HPLC step and Rt
in second HPLC step) and mass spectral data (MS1, MS2) in positive ion mode, from which the mass of the C-3 oligosaccharide, the triterpene and the mass of the C-28 oligosaccharide is derived. During the investigation this fingerprinting information proved suitable to discern more than 400 individual saponin components. Within these observations 43 [B+Na]+ ions and 4 potential triterpene structures (468, 500, 514 and 648 Da) were found with a mass previously not investigated. A rather large amount of structurally related information is needed for meaningful comparison of bark samples, by visual inspection. The most common plots from mass spectrometric investigations are visualized in Fig. 23(a); ultraviolet light (UV), total ion current (TIC) and base peak chromatogram (BPC). These means of visualisation are not very helpful to evaluate samples with the intention to spot metabolic variation due to insufficient information. An ion plot of saponin components based on their Rt-
43

value obtained from one HPLC step as coordinate in the first dimension and m/z value of the [M+Na]+ ion as a coordinate in the second dimension provides a more powerful visualisation of the complexity of biological samples (Fig. 23(b)). Ion plots can be useful for a coarse comparison to see if all major saponins are represented in the investigated specimen. A more detailed plot is achieved when two separation steps are included and the mass of the [M+Na]+ ion with encoded structural information from MS2 or MS3 spectral data. In figure 23(c) two chromatographic steps are plotted as coordinates in the first two dimensions and the m/z value of the [M+Na]+ ion as a third dimension. Information related to the mass of the triterpene has been encoded for that was obtained from MS2 spectra as the m/z difference between the A and the B fragments.
44

Figure 23. Different plots visualising separation profiles of a Quillaja saponin bark extract by HPLC (methanol: aq NH4OAc (30 mM) followed by (acetonitrile: aq TFA (0.1%)). (a) UV chromatogram at 210 nm with the corresponding total ion current (TIC) and base peak (BPC) chromatograms. The information from these plots is hard to relate to single saponin components or the composition thereof. (b) ion map visualizing the Rt vs. m/z of the [M+Na]+ of major saponin components. (c) a scatter plot with two chromatographic steps vs. m/z of the [M+Na]+ ion. The triterpene structure of each [M+Na]+ is shown and explained. The new structures of 500 and 514 Da may correspond to an additional double bond of the triterpene structures quillaic acid, 22β-OH and phytolaccagenic acid, respectively.
45

Profiling new saponins by LC-MSn spectral data, Paper IV
The ability to investigate saponin components by LC-MS data is viable for the investigation of large sets of unknown structures. In paper IV the multivariate method previously reported has been adapted to predict samples based on LC-MS spectral data. The larger inconsistency within LC-MS data compared to the spectral data previously investigated decreased the predictive capability of the PLS-DA models especially for the C-28 oligosaccharide (MS3 spectra). Therefore, scaling of data was modified and the spectral information correlated to the C-28 oligosaccharide (MS3) was extended to not only include the referenced spectral data but also the lower part (m/z 300-700) of the original mass spectrum containing end fragments (from the non-reducing end). The detected fragments cleaved off from the C-28 oligosaccharide are fucosyl residue fragments (from the reducing end) and end fragments in +MS3. The fucosyl residue fragments have previously been used to correlate structural features by PLS-DA, as were investigated in paper I and paper II. Due to the difference in relative intensity between the two types of fragments, correlation by PLS-DA provides an advantage for the fucosyl residue fragments. Therefore, the referencing procedure reported in paper I is necessary for obtaining a correlation between mass spectral data and structural features. However, when the referencing procedure is carried out the end fragments lose their correlation to type of substituent. Therefore, combining referenced mass spectral data with the part of the original mass spectrum that contains mainly the end fragments allows for correlation between structural features and fragment ions that correspond to both the reducing end and non-reducing end. PLS-DA models were based on data of isolated compounds previously acquired in paper I and paper II listed in Fig. 3 and in addition the four reported structures J1, J1a, J2 and J3 from paper II. A bark extract of Quillaja saponaria Molina was subjected to two consecutive HPLC (C-18 phase) steps as previously described in paper III. A gradient program with water and methanol at near neutral pH was used to fractionate the injected material in the first HPLC step after which the 40 fractions were subjected to a second gradient program where MS1, MS2 and MS3 spectral data were recorded. A set of 35 compounds, recognized by spectral interpretation as structures previously investigated, were selected and used to test the predictive capabilities of the PLS-DA models. Furthermore, 8 saponins with a new C-28 oligosaccharide structure were predicted by PLS-DA and the results were used as a starting point for further spectral interpretation. The new set of data (X- matrix) was constructed by merging the original spectral data of the spectral region between m/z 300-700 with referenced data of the region -600-(-10). Data was scaled by first setting the maximum intensity peak to 1 and then standard normal variate correction (SNV) was applied. 19 PLS-DA models were obtained by correlating the spectral data to the created y-
46
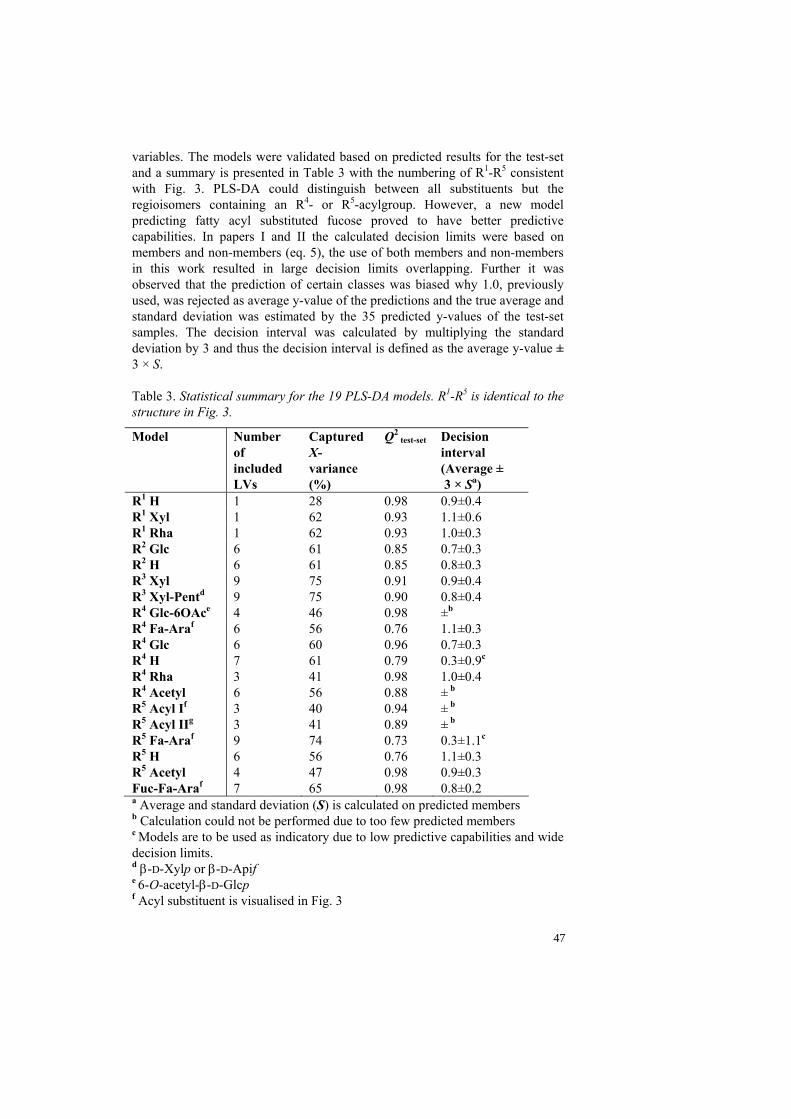
variables. The models were validated based on predicted results for the test-set and a summary is presented in Table 3 with the numbering of R1-R5 consistent with Fig. 3. PLS-DA could distinguish between all substituents but the regioisomers containing an R4- or R5-acylgroup. However, a new model predicting fatty acyl substituted fucose proved to have better predictive capabilities. In papers I and II the calculated decision limits were based on members and non-members (eq. 5), the use of both members and non-members in this work resulted in large decision limits overlapping. Further it was observed that the prediction of certain classes was biased why 1.0, previously used, was rejected as average y-value of the predictions and the true average and standard deviation was estimated by the 35 predicted y-values of the test-set samples. The decision interval was calculated by multiplying the standard deviation by 3 and thus the decision interval is defined as the average y-value ± 3 × S. Table 3. Statistical summary for the 19 PLS-DA models. R1-R5 is identical to the structure in Fig. 3.
Model Number of included LVs
Captured X-variance (%)
Q2 test-set Decision
interval (Average ± 3 × Sa)
R1 H 1 28 0.98 0.9±0.4 R1 Xyl 1 62 0.93 1.1±0.6 R1 Rha 1 62 0.93 1.0±0.3 R2 Glc 6 61 0.85 0.7±0.3 R2 H 6 61 0.85 0.8±0.3 R3 Xyl 9 75 0.91 0.9±0.4 R3 Xyl-Pentd 9 75 0.90 0.8±0.4 R4 Glc-6OAce 4 46 0.98 ±b R4 Fa-Araf 6 56 0.76 1.1±0.3 R4 Glc 6 60 0.96 0.7±0.3 R4 H 7 61 0.79 0.3±0.9c R4 Rha 3 41 0.98 1.0±0.4 R4 Acetyl 6 56 0.88 ± b R5 Acyl If 3 40 0.94 ± b R5 Acyl IIg 3 41 0.89 ± b R5 Fa-Araf 9 74 0.73 0.3±1.1c R5 H 6 56 0.76 1.1±0.3 R5 Acetyl 4 47 0.98 0.9±0.3 Fuc-Fa-Araf 7 65 0.98 0.8±0.2 a Average and standard deviation (S) is calculated on predicted members b Calculation could not be performed due to too few predicted members c Models are to be used as indicatory due to low predictive capabilities and wide decision limits. d β-D-Xylp or β-D-Apif
e 6-O-acetyl-β-D-Glcp
f Acyl substituent is visualised in Fig. 3
47
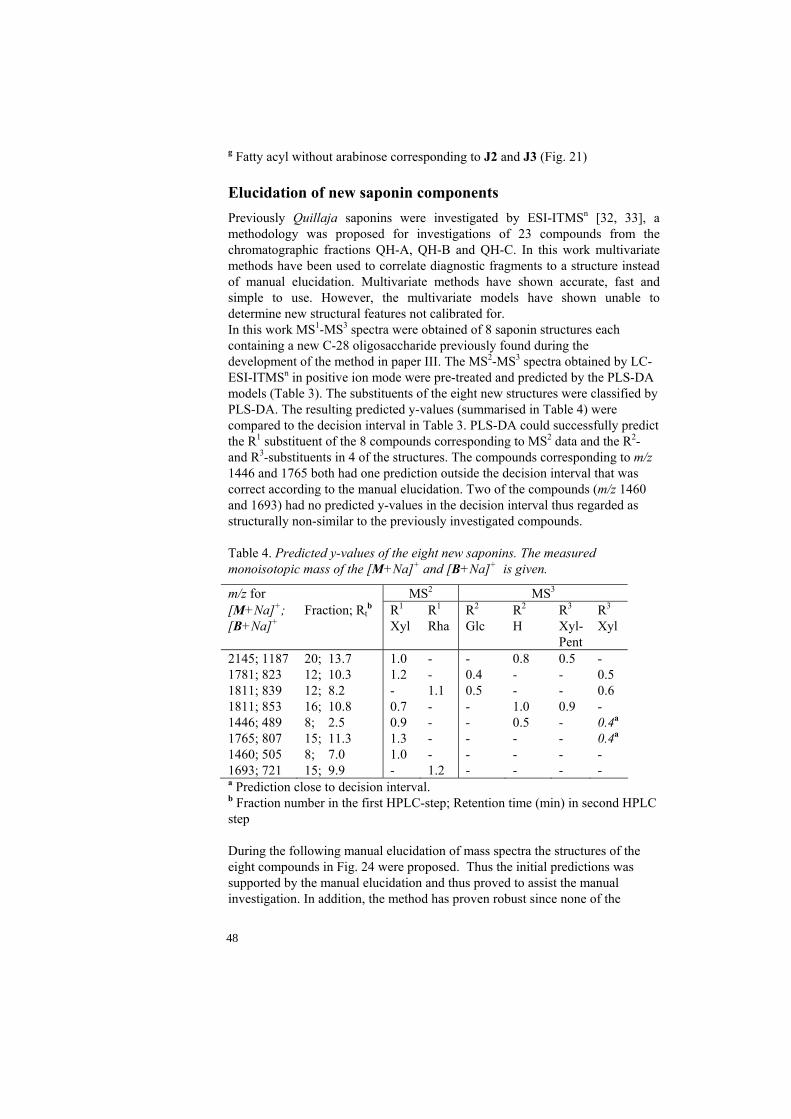
g Fatty acyl without arabinose corresponding to J2 and J3 (Fig. 21)
Elucidation of new saponin components Previously Quillaja saponins were investigated by ESI-ITMSn [32, 33], a methodology was proposed for investigations of 23 compounds from the chromatographic fractions QH-A, QH-B and QH-C. In this work multivariate methods have been used to correlate diagnostic fragments to a structure instead of manual elucidation. Multivariate methods have shown accurate, fast and simple to use. However, the multivariate models have shown unable to determine new structural features not calibrated for. In this work MS1-MS3 spectra were obtained of 8 saponin structures each containing a new C-28 oligosaccharide previously found during the development of the method in paper III. The MS2-MS3 spectra obtained by LC-ESI-ITMSn in positive ion mode were pre-treated and predicted by the PLS-DA models (Table 3). The substituents of the eight new structures were classified by PLS-DA. The resulting predicted y-values (summarised in Table 4) were compared to the decision interval in Table 3. PLS-DA could successfully predict the R1 substituent of the 8 compounds corresponding to MS2 data and the R2- and R3-substituents in 4 of the structures. The compounds corresponding to m/z 1446 and 1765 both had one prediction outside the decision interval that was correct according to the manual elucidation. Two of the compounds (m/z 1460 and 1693) had no predicted y-values in the decision interval thus regarded as structurally non-similar to the previously investigated compounds. Table 4. Predicted y-values of the eight new saponins. The measured monoisotopic mass of the [M+Na]+ and [B+Na]+ is given.
m/z for MS2 MS3 [M+Na]+; [B+Na]+
Fraction; Rtb R1
Xyl R1 Rha
R2 Glc
R2 H
R3 Xyl-Pent
R3 Xyl
2145; 1187 20; 13.7 1.0 - - 0.8 0.5 - 1781; 823 12; 10.3 1.2 - 0.4 - - 0.5 1811; 839 12; 8.2 - 1.1 0.5 - - 0.6 1811; 853 16; 10.8 0.7 - - 1.0 0.9 - 1446; 489 8; 2.5 0.9 - - 0.5 - 0.4a 1765; 807 15; 11.3 1.3 - - - - 0.4a 1460; 505 8; 7.0 1.0 - - - - - 1693; 721 15; 9.9 - 1.2 - - - - a Prediction close to decision interval. b Fraction number in the first HPLC-step; Retention time (min) in second HPLC step During the following manual elucidation of mass spectra the structures of the eight compounds in Fig. 24 were proposed. Thus the initial predictions was supported by the manual elucidation and thus proved to assist the manual investigation. In addition, the method has proven robust since none of the
48

substituents predicted during this work has been miss-classified or provided structural information contrary to results from the manual elucidation.
49

Figure 24. Tentative structures of the eight C-28 oligosaccharides studied. The mass of the [B+Na]+ ion is given together with some diagnostic sodiated fragments in positive ion mode MS3 spectra. The pentose substituted at the non-reducing end of m/z 853 and 1187are shown with a xylose but could also be apiose.
50

Conclusions
A method for classification of the structural features of 58 Quillaja saponin compounds has been developed. The method utilises data from electrospray ionisation multiple stage mass spectrometry followed by multivariate analysis. The multivariate analyses have been used to correlate individual fragment masses with certain substituents. A referencing procedure has been developed that is critical for creating a mass pattern that can be correlated to a certain substituent by the multivariate analysis. The method is accurate, fast and easy to use. Metabolic fingerprinting of a Quillaja bark extract was demonstrated. Data was acquired by a two step HPLC separation followed by multiple stage mass spectrometry. The fingerprint information was based on MS1 and MS2 positive ion mode spectral data, from which the mass of the C-3 oligosaccharide, the triterpene and the mass of the C-28 oligosaccharide could be derived. As a result of the investigation more than 400 individual saponin components were recognised. Among the detected saponin components new structural features were found corresponding to 43 C-28 oligosaccharide structures and 4 potential triterpene structures. A multivariate method was developed for structural classification based on liquid chromatography mass spectrometry data and classification of 8 of the 43 new C-28 structures was carried out. None of the predictions has miss-classified a structural feature, thus the methodology has proven robust for investigating glyco-conjugate metabolites in complex mixtures. The application of the method outlined in this thesis is for Quillaja saponins. However, it could also be applied to families of saponins from other plants or to other glycoconjugates with similar different substituents to a basic structure. Moreover, in total 12 new Quillaja saponin structures have been elucidated based on multiple stage mass spectrometry in positive ion mode. The reported structures have added new structural features to those of previously reported structures.
Outlook
Mass spectrometry has shown to be a fast and accurate method when combined with multivariate analysis for profiling saponins in complex mixtures. Therefore it is of importance to further study the mass spectrometric fragmentation pathways of new Quillaja saponin structures to make complete profiling studies of biological samples or chromatographic fractions possible. Profiling saponin components in biological samples is of importance to metabolomic studies on Quillaja saponaria Molina and in an extended view to the selection of biological material for further refinement to chromatographic
51

fractions with desired properties e.g. high adjuvant activity and low toxicity. Furthermore, the structure-activity relationship can be clarified by comparing saponin components in different chromatographic fractions with tested toxicity. Finally, the proposed method could be attractive for applications in many other areas that involve carbohydrates, which play fundamental roles in the form of e.g. glycoproteins, glycolipids and polysaccharides in the cell of microbes, plants and animals.
52

REFERENCES
1. Hostettmann, K. and A. Marston, Saponins. 1995, Cambridge: University of cambridge.
2. Shi, J., et al., Saponins from edible legumes: chemistry, processing, and health benefits. J Med Food, 2004. 7(1): p. 67-78.
3. Özlem, G. and G. Mazza, Saponins: Properties, Applications and Processing. Critical reviews in food and nutrition, 2007. 47: p. 231-258.
4. Francis, G., et al., The biological action of saponins in animal systems: a review. British Journal of Nutrition, 2002. 88(06): p. 587-605.
5. Lacaille-Dubois, M.A. and H. Wagner, Areview of the biological and pharmacological activities of saponins. Phytomedicine, 1996. 2: p. 363-368.
6. Milgate, J. and D.C.K. Roberts, The nutritional & biological significance of saponins. Nutrition Research, 1995. 15(8): p. 1223-1249.
7. Kensil, C.R., et al., Separation and characterization of saponins with adjuvant activity from Quillaja saponaria Molina cortex. The Journal of Immunology, 1991. 146(2): p. 431-437.
8. Campbell, J.B. and Y. Peerbaye, Saponin. Research in Immunology, 1992. 143(5): p. 526-530.
9. Barr, I.G., A. Sjölander, and J.C. Cox, ISCOMs and other saponin based adjuvants. Advanced drug delivery reviews, 1998. 32(3): p. 247-271.
10. Bomford, R., et al., Adjuvanticity and ISCOM formation by structurally diverse saponins. Vaccine, 1992. 10(9): p. 572-577.
11. Dalsgaard, A study of the isolation and characterization of the saponin Quil A. Evaluation of its adjuvant activity, with a special reference to the application in the vaccination of cattle against foot-and-mouth disease. Acta Vet Scand Suppl, 1978(69): p. 7-40.
12. Lövgren, K. and B. Morein, The requirement of lipids for the formation of immunostimulating complexes (iscoms). Biotechnol Appl Biochem, 1988. 10(2): p. 161-72.
13. Morein, B., et al., Martix with immunomodulating activity. Patent application WO 89/00528, 1989.
14. Morein, B., et al., Iscom, a novel structure for antigenic presentation of membrane proteins from enveloped viruses. Nature, 1984. 308(5958): p. 457-60.
15. Rönnberg, B., M. Fekadu, and B. Morein, Adjuvant activity of non-toxic Quillaja saponaria Molina components for use in ISCOM matrix. Vaccine, 1995. 13(14): p. 1375-82.
16. Hu, K.-F., et al., The immunomodulating properties of human respiratory syncytial virus and immunostimulating complexes containing Quillaja saponin components QH-A, QH-C and ISCOPREPTM703. FEMS Immunology and Medical Microbiology, 2005. 43(2): p. 269-276.
53

17. Dalsgaard, K., et al., Compounds with adjuvant activity, WO, Editor. 1995.
18. Sjölander, A., et al., Immune responses to ISCOM formulations in animal and primate models. Vaccine, 2001. 19(17-19): p. 2661-5.
19. Sanders, M.T., et al., ISCOM-based vaccines: the second decade. Immunology and cell biology, 2005. 83(2): p. 119-28.
20. Dalsgaard, K., Thin layer chromatographic fingerprinting of commercially available saponins. Dansk Tisddkrift for farmaci, 1970. 44: p. 327-331.
21. Guo, S.J. and L. Kenne, Structural studies of triterpenoid saponins with new acyl components from Quillaja saponaria Molina. Phytochemistry, 2000. 55(5): p. 419-428.
22. Nord, L.I. and L. Kenne, Novel acetylated triterpenoid saponins in a chromatographic fraction from Quillaja saponaria Molina. Carbohydrate Research, 2000. 329(4): p. 817-829.
23. van Setten, D.C., et al., Glycosyl Compositions and Structural Characteristics of the Potential Immuno-adjuvant Active Saponins in the Quillaja saponaria Molina Extract Quil A. Rapid Communications in Mass Spectrometry, 1995. 9: p. 660-666.
24. van Setten, D.C., et al., Ion Trap Multiple-Stage Tandem Mass Spectrometry as a Pre-NMR Tool in the Structure Elucidation of Saponins. Phytochemical Analysis, 2000. 11(3): p. 190-198.
25. Varshney, I.P., M.F.A. Beg, and S. AVB, Fitoterapia, 1985: p. 254-256.
26. Guo, S., Structural Studies of Saponins from Quillaja saponaria Molina, in Chemistry. 2000, Swedish University of Agricultural Sciences: Uppsala.
27. Guo, S.J., et al., Triterpenoid saponins containing an acetylated branched D-fucosyl residue from Quillaja saponaria Molina. Phytochemistry, 2000. 53(8): p. 861-868.
28. Guo, S.J. and L. Kenne, Characterization of some O-acetylated saponins from Quillaja saponaria Molina. Phytochemistry, 2000. 54(6): p. 615-623.
29. Guo, S.J., et al., Triterpenoid saponins from Quillaja saponaria. Phytochemistry, 1998. 48(1): p. 175-180.
30. Nord, L.I. and L. Kenne, Separation and structural analysis of saponins in a bark extract from Quillaja saponaria Molina. Carbohydrate Research, 1999. 320(1-2): p. 70-81.
31. Nyberg, N.T., et al., Separation and structural analysis of some saponins from Quillaja saponaria Molina. Carbohydrate Research, 2000. 323: p. 87-97.
32. Broberg, S., PhD Thesis, "Studies of oligo- and polysaccharides by MALDI-TOF and ESI-IT multiple stage mass spectrometry". Swedish university of agricultural sciences, Uppsala., 2004.
33. Broberg, S., L.I. Nord, and L. Kenne, Oligosaccharide sequences in Quillaja saponins by electrospray ionization ion trap multiple-stage mass spectrometry. Journal of Mass Spectrometry, 2004. 39(6): p. 691-701.
54

34. Kite, G.C., M.J.R. Howes, and M.S.J. Simmonds, Metabolomic analysis of saponins in crude extracts of Quillaja saponaria by liquid chromatography/mass spectrometry for product authentication. Rapid Communications in Mass Spectrometry, 2004. 18(23): p. 2859-2870.
35. Domon, B. and C.E. Costello, A Systematic Nomenclature For Carbohydrate Fragmentations in FAB-MS/MS Spectra of Glycoconjugates. Glycoconjugate Journal, 1988. 5(4): p. 397-409.
36. Zaia, J., Mass spectrometry of oligosaccharides. Mass Spectrom Rev, 2004. 23(3): p. 161-227.
37. Wang, Y., X. Lu, and G. Xu, Development of a comprehensive two-dimensional hydrophilic interaction chromatography/quadrupole time-of-flight mass spectrometry system and its application in separation and identification of saponins from Quillaja saponaria. Journal of Chromatography A, 2008. 1181(1-2): p. 51-59.
38. Nord, L., Structural Analysis of Saponins from Quillaja saponaria Molina and methods for Structure-Property Relationship Studies, in Chemistry. 2000, Swedish University of Agricultural Sciences: Uppsala.
39. Nord, L.I., L. Kenne, and S.P. Jacobsson, Multivariate analysis of 1H NMR spectra for saponins from Quillaja saponaria Molina. Analytica Chimica Acta, 2001. 446(1-2): p. 199-209.
40. Nyberg, N., PhD Thesis "Structural Analysis of Saponins from Quillaja saponaria and the use of solid phase extraction coupled to an NMR flow-probe". 2002.
41. Oleszek, W. and Z. Bialy, Chromatographic determination of plant saponins--An update (2002-2005). Journal of Chromatography A, 2006. 1112(1-2): p. 78-91.
42. Oleszek, W.A., Chromatographic determination of plant saponins. Journal of Chromatography A, 2002. 967(1): p. 147-162.
43. Gingras, A.-C., et al., Analysis of protein complexes using mass spectrometry. Nat Rev Mol Cell Biol, 2007. 8(8): p. 645-654.
44. Gramolini, A.O., S.M. Peterman, and T. Kislinger, Mass Spectrometry-based Proteomics: A Useful Tool for Biomarker Discovery? Clin Pharmacol Ther, 2008.
45. Kostiainen, R., et al., Liquid chromatography/atmospheric pressure ionization-mass spectrometry in drug metabolism studies. Journal of Mass Spectrometry, 2003. 38(4): p. 357-372.
46. Prakash, C., C.L. Shaffer, and A. Nedderman, Analytical strategies for identifying drug metabolites. Mass Spectrometry Reviews, 2007. 26(3): p. 340-369.
47. Aebersold, R. and M. Mann, Mass spectrometry-based proteomics. Nature, 2003. 422(6928): p. 198-207.
48. Mahal, L.K., Glycomics: Towards Bioinformatic Approaches to Understanding Glycosylation. Anti-Cancer Agents in Medicinal Chemistry (Formerly Current Medicinal Chemistry - Anti-Cancer Agents), 2008. 8: p. 37-51.
49. Watson, J.T. and O.D. Sparkman, Introduction to mass spectromery. 4 ed. 2007, Chichester: Wiley.
55
50. Barber, M., et al., Fast atom bombardment mass spectrometry of the angiotensin peptides. Biomed Mass Spectrom, 1982. 9(5): p. 208-14.
51. Fenn, J.B., et al., Electrospray Ionization for Mass Spectrometry of Large Biomolecules. Science, 1989. 246(4926): p. 64-71.
52. Karas, M. and F. Hillenkamp, Laser desorption ionization of proteins with molecular masses exceeding 10,000 daltons. Anal Chem, 1988. 60(20): p. 2299-301.
53. Sundqvist, B., et al., Californium-252 plasma desorption time of flight mass spectroscopy of proteins. Biomed Mass Spectrom, 1984. 11(5): p. 242-57.
54. Sundqvist, B., et al., Molecular weight determinations of proteins by californium plasma desorption mass spectrometry. Science, 1984. 226(4675): p. 696-8.
55. Huang, E.C., et al., Atmospheric pressure ionization mass spectrometry. Detection for the separation sciences. Anal. Chem., 1990. 62(13): p. 713-725.
56. Cech, N.B. and C.G. Enke, Practical implications of some recent studies in electrospray ionization fundamentals. Mass Spectrom Rev, 2001. 20(6): p. 362-87.
57. Gaskell, S.J., Electrospray: principles and practice. Journal of mass spectrometry, 1997. 32: p. 677-688.
58. Kebarle, P., A brief overview of the present status of the mechanisms involved in electrospray mass spectrometry. J Mass Spectrom, 2000. 35(7): p. 804-17.
59. Cole, R., Electrospray ionisation mass spectrometry. Fundamentals, Instrumentation & Applications. 1997, New York: John Wiley & Sons.
60. Dams, R., et al., Urine drug testing for opioids, cocaine, and metabolites by direct injection liquid chromatography/tandem mass spectrometry. Rapid Communications in Mass Spectrometry, 2003. 17(14): p. 1665-1670.
61. Carroll, D.I., et al., Atmospheric pressure ionization mass spectrometry. Corona discharge ion source for use in a liquid chromatograph-mass spectrometer-computer analytical system. Anal. Chem., 1975. 47(14): p. 2369-2373.
62. Yanxuan Cai, D.K.O.M.A.C.B., II, Advantages of atmospheric pressure photoionization mass spectrometry in support of drug discovery. Rapid Communications in Mass Spectrometry, 2005. 19(12): p. 1717-1724.
63. Harvey, D.J., Matrix-assisted laser desorption/ionization mass spectrometry of carbohydrates. Mass Spectrom Rev, 1999. 18(6): p. 349-450.
64. Harvey, D.J., Analysis of carbohydrates and glycoconjugates by matrix-assisted laser desorption/ionization mass spectrometry: An update covering the period 1999-2000. Mass Spectrometry Reviews, 2006. 25(4): p. 595-662.
65. Harvey, D.J., Analysis of carbohydrates and glycoconjugates by matrix-assisted laser desorption/ionization mass spectrometry: An
56

update covering the period 2001-2002. Mass Spectrometry Reviews, 2008. 27(2): p. 125-201.
66. Strupat, K., M. Karas, and F. Hillenkamp, 2,5-Dihydroxybenzoic acid: a new matrix for laser desorption--ionization mass spectrometry. International Journal of Mass Spectrometry and Ion Processes, 1991. 111: p. 89-102.
67. Papac, D.I., A. Wong, and A.J.S. Jones, Analysis of Acidic Oligosaccharides and Glycopeptides by Matrix-Assisted Laser Desorption/Ionization Time-of-Flight Mass Spectrometry. Anal. Chem., 1996. 68(18): p. 3215-3223.
68. Eriksson, J. and D. Fenyo, Improving the success rate of proteome analysis by modeling protein-abundance distributions and experimental designs. Nat Biotech, 2007. 25(6): p. 651-655.
69. March, R.E., An introduction to quadrupole ion trap mass spectrometry. Journal of Mass Spectrometry, 1997. 32: p. 351-369.
70. Mamyrin, B.A., Time-of-flight mass spectrometry (concepts, achievements, and prospects). International Journal of Mass Spectrometry, 2001. 206(3): p. 251-266.
71. А., М.Б., et al., Масс-рефлектрон. Новый способ разделения ионов. ЖЭТФ, 1973. Т. 64(11): p. с. 82-88.
72. Mamyrin, B.A., Laser assisted reflectron time-of-flight mass spectrometry. International Journal of Mass Spectrometry and Ion Processes, 1994. 131: p. 1-19.
73. Wold, S., K. Esbensen, and P. Geladi, Principal Component Analysis. Chemometrics and Intelligent Laboratory Systems, 1987. 2(1-3): p. 37-52.
74. Geladi, P. and B.R. Kowalski, Partial Least-Squares Regression - a Tutorial. Analytica Chimica Acta, 1986. 185: p. 1-17.
75. Brereton, R.G., Chemometrics "Data analysis for the laboratory and chemical plant". New York: John Wiley & Sons, 2003.
76. Rubingh, C., et al., Assessing the performance of statistical validation tools for megavariate metabolomics data. Metabolomics, 2006. 2(2): p. 53-61.
77. Geladi, P., M. Manley, and T. Lestander, Scatter plotting in multivariate data analysis. Journal of Chemometrics, 2003. 17(8-9): p. 503-511.
78. Eriksson, L., et al., Multi- and Megavariate Data Analysis. 2006, Umeå: Umetrics.
79. Franke, R., et al., Multivariate Data Analysis of Chemical and Biological Data, in Chemometric Methods in Molecular Design, W. Dr. Han van de, Editor. 2008. p. 113-308.
80. Kite, G.C., E.A. Porter, and M.S. Simmonds, Chromatographic behaviour of steroidal saponins studied by high-performance liquid chromatography-mass spectrometry. J Chromatogr A, 2007. 1148(2): p. 177-83.
57

Acknowledgements
Financial support was provided by grants from the Swedish Research Council. A thesis is not made by it self or by one person alone, therefore I am much obliged for the help and support from first and foremost Professor Lennart Kenne for introducing me to science in general and natural products in particular and for all the knowledge and time shared in invaluable discussions. I am very grateful for the opportunity I have had to take part of this process with an as enthusiastic supervisor as you. Dr. Lars Nord for being my much appreciated assistant supervisor and guide throughout this work with a wholehearted engagement. Your optimistic approach to this journey has been of great value. I would like to thank all my present and former colleagues at the Department of Chemistry for the pleasant environment during these five years, there are some people whom I would like to dedicate a special thanks to: Associate Professor Jan Eriksson for sharing his time and wisdom in the area of mass spectrometry and for being much supportive in writing this thesis. Suresh Gohil, without whom this thesis ever would have been written. Without your support I would probably have surrendered to the all mighty evilness that sometimes lurks within the field of mass spectrometry. I am very grateful for all assistance you have given. Rolf Andersson and Corin Sandström for help with the NMR machines. Bernt Andersson and Anders Sandström for a much needed helping hand in teaching our undergraduate students. Lena Andersson for help with all administration and for providing a nice and much appreciated atmosphere to the department. Dr. Sussana Broberg for preceding my projects with a much utilisable and thorough investigation within the saponin field. Dr. Elena Ossipova for conversations, both on scientific matters and not so scientific matters. Associate Professor Anders Broberg and Dr. Anton Pohanka for sharing much practical knowledge about lab works. Joris Van Schaik my “tjockis” fishing buddy and colleague for great support and friendship during these years.
58

My family, my mother and father Elisabeth and Olle and my two brothers Anders and Per for always being supportive and being the foundation of my life together with my grandfather Arne, to whom I am grateful for having shared so much with me ever since I was little. Karin, my love and big support during not only the making of this thesis but also my licentiate thesis, for all time we have spent together and will spend together.
59
