methods for establishing a surveillance system for ... · pandav cs,a ahmed fu,e joshi pp,f meera...
TRANSCRIPT

461Bulletin of the World Health Organization | June 2006, 84 (6)
Objective To establish a surveillance network for cardiovascular diseases (CVD) risk factors in industrial settings and estimate the risk factor burden using standardized tools.Methods We conducted a baseline cross-sectional survey (as part of a CVD surveillance programme) of industrial populations from 10 companies across India, situated in close proximity to medical colleges that served as study centres. The study subjects were employees (selected by age and sex stratified random sampling) and their family members. Information on behavioural, clinical and biochemical determinants was obtained through standardized methods (questionnaires, clinical measurements and biochemical analysis). Data collation and analyses were done at the national coordinating centre.Findings We report the prevalence of CVD risk factors among individuals aged 20–69 years (n = 19 973 for the questionnaire survey, n = 10 442 for biochemical investigations); mean age was 40 years. The overall prevalence of most risk factors was high, with 50.9% of men and 51.9% of women being overweight, central obesity was observed among 30.9% of men and 32.8% of women, and 40.2% of men and 14.9% of women reported current tobacco use. Self-reported prevalence of diabetes (5.3%) and hypertension (10.9%) was lower than when measured clinically and biochemically (10.1% and 27.7%, respectively). There was marked heterogeneity in the prevalence of risk factors among the study centres.Conclusion There is a high burden of CVD risk factors among industrial populations across India. The surveillance system can be used as a model for replication in India as well as other developing countries.
Bulletin of the World Health Organization 2006;84:461-469.
Voir page 467 le résumé en français. En la página 468 figura un resumen en español.
IntroductionCardiovascular diseases (CVDs are majjjor contributors to the global burden of chronic diseases with 29.3% of global deaths and 9.9% of total disease burden, in terms of disabilityjadjusted life years (DALYs) lost, being reported in 2003.1 Lowj and middlejincome countries acjjcounted for 78% and 86% of the CVD deaths and DALYs lost, respectively, worldwide in 1998.2 Recent estimates by WHO suggest that in 2005, 80% of chronic disease deaths occurred in lowj and middlejincome countries.3 This burden of CVD is predicted to increase substantially in developing countries by
a Department of Cardiology, All India Institute of Medical Sciences, Ansari Nagar, New Delhi 110029, India. Correspondence to Dr Reddy (email: [email protected]).b Initiative for Cardiovascular Health Research in the Developing Countries, New Delhi, India.c Sree Chitra Tirunal Institute of Medical Sciences and Technology, Thiruvananthapuram, India.d Ambedkar Medical College, Bangalore, India.e Assam Medical College, Dibrugarh, India.f Government Medical College, Nagpur, India.g PSG Institute of Medical Sciences, Coimbatore, India.h BJ Medical College, Pune, India.i King George Medical College, Lucknow, India.j Nizam’s Institute of Medical Sciences, Hyderabad, India.k Christian Medical College, Ludhiana, India.Ref. No. 05-027037(Submitted: 27 September 2005 – Final revised version received: 9 December 2005 – Accepted: 15 December 2005)
Methods for establishing a surveillance system for cardiovascular diseases in Indian industrial populationsReddy KS,a Prabhakaran D,a Chaturvedi V,a Jeemon P,b Thankappan KR,c Ramakrishnan L,a Mohan BVM,d Pandav CS,a Ahmed FU,e Joshi PP,f Meera R,g Amin RB,h Ahuja RC,i Das MS,j & Jaison TM k, on behalf of the Sentinel Surveillance System for Indian Industrial Populations Study Group
ميكن االطالع عىل امللخص بالعربية يف صفحة 468.
year 2020.4 Major causes for the injjcrease in disease burden are rising rates of hypertension, dyslipidaemia, diabetes, overweight, obesity, physical inactivity and tobacco use.5
In India, CVD is projected to be the largest cause of death and disabiljjity by 2020,5 with 2.6 million Indians predicted to die due to coronary heart disease, which constitutes 54.1% of all CVD deaths. Nearly half of these deaths are likely to occur among young and middlejaged individuals (30–69 years). This is because Indians experience CVD deaths at least a decade earlier than their counterparts in developed countries.6
This has the potential to adversely affect India’s economy with 52% of CVD deaths occurring in those below the age of 70 years compared to 23% in countries in established market economies.4
Demographic and health transijjtions, genejenvironmental interactions and early life influences of fetal malnujjtrition have been implicated as the causes of increasing CVD burden in India.7 However, the most important factors are changes in living habits, whereby behavioural risk factors are transformed into biological risk factors. Such envijjronmentallyjdetermined risk factors are more amenable to change through
462 Bulletin of the World Health Organization | June 2006, 84 (6)
ResearchSurveillance system for cardiovascular diseases in India K Srinath Reddy et al.
public health and clinical interventions and, therefore, warrant early recognition at the individual level and surveillance at the population level.
To formulate national policies for the prevention and control of CVDs, nationally representative data collected through standardized techniques would be required. However, published crossjsectional studies on risk factors, such as hypertension,8–11 diabetes,11–14 impaired fasting glucose,14 dyslipidaemia,15 overjjweight,16–19 obesity,18,20 and smoking,21–23 are highly heterogeneous and limited by variations in measurement techniques, interviewer bias, and differing definijjtions for risk factors and time periods of survey. We designed and established a sentinel surveillance system for CVD risk factors in Indian industrial populajjtions with the following objectives:• to conduct a baseline survey and
continual surveillance of CVD risk factors and their determinants;
• to ascertain the incidence of CVD morbidity and mortality;
• to impart health education for prejjvention of CVD and assess the imjjpact of health education on control of CVD;
• to develop guidelines for detection and management of CVD in the injjdustrial settings, using the results of the baseline study.
We report the methods and results of the baseline survey conducted in 2002–03, in accordance with the first objective.
MethodsStudy settingWe selected 10 mediumjtojlarge comjjpanies (employing 1500–5000 people) in the organized sector (both public and private), from different sites across India, based on their willingness to participate in the study and proximity to an acajjdemic medical institution. Ten medical colleges designated as study centres were linked to each of these selected compajjnies (Table 1, web version only, available from: http://www.who.int/bulletin). The study team included faculty members from various departments (medicine, cardiology, preventive medicine, and biochemistry) of each medical college headed by a principal investigator and supported by a biochemical investigator from the medical college as well as an injjdustrial medical officer who represented
the company. A research team comjjprising medical and nonjmedical staff assisted the study team.
SamplingAll employees and their family members, age 10–69 years, from each participatjjing centre were eligible for inclusion in the study. At each participating centre, detailed data were obtained from 800 randomly selected employees and their eligible family members. We expected a total of 2400 individuals from each centre to participate in this study with at least 200 individuals in each decile starting from 10–19 years to 60–69 years. Since, we did not collect blood samples from the 10–19 years agejgroup (for ethical reasons), their data are not included in this report. Of the remainjjing 2000 we chose 1000 individuals per centre, aged 20–69 years, by stratified random subjsampling for adequate representation of all age deciles and sex groups. When required we used purpojjsive overjsampling to include additional
eligible participants to attain the rejjquired cell size. We expected to include 20 000 individuals to generate demojjgraphic and clinical data and 10 000 for biochemical data. At the Delhi centre, in accordance with the stipulation of the management of the participating industry, we surveyed all the employees and family members based on the prejspecified randomization sequence, while at the Ludhiana centre we did not survey family members.
Study variablesWe collected data on demographics, injjdividual characteristics associated with major risk factors of CVD, past medijjcal history, clinical and anthropometric profile and biochemical parameters (Table 2).
Quality control measuresTo ensure the accuracy, completeness, as well as comparability of blood presjjsure, anthropometric measurements, and interviewee responses across the
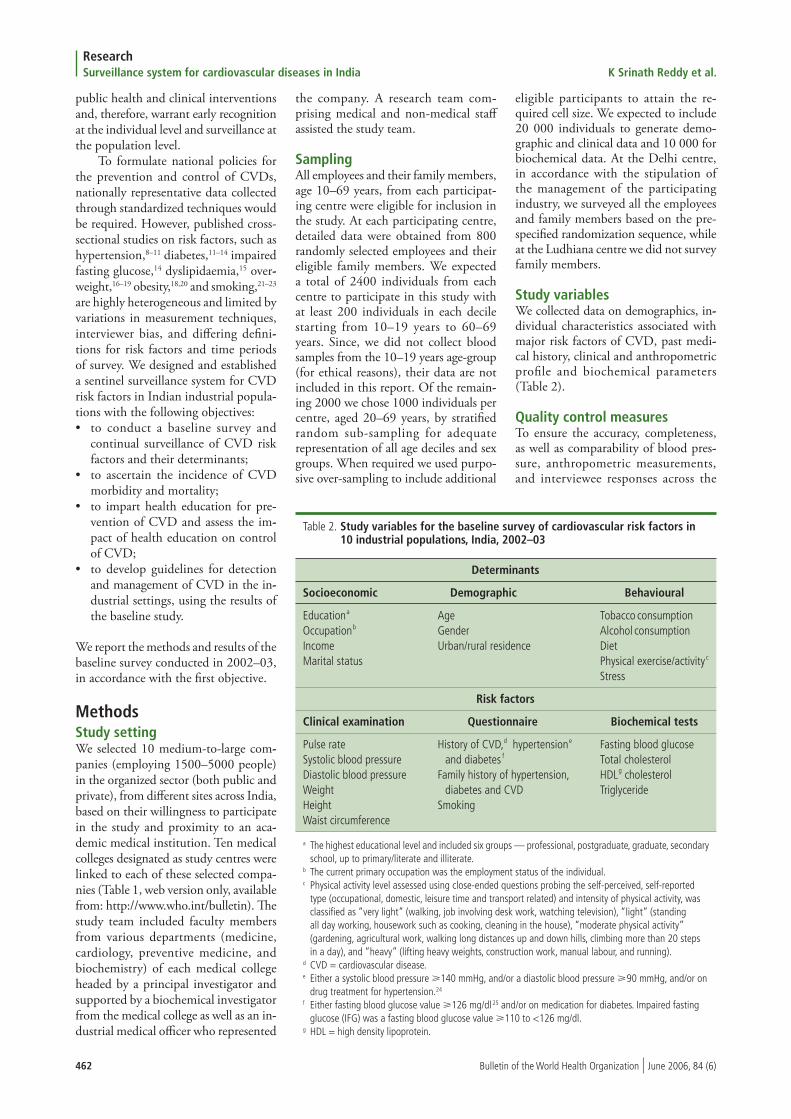
Table 2. Study variables for the baseline survey of cardiovascular risk factors in 10 industrial populations, India, 2002–03
Determinants
Socioeconomic Demographic Behavioural
Educationa Age Tobacco consumptionOccupationb Gender Alcohol consumptionIncome Urban/rural residence DietMarital status Physical exercise/activityc
Stress
Risk factors
Clinical examination Questionnaire Biochemical tests
Pulse rate History of CVD,d hypertensione Fasting blood glucoseSystolic blood pressure and diabetes f Total cholesterolDiastolic blood pressure Family history of hypertension, HDLg cholesterolWeight diabetes and CVD TriglycerideHeight SmokingWaist circumference
a The highest educational level and included six groups — professional, postgraduate, graduate, secondary school, up to primary/literate and illiterate.
b The current primary occupation was the employment status of the individual.c Physical activity level assessed using close-ended questions probing the self-perceived, self-reported
type (occupational, domestic, leisure time and transport related) and intensity of physical activity, was classified as “very light” (walking, job involving desk work, watching television), “light” (standing all day working, housework such as cooking, cleaning in the house), “moderate physical activity” (gardening, agricultural work, walking long distances up and down hills, climbing more than 20 steps in a day), and “heavy” (lifting heavy weights, construction work, manual labour, and running).
d CVD = cardiovascular disease.e Either a systolic blood pressure >140 mmHg, and/or a diastolic blood pressure >90 mmHg, and/or on
drug treatment for hypertension.24 f Either fasting blood glucose value >126 mg/dl 25 and/or on medication for diabetes. Impaired fasting
glucose (IFG) was a fasting blood glucose value >110 to <126 mg/dl. g HDL = high density lipoprotein.

463Bulletin of the World Health Organization | June 2006, 84 (6)
ResearchK Srinath Reddy et al. Surveillance system for cardiovascular diseases in India
10 centres, we included several quality control measures in the study protojjcol. We developed a common manual of operations and distributed it to all participating centres. To ensure uniforjjmity of data collection we conducted nationaljlevel questionnaire administrajjtion training sessions for all study staff. We pilotjtested all questions for clarity and “face validity” (“Does the question refer to what it intends to seek?”) and developed the standard final version of the questionnaire and distributed to all centres.
Pilot studyWe conducted a pilot study using 10–25 individuals in May–June 2001, in all the centres, to evaluate the measurejjment tools, feasibility of transporting blood samples for biochemical analysis, efficiency of data transfer and qualjjity assessment of transferred data. We modified the study protocol and survey instruments based on results from the pilot study. Those who were part of the pilot study were excluded from the main study.
Questionnaire administration and measurement techniquesWe obtained written informed consent from the 19 973 individuals who rejjsponded to the questionnaire survey. We estimated fasting blood glucose and fastjjing lipid profile in 10 442 individuals. Blood was collected after an overnight fast of 10–12 hours. Blood pressure (BP) was measured using automated BP monitoring equipment (Omron MX3) according to the procedure detailed in the instruction manual. Waist circumjjference (WC) was measured with a standard tape measure, while subjects were lightly clothed, at a level midway
Table 3. Distribution of the study population across 10 sites in the baseline survey, India, 2002–03
Sites Men (n) Women (n) Total (n)
Bangalore 53.4 (906) 46.6 (790) 100% (1696)Coimbatore 52.7 (1100) 47.3 (989) 100% (2089)Delhi 69.3 (2354) 30.7 (1043) 100% (3397)Dibrugarh 49.5 (1190) 50.5 (1213) 100% (2403) Hyderabad 68.4 (882) 31.6 (407) 100% (1289)Lucknow 55.6 (944) 44.4 (755) 100% (1699)Ludhiana 97.9 (832) 2.1 (18) 100% (850)Nagpur 63.2 (1408) 36.8 (819) 100% (2227)Pune 50.4 (1164) 49.6 (1144) 100% (2308)Trivandrum 55.5 (1118) 44.5 (897) 100% (2015)
between the lower rib margin and iliac crest in centimetres (cm) to the nearest 0.1 cm. Weight was taken (to the nearjjest 0.1 kg) with the subject standing motionless on an electronic weighing machine without shoes or any heavy outer garments, and weight equally distributed over each leg. Height was measured (to the nearest 0.1 cm) using a standard stadiometer with the subject standing erect against a vertical surface, without shoes, and the head positioned such that top of the external auditory meatus was level with the inferior margin of the bony orbit.
Laboratory techniques and biochemical standardizationThe Department of Cardiac Biochemisjjtry at the All India Institute of Medical Sciences (AIIMS), New Delhi was rejjsponsible for biochemical standardizajjtion at each centre and coordination. We estimated glucose by GODjPAP (glucose oxidase/peroxidasej4jaminophenazonejphenol; Randox) method, cholesterol by CHODjPAP (cholesterol oxidase/ pjaminophenazone; Randox) method, and triglycerides by GPOjPAP (glycerjjolphosphate oxidase–peroxidase amijjnophenazone; Randox) method. Highjdensity lipoprotein (HDL) was estimated by the precipitation method using phosjjphotungstate/magnesium — precipitajjtion of apolipoprotein B containing lipoproteins followed by estimation of cholesterol in the supernatant by enzyjjmatic method. All estimation kits and quality control materials were sent from the coordinating laboratory to the centre to minimize variation.
We regularly performed both interjjnal and external quality assessments at all participating laboratories along with validity checks to ensure accurate and
consistent results. For quality assurance, we conducted different levels of internal quality controls with each batch of samples. The interj and intrajassay coefjjficient of variation of each individual laboratory was less than 2% and 3%, respectively, for glucose and cholesterol estimations, and less than 2.5% and 3.5%, respectively, for triglycerides and HDLjcholesterol (HDLjc) estimajjtions. For external validation, we sent lyophilized samples from the coordinatjjing laboratory once a month to all parjjticipating laboratories throughout the period of the study. We also rejanalysed 10% of samples selected randomly from all centres in the coordinating laborajjtory as an additional quality assurance measure. The coefficient of variation was less than 5% for all, except for HDLjc at Bangalore (this was rejanalysed at the coordinating centre).
FindingsBased on our proposed sampling scheme we approached 22 266 individuals. However, only 19 973 consented to parjjticipate in the study, yielding a response rate of 89.7%. The response rates varied across centres. The distribution of the study population is provided in Table 3. The general characteristics of the study population are given in Table 4 (web verjjsion only, available from: http://www.who.int/bulletin).
Demographic characteristicsThe mean age of the participants in our study was 40 years (range of mean age: 32 years at Nagpur to 45.4 years at Delhi), with only 5% in >60 age group. More than threejquarters of the subjects (77.7%) had at least secondary school education while 12.1% were illiterate. A third (34%) of the study population comprised both unemployed or retired individuals (10%) and homejmakers (24%). We observed a wide variation in educational status and occupation across all centres.
Behavioural determinantsOur results showed that onejthird (33.6%) of the subjects had history of tobacco use in any form and 30% were using tobacco regularly. Smoking was the major form of tobacco use (12.6%), followed by use as snuff (10.7%), and tobacco chewing (9%). Current smoking and chewing prevalence rates were signifjj

464 Bulletin of the World Health Organization | June 2006, 84 (6)
ResearchSurveillance system for cardiovascular diseases in India K Srinath Reddy et al.
icantly higher among men (21% versus 0.2% and 13.3% versus 2.6%) whereas tobacco use as snuff was higher among women (9.5% versus 12.4%). Of our study subjects 12% took alcohol regularjjly and 12.5% took alcohol occasionally. A large number of our study participants (51.4%) reported medium level of physijjcal activity, 3.4% reported very light physical activity, while 13% reported high physical activity level.
Anthropometric measurementsOur results showed a mean body mass index (BMI) of 23.1 kg/m² (95% conjjfidence interval (95% CI) = 14.8–31.4 kg/m²). The overall prevalence of overjjweight (BMI >23 kg/m²) was 51.3% (50.9% in men and 51.9% in women), however, the prevalence of overweight based on the WHO definition (BMI >25 kg/m²) was 30.9%. The mean WC was 82.9 cm (95% CI = 60.6–105.2 cm); significantly higher among men (85.0 cm) than women (79.9 cm). Central obesity was 18.2% among men (WC >94 cm) and 23.3% among women (WC >88 cm). Using modified waist circumjjference cutjoffs appropriate for Indian populations (WC >90 cm for men and WC >85 cm for women), the prevalence of central obesity was 30.9% and 32.8% among men and women, respectively.20 Women had a higher prevalence of central obesity compared to men, across all age groups. The agej and sexjspecific mean
Table 5. Age-specific blood pressure, body mass index, waist circumference and lipid levels (mean ± SD) in 10 industrial populations, India, 2002–03
Variable 20–29 years 30–39 years 40–49 years 50–59 years > 60 years Total
Men Women Men Women Men Women Men Women Men Women Men Women
Systolic blood 121.9 114.2 123.4 119.1 127.8 126.1 132.8 133.9 137.9 142.0 127.0 123.1 pressure (mmHg) ± 11.8 ± 11.4 ± 12.3 ± 13.9 ± 6.5 ± 16.6 ± 19.1 ± 19.8 ± 20.8 ± 20.6 ± 16.2 ± 17.5
Diastolic blood 75.3 73.21 78.6 77.2 80.8 80.4 81.8 82.8 80.7 82.7 79.24 78.1 pressure (mmHg) ± 9.9 ± 9.6 ± 9.9 ± 10.5 ± 11.0 ± 10.5 ± 10.8 ± 10.7 ± 11.6 ± 9.7 ± 10.8 ± 10.8
Body mass index 21.24 21.2 22.8 23.5 24.0 25.2 24.1 24.1 20.9 21.4 23.0 23.3 (kg/m²) ± 3.4 ± 3.8 ± 3.7 ± 4.7 ± 3.7 ± 4.7 ± 3.7 ± 5.2 ± 3.9 ± 5.2 ± 3.8 ± 4.9
Waist circumfer- 78.65 74.5 84.2 80.1 88.2 83.7 89.2 82.3 80.4 78.0 85.0 79.8 ence (cm) ± 9.1 ± 10.3 ± 9.9 ± 11.4 ± 9.9 ± 11.5 ± 10.0 ± 12.3 ± 11.2 ± 13.0 ± 10.6 ± 11.9
Triglycerides 158.5 159.7 170.5 168.6 185.9 185.9 183.9 189.5 165.6 182.1 177.1 175.7 (mg/dl) ± 36.6 ± 34.9 ± 39.9 ± 35.6 ± 39.2 ± 39.9 ± 38.8 ± 44.4 ± 41.1 ± 46.1 ± 40.2 ± 40.1
High density 40.9 45.1 41.9 44.4 41.1 44.3 41.8 44.7 43.2 45.5 41.5 44.6 lipoprotein ± 9.7 ± 11.1 ± 10.6 ± 10.9 ± 9.6 ± 10.8 ± 10.4 ± 11.0 ± 11.1 ± 12.0 ± 10.1 ± 10.9 cholesterol (mg/dl)
Triglycerides 112.9 95.1 137.6 107.7 148.6 124.4 141.2 129.7 114.5 124.4 137.4 114.1 (mg/dl) ± 65.2 ± 47.0 ± 81.3 ± 55.2 ± 82.4 ± 65.8 ± 77.0 ± 74.5 ± 66.5 ± 57.9 ± 78.6 ± 61.6
levels of BP, BMI, WC, and lipid levels as continuous variables are given in Table 5 and the agej and sexjspecific prevalence of elevated risk factors as categorical varijjables are provided in Table 6.
Clinical and biochemical measurementsBlood pressureMean systolic blood pressure (SBP) was 125.4 mmHg (127.0 mmHg in men, 123.1 mmHg in women) and mean diastolic blood pressure (DBP) was 78.8 mmHg (79.2 mmHg in men, 78.1 mmHg in women). Both mean SBP and DBP increased with age among men and women. The SBP levels among men were significantly higher than those among agejmatched women until the age of 49 years, after which the levels were higher among women. Selfjreported prevalence of hypertension was 10.9% and the prevalence of hypertension and “prejhypertension” (“Blood pressure between 120/80 mmHg and 139/89 mmHg.”), by JNC VII criteria was 27.7%, and 56.3%, respectively. The prevalence of hypertension and prejhypertension injjcreased with age.
LipidsMean total cholesterol and mean HDL cholesterol were 176.6 mg/dl (177.1 mg/dl in men, 175.7 mg/dl in women) and 42.3 mg/dl (41.5 mg/dl in men, 44.6 mg/dl in women), respectively.
Mean total cholesterol increased with age, whereas HDL cholesterol had no linear relationship with age. The mean total cholesterol–HDL cholesterol ratio (TC/HDLjc) was 4.3 (4.4 in men, 4.1 in women). Women had lower TC/HDLjc compared to men across all age groups. Dyslipidaemia prevalence (TC/HDL >4.5 or triglycerides >150 mg/dl) showed a linear increase with age, until the age of 50 years. Dyslipidaemia in the age group 50–59 years (for both men and women) did not differ from that in the previous age group; however, it was lower in the age group of 60–69 years, than in the previous age groups.
Diabetes and metabolic syndromeSelfjreported diabetes prevalence was 5.3%, while that of diabetes and imjjpaired fasting glucose (IFG) by WHO criteria were 10.1% and 6.4%, respecjjtively. Metabolic syndrome prevalence was 26.6% (20.9% in men, 36.3% in women) by modified NCEP ATP III criteria 26 and 35.4% (29.4% in men, 46.1% in women) by the recently projjposed IDF criteria for south Asians.27
Age-adjusted prevalence of risk factorsThe agejadjusted prevalence of major risk factors of CVD using 2001 Indian census data was 26% for hypertension, 8.4% for diabetes, 24.8% for metabolic

465Bulletin of the World Health Organization | June 2006, 84 (6)
ResearchK Srinath Reddy et al. Surveillance system for cardiovascular diseases in India
Table 6. Prevalence of overweight, central obesity, dyslipidaemia, diabetes, hypertension and metabolic syndrome across various age groups in 10 industrial populations, India, 2002–03
Variable 20–29 years 30–39 years 40–49 years 50–59 years > 60 years Total
Men Women Men Women Men Women Men Women Men Women Men Women (n) (n) (n) (n) (n) (n) (n) (n) (n) (n) (n) (n)
BMIa 30.1 29.1 48.8 52.9 62.0 70.6 64.2 61.9 31.1 42.3 50.9 51.9 >23 kg/m² (836) (641) (1250) (1059) (2114) (1609) (1664) (647) (152) (210) (6016) (4166)
BMI 12.2 13.9 26.1 35.0 37.4 52.1 39.7 41.9 13.8 24.6 28.6 34.3 >25 kg/m² (338) (306) (669) (702) (1276) (1187) (1029) (438) (67) (122) (3379) (2755)
Central 8.8 14.6 25.3 32.0 42.3 45.7 47.6 44.6 18.4 31.5 30.9 32.8 obesity b (243) (316) (648) (640) (1443) (1041) (1233) (467) (90) (156) (3657) (2620)
TC/HDLc 32.0 21.3 38.2 31.9 52.8 44.1 51.5 47.2 31.3 45.4 45.6 36.2 >4.5 (365) (184) (449) (321) (1195) (598) (889) (224) (52) (59) (2950) (1386)
Triglycerides 19.1 10.3 33.0 16.7 37.6 26.2 34.3 26.0 21.3 25.0 32.2 20.1 >150 mg/dl (222) (91) (393) (170) (856) (360) (595) (127) (36) (33) (2102) (781)
Diabetesd 0.9 0.9 4.4 4.2 12.4 10.8 20.7 17.0 16.0 27.3 11.2 8.2 (10) (8) (53) (43) (282) (149) (360) (83) (27) (36) (732) (319)
Hypertensione 12.2 5.9 19.3 17.1 34.6 31.4 46.9 50.9 49.2 62.0 29.3 25.2 (337) (129) (494) (342) (1180) (715) (1215) (532) (240) (308) (3466) (2026)
Metabolic 10.2 12.9 13.1 33.7 21.7 45.2 30.8 52.0 35.5 61.5 20.9 36.3 syndrome f (117) (111) (154) (339) (491) (613) (532) (247) (59) (80) (1353) (1390)
a BMI = body mass index.b Waist circumference >90 cm in males; >85 cm in females. c TC/HDL = total cholesterol to HDL cholesterol ratio.d Fasting plasma glucose >126 mg/dl or drug treatment for diabetes mellitus.e Systolic blood pressure >140 mmHg or diastolic blood pressure >90 mmHg or under medication for hypertension.f Based on NCEP ATP III criteria.26 NCEP ATP III guidelines define metabolic syndrome based on presence of any three of the following five components:
abdominal obesity, elevated triglycerides, low HDL cholesterol, raised blood pressure and impaired fasting glucose levels.
syndrome, 46.7% for BMI >23 kg/m², 25.5% among men and 30.3% among women for central obesity (WC >90 cm in men, WC >85 cm in women), 37.5% for dyslipidaemia (TC/HDL >4.5) and 24.3% for hyperjtriglyceridaemia (trijjglycerides >150 mg/dl) (Fig. 1).
Heterogeneity in risk factors among participating centresOur results showed widejranging hetjjerogeneity among risk factor prevalence across the different centres (Table 7, web version only, available from: http://www.who.int/bulletin). Current tobacco use was highest in Dibrugarh (83.8%) and lowest in Bangalore (15.4%). Current tojjbacco use was very low among women compared to men across all centres (14.9% in women versus 40.2% in men). However, in Dibrugarh the prevalence of current tobacco use among women was exceptionally high (77.8%). Prevalence of hypertension was high in Hyderabad (39.1%) and Lucknow (38.4%) and lowjjest in Nagpur (16.9%). Diabetes prevajjlence varied from 2.3% in Dibrugarh to 16.6% in Trivandrum. A relatively low prevalence of diabetes was reported in
Nagpur (4.2%) and Coimbatore (7.7%). High prevalence of metabolic synjjdrome was seen in Bangalore (38.8%), Trivandrum (37.9%), Hyderabad (33.0%), Lucknow (29.0%), Coimbatore (28.2%) and Delhi (22.9%) centres. A comparatively low prevalence of metajjbolic syndrome was reported in Nagpur (17.8%) and Dibrugarh (19.9%).
DiscussionIn the absence of a populationjbased nationally representative surveillance system for CVD, establishing a multijcentric surveillance system in industrial settings could be a useful initial step, the first component being a baseline crossjsectional survey of risk factors.
In our baseline crossjsectional surjjvey the choice of industrial settings was based on the availability of functioning healthjcare services in those industries and the assurance of good followjup. The additional costs of CVD surveiljjlance under such circumstances are low with high quality information yield. The inclusion of family members allowed us to study people in the age groups of
10–19 years and 60–69 years as well as a large number of women to balance the predominantly male employee group.
We observed a high prevalence of CVD risk factors among a relatively young population across the selected industrial populations. Our results are consistent with high prevalence of CVD risk factors reported in previous crossjsectional studies conducted at various geographical locations in India.8–23 If we project our findings to the whole industrial population of India the magjjnitude of the number of persons living with CVD risk factors, such as tobacco use, overweight, hypertension, diabetes, and metabolic syndrome would pose a major challenge to the existing healthjcare systems.
Our results showed marked heterojjgeneity in the prevalence of risk factors across the centres. This may be due to dissimilar levels of urbanization in the different industrial settings as some are located in a rural/semi rural situajjtion while others are in more urbanized regions. For example, the prevalence of diabetes was low in the predominantly rural setting of Dibrugarh and Nagpur.

466 Bulletin of the World Health Organization | June 2006, 84 (6)
ResearchSurveillance system for cardiovascular diseases in India K Srinath Reddy et al.
Overweight = body mass index (BMI) ‡23 kg/m2, which is the suggested cut-off for Asians.28, 29
Central obesity = waist circumference >90 cm in males; >85 cm in females.Dyslipidaemia = total cholesterol/HDL-cholesterol ratio.Hypertriglyceridemia = fasting triglyceride level ‡150 mg/dl.Diabetes = fasting plasma glucose ‡126 mg/dl or on treatment.Hypertension = systolic blood pressure ‡140 mmHg or diastolic blood pressure ‡90 mmHg or on treatment.Tobacco use = current use of tobacco in any form.Metabolic syndrome, based on NCEP ATP III criteria.26
Fig. 1. Age-adjusted prevalence of cardiovascular disease risk factorsin 10 industrial centres, India, 2002–03
WHO 06.74
%
60
0Overweight
Men
50
40
30
20
10
45.848.1
25.5
30.3
Centralobesity
40.2
34.4
Dyslipidaemia
28.6
18.2
Hypertri-glyceridaemia
8.3 9
Diabetes
26 26.3
Hypertension
40.2
15.5
Tobaccouse
18.4
35
Metabolicsyndrome
Women
The only exception was the high prevajjlence of hypertension among the tea garden workers of Dibrugarh, which could be attributable to the practice by employees of adding salt to drinking wajjter and tea while working in the field.
Wide variability in the measurejjments of lipids, specifically triglycerides and HDLjc, are well known and stanjjdardizing these measurements is particujjlarly difficult.30 Our biochemical quality control strategies were a unique feature of this study. Through simple measures of maintaining internal validity of the participating laboratories and ensuring external validity by assessment of blinded lyophilized samples we were able to esjjtablish a high degree of quality in the 10 participating laboratories.
One of the limitations of our study was the industrial setting, which may not be representative and applicable to the general population. The participants in our sentinel surveillance system formed a stable surrogate community for surjjveillance unlike the general population where loss to followjup is frequent and continuous monitoring of risk factors more expensive. Though the inclusion of family members of employees in the reference population should have imjjproved the generalization of the results, the age structure and socioeconomic status of the industrial populations are different from that of the general popujjlation. The results of our study cannot be generalized to those >60 years of age, as the numbers in this age group, especially women, were small in our sample compared to other age groups. Further, the sustainability of the system depends on the continuing interest of the participating companies.
The high levels of risk observed with our baseline crossjsectional survey justifies the need for establishing a surjjveillance system to monitor the trends of CVD risk factors over time and has persuaded the participating industries to accept the proposed system of periodic rejsurveys of CVD risk factors as well as of continual tracking of CVDjrelated events. It also enabled us to initiate workjsite programmes for health promotion and CVD reduction. We are continuing surveillance activities in seven of the 10 selected industrial settings, which
includes physical and biochemical meajjsures of major risk factors, periodic estimates of validity of the data collected and a broader set of outcome indicators beyond risk factor prevalence. A health education intervention package that was developed is being implemented in all industrial settings, and would help the target community to change risky bejjhaviours to healthy behaviours. It would also enable us to demonstrate the effecjjtiveness of the health intervention packjjage in terms of change in knowledge, attitude and risk factor prevalence levels in the target community. In an effort to assess the trends in CVD mortality and morbidity an event registry, initiated at all selected industrial centres successfully from May 2003, would help us estimate the incidence of CVD mortality and morbidity in the selected populations.
ConclusionsOur study has demonstrated very high levels of CVD risk factors among a relatively young population from 10 industrial settings across India. The
surveillance network established by this project is the first of its kind for CVD risk factors in India and can be used as a model for replication of prevention strategies for CVD and other noncomjjmunicable diseases in India as well as other developing countries. The dissemijjnation of these findings may encourage other companies to set up surveillance activities especially in developing counjjtries where the organized work force comprises a substantial number of indijjviduals. Continuing surveillance efforts would provide us with an opportunity to develop evidencejbased costjeffective CVD prevention, detection and manjjagement strategies. O
AcknowledgementsWe thank the participating companies and their employees, all the principal investigators and the research staff who have contributed to the success of this project. The members of Sentinel Surveillance System for Indian Indusjjtrial Populations Study Group are listed below.

467Bulletin of the World Health Organization | June 2006, 84 (6)
ResearchK Srinath Reddy et al. Surveillance system for cardiovascular diseases in India
Résumé
Méthodes pour mettre en place un réseau de surveillance des maladies cardiovasculaires chez les employés d’entreprises industrielles indiennes et leurs famillesObjectif Mettre en place un système de surveillance des facteurs de risques de maladie cardiovasculaire (MCV) sur des sites industriels et estimer au moyen d’outils standardisés la charge de facteurs de risque.Méthodes Une étude transversale de référence a été menée (dans le cadre d’un programme de surveillance des MCV) parmi les employés de 10 entreprises industrielles et leurs familles, ces entreprises étant situées dans différentes régions de l’Inde et à proximité de facultés de médecine qui ont servi de centres d’étude. Les sujets de l’étude ont été sélectionnés parmi les employés et leurs familles (échantillon aléatoire stratifié selon l’âge et le sexe). Des informations relatives aux déterminants comportementaux, cliniques et biochimiques ont été obtenues par des méthodes standardisées (questionnaires, mesures cliniques et analyse biochimique). La collecte des données et les analyses ont été effectuées par le centre coordinateur national.Résultats L’article indique la prévalence des facteurs de risque de MCV parmi des sujets de 20 à 69 ans (n = 19 973
pour l’enquête par questionnaire, n = 10 442 pour les études biochimiques), dont l’âge moyen était de 40 ans. Il relève une forte prévalence globale de la plupart des facteurs de risque : 50,9 % des hommes et 51,9 % des femmes présentent une surcharge pondérale, 30,9 % des hommes et 32,8 % des femmes souffrent d’une obésité centrale, 40,2 % des hommes et 14,9 % des femmes signalent qu’ils ou elles fument actuellement du tabac. Les prévalences autorapportées du diabète (5,3 %) et de l’hypertension (10,9 %) sont plus faibles que celles mesurées par des examens cliniques et biochimiques (10,1 % et 27,7 % respectivement). On constate une hétérogénéité marquée de la prévalence des facteurs de risque entre les centres d’étude.Conclusion La charge de facteurs de risque de MCV relevée chez les employés d’entreprises industrielles réparties à travers l’Inde et leurs familles est élevée. Le système de surveillance établi peut être utilisé comme modèle pour être transposé à d’autres populations Indiennes et à d’autres pays en développement.
Steering CommitteeK Srinath Reddy, Dorairaj Prabhakaran, V Murali Mohan, Chandarkant S Pandav, Farukh U Ahmed, KR Thankappan, Prashant P Joshi, R Meera, Rajni B Amin, Ramesh C Ahuja, S Mohan Das, TM Jaison and Subhash C Manchanda.
National Coordinating CentreK Srinath Reddy (Principal Investigator), Dorairaj Prabhakaran (CojPrincipal Investigator), Lakshmy Ramakrishnan (Biojjchemical Investigator), Vivek Chaturvedi (CojPI), Shifalika Goenka (CojPI, Health promotion), Jeemon Panniyammakal (Project Officer), Monica Singhi (Project Officer), Anuradha Dwivedi (RA), Ajay Manhapra (RA), Vasanthan Mettupalle (RA), Ruby Gupta (Biochemical Research Assistant), Karthika A (Biostatistician).
Investigators and study staff at the individual centresBangalore — B V Murali Mohan (PI), Seema Murthy (SRF), Aravind K Joshi (IMO), Nagi Reddy (SW). Coimabatore — R Meera (PI), Ursula Sampson (BI), S Premkumar (SRF), S Chandrakaran (SW). Delhi — Chandarkant S Pandav (PI), Dorairaj Prabhakaran (PI), Lakshmy Ramakrishnan (BI), Uma Snehi (SRF), SB Goel (IMO), Yogesh Garg (SW). Dibrugarh — Farukh U Ahmed (PI), D Dutta (CojPI), S Borkotoky (BI),
P Khound (IMO), R Mahanta (SRF). Hyderabad — S Mohan Das (PI), SS Potnis (IMO), T Malathi (BI), R Kamilli ( SRF), S Dattu (SW). Lucknow — Ramesh C Ahuja (PI), RK Saran (CojPI), Nakul Sinha (CojPI), PK Nigam (BI), A Surange, P Kumar (IMO), M Lal (SRF). Ludhiana — TM Jaison (PI), Satpal (SRF), Jeyaraj (SW). Nagpur — Prashant P Joshi (PI), NR Akarte (CojPI), NM Thakare, (IMO), HR Salkar. Pune — Rajni B Amin (PI), DB Kadam (CojPI), DN Doiphode (BI), R Thadani (SRF). Trivandrum — KR Thankappan (PI), S Sivasankaran (CojPI), CC Kartha (BI), VJ Thomas (IMO), RC Nair (SRF)
PI = Principal Investigator Co-PI = Co Investigator BI = Biochemical Investigator RA = Research Assistant SRF = Senior Research Fellow IMO = Industrial Medical Officer SW = social worker
Funding: This study was funded by the World Health Organizajjtion and Ministry of Health and Family Welfare, Government of India.
Competing interests: none declared.
468 Bulletin of the World Health Organization | June 2006, 84 (6)
ResearchSurveillance system for cardiovascular diseases in India K Srinath Reddy et al.
References 1. World Health Organization. The world health report 2004: Changing history.
Geneva: WHO; 2004. 2. World Health Organization. The world health report 1999: Making a
difference. Geneva: WHO; 1999. 3. World Health Organization. Preventing Chronic Diseases: A Vital Investment.
Geneva: WHO; 2005. 4. Murray CJL, Lopez AD. Global health statistics. Global Burden of
Disease and Injury Series. Boston (MA): Harvard School of Public Health; 1996.
5. World Health Organization. The world health report 2002: Reducing risks, promoting life. Geneva: WHO; 2002.
6. Prabhakaran D, Yusuf S, Mehta S, Pogue J, Avezum A, Budaj A, et al. Two-year outcomes in patients admitted with non-ST elevation acute coronary syndrome: results of the OASIS registry 1 and 2. Indian Heart J 2005; 57:217-25.
7. Bahl VK, Prabhakaran D, Karthikeyan G. Coronary artery disease in Indians. Indian Heart J 2001;53:707-13.
8. Gupta R. Trends in hypertension epidemiology in India. J Hum Hypertens 2004;18:73-8.
9. Gupta R. Defining hypertension in the Indian population. Natl Med J India 1997;10:139-43.
10. Gupta R, Al-Odat NA, Gupta VP. Hypertension epidemiology in India. Meta-analysis of fifty years prevalence rates and blood pressure trends. J Hum Hypertens 1996;10:465-72.
11. Gupta R, Gupta VP, Sarna M, Prakash H, Rastogi S, Gupta KD. Serial epidemiological surveys in an urban Indian population demonstrate increasing coronary risk factor among the lower socio economic strata. J Assoc Physicians India 2003;55:470-7.
12. Gupta R, Gupta VP, Alhuwalia NS. Educational status, coronary heart disease and coronary risk factor prevalence in a rural population of India. BMJ 1994;309:1332-6.
13. Kutty VR, Soman CR, Joseph A, Pisharody R, Vijayakumar K. Type 2 diabetes in southern Kerala: Variation in prevalence among geographic divisions within a region. Natl Med J India 2000;13:287-92.
ملخصد األمراض القلبية الوعائية بني املجموعات السكانية الهندية يف املواقع الصناعية طرق إنشاء نظام لرتصُّ
د عوامل خطر األمراض القلبية الوعائية يف املواقع الهدف: تأسيس شبكة لرتصُّالصناعية وتقدير عبء عوامل الخطر باستعامل أدوات معيارية.
د ترصُّ برنامج من )كجزء للقطاعات شاماًل أساسياً مسحاً أجرينا الطريقة: األمراض القلبية الوعائية( يف املجموعات السكانية يف املواقع الصناعية لعرشة كانت التي الطب كليات من قريباً تقع الهند أرجاء مختلف يف رشكات اختيارهم )وتم املوظفون هم الدراسة عنارص وكان الدراسة. مراكز مبثابة أرسهم، وأفراد وللجنس(، للعمر وفقاً طبقات ذات عشوائية عينات وفق والكيميائية )اإلكلينيكية( والرسيرية السلوكية دات املحدِّ حول ومعلومات الحيوية تم الحصول عليها بطرق معيارية )االستبيانات واإلجراءات الرسيرية )أو اإلكلينيكية( والتحليالت الكيميائية الحيوية(. وقد أجري تجميع املعطيات
وتحليلها يف مركز وطني للتنسيق.األمراض خطر عوامل انتشار معدل عن تقريرنا يف أبلغنا املوجودات: عاماً 69 – 20 بني أعامرهم ترتاوح الذين الشباب بني الوعائية القلبية
ممن 10 442 وعددهم االستبيان، استكملوا ممن 19 973 )وعددهم عاماً، 40 العمر متوسط وكان الحيوية(، الكيميائية لالستقصاءات خضعوا فكان مرتفعاً، الخطر مستوى عوامل النتشار معظم اإلجاميل املعدل وبلغ بالنسبة للبدانة 50.9% لدى الرجال و51.9% لدى النساء، وللبدانة املركزية لدى %40.2 التبغ ولتعاطي النساء، لدى و%32.8 الرجال لدى %30.9عن الذايت اإلبالغ انتشار معدل بلغ فيام النساء. لدى و%14.9 الرجال السكري 5.3% وعن ارتفاع ضغط الدم 10.9% وكان هذا أقل من معدل %10.1 بلغت التي الحيوية والكيميائية )اإلكلينيكية( الرسيرية القياسات بالنسبة للسكري و27.7% بالنسبة الرتفاع ضغط الدم. وكان هناك قدر كبري
من عدم التجانس يف انتشار عوامل الخطر بني مراكز الدراسة.االستنتاج: كان هناك عبء مرتفع لعوامل خطر األمراض القلبية الوعائية بني املجموعات السكانية يف املواقع الصناعية يف جميع أرجاء الهند، وميكن استخدام برنامج الرصد كنموذج لتكثري املعطيات يف الهند، ويف البلدان النامية األخرى.
Resumen
Métodos para establecer un sistema de vigilancia de las enfermedades cardiovasculares en poblaciones industriales de la IndiaObjetivo Establecer una red de vigilancia de los factores de riesgo de enfermedades cardiovasculares (ECV) en entornos industriales y estimar la carga de factores de riesgo utilizando instrumentos normalizados.Métodos Llevamos a cabo una encuesta transversal basal (como parte de un programa de vigilancia de las ECV) de las poblaciones industriales de 10 empresas de la India, situadas muy cerca de las escuelas de medicina empleadas como centros de estudio. Los sujetos estudiados eran empleados de esas empresas (seleccionados mediante muestreo aleatorio estratificado por edad y sexo) y sus familiares, y la información referente a los determinantes comportamentales, clínicos y bioquímicos se obtuvo mediante métodos normalizados (cuestionarios, variables clínicas y análisis bioquímicos). La recopilación y el análisis de los datos se hicieron en el centro coordinador nacional.Resultados Notificamos aquí la prevalencia de los factores de
riesgo de ECV entre los individuos de 20 a 69 años (n = 19 973 para la encuesta mediante cuestionario, n = 10 442 para los análisis bioquímicos), con una edad media de 40 años. La prevalencia general de la mayoría de los factores de riesgo fue alta: exceso de peso en el 50,9% de los hombres y el 51,9% de las mujeres, obesidad central en el 30,9% de los hombres y el 32,8% de las mujeres, y consumo de tabaco en el 40,2% de los hombres y el 14,9% de las mujeres. La prevalencia autonotificada de diabetes (5,3%) e hipertensión (10,9%) fue menor que la determinada clínica y bioquímicamente (10,1% y 27,7%, respectivamente). Se observó una notable heterogeneidad en la prevalencia de factores de riesgo entre los centros de estudio.Conclusión Existe una alta carga de factores de riesgo de ECV entre las poblaciones industriales en la India. El sistema de vigilancia puede servir de modelo para repetir la experiencia en este país y en otros países en desarrollo.

469Bulletin of the World Health Organization | June 2006, 84 (6)
ResearchK Srinath Reddy et al. Surveillance system for cardiovascular diseases in India
14. Gupta A, Gupta R, Sarna M, Rastogi S, Gupta VP, Kothari K. Prevalence of diabetes, impaired fasting glucose and insulin resistance syndrome in an urban Indian population. Diabetes Res Clin Prac 2003;61:69-76.
15. Joseph A, Kutty VR, Soman CR. High risk for coronary heart disease in Thiruvananthapuram city: A study of serum lipids and other risk factors. Indian Heart J 2000;52:29-35.
16. Reddy KK, Rao AP, Reddy TP. Socioeconomic status and the prevalence of coronary heart disease risk factors. Asia Pac J Clin Nutr 2002;11:98-103.
17. Gupta R, Gupta VP, Sarna M, Bhatnagar S, Thanvi J, Sharma V, et al. Prevalence of coronary heart disease and risk factors in an urban Indian population: Jaipur Heart Watch-2. Indian Heart J 2002;54:59-66.
18. Misra A, Vikram NK, Arya S, Pandey RM, Dhingra V, Chatterjee A, et al. High prevalence of insulin resistance in postpubertal Asian Indian children is associated with adverse truncal body fat patterning, abdominal adiposity and excess body fat. Int J Obes Relat Metab Disord 2004;28:1217-26.
19. Gopinath N, Chadha SL, Jain P, Shekhawat S, Tandon R. An epidemiological study of obesity in adults in the urban population of Delhi. J Assoc Physicians India 1994;42:212-5.
20. Ramachandran A, Snehalatha C, Satyavani K, Sivasankari S, Vijay V. Metabolic syndrome in urban Asian Indian adults — a population study using modified ATP III criteria. Diabetes Res Clin Pract 2003;60:199-204.
21. Kutty VR, Balakrishnan KG, Jayasree AK, Thomas J. Prevalence of coronary heart disease in the rural population of Thiruvanathapuram district, Kerala, India. Int J Cardiol 1993;39:59-70.
22. Gupta PC. Survey of sociodemographic characteristics of tobacco use among 99,598 individuals in Bombay, India using handheld computers. Tob Control 1996;5:114-20.
23. Reddy NK, Kumar DN, Rayudu NV, Sastry BK, Raju BS. Prevalence of risk factors for coronary atherosclerosis in a cross-sectional population of Andhra Pradesh. Indian Heart J 2002;54:697-701.
24. Chobanian AV, Bakris GL, Black HR, Cushman WC, Green LA, Izzo JL Jr, et al. The seventh report of the Joint National Committee on Prevention, Detection, Evaluation, and Treatment of High Blood Pressure: the JNC 7 report. JAMA 2003;289:2560-72.
25. Alberti KG, Zimmet PZ. Definition, diagnosis and classification of diabetes mellitus and its complications. Part 1: diagnosis and classification of diabetes mellitus; provisional report of a WHO consultation. Diabet Med 1998;15:539-53.
26. Expert Panel on Detection, Evaluation, and Treatment of High Blood Cholesterol in Adults. Executive summary of the third report of the National Cholesterol Education Program (NCEP) expert panel on detection, evaluation, and treatment of high blood cholesterol in adults (Adult Treatment Panel III). JAMA 2001;285:2486-97.
27. International Diabetes Federation: The IDF consensus worldwide definition of the metabolic syndrome. Available from http://www.idf.org/webdata/docs/MetSyndrome_FINAL.pdf
28. Snehalatha C, Viswanathan V, Ramachandran A. Cutoff values for normal anthropometric variables in Asian Indian adults. Diabetes Care 2003; 26:1380-4.
29. International Obesity Task Force (on behalf of the Steering Committee) (2002). The Asia-Pacific perspective: redefining obesity and its treatment. Western Pacific Region. Sydney: Health Communications Australia Pty Limited.
30. McGuinness C, Seccombe DW, Frohlich JJ, Ehnholm C, Sundvall J, Steiner G. Laboratory standardization of a large international clinical trial: the DAIS experience. DAIS Project Group. Diabetes Atherosclerosis Intervention Study. Clin Biochem 2000;33:15-24.

ABulletin of the World Health Organization | June 2006, 84 (6)
ResearchK Srinath Reddy et al. Surveillance system for cardiovascular diseases in India
Table 1. Selected sites, companies and their respective study centres for the sentinel surveillance system, India
Sites Companies Study centres (associated medical colleges)
Bangalore Hindustan Machine Tools Limited Dr BR Ambedkar Medical CollegeCoimbatore Premier Instruments and Controls Limited PSG Institute of Medical Sciences and ResearchDelhi Bharat Electronics Limited All India Institute of Medical SciencesDibrugarh Assam Company Limited — tea estate Assam Medical CollegeHyderabad Bharat Heavy Electricals Limiteds Nizam’s Institute of Medical SciencesLucknow Hindustan Aeronautics Limited King George’s Medical CollegeLudhiana Hero Cycles Limited Christian Medical CollegeNagpur Indo Rama Synthetics (I) Limited Government Medical CollegePune Hindustan Antibiotics Limited BJ Medical CollegeTrivandrum Travancore Titanium Products Limited Sri Chitra Thirunal Institute for Medical Sciences and Technology

B Bulletin of the World Health Organization | June 2006, 84 (6)
ResearchSurveillance system for cardiovascular diseases in India K Srinath Reddy et al.
Table 4. General characteristics of the baseline survey study population from 10 sites across India, stratified by gender, 2002–03
Variable Total Men Women (n = 19 973) (n = 11 898) (n = 8075)
Mean age 39.8 ± 11.9 40.5 ± 11.7 38.7 ± 12.1
Age group (%)20–29 25.1 23.5 27.530–39 23.0 21.7 24.940–49 28.6 28.8 28.450–59 18.3 21.9 13.0> 60 5.0 4.1 6.2Total 100.0 60.0 40.0
Education (%)Professional/postgraduate/graduate 34.1 35.5 32.1Secondary school 43.3 48.9 35.1Up to primary/literate 10.5 9.1 12.5Illiterate 12.1 6.5 20.2
Occupation (%)Professional 5.5 7.8 1.9Trained/clerical 18.1 22.9 10.5Skilled/semi-skilled 32.4 47.3 9.3Unskilled 10.0 10.2 9.8Unemployed 10.0 11.9 7.0Housewife 24.0 0.0 61.5
Tobacco use (%)Ever used 33.6 46.1 15.2Current usea 30.0 40.2 14.9Current smoking 12.6 21.0 0.2Current chewing 9.0 13.3 2.6Current snuff use 10.7 9.5 12.4Other form 0.7 0.4 1.3
Alcohol (%)Never used 73.9 62.4 90.9Current regular use b 11.9 15.6 6.4Current occasional usec 12.5 19.3 2.4
Physical activity (%)Very light 3.4 3.1 4.6Light 32.2 32.1 32.9Moderate 51.4 50.3 55.9Heavy 13.0 14.5 6.6
Diabetes (%)Self-reported 5.3 5.9 4.4
Hypertension (%)Self-reported 10.9 10.6 11.2
a Use of tobacco products in any form in the previous 30 days.b Alcohol intake for more than three times (average) a week.c Alcohol intake for more than three times a month, but less than three times a week.

CBulletin of the World Health Organization | June 2006, 84 (6)
ResearchK Srinath Reddy et al. Surveillance system for cardiovascular diseases in India
Table 7. Prevalence of current tobacco use, diabetes, hypertension and metabolic syndrome in ninea industrial populations, India, 2002–03
Sites Current tobacco use Diabetes Hypertension Metabolic syndrome % (95 confidence interval) % (95 confidence interval) % (95 confidence interval) % (95 confidence interval)
Men Women Men Women Men Women Men Women
Bangalore 27.4 1.8 12.1 9.1 36.8 26.8 24.7 46.3 (24.5–30.3) (1.0–2.8) (9.0–15.7) (6.4–12.6) (31.9–42.2) (21.2–33.2) (20.4–29.2) (40.9–51.7)
Coimbatore 29.5 4.0 7.5 8.1 21.9 21.2 17.4 43.0 (26.9–32.2) (2.9–5.4) (5.5–9.9) (5.7–11.1) (16.9–27.7) (15.8–27.1) (14.3–20.7) (38.1–47.9)
Delhi 36.5 2.0 12.5 7.3 27.1 22.1 18.8 32.2 (34.5–38.4) (1.2–3.0) (11.2–13.9) (5.9–9.1) (23.8–30.7) (17.1–27.8) (17.2–20.4) (29.4–35.1)
Dibrugarh 89.9 77.8 2.8 1.7 29.9 32.7 21.5 18.0 (88.1–91.5) (75.4–80.0) (1.5–4.8) (0.7–3.6) (25.3–34.8) (28.3–37.5) (17.6–25.8) (14.1–22.4)
Hyderabad 22.6 4.4 15.1 11.9 41.0 34.7 26.8 47.3 (19.8–25.4) (2.7–6.7) (12.4–18.0) (8.5–16.1) (35.9–46.0) (27.2–42.9) (23.4–30.3) (41.4–53.1)
Lucknow 32.2 2.3 12.6 8.7 43.7 31.7 25.2 33.4 (29.2–35.2) (1.3–3.5) (9.7–16.0) (6.1–12.0) (38.9–48.5) (26.1–37.9) (21.2–29.5) (28.6–38.4)
Nagpur 48.4 2.6 4.4 3.8 19.5 12.3 14.7 22.6 (45.7–50.9) (1.6–3.8) (2.8–6.7) (2.0–6.6) (15.3–24.7) (6.6–19.3) (11.5–18.3) (17.9–27.9)
Pune 32.6 10.3 9.8 7.2 26.2 25.4 12.8 39.6 (29.9–35.2) (8.6–12.1) (7.1–13.0) (5.0–10.0) (21.6–31.5) (20.8–30.8) (9.8–16.3) (34.9–44.3)
Trivandrum 30.6 0.9 17.4 15.3 30.4 23.9 31.6 47.2 (27.9–33.3) (0.4–1.6) (14.7–20.5) (12.2–18.9) (25.7–35.4) (18.5–29.9) (28.0–35.2) (42.5–41.8)
a In Ludhiana, families were not surveyed because of the stipulation of the management of the participating industry and therefore results are not included.