methods for characterising effects of liquefaction in terms of … · s. van ballegooy, p.j. malan,...
TRANSCRIPT

Methods for characterising effects of liquefaction in
terms of damage severity
S. van Ballegooy, P.J. Malan, M.E. Jacka, V.I.M.F. Lacrosse, J.R. Leeves
& J.E. Lyth Tonkin & Taylor Limited
H. Cowan New Zealand Earthquake Commission
ABSTRACT:
This paper describes the development of a new method, the Liquefaction Severity Number (LSN), to assess
vulnerability of land to liquefaction-induced damage by comparing measured damage attributes with parameters
calculated from approximately 1500 Cone Penetration Tests (CPT’s). The paper presents a review of the
published literature relating to land vulnerability and the observed effects of strong earthquake shaking in
Canterbury, New Zealand where various parameters have been calculated and correlated with the observed
damage attributes. A sample CPT is presented, followed by preliminary results for two parameters plotted
against land and foundation damage measured around Canterbury. The paper concludes that LSN is an
alternative method for characterising vulnerability to liquefaction in residential areas.
Keywords: Liquefaction vulnerability, Liquefaction Severity Number, Liquefaction Potential Index.
1. INTRODUCTION
The Canterbury region of New Zealand has been affected by a sequence of earthquakes and
aftershocks since 4 September 2010. The four most significant quakes and aftershocks occurred on 4
September 2010, 22 February, 13 June and 23 December 2011. The shaking from these events
triggered locally severe liquefaction. The incidence of subsidence associated with voluminous
ejection of liquefied material, and other effects such as lateral spreading has been a strong determinant
of foundation deformation damage to residential dwellings. However, while the liquefaction triggering
was extensive in some areas, it was also observed to be of little to no consequence to the built
environment in other areas, where more serious effects might have been anticipated from the soil
properties alone. These variations have been observed in each of the damaging Canterbury
earthquakes, suggesting that criteria other than soil properties influence the vulnerability of a given
site to consequential effects of liquefaction.
There is extensive literature on the triggering of liquefaction within soil strata subject to seismic
shaking, but substantially less on vulnerability indicators that address the consequences of liquefaction
for residential dwellings on shallow foundation systems. This paper provides a review of published
methods that predict whether liquefaction is likely to be consequential at the ground surface and
compares the results obtained for these methodologies from the damage observations and soil test
results obtained after each of the major earthquake events in Canterbury. A new vulnerability
parameter, the Liquefaction Severity Number (LSN) is presented and compared to the measured
damage datasets. Initial analyses indicate that it could provide a better fit to measured damage than
the Liquefaction Potential Index (LPI) presented by Iwasaki (1982).
2. LIQUEFACTION DAMAGE VULNERABILITY INDICATORS
Ishihara (1985) published observations on the protective effect of an upper layer of non-liquefied
material against the expression of liquefaction at the ground surface. The paper contained graphs that
plotted thickness of the non liquefied upper layer (H1), referred to herein as the crust, and the
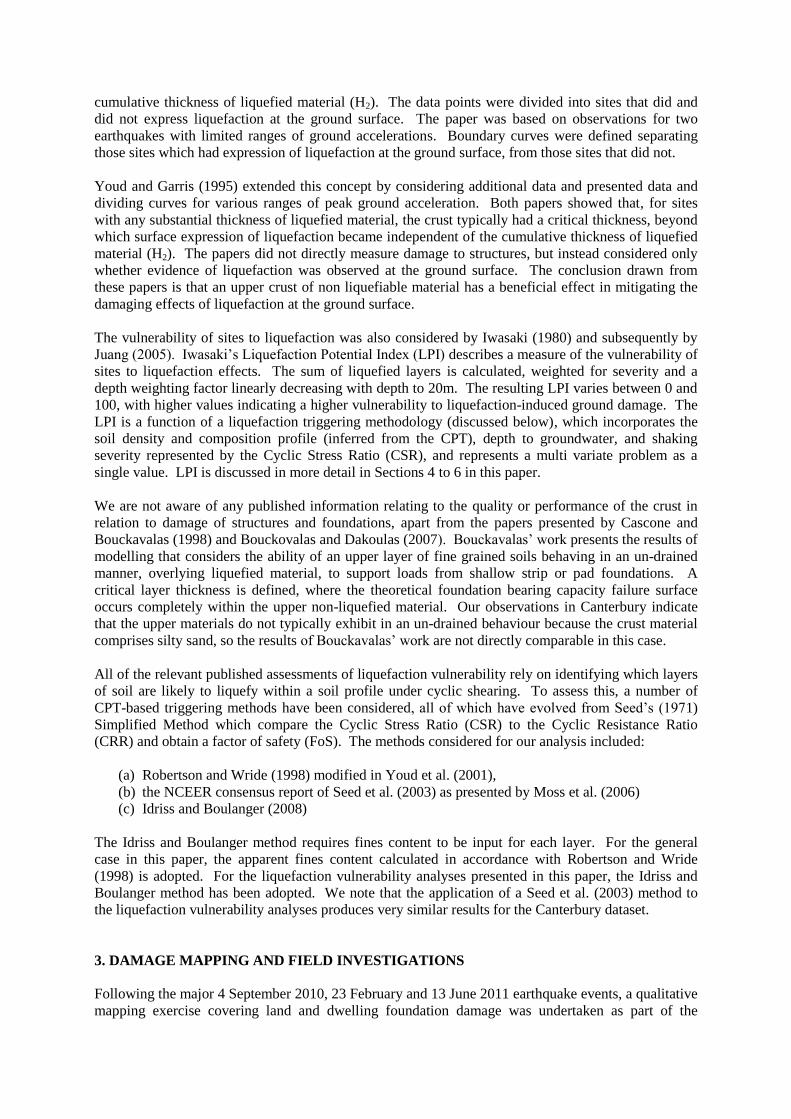
cumulative thickness of liquefied material (H2). The data points were divided into sites that did and
did not express liquefaction at the ground surface. The paper was based on observations for two
earthquakes with limited ranges of ground accelerations. Boundary curves were defined separating
those sites which had expression of liquefaction at the ground surface, from those sites that did not.
Youd and Garris (1995) extended this concept by considering additional data and presented data and
dividing curves for various ranges of peak ground acceleration. Both papers showed that, for sites
with any substantial thickness of liquefied material, the crust typically had a critical thickness, beyond
which surface expression of liquefaction became independent of the cumulative thickness of liquefied
material (H2). The papers did not directly measure damage to structures, but instead considered only
whether evidence of liquefaction was observed at the ground surface. The conclusion drawn from
these papers is that an upper crust of non liquefiable material has a beneficial effect in mitigating the
damaging effects of liquefaction at the ground surface.
The vulnerability of sites to liquefaction was also considered by Iwasaki (1980) and subsequently by
Juang (2005). Iwasaki’s Liquefaction Potential Index (LPI) describes a measure of the vulnerability of
sites to liquefaction effects. The sum of liquefied layers is calculated, weighted for severity and a
depth weighting factor linearly decreasing with depth to 20m. The resulting LPI varies between 0 and
100, with higher values indicating a higher vulnerability to liquefaction-induced ground damage. The
LPI is a function of a liquefaction triggering methodology (discussed below), which incorporates the
soil density and composition profile (inferred from the CPT), depth to groundwater, and shaking
severity represented by the Cyclic Stress Ratio (CSR), and represents a multi variate problem as a
single value. LPI is discussed in more detail in Sections 4 to 6 in this paper.
We are not aware of any published information relating to the quality or performance of the crust in
relation to damage of structures and foundations, apart from the papers presented by Cascone and
Bouckavalas (1998) and Bouckovalas and Dakoulas (2007). Bouckavalas’ work presents the results of
modelling that considers the ability of an upper layer of fine grained soils behaving in an un-drained
manner, overlying liquefied material, to support loads from shallow strip or pad foundations. A
critical layer thickness is defined, where the theoretical foundation bearing capacity failure surface
occurs completely within the upper non-liquefied material. Our observations in Canterbury indicate
that the upper materials do not typically exhibit in an un-drained behaviour because the crust material
comprises silty sand, so the results of Bouckavalas’ work are not directly comparable in this case.
All of the relevant published assessments of liquefaction vulnerability rely on identifying which layers
of soil are likely to liquefy within a soil profile under cyclic shearing. To assess this, a number of
CPT-based triggering methods have been considered, all of which have evolved from Seed’s (1971)
Simplified Method which compare the Cyclic Stress Ratio (CSR) to the Cyclic Resistance Ratio
(CRR) and obtain a factor of safety (FoS). The methods considered for our analysis included:
(a) Robertson and Wride (1998) modified in Youd et al. (2001),
(b) the NCEER consensus report of Seed et al. (2003) as presented by Moss et al. (2006)
(c) Idriss and Boulanger (2008)
The Idriss and Boulanger method requires fines content to be input for each layer. For the general
case in this paper, the apparent fines content calculated in accordance with Robertson and Wride
(1998) is adopted. For the liquefaction vulnerability analyses presented in this paper, the Idriss and
Boulanger method has been adopted. We note that the application of a Seed et al. (2003) method to
the liquefaction vulnerability analyses produces very similar results for the Canterbury dataset.
3. DAMAGE MAPPING AND FIELD INVESTIGATIONS
Following the major 4 September 2010, 23 February and 13 June 2011 earthquake events, a qualitative
mapping exercise covering land and dwelling foundation damage was undertaken as part of the

coordinated response by agencies of the New Zealand Government. Land damage mapping of
residential properties was carried out to assess the extent and severity of surface liquefaction
manifestation. The mapping was carried out by a small team of senior engineers who cross-checked
observations to ensure broad consistency across the assessments. A more detailed land damage
inspection programme was undertaken after each of the rapid land inspections by a team of
approximately 400 engineers for insurance assessment purposes. As part of the detailed land damage
assessment on each residential property, damage to the foundations of homes was also recorded based
on set criteria (refer to the right hand columns in Figure 1).
Figure 1. Land damage and residential dwelling foundation damage categories and criteria
The land damage mapping was based on the observed surface expression of liquefaction caused by
each major earthquake. Between each of the events the ejected liquefied material was removed and
major cracks filled. Therefore, the qualitative land damage mapping recorded the incremental effects
of each earthquake. Conversely the residential foundation deformation dataset was based on
assessments of the cumulative observed foundation deformation, for all previous events prior to the
inspection date. Figure 1 summarises the criteria for the different land damage and dwelling damage
categories1.
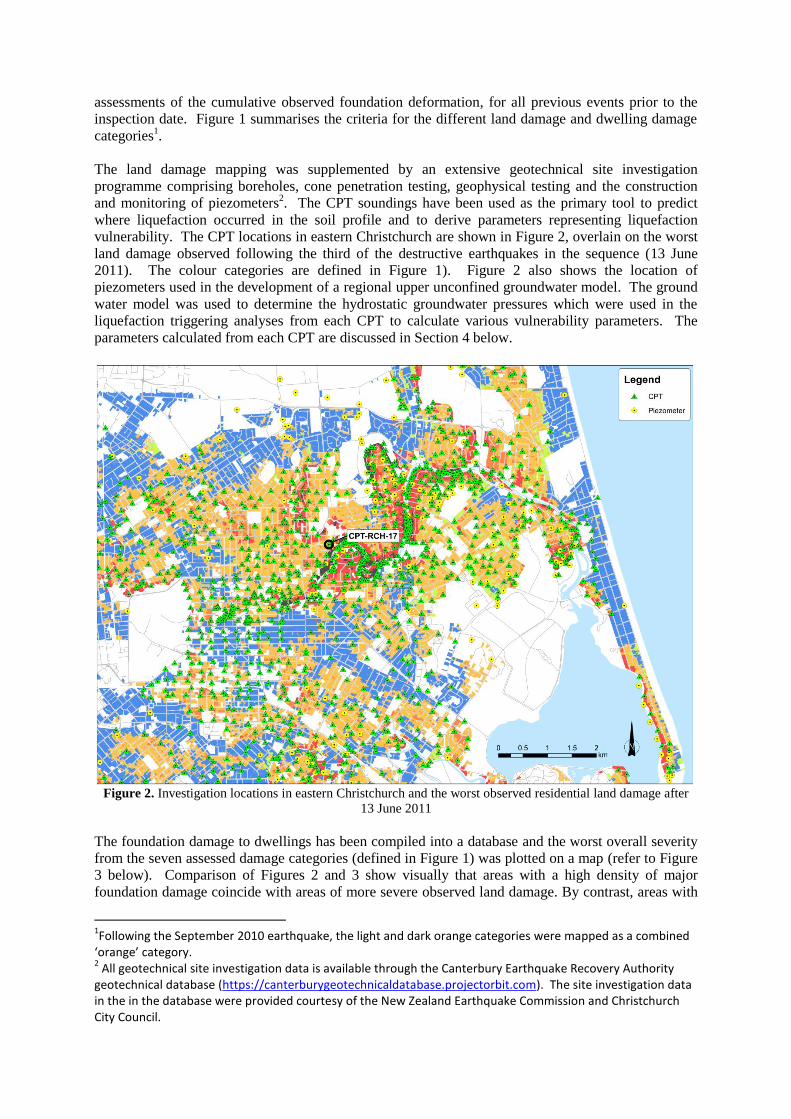
The land damage mapping was supplemented by an extensive geotechnical site investigation
programme comprising boreholes, cone penetration testing, geophysical testing and the construction
and monitoring of piezometers2. The CPT soundings have been used as the primary tool to predict
where liquefaction occurred in the soil profile and to derive parameters representing liquefaction
vulnerability. The CPT locations in eastern Christchurch are shown in Figure 2, overlain on the worst
land damage observed following the third of the destructive earthquakes in the sequence (13 June
2011). The colour categories are defined in Figure 1). Figure 2 also shows the location of
piezometers used in the development of a regional upper unconfined groundwater model. The ground
water model was used to determine the hydrostatic groundwater pressures which were used in the
liquefaction triggering analyses from each CPT to calculate various vulnerability parameters. The
parameters calculated from each CPT are discussed in Section 4 below.
Figure 2. Investigation locations in eastern Christchurch and the worst observed residential land damage after
13 June 2011
The foundation damage to dwellings has been compiled into a database and the worst overall severity
from the seven assessed damage categories (defined in Figure 1) was plotted on a map (refer to Figure
3 below). Comparison of Figures 2 and 3 show visually that areas with a high density of major
foundation damage coincide with areas of more severe observed land damage. By contrast, areas with
1Following the September 2010 earthquake, the light and dark orange categories were mapped as a combined
‘orange’ category. 2 All geotechnical site investigation data is available through the Canterbury Earthquake Recovery Authority
geotechnical database (https://canterburygeotechnicaldatabase.projectorbit.com). The site investigation data in the in the database were provided courtesy of the New Zealand Earthquake Commission and Christchurch City Council.

a low density of foundation damage coincide with areas with none or minor observed land damage.
This shows, not surprisingly, that land damage resulting from the triggering of liquefaction and
foundation deformation damage of residential dwellings are strongly correlated.
Figure 3. Assessed residential dwelling foundation deformation damage after 13 June 2011
4. VULNERABILITY PARAMETERS
For each CPT, the following three vulnerability parameters were calculated based on the Idriss and
Boulanger (2008) liquefaction triggering method:
1. Cumulative thickness of liquefaction (CTL)
2. Liquefaction Potential Index (LPI)
Calculated in accordance with Iwasakai (1982), Where W(z) = 10 – 0.5z, and F1 = 1-FS for
FS<1.0 and F1 = 0 for FS>1.0. z is the depth below the ground surface.
(4.1)
3. Liquefaction Severity Number (LSN)
A new parameter developed to represent vulnerability and discussed in more detail below,
where εv is the calculated volumetric consolidation strain in the subject layer and z is the depth
below the ground surface
(4.2)
Iwasaki’s LPI was the first published index for assessing the vulnerability of land subjected to
liquefaction effects. LPI provides a simple method for assessing the vulnerability of sites, with
published ranges indicating the severity of liquefaction. Sites with an LPI of more than 5 have a high
liquefaction risk and more than 15 indicates very high risk (Iwasaki, 1982).
A sensitivity study of LPI as a function of PGA for the CPT soundings undertaken in Christchurch

indicates that LPI responds in a broadly linear manner as PGA increases, which is shown graphically
for a single CPT in Section 5. The nature of the LPI calculation means that potentially liquefiable
layers only contribute to the LPI when their calculated FoS falls below 1.0, and that the lower the FoS,
the higher the contribution.
LPI values have been computed for each of the major earthquake events based on the interpolated
seismic demand at each location. These computed LPI values have been plotted against the
corresponding observed land damage and dwelling foundation damage datasets. The results are
presented in Section 6. The results show that the observed land damage and foundation damage
increases linearly with increasing LPI for each of the earthquake events. However, the slope is
different for each event which indicates that correlation between LPI and land damage or foundation
damage is event specific and produces an inconsistent response across the three events.
In this study we have attempted to provide a better indicator of vulnerability, the Liquefaction Severity
Number. This is an extension of the philosophy of the LPI, and represents intensity of liquefaction
using volumetric densification strain as a proxy, with depth weighting by a hyperbolic (1/z) rather than
a linear reduction. The intent was that the LSN should more heavily weight the contribution to ground
surface damage from soil layers which liquefy closer to the ground surface compared to those layers
that liquefy at greater depths. This inference was supported by general observations during the rapid
land damage mapping work, particularly the observation that ejection of liquefied material tended to
result in significant differential settlements, and the results of the site investigation programme. The
use of volumetric densification (Zhang, Robertson Brachman, 2002) as a proxy for prediction of
consequential liquefaction has two benefits:
1. The contribution starts as excess pore pressures rise when FoS < 2.0, and include smooth
transitions when FoS < 1.0, and,
2. The maximum consequence contribution of a soil layer which liquefies is limited by the
calculated strain which trends to a limiting value depending on the initial state of the soil as
represented by CPT tip resistance.
It should be noted, that both the Ishihara and Yoshimine (1992) and Zhang, Robertson Brachman
(2002) volumetric densification methods were assessed. However, in this paper, we have only
provided the results of the Zhang, Robertson Brachman (2002) method as it provides a better fit to the
damage data sets discussed in Section 6.
5. SINGLE CPT
A single CPT from Richmond, Christchurch (location shown in Figure 2) has been presented for
illustrative purposes in this paper (Figure 4). This is a representative CPT that has been assessed using
the seismic demand from the 4 September 2010, 22 February and 13 June 2011 earthquake events and
uses the corresponding groundwater depth immediately prior to each event, based on the regional
groundwater model. The results show the relationship between CSR and CRR with depth, the
calculated FoS with depth and the calculated volumetric strains with depth. Figure 5 then shows the
contribution of each layer to the selected calculated vulnerability parameters described in Section 4.
Figure 5 also shows the difference in contribution from shallower layers for LSN compared to LPI.
Figures 4 and 5 show that the 23 February 2011 earthquake event caused the greatest amount of
liquefaction triggering (and the highest CTL, LPI and LSN values) in the soil profile at the Richmond
site, and the least amount of liquefaction triggering (and the lowest CTL, LPI and LSN values) from
the 4 September 2010 event. This is consistent with the observed severity of land and dwelling
damage caused by each event. The response of calculated parameters: crust thickness, CTL, LPI and
LSN to variations in PGA are presented in Figure 6. It shows that there is a particular sensitivity in
the PGA range of 0.15g to 0.25g, where layers within the CPT trace begin to drop below a FoS = 1..
Below 0.1g, LSN is insensitive to PGA and below 0.15g CTL and LPI are insensitive to the PGA. We
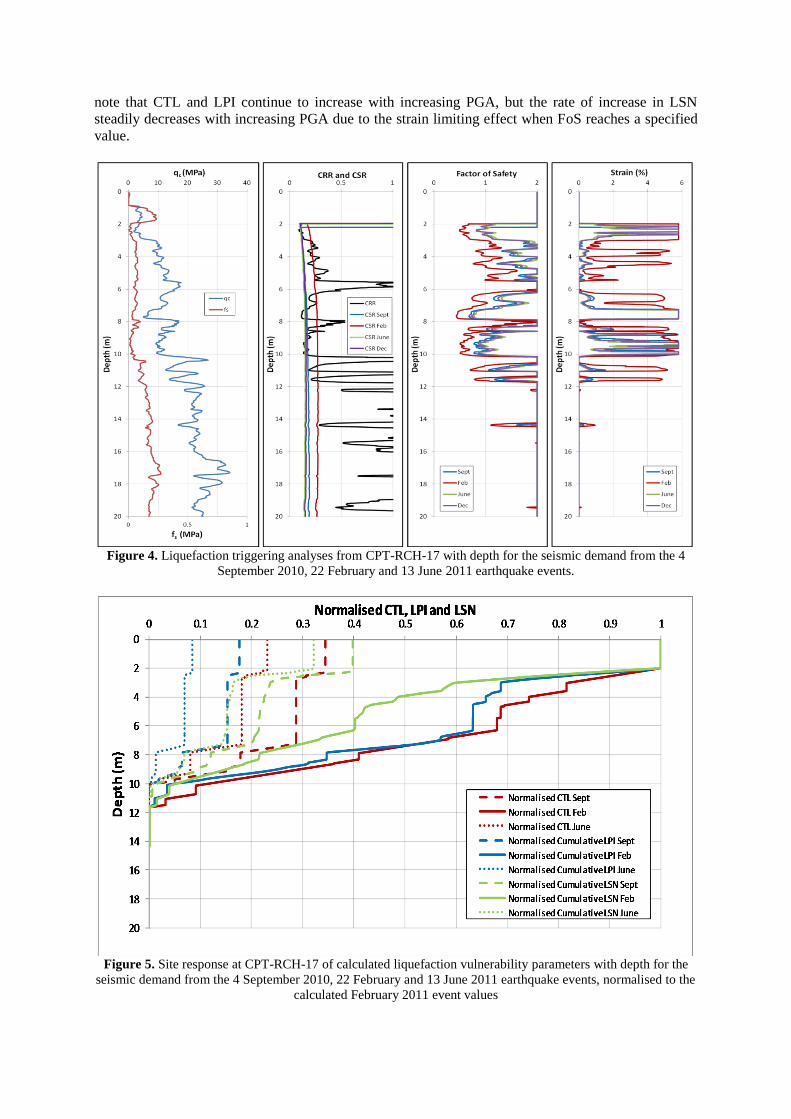
note that CTL and LPI continue to increase with increasing PGA, but the rate of increase in LSN
steadily decreases with increasing PGA due to the strain limiting effect when FoS reaches a specified
value.
Figure 4. Liquefaction triggering analyses from CPT-RCH-17 with depth for the seismic demand from the 4
September 2010, 22 February and 13 June 2011 earthquake events.
Figure 5. Site response at CPT-RCH-17 of calculated liquefaction vulnerability parameters with depth for the
seismic demand from the 4 September 2010, 22 February and 13 June 2011 earthquake events, normalised to the
calculated February 2011 event values

Figure 6. Site response at CPT-RCH-17 of calculated parameters to varying PGA for a magnitude 6.3
earthquake and pre 23 February 2011 ground water levels.
The LPI and LSN values have been compared to the nearby damage attributes measured around
Canterbury, and a detailed assessment of these results will be the subject of future publications.
However, preliminary results from these analyses are presented in Section 6.
6. CORRELATION OF DAMAGE DATA WITH LPI AND LSN
This section presents a brief introduction to the data analyses that are currently in progress and
provides some selected preliminary results. The available CPT traces (around 1,500) have been
analysed using inputs based on the interpolated seismic demand from the 4 September 2010, 22
February and 13 June 2011 strong motion records3 and the pre-earthquake ground water levels. These
inputs were used to calculate parameters for each CPT using the different triggering methods
presented in Section 2, combined with deformation calculations from Zhang, Robertson and Brachman
(2002, 2004) and Ishihara and Yoshimine (1992). The calculated parameters have been plotted against
measured land damage, dwelling damage and measured settlement (derived from LiDAR survey data
obtained after each event) for residential sites within 40 m of each CPT. This typically generated
datasets of between 5,000 and 10,000 points, depending on the earthquake event considered and the
number of available measured / observed damage attributes4.
The results were initially used to prepare a plot similar to that of Youd and Garris (1995), using a two
layer system (H1 plotted against H2). Practically this was difficult to apply because the crust thickness
and the thickness of the underlying liquefying soil layer, H2, are difficult to define in a soil profile
where there is often more than one liquefying soil layer sandwiched between non liquefying layers.
By assuming CTL = H2, the data indicated that almost all H1 crust thicknesses were typically lower
than Youd and Garris’ required crust thickness to protect against surface liquefaction effects.
Therefore, sites with both surface expression and no surface expression of liquefaction plot on top of
each other with no clear dividing line for the Christchurch damage datasets.
3 All strong motion data utilised in this study were recorded by the New Zealand GeoNet (www.geonet.org.nz)
4 All land damage observations are available through the Canterbury Earthquake Recovery Authority
geotechnical database (https://canterburygeotechnicaldatabase.projectorbit.com). The land damage observations in the database were provided courtesy of the New Zealand Earthquake Commission.
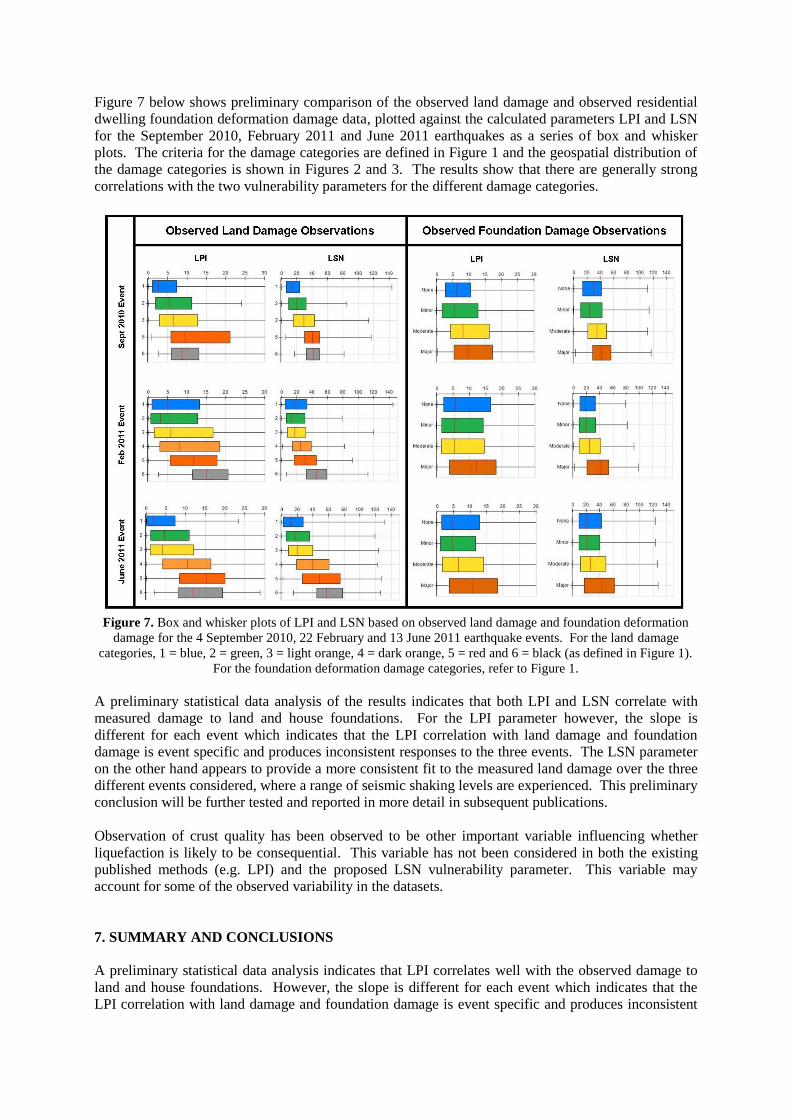
Figure 7 below shows preliminary comparison of the observed land damage and observed residential
dwelling foundation deformation damage data, plotted against the calculated parameters LPI and LSN
for the September 2010, February 2011 and June 2011 earthquakes as a series of box and whisker
plots. The criteria for the damage categories are defined in Figure 1 and the geospatial distribution of
the damage categories is shown in Figures 2 and 3. The results show that there are generally strong
correlations with the two vulnerability parameters for the different damage categories.
Figure 7. Box and whisker plots of LPI and LSN based on observed land damage and foundation deformation
damage for the 4 September 2010, 22 February and 13 June 2011 earthquake events. For the land damage
categories, 1 = blue, 2 = green, 3 = light orange, 4 = dark orange, 5 = red and 6 = black (as defined in Figure 1).
For the foundation deformation damage categories, refer to Figure 1.
A preliminary statistical data analysis of the results indicates that both LPI and LSN correlate with
measured damage to land and house foundations. For the LPI parameter however, the slope is
different for each event which indicates that the LPI correlation with land damage and foundation
damage is event specific and produces inconsistent responses to the three events. The LSN parameter
on the other hand appears to provide a more consistent fit to the measured land damage over the three
different events considered, where a range of seismic shaking levels are experienced. This preliminary
conclusion will be further tested and reported in more detail in subsequent publications.
Observation of crust quality has been observed to be other important variable influencing whether
liquefaction is likely to be consequential. This variable has not been considered in both the existing
published methods (e.g. LPI) and the proposed LSN vulnerability parameter. This variable may
account for some of the observed variability in the datasets.
7. SUMMARY AND CONCLUSIONS
A preliminary statistical data analysis indicates that LPI correlates well with the observed damage to
land and house foundations. However, the slope is different for each event which indicates that the
LPI correlation with land damage and foundation damage is event specific and produces inconsistent
responses to the three events. It is also noted that LPI values greater than 5 were calculated for which
land and dwelling damage was recorded, which is outside of the ranges published by Iwasaki (1982).
This is potentially because the correlation of LPI to damage is event and location specific.
The LSN vulnerability parameter more heavily weights the contribution to ground surface damage
from soil layers which liquefy closer to the ground surface compared to those layers that liquefy at
greater depths. In addition the LSN vulnerability parameter becomes independent of PGA beyond a
specific level depending on the initial density state of the soil. Preliminary analyses indicate that for
the range of seismic demands imposed by the recent earthquakes, the LSN vulnerability parameter
provides a more consistent correlation with the available damage datasets for all events. This
preliminary conclusion will be further tested and reported in more detail in subsequent publications.
ACKNOWLEDGEMENT
This work would not have been possible without the data obtained by the New Zealand hazard monitoring
system, GeoNet and the extensive remote sensing and ground investigations of land and dwelling damage,
sponsored by the New Zealand Government through its agencies the Earthquake Commission of New Zealand,
the Ministry of Civil Defence and Emergency Management and Land Information New Zealand.
9. REFERENCES
Bouckovalas, G. & Dakoulas, P. (2007) Liquefaction performance of shallow foundation in presence of a soil
crust, Earthquake Geotechnical Engineering, Chapter 11, 245-276
Cascone, E. & Bouckovalas, G (1998) Seismic bearing capacity of footings on saturated sand with a clay cap
11th European Conference on Earthquake Engineering, 1998. Balkema, Rotterdam, ISBN 90 5410 982 3
Idriss, I.M. & Boulanger, R.W. (2008). Soil liquefaction during earthquakes, MNO–12, Earthquake Engineering
Research Institute, 242p
Ishihara, K. (1985). Stability of Natural Deposits During Earthquakes Proceedings of the 11th International
Conference on Soil Mechanics and Foundation Engineering, San Francisco, 1:321376
Ishihara, K. & Yoshimine, M. (1992). Evaluation of settlements in sand deposits following liquefaction during
earthquakes, Soils and Foundations, 32 (1), 173–188
Juang, C.H, Yuan, H., Kun, D., Yang, S.H., & Christopher, R.A. (2005) Estimating severity of liquefaction-
induced damage near foundation Soil Dynamics and Earthquake Engineering 25 pp403-411
Moss, R. E. S., Seed, R. B., Kayen, R. E., Stewart, J. P., Kiureghian, A. D., & Cetin, K. O., (2006). CPT-based
probabilistic and deterministic assessment of in situ seismic soil liquefaction potential, ASCE Journal of
Geotechnical and Geoenvironmental Engineering, Vol. 132(8), 1032-1051,
Robertson, P.K. & Wride, C.E., (1998). Evaluating cyclic liquefaction potential using the cone penetration test,
Canadian Geotechnical Journal, 35:442 – 459
Seed, H.B. & Idriss, I.M. (1971). Simplified procedure for evaluating soil liquefaction potential: Proceeding of
the American Society of Civil Engineers, Journal of the Soil Mechanics and Foundations Division, v. 93,
no. SM9, 1249-1273
Seed, R.B., Cetin, K.O., Moss, R.E.S., Kammerer, A., Wu, J., Pestana, J. and Riemer, M., Sancio, R.B., Bray,
J.D., Kayen, R.E., & Faris, A. (2003). Recent advances in soil liquefaction engineering: a unified and
consistent framework White Paper for Keynote Presentation, 26th Annual ASCE Los Angeles Geotechnical
Spring Seminar, Long Beach EERC report 2003-06
Youd, T.L. & Garris, C.T. (1995). Liquefaction-induced ground surface disruption ASCE Journal of
Geotechnical Engineering, 121 (11), 805 – 809
Youd, T.L., Idriss, I.M., Andrus, R.D., Arango, I., Castro, G., Christian, J.T., Dobry, R., Liam Finn, W.D.,
Harder Jr., L.H., Hynes, M.E., Ishihara, K., Koester, J.P., Liao, S.S.C, Marcuson, W.F., Marting, G.R.,
Mitchell, J.K., Moriwaki, Y., Power, M.S., Robertson, P.K., Seed, R.B, & Stokoe, K.H. (2001).
Liquefaction Resistance of Soils: Summary from the 1996 NCEER and 1998 NCEER/NSF Workshops on
Evaluation of Liquefaction Resistance of Soils: Journal of Geotechnical and Geoenvironmental
Engineering, 817 – 833
Zhang, G., Robertson, P. K., Brachman, R. W. I. (2002). Estimating liquefaction-induced ground settlements
from CPT for level ground, Canadian Geotechnical Journal, 39, 1168–80
Zhang, G., Robertson, P. K., & Brachman, R. W. I., (2004). Estimating liquefaction-induced lateral
displacements using the standard penetration test or cone penetration test Journal of Geotechnical and
Geoenvironmental Engineering 130, 861