methodology review seminar - am bestseminar etc.venues st.paul’s, london 15 november 2017 1...
TRANSCRIPT

Methodology Review Seminar
etc.venues St.Paul’s, London
15 November 2017
1

Agenda: Methodology Review Seminar 14:15 Welcome & Introduction Overview of the Revised Best's
Credit Rating Methodology Greg Carter, Managing Director, Analytics – EMEA
14:25 Best’s Capital Adequacy Ratio (BCAR) – Key Changes & Impacts Mathilde Jakobsen, Director, Analytics
14:40 Mature Markets Benchmark Analysis - Building Block Approach Carlos Wong-Fupuy, Senior Director
15:00 Emerging Markets Benchmark Analysis - Building Block Approach Mahesh Mistry, Senior Director, Analytics
15:20 Q&A: Interactive Discussion 16:00 Close
2

Disclaimer © AM Best Company (AMB) and/or its licensors and affiliates. All rights reserved. ALL INFORMATION CONTAINED HEREIN IS PROTECTED BY COPYRIGHT LAW AND NONE OF SUCH INFORMATION MAY BE COPIED OR OTHERWISE REPRODUCED, REPACKAGED, FURTHER TRANSMITTED, TRANSFERRED, DISSEMINATED, REDISTRIBUTED OR RESOLD, OR STORED FOR SUBSEQUENT USE FOR ANY SUCH PURPOSE, IN WHOLE OR IN PART, IN ANY FORM OR MANNER OR BY ANY MEANS WHATSOEVER, BY ANY PERSON WITHOUT AMB’s PRIOR WRITTEN CONSENT. All information contained herein is obtained by AMB from sources believed by it to be accurate and reliable. Because of the possibility of human or mechanical error as well as other factors, however, all information contained herein is provided “AS IS” without warranty of any kind. Under no circumstances shall AMB have any liability to any person or entity for (a) any loss or damage in whole or in part caused by, resulting from, or relating to, any error (negligent or otherwise) or other circumstance or contingency within or outside the control of AMB or any of its directors, officers, employees or agents in connection with the procurement, collection, compilation, analysis, interpretation, communication, publication or delivery of any such information, or (b) any direct, indirect, special, consequential, compensatory or incidental damages whatsoever (including without limitation, lost profits), even if AMB is advised in advance of the possibility of such damages, resulting from the use of or inability to use, any such information. The credit ratings, financial reporting analysis, projections, and other observations, if any, constituting part of the information contained herein are, and must be construed solely as, statements of opinion and not statements of fact or recommendations to purchase, sell or hold any securities, insurance policies, contracts or any other financial obligations, nor does it address the suitability of any particular financial obligation for a specific purpose or purchaser. Credit risk is the risk that an entity may not meet its contractual, financial obligations as they come due. Credit ratings do not address any other risk, including but not limited to, liquidity risk, market value risk or price volatility of rated securities. NO WARRANTY, EXPRESS OR IMPLIED, AS TO THE ACCURACY, TIMELINESS, COMPLETENESS, MERCHANTABILITY OR FITNESS FOR ANY PARTICULAR PURPOSE OF ANY SUCH RATING OR OTHER OPINION OR INFORMATION IS GIVEN OR MADE BY AMB IN ANY FORM OR MANNER WHATSOEVER. Each credit rating or other opinion must be weighed solely as one factor in any investment or purchasing decision made by or on behalf of any user of the information contained herein, and each such user must accordingly make its own study and evaluation of each security or other financial obligation and of each issuer and guarantor of, and each provider of credit support for, each security or other financial obligation that it may consider purchasing, holding or selling.
3

Disclaimer US Securities Laws explicitly prohibit the issuance or maintenance of a credit rating where a person involved in the sales or marketing of a product or service of the CRA also participates in determining or monitoring the credit rating, or developing or approving procedures or methodologies used for determining the credit rating.
No part of this presentation amounts to sales / marketing activity and A.M. Best’s Rating Division employees are prohibited from participating in commercial discussions.
Any queries of a commercial nature should be directed to A.M. Best’s Market Development function.
4

Update on Best's Credit Rating Methodology (BCRM)
Greg Carter Managing Director, Analytics - EMEA
5

BCRM Building Blocks
6

BCRM Building Blocks
Assessment
Strongest
Very Strong
Strong
Adequate
Weak
Very Weak
Assessment
Very Strong +2
Strong +1
Adequate 0
Marginal -1
Weak -2
Very Weak -3
Assessment
Very Favorable +2
Favorable +1
Neutral 0
Limited -1
Very Limited -2
Assessment
Very Strong +1
Appropriate 0
Marginal -1
Weak -2
Very Weak -3/4
7

EMEA – Balance Sheet Strength
Strongest 8.3%
Very Strong 64.5%
Strong 23.7%
Adequate 3.6%
EMEA – Balance Sheet Strength Distribution
0
10
20
30
40
50
60
70
80
VaR 95% VaR 99% VaR 99.5% VaR 99.6% VaR 99.8%
Med
ian
BC
AR S
core
Strongest Very Strong Strong Adequate
EMEA – Median BCAR Score by Balance Sheet Strength
Source: A.M. Best data and research
8

EMEA – Balance Sheet Strength
8 6 14 24 28
46
100 100 75
80 65
72
42
100
16 12 4
0
10
20
30
40
50
60
70
80
90
100
aa aa- a+ a a- bbb+ bbb bbb-
(%)
Strongest Very Strong Strong Adequate
EMEA – Balance Sheet Strength by Long-Term Issuer Credit Rating
Source: A.M. Best data and research
9

BCRM Building Blocks
Assessment
Strongest
Very Strong
Strong
Adequate
Weak
Very Weak
Assessment
Very Strong +2
Strong +1
Adequate 0
Marginal -1
Weak -2
Very Weak -3
Assessment
Very Favorable +2
Favorable +1
Neutral 0
Limited -1
Very Limited -2
Assessment
Very Strong +1
Appropriate 0
Marginal -1
Weak -2
Very Weak -3/4
10

EMEA – Operating Performance
Strong +1 42.0%
Adequate 0 48.5%
Marginal -1 9.5%
EMEA – Operating Performance Notch Distribution
18 22
4 13
34
66
53 39 58
100 100 88
66
32 29 39 38
0
10
20
30
40
50
60
70
80
90
100
aa aa- a+ a a- bbb+ bbb bbb-
(%)
Strong +1 Adequate 0 Marginal -1
EMEA – Operating Performance Notch by Long-Term Issuer Credit Rating
Source: A.M. Best data and research
11

EMEA – Operating Performance
87.5 96.6
106.2
0
20
40
60
80
100
120
+1 0 -1
Strong Adequate Marginal
Med
ian
5-Yr
. Avg
. Com
bine
d R
atio
(%)
EMEA – Median 5-Year Average Combined Ratio by Operating Performance Notch
7.3 7.7
15.7
0
2
4
6
8
10
12
14
16
18
+1 0 -1
Strong Adequate Marginal
Med
ian
10-Y
r. C
ombi
ned
Rat
io S
TD (%
)
EMEA – Median 10-Year Combined Ratio Standard Deviation by Operating Performance Notch
Source: A.M. Best data and research
12

BCRM Building Blocks
Assessment
Strongest
Very Strong
Strong
Adequate
Weak
Very Weak
Assessment
Very Strong +2
Strong +1
Adequate 0
Marginal -1
Weak -2
Very Weak -3
Assessment
Very Favorable +2
Favorable +1
Neutral 0
Limited -1
Very Limited -2
Assessment
Very Strong +1
Appropriate 0
Marginal -1
Weak -2
Very Weak -3/4
13

EMEA – Operating Performance
12.0
7.1
3.5
0
2
4
6
8
10
12
14
+1 0 -1
Strong Adequate Marginal
Med
ian
5-Yr
. Avg
. RO
E (%
)
EMEA – Median 5-Year Average ROE by Operating Performance Notch
6.2
8.1
12.9
0
2
4
6
8
10
12
14
+1 0 -1
Strong Adequate MarginalM
edia
n 10
-Yr.
RO
E ST
D (%
)
EMEA – Median 10-Year ROE Standard Deviation by Operating Performance Notch
Source: A.M. Best data and research
14

BCRM Building Blocks
Assessment
Strongest
Very Strong
Strong
Adequate
Weak
Very Weak
Assessment
Very Strong +2
Strong +1
Adequate 0
Marginal -1
Weak -2
Very Weak -3
Assessment
Very Favorable +2
Favorable +1
Neutral 0
Limited -1
Very Limited -2
Assessment
Very Strong +1
Appropriate 0
Marginal -1
Weak -2
Very Weak -3/4
15
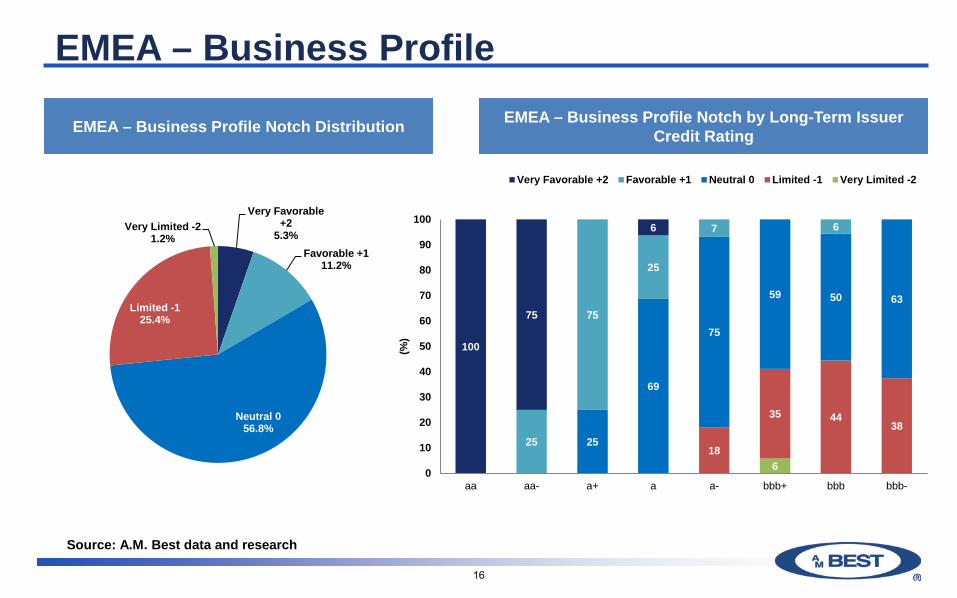
EMEA – Business Profile
Very Favorable +2
5.3% Favorable +1
11.2%
Neutral 0 56.8%
Limited -1 25.4%
Very Limited -2 1.2%
EMEA – Business Profile Notch Distribution
6 18
35 44 38
25
69
75
59 50 63
25
75
25
7 6
100
75
6
0
10
20
30
40
50
60
70
80
90
100
aa aa- a+ a a- bbb+ bbb bbb-
(%)
Very Favorable +2 Favorable +1 Neutral 0 Limited -1 Very Limited -2
EMEA – Business Profile Notch by Long-Term Issuer Credit Rating
Source: A.M. Best data and research
16

BCRM Building Blocks
Assessment
Strongest
Very Strong
Strong
Adequate
Weak
Very Weak
Assessment
Very Strong +2
Strong +1
Adequate 0
Marginal -1
Weak -2
Very Weak -3
Assessment
Very Favorable +2
Favorable +1
Neutral 0
Limited -1
Very Limited -2
Assessment
Very Strong +1
Appropriate 0
Marginal -1
Weak -2
Very Weak -3/4
17

EMEA – Enterprise Risk Management
Very Strong +1 5.3%
Appropriate 0 71.6%
Marginal -1 14.8%
Weak -2 8.3%
EMEA – Enterprise Risk Management Notch Distribution
17 9
18
28
25 50
88
84 98
82
67 58
100
50
13 6
0
10
20
30
40
50
60
70
80
90
100
aa aa- a+ a a- bbb+ bbb bbb-
(%)
Very Strong +1 Appropriate 0 Marginal -1 Weak -2
EMEA – Enterprise Risk Management Notch by Long-Term Issuer Credit Rating
Source: A.M. Best data and research
18

Best's Capital Adequacy Ratio (BCAR)
Mathilde Jakobsen Director, Analytics
19

• Overview of BCAR • Interpreting BCAR scores • Model differences
Agenda
20

Summary of Model Changes
• Stochastic-based risk factors applied within the model – Factors generated using stochastic simulations from
probability curves and ESG • Basis of risk measurement is Value at Risk (VaR) • 5 scores calculated instead of 1
– Net Required Capital calculated at 95%, 99%, 99.5%, 99.6%, and 99.8% confidence levels
21

Summary of Model Changes
22

BCAR Assessment VaR Confidence Level (%)
BCAR BCAR Assessment
99.6 >25 at 99.6 Strongest
99.6 > 10 at 99.6 & ≤ 25 at 99.6 Very Strong
99.5 > 0 at 99.5 & ≤ 10 at 99.6 Strong
99 > 0 at 99 & ≤ 0 at 99.5 Adequate
95 > 0 at 95 & ≤ 0 at 99 Weak
95 ≤ 0 at 95 Very Weak
23

BCARs Support Strong Balance Sheet Assessments
-20
-10
0
10
20
30
40
50
60
70
80
VaR 95% VaR 99% VaR 99.5% VaR 99.6% VaR 99.8%
Med
ian
BC
AR S
core
Strongest Very Strong Strong Adequate
EMEA Mature Markets – Median BCAR Score by Balance Street Strength
Source: A.M. Best data and research
24

Interpreting BCARs
-120-100
-80-60-40-20
020406080
100VAR 95 VAR 99 VAR 99.5 VAR 99.6 VAR 99.8
BCAR
Company A: Available Capital is 4*NRC at VAR 95 Company B: Available Capital = 3* NRC at VAR 95
Company C: Available Capital = 2* NRC at VAR 95 Company D: Available Capital = 1*NRC at VAR 95
• Net required capital (NRC) is the same for companies A, B, C and D at all VARs • The slope becomes steeper, as the BCAR at VAR 95 reduces
25

Model Differences…
… that can now drive a different assessment of risk-adjusted capitalisation, as measured by BCAR Difference Potential Effect Higher charges for equity and for low credit quality fixed income, especially with long durations
A lower BCAR assessment where net required capital is driven by investment risk
Lower charge for non-rated reinsurance recoverables
A higher BCAR assessment where net required capital is driven by counterparty credit risk
Catastrophe risk included within covariance adjustment
A higher BCAR assessment for catastrophe-exposed companies
26

Mature Markets Benchmark Analysis -
Building Block Approach
Carlos Wong-Fupuy Senior Director
27

EMEA – Mature Markets / Building Block Approach
• Country Risk Tiers 1 and 2 Europe, Middle East and Africa covered from the London office
Source: Best's Credit Rating Methodology
28

EMEA – Mature Markets / Balance Sheet Strength
• No cases of “Weak” or “Very Weak”.
• BCAR ≠ Balance sheet strength assessment.
• Negative BCARs in only a few cases.
Strongest 9.0%
Very Strong 73.0%
Strong 13.5%
Adequate 4.5%
-20-10
01020304050607080
VaR 95% VaR 99% VaR 99.5% VaR 99.6% VaR 99.8%
Med
ian
BC
AR S
core
Strongest Very Strong Strong Adequate
EMEA Mature Markets – Balance Sheet Strength Distribution
EMEA Mature Markets – Median BCAR Score by Balance Sheet Strength
Source: A.M. Best data and research
29

EMEA – Mature Markets / Balance Sheet Strength
100
8 19 22
50
100 100 81 75 67
50
100
8 11
0
10
20
30
40
50
60
70
80
90
100
aa aa- a+ a a- bbb+ bbb bbb-
(%)
Strongest Very Strong Strong Adequate
EMEA Mature Markets – Balance Sheet Strength by Long-Term Issuer Credit Rating
• Sector strongly capitalised • Wide variety of companies
• Strong correlation between balance sheet assessment and ICRs, but with some exceptions
Source: A.M. Best data and research
30

EMEA – Mature Markets / Operating Performance
• Small proportion of “Marginal” assessment
• In general, positive correlation with ICRs
• “bbb-” category an exception: subsidiaries with balance sheet strength pressures
Strong +1 40.5%
Adequate 0 52.8%
Marginal -1 6.7%
33 50
13
38
81
67 50
100 100 100 88
62
16
0102030405060708090
100
aa aa- a+ a a- bbb+ bbb bbb-(%
)
Strong +1 Adequate 0 Marginal -1
EMEA Mature Markets – Operating Performance Notch Distribution
EMEA Mature Markets – Operating Performance Notch by Long-Term Issuer Credit Rating
31

EMEA – Mature Markets / Operating Performance
• Good average combined ratios despite market pressures
• No cases under extreme categories of “Very Strong”, “Weak” or “Very Weak”
• Adaptability to pressures on profit margins will be key going forward
• Volatility is another important factor in the O/P assessment
• A few “marginal” cases: small, niche or subsidiaries under re-structuring
86.0
94.9
103.2
75
80
85
90
95
100
105
+1 0 -1
Strong Adequate Marginal
Med
ian
5-Yr
. Avg
. Com
bine
d R
atio
(%)
6.0 7.6
14.4
0
2
4
6
8
10
12
14
16
+1 0 -1
Strong Adequate Marginal
Med
ian
10-Y
r. C
ombi
ned
Rat
io S
TD (%
)
Mature Markets – Median 5-Year Average Combined Ratio by Operating Performance
Notch
Mature Markets – Median 10-Year Combined Ratio Standard Deviation by Operating
Performance Notch
Source: A.M. Best data and research
32

EMEA – Mature Markets / Business Profile
Very Favorable
+2 9.0%
Favorable +1
18.0%
Neutral 0 59.5%
Limited -1 13.5%
13
44
100
25
73
78
56
100
25
75
23
9
100
75
0
10
20
30
40
50
60
70
80
90
100
aa aa- a+ a a- bbb+ bbb bbb-
(%)
Very Favorable +2 Favorable +1 Neutral 0 Limited -1
EMEA Mature Markets – Business Profile Notch Distribution
EMEA Mature Markets – Business Profile Notch by Long-Term Issuer Credit Rating
• Positive correlation with ICRs
• “bbb-” the exception: cases where balance sheet pressures are dominant
Source: A.M. Best data and research
33

EMEA – Mature Markets / Business Profile
• Market position, a key factor within the business profile assessment
• But it needs to be seen alongside the degree of competition in the market where the company operates
Assessment Notch Positive Neutral Negative Very Favourable +2 12.5 37.5 50.0
Favourable +1 25.0 31.3 43.7
Neutral 0 17.0 40.4 42.6
Limited -1 - 40.0 60.0
Very Limited -2
Assessment Notch Positive Neutral Negative Very Favourable +2 87.5 12.5 -
Favourable +1 93.8 6.2 -
Neutral 0 34.0 55.4 10.6
Limited -1 10.0 50.0 40.0
Very Limited -2
EMEA Mature Markets – Market Position by Business Profile Notch
EMEA Mature Markets – Degree of Competition by Business Profile Notch
Source: A.M. Best data and research
34

EMEA – Mature Markets / Enterprise Risk Management
• Maximum of +2 notches in cases of “Very Favorable” business profile and “Very Strong” ERM assessment
• EMEA – mature markets in general highly regulated / Solvency II regime
• Some leading players and pioneers in developing ERM
• “Marginal” cases driven by significant volatility in underwriting results offset by strong capitalisation and / or parental support
Very Strong +1 10.1%
Appropriate 0 87.7%
Marginal -1 2.2%
EMEA Mature Markets – Enterprise Risk Management Notch Distribution
Source: A.M. Best data and research
35

EMEA – Mature Markets / Conclusions
• Main features: very robust balance sheets, adequate and strong operating performance,
neutral business profiles and appropriate ERM
• About 3% of companies under review as a result of the updated BCRM
Stable 86.6%
Positive 2.2%
Negative 4.5%
Under Review
6.7%
EMEA Mature Markets – Long-Term Issuer Credit Rating Outlooks
EMEA Mature Markets – Long-Term Issuer Credit Rating Distribution
Source: A.M. Best data and research. The ICR rating distribution is shown as of October 17, 2017
Superior 'aa' 11.2%
Excellent 'a' 76.4%
Good 'bbb' 12.4%
36

Emerging Markets Benchmark Analysis -
Building Block Approach
Mahesh Mistry Senior Director
37

Emerging - EMEA Markets / Country Risk • Emerging EMEA:
Country Risk Tiers 3, 4 and 5 (Europe, Middle East and Africa covered from the London office)
• Country risk is incorporated into the assessment of balance sheet strength, operating performance and business profile
• Country specific factors that will adversely affect an insurer’s ability to meet its financial obligations: economic risk, political risk, and financial system risk
• Greater uncertainty, volatile external conditions, developing regulatory regimes
38

Emerging - EMEA Markets / Country Risk
39

Emerging - EMEA / Balance Sheet Strength
• Balance sheet strength assessment mainly “Very Strong” to “Strong” • No cases of “Weak” or “Very Weak” balance sheet assessments • Most companies have “Strongest” or “Very Strong” BCAR positions • Capital requirements generally driven by investment risk
Strongest 7.5%
Very Strong 55.0%
Strong 35.0%
Adequate 2.5%
Emerging Markets – Balance Sheet Strength Distribution
-20
0
20
40
60
80
100
VaR 95% VaR 99% VaR 99.5% VaR 99.6% VaR 99.8%
Med
ian
BC
AR S
core
Strongest Very Strong Strong Adequate
Emerging Markets – Median BCAR Score by Balance Sheet Strength
40

Emerging - EMEA / Balance Sheet Strength
• Sector strongly capitalised • Strong correlation between balance sheet assessment and ICRs • Country risk has a bearing on the outcome • Negatives: quality of assets, reinsurance dependence, reserve quality
33 25 21
50 60
75
50
67
50
92
62 79
45 40
25
50 50
8 13 5
0
10
20
30
40
50
60
70
80
90
100
a a- bbb+ bbb bbb- bb+ bb bb- b+
(%)
Strongest Very Strong Strong Adequate
Emerging Markets – Balance Sheet Strength by Long-Term Issuer Credit Rating
Source: A.M. Best data and research
41

Emerging - EMEA / Operating Performance
• Consider past and prospective performance • No companies have “Very Strong”, “Weak” or “Very Weak” assessment • In general, positive correlation with ICRs
Strong +1 43.8%
Adequate 0 43.8%
Marginal -1 12.4%
Emerging Markets – Operating Performance Notch Distribution
14 5
25
50 67
17 25
38
36 55
100
75
50 33
83 75
62 50
40
0
10
20
30
40
50
60
70
80
90
100
a a- bbb+ bbb bbb- bb+ bb bb- b+
(%)
Strong +1 Adequate 0 Marginal -1
Emerging Markets – Operating Performance Notch by Long-Term Issuer Credit Rating
Source: A.M. Best data and research
42
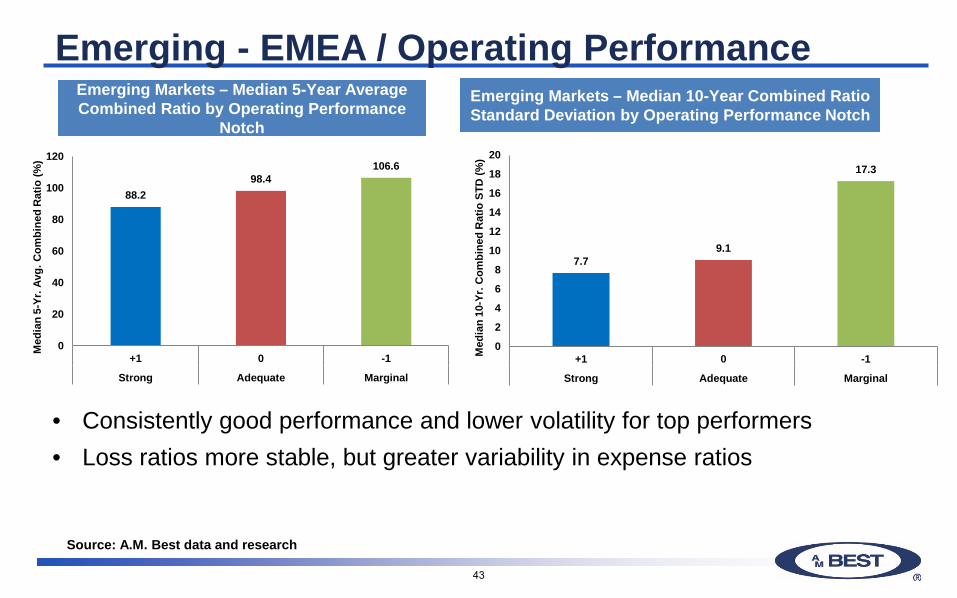
Emerging - EMEA / Operating Performance
• Consistently good performance and lower volatility for top performers • Loss ratios more stable, but greater variability in expense ratios
88.2 98.4
106.6
0
20
40
60
80
100
120
+1 0 -1
Strong Adequate Marginal
Med
ian
5-Yr
. Avg
. Com
bine
d R
atio
(%)
Emerging Markets – Median 5-Year Average Combined Ratio by Operating Performance
Notch
7.7 9.1
17.3
0
2
4
6
8
10
12
14
16
18
20
+1 0 -1
Strong Adequate Marginal
Med
ian
10-Y
r. C
ombi
ned
Rat
io S
TD (%
)
Emerging Markets – Median 10-Year Combined Ratio Standard Deviation by Operating Performance Notch
Source: A.M. Best data and research
43

Emerging - EMEA / Operating Performance
• Consistently good performance and lower volatility for top performers • Investment a key contributor to earnings; although adds volatility • Consider operating environment; interest rates, inflation, currency risk • Movements in ‘other comprehensive income’ adds further volatility
13.0
10.5
4.1
0
2
4
6
8
10
12
14
+1 0 -1
Strong Adequate Marginal
Med
ian
5-Yr
. Avg
. RO
E (%
)
4.8
9.0
15.9
0
2
4
6
8
10
12
14
16
18
+1 0 -1
Strong Adequate Marginal
Med
ian
10-Y
r. R
OE
STD
(%)
Emerging Markets – Median 10-Year return on equity Standard Deviation by Operating Performance Notch
Emerging Markets – Median 5-Year Average return on equity by Operating Performance
Notch
Source: A.M. Best data and research
44

Emerging - EMEA / Business Profile
• Less correlation between ICRs and business profile • Neutral: mainly leading positions in local market; small globally • Limited: mid-sized companies with good access to business;
no product differentiation
Very Favorable
+2 1.3%
Favorable +1
3.8%
Neutral 0 53.8%
Limited -1 38.6%
Very Limited -2
2.5%
Emerging Markets – Business Profile Notch Distribution
13
33 25
29 41
60
25
100 100
50
67 62 64
59
40
75 33
7 17
0
10
20
30
40
50
60
70
80
90
100
a a- bbb+ bbb bbb- bb+ bb bb- b+
(%)
Very Favorable +2 Favorable +1 Neutral 0 Limited -1 Very Limited -2
Emerging Markets – Business Profile Notch by Long-Term Issuer Credit Rating
Source: A.M. Best data and research
45

Emerging - EMEA / Enterprise Risk Management
• No companies given “Very Favorable” ERM assessment • Diverse ERM practices across emerging market companies • Difficult to mitigate all economic, political and financial system risks within
a country
Appropriate 0
53.7% Marginal -1
28.8%
Weak -2 17.5%
Emerging Markets – Enterprise Risk Management Notch Distribution
7 18 20 25
100
67
33
8 25
36 27
40
75
33
67
92 75
57 55 40
0
10
20
30
40
50
60
70
80
90
100
a a- bbb+ bbb bbb- bb+ bb bb- b+(%
) Appropriate 0 Marginal -1 Weak -2
Emerging Markets – Enterprise Risk Management Notch by Long-Term Issuer Credit Rating
Source: A.M. Best data and research
46

• Emerging - EMEA main features: robust balance sheets, strong to adequate operating performance, neutral to limited business profiles and appropriate to marginal ERM
• About 2% of companies under review as a result of the updated BCRM
Emerging - EMEA / Conclusions
Excellent 25.0%
Good 53.9%
Fair & Below 21.1%
Emerging Markets – Long-Term Issuer
Credit Rating Distribution
Stable 73.7% Positive
3.9%
Negative 13.2%
Under Review 9.2%
Emerging Markets – Long-Term Issuer Credit Rating
Distribution
Source: A.M. Best data and research. The ICR rating distribution is shown as of October 17, 2017
47

Methodology Review Seminar
etc.venues St.Paul’s, London
15 November 2017
48