methodology open access organization of gc/ms and lc/ms … · 2017-08-27 · methodology open...
TRANSCRIPT
METHODOLOGY Open Access
Organization of GC/MS and LC/MS metabolomicsdata into chemical librariesCorey D DeHaven*, Anne M Evans, Hongping Dai, Kay A Lawton
Abstract
Background: Metabolomics experiments involve generating and comparing small molecule (metabolite) profilesfrom complex mixture samples to identify those metabolites that are modulated in altered states (e.g., disease,drug treatment, toxin exposure). One non-targeted metabolomics approach attempts to identify and interrogate allsmall molecules in a sample using GC or LC separation followed by MS or MSn detection. Analysis of the resultinglarge, multifaceted data sets to rapidly and accurately identify the metabolites is a challenging task that relies onthe availability of chemical libraries of metabolite spectral signatures. A method for analyzing spectrometry data toidentify and Quantify Individual Components in a Sample, (QUICS), enables generation of chemical library entriesfrom known standards and, importantly, from unknown metabolites present in experimental samples but without acorresponding library entry. This method accounts for all ions in a sample spectrum, performs library matches, andallows review of the data to quality check library entries. The QUICS method identifies ions related to any givenmetabolite by correlating ion data across the complete set of experimental samples, thus revealing subtle spectraltrends that may not be evident when viewing individual samples and are likely to be indicative of the presence ofone or more otherwise obscured metabolites.
Results: LC-MS/MS or GC-MS data from 33 liver samples were analyzed simultaneously which exploited theinherent biological diversity of the samples and the largely non-covariant chemical nature of the metabolites whenviewed over multiple samples. Ions were partitioned by both retention time (RT) and covariance which groupedions from a single common underlying metabolite. This approach benefitted from using mass, time and intensitydata in aggregate over the entire sample set to reject outliers and noise thereby producing higher qualitychemical identities. The aggregated data was matched to reference chemical libraries to aid in identifying the ionset as a known metabolite or as a new unknown biochemical to be added to the library.
Conclusion: The QUICS methodology enabled rapid, in-depth evaluation of all possible metabolites (known andunknown) within a set of samples to identify the metabolites and, for those that did not have an entry in thereference library, to create a library entry to identify that metabolite in future studies.
BackgroundMetabolomics is the study of the small molecules (i.e.,metabolites or biochemicals), contained in a cell, tissue,organ or biological fluid [1-3]. Metabolomics data canbe generated from an array of sources such as liquid orgas chromatography coupled to mass spectrometry (e.g.,LC/MS, GC/MS), capillary electrophoresis (CE), andnuclear magnetic resonance (NMR) spectroscopy [4].Typically, metabolomics uses non-targeted methodswhere the analytical conditions are optimized to detectand identify as many molecules as possible. However,
targeted metabolomics methods where the chromatogra-phy is optimized for detection of a specific molecule orclass of molecules (e.g., lipids) are also used. In eithercase, the structure of metabolomics data is generallythree dimensional. For example, the data for a separa-tion method coupled with mass spectrometry includesvalues for time, intensity and mass (m/z).The fundamental goal of metabolomics analysis is to
quickly and accurately identify the metabolites detectedin a complex biological sample and determine whichchange (increase or decrease) in response to experimen-tal conditions (e.g., disease state, drug treatment, etc).Typically, data for a set of biological samples are* Correspondence: [email protected]
Metabolon, Inc., 800 Capitola Drive, Suite 1, Durham, NC 27713, USA
DeHaven et al. Journal of Cheminformatics 2010, 2:9http://www.jcheminf.com/content/2/1/9
© 2010 DeHaven et al; licensee BioMed Central Ltd. This is an Open Access article distributed under the terms of the CreativeCommons Attribution License (http://creativecommons.org/licenses/by/2.0), which permits unrestricted use, distribution, andreproduction in any medium, provided the original work is properly cited.

collected, plotted and stored in individual files with eachfile corresponding to each biological sample. Using var-ious software tools, the raw three-dimensional data forthe sample set are integrated into ion peaks organizedby mass, retention time (RT), and peak area. The inte-grated ion peaks are aligned by time and may be nor-malized by intensity across the set of samples. Then,each individual sample is processed for the identificationof metabolites which, in most cases, involves the com-parison of individual spectra to standard referencelibraries. Such standard reference library data consist ofknown spectra corresponding to certain metabolites thatmay be present in a given sample. While individual ionsmay be detectable in such spectra, the combinations andinterplay of such ions to indicate specific individualmetabolites may not be immediately discernable, espe-cially in only a single biological sample. If the individualsample contains substantially pure components (such assmall molecule metabolites), the spectrum of the com-ponent can be easily matched with the spectra of knownmetabolites in order to identify the biochemical. How-ever, in many cases, the fractionation of a particular bio-logical sample (in a liquid or gas chromatograph, forexample) is incomplete. In this case, two or more bio-chemicals may co-elute from the incomplete chromato-graphic separation process giving rise to an impuremixture of metabolites going into the spectrometer. Theconventional methods of analyzing datasets by groupingand organizing related ions on a per sample basis fallshort when faced with this level of data complexity[5-7].An analytical method that is capable of performing
statistical analysis on a set of ions in a given population(sample set) could address these shortcomings [7].Recently, a correlation-based deconvolution approachwas reported for LC/MS datasets [8]. In this report, wepresent QUICS, a method to identify and organize theions related to metabolites of known and unknownidentity from complex mixtures. The function of QUICSis to go beyond a single sample approach to the identifi-cation of the multiple ions that are related to any givenmetabolite by correlating ion data across a set of sam-ples. Consequently, when viewed over many individualbiological samples of the same type, subtle spectraltrends indicative of the presence of one or more other-wise obscured metabolites may be revealed. Once theserelated ions are grouped based upon the correlationacross samples, there exists the capability of searchingfor these organized ion groups in reference library data-bases to identify the corresponding metabolites. Further-more, new library entries can be created when groupedions represent a new, undocumented metabolite(unknown). Here, we show the utility of this method for
the deconvolution and analysis of GC-MS and LC-MSn
data sets.
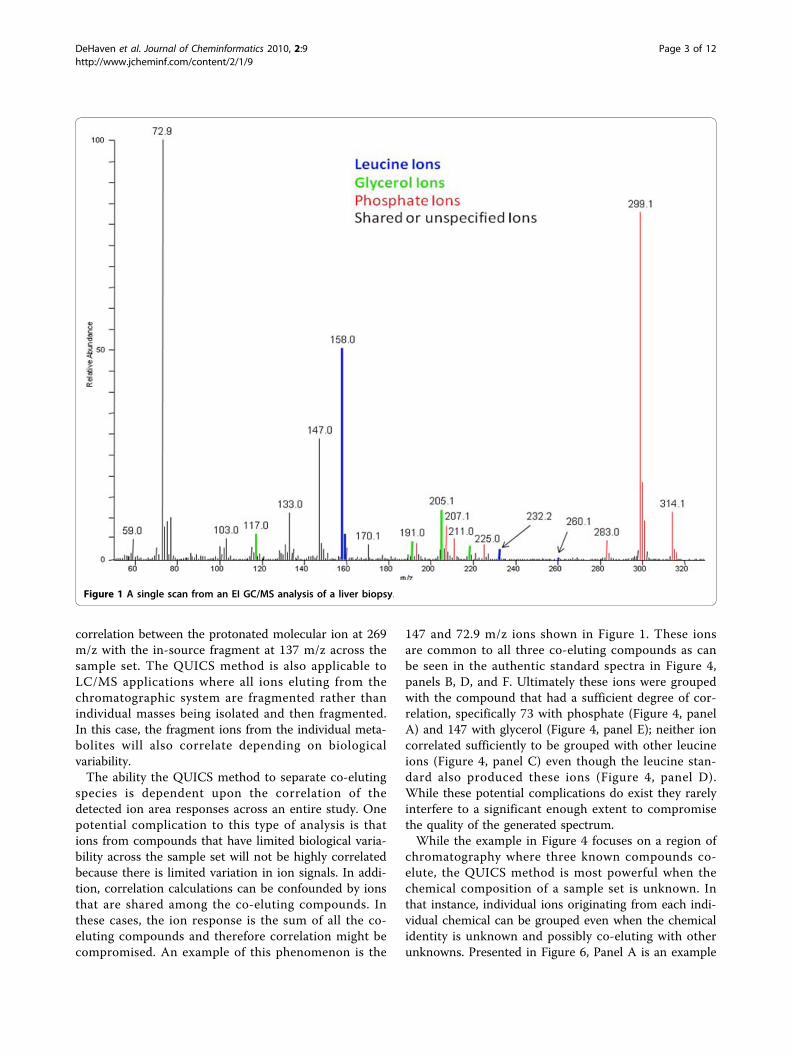
Results and DiscussionTo demonstrate the ability of the QUICS method toaccurately separate and organize ions related to co-elut-ing biochemicals, a sample set of 33 liver samples wasanalyzed by GC/EI-MS. In this study three known meta-bolites, leucine, phosphate and glycerol, consistently co-elute as shown in Figure 1. Without prior knowledge ofthe content of this scan it would be difficult to deter-mine whether the spectrum shown in Figure 1 is a mix-ture of metabolites or a single metabolite. Using theQUICS methodology this spectrum is separated into itsthree biochemical components by grouping highly corre-lated individual ions based on instrument responseacross the sample set. This is possible because the ionsoriginating from a single biochemical will exhibit similarbiological variability across the study and therefore cor-relate, as can be seen in Figure 2. Consequently, indivi-dual ions belonging to a single component can begrouped based on correlation. In Figure 2, Panel Ademonstrates the chromatographic profile of two ionsgenerated during a GC/EI-MS analysis of leucine, 158and 232 m/z. Note that the intensities of the ions trendthe same way across the four different liver samplesshown. More specifically, the liver sample shown inblack has the highest amount of 158 and 232 m/z, fol-lowed by the liver sample represented in red, thengreen, then blue. As a result, these two ions correlatewhen the ion response is compared across all of thesample injections in the study which is shown in Figure3. This is in contrast to the ions related to glycerol (Fig-ure 2, panel B), in which the liver sample labelled inblack has the highest amount of both ions (205 and 103m/z), followed by green, then blue, then red. The threeion groups that were created from a set of 33 liver sam-ples and their respective authentic standard spectrummatches are shown in Figure 4.The examples discussed thus far are from data gener-
ated from electron ionization (EI) GC/MS analyses,where all of the ions detected are a result of fragmenta-tion of the intact molecule during ionization. However,the QUICS method is also useful with other types ofdata. Deconvoluting LC/MS data where a biochemicalcompound does not necessarily fragment in the sourcebut instead readily forms adducts and multimers is alsopossible. Shown in Figure 5, Panel A is an example ofions from an LC/MS sample injection that were groupedbased on correlation. The ions presented are variousadducts, isotopes, multimers and in-source fragmentsfor inosine, as confirmed by the authentic standardlibrary spectrum in Panel B. Shown in Panel C is the
DeHaven et al. Journal of Cheminformatics 2010, 2:9http://www.jcheminf.com/content/2/1/9
Page 2 of 12
correlation between the protonated molecular ion at 269m/z with the in-source fragment at 137 m/z across thesample set. The QUICS method is also applicable toLC/MS applications where all ions eluting from thechromatographic system are fragmented rather thanindividual masses being isolated and then fragmented.In this case, the fragment ions from the individual meta-bolites will also correlate depending on biologicalvariability.The ability the QUICS method to separate co-eluting
species is dependent upon the correlation of thedetected ion area responses across an entire study. Onepotential complication to this type of analysis is thations from compounds that have limited biological varia-bility across the sample set will not be highly correlatedbecause there is limited variation in ion signals. In addi-tion, correlation calculations can be confounded by ionsthat are shared among the co-eluting compounds. Inthese cases, the ion response is the sum of all the co-eluting compounds and therefore correlation might becompromised. An example of this phenomenon is the
147 and 72.9 m/z ions shown in Figure 1. These ionsare common to all three co-eluting compounds as canbe seen in the authentic standard spectra in Figure 4,panels B, D, and F. Ultimately these ions were groupedwith the compound that had a sufficient degree of cor-relation, specifically 73 with phosphate (Figure 4, panelA) and 147 with glycerol (Figure 4, panel E); neither ioncorrelated sufficiently to be grouped with other leucineions (Figure 4, panel C) even though the leucine stan-dard also produced these ions (Figure 4, panel D).While these potential complications do exist they rarelyinterfere to a significant enough extent to compromisethe quality of the generated spectrum.While the example in Figure 4 focuses on a region of
chromatography where three known compounds co-elute, the QUICS method is most powerful when thechemical composition of a sample set is unknown. Inthat instance, individual ions originating from each indi-vidual chemical can be grouped even when the chemicalidentity is unknown and possibly co-eluting with otherunknowns. Presented in Figure 6, Panel A is an example
Figure 1 A single scan from an EI GC/MS analysis of a liver biopsy.
DeHaven et al. Journal of Cheminformatics 2010, 2:9http://www.jcheminf.com/content/2/1/9
Page 3 of 12

of a spectrum that was created using the QUICSmethod. The ions that were grouped (Figure 6, panel A)as originating from an unknown source were later iden-tified as Equol (4’,7-isoflavandiol), an isoflavandiol meta-bolized from daidzein, a type of isoflavone, by bacterialflora in the intestines [9] (Figure 6, panel B).The ultimate goal of the QUICS method is to permit
the deconvolution of the many redundant ion signalsthat each individual biochemical entity produces. One ofthe standard approaches of data analysis in the bio-chemical profiling field is to perform statistical analysesusing every individual ion signal whether or not they areredundant ions produced by a single chemical [10-12].This ion-centric approach leads to a greater number offalse discoveries as a result of increased numbers ofmeasurements processed in the statistical analysis. Thisapproach also has the potential to skew statistics sincedifferent chemicals will produce different numbers ofion signals. For example, multivariate techniques suchas Principal Component Analysis (PCA) can be skewed
in favor of chemicals that produce more ion signals. Incontrast, the QUICS method enables a chemo-centricapproach to data analysis. Once the related ion featuresthat belong to a given biochemical are organized andgrouped, a single ion from that group can be used torepresent that metabolite in statistical analyses. By usingthe chemo-centric approach the number of false discov-eries is reduced since the number of ions processed instatistical analyses is reduced to a single representativeion for each metabolite and, furthermore, the potentialfor skewed statistical results is decreased.Similar use of correlation analysis across samples has
been used with NMR data. In that analysis, the multiplechemical shift peaks generated by a single molecule canbe correlated across samples, grouped, and used to aididentification of detected molecules [13-16]. While simi-lar in concept to the method presented here, the ulti-mate outcome has different advantages since theunderlying data streams are so unique. One of the goalsof the QUICS method was to deconvolute the highly
Figure 2 The selected ion chromatogram (SIC) for two different ions from leucine (A) and two ions from glycerol (B) as measuredfrom 4 different liver sample analyses. The ions from leucine, 158 and isotope 232 m/z, trend across the different liver samples and the ionsrelated to glycerol share a different trend.
DeHaven et al. Journal of Cheminformatics 2010, 2:9http://www.jcheminf.com/content/2/1/9
Page 4 of 12

redundant ion features generated by a single moleculetraditionally seen in most mass spectrometric basedtechnologies. As discussed, this redundancy of data canalter statistical analysis and lead to greater numbers offalse discoveries. Using the QUICS method, it is possibleto group all of the redundant ions related to thedetected metabolites within a set of experimental sam-ples with or without the use of a known spectral library.By utilizing both the chromatographic time domain andion response the QUICS method is able to gain an addi-tional degree of specificity not seen in NMR datastreams. As a result only those ions that co-elute andcorrelate are grouped, thus removing the confoundingredundancies. It should be noted that this methodrepresents an automated package that also enables thegeneration of spectral library entries for unnamed/unknown metabolites–those molecules where a refer-ence library entry of chemical spectral signatures doesnot yet exist. Taking a statistical approach to the analy-sis of all ions in a sample and evaluating the entire sam-ple set simultaneously enables the system to not onlyidentify metabolites with spectral matches to known bio-chemicals in the reference library, but also enables iden-tification of biochemicals that are not in the referencelibrary. The identification of these so-called unnamedmetabolites capitalizes on the fact that ions originating
from a single biochemical will exhibit similar biologicalvariability across the study samples and therefore corre-late. The QUICS method has been used successfully fordiverse experimental studies including disease biomarkeridentification, drug mode of action, toxicology, agingand characterization of variation in complex mixturessuch as milk and on a variety of sample matrices (e.g.,biological fluids, tissue, milk) [17-22].
ExperimentalTo begin, GC/MS and LC/MSMS data are collected aspart of an automated, high-throughput processing sys-tem. These data consist of ions peaks that have beenautomatically detected and integrated from raw 3D GC/MS or LC/MSMS analyses for each sample. These dataare characterized by the mass (m/z) of the ion, the area(representing the amount of the ions), and retentiontime (RT) and retention index (RI) representing thechromatographic characteristics that tell when therelated biochemicals elute. Retention indices areassigned to all ion peaks by calibration with the reten-tion index of internal standards, added into each sample,and their retention time for each sample [6]. These rawsignal data and integrated ion peak data are both loadedand stored in a relational database system which pro-vides data structures that are optimal for the storage
Figure 3 Correlation of m/z 158 and 232, two ions related to leucine, across all injections in a study. All ions were pulled from all sampleinjections in a study and analyzed all for correlation. Ions are then grouped based on a user-specified correlation limit.
DeHaven et al. Journal of Cheminformatics 2010, 2:9http://www.jcheminf.com/content/2/1/9
Page 5 of 12

Figure 4 The creation of 3 different groups of correlating ions, A,C, and E, and their respective authentic standard library entries areshown for comparison, B, D, and F. The ions within the groups correlated with a minimum of 0.8. From the single scan in Figure 1, 3different compounds are present; phosphate, leucine and glycerol.
DeHaven et al. Journal of Cheminformatics 2010, 2:9http://www.jcheminf.com/content/2/1/9
Page 6 of 12

and retrieval of large chromatographic datasets. Immedi-ately after data acquisition has been completed for asample, that data file has been retrieved by the system,and automated loading and peak detection have beencompleted, the resulting data is compared using amatching algorithm against an existing spectral librarywhich contains the spectral definitions of both knownstandards as well as unknown metabolites. Any matchesbetween ion peak data and the spectral library thatoccur are scored for confidence, and that information isstored within the relational database system.
To determine which groups of ions are commonacross samples, all the ions are binned by mass windowand RI window. Ions from the same chemical that aredetermined to be common across samples are thengrouped by correlation. Table 1 shows the processingthresholds for ion binning and bin grouping.
Ion BinThe first step is to begin a binning process where ionsfrom samples in the same study set are binned by massand retention index (RI) [23]. A bin is a space
Figure 5 (A) An ion group including the protonated molecular ion, isotopes, adducts, and multimers of inosine (m + H+ 269) basedon correlation across a 33 sample set study. (B) The authentic standard spectrum of inosine. (C) The correlation between the protonatedmolecular ion of inosine at 269 m/z and an in-source fragment at 137 m/z.
DeHaven et al. Journal of Cheminformatics 2010, 2:9http://www.jcheminf.com/content/2/1/9
Page 7 of 12

partitioning data structure that enables fast regionqueries and nearest neighbor search. Each bin is charac-terized by a center mass and a center RI. Ions fromacross the set of samples are put into the same bin if
their masses and RIs fall into the windows around thecenter mass and the center RI.Two kinds of ions can be defined in this process, a
singlet and a multiplet. A singlet ion comes from a
Figure 6 (A) An ion group created from an EI-GC/MS analysis of urine that when created was an unknown. (B) The authentic standardspectrum of equol, later permitted the identification of the unknown.
Table 1 Binning and Grouping Threshold Parameters
Name Description Normal Values
Ions to Analyze
RI +/- Range of retention indexes of ions across samples for analysis 0~9000 +/- 100
Ion Binning
Mass Window Mass window for ions to be binned together 0.4
Extended MassWindow
Mass window to look for ions missing from samples in neighboring bins. 0.5
RI Window RI window for ions to be binned together 25 to 50, default 25
Extended RI Window RI window to look for ions missing from samples in neighboring bins. 25 to 50, default 38
Bin Grouping
Max. RI Difference Maximal difference of the average RIs of the two bins 0~999
Min. Correlated Ions Minimal number of common singlet ions existing in the two bins 1~999
Max. Linear Area Maximal area of ions that can be included for correlation calculation Large enough to include allions
Max. RSD (%) Maximal Relative Standard Deviation (%) of common singlet peak area ratio between thetwo bins
0~100
Min. Correlation Minimal correlation value for grouping 0 ~ 1 with default of 0.8
DeHaven et al. Journal of Cheminformatics 2010, 2:9http://www.jcheminf.com/content/2/1/9
Page 8 of 12

sample that has one and only one ion in the same bin.A multiplet ion comes from a sample that has morethan one ion in the same bin. Multiplet ions from thesame sample imply the co-elution of several compoundsand are termed a collision. The number of collisions, i.e.the number of times multiple ions were detected in allbins, seen in a loaded data set is displayed in Figure 5(C).Binning includes the following steps:
1. Sorting ions by their areas in descending order.2. Bin ions with smaller areas around ions with lar-ger areas, with the larger ions serving as the bincenters.3. Calculate the statistics of each ion bin: meanmass, mean area, mean RI and their standard devia-tions, respectively, from all singlet ions in the bin.4. Reset the bin center mass and center RI to itsmean mass and mean RI to take into account theion distribution within the bin. Remove all bins thathave no singlet ions.5. Re-binning all ions into these bins. If an ion can’tbe binned into any of them, a new bin is createdwith its mass and RI as the center mass and RI.6. Repeat steps 3 and 4 for optimized binning of allions.
The number of singlet ions in an ion bin indicateshow popular this ion is across the samples. The size ofa bin is represented by the percentage of singlet ionsamong the total number of samples, the percentage of“filled” in Figure 5 (C, % column).When a bin is not 100% filled, that is, when there are
samples that have no ions in the bin, it might be possi-ble that these samples might have the same ions butthey might be just outside the mass window and/or theRI window of the bin. Should these outlier ions be thesame as those in the bin, their areas would be withinfour standard deviations of the areas of singlet ions inthe bin. To recover these outlier ions from the missingsamples, ions within an extended mass window and/orRI window are searched for those samples in the binswith lower “filled” percentage; if found, such ions aremigrated from the less “filled” bin to the more “filled”bin.For example, suppose there are 30 samples in total,
and there are 25 samples that have singlet peaks in binB1, and sample A does not have any peak in it. Tocheck if sample A has an outlier peak that is similar topeaks from other samples in bin B1, peaks from sampleA in neighbor bins are searched in an extended RI andmass window. Peaks from sample A must have theirpeak areas in the window of four standard deviations ofpeak areas in bin B1. The best matched peak from
sample A in the neighbor bins would be migrated to binB1, making bin B1 more “filled” (sample A is nowincluded).This process is looped from the more filled bins to the
less filled bins.
Grouping Ion BinsIn GC/MS or LC/MS, many ions may be produced fromthe same metabolite during the ionization and fragmen-tation processes. In LC/MS, different adducts and aggre-gates may form from the same metabolite. These ionsfrom the same metabolite should be well correlated. Onthe other hand, ions from different chemical origin arelargely non-covariant.Once ions from across the set of samples are properly
binned, each bin represents a common ion that is com-mon in many samples in the sample set. Bins represent-ing ions from the same metabolite should be wellcorrelated when analyzed across multiple samples. Sup-pose a majority of the samples contain a common meta-bolite A, which has ionized to N ions, then there wouldbe N bins that are well correlated. The goal of groupingbins is to find those well correlated ions that couldrepresent a known or unknown metabolite in thosesamples.
Correlation between the Normalization Bin andCorrelation BinThe Pearson’s correlation is calculated to measure thecorrelation between two ion bins. Only singlet ions thatare common in both ion bins are included in thecalculation.Bins are sorted by their mean area in descending
order. Using the larger bins as the normalizer, smallerbins are grouped around the larger bins as if the corre-lation is above the correlation threshold value. The cor-relation between the normalizer bin and correlation binis calculated as follows:
Pearson s CorrelationS S S S
S S S S
iN N iC Ci
iN Ni
iC C
’( )( )
( ) ( =
− −
− −
∑∑ 2 ))2
i∑ (1)
where Si is the area of a common singlet ion, S is the
average area of the common singlet ions in a bin.Thresholds for the minimal correlation and the numberof singlet ions that are common in both the normaliza-tion bin and the correlation bin are user specified andcan be altered prior to the process being started.The correlation threshold is chosen by trial-and-error.
Usually it is between 0.70 and 0.90. It depends on thematrix type and the sample set size (number of samplesin the sample set). A too low correlation thresholdwould group too many bins into a group, whereas a too
DeHaven et al. Journal of Cheminformatics 2010, 2:9http://www.jcheminf.com/content/2/1/9
Page 9 of 12

high threshold would miss some ions from the group,which can be judged from metabolites in the samplesknown from library match.
Chemical IntelligenceThe ions originating from the same chemical will havedifferent m/z values and include various in-source frag-mentations, isotopes, adducts and multimers. In LC/MS,ions could be aggregates of monomers or adducts withsolvent/mobile phase ions such as H+, Na+, K+, Cl-,OH-, NH4
+, H2O, COO-, etc. The true mass could becalculated from the measured mass:
( / )( / ) ( / )
m zm z m z
NMonoMeasured Adduct
IMER
= −(2)
where NIMER is the number of monomers in theaggregate, (m/z)adduct is the (m/z) of the adduct, (m/z)monomer, is the (m/z) of the monomer, and (m/z)measured
is the measured (m/z) for the ion.Table 2 shows the most common aggregates and
adducts. All ions in the group are checked against thesepossible aggregates and/or adducts to determine themost probable form of the ion.To calculate the monomer mass of a metabolite, each
ion in the grouped bins is tested against the above pos-sible ion form and the possible monomer mass is calcu-lated and scored by the product of the ion peak areaand the ion form probability.To do so, possible monomer masses for all the ions in
all ion forms are calculated and binned and scored inTable 3:1. For each ion from big (large ion peak area)to small
(small ion peak area) in the group AND each ion formfrom the most probable to less probable in the possibleion forms
○ Calculate the monomer mass (m/z)Mono and itsscore.○ If some monomer masses have already been calcu-lated AND this monomer mass is within one ofthem, add its score. e.g., if (m/z)Mono
i - 0.3 <= (m/z)Monomer <= (m/z)Mono
i + 0.3, then SCOREi += (PeakArea) * (Ion Form Probability)○ Otherwise, add this monomer mass and its scoreto the possible monomer mass list as another possi-ble monomer mass.
2. Among the all possible monomer masses, themonomer mass with the maximal mass score is themost probable mass.After the monomer mass is calculated from the well
correlated bins in a group, other forms of adduct/aggre-gate ions from the same metabolite not existing in the
bins in the group could be searched. These missingforms of adduct/aggregate ions could be more variantacross samples and so their correlations with the nor-malize bin are below the threshold value used for group-ing and so bins representing these adducts/aggregatesare mis-grouped into different groups. The QUICSmethod attempts to correct these misgrouped ions by
Table 2 Possible aggregate and adducts in measuredions
(m/z)adduct NIMER Ion Form PROBABILITY(%)
1.00728 3 3 m + H 1
1.00728 4 4 m + H 1
1.00728 5 5 m + H 1
22.98977 3 3 m + Na 1
22.98977 4 4 m + Na 1
22.98977 5 5 m + Na 1
1.00728 1 m + H 100
0 1 m- 10
1.00728 2 2 m + H 50
22.98977 1 m + Na 90
22.98977 2 2 m + Na 25
39.954 1 m + K 10
39.954 2 2 m + K 5
-1.00728 1 m-H 100
39.954 4 4 m + K 1
-1.00728 2 2 m-H 50
44.9971 1 m + Form 99
-18.01002 1 m-H2O 80
39.954 5 5 m + K 1
1.00728 3 3 m-H 1
-1.00728 4 4 m-H 1
-1.00728 5 5 m-H 1
20.9741 2 2 m + Na-2H 50
1.00728 6 6 m + H 1
1.00728 7 7 m + H 1
1.00728 8 8 m + H 1
-17.01 1 m + H-H20 1
34.9689 1 m + Cl35 12
36.9659 1 m + Cl35[Cl37] 4
18.03437 1 m + NH4 1
Table 3 List of possible monomer masses, binned andscored
Ion Calculated Monomer Mass Calculated Score Assigned Bin
1 (m/z)Mono1 Score1 X
2 (m/z)Mono2 Score2 X
... ... ... X
n (m/z)Monon Scoren X
DeHaven et al. Journal of Cheminformatics 2010, 2:9http://www.jcheminf.com/content/2/1/9
Page 10 of 12

lowering the required correlation threshold for thoseions which have masses consistent with the monomermass of the metabolite.To find the missing adduct/aggregate in a bigger
group (with a larger peak area of normalize bin) with itsmonomer mass calculated as described above, for eachpossible form of adduct/aggregate:
1. Calculate the measured mass from the monomermass assuming there is an ion in this form ofadduct/aggregate.2. Bins in smaller groups within are searched withinthe mass window (±0.4) of calculated mass and theRI window of the normalize bin of the larger group.3. Calculate the correlation of these adduct/aggre-gate bins with the normalize bin of the big group.4. The bin with the highest correlation above 0.4 willbe one of the missing adduct/aggregate ions and willbe migrated from the smaller groups to the biggroup.
This process is repeated for each group from big tosmall.Isotope ions are checked the same way except they
require the ion peak area to be no more than half of thenormal ion.As discussed above, each primary ion peak bin repre-
sents the average of a common ion across samples, andeach group of correlated bins represents ions of a com-mon metabolite. For LC/MS/MS, secondary MS2 ionsfor each primary ion are also retrieved from all the sing-let samples in the primary ion peak bin and similarlybinned. Among the MS2 ion bins that satisfy the mini-mal number of singlet ions, the maximal bin with themaximal mean intensity will be used as the normalizebin to normalize other bins that satisfy both the mini-mal number of singlet ions and the minimal relativeintensity against the normalize bin, are included into thelibrary to represent the MS2 ions for the primary ion. Insummary, integrated primary ion chromatographic peaksfrom all the samples are binned based on chromato-graphic features of retention index and ion mass, wellcorrelated bins within the retention index window aregrouped to create a library entry to represent a chemicalentity. Each mass with their characteristic values fromthe averages of mass, area, RI, and RT from a bin in thegroup, represents one of the fragmented ions from apure chemical entity or its adducts/aggregate. For LC/MS/MS, secondary masses are also created from thebin/group of all secondary ions across the samples andthe averages represent the secondary ions from one ofthe primary fragments of the chemical entity. Such cre-ated library entries for each chemical entity may matchwell to an entry in the library, or as an unknown to be
added to the library and to be further identified withmore studies.
Reference Library EntriesOnce the binned ions are grouped by correlation, thegroups can be searched against a reference library inorder to determine whether the group of ions representsa known entity or whether the group of ions representsa new or an unknown (a biochemical that is not in thelibrary) chemical entity. If the group of ions is deter-mined to represent an unknown chemical with no refer-ence library entry, a new spectral entry is added to thelibrary so that the unknown entity can be tracked infuture studies. An attempt is made to assign chemicalintelligence to the ions belonging to the unknown entitybased on previously defined mass relationships, e.g. Naadduct m + 23.
ConclusionThe QUICS method greatly accelerates the organizationof ions into chemically related sets and expedites thecreation of chemical library entries and the identificationof metabolites. It is immensely beneficial to track boththe chemicals for which there are authentic standardspectra in the chemical library and the chemicals forwhich there are no current library entries. Consequentlynew spectral libraries can be created automatically; themethod is not limited by the availability of a chemicallibrary of authentic standard spectra. Furthermore, theability to access data across multiple samples provides aunique and powerful method to resolve co-eluting che-micals. Taken together these features greatly facilitatethe chemo-centric approach to the analysis of metabolo-mics studies leading to the discovery of novel biomar-kers and understanding of the underlying biochemicalprocesses.
Authors’ contributionsCD, AE and HD participated in the design and analysis of this study. CD, AE,HD and KL participated in manuscript preparation and read and approvedthe final manuscript.
Competing interestsCD, AE, HD and KL are employees of Metabolon, Inc.
Received: 28 December 2009 Accepted: 18 October 2010Published: 18 October 2010
References1. Schnackenberg LK, Beger RD: Monitoring the health to disease
continuum with global metabolic profiling and systems biology.Pharmacogenomics 2006, 7:1077-1086.
2. Nobeli I, Thornton JM: A bioinformatician’s view of the metabolome.Bioessays 2006, 28:534-545.
3. Griffin JL: The Cinderella story of metabolic profiling: does metabolomicsget to go to the functional genomics ball? Philos Trans R Soc Lond B BiolSci 2006, 361:147-161.
DeHaven et al. Journal of Cheminformatics 2010, 2:9http://www.jcheminf.com/content/2/1/9
Page 11 of 12

4. Dunn WB, Bailey NJ, Johnson HE: Measuring the metabolome: currentanalytical technologies. Analyst 2005, 130:606-625.
5. Nordstrom A, O’Maille G, Qin C, Siuzdak G: Nonlinear Data Alignment forUPLC-MS and HPLC-MS Based Metabolomics: Quantitative Analysis ofEndogenous and Exogenous Metabolites in Human Serum. Anal Chem2006, 78:3289-3295.
6. Evans AM, Dehaven CD, Barrett T, Mitchell M, Milgram E: Integrated,Nontargeted Ultrahigh Performance Liquid Chromatography/Electrospray Ionization Tandem Mass Spectrometry Platform for theIdentification and Relative Quantification of the Small-MoleculeComplement of Biological Systems. Anal Chem 2009, 81:6656-6667.
7. Young SS, Barrett TH Jr, Beecher C: System, Method and ComputerProgram Product for Analyzing Spectrometry Data to Identify andQuantify Individual Components in a Sample. 2009, US Patent 7,561,975,Issued.
8. Scheltema R, Decuypere S, Dujardin J, Watson D, Jansen R, Breitling R:Simple data-reduction method for high-resolution LC-MS data inmetabolomics. Bioanalysis 2009, 1:1551-1557.
9. Setchell KD, Brown NM, Lydeking-Olsen E: The clinical importance of themetabolite equol-a clue to the effectiveness of soy and its isoflavones. JNutr 2002, 132:3577-3584.
10. Tolstikov VV, Fiehn O: Analysis of highly polar compounds of plant origin:combination of hydrophilic interaction chromatography andelectrospray ion trap mass spectrometry. Anal Biochem 2002, 301:298-307.
11. Werner E, Heilier JF, Ducruix C, Ezan E, Junot C, Tabet JC: Massspectrometry for the identification of the discriminating signals frommetabolomics: current status and future trends. J Chromatogr B AnalytTechnol Biomed Life Sci 2008, 871:143-163.
12. Katajamaa M, Oresic M: Data processing for mass spectrometry-basedmetabolomics. J Chromatogr A 2007, 1158:318-328.
13. Cloarec O, Campbell A, Tseng LH, Braumann U, Spraul M, Scarfe G,Weaver R, Nicholson JK: Virtual chromatographic resolution enhancementin cryoflow LC-NMR experiments via statistical total correlationspectroscopy. Anal Chem 2007, 79:3304-3311.
14. Cloarec O, Dumas ME, Craig A, Barton RH, Trygg J, Hudson J, Blancher C,Gauguier D, Lindon JC, Holmes E, Nicholson J: Statistical total correlationspectroscopy: an exploratory approach for latent biomarkeridentification from metabolic 1H NMR data sets. Anal Chem 2005,77:1282-1289.
15. Couto Alves A, Rantalainen M, Holmes E, Nicholson JK, Ebbels TM: AnalyticProperties of Statistical Total Correlation Spectroscopy BasedInformation Recovery in (1)H NMR Metabolic Data Sets. Anal Chem 2009,81:2075-84.
16. Crockford DJ, Holmes E, Lindon JC, Plumb RS, Zirah S, Bruce SJ, Rainville P,Stumpf CL, Nicholson JK: Statistical heterospectroscopy, an approach tothe integrated analysis of NMR and UPLC-MS data sets: application inmetabonomic toxicology studies. Anal Chem 2006, 78:363-371.
17. Lawton KA, Berger A, Mitchell M, Milgram KE, Evans AM, Guo L, Hanson RW,Kalhan SC, Ryals JA, Milburn MV: Analysis of the adult human plasmametabolome. Pharmacogenomics 2008, 9:383-397.
18. Sreekumar A, Poisson LM, Rajendiran TM, Khan AP, Cao Q, Yu J, Laxman B,Mehra R, Lonigro RJ, Li Y, Nyati MK, Ahsan A, Kalyana-Sundaram S, Han B,Cao X, Byun J, Omenn GS, Ghosh D, Pennathur S, Alexander DC, Berger A,Shuster JR, Wei JT, Varambally S, Beecher C, Chinnaiyan AM: Metabolomicprofiles delineate potential role for sarcosine in prostate cancerprogression. Nature 2009, 457:910-914.
19. Boudonck KJ, Mitchell MW, Nemet L, Keresztes L, Nyska A, Shinar D,Rosenstock M: Discovery of metabolomics biomarkers for early detectionof nephrotoxicity. Toxicol Pathol 2009, 37:280-292.
20. Watson M, Roulston A, Bélec L, Billot X, Marcellus R, Bédard D, Bernier C,Branchaud S, Chan H, Dairi K, Gilbert K, Goulet D, Gratton MO, Isakau H,Jang A, Khadir A, Koch E, Lavoie M, Lawless M, Nguyen M, Paquette D,Turcotte E, Berger A, Mitchell M, Shore GC, Beauparlant P: The smallmolecule GMX1778 is a potent inhibitor of NAD+ biosynthesis: strategyfor enhanced therapy in nicotinic acid phosphoribosyltransferase 1-deficient tumors. Mol Cell Biol 2009, 29:5872-5888.
21. Ohta T, Masutomi N, Tsutsui N, Sakairi T, Mitchell M, Milburn MV, Ryals JA,Beebe KD, Guo L: Untargeted metabolomic profiling as an evaluativetool of fenofibrate-induced toxicology in Fischer 344 male rats. ToxicolPathol 2009, 37:521-535.
22. Boudonck KJ, Mitchell M, Wulff J, Ryals JA: Characterization of thebiochemical variability of bovine milk using metabolomics. Metabolomics2009, 5:375-386.
23. Halket JM, Waterman D, Przyborowska AM, Patel RK, Fraser PD, Bramley PM:Chemical derivatization and mass spectral libraries in metabolic profilingby GC/MS and LC/MS/MS. J Exp Bot 2005, 56:219-243.
doi:10.1186/1758-2946-2-9Cite this article as: DeHaven et al.: Organization of GC/MS and LC/MSmetabolomics data into chemical libraries. Journal of Cheminformatics2010 2:9.
Open access provides opportunities to our colleagues in other parts of the globe, by allowing
anyone to view the content free of charge.
Publish with ChemistryCentral and everyscientist can read your work free of charge
W. Jeffery Hurst, The Hershey Company.
available free of charge to the entire scientific communitypeer reviewed and published immediately upon acceptancecited in PubMed and archived on PubMed Centralyours you keep the copyright
Submit your manuscript here:http://www.chemistrycentral.com/manuscript/
DeHaven et al. Journal of Cheminformatics 2010, 2:9http://www.jcheminf.com/content/2/1/9
Page 12 of 12