methodology open access a single-field integrated boost
TRANSCRIPT

Zhu et al. Radiation Oncology 2014, 9:202http://www.ro-journal.com/content/9/1/202
METHODOLOGY Open Access
A single-field integrated boost treatment planningtechnique for spot scanning proton therapyXiaorong Ronald Zhu1*, Falk Poenisch1, Heng Li1, Xiaodong Zhang1, Narayan Sahoo1, Richard Y Wu1, Xiaoqiang Li1,Andrew K Lee2, Eric L Chang2, Seungtaek Choi2, Thomas Pugh2, Steven J Frank2, Michael T Gillin1,Anita Mahajan2 and David R Grosshans2
Abstract
Purpose: Intensity modulated proton therapy (IMPT) plans are normally generated utilizing multiple field optimization(MFO) techniques. Similar to photon based IMRT, MFO allows for the utilization of a simultaneous integrated boost inwhich multiple target volumes are treated to discrete doses simultaneously, potentially improving plan quality andstreamlining quality assurance and treatment delivery. However, MFO may render plans more sensitive to the physicaluncertainties inherent to particle therapy. Here we present clinical examples of a single-field integrated boost (SFIB)technique for spot scanning proton therapy based on single field optimization (SFO) treatment-planning techniques.
Methods and materials: We designed plans of each type for illustrative patients with central nervous system (brain andspine), prostate and head and neck malignancies. SFIB and IMPT plans were constructed to deliver multiple prescriptiondose levels to multiple targets using SFO or MFO, respectively. Dose and fractionation schemes were based on thecurrent clinical practice using X-ray IMRT in our clinic. For inverse planning, dose constraints were employed to achievethe desired target coverage and normal tissue sparing. Conformality and inhomogeneity indices were calculated toquantify plan quality. We also compared the worst-case robustness of the SFIB, sequential boost SFUD, and IMPT plans.
Results: The SFIB technique produced more conformal dose distributions than plans generated by sequential boostusing a SFUD technique (conformality index for prescription isodose levels; 0.585 ± 0.30 vs. 0.435 ± 0.24, SFIB vs. SFUDrespectively, Wilcoxon matched-pair signed rank test, p < 0.01). There was no difference in the conformality indexbetween SFIB and IMPT plans (0.638 ± 0.27 vs. 0.633 ± 0.26, SFIB vs. IMPT, respectively). Heterogeneity between techniqueswas not significantly different. With respect to clinical metrics, SFIB plans proved more robust than the correspondingIMPT plans.
Conclusions: SFIB technique for scanning beam proton therapy (SSPT) is now routinely employed in our clinic. The SFIBtechnique is a natural application of SFO and offers several advantages over SFUD, including more conformal plans,seamless treatment delivery and more efficient planning and QA. SFIB may be more robust than IMPT and has been thetreatment planning technique of choice for some patients.
Keywords: Proton therapy, Spot scanning, Single-field optimization, Single field integrated boost, SFIB
* Correspondence: [email protected] of Radiation Physics, The University of Texas MD AndersonCancer Center, Unit 1150, 1515 Holcombe Boulevard, Houston, TX, USAFull list of author information is available at the end of the article
© 2014 Zhu et al.; licensee BioMed Central Ltd. This is an Open Access article distributed under the terms of the CreativeCommons Attribution License (http://creativecommons.org/licenses/by/2.0), which permits unrestricted use, distribution, andreproduction in any medium, provided the original work is properly credited. The Creative Commons Public DomainDedication waiver (http://creativecommons.org/publicdomain/zero/1.0/) applies to the data made available in this article,unless otherwise stated.

Zhu et al. Radiation Oncology 2014, 9:202 Page 2 of 12http://www.ro-journal.com/content/9/1/202
IntroductionIn spot scanning proton therapy (SSPT), a pencil beam(spot) is magnetically scanned in both directions lateralto the beam direction to produce a large field without theintroduction of scattering elements or range modulationdevices into the beam path [1-4]. Monoenergetic pencilbeams of different energies are used to produce thedesired depth dose distribution. The intensity of each spotcan also be modulated to deliver intensity-modulatedproton therapy (IMPT) [5-9]. To achieve the desired dosedistribution over the target volumes, the weights ofindividual spots are optimized using an inverse plan-ning process. There are two general approaches tooptimizing a SSPT plan. The first is to optimize theweights of all spots in all fields simultaneously toproduce the desired dose distribution. This approachis called multiple-field optimization (MFO), and ismore commonly known as IMPT [5-10]. The secondapproach is to optimize the weights on a field-by-fieldbasis, that is, each field is optimized individually todeliver a fraction of the prescribed doses to the entiretarget volume(s). This method is called single-fieldoptimization (SFO) [11]. The most common applicationof SFO is to produce a uniform dose over the entire targetvolume by each field, known as single–field uniform dose(SFUD) [5,11-13].An extension of SFO techniques would allow for the
incorporation of a simultaneous integrated boost (SIB), anapproach which we have termed, single field integratedboost (SFIB). The concept of SIB was originally proposedfor intensity modulated radiation therapy (IMRT) usingphotons [14] and has been widely used since. For a patientwith multiple target volumes to be treated at differentprescription dose levels, one could develop multipletreatment plans using SFUD to sequentially treat thepatient. However, optimizing plans separately may produceinferior results when plans are combined. Moreover,additional time is required for treatment planning aswell as quality assurance of individual plans. LikeIMRT, IMPT can be naturally used to achieve SIB[5-9]. IMPT is considered more flexible than SFUD andoften delivers more conformal dose distribution to targetvolumes and lower doses to critical structures. However,IMPT plans may be more sensitive to the uncertaintiesassociated with proton therapy and thus less robustthan SFUD plans [7]. Given the limitations of currentcommercial treatment planning systems (TPS), at theUniversity of Texas MD Anderson Cancer Center(UTMDACC) Proton Therapy Center, we normally treatour patients with the SFO (either SFUD or SFIB)technique [13], unless the IMPT plan is significantlybetter than the SFO plan. In this work, we presentexamples of treatment planning techniques of SFIBimplemented in our clinic.
Materials and methodsPatients and treatment planningSince April 2010, we have employed an SFIB techniquefor planning and treatment of patients at the UTMDACCproton therapy center. Diseases planned and treated withthis technique include prostate cancer, thoracic tumors,central nervous system tumors (brain and spinal lesions),and head and neck tumors. All patients are enrolled inInstitutional Review Board approved prospective studiesof proton therapy. To demonstrate the SFIB techniqueand qualitatively assess it’s benefits and versatility, here wepresent four representative clinical cases each withmultiple target volumes requiring different dose levels.We utilized SFO planning with dose constraints employed
to achieve the desired coverage of different target volumesby differing dose levels within in a single plan. Target vol-umes treated with the SFIB technique may include a targetwithin a target, such as for patient 1 and 4; targets locatedside by side, such as for patient 3; or a combination of thesetwo situations, such as for patient 2 (see below for detaileddescription of each case).SFIB treatment plans as well as sequential boost SFUD
and IMPT plans were generated for comparison. Doselevels for SFUD plans were determined based on thelinear quadratic model and the dose levels chosen by thetreating physician for the clinically utilized SFIB plan.Doses were rounded to integer number of fractions.IMPT plans used identical dose levels as SFIB plans.Treatment plans for all patients were developed usingcomputed tomography (CT) images obtained using120-kV X-rays on a 16-slice scanner (LightSpeed RT 16;GE Healthcare, Waukesha, WI). In treatment planning, allproton doses were expressed as Gy(RBE) with a constantRBE factor of 1.1. The Eclipse TPS (version 8.9; VarianMedical Systems, Palo Alto, CA) with a proton modulewas used. Inverse planning using an SFO and MFOoptions with simultaneous spot optimization, usingconstraints for target volumes and critical structures,was used for all patients. The details of our clinicalcommissioning of the scanning beam dose model in TPS isdescribed separately [15]. Each spot’s position, energy, andnumber of monitor units (MUs) were determined usingthe TPS. Beam parameters for each field are summarizedin Table 1.
Patient 1 central nervous system - brainA young patient with a glioma of the tectal plate wastreated with SSPT. The patient was immobilized using aPrecise Bite positioner attached to a thermoplastic maskwith a polyurethane foam headrest (CIVCO MedicalSolutions, Orange City, IA). The SFUD, SFIB and IMPTplans used the same three fields: two left oblique superiorvertex fields and one posterior– anterior (PA) field.For SFIB and IMPT planning, the clinically prescribed
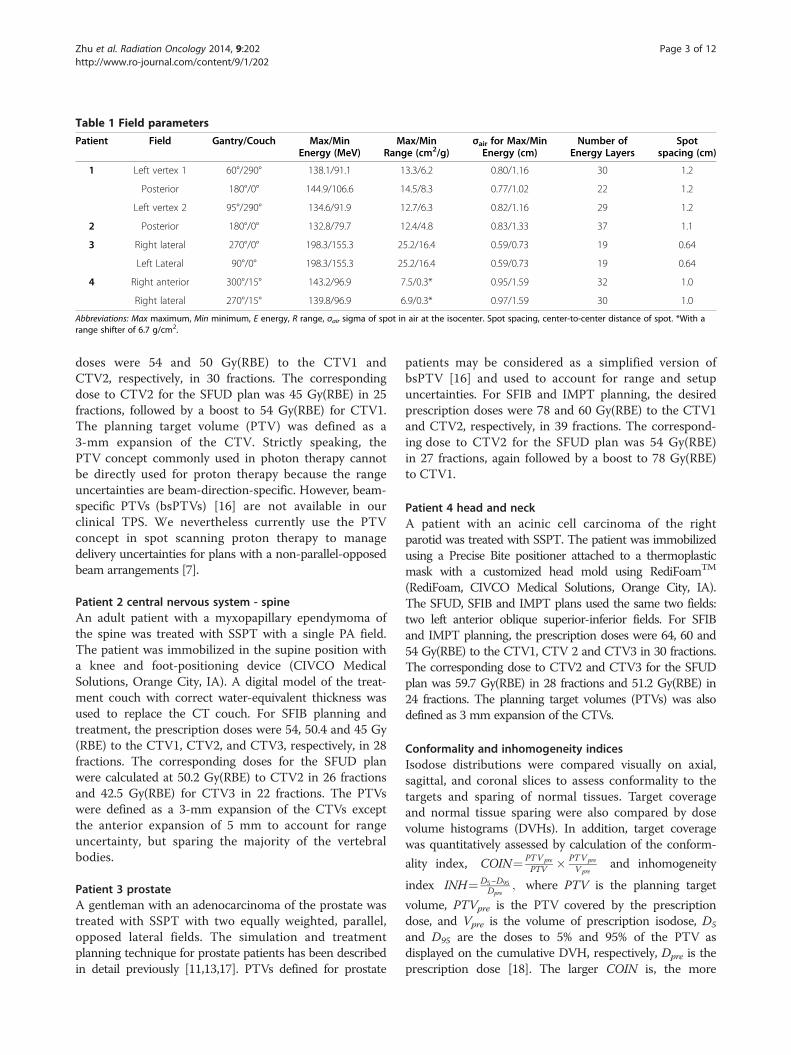
Table 1 Field parameters
Patient Field Gantry/Couch Max/MinEnergy (MeV)
Max/MinRange (cm2/g)
σair for Max/MinEnergy (cm)
Number ofEnergy Layers
Spotspacing (cm)
1 Left vertex 1 60°/290° 138.1/91.1 13.3/6.2 0.80/1.16 30 1.2
Posterior 180°/0° 144.9/106.6 14.5/8.3 0.77/1.02 22 1.2
Left vertex 2 95°/290° 134.6/91.9 12.7/6.3 0.82/1.16 29 1.2
2 Posterior 180°/0° 132.8/79.7 12.4/4.8 0.83/1.33 37 1.1
3 Right lateral 270°/0° 198.3/155.3 25.2/16.4 0.59/0.73 19 0.64
Left Lateral 90°/0° 198.3/155.3 25.2/16.4 0.59/0.73 19 0.64
4 Right anterior 300°/15° 143.2/96.9 7.5/0.3* 0.95/1.59 32 1.0
Right lateral 270°/15° 139.8/96.9 6.9/0.3* 0.97/1.59 30 1.0
Abbreviations: Max maximum, Min minimum, E energy, R range, σair sigma of spot in air at the isocenter. Spot spacing, center-to-center distance of spot. *With arange shifter of 6.7 g/cm2.
Zhu et al. Radiation Oncology 2014, 9:202 Page 3 of 12http://www.ro-journal.com/content/9/1/202
doses were 54 and 50 Gy(RBE) to the CTV1 andCTV2, respectively, in 30 fractions. The correspondingdose to CTV2 for the SFUD plan was 45 Gy(RBE) in 25fractions, followed by a boost to 54 Gy(RBE) for CTV1.The planning target volume (PTV) was defined as a3-mm expansion of the CTV. Strictly speaking, thePTV concept commonly used in photon therapy cannotbe directly used for proton therapy because the rangeuncertainties are beam-direction-specific. However, beam-specific PTVs (bsPTVs) [16] are not available in ourclinical TPS. We nevertheless currently use the PTVconcept in spot scanning proton therapy to managedelivery uncertainties for plans with a non-parallel-opposedbeam arrangements [7].
Patient 2 central nervous system - spineAn adult patient with a myxopapillary ependymoma ofthe spine was treated with SSPT with a single PA field.The patient was immobilized in the supine position witha knee and foot-positioning device (CIVCO MedicalSolutions, Orange City, IA). A digital model of the treat-ment couch with correct water-equivalent thickness wasused to replace the CT couch. For SFIB planning andtreatment, the prescription doses were 54, 50.4 and 45 Gy(RBE) to the CTV1, CTV2, and CTV3, respectively, in 28fractions. The corresponding doses for the SFUD planwere calculated at 50.2 Gy(RBE) to CTV2 in 26 fractionsand 42.5 Gy(RBE) for CTV3 in 22 fractions. The PTVswere defined as a 3-mm expansion of the CTVs exceptthe anterior expansion of 5 mm to account for rangeuncertainty, but sparing the majority of the vertebralbodies.
Patient 3 prostateA gentleman with an adenocarcinoma of the prostate wastreated with SSPT with two equally weighted, parallel,opposed lateral fields. The simulation and treatmentplanning technique for prostate patients has been describedin detail previously [11,13,17]. PTVs defined for prostate
patients may be considered as a simplified version ofbsPTV [16] and used to account for range and setupuncertainties. For SFIB and IMPT planning, the desiredprescription doses were 78 and 60 Gy(RBE) to the CTV1and CTV2, respectively, in 39 fractions. The correspond-ing dose to CTV2 for the SFUD plan was 54 Gy(RBE)in 27 fractions, again followed by a boost to 78 Gy(RBE)to CTV1.
Patient 4 head and neckA patient with an acinic cell carcinoma of the rightparotid was treated with SSPT. The patient was immobilizedusing a Precise Bite positioner attached to a thermoplasticmask with a customized head mold using RediFoamTM
(RediFoam, CIVCO Medical Solutions, Orange City, IA).The SFUD, SFIB and IMPT plans used the same two fields:two left anterior oblique superior-inferior fields. For SFIBand IMPT planning, the prescription doses were 64, 60 and54 Gy(RBE) to the CTV1, CTV 2 and CTV3 in 30 fractions.The corresponding dose to CTV2 and CTV3 for the SFUDplan was 59.7 Gy(RBE) in 28 fractions and 51.2 Gy(RBE) in24 fractions. The planning target volumes (PTVs) was alsodefined as 3 mm expansion of the CTVs.
Conformality and inhomogeneity indicesIsodose distributions were compared visually on axial,sagittal, and coronal slices to assess conformality to thetargets and sparing of normal tissues. Target coverageand normal tissue sparing were also compared by dosevolume histograms (DVHs). In addition, target coveragewas quantitatively assessed by calculation of the conform-
ality index, COIN¼ PTVpre
PTV � PTVpre
V preand inhomogeneity
index INH¼ D5−D95Dpre
; where PTV is the planning target
volume, PTVpre is the PTV covered by the prescriptiondose, and Vpre is the volume of prescription isodose, D5
and D95 are the doses to 5% and 95% of the PTV asdisplayed on the cumulative DVH, respectively, Dpre is theprescription dose [18]. The larger COIN is, the more

A
B
C
D
Depth(cm)E
SFIB
SFUD
IMPT
CTV1
CTV2HippocampusOpticChiasm
BrainStem
WholeBrain
Figure 1 Representative isodose distributions on axial CT images for patient 1. (A) SFIB, (B) SFUD sequential boost and (C) IMPT treatmentplans for a central glioma. Targets and normal tissues are represented as color washes. (D) Dose volume histogram for corresponding plans. Solidlines correspond to SFIB, dashed lines to SFUD, and dotted lines to IMPT. Exposure of right and left hippocampi to low and high doses isreduced for SFIB and IMPT plans. (E) Comparison of measured (data points) and calculated (blue lines) depth dose curves for each of threebeams employed in the treatment of patient 1. Error bars are fixed values of 3% in the vertical axis and 2 mm in the horizontal axis to helpvisualizing the difference between measurements and calculations.
Zhu et al. Radiation Oncology 2014, 9:202 Page 4 of 12http://www.ro-journal.com/content/9/1/202
conformal is the plan. The larger INH values indicate amore inhomogeneous dose distribution.
Comparison of robustnessRobustness of the SFUD, SFIB and IMPT plans withrespect to setup and range uncertainties was evaluatedusing a worst-case analysis method [19]. A setupuncertainty of 3 mm was used for patients 1, 2 and 4and 5 mm for patient 3. The range uncertainty wasassumed to be 3.5% of the nominal ranges [20]. Introduced
perturbations included six spatial shifts along the threemajor axes (left-right, posterior-anterior, and superior-inferior) and two range shifts – for a total of 8 perturbeddose distributions. The highest and lowest dose values ineach pixel were extracted from the nominal and the 8perturbed dose distributions, forming a hot and colddose distributions with the highest and lowest values,respectively [19]. The width of a banded DVH couldthen be used to qualitatively represent the robustness ofthe plans for a specific structure. We selected appropriate

Figure 2 Representative isodose distributions on sagittal CT images for patient 2. (A) SFIB and (B) SFUD treatment plans for a spinal ependymoma.Targets and normal tissues are represented as color washes. (C) Dose volume histogram for corresponding plans (solid lines, SFIB; dashed lines, SFUD).
Zhu et al. Radiation Oncology 2014, 9:202 Page 5 of 12http://www.ro-journal.com/content/9/1/202
dosimetric parameters from the DVHs for the hotand cold plans to compare the robustness of SFUD,SFIB and IMPT plans. For target volumes, D95 andD98 for CTVs and generalized equivalent uniformdose (EUD = (ΣviDi
a)1/a, where vi is the fractional organvolume receiving a dose Di and a is a tissue-specificparameter that describes the volume effect) [14,21],from the cold plans were used to compare the worstcase target coverage. The clinical criteria establishedin our clinic, are, in the worst case (the cold plan),D95 ≥ 95%, D98 ≥ 90% and EUD ≥100% of the prescriptiondose. For normal tissues, the maximum dose (Dmax), mean
dose (Dmean) or the percent volume, VD, receiving certaindose, D, or more and EUD from hot plans were used tocompare the worst case sparing. The EUD parameter a wascollected from literature [14,21]: for CTVs, a= -10; for spinalcord, a= 20; for brainstem, hippocampus, optic chiasm,cochlea, a= 16; for femoral heads, a= 12; for mandible, a=10; for bladder, rectum a= 8; for larynx, a= 7.4; for kidney,a= 5; and for submandibular gland and whole brain, a= 1.
Statistical analysisThe COIN, INH, target coverage in terms of D95, D98
and EUD in the worst case (cold plans) and normal

CTV1CTV2
Rectum
Femoral Heads
Bladder
SFIB
SFUD
IMPT
A
B
C
D
Figure 3 Representative axial isodose distributions for treatment of a prostatic adenocarcinoma. Targets and normal tissues are representedas color washes. Slices depicting treatment of CTV2 (seminal vesicles) as well as CTV1 (prostate) are shown in left and right panels for SFIB (A), SFUDwith sequential boost (B) and IMPT (C) plans. The dose volume histogram is shown in (D) (solid lines, SFIB; dashed lines, SFUD and dotted lines, IMPT).
Zhu et al. Radiation Oncology 2014, 9:202 Page 6 of 12http://www.ro-journal.com/content/9/1/202
tissues dosimetric parameters in the worst case (hot plans)were compared statistically by the Wilcoxon matched-pairssigned rank test using GraphPad Prim 6 software(GraphPad Software, Inc., La Jolla, CA). A derived valueof p < 0.05 was considered statistically significant.
ResultsFigure 1A-D depicts the isodose distributions and DVHsbetween the SFIB, SFUD and IMPT plans for the gliomapatient. The SFIB planning technique produced a moreconformal dose distribution than the SFUD. Moreover,
the SFIB technique achieved the desired dose coveragefor the target volumes and lower doses to critical normalstructures including the right and left hippocampus, andwhole brain. The IMPT plan had similar target coverageas SFIB plan, however in this case, normal tissues hadsimilar or less dose. Panel E illustrates the calculatedand measured depth doses of the SFIB plan. Note thatthe depth dose curves are not flat as would be a typicalcurve from a passive scattering or SFUD plan. Instead,we observe a rather non-uniform dose profile, as requiredby the SFIB technique.

SFIB
SFUD
IMPT
A
B
C
CTV3
CTV1
CTV2
CTV1CTV2Right Submandibular
RightCochlea
Larynx D
CTV3
Figure 4 Representative axial, coronal and sagittal (left, middle, and right panels, respectively) CT images for a patient 4. (A) SFIB,(B) SFUD with sequential boost and (C) IMPT treatment plans. Targets volumes are represented as color washes. (D) Dose volume histogram(solid lines, SFIB; dashed lines, SFUD and dotted line, IMPT).
Zhu et al. Radiation Oncology 2014, 9:202 Page 7 of 12http://www.ro-journal.com/content/9/1/202
For the patient treated for a tumor within the spinalcanal, a comparison of isodose distributions and DVHsplanned with the SFIB and SFUD technique are shownin Figure 2, respectively and demonstrate that the SFIBplan is qualitatively, more conformal than SFUD plan. Be-cause this patient was treated with a single PA beam,IMPT planning was not applicable.
Figure 3 depicts a comparison of the isodose distributionsand DVHs between the SFIB, SFUD and IMPT plans forthe patient with adenocarcinoma of the prostate. SFIBplanning provided a slightly more conformal plan inthe region of CTV2 than SFUD. The SFIB techniqueachieved the desired dose coverage for the target volumesand similar doses to normal structures, including the

Zhu et al. Radiation Oncology 2014, 9:202 Page 8 of 12http://www.ro-journal.com/content/9/1/202
bladder, rectum, and femoral heads. The IMPT plan hadsimilar target coverage as SFIB plan and a reduced rectumdose but slightly increased femoral head dose.Figure 4 is a comparison of the isodose distributions
and DVHs between the SFIB, SFUD and IMPT plans forthe head and neck patient. The SFIB technique achieveda conformal dose distribution and met the desired dosecoverage for the target volumes while lowering dosesto some normal structures, such as the mandible andlarynx. The IMPT plans had similar coverage for thetarget but lower doses to normal tissues.
Conformality index and inhomogeneity indicesTable 2 lists the COIN and INH values for PTV1 forSFUD, SFIB and IMPT plans. For all four patients,SFIB plans had larger COIN values than SFUD plans(0.585 ± 0.300 vs. 0.435 ± 0.239, Wilconxon test, p < 0.01)and thus were more conformal than SFUD plans. However,the difference in COIN between SFIB and IMPT was notsignificant. The inhomogeneity between all three planningtechniques was similar (Wilcoxon test, p = 0.81).
Robustness evaluationShown in Figure 5 is a summary of the comparisonof worst case robustness of SFUD, SFIB and IMPTplans in terms of both target coverage and normaltissue sparing in column bar plots. For target coverageof all 4 patients, D95, D98 and EUD for the SFIBplans were smaller than SFUD plans in the worst
Table 2 Quantitative comparison of dose conformality and ho
COIN
SFUD SFIB
Patient 1
PTV1 0.507 0.867
PTV2 0.422 0.857
Patient 2
PTV1 0.771 0.771
PTV2 0.539 0.577
PTV3 0.026 0.033
Patient 3
PTV1 0.859 0.910
PTV2 0.140 0.159
Patient 4
PTV1 0.273 0.427
PTV2 0.474 0.613
PTV3 0.608 0.633
Mean ± SD (All patients) 0.435 ± 0.239* 0.585 ± 0.300*
Mean ± SD (exclude patient 2) 0.469 ± 0.232 0.638 ± 0.274
Abbreviations: COIN conformal index, INH inhomogeneity index, PTV planning targetIMPT intensity modulated proton therapy, SD standard deviation. *p < 0.01, Wilcoxo
case, cold plans, Table 3 (mean ± standard deviation,D95 = 100.0 ± 1.3 vs. 102.7 ± 5.0, D98 = 98.1 ± 2.1 vs.101.1 ± 5.2, EUD = 104.6 ± 2.8 vs. 108.0 ± 6.1, SFIB vs.SFUD, respectively, Wilcoxon test, p < 0.05 for D95,D98, and EUD). This is consistent with SFIB plan beingmore conformal than SFUD plans. Despite the slightlysmaller values of D95, D98 and EUD, all SFIB plans meetthe clinical criteria established in our clinic, that is, in theworst case (the cold plan), D95 ≥ 95%, D98 ≥ 90% andEUD ≥100% of the prescription dose (Table 3).For target coverage of the three cases with IMPT
plans, D95, D98 and EUD for the IMPT plans weresmaller than SFIB plans in the worst case, cold plans,Table 3 (mean ± standard deviation, D95 = 97.4 ± 3.3 vs.101.1 ± 1.5, D98 = 93.6 ± 6.1 vs. 97.9 ± 2.4, EUD= 102.3 ± 4.1vs. 105.5 ± 3.0, IMPT vs. SFIB, respectively, Wilcoxon test,p < 0.05 for D95 and EUD, and p = 0.078 for D98). However,some IMPT plans failed to meet the clinical criteria in theworst case scenario (the cold plans), with minimum valuesof D95, D98 and EUD of 92.7%, 82.4% and 95.4% of theprescription doses respectively, values below our clinicalcriteria (Table 3).For normal tissues, SFIB was significant better than
SFUD even in the worst case (the hot plans) (dosimetricparameters and EUDs in Figure 5, SFIB vs. SFUD,Wilcoxon test, p < 0.01). One noted exception was themandible for patient 4 as presented in Figure 5H.This exception is likely due to the fact that the mandibleoverlapped with target volume in this case. On the other
mogeneity
INH
IMPT SFUD SFIB IMPT
0.827 0.021 0.063 0.058
0.893 - -
- 0.066 0.056 -
- - - -
- - - -
0.851 0.043 0.038 0.057
0.154 - -
0.453 0.062 0.089 0.091
0.638 - -
0.613 - -
- 0.048 ± 0.021 0.062 ± 0.021 -
0.633 ± 0.263 0.042 ± 0.021 0.063 ± 0.026 0.069 ± 0.019
volume, SFIB single-field integrated boost, SFUD single field uniform dose,n matched-pairs signed rank test.

Figure 5 Worst case robustness comparison of SFUD, SFIB and IMPT/MFO plans. The left column (blue) represents SFUD, the middle (red),SFIB, and the right (green), IMPT plans. For target volumes, the cold plans are used to evaluate target coverage in terms of percentage of dosesof D95, D98 and EUD relative to the prescription doses. For critical structures, the hot plans are used assess the tissue sparing. (A) and (B) forpatient 1 (BS – brain stem, HC – hippocampus, OC – optical chiasm, PH – pituitary and hypothalamus, WB – whole brain); (C) and (D) for patient2 (SC – spinal cord, LK – left kidney, RK – right kidney); (E) and (F) for patient 3 (BLD – bladder, RET – rectum, FH – femoral heads); and (G) and(H) for patient 4 (LNX- larynx, RS – right submandibular, RC – right cochlea, and MDB – mandible).
Zhu et al. Radiation Oncology 2014, 9:202 Page 9 of 12http://www.ro-journal.com/content/9/1/202
hand, the difference between IMPT and SFIB in termsof normal tissues in the worst cases (hot plans) wasinsignificant (Wilcoxon test, p = 0.58 and 0.45 for dosi-metric parameters and EUDs, respectively).
DiscussionSSPT employing an SFIB approach is commonly usedin our clinical practice. Here, we have presented examples
of treatment plans utilizing the SFIB technique. We foundin each disease site, the SFIB technique generated moreconformal dose distributions than the SFUD technique.Moreover, SFIB plans were robust in the face of uncertain-ties. For target coverage, all SFIB plans meet clinicalcriteria even in the worst-case scenario; for normaltissues, the SFIB plans were most often superior toSFUD plans with the exception cases where normal tissues

Table 3 Summary of the worst-case target coverage as percentage of prescription dose
SFUD% (range) SFIB% (range) IMPT% (range)
D95/Dpre (All patients) 102.7 ± 5.0 100 ± 1.3 -
(97.6-115.9) (97.6-102.5) -
D98/Dpre (All patients) 101.1 ± 5.2 98.1 ± 2.1 -
(95.2-114.2) (95.0-101.2) -
EUD/Dpre (All patients) 108.0 ± 6.1 104.6 ± 2.8 -
(101.6-120.2) (101.9-108.9) -
D95/Dpre (exclude patient 2) 103.8 ± 5.5 100.1 ± 1.5 97.4 ± 3.3
(99.7-115.9) (97.6-102.5) (92.7-101.9)
D98/Dpre (exclude patient 2) 101.9 ± 5.9 97.9 ± 2.4 93.6 ± 6.1
(95.2-114.2) (95.0-101.2) (82.4-100.4)
EUD/Dpre (exclude patient 2) 109.5 ± 6.7 105.5 ± 3.0 102.3 ± 4.1
(101.6-120.2) (101.9-108.9) (95.4-106.8)
Abbreviations: D95 and D98, doses to 95% and 98% of the target volumes as displayed on the cumulative DVH, respectively, Dpre, prescription dose, EUD equivalentuniform dose, SFUD single field uniform dose, SFIB single-field integrated boost, IMPT intensity modulated proton therapy.
Zhu et al. Radiation Oncology 2014, 9:202 Page 10 of 12http://www.ro-journal.com/content/9/1/202
of concern overlapped with the target volume. Our clinicalexperience suggests that not only does SFIB result insuperior treatment plans but also expedites treatmentplanning and patient specific QA.SSPT offers exciting and challenging new opportunities,
such as IMPT. In IMPT, the dose for each individual fieldis highly inhomogeneous within each target volume.When all fields are combined, the total doses would resultin the desired dose distribution for all target volumes.Shown in Figure 6 are the IMPT plan dose distributionsfrom combined and individual fields for patient 4. Thereis little difference between SFIB and IMPT for thecombined dose distributions (Figure 6A and B), except theIMPT dose distribution is more conformal in certain areas(arrow, Figure 6B). For both field one or two, the IMPTplan shows much more inhomogenous dose distributionthan the SFIB plan. One could consider IMPT as asophisticated version of the patch/match technique,sometimes used in passively scattered proton beam therapyplanning [1]. IMPT may produce more conformal dosedistributions, but may also be more sensitive to variousuncertainties, including setup and range uncertainties.In the current work, worst case robust analysis showed
that IMPT were less robust than SFIB plans in terms oftarget coverage. It should be pointed out that theoptimization phase space of a SFIB plan is a subset ofthat of IMPT. In other words, it is possible, in theory, toobtain a solution of SFIB with MFO. In practice, however,one would never arrive at a solution of SFIB usingMFO due to very large number of degenerated solutionsavailable for MFO. In our clinical practice, we have alsofound that the robustness of an IMPT plan is optimizationtechnique dependent; that is, IMPT plans generated bysome initial conditions are more robust than others. Forthe examples presented here, the SFIB technique achieved
the similar dose conformity and normal tissue sparing toIMPT and yet provided some assurance of robustness ofthe plan.The SFIB technique may not be ideally applied to all
cancer patients who received SSPT and require multipledose levels. For complex target volumes such as withoropharyngeal and nasopharyngeal tumors requiringtreatment of the bilateral neck, it is recommended touse IMPT as the planning method given the complexgeometry of the targets [19]. Indeed robust optimization,considering various uncertainties, is recommended forgeneral IMPT planning [6,7,22].The SFUD technique produces a flat depth dose
profile within the target along the beam direction bythe superposition of many spots with different energies.However, a flat depth dose profile is not required withSFO. In fact, the planner has all the degrees of freedom toproduce a non-uniform dose distribution along the beamand lateral directions with SFO. SFO is a more generalconcept than SFUD and may be used to generate eitherSFUD or SFIB plans on a field-by-field basis. It should benoted that identical beams were used for SFUD primaryand boost plans in this work. If different beam angles wereused for the boost SFUD plans, the normal tissues mightbe better spared. However, this was not explored in thecurrent study.In a planning study, Cozzia et al. proposed an SIB
technique based on SFUD for head and neck cancerpatients with two target volumes and two prescriptiondose levels [23]. They optimized fields for each targetindividually and then summed them to obtain the finalplan. In contrast to the SFUD-based SIB technique byCozzia et al. [23], the SFIB method presented in thiswork is an integrated approach in terms of both treatmentplanning and delivery.
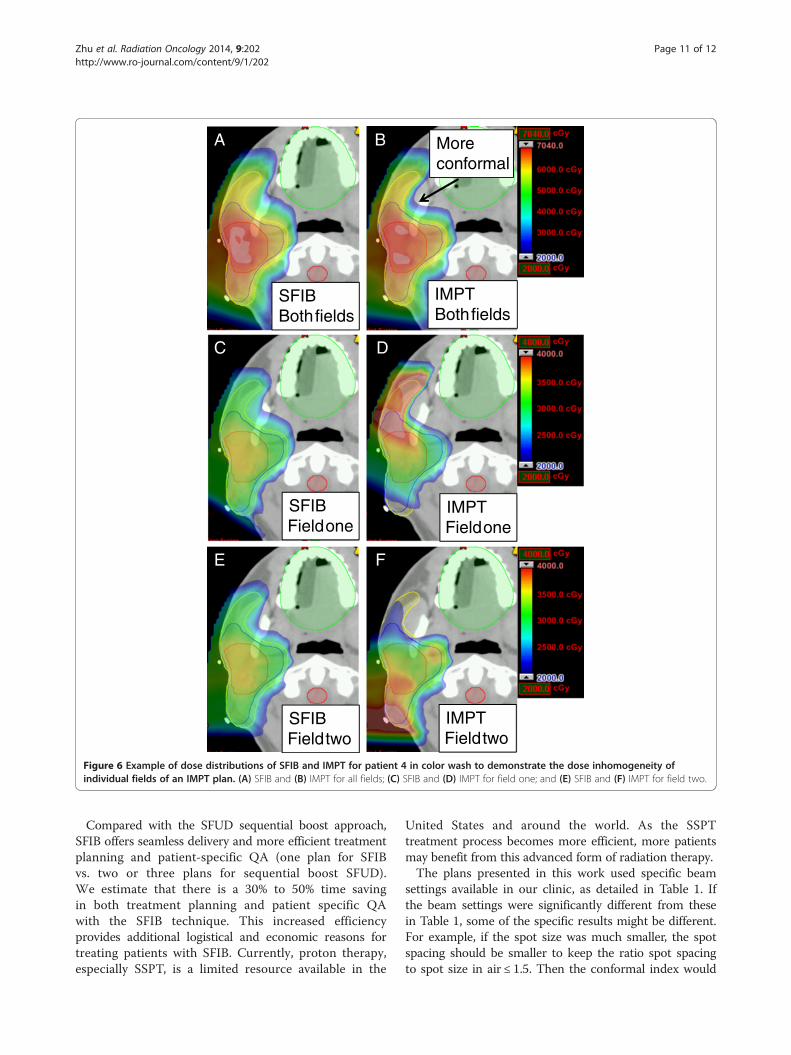
SFIBBothfields
IMPTBothfields
SFIBFieldone
IMPTFieldone
SFIBFieldtwo
IMPTFieldtwo
A B
C D
E F
Moreconformal
Figure 6 Example of dose distributions of SFIB and IMPT for patient 4 in color wash to demonstrate the dose inhomogeneity ofindividual fields of an IMPT plan. (A) SFIB and (B) IMPT for all fields; (C) SFIB and (D) IMPT for field one; and (E) SFIB and (F) IMPT for field two.
Zhu et al. Radiation Oncology 2014, 9:202 Page 11 of 12http://www.ro-journal.com/content/9/1/202
Compared with the SFUD sequential boost approach,SFIB offers seamless delivery and more efficient treatmentplanning and patient-specific QA (one plan for SFIBvs. two or three plans for sequential boost SFUD).We estimate that there is a 30% to 50% time savingin both treatment planning and patient specific QAwith the SFIB technique. This increased efficiencyprovides additional logistical and economic reasons fortreating patients with SFIB. Currently, proton therapy,especially SSPT, is a limited resource available in the
United States and around the world. As the SSPTtreatment process becomes more efficient, more patientsmay benefit from this advanced form of radiation therapy.The plans presented in this work used specific beam
settings available in our clinic, as detailed in Table 1. Ifthe beam settings were significantly different from thesein Table 1, some of the specific results might be different.For example, if the spot size was much smaller, the spotspacing should be smaller to keep the ratio spot spacingto spot size in air ≤ 1.5. Then the conformal index would

Zhu et al. Radiation Oncology 2014, 9:202 Page 12 of 12http://www.ro-journal.com/content/9/1/202
be improved for all plans yet the robustness would bereduced with respect to the setup uncertainties due tosharper penumbra associated with smaller spot size.However, one should expect that the SFIB still is a validplanning technique to generate conformal and robustplans for selected patients with relatively simple targets.
ConclusionWe have successfully implemented an SFIB technique basedon SFO for SSPT to treat a variety of cancer types. SFIB is anatural application of SFO. When SFO is used, a uniformdose across the target volume is not required. Therefore,SFO is a general concept and can be used to generate eitherSFUD or SFIB plans. SFIB often produces more conformalplans compared to those with SFUD. Additional advantagesof SFIB are seamless delivery and more efficient treatmentplanning and patient-specific QA. For relatively simpletarget volumes presented in this work, we also demon-strated that SFIB may be more robust than IMPT, yet hassimilar conformity and normal tissue sparing.
Competing interestsThe authors declare that they have no competing interests.
Authors’ contributionsXRZ: performed planning study and data analysis. FP: contributed planningstudy and data analysis. HL: contributed planning study and data analysis.RYW: contributed planning study and data analysis. NS: contributed planningstudy and data analysis XL: performed some of robust analysis. AKL:contributed the original idea. ELC: contributed evaluation of one of thepatients’ treatment plans. SC: contributed the original idea. TP: contributedevaluation of one of the patients’ treatment plans. SJF: contributedevaluation of one of the patients’ treatment plans. MTG: contributed theoriginal idea. AM: contributed the original idea. DRG: contributed the originalidea and evaluation of one of the patients’ treatment plans. All authors readand approved the final manuscript.
AcknowledgmentsWe would like to thank Mayank V Amin and Matthew B Palmer for theirassistance with development of some of clinical plans. We greatly appreciateKaren Müller from the Department of Scientific Publications for her editorialreview of this manuscript. This research is supported in part by the NationalInstitutes of Health through MD Anderson’s Cancer Center Support Grant(CA016672).
Author details1Departments of Radiation Physics, The University of Texas MD AndersonCancer Center, Unit 1150, 1515 Holcombe Boulevard, Houston, TX, USA.2Department of Radiation Oncology, The University of Texas MD AndersonCancer Center, 1515 Holcombe Boulevard, Houston, TX, USA.
Received: 20 November 2013 Accepted: 5 September 2014Published: 11 September 2014
References1. Delaney TF, Kooy HM: Proton and Charged Particle Radiotherapy.
Philadelphia: Wolters Kluwer Lippincott Williams & Wilkins; 2008.2. Haberer T, Becher W, Schardt D, Kraft G: Magnetic scanning system for
heavy ion therapy. Nucl Instrum Methods Phys Res A 1993, 330:296–305.3. ICRU: Prescribing, Recording, And Reporting Proton-Beam Therapy. Washington DC:
International Commission on Radiation Units and Measurements; 2007.4. Pedroni E, Bacher R, Blattmann H, Bohringer T, Coray A, Lomax A, Lin S,
Munkel G, Scheib S, Schneider U, Tourovsky A: The 200-mev protontherapy project at the Paul scherrer institute: conceptual design andpractical realization. Med Phys 1995, 22:37–53.
5. Lomax A: Intensity modulation methods for proton radiotherapy. Phys MedBiol 1999, 44:185–205.
6. Lomax AJ: Intensity modulated proton therapy and its sensitivity totreatment uncertainties 1: the potential effects of calculationaluncertainties. Phys Med Biol 2008, 53:1027–1042.
7. Lomax AJ: Intensity modulated proton therapy and its sensitivity totreatment uncertainties 2: the potential effects of inter-fraction andinter-field motions. Phys Med Biol 2008, 53:1043–1056.
8. Lomax AJ, Bohringer T, Coray D, Egger E, Goitein G, Grossmann M, Juelke P,Lin S, Pedroni E, Rohrer B, Roser W, Rossi B, Siegenthaler B, Stadelmann O,Stauble H, Vetter C, Wisser L: Intensity modulated proton therapy: a clinicalexample. Med Phys 2001, 28:317–324.
9. Lomax AJ, Bohringer T, Bolsi A, Coray D, Emert F, Goitein G, Jermann M, Lin S,Pedroni E, Rutz H, Stadelmann O, Timmermann B, Verwey J, Weber DC:Treatment planning and verification of proton therapy using spotscanning: Initial experiences. Med Phys 2004, 31:3150–3157.
10. Smith AR: Vision 20/20: proton therapy. Med Phys 2009, 36:556–568.11. Zhu XR, Sahoo N, Zhang X, Robertson D, Li H, Choi S, Lee MT, Gillin AK:
Intensity modulated proton therapy treatment planning using single-fieldoptimization: the impact of monitor unit constraints on plan quality.Med Phys 2010, 37:1210–1219.
12. Fredriksson A, Forsgren A, Hardemark B: Minimax optimization for handlingrange and setup uncertainties in proton therapy. Med Phys 2011, 38:1672–1684.
13. Zhu XR, Poenisch F, Song X, Johnson JL, Ciangaru G, Taylor MB, Lii M,Martin C, Arjomandy B, Lee AK, Choi S, Nguyen QN, Gillin MT, Sahoo N:Patient-specific quality assurance for prostate cancer patients receivingspot scanning proton therapy using single-field uniform dose. Int JRadiat Oncol Biol Phys 2011, 81:552–559.
14. Wu Q, Manning M, Schmidt-Ullrich R, Mohan R: The potential forsparing of parotids and escalation of biologically effective dose withintensity-modulated radiation treatments of head and neck cancers:a treatment design study. Int J Radiat Oncol Biol Phys 2000, 46:195–205.
15. Zhu XR, Poenisch F, Lii M, Sawakuchi G, Titt U, Bues M, Song X, Zhang X,Li Y, Ciangaru G, Li H, Taylor MB, Suzuki K, Mohan R, Gillin MT, Sahoo N:Commissioning dose computation models for spot scanning protonbeams in water for a commercially available treatment planning system.Med Phys 2013, 40:041723. 041721-041715.
16. Park PC, Zhu XR, Lee AK, Sahoo N, Melancon AD, Zhang L, Dong L: Abeam-specific planning target volume (ptv) design for proton therapyto account for setup and range uncertainties. Int J Radiat Oncol BiolPhys 2011.
17. Meyer J, Bluett J, Amos R, Levy L, Choi S, Nguyen QN, Zhu XR, Gillin MT,Lee AK: Spot scanning proton beam therapy for prostate cancer: treatmentplanning technique and analysis of consequences of rotational andtranslational alignment errors. Int J Radiat Oncol Biol Phys 2010, 78:428–434.
18. Zhu XR, Prado K, Liu HH, Guerrero TM, Jeter M, Liao Z, Rice D, Forster K, StevensCW: Intensity-modulated radiation therapy for mesothelioma: impact ofmultileaf collimator leaf width and pencil beam size on planning quality anddelivery efficiency. Int J Radiat Oncol Biol Phys 2005, 62:1525–1534.
19. Quan EM, Liu W, Wu R, Li Y, Frank SJ, Zhang X, Zhu XR, Mohan R:Preliminary evaluation of multifield and single-field optimization for thetreatment planning of spot-scanning proton therapy of head and neckcancer. Med Phys 2013, 40:081709.
20. Yang M, Zhu XR, Park PC, Titt U, Mohan R, Virshup G, Clayton JE, Dong L:Comprehensive analysis of proton range uncertainties related to patientstopping-power-ratio estimation using the stoichiometric calibration.Phys Med Biol 2012, 57:4095–4115.
21. Li XA, Alber M, Deasy JO, Jackson A, Ken Jee KW, Marks LB, Martel MK, Mayo C,Moiseenko V, Nahum AE, Niemierko A, Semenenko VA, Yorke ED: The use andqa of biologically related models for treatment planning: Short report ofthe tg-166 of the therapy physics committee of the aapm. Med Phys 2012,39:1386–1409.
22. Liu W, Zhang X, Li Y, Mohan R: Robust optimization of intensity modulatedproton therapy. Med Phys 2012, 39:1079–1091.
23. Cozzia L, Bolsi A, Nicolini G, Fogliata A: The simultaneous integrated boostwith proton beams in head and neck patients. Z Med Phys 2004, 14:180–188.
doi:10.1186/1748-717X-9-202Cite this article as: Zhu et al.: A single-field integrated boost treatmentplanning technique for spot scanning proton therapy. Radiation Oncology2014 9:202.