methodology for developing input datasets for the moves model
TRANSCRIPT

Methodology for Developing
Input Datasets for the MOVES Model
The University of Tennessee, Knoxville
Department of Civil & Environmental Engineering
851 Neyland Drive
Room 325, John D. Tickle Engineering Bldg.
Knoxville, TN 37996
Contact Person: James Calcagno
Post-doc Research Associate
Room 414, John D. Tickle Engineering Bldg.
Office phone: 865-974-7723
Email: [email protected]
May 2018

Technical Report Documentation Page
1. Report No.
RES2013-09 2. Government Accession No.
3. Recipient's Catalog No.
4. Title and Subtitle
Input Data Development for Motor Vehicle Emissions Simulator
(MOVES)
5. Report Date
May 2018
6. Performing Organization Code
7. Author(s)
Calcagno, J. & Fu, J. 8. Performing Organization Report No.
9. Performing Organization Name and Address
University of Tennessee Knoxville
325 John D. Tickle Bldg
851 Neyland Drive
Knoxville,TN 37996-2313
10. Work Unit No. (TRAIS)
11. Contract or Grant No.
009B268 (FHWA)
12. Sponsoring Agency Name and Address
Tennessee Department of Transportation
Research Office
505 Deaderick Street, Suite 900
Nashville, TN 37243
13. Type of Report and Period Covered
Transportation Research Report
July 2013 – May 2018
14. Sponsoring Agency Code
15. Supplementary Notes
16. Abstract
In April 2004, the U.S. Environmental Protection Agency (EPA) released a new regulatory (computer)
model for estimating emissions from on-road motor vehicles called the Motor Vehicle Emission Simulator
(MOVES). Since the EPA must periodically update their regulatory models, as stipulated by the Clean Air Act, it
was in-line to replace the Mobile Source Emission Factor Model (MOBILE).
The EPA strongly recommends states use the latest version of MOVES that is available instead of relying on
previous versions of the model. The EPA also recommends that states derive input data for the model from local
sources rather than relying on default data which is included with the model. At the moment, adequate data in the
appropriate format to run MOVES are not available for many states in the country including Tennessee. The
purpose of this project was to develop several of these input datasets for the state.
17. Key Words
TIMES NEW ROMAN 12 PT, ALL CAPS,
BOLD,
18. Distribution Statement
No restrictions. This document is available through the
National Technical Information Service, Springfield,
VA 22161; www.ntis.gov.
19. Security Classif. (of this report)
Unclassified 20. Security Classif. (of this page)
Unclassified 21. No. of Pages
46 22. Price
$369,868.64
Form DOT F 1700.7 (8-72) Reproduction of completed page authorized

2
TABLE OF CONTENTS
Introduction ................................................................................................................................... 5
Source Type Population ............................................................................................................... 7
Vehicle Registration Data Method .............................................................................................. 8
Transit Bus ............................................................................................................................ 10
School Bus ............................................................................................................................ 11
National Default-Local Data Method ....................................................................................... 11
Final Statewide Dataset............................................................................................................. 13
Age Distribution .......................................................................................................................... 13
Road Type Distribution .............................................................................................................. 14
Vehicle Type VMT ...................................................................................................................... 15
Summary ...................................................................................................................................... 17
Conclusions .................................................................................................................................. 18
References .................................................................................................................................... 20
Appendix ...................................................................................................................................... 21
Appendix A - Tables mentioned in body of document ............................................................. 22
Appendix B - Equations and sample calculations mentioned in body of document ................ 38
Sample Calculations Source Type Population: ..................................................................... 39
Sample Calculations VMT Distribution: .............................................................................. 41
Sample Calculations AAVMT Distribution: ........................................................................ 43

3
LIST OF TABLES
Table 1: Input Data Files.............................................................................................................. 23
Table 2: Number of Vehicles in the TDOR July 2015 Initial Data Extraction ............................ 23
Table 3: Number of Vehicles in the TDOR January 2016 Initial Data Extraction ...................... 24
Table 4: HPMS 2015 DVMT for Rural and Urban Roads .......................................................... 25
Table 5: Class Count 2015 Summary for the Rural and Urban Road System ............................. 28
Table 6: HPMS 2016 DVMT for Rural and Urban Roads .......................................................... 29
Table 7: Class Count 2016 Summary for the Rural and Urban Road System ............................. 32
Table 8: HPMS and MOVES Mapping Scheme.......................................................................... 33
Table 9: Final Statewide Source Type Population Data for 2015 ............................................... 34
Table 10: Final Statewide Source Type Population Data for 2016 ............................................. 35
Table 11: 5-Year Average Monthly Variation Factors, by Day of Week for 2015 ..................... 36
Table 12: 5-Year Average Monthly Variation Factors, by Day of Week for 2016 ..................... 37

4
LIST OF EQUATIONS
Equation 1: General formula used to convert default population/VMT data, local DVMT, and
local vehicle count summaries into MOVES source type population data ................................... 39
Equation 2: General formula used to convert HPMS local DVMT and vehicle classification
summaries into MOVES road type VMT distributions by source types ...................................... 41
Equation 3: General formula used to calculate local AADVMT for HPMS vehicle types ......... 43

5
Introduction
In April 2004, the U.S. Environmental Protection Agency (EPA) released a new
regulatory (computer) model for estimating emissions from on-road motor vehicles called the
MOtor Vehicle Emission Simulator (MOVES). Since the EPA must periodically update their
regulatory models, as stipulated by the Clean Air Acts, it was in-line to replace the Mobile
Source Emission Factor Model (MOBILE). MOVES is considered to be vastly superior to
MOBILE because it incorporates the most recent advances in the science to better estimate
vehicle emissions. More importantly, it has new input data requirements that are not only
different but much larger in scope than the data requirements necessary to run the older model.
As of March 2, 2013, the EPA requires that MOVES is used for inventory development
in State Implementation Plans (SIP) and regional emissions analysis for showing transportation
conformity by all states except for California. Currently several versions of the model exist for
these purposes: MOVES2010, MOVES2010a, and MOVES2010b. Each version in the series
incorporated certain performance enhancements which did not significantly impact any changes
on emissions in computer runs at the County or Project Level Scales. However, a newer version
of the model (MOVES2014) was released in July 31, 2014 that contains modifications which
may impact changes in emissions. Likewise, certain modifications occurred in the format of the
MySQL tables that receive the input data between the 2010 and 2014 versions of the model.
Also, MOVES2014 is the first version of the model to include the ability to estimate emissions
from non-road sources. Non-road include combustion engine or turbines used for other purposes
than being an engine of a vehicle operated on public roadways. Examples of non-road sources
are construction, agriculture, railroad, marine, and aviation equipment. Currently non-road
emissions from MOVES2014 are essentially equivalent to those produced from
NONROAD2008 and NMIM2008 (National Mobile Inventory Model).
On November 4, 2014, EPA released still another version of the model (MOVES2014a)
that contains minor revisions to the previously released model (MOVES2014). Since significant
changes in criteria pollution emissions did not result, MOVES2014a is not considered to be a
new model for SIP and transportation conformity purposes. In the future, MOVES2014 and the
minor revisions (currently, only MOVES2014a) will replace MOVES2010 and its minor
revisions (MOVES2010a and MOVES2010b) for regulatory purposes. The grace period

6
between using MOVES2010 and MOVES2014 ended on October 7, 2016. Nonetheless, the
EPA strongly recommends states use the latest version of MOVES that is available instead of
relying on previous versions of the model. The EPA also recommends that states derive input
data for the model from local sources rather than relying on default data which is included with
the model. At the moment, adequate data in the appropriate format to run MOVES are not
available for many states in the country, and the State of Tennessee is not an exception.
The purpose of this project was to develop several of these input datasets for the State of
Tennessee which are listed in Table 1. (Note: all tables mentioned in this document are included
in Appendix A.) These input files will also be formatted to MOVES2014a, which is the most
recent version of the model, as of the writing of this document. Thereafter, MOVES2014a will
be referred to simply as MOVES.
The CDM (County Data Manager) tab is the dialog box of the importer tool in MOVES;
it allows the user to import data into MySQL, which is the data management software package
included with the model. Other input datasets, located in the CDM, such as the Average Speed
Distribution, Meteorological Data, Fuel, and I/M Programs, will not be discussed in this report;
these datasets will be developed by other entities. It is assumed that the reader of this document
has some familiarity with using MOVES, so only a minimal discussion of the mechanics of the
model will be forthcoming in the following paragraphs. For the interested reader, details
concerning MOVES can be found in the EPA documentation on the Internet:
http://www.epa.gov/otaq/models/moves/index.htm
Input data developed and discussed in this document are based on the calendar years
2015 and 2016. Equations or formulas showing how the datasets were developed in
mathematical layout will be presented. Microsoft Excel files are included to exhibit sample
calculations or data manipulation in spreadsheet format using data for Knox County, Tennessee.
These Excel files are supplied in a single compressed (zip) file for each year. The input data that
are intended for running MOVES will also be supplied in separate compressed (zip) files
containing a total of 95 Excel files (one for each county in Tennessee). These files are named by
the county and year in which the data are intended. The names of zip files will be listed in the
Summary section of this document. The input data will be provided in the appropriate format for
use with the CDM importer tool in MOVES. The following methodology will describe the

7
preparation of these input datasets, as well as any quality assurance measures that were taken to
ensure the integrity of the data.
It should be noted that MOVES input data from this project will not be provided for the
calendar year 2017 which of note corresponds to a reporting year for the EPA National Emission
Inventory (NEI). Air emissions based on data provided by state and local air agencies from
sources located in their jurisdiction are used to create the NEI which is released publically via the
Internet every three years by EPA. In part, the MOVES model is used to compute on-road
source emissions based on model inputs provide by state and local air agencies. Typically, a
higher level of quality assurance measures should be taken to ensure the integrity of the input
data for NEI. In closing this section, the input data provided by this project are not intended for
developing mobile source emission inventories using MOVES for the EPA 2017 NEI.
Source Type Population
The source type population is the actual number of vehicles of each source type in the
modeling domain. Vehicles in MOVES are categorized into 13 source types: Motorcycle,
Passenger Car, Passenger Truck, Light Commercial Truck, Intercity Bus, Transit Bus, School
Bus, Refuse Truck, Single Unit Short-haul Truck, Single Unit Long-haul Truck, Motor Home,
Combination Short-haul Truck, and Combination Long-haul Truck. Vehicles are called source
types in MOVES because the model relies more heavily on the activity or use of the vehicles to
simulate emissions rather than on engine and/or body style configurations.
Two methods were used to develop the source type populations: the vehicle registration
data method and the national default-local data method. The former utilizes statewide motor
vehicle registration data or other reliable databases at the state or federal level. This is the EPA
preferred procedure when actual road count data are not available. The latter method utilizes the
ratio of default population and vehicle miles traveled (VMT) data generated by MOVES, as well
as local VMT and vehicle classification data via a calculation procedure. This method is also
acceptable by EPA but is used only when motor vehicle registration data are not available and/or
inappropriate to use for the source types.

8
Vehicle Registration Data Method
Motor vehicle registration data were provided by the Tennessee Department of Revenue
(TDOR) in the format of text files. These files contained the vehicles currently registered or
scheduled for a license renewal in the state at the time the database query was executed. For the
calendar years 2015 and 2016, data were extracted July 2015 and January 2016, respectively. In
the best case scenario, a snapshot of registration data is required mid-year, but this was not
possible for 2016. Therefore, a growth factor embedded in the MOVES model was used to
project data from January 2016 to mid-year 2016.
Each record or row of data in the text file indicated a single motor vehicle. The start- and
end-length of each record contains 49 integers and/or spaces; these represented coded or
abbreviated information that could be used to identify or clarify source types. Information
contained in the record are vehicle identification number (VIN), year, make, model, use, type,
body style, fuel, county of registration, and license plate class. Descriptions of the coding were
provided by TDOR for interpretation of the information contained in the text file. Several of the
codes, such as use, type, body style, and license class are specific to the state. These codes can
change over time as manufacturing adapts to meet the varying consumer demand for different
body or frame styles and as road tax legislation may alter classifications which are based on
gross vehicle weight and other factors.
Several group discussions were held with TDOR personnel to explain the source type
population requirements for MOVES before the motor vehicle data were extracted to the text
file. States typically report to the Federal Highway Administration (FHWA) on the operating
characteristic of their road systems using Highway Performance Monitoring System (HPMS) of
classifications, so personnel were somewhat familiar applying these terms. Therefore, the text
file contained preliminary MOVES source type and HPMS designations for each record.
Presently, 13 vehicle classes are contained in HPMS, but these should not be confused
with the 13 source types used in MOVES. The HPMS classes rely more heavily on frame or
body style, number of wheels and/or axles, and gross vehicle weight. The HPMS classes can be
reordered into six general categories: Motorcycle, Passenger Car, Other 2-axle 4-tire Vehicles,
Buses, Single Unit Trucks, and Combination Trucks. More details of the HPMS format can be

9
found in the FHWA documentation on the Internet:
https://www.fhwa.dot.gov/policyinformation/hpms.cfm
Starting with the 2014 release of MOVES, the EPA decided that only five subsets of
HPMS will be used because of trouble distinguishing between all types of light-duty vehicles
using traffic or road tube counters. For this situation, the two HPMS classes (i.e., Passenger Car
and Other 2-axle 4-tire Vehicles) were combined into a single class called Light Duty Vehicles.
This HPMS (defined by EPA) will include both short and long wheelbases. More will be said
later in the paper about this effect on developing the input data for MOVES.
The total number of vehicles in the initial data extractions for July 2015 and January
2016 were 5,536,391 and 5,399,414, respectively. The source types associated with MOVES
and the HPMS vehicle categories are listed in Table 2 and Table 3. Heavy-duty freight trucks,
utility trailers, and special government vehicles were not included in the extraction. As may be
the case, county registered heavy duty vehicles used for hauling freight over short or long
distances are not necessarily representative of that portion of the fleet because these vehicles may
typically transport freight across state and county borders.
The information shown in the tables reveal a large disparity between the number of
Passenger Cars (HPMS 20 or MOVES 21) and Other 2 axle-4 tire Vehicles (HPMS 30) or
Passenger Trucks with the addition of Light Commercial Truck (MOVES 32 & 33). That is
approximately 76% versus 16%, respectively. Therefore, it is believed that the number of
vehicles initially assigned to Passenger Car in the data extractions for 2015 and 2016 were
overstated by TDOR because the percentages of Passenger Car and Passenger Truck for states
less urbanized like Tennessee are typically between 40% and 50% each. For example, FHWA
highway statistics compiled for Tennessee during 2015 and 2016 were about 42% automobiles
and 52% pickups, vans and sport utility vehicles. Several factors may account for the
disagreement in the data provided by TDOR and data reported by FHWA. However, a
discussion of these factors is not the subject of this document. On the other hand, further action
was needed to transform the state’s motor vehicle registration data into results that were more in
line with the reported data from FHWA.

10
Using a VIN decoder on the Internet and other abbreviated or coded information
contained in the text file, such as make, model, type, use, class, body, etc., the vehicles were
rearranged into source types by a repetitive trial-and-error procedure using database query
software (i.e., Microsoft Access
). Additionally, vehicles registered as antique or show cars and
vehicles older than 1961 for 2015 or older than 1962 for 2016 were removed from the database
since it is assumed that these vehicles are rarely driven on the public roads. From this activity,
Passenger Car (MOVES 21), Passenger Truck (MOVES 32), and Light Commercial Truck
(MOVES 33) are approximately 46%, 40%, and 7%, respectively.
It was more difficult to distinguish between buses (Intercity, Transit, and School Buses),
Refuse Truck, and Motor Home with a high level of certainty because these vehicles had similar
engine, body, and weight configurations, so other methods were used to develop population data
for these source types. Also, computer coding that was applied to these vehicle types by the
County Clerks in Tennessee were highly inconsistent within the motor vehicle registration
database. Even though codes are provided in the registration database for these vehicle types. It
should be noted that this problem has been brought to the attention of TDOR, but it has not been
resolved. In the following paragraphs, the approach is discussed for the two bus source types
where other reliable data were available. These are Transit Bus and School Bus.
Transit Bus
Transit buses are owned by a public transit organization for the primary purpose of
transporting passengers on fixed routes and schedules with a capacity of at least 15 or more
persons as per EPA. To meet the needs of the public transportation system, the Federal Transit
Administration (FTA) maintains a National Transit Database (NTD). Recipients or beneficiaries
of grants for public transportation from the FTA are required to submit operating and financial
data to the NTD. Among other information, fleet size, vehicle model and year, fuel type, seating
and standing capacity, and average mileage per vehicle on a county basis are contained in the
database. Data are available at https://www.transit.dot.gov/ntd. Statistics from the NTD were
used to determine source type population data for Transit Bus. Thus, it was estimated that a total
of 731 transit buses, as classified by EPA, were operating in the state during 2015, and 1,092
during 2016. These buses were operated in only 16 counties of the state.

11
School Bus
Annual Statistical Reports of the Tennessee Department of Education (TDOE) are
published annually that contain data for school buses operating in the state at the county level for
the scholastic year. Data are available at https://www.tn.gov/education/data/department-
reports.html. From this source, it was estimated that a total of 8,858 school buses operated
throughout the state during 2015, and 9006 buses operated during 2016.
National Default-Local Data Method
Local vehicle data were not available for the Single Unit Long-haul Truck and the
Combination Short- and Long-haul Trucks. Population data for the Intercity Bus, Refuse Truck,
and Motor Home also were not adequately resolved using motor vehicle registration data. In
these circumstances, the EPA recommends using other auxiliary methods. For this situation,
population data were derived by a ratio computation method using national default data in
conjunction with local VMT and statewide vehicle classification summaries.
The ratio factor is the population data for the source type (numerator) by the distance
traveled for the road type (denominator). Activity data are obtained by running MOVES at the
National Scale for the calendar year of interest (2015 or 2016) on a per county basis. The
multiplying factor (numerator) is the local or county VMT data for the vehicle or source type.
Local data are obtained from the Tennessee Department of Transportation (TDOT) in the form of
the annual average daily vehicle miles traveled (DVMT) and the statewide vehicle classification
summaries. Samples of these data are shown in Table 4, Table 5, Table 6, and Table 7. Two
comments concerning the data are necessary: (1) the exact DVMT for 2016 was not available
from TDOT, so amended data between 2014 and 2016 were used; (2) the road classification for
Rural Freeway is not used in Tennessee, so the DVMT is zero for all counties, however, DVMT
data for 2016 are shown for several counties. They are Fayette, Maury, Shelby, and Sumner.
Since the statewide vehicle classification summary did not contain data for the Rural Freeway,
the DVMT were added to the values for Rural Interstate.
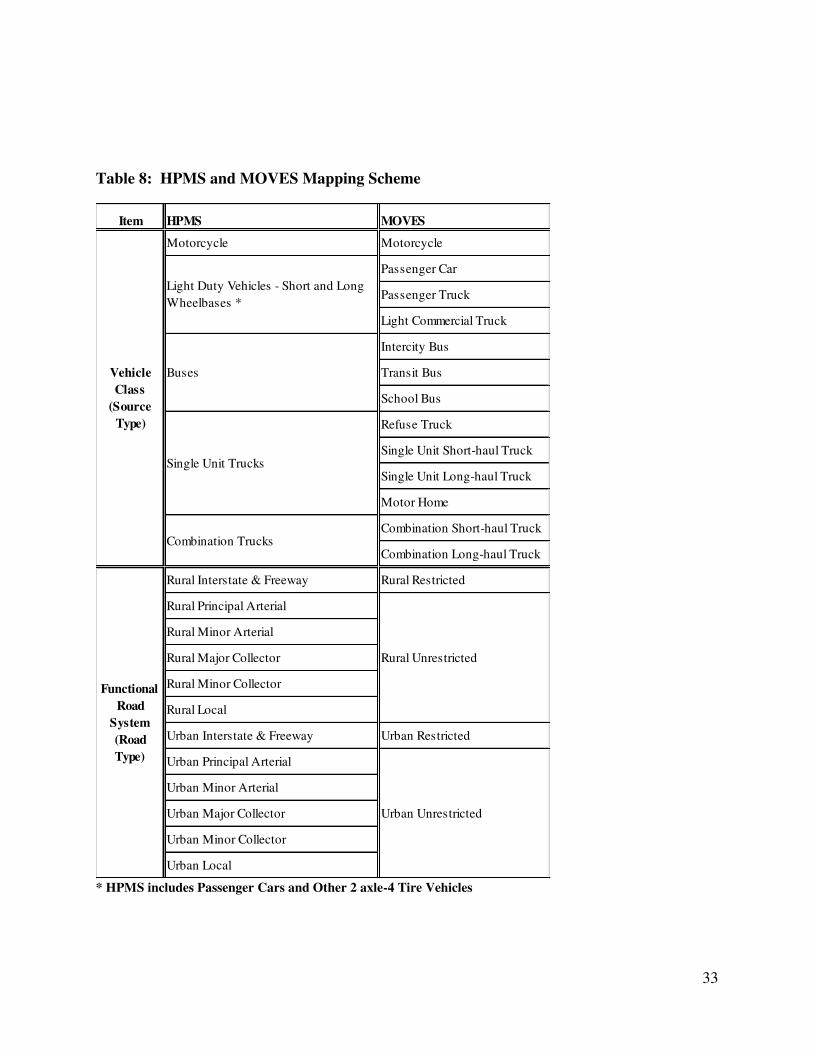
The vehicle and road data for the state are categorized by HPMS, and as mentioned
earlier, MOVES does not directly use the HPMS based classifications. Thus, additional
preprocessing is required to distribute or map HPMS to MOVES. In HPMS, six (general)

12
functional road classifications exist: Interstate & Freeways, Principal Arterial, Minor Arterial,
Major Collector, Minor Collector, and Local, which are further subdivided into Urban and Rural.
In MOVES, only four primary road types are used: Rural Restricted, Rural Unrestricted, Urban
Restricted, and Urban Unrestricted. A fifth road type is Off-network, but it accounts for
locations where the predominant vehicle activity is essentially not conducted on the roadway,
such as starting, parking, and idling. A summary of the mapping scheme between the HPMS and
MOVES classifications are shown in Table 8 for both source and road types.
To smooth out yearly fluctuations in the vehicle classification summaries, a five-year
average (i.e., years 2011 through 2015 for calendar year 2015 and years 2012 through 2016 for
calendar year 2016) were used. The raw data from these previous years are not shown in this
document, however a summary of the data is built-into the Excel files that will demonstrate the
sample calculations in spreadsheet format. The name of this spreadsheet is called “5-Year
Average”. The final averages were adjusted proportionally across the EPA five HPMS vehicle
types, so that the sum of the averaged percentages would equal 100%. In several instances,
TDOT did not include a road category in the dataset, so data from the next higher category was
used if this data were applicable. For example, Rural Minor Collector data were used for Rural
Local data because vehicle traffic on a Rural Minor Collector ultimately passes through a Rural
Local road.
The general formula that was used to calculate population source type data is Equation 1.
It has three parts represented by the symbols A, B, and C. (Note: all equations mentioned are
included in the Appendix B of this document.) The “A” expression evaluates local DVMT for
the HPMS vehicle type. The MOVES default population to VMT ratio is the “B” expression.
The “C” expression (also a ratio) maps the HPMS vehicle type to the MOVES source type. The
C value will equal unity (or 1.0) when the HPMS vehicle type is equivalent to the MOVES
source type. Currently this is only the case for Motorcycle, otherwise it is equal to a fraction that
sums to unity within MOVES source types that were mapped from the HPMS vehicle type.
Sample calculations for the Combination Long-haul Truck using the equations for Knox County
data are include in Appendix B for calendar years 2015 and 2016.
The supplemental Microsoft Excel file that will show all calculations or data
manipulations in spreadsheet format for this section using Knox County data is named Sample

13
Calculations for SourceType Populations - Knox yyyy.xlsx. The symbols “yyyy” will represent
the calendar year. This file contains two spreadsheets. The first spreadsheet is called
“SourceType Population” which contains several tables that are used to calculate source type
population data using the raw data received from TDOT. The second spreadsheet is called “5-
Year Average”. This spreadsheet demonstrates how the five-year averages were calculated also
using raw data received from TDOT. The sample calculations for Knox County data (shown in
Appendix B for Combination Long-haul Truck, mentioned above) will match the sample
calculations shown in the Excel spreadsheets for Knox County. However due to rounding, the
arithmetic calculations shown in Appendix B may appear to be incorrect by very small amounts
when compare to the spreadsheet calculations.
Final Statewide Dataset
A summary of the final population data that will be used by source types are shown in
Table 9 (2015) and Table 10 (2016). Motorcycle, Passenger Car, Passenger Truck, Light
Commercial Truck, Transit Bus, School Bus, and Single Unit Short-haul Truck were derived
from motor vehicle registration data and other useable datasets. Intercity Bus, Refuse Truck,
Single Unit Long-haul Truck, Motor Home, and Combination Short- and Long-haul Trucks were
determined using the ratio-calculation method. The data were distributed across counties as per
county designation in the respective datasets. The final input data for MOVES are included in
the compressed (zip) on a per county basis.
Age Distribution
Age distribution is the age fractions of fleet by age and source type. Vehicle ages in
MOVES cover a range of 31 years with vehicles 30 years and older grouped together. States are
encouraged by EPA to develop age distributions with local data. In the present study, local
population data were available for only seven of the 13 source types using the motor vehicle
registration data and/or other valid data sources. Since the motor vehicle registration data
received from TDOT was just a snapshot of registrations for the end of the year, population data
were adjusted. Age distribution data for school buses were not available for 2015 and 2014, so
2014 data were used. In other situations, where local population were not available to determine
the age distributions, the default age distributions for the year in question (i.e., 2015 or 2016)

14
were used instead. These distributions were obtained from the EPA Default Age Distributions
for MOVES2014 file. This file is available via the Internet MOVES site. Default age
distributions were used for Intercity Bus, Refuse Truck, Single Unit Long-haul Truck, Motor
Home, and Combination Short- and Long-haul Trucks. The final input data for MOVES are
included in the compressed (zip) on a per county basis.
Road Type Distribution
Road type distribution is the fraction of source type VMT on each of the four road types.
Once again, data in this format are not available for Tennessee, so a calculation method was used
to convert HPMS road data into MOVES data. The five-year average vehicle summary
classifications by road type for 2011-2015 and 2012-2016, as well as the 2015 and 2016 DVMT
were used to develop the road type distributions. Note that local data are classified by HPMS, so
the mapping scheme shown in Table 8 had to be applied.
Equation 2 is the overall formula that was used to calculate the VMT road type
distributions. It has two parts which are represented by the symbols A and B. The “A”
expression evaluates local DVMT for the MOVES road types per HPMS vehicle type. The “B”
expression is the MOVES road type ratio that distributes the road type fractions across source
types. Sample calculations for the Combination Long-haul Truck using the equations for Knox
County data are include in Appendix B. Off-network was assigned a value of zero. It should be
noted that the road type VMT fractions are the same for those source types that were mapped
from the HPMS vehicle type. For example, Passenger Car, Passenger Truck, and Light
Commercial Truck in MOVES were mapped together from Passenger Car, and Other 2-axle 4-
tire Vehicles in HPMS, which are now under the EPA term Light Duty Vehicles - Short and
Long Wheelbase, and thus, VMT fractions will be the same for these three source types.
The supplemental Microsoft Excel file showing calculations in spreadsheet format for
this section using Knox County data is named Sample Calculations for RoadType VMT
Distributions - Knox yyyy.xlsx. This file contains two spreadsheets. The first spreadsheet is
called “SourceType Pop”, which contains several tables that are used to calculate source type
VMT distribution data using the raw data received from TDOT. The second spreadsheet is
called “5-Year Average”. It is the same spreadsheet which was mentioned earlier in the

15
discussion of source type population. The sample calculations for Knox County data (shown in
Appendix B for Combination Long-haul Truck, mentioned above) will match the sample
calculations shown in the Excel spreadsheets for Knox County. The final input data for MOVES
are included in the compressed (zip) on a per county basis.
Vehicle Type VMT
Annual VMT by the HPMS vehicle classes are required by MOVES. Vehicle type VMT
is the total annual or daily VMT by HPMS vehicle type or source type. It includes month, day,
and hour VMT fractions. Month VMT fractions are the fraction of annual VMT (per source
type) occurring per month. Day VMT fractions are the fraction of monthly VMT (per source
type) occurring on one of the two day types (weekday or weekend-day). Hour VMT fractions
are the fraction of daily VMT (per source type) occurring per hour.
Once again, the vehicle type VMT data in this format are not available for Tennessee.
However, to help the user develop inputs for MOVES, the EPA created several Microsoft Excel
spreadsheet-based converter or calculator tools. A modified version of the file named
“aadvmtcalculator_hpms.xls” was used to develop the data for vehicle type VMT. First, some
general information will be given about the original EPA file which can be downloaded from the
MOVES Internet site listed earlier in the report.
The EPA tool uses annual average weekday (AAD) VMT at the HPMS level to calculate
type of day, monthly and yearly VMT in terms of HPMS and/or MOVES source types. The tool
contains default vehicle type VMT datasets for monthly, daily, and hourly VMT fractions and
provides default monthly and weekend-day adjustment factors if local inputs are not available.
However, the decision was made to modify the EPA converter tool after some discussion among
stakeholders. The primary concern was that the annual VMT (i.e., the MOVES input for the
HPMSBaseYearVMT as calculated via the tool) should equal 365 times the HPMS DVMT data
(or 366 if the year for the model run was a leap year).
It is assumed this tool was designed to handle average annual weekday VMT
(AAWDVMT) rather than average annual daily traffic (AADVMT). Raw HPMS data from
TDOT are reported in terms of AADVMT and by definition represents an average day regardless
of weekday or weekend. For their roads analysis, TDOT will normally apply a daily variation

16
factors to represent traffic for a particular weekday or weekend-day. Thus, the EPA tool was
modified to essentially multiply daily VMT by 365 (because 2014 was not a leap year) to create
the HPMSVTypeYear data. Also since TDOT determines seven-day adjustment factors by
months of the year, the weekday and weekend-day adjustment factors could be determined
separately. These factors were also added to the modified EPA calculator tool which originally
included only default monthly and weekend-day adjustment factors.
A copy of the TDOT five year seasonal variation factors that were used for 2015 and
2016 are shown in Table 11 and Table 12, respectively. Note that the final factors used in the
modified tool will be the inverse of the variation factors shown in the table. They are listed for
Rural Interstate, Rural Other, Urban, and Recreational. This required preprocessing of the road
categories into HPMS road types and averaging the results before the adjustment factors could be
applied to the modified EPA calculator tool. The averaging pattern is represented in the Excel
file showing the AADVMT sample calculations. It should be noted that the variation factors for
Recreational were not used because they are for road traffic in state parks. In effect, weighting
factors were created from the road categories that had been mapped to HPMS road types, and
then these weighting factors were applied to the averaged adjustment factors to create monthly,
weekday, and weekend-day factors for use in the modified calculator tool. The method of
averaging these seasonal variation factors are shown in the Microsoft Excel preprocessing data
file mentioned below. One final comment is in order: as of the writing of this document, the
EPA has a new converter tool that permits entering ADDVMT data as average day or as an
average weekday. This file is called “aadvmt-converter-tool-moves2014.xlsx”, but it was
decided to say with the original EPA tool because the modified version includes the monthly,
weekday and weekend-day adjustment factors.
Once more, it was necessary that local data be preprocessed before it could be used. The
general formula that was applied to prepare AADVMT data is Equation 3. Note that this
formula is identical to the “A” expression of Equation 1. (It was listed again only to maintain
continuity in the narrative.) Sample calculations for Combination Long-haul Truck using the
equation for Knox County data are include in Appendix B.
Two Microsoft Excel file will accompany this section. The names of these files are
Sample Calculations for AADVMT - Knox yyyy.xlsx and Sample Modified AADVMT

17
Calculator HPMS - Knox yyyy.xlsx. The former file includes calculations in spreadsheet format
for Knox County that were used to develop the AADVMT input data for the calculation tool.
This file contains three spreadsheets. The first spreadsheet is called “AADVMT” which contains
several tables that are used to calculate the AADVMT data. The second spreadsheet is called
“Adjustment Factors” which contains several tables that are used to calculate the monthly,
weekday, and weekend-day adjustment factors. Both of these spreadsheets use raw data received
from TDOT. The third spreadsheet is called “5-Year Average”. Calculation in this spreadsheet
demonstrates how the five-year averages were calculated, using the yearly vehicle summaries by
the functional road classes. It is the same spreadsheet that was mentioned earlier in the
discussion of source type population and road type distribution. The Sample calculations for
Knox County data (shown in Appendix B for Combination Long-haul Truck, mentioned above)
will match the sample calculations shown in the Excel spreadsheets for Knox County.
The latter file is the modified EPA calculator tool that was run using the Knox County
AADVMT data. This file contains eight spreadsheets. The main spreadsheet is called “Import
HPMS AADVMT and Factors”. This spreadsheet accepts the AADVMT and adjustment factor
data generated by the former file (previously discussed). Calculations are shown in the
spreadsheet called “Intermediate Calculations”. The final calculations become the input data for
MOVES which are shown in the three spreadsheets named: “HPMSVTypeYear”,
“monthVMTFraction-calculated”, and “dayVMTFraction-calculated”. For closure, the EPA
default VMT fractions were included in the file as the following spreadsheets:
“monthVMTFraction-default”, “dayVMTFraction-default”, and “hourVMTFraction-default”.
The modified tool will only generate the HPMS base year VMT data and the monthly and daily
VMT fractions required by MOVES. Therefore, the default hourly VMT fractions are used as
input data for MOVES because, at the moment, no hourly vehicle data are available at the local
level to aid in calculating hourly fractions. The other two default VMT fractions (month and
day) were included for comparison purposes. The final input data for MOVES are included in
the compressed (zip) on a per county basis.
Summary
Four compressed (or zip type) files are included with this document. Two files named
MOVES Input Data files for yyyy.zip contains the Excel input data files for the 95 counties of

18
Tennessee for 2015 and 2016. Each file contains eight spreadsheets; seven spreadsheets contain
the input data listed in Table 1, and the last spreadsheet contains general comments about the
input data. The prefix of the file name is the county name. For example, Knox Input File
2015.xlxs is the Excel file containing MOVES input data for Knox County for the calendar year
2015. The second zip or compressed file contains the Excel files that demonstrate all sample
calculations in spreadsheet format for Knox County. The name of this file is Sample
Calculations for Five Counties yyyy.zip; it contains a total of 4 files.
Conclusions
Two areas need improvement to enhance the quality of the input data: the motor vehicle
registration database and the statewide vehicle classification summaries. A trial-and-error
method was required to match vehicles with the MOVES and/or HPMS categories using motor
vehicle registration data to generate source type population data. This method is time consuming
and may produce inconsistent results because many of the vehicle categories listed in the
registration database are labeled incorrectly and often require a judgment call. For example,
vehicle type, use, and body codes exist for commercial bus, school bus, motor home, pick-up
truck, and garbage truck in the database, but in many instances, these abbreviations do not match
the information derived by querying the VIN. Additional evidence for this problem is shown by
the initial data extraction which disclosed almost 80% passenger cars. This is not an attempt to
fault TDOR because the purpose of vehicle registration is to collect title information, such as for
the establishment of legal ownership of property and to collect road-use taxes, which in turn help
finance the construction and/or maintenance of the public roadways. This is to say, the intent of
motor vehicle registration data is not to serve as input for the MOVES model.
The final concern involves using statewide data to predict local (county) conditions. The
EPA requires that states develop local data for MOVES. Although the quality of data received
from TDOT is very high, much of the data have been abridged to generate statewide summaries.
In this project, the abridged data were used in various calculation methods to predict local
conditions that possibly do not represent the true local condition. The most reliable data are
from physical traffic volume counts, which are actual counts of vehicles along a particular road
way. However at present, it is very difficult to classify vehicles or distinguish between source
types using pneumatic and/or electronic counters. Also the method would be costly and time

19
consuming to perform on all roadways. Therefore, sampling is typically performed on certain
roadways on a seasonal basis, and the data are projected to similar locations (i.e., as statewide
summaries). Inputs to MOVES require highly detailed data. Concluding: state and local
agencies must use computer models for SIPs and transportation conformity analyses. Ultimately
the results from these computer programs will influence policy decisions that can have
significant economic effects on the community in which they are applied. Therefore, it is
paramount that the highest quality of data is used to run the models.

20
References
1. U.S. Environmental Protection Agency. Motor Vehicle Emission Simulator (MOVES):
User Guide for MOVES2014a. Assessment and Standards Division, Office of Transportation
and Air Quality; EPA-420-B-15-095; November 2015.
2. U.S. Environmental Protection Agency. MOVES2014 and MOVES2014a Technical
Guidance: Using MOVES to Prepare Emission Inventories in State Implementation Plans and
Transportation Conformity. Assessment and Standards Division, Office of Transportation and
Air Quality; EPA-420-R-15-093; November 2015.
3. U.S. Environmental Protection Agency. Population and Activity of On-road Vehicles in
MOVES2014a. Assessment and Standards Division, Office of Transportation and Air Quality;
EPA-420-R-16-003; January 2016.
4. U.S. Environmental Protection Agency. MOVES2014a User Interface Reference
Manual. Assessment and Standards Division, Office of Transportation and Air Quality; EPA-
420-B-16-085; November 2016.
5. U.S. Department of Transportation. Traffic Monitoring Guide. Federal Highway
Administration (FHWA); Office of Highway Policy Information; Updated October 2016.
6. U.S. Department of Transportation. Highway Performance Monitoring System – Field
Manual. Federal Highway Administration (FHWA); Office of Highway Policy Information;
Office of Management & Budget (OMB) Control No. 2125-0028; December 2016.

21
Appendix

22
Appendix A - Tables mentioned in body of document

23
Table 1: Input Data Files
Table 2: Number of Vehicles in the TDOR July 2015 Initial Data Extraction
Note: vehicle data from HPMS ID 20 & 30 will be combined, assigned ID 25, and called Light Duty Vehicles -
Short and Long Wheelbase for evaluation in MOVES; na = not available
CDM (tab) Name Data Source (file) Name
Source Type Population sourceTypeYear
Age Distribution sourceTypeAgeDistribution
Road Type Distribution roadTypeDistribution
HPMSVTypeYear
monthVMTFraction
dayVMTFraction
hourVMTFraction
Vehicle Type VMT
HPMS ID HPMS Vehicle Type TDOR Extraction MOVES ID MOVES Source Type TDOR Extraction
10 Motorcycle 158,643 11 Motorcycle 158,643
20 Passenger Car 4,215,201 21 Passenger Car 4,215,201
31 Passenger Truck 872,247
32 Light Commercial Truck 204
41 Intercity Bus 772
42 Transit Bus 1,459
43 School Bus 1,030
51 Refuse Truck 326
52 Single Unit Short-haul Truck 256,030
53 Single Unit Long-haul Truck na
54 Motor Home 7,150
61 Combination Short-haul Truck na
62 Combination Long-haul Truck na
5,513,062 5,513,062Total Total
Combination Trucks
872,451
263,506
na
30
40 3,261
Other 2 axle-4 tire Vehicles
Buses
60
50 Single Unit Trucks

24
Table 3: Number of Vehicles in the TDOR January 2016 Initial Data Extraction
Note: vehicle data from HPMS ID 20 & 30 will be combined, assigned ID 25, and called Light Duty Vehicles -
Short and Long Wheelbase for evaluation in MOVES; na = not available
HPMS ID HPMS Vehicle Type TDOR Extraction MOVES ID MOVES Source Type TDOR Extraction
10 Motorcycle 158,164 11 Motorcycle 158,164
20 Passenger Car 4,089,601 21 Passenger Car 4,089,601
31 Passenger Truck 885,721
32 Light Commercial Truck 187
41 Intercity Bus 787
42 Transit Bus 1,470
43 School Bus 1,362
51 Refuse Truck 313
52 Single Unit Short-haul Truck 254,456
53 Single Unit Long-haul Truck na
54 Motor Home 7,353
61 Combination Short-haul Truck na
62 Combination Long-haul Truck na
5,399,414 5,399,414
30 Other 2 axle-4 tire Vehicles 885,908
262,122
40 Buses 3,619
50 Single Unit Trucks
60 Combination Trucks na
Total Total

25
Table 4: HPMS 2015 DVMT for Rural and Urban Roads

26
(continued)

27
(continued)

28
Table 5: Class Count 2015 Summary for the Rural and Urban Road System

29
Table 6: HPMS 2016 DVMT for Rural and Urban Roads

30
(continued)

31
(continued)

32
Table 7: Class Count 2016 Summary for the Rural and Urban Road System
33
Table 8: HPMS and MOVES Mapping Scheme
* HPMS includes Passenger Cars and Other 2 axle-4 Tire Vehicles
Item HPMS MOVES
Motorcycle Motorcycle
Passenger Car
Passenger Truck
Light Commercial Truck
Intercity Bus
Transit Bus
School Bus
Refuse Truck
Single Unit Short-haul Truck
Single Unit Long-haul Truck
Motor Home
Combination Short-haul Truck
Combination Long-haul Truck
Rural Interstate & Freeway Rural Restricted
Rural Principal Arterial
Rural Minor Arterial
Rural Major Collector
Rural Minor Collector
Rural Local
Urban Interstate & Freeway Urban Restricted
Urban Principal Arterial
Urban Minor Arterial
Urban Major Collector
Urban Minor Collector
Urban Local
BusesVehicle
Class
(Source
Type)
Rural Unrestricted
Light Duty Vehicles - Short and Long
Wheelbases *
Functional
Road
System
(Road
Type)
Urban Unrestricted
Single Unit Trucks
Combination Trucks

34
Table 9: Final Statewide Source Type Population Data for 2015
MOVES ID MOVES sourceTypeName TDOR Extraction
11 Motorcycle 161,235
21 Passenger Car 2,548,305
31 Passenger Truck 2,216,379
32 Light Commercial Truck 344,256
41 Intercity Bus 79
42 Transit Bus 731
43 School Bus 8,858
51 Refuse Truck 2,695
52 Single Unit Short-haul Truck 114,115
53 Single Unit Long-haul Truck 3,758
54 Motor Home 22,414
61 Combination Short-haul Truck 44,615
62 Combination Long-haul Truck 49,357
5,516,797Total

35
Table 10: Final Statewide Source Type Population Data for 2016
MOVES ID MOVES sourceTypeName TDOR Extraction
11 Motorcycle 160,221
21 Passenger Car 2,520,928
31 Passenger Truck 2,225,466
32 Light Commercial Truck 377,927
41 Intercity Bus 94
42 Transit Bus 1,092
43 School Bus 9,006
51 Refuse Truck 2,777
52 Single Unit Short-haul Truck 117,623
53 Single Unit Long-haul Truck 3,867
54 Motor Home 23,021
61 Combination Short-haul Truck 44,756
62 Combination Long-haul Truck 49,880
5,536,658Total

36
Table 11: 5-Year Average Monthly Variation Factors, by Day of Week for 2015

37
Table 12: 5-Year Average Monthly Variation Factors, by Day of Week for 2016

38
Appendix B - Equations and sample calculations mentioned in body of document

39
Equation 1: General formula used to convert default population/VMT data, local DVMT,
and local vehicle count summaries into MOVES source type population data
𝑃 𝑖 𝑦 = ∙ ∙ where:
= ∑ 𝑉 ℎ𝑖 𝐹 𝑖 ∙ 𝑉 𝑇 𝐻
= 𝑃 𝑖 𝑦 𝑉 𝑇 𝑦 𝐸
= 𝑉 𝑇 𝑦 𝐸∑( 𝑉 𝑇 𝑦 )𝐻 𝐸
Sample Calculations Source Type Population:
Knox County – Combination Long-haul Truck - 2015 = [ . ∙ , + . ∙ , , + . ∙ + . ∙ ,+ . ∙ + . ∙ , , + . ∙ ,+ . ∙ , , + . ∙ , + . ∙ ,+ . ∙ , + . ∙ , + . ∙ , + . ∙ , , ] ≅ , , 𝑖 𝑦⁄
= ( , 𝑖 𝑖 − ℎ 𝑇, , 𝑖 𝑦⁄ )≅ . ∙ −5 𝑖 𝑖 − ℎ 𝑇𝑖 𝑦⁄

40
= , , 𝑖 𝑦⁄, , + , , 𝑖 𝑦⁄ ≅ .
𝑃 𝑖 𝐶 𝑖 𝑖 −ℎ = , , 𝑖 𝑦 ∙ . ∙ −5 ℎ 𝑇𝑖 𝑦⁄ ∙ . ∙ ( 𝑦𝑦 )
≅ , 𝑖 𝑖 − ℎ 𝑇
Knox County - Combination Long-haul Truck - 2016 = [ . ∙ , + . ∙ , , + . ∙ + . ∙ ,+ . ∙ + . ∙ , , + . ∙ ,+ . ∙ , , + . ∙ , + . ∙ ,+ . ∙ , + . ∙ , + . ∙ , + . ∙ , , ] ≅ , , 𝑖 𝑦⁄
= ( , 𝑖 𝑖 − ℎ 𝑇, , 𝑖 𝑦⁄ )≅ . ∙ −5 𝑖 𝑖 − ℎ 𝑇𝑖 𝑦⁄
= , , 𝑖 𝑦⁄, , + , , 𝑖 𝑦⁄ ≅ .

41
𝑃 𝑖 𝐶 𝑖 𝑖 −ℎ = , , 𝑖 𝑦 ∙ . ∙ −5 ℎ 𝑇𝑖 𝑦⁄ ∙ . ∙ ( 𝑦𝑦 )≅ , 𝑖 𝑖 − ℎ 𝑇
Equation 2: General formula used to convert HPMS local DVMT and vehicle classification
summaries into MOVES road type VMT distributions by source types 𝑉 𝑇 𝐹 𝑖 𝐸 𝑦 𝑦 = ( ⁄ ) 𝑦 𝑦
= ∑ 𝐹 𝑖 ℎ𝑖 𝑦 ∙ 𝑉 𝑇 𝐻 𝐸
= ∑ 𝑦 𝐻 𝐸
Sample Calculations VMT Distribution:
Knox County – Combination Long-haul Truck - 2015
𝑖 = ( . ∙ , + . ∙ ) = , 𝑖 𝑦⁄ 𝑖 = ( . ∙ + . ∙ , + . ∙ ,+ . ∙ , + . ∙ , ) = , 𝑖 𝑦⁄
𝑖 = ( . ∙ , , + . ∙ , ) = , 𝑖 𝑦⁄ 𝑖= ( . ∙ , , + . ∙ , , + . ∙ ,+ . ∙ , + . ∙ , , ) = , 𝑖 𝑦⁄
= , + , + , + , = , , 𝑖 𝑦⁄

42
𝑉 𝑇 𝐹 𝑖 𝑖 = , 𝑖 𝑦⁄ , , 𝑖 𝑦⁄⁄ = .
𝑉 𝑇 𝐹 𝑖 𝑖 = , 𝑖 𝑦⁄ , , 𝑖 𝑦⁄⁄ = .
𝑉 𝑇 𝐹 𝑖 𝑖 = , 𝑖 𝑦⁄ , , 𝑖 𝑦⁄⁄ = .
𝑉 𝑇 𝐹 𝑖 𝑖 = , 𝑖 𝑦⁄ , , 𝑖 𝑦⁄⁄= .
Knox County - Combination Long-haul truck - 2016
𝑖 = ( . ∙ , + . ∙ ) = , 𝑖 𝑦⁄ 𝑖 = ( . ∙ + . ∙ , + . ∙ ,+ . ∙ , + . ∙ , ) = , 𝑖 𝑦⁄
𝑖 = ( . ∙ , , + . ∙ , ) = , 𝑖 𝑦⁄ 𝑖= ( . ∙ , , + . ∙ , , + . ∙ ,+ . ∙ , + . ∙ , , ) = , 𝑖 𝑦⁄
= , + , + , + , = , , 𝑖 𝑦⁄

43
𝑉 𝑇 𝐹 𝑖 𝑖 = , 𝑖 𝑦⁄ , , 𝑖 𝑦⁄⁄ = .
𝑉 𝑇 𝐹 𝑖 𝑖 = , 𝑖 𝑦⁄ , , 𝑖 𝑦⁄⁄ = .
𝑉 𝑇 𝐹 𝑖 𝑖 = , 𝑖 𝑦⁄ , , 𝑖 𝑦⁄⁄ = .
𝑉 𝑇 𝐹 𝑖 𝑖 = , 𝑖 𝑦⁄ , , 𝑖 𝑦⁄⁄= .
Equation 3: General formula used to calculate local AADVMT for HPMS vehicle types
𝑉 𝑇 = ∑ 𝑉 ℎ𝑖 𝐹 𝑖 ∙ 𝑉 𝑇 𝐻
Sample Calculations AAVMT Distribution:
Knox County – Combination long-haul Truck - 2015 𝑉 𝑇 = [ . ∙ , + . ∙ , , + . ∙+ . ∙ , + . ∙ + . ∙ , ,+ . ∙ , + . ∙ , , + . ∙ ,+ . ∙ , + . ∙ , + . ∙ ,+ . ∙ , + . ∙ , , ] ≅ , , 𝑖 𝑦⁄

44
Knox County – Combination Long-haul Truck - 2016 𝑉 𝑇 = [ . ∙ , + . ∙ , , + . ∙+ . ∙ , + . ∙ + . ∙ , ,+ . ∙ , + . ∙ , , + . ∙ ,+ . ∙ , + . ∙ , + . ∙ ,+ . ∙ , + . ∙ , , ] ≅ , , 𝑖 𝑦⁄