methodological issues in malingering …/67531/metadc33153/m2/1/high... · malingering is defined...
TRANSCRIPT
APPROVED: Richard Rogers, Major Professor Kenneth W. Sewell, Committee Member Charles A. Guarnaccia, Committee
Member Jennifer L. Callahan, Director of Clinical
Training Vicki L. Campbell, Chair of the Department
of Psychology James D. Meernik, Acting Dean of the
Robert B. Toulouse School of Graduate Studies
METHODOLOGICAL ISSUES IN MALINGERING RESEARCH:
THE USE OF SIMULATION DESIGNS
Nathan D. Gillard, B.S.
Thesis Prepared for the Degree of
MASTER OF SCIENCE
UNIVERSITY OF NORTH TEXAS
December 2010

Gillard, Nathan D. Methodological issues in malingering research: The use of
simulation designs. Master of Science (Psychology), December 2010, 168 pp., 16
tables, references, 170 titles.
The accurate determination of malingering relies on the use of validated and
clinically relevant assessment measures. Simulation design is the most often-used
research design to accomplish this. However, its external validity is sometimes
questioned. The goal of the thesis was to systematically evaluate these major elements:
situation, incentives, and coaching. The situation in simulation studies can vary from
relevant (academic failure in a college population) to irrelevant (capital murder) for the
samples being studied. Incentives refer to the external motivation given to improve
simulators’ performance and can be positive (extra credit and monetary reward) or
negative (extra time and effort). Finally, coaching refers to whether the participant
receives any information on detection strategies that are designed to identify feigners.
Using a large undergraduate sample in a factorial design, results indicate that a
scenario familiar to the participants generally improved the believability of their
responses. Coaching also improved the ability to feign convincingly, while incentive type
was not associated with any change in scores. The implications of these findings for
future research designs and the connection to practice are discussed.

ii
Copyright 2010
by
Nathan D. Gillard
TABLE OF CONTENTS
Page
LIST OF TABLES………………………………………………………………………………vii
Chapter
1. INTRODUCTION…………………………………………………………………....1
Malingering and Other Response Styles
Explanatory Models
Prevalence of Malingering
Detection Strategies
Common Detection Strategies
Detection of Feigning on Multiscale Inventories
MMPI-2
PAI
Specialized Measures of Malingering
M-FAST
SIMS
SIRS
Malingering Research
Known-Groups Comparisons
Differential Prevalence Design
Bootstrapping Comparisons
Simulation Design
Specificity
iii

The Role of Motivation
Using Context to Motivate
Coaching
Incentives
Current Study
Research Questions and Hypotheses
2. METHODS………………………………………………………………………….50
Design
Participants
Materials
Instructional Sets
Scenarios
Incentives
Coaching
Measures
Symptom Checklist-90-Revised
Structured Inventory of Malingered Symptoms
Procedures
3. RESULTS…………………………………………………………………………..58
General Manipulation Check
Descriptive Data
Specific Manipulation Checks
Research Questions
iv
Research Question 1
Research Question 2
Research Question 3
Research Question 4
Research Question 5
Supplementary Research Questions
Supplementary Question 1
Supplementary Question 2
Supplementary Question 3
4. DISCUSSION………………………………………………………………………82
Research Design and Malingering
Comparison of Designs
Ecological Validity of the Simulation Design
Role of Scenario
Previous Research on the Effect of Scenario
Role of Coaching
Role of Incentives
Putting Instructional Change in Perspective
Simulators’ Choice of Feigned Disorders
Limitations
Future Directions
Conclusions
v
vi
APPENDICES…...……………………………………………………………………114
REFERENCES..……………………...………………………………………………147
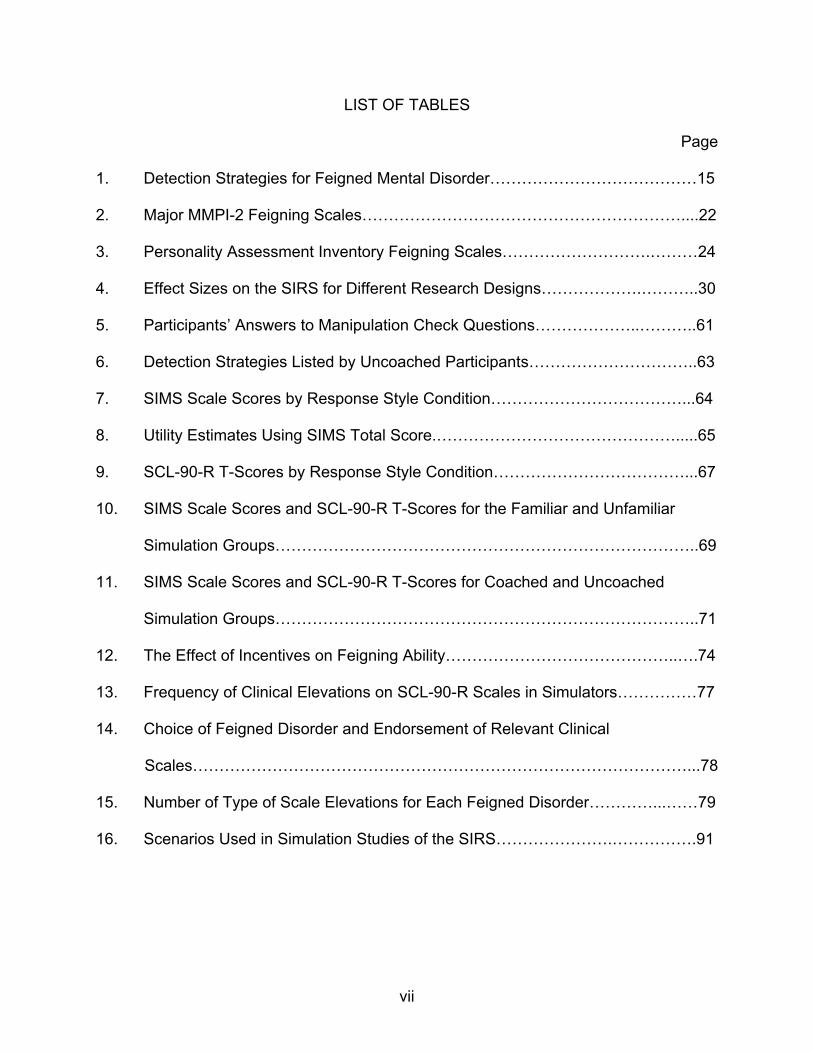
LIST OF TABLES
Page
1. Detection Strategies for Feigned Mental Disorder…………………………………15
2. Major MMPI-2 Feigning Scales……………………………………………………....22
3. Personality Assessment Inventory Feigning Scales……………………….………24
4. Effect Sizes on the SIRS for Different Research Designs……………….………..30
5. Participants’ Answers to Manipulation Check Questions………………..………..61
6. Detection Strategies Listed by Uncoached Participants…………………………..63
7. SIMS Scale Scores by Response Style Condition………………………………...64
8. Utility Estimates Using SIMS Total Score.……………………………………….....65
9. SCL-90-R T-Scores by Response Style Condition………………………………...67
10. SIMS Scale Scores and SCL-90-R T-Scores for the Familiar and Unfamiliar
Simulation Groups……………………………………………………………………..69
11. SIMS Scale Scores and SCL-90-R T-Scores for Coached and Uncoached
Simulation Groups……………………………………………………………………..71
12. The Effect of Incentives on Feigning Ability……………………………………..….74
13. Frequency of Clinical Elevations on SCL-90-R Scales in Simulators……………77
14. Choice of Feigned Disorder and Endorsement of Relevant Clinical
Scales…………………………………………………………………………………...78
15. Number of Type of Scale Elevations for Each Feigned Disorder…………...……79
16. Scenarios Used in Simulation Studies of the SIRS………………….…………….91
vii

CHAPTER 1
INTRODUCTION
The accurate detection of malingered mental disorders is highly consequential in
forensic and clinical settings. On the one hand, persons who feign symptoms can
sometimes avoid criminal punishment in the case of insanity acquittal or have
misdemeanor charges dropped. Malingerers may also obtain disability payments or
mental health services that are in short supply and urgently needed by those with real
mental disorders. Both outcomes increase the burden on the legal system and society
in general (Kucharski et al., 2006). On the other hand, defendants with genuine mental
disorders can be wrongly classified as malingerers and deprived of needed mental
health treatment, lose an otherwise legitimate mental health defense, and be denied
due process in the legal system (Kucharski et al., 2006; Kropp & Rogers, 1993).
Wrongly classified patients in clinical settings may be denied the help they need and the
classification of “malingering” may brand them as deceivers, destroying their
opportunities to receive assistance in the future (Resnick & Knoll, 2008). Therefore, the
accurate assessment of malingering is an essential part of all forensic and clinical
evaluations. The establishment of valid and reliable measures to assist in this goal is
vitally important.
This chapter introduces the topics of malingering and malingering research.
Malingering is defined and differentiated from other response styles. The major findings
regarding its prevalence and conceptual underpinnings are also reviewed.
1
The importance of detection strategies and their uses are highlighted as well. Finally,
various research designs are reviewed with an emphasis on simulation design.
Specifically, the methodological issues affecting the ecological validity of this design are
discussed in depth, which leads into the current study.
Malingering and Other Response Styles
Terminology in malingering research has been problematic because terms
having distinct meanings are sometimes used interchangeably. Before discussing
malingering itself in depth, these distinctions must be clarified. Malingering is described
in the Diagnostic and Statistical Manual- Fifth Edition, Text Revised (DSM-IV-TR) as a
response style that consists of the intentional falsification or gross exaggeration of
symptoms, which is motivated by external incentives (American Psychiatric Association,
2000). In contrast, dissimulation is a general term used to characterize the deliberate
distortion or misrepresentation of psychological symptoms (Rogers, 2008). Because of
its general nature, dissimulation is most often used when a more specific response style
is not applicable. Besides dissimulation, two other common response styles include
defensiveness and irrelevant responding. Defensiveness is the deliberate denial of
symptoms for external gain; it can be conceptualized as the polar opposite of
malingering (Rogers & Bender, 2003). Irrelevant responding refers to responses that
are not connected to the content of the clinical inquiries (Rogers, 1997). One variant of
irrelevant responding is random responding, in which an individual simply responds
haphazardly with no regard for content. This pattern most often occurs on forced-choice
measures.
2

The term feigning is often preferred to malingering when reporting test results on
psychological measures. Like malingering, feigning describes the deliberate fabrication
or gross exaggeration of symptoms (Rogers, 2008a). However, it differs from
malingering because it draws no conclusions about the presence of external incentives
or any other goal. The reason for this distinction is that standardized measures are ill
equipped to assess the complex interplay of external and internal motivations, thus,
feigning is the most accurate term for such measures.
The definition of malingering set forth by DSM-IV-TR (APA, 2000, p. 739) is “the
intentional production of false or grossly exaggerated physical or psychological
symptoms, motivated by external incentives such as avoiding military duty, avoiding
work, obtaining financial compensation, evading criminal prosecution, or obtaining
drugs.” It can be differentiated from factitious disorder due to the presence of external
incentives. In addition, it can be differentiated from conversion disorder by the
intentional production of symptoms in addition to the presence of external incentives
(North & Yutzy, 2005).
Malingering is not a diagnosable disorder; instead, it is considered a “V code” in
DSM-IV-TR. V codes are classifications of circumstances or problems influencing an
individual’s health status that are considered supplementary to any diagnoses (APA,
2000). While a V code does not have any inclusion or exclusion criteria, it still requires
clinicians to make a categorical determination about the presence or absence of the
condition.
As the DSM-IV-TR (APA, 2000) makes clear, malingering can occur in a number
of contexts including medicolegal or forensic settings. In addition to occurring in a
3

medicolegal context, the DSM-IV-TR screening indicators include the following: (a) a
marked discrepancy between the claimed disability and objective findings, (b) a lack of
cooperation in assessment and treatment, and (c) the presence of antisocial personality
disorder (APA, 2000). Importantly, the DSM-IV-TR indicators are meant only to raise the
suspicion of malingering. Although these characteristics are common in medicolegal
settings, these DSM-IV-TR screening indicators should not mistakenly be thought of as
inclusion criteria or even discriminating characteristics.
In the assessment of malingering, a key distinction must be made between
common and discriminating characteristics. Common characteristics describe features
that are often observed in individuals with a given condition and are sometimes referred
to as “clinical correlates.” They typically do not assist in classification. For example,
“medicolegal contexts” are common to all forensic examinees; therefore, they do not
help to distinguish between malingerers and genuine responders. In contrast,
discriminating characteristics are specific features that reliably differentiate between
groups (Rogers, 1997). Wrongly assuming that the DSM-IV-TR guidelines are
discriminating characteristics can be quite misleading and dangerous. For instance, if
we assume that antisocial personality disorder (APD) is a discriminating characteristic, it
would mean that the rate of malingering in correctional settings is somewhere above
50%, the prevalence of APD in correctional settings. However, since the rate of
malingering is estimated to be around 15% in this setting (Rogers, 2008; to be
discussed later), more than 2/3 of those identified as malingering by this indicator would
be incorrectly classified. In fact, studies suggest that DSM-IV screening indicators may
produce false-positive rates around 80% (Rogers & Vitacco, 2002). Because DSM-IV
4

guidelines may represent common features of malingerers, at least in forensic settings,
they cannot assist in the clinical classification of malingering. The possibility that these
guidelines (e.g., presence of APD) would discriminate those in non-forensic settings has
not been investigated specifically.
Simple categorical classifications (i.e., malingering or not) can lead clinicians to
make difficult dichotomous decisions in every situation. Instead, malingering has been
conceptualized based on severity, type (fabrication vs. exaggeration), and clinical
relevance. Rogers (1988) identified three levels of severity for malingering. First, mild
malingering consists primarily of exaggerations, with minimal distortion and only a
moderate role in differential diagnosis. Second, moderate malingering consists of
exaggerated or fabricated symptoms presented by the individual to make his/her
condition more significant than it is. This level can include a mix of genuine and
exaggerated or feigned symptoms. Third, severe malingering involves extreme
fabrication of symptoms that makes the presentation absurd or incredible. An important
contribution of this model is that mild malingering can be inconsequential to diagnosis
and forensically-relevant issues. Using a different method of classification, Resnick
(Resnick, West, & Payne, 2008), provided three categories. Pure malingering refers to
the falsification of all an individual’s symptoms. Partial malingering involves the
exaggeration of the extent of an individual’s deficits. Lastly, false imputation is the
intentional attribution of real symptoms to a false cause for the purpose of personal
gain.
Both Rogers’ and Resnick’s categories classify the method an individual is using
to malinger in essentially the same way – levels of fabrication. Each model makes its
5

own valuable contribution. Resnick’s false imputation category is a type of malingering
not explicitly included in Rogers’ categories; but the prevalence of this type of
malingering is unknown and the question of whether it needs a separate category has
yet to be addressed. On the other hand, as noted, Rogers’ mild category allows
examiners to note the presence of an exaggeration, while leaving the ultimate forensic
decision unchanged. This contribution may make the Rogers’ model more applicable to
adjudicative settings.
Determinations of malingering and feigning can also vary by the confidence or
certitude in these classifications (Rogers, 1988). Based on the development of the SIRS
(Rogers, Bagby, & Dickens, 1992), examinees can be classified as Honest and
Indeterminate and on two levels of feigning: Probable Feigning and Definite Feigning.
The honest classification is reserved for those who have a very low likelihood of feigning
(≤ 5.0%; Rogers et al., 1992). The Indeterminate category suggests variability in
responding; no classification can be made regarding response style. Probable and
definite feigning classifications differ in their levels of certainty. Based on original
classification data, the probable range has a 90% likelihood of being correct (Rogers et
al., 1992), while the definite range approaches a 100% likelihood of being correct. This
system increases classificatory accuracy by avoiding dichotomous determinations. It
also indicates genuine cases where the likelihood of feigning is very low.
The models above describe various subcategories of malingering but do not
attempt to explain motivations for malingering. By definition, malingering is dependent
on motivation by external incentives. However, the majority of persons do not choose to
malinger irrespective of those incentives. Explanatory models vary both on their
6

hypothesized reasons for malingering and on the amount of support they have received
from research.
Explanatory Models
Three explanatory models have been proposed to explain the primary motivation
for malingering: (a) pathogenic, (b) criminological, and (c) adaptational (Ustad &
Rogers, 1996). The pathogenic model, one of the earliest models put forward (Berney,
1973; Hay, 1983), posits that a mental disorder is the underlying reason for malingering.
In an effort to control symptoms, an individual deliberately produces false ones and tries
to portray them as real. As the disorder intensifies, the individual loses control over the
symptoms and real symptoms emerge. For example, Hay (1983) argued that the
simulation of schizophrenia is a prodromal phase of psychosis occurring in “extremely
deviant premorbid personalities” (p. 8). This model has lost popularity because of its
lack of empirical support; specifically, the predicted deterioration from voluntary to
involuntary symptom production is not often observed (Rogers, Salekin, et al., 1998). In
addition, the pathogenic model is subject to hindsight bias. While it may be easy to look
retrospectively at a patient’s history of impairment and see an increase over time, it is
difficult to predict this exacerbation at the beginning of the patient’s complaints.
Conceptually, the pathogenic model has limited value in predicting further deterioration.
As noted by Resnick (1988), once the external incentive to feign mental disorder is
eliminated, malingerers tend to improve greatly, contrary to the prediction of the
pathogenic model.
The criminological model posits that individuals malinger because they have
antisocial and oppositional motivations (Rogers, 1984). It is consistent with the DSM-IV-
7

TR, which assumes that malingering will be found in forensic settings and that these
individuals are very likely to have antisocial personality disorder (APD). Despite its
promotion by DSM-IV, the criminological model has lost favor with some researchers
(Rogers, 1997). Because most forensic studies occur in criminal settings, the co-
occurrence of malingering and APD may reflect a sample characteristic rather than a
causal relationship. Therefore, while those with APD may have a higher prevalence of
malingering in criminal-forensic settings (Kucharski, Falkenbach, Egan, & Duncan,
2006), its use can lead to misclassification of genuine examinees. The criminological
model and DSM–IV also assume that malingerers are often uncooperative. Contrary to
this claim, malingerers often appear willing to report their symptoms, whereas those
with many genuine disorders often conceal their symptoms (Resnick, 2008).
Due to the serious theoretical and empirical problems with the pathogenic and
criminological models, Rogers and Cavanaugh (1983) advocated a third explanatory
model that has since gained empirical support. The adaptational model asserts that
individuals may malinger when (a) they have a substantial personal investment, (b) the
context of the evaluation is seen as adversarial, and (c) the individuals see few
alternatives to reach their goals. Research has supported the adaptational model over
previous models. For instance, prevalence research indicates that higher rates of
malingering occur when individuals have a lot to gain or lose and have few positive
alternatives (Binder, 1993; Larrabee, 2005; Mittenburg, Patton, Canyock, & Condit,
2002; Rogers, 1997; Rogers, Salekin, Sewell, Goldstein, & Leonard, 1998). However,
Rogers (1997) cautioned that the adaptational model is an explanatory and not a
detection model. It would be a gross error to conclude malingering simply because an
8
individual is in an adversarial setting with a large personal investment and few
alternatives. The combination of these factors may motivate small numbers to malinger,
but prevalence rates alone provide no evidence of malingering.
Prevalence of Malingering
The prevalence of malingering is a very important question, yet for many years it
went virtually uninvestigated (Rogers, 1997). Prior to research on prevalence, many
professionals simply assumed that malingering occurred so infrequently that its
investigation was unwarranted. However, two points are relevant here. First, as Rogers
(1994) observed, infrequency does not equate with inconsequentiality; the social and
monetary costs of misclassifying malingerers are very high. Second, the assumption
that malingering occurs infrequently also appears to be false. The rate of malingering
varies markedly across settings.
The simplistic assumption that malingering occurs only in forensic settings has
been effectively disproven. For instance, malingering in general clinical populations has
been estimated to be around 7-8% (Rogers, 1997). A review by Fishbain, Cutler,
Rosomoff, and Rosomoff (1999) of chronic pain patients in health care settings
estimated the rate of malingering to be between 1.25% and 10.4%, while in military
settings, the prevalence has been found to be between 2% and 7% (Viglione, Fals-
Stewart, & Moxham, 1995).
Estimates of malingering are much higher in settings that can be considered
adversarial. For general forensic populations, the average rate of malingering falls
somewhere around 15.7-17.4% (Rogers, 1997; Rogers et al., 1998), while in personal
injury cases estimates are higher, with 18-33% of clients feigning responses (Binder,
9
1993; Mittenburg, Patton, Canyock, & Condit, 2002). Cases of neurological deficits have
evidenced similar rates, with some researchers estimating base rates of malingering at
16.3 to 26.7% (Bianchini, Curtis, & Greves, 2006).
Conceptually, prevalence rate findings lend support to the adaptational model
because adversarial settings have higher rates of malingering than non-adversarial
settings. While prevalence rates can provide some insight into when individuals are
likely to malinger, they cannot predict who is malingering. The next section reviews the
development and use of detection strategies designed to differentiate honest from
feigned presentations.
Detection Strategies
Starting in the early 1800s, attempts to identify malingerers relied heavily on case
studies that were of dubious quality with questionable generalizability (Geller, Erlen,
Kaye, & Fisher, 1990). A review by Geller et al. (1990) indicated that early authors
suggested a range of indicators of feigning, including (a) interview behavior, such as an
inability to maintain eye contact, (b) feigned presentation, such as overacting
symptoms, (c) areas of intact functioning, usually of symptoms that are less obvious or
known to the public, and (d) atypical symptoms, such as rapid onset, rare symptoms,
and absurd thoughts. Rogers (1984) observed that these methods derived from case
studies have essentially gone unchanged to this day. In fact, nearly all methods used
today were known 100 years ago, and some methods have even disappeared (Rogers
& Correa, 2008).
Although case studies were a good first step, two major problems are found with
this approach. First, the reasoning is circular. With unstandardized strategies derived
10

from case studies, salient characteristics are used to identify malingerers; these same
characteristics are then used to characterize malingerers (Borum, Otto, & Golding,
1993, Rogers, 1997; Rogers & Correa, 2008). The second and related point is that
common characteristics cannot be equated with discriminating characteristics (Rogers,
2008a). By relying on common characteristics, these case study-based methods can
lead to high false positive rates in the classification of malingerers. As a result of these
problems, studies relying on group differences were developed.
Systematic assessments using group differences were the next step and offered
several advantages over the case study approach (Rogers & Correa, 2008). This
assessment approach can be traced to the original Minnesota Multiphasic Personality
Inventory (MMPI; Hathaway & McKinley, 1940), the first measure to use the standard
approach, which paved the way for all other empirically supported methods for the
assessment of malingering. Essentially, many studies focusing on group differences
relied not on conceptually-based strategies, but on statistical differentiation. Two or
more groups of feigners and genuine responders were given a standard series of
questions via self-report measure or interview. Questions which differentiated feigning
from genuine responders were then used as the method of determining malingering
(Rogers, 1984; an in-depth discussion of how groups and scales are formed can be
found later in this section).
While the development of the MMPI was an important step, little attention was
originally paid to the detection strategies underlying its validity scales (Rogers, Harrell,
& Liff, 1993). The majority of research was focused on individual scale development,
while Rogers et al. (1993) were the first to focus on their explicit or implicit detection
11
strategies. Detection strategies have the advantage of being conceptually grounded and
studied across different measures, lessening the chance that their effectiveness reflects
idiosyncratic features of a particular scale.
Rogers and Bender (2003) proposed that a good detection strategy must be
developed with five criteria. First and foremost, researchers should take care to define
the detection strategy as specifically as possible. Second, strategies should be
standardized to ensure that items are written and administered correctly each time, but
also to allow for cross-validation. Third, the conceptual basis for a detection strategy
should be well-formulated. The fourth and fifth criteria refer to considerations in initial
testing of the strategy – each should be based on empirical validation and systematic
differentiation.
The validation of detection strategies for response styles is a multi-step process
(Rogers, 2008b). Researchers should use a variety of research designs to protect
against the specific limitations of each individual design used for validation. Other
methodological issues will be discussed later and are a major part of the current study.
Beyond design and methodology, several important statistics should be included in the
validation process. Validation studies should include effect sizes to indicate the
magnitude of differences. Additionally, utility estimates measuring the rates of correct
and incorrect classifications should be used to examine the accuracy of the detection
strategies across measures. To establish each detection strategy, it should then be
tested and validated across various scales and measures. If these criteria are not met,
the detection strategy cannot be assumed valid and its use should be limited.
Common detection strategies
12

A detection strategy that is well-validated is only useful for a specific response
style and intended domain. Generally, domains can be categorized into three broad
areas: mental disorders, cognitive impairment, and medical presentation (Rogers &
Bender, 2003). For malingering, strategies that are effective with mental disorders are
often ill-suited for the other two domains. For example, the rare symptoms strategy,
which focuses on the genuineness of symptoms associated with Axis I disorders, has
little relevance to feigned mental retardation, which involves failure at simple cognitive
tasks. In contrast, medical feigning detection strategies must focus on the severity or
specific constellations of impairing medical conditions, which differs vastly from mental
disorders. The present discussion focuses on detection strategies for malingered mental
disorders and excludes feigning in the cognitive and medical domains.
Most modern validity scales now use established detection strategies. These
strategies were first examined by Rogers (1984), who provided a basic description of
how they were designed to work. With subsequent research, detection strategies for
mental disorders were classified into two basic categories – unlikely presentation and
amplified presentation. Unlikely presentation strategies measure the presence of
unusual or atypical symptoms. These symptoms should be so atypical that genuine
clinical populations report very few of them. Amplified presentation strategies, on the
other hand, measure the frequency or intensity of psychopathological characteristics to
an extent that is uncommon in clinical populations (Rogers, Jackson, Sewell, & Salekin,
2005). This categorization was supported in a confirmatory factor analysis of the SIRS,
which classified scales on similar categories (Rogers et al., 2005). Rogers (2008b;
Rogers & Bender, 2003) presents ten primary detection strategies that fit into these two
13

categories for the domain of feigned mental disorder (see Table 1). While other
strategies have been devised and used, these ten represent the most common and
best-validated detection strategies for feigned mental disorders.
Unlikely presentation strategies have proven to be very useful in the detection of
feigned mental disorders. Under this general category, five major detection strategies
are found, (a) rare symptoms, (b) quasi-rare symptoms, (c) improbable symptoms, (d)
symptom combinations, and (e) spurious patterns of psychopathology (Rogers, 2008b;
see Table 1 for brief descriptions of each strategy).
The first two detection strategies, rare symptoms and quasi-rare symptoms,
share a common theme but with a critical difference. Rogers (2008b) operationalized
rare symptoms as those reported by less than 5% of genuine clinical patients; however,
this operationalization has varied over time. In the first basic description of rare
symptoms, Rogers (1984) used the word “rare,” but did not specify its maximum
criterion. Although they do not use the term “rare symptom,” Arbis and Ben-Porath
(1995) operationalized this construct for the Fp scale as items endorsed by less than
20% of clinical populations, a less stringent standard than that proposed by Rogers
(2008b). Rare symptoms is one of the most often used detection strategies and can
often be found on multiscale and specialized malingering measures. Its frequent use is
due to both its intuitive appeal and proven effectiveness. Empirically, the strategy has
consistently evidenced large to very large effect sizes (Rogers, 2008). Examples of this
detection strategy include the MMPI-2’s Fp scale and the SIRS RS scale.
Quasi-rare symptoms is similar to rare symptoms strategy; however, the criterion
for the selection of items is infrequency in normative populations rather than clinical
14

samples. Because it is based on symptoms that are rare in normative populations, high
false positive rates may occur in clinical or forensic populations where the symptoms
are genuinely present more often. The distinction between rare and quasi-rare
symptoms is very important. In a meta-analysis of the MMPI-2, Rogers et al. (2003)
found that quasi-rare scales (i.e., F and Fb) produced high elevations in genuine
patients with schizophrenia and PTSD. These quasi-rare scales have diminished
discriminant ability for patients with severe Axis I disorders.
Improbable symptoms strategy is an extreme version of rare symptoms. These
items are sometimes reported by malingerers, but are never encountered in patients
with genuine psychopathology. It can be distinguished from the rare symptoms strategy
because the items are not only infrequent, but preposterous in nature. Rogers (1984)
did not originally differentiate between these two strategies; but in the development of
the SIRS (Rogers et al., 1992) the authors used both strategies separately (i.e., Rare
Symptoms and Improbable or Absurd Symptoms). One main limitation of this strategy is
its potential transparency. Those individuals with experience in the mental health
system may recognize improbable symptoms as clearly bogus and avoid detection on
them.
Table 1 Detection Strategies for Feigned Mental Disorder
Strategy Description Unlikely
Presentation
Rare symptoms
Measures endorsement of symptoms that are very infrequently reported by genuine clinical populations.
(table continues)
15
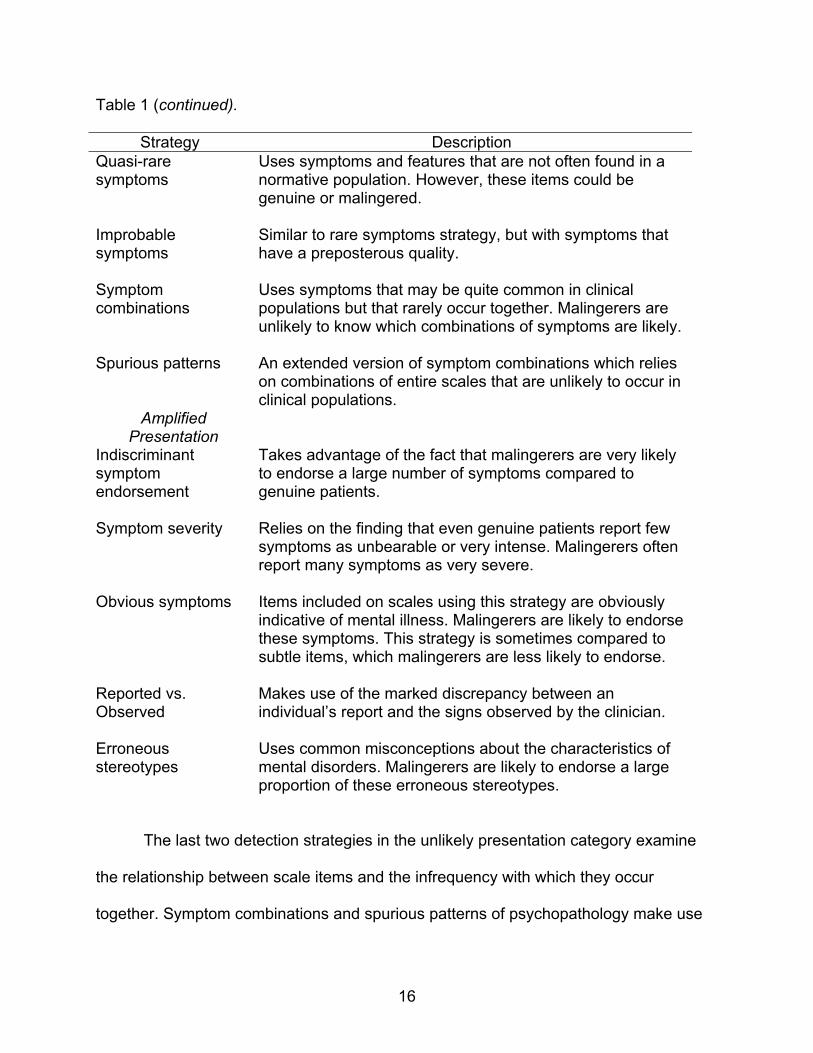
Table 1 (continued).
Strategy Description Quasi-rare symptoms
Uses symptoms and features that are not often found in a normative population. However, these items could be genuine or malingered.
Improbable symptoms
Similar to rare symptoms strategy, but with symptoms that have a preposterous quality.
Symptom combinations
Uses symptoms that may be quite common in clinical populations but that rarely occur together. Malingerers are unlikely to know which combinations of symptoms are likely.
Spurious patterns
An extended version of symptom combinations which relies on combinations of entire scales that are unlikely to occur in clinical populations.
Amplified Presentation
Indiscriminant symptom endorsement
Takes advantage of the fact that malingerers are very likely to endorse a large number of symptoms compared to genuine patients.
Symptom severity
Relies on the finding that even genuine patients report few symptoms as unbearable or very intense. Malingerers often report many symptoms as very severe.
Obvious symptoms
Items included on scales using this strategy are obviously indicative of mental illness. Malingerers are likely to endorse these symptoms. This strategy is sometimes compared to subtle items, which malingerers are less likely to endorse.
Reported vs. Observed
Makes use of the marked discrepancy between an individual’s report and the signs observed by the clinician.
Erroneous stereotypes
Uses common misconceptions about the characteristics of mental disorders. Malingerers are likely to endorse a large proportion of these erroneous stereotypes.
The last two detection strategies in the unlikely presentation category examine
the relationship between scale items and the infrequency with which they occur
together. Symptom combinations and spurious patterns of psychopathology make use
16

of the finding that even when malingerers endorse plausible symptoms, they are likely
to endorse multiple symptoms that rarely occur together. An example of a rare
combination might be grandiosity and increased appetite. Even those persons who are
familiar with specific symptoms may be unlikely to know what combinations are
plausible. Only a malingerer with a sophisticated understanding of psychopathology
would be likely to foil this strategy (Rogers, 2008b). The SIRS Symptom Combination
scale (SC) and M-FAST Rare Combinations scale (RC) use this detection strategy
(Rogers, 2008b). Interestingly, this strategy has only been used in interview formats.
The spurious patterns of psychopathology strategy is a more complex version of
symptom combinations. Its complexity represents both its greatest strength and its
greatest weakness. While difficult to foil because of its complexity, it is also difficult to
validate because of the vast number of possible combinations. Investigators must be
sure that results are not capitalizing on chance patterns of genuine psychopathology
(Rogers, 2008b).
The second group of detection strategies, known as amplified strategies,
contains real symptoms of mental disorder whose number, frequency, or intensity is
exaggerated. While unlikely presentation strategies identify feigning based on the
endorsement of symptoms, amplified strategies rely on the magnitude of reported
symptoms. This category of detection strategies can be accomplished via single items
or scales that capitalize on exaggerated frequency or intensity.
The first two strategies within the amplified category can be seen as measuring
two aspects of the same symptoms. The strategy of indiscriminant symptom
endorsement detects the tendency of malingerers to be unselective when endorsing
17
items. This strategy is easily incorporated into measures and scored because it often
consists of the summing of reported items. However, care should be used to ensure that
a wide range of symptoms is used; otherwise, the scale could capitalize on many real
symptoms of the same disorder that would be seen in genuine cases (Rogers, 2008b).
Symptom severity strategies detect the intensity of endorsed symptoms. Only a certain
number of symptoms are considered unbearable by even the most severely impaired
individuals (Rogers & Bender, 2003). When a larger number of symptoms are rated as
“extreme,” it is very likely that the symptoms are being exaggerated if not fabricated.
Malingerers are often unable to decide which symptoms, or how many, should be
severe. While a number of common measures use these strategies, the SIRS provides
an excellent example. A series of items containing a wide variety of symptoms are
presented and answers are given for both the presence and severity of each item. In
this way, each item loads on to both scales. These two strategies are widely used and
have resulted in large effect sizes (Rogers, 2008b).
The next two amplified strategies involve misconceptions about symptoms of
psychopathology. The obvious vs. subtle symptoms strategy has existed since Wiener
and Harmon’s (1946) designation of obvious and subtle items on five of the original
MMPI scales. They noted that malingerers tend to endorse a higher proportion of
obvious symptoms, neglecting those that may not be popularly known (Greene, 2008).
For example, persons feigning psychosis often report positive symptoms (e.g.,
hallucinations and delusions) but omit negative symptoms (e.g., affective flattening and
alogia). Erroneous stereotypes strategy takes advantage of the fact that malingerers
may erroneously assume that certain presentations are common in genuine
18
populations, while in fact they are not. This strategy is resistant to preparation, since
even many clinicians are unaware of these stereotypes. The use of erroneous
stereotypes strategy has produced very large effect sizes (Rogers, 1997).
Lastly, the reported versus observed symptoms strategy differs from all other
strategies by using more than item endorsement. Instead, it examines patterns between
endorsed items and observed behavior. However, caution must be used with this
strategy, as many genuine patients lack insight and may not endorse items that are
observed by the clinician. In addition, problems can arise when raters are not
adequately trained in observing the behavior of the test taker.
Detection of Feigning on Multiscale Inventories
Multiscale personality inventories were the first standardized methods for the
assessment of feigning and continue to be used most frequently (Greene, 2008). Most
multiscale measures available today contain scales for directly assessing response
styles (Sellbom & Bagby, 2008). This combination of validity and clinical scales provides
the clinician the most information with relatively little use of professional time, making
inventories a very important part of many forensic and clinical evaluations. This section
will review the MMPI-2 and PAI, two of the most often used measures for malingering
and other response styles. This review emphasizes their use of detection strategies.
MMPI – 2
The MMPI-2 (Butcher et al., 1989) is the most extensively researched measure
for the detection of feigning (Rogers, Sewell, Martin, & Vitacco, 2003). Many studies
have investigated its usefulness with feigned mental disorder, including two meta-
analyses (Rogers, Sewell, & Salekin, 1994; Rogers et al., 2003). In addition to extensive
19

research, the MMPI-2 is the most commonly used instrument in forensic settings for the
detection of malingering. According to Lally (2003), nearly two-thirds (64.0%) of forensic
clinicians rate the MMPI-2 as “recommended” and almost all (92.0%) consider it
“acceptable”.
The effectiveness of the MMPI-2 feigning scales can be negated by incomplete
or inconsistent profiles. Effectiveness relies on the ability to score items accurately;
therefore, missing or inconsistent data will result in incomplete and inaccurate scale
scores. Greene (2008) points out that because malingerers are making an effort to raise
their scores on clinical scales to appear mentally disordered, they are unlikely to omit
any items. Nonetheless, inconsistent profiles lead to misclassifications of malingerers,
raising the number of false-positives.
Over time, many validity scales were developed for the MMPI and MMPI-2,
sometimes with little attention to the underlying detection strategy (Rogers et al., 2003).
Items for validity and clinical scales were chosen according to the frequency with which
certain populations endorsed them (i.e., empirical keying). While the reasoning behind
this empirical selection method was to reduce the face validity of items, it has created
problems with interpretation that will be discussed later. Current MMPI-2 feigning scales
with more rationally-based constructions rely on four strategies: (a) rare symptoms, (b)
symptom severity, (c) obvious versus subtle symptoms, and (d) symptom selectivity
(see Table 2; Rogers et al., 2003; Rogers, 2008b).
The MMPI–2 contains two traditional scales that use quasi-rare symptom
detection strategies. The Infrequency (F) and Infrequent Back (Fb) scales contain items
that were endorsed by less than 10% of the MMPI-2 normative sample (Clark, Gironda,
20

& Young, 2003; Greene, 2000). Because these items are rare only in normative, and not
clinical populations, results are often difficult to interpret. As a result, 25% of clinical
samples appear to elevate scale F due to genuine psychopathology (Greene, 1997).
While MMPI researchers (Gough, 1947) recognized this problem early on, it should also
be noted that the F scale was originally intended only to measure atypical responding,
with no implied causal factor (Dahlstrom et al., 1972). The conceptual problems with the
F and Fb scales led to the development of the more stringent Psychiatric F (Fp) scale.
Specifically, Fp was developed using items that were endorsed infrequently in an
inpatient population (Arbisi & Ben Porath, 1995). This scale development is consistent
with Rogers’ (2008b) definition of a true rare-symptoms detection strategy.
Strategies using a rare or quasi-rare strategy have resulted in the best overall
effect sizes among MMPI-2 feigning scales. A meta-analysis by Rogers, Sewell et al.
(2003) found that F and Fp are effective scales (M Cohen’s d = 2.21 and 1.90,
respectively); however, due to its better conceptual basis, Fp is preferred. Its validation
used clinical populations, resulting in fewer false positives for examinees with genuine
psychopathology. The family of F scales is by far the most popular series of MMPI-2
scales for the assessment of feigning.
Beyond rare symptoms, effective feigning scales have been created using the
erroneous stereotypes strategy, while scales using obvious vs. subtle symptoms, and
symptom selectivity or severity strategies have been somewhat less effective.
Erroneous stereotypes are used by two scales: Ds and FBS. The Dissimulation scale
(Ds; Gough, 1954) and the shorter Ds-Revised (Ds-r; Gough, 1957) were developed
using misperceptions of neuroticism and maladjustment (Gough, 1954). In contrast, the
21

Fake Bad Scale (FBS) consists of misconceptions of malingerers in a disability context
(Lees-Haley, English, & Glenn, 1991). Similar to the populations on which they were
developed, the Ds has been found to be useful with a wide range of feigned
psychopathology (Rogers et al., 2003), while the effectiveness of FBS has been limited
to the disability context.
Table 2 Major MMPI-2 Feigning Scales
Scale Description Infrequency (F) F is the traditional scale of infrequency. It includes 60 items
that were endorsed by less than 10% of the normative sample. Because validation did not include a clinical population, it uses a “quasi-rare” detection strategy.
Back F (Fb)
The Fb scale was developed for the MMPI-2 using the same method as the traditional F scale. It includes 40 items, all of which occur in the last half of the measure.
Infrequency Psychopathology (Fp)
Because F and Fb were often endorsed by patient populations, Arbisi and Ben-Porath (1995) created Fp to discriminate between feigners and those with genuine disorders. It was normed on an inpatient population. Therefore, it uses a true rare-symptoms strategy.
Fake Bad Scale (FBS)
The FBS is an infrequency scale that assesses erroneous stereotypes and atypical symptoms. Specifically, it includes 42 items related to disability contexts.
Gough’s dissimulation scale (Ds) and revised scale (Dsr)
Ds and Dsr utilize an erroneous stereotypes strategy. Its items address general misperceptions about maladjustment and neuroticism.
To summarize, recent research (see Rogers et al., 2003) has highlighted the
most effective use of the MMPI-2 in feigning detection. Generally, rare symptoms (Fp)
and erroneous stereotype (Ds) strategies appear to be the most effective across
diagnostic groups based on both their conceptual basis and empirical support (Rogers
22
et al., 2003). While F and Fb both employ a quasi-rare symptoms strategy, Rogers et al.
(2003) questioned whether practitioners should rely on two scales using identical
strategies. Overall, research on the MMPI and MMPI-2 has been invaluable by
increased our understanding of feigning detection and contributing to the development
of other feigning measures.
PAI
The Personality Assessment Inventory (PAI; Morey, 1991) is a new-generation
multiscale inventory that uses validity scales to identify potential feigning and other
response styles. Originally, the PAI consisted of four validity scales in addition to its
clinical and treatment-based scales. Rogers, Ornduff, and Sewell (1993) noted two
characteristics of the PAI that give it an advantage over other multiscale measures: (a)
the use of a four point rating gradation, and (b) scales that do not overlap in their use of
items. Unlike most MMPI-2 validation studies, the PAI scales were validated using both
known-groups and simulation designs (Rogers & Bender, 2003).
The PAI uses three scales, Negative Impression Management (NIM), Malingering
(MAL), and Rogers’ Discriminant Function (RDF; see Table 3 for descriptions) to
measure feigned psychopathology. Morey (1996) noted that NIM was able to classify
feigners fairly well, but like the F scale of the MMPI-2, also misclassified some genuine
patients as feigners. Therefore, the MAL scale was created to more accurately
differentiate between feigning and genuine patients using the more intricate spurious
patterns detection strategy. Later, the RDF scale incorporated an even larger
combination of clinical scores also using a spurious patterns detection strategy. Not
23

conceptually based, the RDF scale employed discriminant function analysis to
differentiate simulators and genuine patients.
All three feigning scales have been extensively studied with both known-groups
and simulation designs. Interestingly, the effectiveness of the three primary validity
scales has varied based on study design. Simulation studies (Bagby et al., 2002; Baity
et al., 2007) have shown the greatest effect sizes for RDF (mean d = 1.87). Conversely,
known-groups studies have shown NIM and MAL (d = 1.54 and 1.10, respectively) to be
superior to RDF, with the RDF being unable to differentiate between groups (d = 0.21;
Boccaccini, Murrie, & Duncan, 2006; Kucharski, Toomey, Fila, & Duncan, 2007). An
examination of the research designs may indicate a plausible reason for these
differences. The RDF was developed using a simulation design to maximally
differentiate between groups. This method perhaps accounts for its excellent effect
sizes in studies using simulation design; however, it may also explain its poor
performance when using a known-groups design (Sellbom & Bagby, 2008).
Table 3 Personality Assessment Inventory Feigning Scales
Scale Description Negative Impression Management (NIM)
This scale includes nine items using the rare symptoms strategy (Morey, 1991). It can indicate feigned psychopathology as well as extreme genuine psychopathology.
Malingering Index (MAL)
The MAL uses the spurious patterns of psychopathology detection strategy. It is based on the NIM scale and 11 PAI clinical scales (Morey, 1993).
Rogers Discriminant Function (RDF)
The RDF (Rogers, Sewell, Morey, & Ustad, 1996), like the
(table continues)
24

Table 3 (continued).
Scale Description MAL, uses a spurious patterns of psychopathology
strategy, though it was developed using a discriminant function analysis to maximize the difference between honest and simulation groups.
Several studies have tested the PAI validity scales by correlating them with
similar scales from other measures. MAL and NIM have been found to correlate with the
SIRS Symptom-Combination scale, as well as the Improbable and Absurd Symptoms
scales (Wang et al., 1997). While the RDF was designed specifically to help with the
distinction between malingering and true psychopathology, it showed no correlation with
any SIRS scales and poor classification rates. For this reason, Rogers et al. (1998)
recommended it only be used as a screen in non-forensic cases.
In summary, the MMPI-2 and PAI serve as useful tools for the detection of
feigning and other response styles. Their contributions have been augmented by
specialized measures specifically validated for response styles. The next section
reviews the most frequently used measures of this kind for feigned mental disorders,
with an emphasis on their use of detection strategies.
Specialized Measures of Malingering
While the standardized assessment of feigning was originally incorporated into
general measures of psychopathology, more recently, measures have been developed
specifically for this purpose. According to Smith (2008), specialized measures should be
selected on the following parameters: (a) the type of symptomatology, (b) the relevant
setting or population, and (c) the varied types of available measures and their relative
strengths. Regarding symptomatology, the majority of modern measures focus on one
25
of two domains: feigned mental disorder or feigned cognitive impairment (Rogers,
2008b). At a more focused level, measures sometimes focus on a more specific area,
such as mood disorders or PTSD (Smith, 2008). The clinical setting can also affect
decisions because measures differ based on which populations they were developed
and validated with.
Specialized feigning measures vary on administrative considerations as well as
their use of detection strategies and psychometric properties. Administrative
differences, such as the time, training, and materials needed, should be considered
based on the available resources. For instance, measures requiring extensive training
courses to ensure proper administration may be inappropriate in a setting where many
individuals need to be tested quickly and professional practitioners are scarce.
Additionally, depending on the primary purpose, the detection strategies may
emphasize sensitivity or selectivity; these emphases also vary across measures (Smith,
2008). A screening measure designed to retain possible feigners for further evaluation
must have high sensitivity, while a measure designed to make a final decision must
have high specificity to minimize false positives. The M-FAST, SIMS, and SIRS
represent three of the most frequently-used specialized measures.
M-FAST
The Miller Forensic Assessment of Symptoms Test (M-FAST; Miller, 2001) is a
brief screen for feigned mental disorders, which was originally developed for use in
forensic settings. The M-FAST uses seven separate detection strategies, four of which
are modeled after those on the SIRS. Its strategies can be grouped into the two general
categories – unlikely and amplified presentation. Scales using unlikely strategies include
26

Rare Combinations (RC), Unusual Hallucinations (UH), Suggestibility (S), and Unusual
Symptom Course (USC). Those using amplified strategies are Reported vs. Observed
(RO), Extreme Symptomatology (ES), and Negative Image (NI).
The M-FAST has become one of the most popular screens for feigned mental
disorders due to its conceptual underpinnings and psychometric strengths. The test’s
brief length and interview format make it easy to use in forensic and correctional
settings where time is sometimes limited and literacy levels are low. Beyond these
logistical considerations, the creation and validation of the M-FAST scales followed
many of the recommendations made by Rogers (2008b) that were outlined above. The
scales are rationally-derived and based on well-defined detection strategies (see Table
1; Rogers, 2008b). In addition to sound construction, the M-FAST scales have been well
validated, with an emphasis on the magnitude of differences and classification rates.
The strong conceptual basis of the M-FAST is backed by its extensive empirical
validation. The original validation studies used multiple research designs, with findings
that have been replicated over time. While all of the scales except NI and S evidence
large to very large effect sizes, the total score is especially strong (ds from 1.47 to 3.32;
Miller, 2001; Guy and Miller, 2004; Jackson et al., 2005) and good Negative Predictive
Power (.89 - .97; Miller, 2001; Guy & Miller, 2004). Lastly, studies have established its
convergent validity with the SIRS and MMPI-2 F scale (Guy & Miller, 2004) and PAI
(Veazey, Hays, Wagner, & Miller, 2005).
SIMS
The Structured Inventory of Malingered Symptomatology (SIMS; Widows &
Smith, 2005) is a self-administered, true-false screen of both feigned mental disorders
27

and cognitive impairment. The SIMS items were developed in a unique two-step
fashion. Items were first selected based on items from other measures used for
feigning, notably the MMPI, SIRS, and WAIS-R (Smith, 2008). Next, items were
generated by the authors according to characteristics of feigners found in the literature.
Multiple detection strategies are used for detecting feigned mental disorders (rare
symptoms, improbable symptoms, and symptom combinations) and cognitive
impairment (performance curve and magnitude of error).1 These detection strategies
have consistently been shown to be effective across measures.
Despite containing similar detection strategies to the M-FAST and SIRS, the
SIMS differs in two important ways. First, its formatting is different as a pen-and-paper
measure instead of an interview. Second, its use of detection strategies differs (Smith,
2008). Unlike other feigning measures, the SIMS scales are not organized according to
detection strategies but by content. Thus, detection strategies for feigned mental
disorders are used in varying degrees for Affective Disorders (AF) and Psychosis (P)
scales and detection strategies for feigned cognitive impairment are used on the
Neurological Impairment (NI), Amnesia (AM), and Low Intelligence (LI) scales. This
structure makes it difficult to study the effectiveness of the given strategies, but does not
appear to reduce the test’s effectiveness.
The SIMS has proven to be an effective screen for feigned mental disorders and
cognitive impairment. The Total Score has proven to be more efficient than the
individual scales, correctly identifying 95.6% of simulators and 87.9% of honest
participants, while the individual scales classified at a slightly lower level (74.6% to
88.3%; Smith, 1992). Since the original validation, all five scales have proven to
28

differentiate honest and feigning participants at similar rates (Lewis, 2001). Regarding
its generalizability, the SIMS has also been investigated for use with adolescents
(Rogers, Hinds, & Sewell, 1996), factitious disorder patients (Rogers, Jackson, &
Kaminski, 2005) and coached simulators (Edens, Cruise & Buffington-Vollum, 1999).
SIRS
The Structured Interview of Reported Symptoms (SIRS; Rogers, Bagby, &
Dickens, 1992) is a structured interview frequently used in the detection of feigned
mental disorders. It is the most widely used and researched interview for this purpose
(Archer, Buffington-Vollum, Stredny, & Handel, 2006) and demonstrates high reliability
and validity (Rogers et al., 1992; Blau, 1998, Rogers, 2008d).
One of the major strengths of the SIRS is its use of multiple detection strategies
relying on multiple inquiry types. While other feigning measures also use multiple
strategies, the SIRS uses a total of 13, eight of which are considered primary and find
empirical support in the literature (Rogers, 2008b; Vitacco, Rogers, Gabel, & Munizza,
2007). These scales can be divided into two general categories: those using unlikely vs.
amplified detection strategies (see Table 4). In general, SIRS scales using unlikely
detection strategies have low means and limited variability in honestly responding
genuine patients. When administered to simulators or suspected feigners however, the
means and variability are much higher (Rogers, Sewell, & Gillard, 2010). This pattern
makes unlikely-strategy scales very effective, with average effect sizes of 1.54 for
simulation studies and 1.90 for known-groups comparisons. In contrast to unlikely
strategies, the means and standard deviations for amplified strategy scales are much
higher for both genuine and feigning samples. Large to very large effects are also found
29

for these scales, with effect sizes only slightly below those for unlikely strategies (M d =
1.36 for simulation and 1.85 for known-groups comparisons). Feigners may employee
different strategies for accomplishing their goals and the variety of scales across these
two categories acknowledges this fact.
Table 4
Effect Sizes on the SIRS for Different Research Designs M Cohen’s d Sim. KGC Unlikely Detection Strategy Scales Rare Symptoms (RS) 1.58 1.74 Symptom Combinations (SC) 1.41 1.75 Improbable and Absurd Symptoms (IA) 1.50 1.55 Reported vs. Observed (RO) 1.66 1.61 Amplified Detection Strategy Scales Blatant Symptoms (BL) 1.63 2.50 Subtle Symptoms (SU) 1.16 1.66 Selectivity of Symptoms (SEL) 1.35 1.81 Severity of Symptoms (SEV) 1.28 2.02 Note. Sim. = Simulation design, KGC = Known-groups comparison. Data in table based on Table 6.13 and 6.15 of Rogers, Sewell, & Gillard, 2010. Research consistently shows that the SIRS is a highly reliable and valid measure
for the assessment of feigned mental disorders. An important factor for all feigning
measures is their ability to discriminate between groups. The SIRS consistently excels
in this respect. Across all research designs, the SIRS reliably differentiates malingering
from other response styles (Blau, 1998; Rogers, 1997; Rogers, 2008d). Importantly,
effect sizes and classification rates remain high even when using inpatient or
correctional populations, groups that often lead to higher false positive rates with other
measures (Rogers et al., 2010).
The conceptual strength and psychometric properties of the SIRS have led it to
be considered the “gold standard” for malingering measures (Rogers, 2008d). In clinical
30

practice, it is the most widely accepted specialized measure for feigning (Lally, 2003),
as well as the most frequently used specialized measure in forensic practice, with
86.2% of forensic psychologists using it (Archer et al., 2006).
Multiscale and specialized measures of feigning have become an important part
of clinical and forensic evaluations. However, their usefulness depends on the
adequacy of their underlying detection strategies. These detection strategies and the
measures using them must undergo empirical validation to demonstrate their
usefulness. This validation should be accomplished via multiple research designs to
avoid capitalizing on the strengths and weaknesses of any one design. The next section
examines the designs used in feigning research, as well as the major methodological
issues involved.
Malingering Research
Dissimulation studies vary in their research designs, which differ markedly in their
strengths and limitations. The vast majority of studies use a simulation design, while all
other designs can be classified as quasi-experimental (Rogers, 1997). Strengths can be
classified on one of two competing dimensions: clinical relevance and experimental
rigor. These two dimensions are usually inversely related and must be balanced
(Rogers, 2008). In this section, each design is analyzed in detail, with an emphasis on
their appropriate applications.
Known-Groups Comparisons
Known-groups comparisons design involves the identification of a group of
malingerers and the comparison of this group to genuine patients. Mental health
professionals determine malingering and genuine groups independently or with
31

objective measures (Rogers, 2008c). With both methods, great care must be exercised
to use the best practices available, either experts on malingering or highly accurate
malingering measures.
The external validity of known-groups comparisons represents its greatest
strength. Since actual malingerers are being compared to genuine patients, external
validity is extremely good and the findings are clinically relevant (Rogers, 1997). The
use of clinically relevant comparisons is essential in establishing a measure’s ability to
differential true psychopathology from feigned presentations. Research with this design
is typically conducted in clinical or forensic settings where malingering is expected to
occur. Unlike simulation design, participants in the known group are typically in an
adversarial situation in which they are motivated to malinger.
Known-groups comparison has been criticized because of its weak internal
validity, which stems from the difficultly in establishing the criterion groups (Rogers,
2008). The reliability and accuracy of assigning individuals to the feigning groups is very
difficult and missteps can happen in at least four ways. First, extreme groups may be
used in which the participants are very easily identified as malingering, but are not
representative of the entire malingering population. Second, groups may be used that
are composed of individuals who do not fully meet the criteria for malingering (Rogers,
1997). This problem can happen if overly inclusive criteria are used to determine the
malingering group. For example, the DSM-IV indices for malingering, as discussed
earlier, result in false-positive rates of 80% (Rogers, 1997); therefore, they should not
be used to establish criterion groups. Third, questionable experts and methods can be
used to determine the groups (for an example, see Edens, Poythress, & Watkins-Clay,
32

2007). For these reasons, assignment should be left to highly trained experts, such as
forensic psychologists, who use extensive evaluations. Other times, established
measures of feigning are used as “gold standards” against which the researched
measure can be compared. A measure such as the SIRS is appropriate for known-
group comparisons because of its accurate classification. It has been used for this
purpose in studies of multiscale and specialized measures (e.g., Lewis, Simcox, &
Berry, 2002; Kucharski et al., 2007; Vitacco et al., 2007). The difficulty with establishing
accurate criterion groups makes known-groups comparison costly and difficult.
However, the known-groups design produces the most generalizable findings. When
used in combination with the more rigorous internal validity of simulation design, it
represents an important part of malingering research.
Differential Prevalence Design
In differential prevalence design, comparisons are made between individuals
from settings assumed to have dissimilar prevalence rates of malingering. Forensic and
clinical settings are often used, and this design is sometimes substituted for known-
groups comparison (Rogers, Harrell, & Liff, 1993). The assumption of different
prevalence rates is made based on the perceived motivation for deception, such as
involvement in litigation or even simply presence in a forensic setting.
The differential prevalence design is not recommended for dissimulation
research for a variety of reasons (Rogers, 2008c). The prevalence rate of each group is
inferred but still unknown; it is based on the assumed motivation to feign but no attempt
is made to ensure that this is, in fact, true in a particular sample. As mentioned before,
the prevalence rate of malingering in forensic settings is estimated to be between 15
33

and 17% and lower for most other settings (Rogers, 1997). Therefore, the “high
prevalence” group is composed of mostly non-malingerers, thereby nullifying the
comparison.
Bootstrapping Comparisons
Bootstrapping comparisons design uses multiple feigning measures to classify
participants. Likely-feigning and likely-honest groups are formed using the results from
the multiple feigning measures and these groups are then compared. It is a fairly recent
development in dissimulation research and is similar to known-groups comparison in
many ways. To maximize the design’s utility, the cut scores used to classify groups
should minimize false positives and false negatives, which can be accomplished with
stringent standards and the elimination of participants in the intermediate range.
However, this design still leaves uncertainty regarding group membership (Rogers,
2008c). As an example of bootstrapping comparisons design, Rogers et al. (2007)
conducted a study on feigned disability referrals. They tested the use of the SIRS in
various groups and compared the results to multiple other indicators of feigned cognitive
impairment, which established likely honest and feigning groups. Due to its stringent
standards, Rogers (2008c) noted that this design is useful in the development and
validation of feigning measures, especially when used along with other research
designs that increase internal validity, such as simulation design.
Simulation Design
Simulation represents the only experimental design used in dissimulation
research. A sample of non-feigning individuals is asked to feign and their data are
typically compared to an accurately-responding control group. The majority of studies
34
use non-clinical participants that are randomly assigned to either a feigning or control
group (Brennan & Gouvier, 2006). Therefore, a clinical comparison group representing
relevant disorders should be included (Rogers, 1997). This component is important
because the differences between simulators and non-clinical control groups may
otherwise be attributable to true psychopathology. Due to its ease of use and excellent
internal validity, simulation design is by far the most common design used for feigning
research (Brennan & Gouvier, 2006).
Simulation design is often criticized for external validity concerns, specifically its
unknown generalizability to actual malingerers (Haines & Norris, 1995; Rogers et al.,
1992). Many early studies with a simulation design did not use a clinical comparison
group; an omission that Rogers (2008) considered to be a fatal flaw because the
findings might be equally present in genuine clinical samples. The development of the
MMPI-2 F scale provides a relevant example. The F scale identifies items endorsed by
less than 10% of the normative sample to indicate rare symptoms. Because items were
selected using a normative and not a clinical sample, certain diagnostic groups (e.g.,
those with schizophrenia and PTSD) exhibit high scores on the F scale (Rogers, Sewell,
et al., 2003). Similarly, college populations are very unlikely to exhibit high levels of
psychopathology; comparing them to a simulation group feigning impairment is an
irrelevant comparison. External validity can also be decreased because it is difficult for
researchers to design studies with real-world circumstances. For instance, providing a
well-adjusted, non-forensic college population with real-world motivation to feign can be
difficult.
35
Besides motivation, simulation research differs from real-world feigning in
another, more basic way. Feigners are going directly against what they are supposed to
do, while participants are following instructions. Rogers and Cavanaugh (1983) refer to
this problem as the “simulation-research paradox.” Participants are “asked to comply
with instructions to fake to study patients who fake when they are asked to comply” (p.
447). This difference in reasoning brings the external validity of this design into
question.
When correctly used, simulation design has the highest internal validity in
response style research. As noted, its external validity is often called in to question due
to the lack of significant motivation and use of simulators who may be quite different
from most real-world malingerers. To combat this problem, researchers who use
simulation studies are putting emphasis on previously over-looked elements that are
designed to improve the quality of such research and make findings more applicable to
the real world. The instructional set is one key element in improving simulation design.
Instructions. Participants in simulation studies are asked to act as if the situation
is real and as if the conditions are intrinsically motivating. Unfortunately, instructions for
simulation research often focus more on conveying the task of feigning than on
motivating the participant. The lack of focus on motivation may be exacerbating the poor
external validity of simulation studies. To increase the motivation of participants, Rogers
and Cruise (1998) outlined the major elements that should be considered when
constructing instruction sets. Considering these elements, they found that studies varied
widely in their instructional sets, with some studies offering only very general
36

instructions without presenting a specific context or providing any incentives to follow
the instructions (e.g., Timbrook, Graham, Keiller, & Watts, 1993).
First and foremost, instructions should be comprehensible and communicate the
expectations of simulation clearly. Comprehension can be increased with instructions
that are written at an easily understood reading level and by avoiding jargon and
technical words. For reading levels, tools include the Flesch-Kincaid Reading Ease and
Grade Level tests (Kincaid, Fishburne, Rogers, & Chissom, 1975). Using a PsycINFO
search of “MMPI-2” and “malingering,” 10 simulation studies were selected that included
the full text of the feigning instructions.2 Across these studies, the mean Grade Level
written was 11.54. In contrast, Rogers and Cruise (1998) developed highly specific
instructions that were easily comprehensible with a Grade Level of 4.1. Considering that
the reading level of participants in clinical and correctional populations is often below
normal, this lower grade level is more realistic of typical participant abilities.
Specificity. Specificity refers to the level of detail provided by a set of instructions.
In dissimulation research, the instructions must be explicit enough to conclude that
participants are adequately prepared to do as instructed. Exactly how specific
instructions should be depends on the research questions. For example, including a
specified disorder in the instructions may be appropriate and necessary if the study
examines a referral issue for which that disorder is common, such as feigned PTSD in
disability evaluations. On the other hand, allowing the participant to choose a disorder
may be closer to typical real-world situations. Regardless of how specific the
instructions are, they should not come at the cost of comprehensibility (Rogers, 1997).
37
Despite the recent interest in specificity, early researchers were also aware of its
importance. For instance, Walker (1962) questioned the adequacy of the instructions
given by Wiggins (1959) in the original validation of the Social Desirability scale (Wsd)
on the MMPI. In particular, Walker noted that the instructions were not specific enough
and may not have maximized participants’ socially desirable responding. Wiggins
(1962) responded to the criticism with a qualitative analysis of the instructions used in
his and other studies. His review found that the instructions were adequate when
compared to others at the time, although by today’s standards, they were quite minimal.
The role of motivation. Individuals feigning in real-life situations are often highly
motivated to gain or avoid extreme financial or psychosocial consequences. In stark
contrast, research participants are typically college undergraduates whose incentives
are merely a few extra credit points. The vast majority of simulation studies on response
styles have assumed that this symbolic incentive will be sufficient motivation (Rogers &
Cruise, 1998). Although feigners have much to lose if their attempts are unsuccessful,
ethical regulations prevent the approximation of these losses in research. Clearly, taking
even a small amount of money from a participant or putting them in a jail cell would
cross the boundaries of ethical research. Nonetheless, Rogers (2008) has argued that
researchers should use multiple methods to try to come closer to real-world motivation,
including challenging the participant to do well and making the simulated condition
seem relevant to their own lives. Challenges attempt to motivate by referring to the test
as something to “beat.” The participants should feel that they must be “good enough” to
avoid being identified by the test. Moreover, malingering research can be made relevant
to college students by framing studies as useful tools that may help to improve their
38

lives or society. For instance, information gained from a study can be framed as a way
to prevent the wasting of millions of dollars in fraudulent claims by improving detection
methods. A discussion of incentives to increase motivation occurs later in this section
due to its relevance to the current study.
Using context to motivate. The situation, or context, given to simulators may
affect investment in the task. Among studies with specific instructions, Rogers and
Cruise (1998) observed that marked differences were found in the type of context used.
They also hypothesized that an unfamiliar context would provide less motivation. As an
example, it may be quite difficult for college students to effectively simulate in a highly
improbable context, such as a first-degree murder trial involving the death penalty. This
context is too far removed from most undergraduates’ reality to be relevant to the
students’ lives. A context involving a less serious crime or a violation of university
policies may be more relevant in a college sample. Elhai and colleagues (2005)
provided an interesting alternative in which they provided multiple scenarios for the
participants to choose from, assuming that they would choose the one that is most
relevant to their personal experiences. Although the study attempted to increase
external validity, it sacrificed some experimental rigor. The results may differ depending
on the scenario chosen, making the true effects hard to interpret.
As one of the only studies to examine the effects of context, Rogers and Cruise
(1998) provided a compelling argument for investigating it in simulation studies further.
While the study did not find a main effect, context had an interaction effect with
incentive that was significant. Specifically, it appeared that simulators with positive
incentives and an applicable context were more successful at avoiding detection. When
39

given negative incentives, the opposite occurred: an inapplicable context or no context
led to fewer elevations. The authors explained this finding as the result of a possible
“reality check.” The applicable scenario or the threat of external sanctions caused them
to use more caution. However, the possibility of a reward with little risk (positive reward
and no negative sanction) led to less caution being used.
Coaching. Coaching, or preparing simulators for their role of feigning, is an
important issue that sometimes arises in real-world evaluations. Coaching most likely
occurs in many forensic evaluations, where it is possible for individuals to obtain
information about psychological tests and assessment methods before they are
evaluated. Information is obtained by reading articles or books about the measures or
becoming familiar with the measures themselves (Nichols & Greene, 1997). In addition,
individuals can easily read information on the diagnostic criteria of the disorder they are
attempting to feign.
Coaching can be divided into two main categories based on the type of
information given to the individual. The first involves information about the diagnostic
criteria of a disorder, while the second consists of a warning or information about the
use of detection strategies (Rogers, Jackson, Sewell, & Salekin, 2005). The first method
does not increase one’s ability to avoid detection (Rogers, Bagby, & Chakraborty,
1993). In some cases, the diagnostic criteria may simply be too much information to
remember and use. This type of information may help an individual choose which
symptoms to report or endorse, possibly allowing them to avoid detection on unlikely
detection strategies. However, it will do nothing to foil amplified detection strategies that
40

rely on exaggeration of real symptoms or combinations of symptoms. If fact, it
theoretically may increase these methods of feigning.
Coaching participants about detection strategies, as opposed to providing
information about actual disorders, appears to significantly enhance the ability to feign
convincingly (Lamb, Berry, Wetter, & Baer, 1994; Rogers et al., 1983; Rogers et al.,
1993). However, even when participants do not receive any coaching but are given a
simple warning about the presence of detection methods, performance improves. As an
example, Johnson and Lesniak-Karpiak (1997) demonstrated that simulators who were
warned about detection methods were able to improve their performances on some
neuropsychological tests. Forty-five percent of the warned simulators avoided detection
as feigners. While the authors hypothesized that warning may actually decrease the
prevalence of malingering, it is possible and perhaps more likely that it simply led many
malingerers to go undetected due to more believable feigning. Similar results have been
obtained in the domain of feigned mental disorders (Bagby et al., 1997; Lamb et al.,
1994; Rogers et al., 1993; Storm & Graham, 2000).
Detection strategy coaching appears to work best when the information is simple
enough to keep in mind throughout testing. Rogers and Bender (2003) report that when
participants are informed about intricate detection strategies, as opposed to simpler
ones, they are less likely to avoid detection. This finding is similar to that found when
participants are coached about diagnostic information; this does little to enhance their
ability to feign effectively.
The task of finding relevant material for coaching has become much easier in
recent years. The internet has now become the largest source of immediately available
41

psychological information. Ruiz and colleagues (2002) found hundreds of websites that
had the potential to inform individuals about diagnostic information and a more limited
number that posed a direct threat to test security by providing actual test items or
information on the detection strategies used. This number is likely even higher today.
Individuals in forensic settings may have an additional resource at their disposal.
Lawyers and psychologists may provide information, intentionally or not, that could be
used to feign more convincingly (Youngjohn, Lees-Haley, & Binder, 1999). In fact,
Wetter and Corrigan (1995) found that over 50% of lawyers believe it is not only
permissible, but also appropriate to coach their clients about the presence of validity
scales and how they work.
Incentives. Because real-world circumstances often provide considerable
rewards for successful feigning, incentives are an important aspect of improving
external validity in simulation research. While incentives have always been a part of
most simulation studies, their actual effects have gone largely uninvestigated, especially
in the area of feigned mental disorder (Rogers, Harrell, & Liff, 1993; Rogers, 1997). The
first investigation, by Rogers and Cruise (1998), found that the presence of incentives
had a significant effect on participants’ ability to avoid detection. In a more recent study,
Elhai et al. (2007) found that rewards of $40 and $50, offered to top performing
participants on a measure of PTSD feigning, also increased their ability to avoid
detection. Like Rogers and Cruise, effect sizes were in the small to moderate range.
Five studies have investigated the effects of monetary incentives on cognitive
and neuropsychological impairment, with their results generally showing small effects.
Wilhelm, Franzen, Grinvalds, and Dews (1991) found that while a larger monetary
42

incentive ($20 vs. $0) increased the self-reported motivation for feigning, it did not help
participants avoid detection (i.e., their scores on detection measures were not
significantly lower). Another early study (Bernard, 1990) found that incentives increased
performance only on some feigning scales. More recent studies have found more
consistent results. An incentive of $20 caused less detectable performance in one
simulation study (Shum, O’Gorman, & Alpar, 2004) and two other simulation studies
found that incentives of $20 and $25, respectively, had significant effects on
performance for both standard neuropsychological and malingering-specific tests
(Frederick, Sarfaty, Johnston, & Powel, 1994; Orey, Cragar, & Berry, 2000).
Research participants and would-be malingerers are likely affected by the
magnitude of an incentive. This finding has yet to be investigated experimentally with
strict control, but initial evidence has been provided by a meta-analysis of 17 studies on
closed-head injuries (Binder & Rohling, 1996). These studies did not specifically
investigate the magnitude of incentives, but included enough data to calculate effect
sizes. While controlling for the severity of the injury, the researchers found that cases
involving a higher possible monetary reward were moderately correlated with more
abnormality and disability when tested (d = 0.47). In other words, even in cases with
similar injuries (e.g., same amount of trauma, same medical findings), when the
possible reward was higher, more impairment was reported. This finding supports a
positive relationship between reward size and feigning but has not been tested in
simulation research, possibly due to the relatively small size of these rewards compared
to the large rewards found in compensation cases. Therefore, more research is needed
to understand the effect that incentive size has on feigning.
43

The offering of large incentives is obviously limited by professional ethics and
research funding. One potential solution is to offer a larger incentive to a small number
of participants. As opposed to giving each participant a modest incentive of $5-$10, a
system could be used in which only the “best” participants receive a much more
substantial reward (Rogers, 2008c). Bianchini, Curtis, and Greve (2006) noted another
potentially useful design. They noted that almost all investigations have made incentive
a binary concept (incentive vs. no incentive), with no attention paid to the level of
incentive. They recommended offering a moderate incentive to a small number of
simulators while also offering a large incentive to the “best” simulator to increase
motivation.
Malingerers in real-world situations face severe negative consequences if they
are detected. Detection means not only losing possible rewards, but also facing harsh
penalties (Rogers, 2008a). Interestingly, the instructions of many studies inform
participants of hypothetical negative consequences (e.g., if you were to be caught you
would go to jail), but very few have implemented actual incentives besides low to
moderate monetary rewards. Of course, ethically, many of these consequences cannot
be recreated in simulation studies. It is largely unknown whether other types of
incentives would change results (Rogers, 1997).
Negative incentives consist of (a) “taking away” a promised positive incentive or
(b) implementing an adverse consequence. These incentives attempt to approximate
what real-world malingerers have to lose if they are caught feigning. However, real-
world negative incentives may include far-reaching consequences such as guilty
verdicts or a loss of disability payments. As with positive incentives, it is impractical and
44

unethical to recreate the negative incentives found in reality, which are too severe to
enact in simulation studies.
Only two studies have investigated the effects of ethically-sound negative
incentives on simulators’ ability to avoid detection. Patrick and Iacono (1989) examined
prisoners’ ability to avoid detection on a polygraph test. Participants were informed that
they would not receive their reward ($10) if a certain number of participants were unable
to do the task; in addition, the names of those who failed would be posted for other
prisoners to see. This study is difficult to compare to feigning studies because it
investigated deception instead of feigning and polygraph tests instead of detection
strategies. In the only other known example of negative incentives, Rogers and Cruise
(1998) instructed participants in one simulation group that the names of failed
malingerers would be posted on a bulletin board. Simulators in this group endorsed
fewer symptoms and were more likely to avoid detection when compared to those who
received only positive incentives. No additional studies have attempted to replicate the
findings of Rogers and Cruise. Negative incentives are a promising alternative to the
sole reliance on small positive incentives included in most studies.
Current Study
Simulation research design continues to be the most commonly used design in
dissimulation research, but its external validity is potentially problematic. At present,
most simulation studies follow general patterns without any systematic investigation of
how elements of their design may improve experimental rigor and enhance external
validity. For example, the scenario, or context, the simulators are given can potentially
effect motivation. Rogers and Cruise (1998) found that familiar scenarios improved
45
feigning. While the results were modest, this variable needs to be investigated further.
Likewise, two studies have analyzed the role that incentives play in the malingering of
mental disorders (Elhai et al., 2007; Rogers & Cruise, 1998), with the latter providing an
initial investigation of negative incentives. Given its potential as a useful research tool,
the lack of incentive research is concerning. Finally, while studies exist that examine the
effect of coaching on feigning, its combined effect when considering other variables is
currently unknown. The current study seeks to investigate the methodological
components of scenario, incentive, and coaching. These variables are involved in most
dissimulation research using a simulation design.
Research Questions and Hypotheses
Research Question 1
The first research question investigates the effects of experimental condition on a
group’s ability to avoid detection on the Structured Inventory of Malingered Symptoms
(SIMS). As the scale with the best cut score (Smith, 2008), the SIMS Total Score will be
used to classify individuals as “honest” or “feigning” on research questions requiring a
classification.
• Hypothesis 1: Simulation groups will score higher on the SIMS total score than
the control (standard instructions) group.
• Hypothesis 2: A greater percentage of the simulation groups will score above the
SIMS cut score for feigning than the control group.
• Hypothesis 3: Simulation groups will produce higher SCL-90-R scores than the
control group.
Research Question 2
46

Rogers and Cruise (1998) posited that a scenario that is more familiar to an
individual will improve their performance (i.e., ability to avoid detection). The second
research question examines the effect that the type of scenario has on individuals’
ability to avoid detection on the SIMS. Both groups are expected to endorse a
significant amount of psychopathology, as measured by the SCL-90. As described
further in the Methods, the familiar scenario involves feigning a “mental breakdown” in
order to avoid a failing grade in college. The unfamiliar scenario involves feigning to
avoid a criminal charge of aggravated assault. For this and all remaining research
questions, analyses will be between simulation groups since the standard instructions
group receives no additional instructions.
• Hypothesis 4: The familiar scenario group will score lower on the SIMS than the
unfamiliar group.
• Hypothesis 5: The unfamiliar group will indicate a significantly higher level of
symptomatology, as measured by the SCL-90.
• Hypothesis 6: The familiar scenario group will put forth more effort (i.e., higher
self-rated effort level on the manipulation check) than the unfamiliar scenario
group.
Research Question 3
Investigations of the effect of coaching (Rogers et al., 1983; Lamb, Berry, Wetter, &
Baer, 1994; Rogers, Bagby, & Chakraborty, 1993; Johnson & Lesniak-Karpiak, 1997)
have consistently shown that coaching participants about the presence of detection
scales improves their ability to present believably. The third research question
investigates the role of coaching.
47

• Hypothesis 7: Among simulators, the coached group will score lower on the
SIMS than those in the non-coached group.
Research Question 4
While studies of incentives in cognitive feigning cases have shown a strong
correlation between incentive level and performance (Binder & Rohling, 1996), the role
of incentives in the malingering of mental disorders has gone virtually uninvestigated
(Rogers, 2008). Rogers and Cruise (1998) found that the participants receiving negative
incentives were able to avoid detection better than those who received positive
incentives. The fourth research question examines the relative effect of positive and
negative incentives separately.
• Hypothesis 8: The positive incentive group will score lower on the SIMS than the
“no incentive” group.
• Hypothesis 9: The negative incentive group will score lower on the SIMS than
both the positive incentive and no incentive groups.
Research Question 5
The previous research questions have examined the effect that different levels of
each variable have separately. The fifth research question investigates the relative
importance of two of these variables: scenario and incentive. Coaching has undergone
investigation before and its effect has been documented. Therefore, although it will be
included in the following analysis in order to investigate interaction effects, the emphasis
will be on the relative importance of incentive and scenario conditions.
• Hypothesis 10: Overall, incentive will have a greater effect than scenario on
SIMS Total score results.
48

49
Supplementary Research Questions:
The SIMS includes five subscales that represent two domains of malingering:
feigned mental disorders (psychosis and affective disorders) and feigned cognitive
impairment (amnestic disorder, neurological impairment, and low intelligence). The
instructions given to participants will refer to mental disorder, but do not describe a
specific disorder. The manipulation check will ask participants to report their chosen
disorder. The reported disorder will then be compared with individuals’ SCL-90-R scores
to see if they are endorsing items relevant to their chosen disorder, or if they are
feigning in a more generalized way.
• Supplementary Question 1: Which SCL-90-R scales will be most often elevated?
• Supplementary Question 2: Will participants endorse items that load onto scales
similar to the disorder they are reporting, or will their feigning generalize and
significantly raise scores on many different scales?
• Supplementary Question 3: Will simulators with the most extreme SCL-90-R
elevations be more detectable than those with moderate SCL-90-R elevations?

CHAPTER 2
METHODS
Design
The present study used a between-subjects factorial design to investigate the
differences in response style between groups of randomly assigned participants. This
research design allowed the comparison of all possible combinations of the three
variables, which formed a 2 (Scenario) X 3 (Incentive) X 2 (Coaching) factorial design,
creating 12 combinations. The two scenarios were familiar (possible academic failure)
and unfamiliar (assault charges). The three incentive groups were positive (extra credit
and entry into a $50 drawing for successfully avoiding detection), negative (loss of extra
credit and requirement of additional time and effort), and both (a combination of the
positive and negative incentives). The coaching variable consisted of two conditions:
uncoached (no instruction on how feigning measures work) and coached (information
given on how the Structured Inventory of Malingered Symptoms (SIMS) detection
strategies work). In addition to the 12 experimental groups, a control group was used in
which participants were instructed to answer honestly.
This design is preferable to a within-subjects design due to the nature of the
dependent measures. A within-subjects design would expose participants to the
measures, leading to possible practice effects. In dissimulation research, this practicing
could help participants make decisions about which items to endorse. Although practice
effects are a potentially important part of real-world investigations, they would confound
the effects of the current variables being investigated.
Participants
50

The participants consisted of 289 students recruited from undergraduate
psychology classes at the University of North Texas via an online sign-up system. In
accordance with Institutional Review Board requirements, written informed consent was
obtained from all participants. The only inclusion criterion was to be enrolled as a
current university student. For those who participated, all data were included in
analyses unless the study instructions could not be recalled during the manipulation
check.
Materials
Instructional Sets
Instructional sets are an integral part of all simulation studies because
participants are asked to adopt a role and follow specific directions. As recommended
by Rogers (2008c), all instructions in this study were written at a comparatively low
reading grade level (M grade level = 8.95, SD = .94, range 7.6-10.2) for college
students.
All participants in the experimental groups were given a general set of
instructions on the purpose of feigning psychopathology. These instructions were basic
so that they would not interfere with the coaching condition. As such, the instructions
included only a general statement as to why one would choose to feign
psychopathology.
General Instructions: You will be asked to pretend that you have a mental
disorder. You will be given a number of questionnaires that are designed
to measure the type and level of mental disorder you are pretending to
have. Do your best to fake in a believable way so that you are not caught.
51
In addition to the general instructions, specific directions were given to each
participant depending on their experimental group. These instructions varied by
scenario, incentive, and coaching.
Scenario. Simulators were assigned to one of two experimental conditions with
regard to scenario: (a) familiar scenario, or (b) unfamiliar scenario. The “familiar
scenario” involved the possibility of academic failure unless the individual could
convincingly feign psychological impairment. Even though it is unlikely that this scenario
has been experienced by many of the undergraduate participants, failing a class is
hypothesized to be plausible and relevant because most participants are likely to know
one or more students who have failed. The “unfamiliar scenario” involves aggravated
assault charges because it is assumed that most students and their friends will not have
encountered such a serious criminal charge. Care was taken not to make this condition
too severe, which might make the study seem unbelievable (e.g., murder charges or
pleading insanity; see Bagby, Gillis, & Dickens, 1990). Therefore, assault charges were
chosen because they are unfamiliar to most students but not extreme. In addition, a
manipulation check asked about participants’ experience with both scenarios.
Familiar scenario: Imagine that you are in the final weeks of a class that
you need for graduation. You have not even started a major project that
counts for 50% of your final grade. Without it, you have no hope of
passing. The university makes special exceptions for dropping classes if
a student experiences a mental disorder. You decide that you must fake
a breakdown. A psychologist will give you a few questionnaires to decide
if you are impaired. You can avoid failing only if you are able to convince
52

the psychologist that you really are impaired. Please take a minute to
think about what type of disorder and impairment you would like to fake
before completing the materials – remember, you must appear
convincingly disabled.
Unfamiliar scenario: Imagine you were involved in a fight outside of a
restaurant and you broke a bottle over the other person’s head. You
escaped with a few cuts, but the other person was hospitalized. Felony
Assault charges are now being filed against you. You decide you must
pretend to have a mental disorder that explains your behavior outside
the restaurant. A psychologist will give you a few questionnaires to
decide if you are impaired. You can avoid a conviction and possible jail
time only if you can convince the psychologist that you are mentally
impaired. Please take a minute to think about what type of disorder and
impairment you would like to fake before completing the materials –
remember, you must appear convincingly disabled.
Incentives. Participants were provided with one of three incentive
conditions –positive, negative, or both incentives. As mentioned earlier, the
positive condition informed simulators that they would be entered to receive 50
dollars plus extra credit if they were successful at feigning psychopathology
without detection.
Positive incentive: If you succeed at “faking out” the questionnaires
without being caught, you will receive extra credit and be entered to win
53

$50. Remember, you must appear genuinely impaired and avoid
detection to win a chance at $50.
The negative incentive condition informed simulators that they would not
receive their extra credit if they failed to appear genuinely impaired. They would
also be required to complete an additional 20 minutes of measures to
understand why they failed. This type of negative incentive has never
undergone investigation and was chosen because it was expected to be
aversive in a college sample.
Negative Incentives: If you succeed at “faking out” the questionnaires
about your pretend mental disorder without being caught, you will
receive extra credit and complete the study early. However, if you are
caught trying to deceive the tests, you will not receive the extra credit. In
addition, you will be required to stay for an additional 20 minutes to fill
out more measures to find out why you failed.
Lastly, a third group of simulators received instructions about both the
positive and negative incentives. Therefore, this group, if successful, was told
that they would be entered to win $50, receive extra credit, and avoid the extra
time and effort of completing more measures.
Coaching. Participants were assigned to one of two coaching conditions.
The uncoached group received no additional instructions, whereas the coached
group was given the following information about how validity scales work.
Coached: There are scales on these tests that are designed to catch
those who are faking a mental disorder. These scales use several
54
methods to tell those with genuine disorders from those faking disorders.
One method for identifying fakers is to ask about very strange or unlikely
symptoms. For example, if you indicate that you are deathly afraid of
flowers (almost never a real symptom), the test will see you are likely
faking. Another way the test detects faking is by asking about symptoms
that rarely happen together. For example, increased appetite and
hearing voices are symptoms of different mental disorders. Therefore,
they are unlikely to happen at the same time. Please watch for the items
that are designed to catch you faking. Remember, you want to appear
mentally disordered, but you want to be believable – otherwise you will
be caught.
Measures
The study used measures covering two different purposes: (a) assessing
reported symptoms and (b) testing whether or not participants were feigning.
These measures are described in the following paragraphs.
Symptom Checklist-90-Revised (SCL-90-R)
The SCL-90-R (Derogatis, 1992) is a 90-question, self-report measure of
psychological symptoms that has been validated for use with community participants as
well as patients with mental disorders (Derogatis, 2000). It has been used extensively in
clinical research, with Derogatis (2000) reporting its use in more than 1,000 studies.
Each question asks the individual to rate how stressful an item has been in the last
week. Each item then loads onto one of nine clinical scales (Somatization, Obsessive-
Compulsive, Interpersonal Sensitivity, Depression, Anxiety, Hostility, Phobic Anxiety,
55

Paranoid Ideation, and Psychoticism). In addition, two measures of overall severity
(Global Severity Index, GSI; Positive Symptom Total, PST) are also calculated. Raw
scores are converted to gender-specific T-scores to enhance interpretability (Derogatis,
1992). Internal consistency and test-retest reliability have both been shown to be very
good (mean alpha = .84 for each).
Structured Inventory of Malingered Symptoms (SIMS)
The SIMS is a 75-item true-false screen for feigning of both mental disorders and
cognitive deficits. It is intended for use with adults in clinical or forensic settings who are
not severely impaired (Smith, 2008). Validated across ethnicities (Alwes et al., 2006),
the SIMS is composed of 5 scales: Low Intelligence (LI), Neurological Impairment (N),
Affective Disorders (AF), Psychosis (P), and Amnesia (AM). Its internal reliability is
good, ranging from .80-.88 for each scale. Initial research (Smith, 1992) suggested its
potential utility for identifying persons feigning psychopathology. Since the original
validation, both known-groups (Heinze & Purisch, 2001) and simulation studies (Edens,
Otto, & Dwyer, 1999) have validated its use with clinical and forensic populations. The
SIMS has been used with a narrow range of cut scores designed to maximize negative
predictive power (≥ 14 to ≥ 16; Widows & Smith, 2005). Recent studies using forensic
populations typically use a cut score of 16 (Alwes et al., 2006; Lewis et al., 2002), while
studies with college students have tended to use a score of 14 (Edens et al., 1999;
Jelicic, Hessels, & Merchelbach, 2006). A cut score of 14 will be applied because the
current study uses an undergraduate sample.
In addition to the SCL-90-R and SIMS, a debriefing and manipulation check
(Appendixes H and I) was distributed to evaluate participants’ involvement and effort.
56

57
Besides the manipulation check, the questionnaire included items to aid in analyzing the
supplementary research questions.
Procedures
Participants were recruited from undergraduate classes in psychology via an
online sign-up system. The purpose of the study was explained by the investigator on
an individual basis and written informed consent was obtained from all participants. A
packet including instructions tailored to the experimental condition, the SCL-90-R, the
SIMS, and a debriefing questionnaire was distributed to each individual. The order in
which control and experimental condition packets were distributed was randomized
beforehand. Afterwards, completed packets were collected. The negative incentive
instructions informed participants that they would be required to stay after and complete
more paperwork if they were detected as feigning on the SIMS. Scoring of the SIMS did
not actually take place at the time of testing; however, to convince participants of the
reality of the instructions, each SIMS was “mock scored” upon being completed. In
actuality, no participants were required to do any additional work and all received extra
credit for their participation.

CHAPTER 3
RESULTS
General Manipulation Check
Participants were required to recall the basic instructions (i.e., respond honestly
or feign) as well as indicate at least minimal effort. The data for the ten participants who
were unable to recall the basic instructions and the fourteen who indicated that they
“didn’t try at all” were removed from all subsequent analyses. However,
demographically, these individuals were not significantly different from the final group of
participants who remained.
Descriptive Data
The final sample was composed of 178 (66.8%) female and 87 (32.8%) male
participants. As a college sample, most participants were young adults with an average
age of 20.34 years (SD = 2.96) and age range from 18-42. Academically, all participants
were current undergraduates, with an average of 2.11 years (SD = 1.09) of college at
the time of testing. Likely due to the generally young age of the sample, 247 (93.6%)
listed themselves as single, with less that 5.0% reporting to be married or divorced.
The ethnic composition of the sample was roughly equivalent to that of the
United States in general, with 172 (65.2%) European American, 35 (13.3%) Hispanic,
29 (11.0%) African American, and 17 (6.4%) Asian American. An additional 11 (4.2%)
indicated that their ethnicity was not listed or identified themselves as biracial.
Predictably, the large majority of the participants (229 or 88.4%) listed English as their
first language.
58

Participants were asked about their experiences with class failures and criminal
arrests because the experimental scenarios involved these particular topics.
Approximately one-third (81 or 30.7%) of the participants indicated that they had failed
at least one class during college. Of those who had failed a class, 73 (91.3%) had failed
less than three times, whereas six (8.9%) had failed between 3 and 6 classes, and one
individual had failed over 10 classes. Of the 24 people (9.1%) who reported that they
had been arrested, 12 (50.0%) were arrested for alcohol-related offenses; the remaining
half were arrested for various crimes including property offenses, financial infractions
such as writing hot checks, and traffic offenses. Importantly, none of the participants
had been arrested for violent crimes such as the one described in the unfamiliar
scenario.
Participants were asked whether they had even been diagnosed with a mental
disorder. While 18 participants (6.8%) left this section blank, nearly all of those
remaining (242 or 98.0%) reported no diagnoses. Reported diagnoses included mood
disorders (2 or 0.8%), an anxiety disorder (1 or 0.4%), and ADHD (2 or 0.8%). It is
possible that more participants had personal experience with disorders, such as ADHD,
but did not classify them as “mental disorders.”
Specific Manipulation Checks
Besides recalling the general instructions about the honest or feigning conditions,
the manipulation check also asked participants to recall the specific instructions they
were given for each variable. Approximately 82.0% of all simulators accurately and
completely recalled the scenario they were given; percentages were comparable for the
unfamiliar (83.0%) and familiar (81.0%) groups. One hundred percent recalled at least
59
part of the details of their scenario. Failure to recall some of these specific instructions
did not remove participants from analysis; only an inability to recall condition (i.e.,
feigning vs. honest instructions) or a self-report of poor effort were criteria for removal.
This was done because we wanted to include as many simulators as possible without
holding them to a standard of complete recall.
Participants were understandably better able to recall the realistic incentives –
which applied to them directly – than the hypothetical incentives that had no personal
bearing. More specifically, the realistic incentives provided direct benefits that were
positive (i.e. extra credit and the possibility of money) or negative (removal of extra
credit and the addition of extra time and work requirements). In contrast, the
hypothetical incentives only involved the scenario (i.e., avoiding a criminal charge or
class failure; see Table 5). Overall, there was a dramatic difference between the recall
of real incentives (81.7%) and hypothetical rewards or punishments (45.0%).
Methodologically, an important finding was the stark differences between positive
incentive (i.e., money and extra credit) and negative incentive (i.e., extra time and loss
of extra credit) groups regarding the types of experimental incentives accurately
recalled. For instance, nearly all (92.5%) of the positive incentive group recalled the real
incentives (i.e., $50 and extra credit), which is dramatically higher than the negative
incentive group’s recall of their extra requirements and loss of extra credit (53.8%; χ2 =
55.70, p < .001). At first glance, this disparity seems to indicate that the negative
incentives were more difficult to recall. However, participants receiving both the positive
and negative incentives had excellent recall (90.0%), suggesting that the presence of a
60
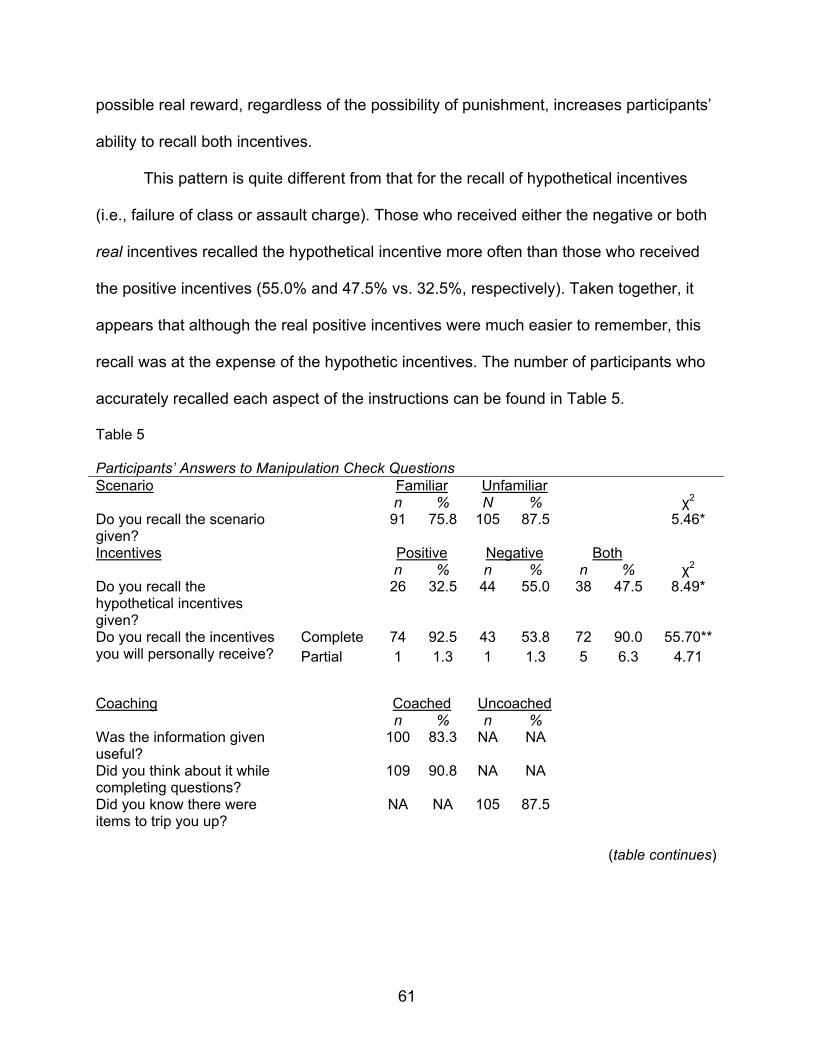
possible real reward, regardless of the possibility of punishment, increases participants’
ability to recall both incentives.
This pattern is quite different from that for the recall of hypothetical incentives
(i.e., failure of class or assault charge). Those who received either the negative or both
real incentives recalled the hypothetical incentive more often than those who received
the positive incentives (55.0% and 47.5% vs. 32.5%, respectively). Taken together, it
appears that although the real positive incentives were much easier to remember, this
recall was at the expense of the hypothetic incentives. The number of participants who
accurately recalled each aspect of the instructions can be found in Table 5.
Table 5
Participants’ Answers to Manipulation Check Questions Scenario Familiar Unfamiliar n % N % χ2 Do you recall the scenario given?
91 75.8 105 87.5
5.46*
Incentives Positive Negative Both n % n % n % χ2 Do you recall the hypothetical incentives given?
26 32.5 44 55.0 38 47.5 8.49*
Do you recall the incentives you will personally receive?
Complete 74 92.5 43 53.8 72 90.0 55.70** Partial 1 1.3 1 1.3 5 6.3 4.71
Coaching Coached Uncoached n % n % Was the information given useful?
100 83.3 NA NA
Did you think about it while completing questions?
109 90.8 NA NA
Did you know there were items to trip you up?
NA NA 105 87.5
(table continues)
61

Table 5 (continued).
Success Familiar Unfamiliar n % n % χ2 Do you believe that you were successful at deceiving the tests?
84 70.0 71 60.2 2.53 Positive Negative Both n % n % n % χ2 47 60.3 54 67.5 54 67.5 1.21
Coached Uncoached n % n % χ2 83 69.2 72 61.0 1.74 Note. Complete = Complete list of possible incentives was given, Partial = Partial list was given. Empty cells indicate that the item was not given to that group. *p < .05, **p<.01.
The manipulation checks were used to evaluate the perceived relevance of the
coaching instructions. A large majority of coached participants found the information
useful (83.3%), with an even higher percentage taking the information into consideration
when answering questions (90.8%). Of those who were not coached, a similar
percentage reported that they were aware of items designed to detect them (87.5%),
though their ideas about the underlying detection strategies varied widely (Table 6).
Specifically, it appears that the transparency of detection strategies may be an
important consideration. A third of uncoached participants listed “inconsistency” as the
only detection strategy in use, despite the fact that it is not used on the SIMS. This
misplaced focus on inconsistency, noted by Rogers and his colleagues (2010), is a
common finding even in highly functioning groups. Approximately another third listed
other validated detection strategies that were outlined in the Introduction, while the final
third listed non-descript terms, such as “trick questions” or “make you second guess” as
the methods of feigning detection.
62
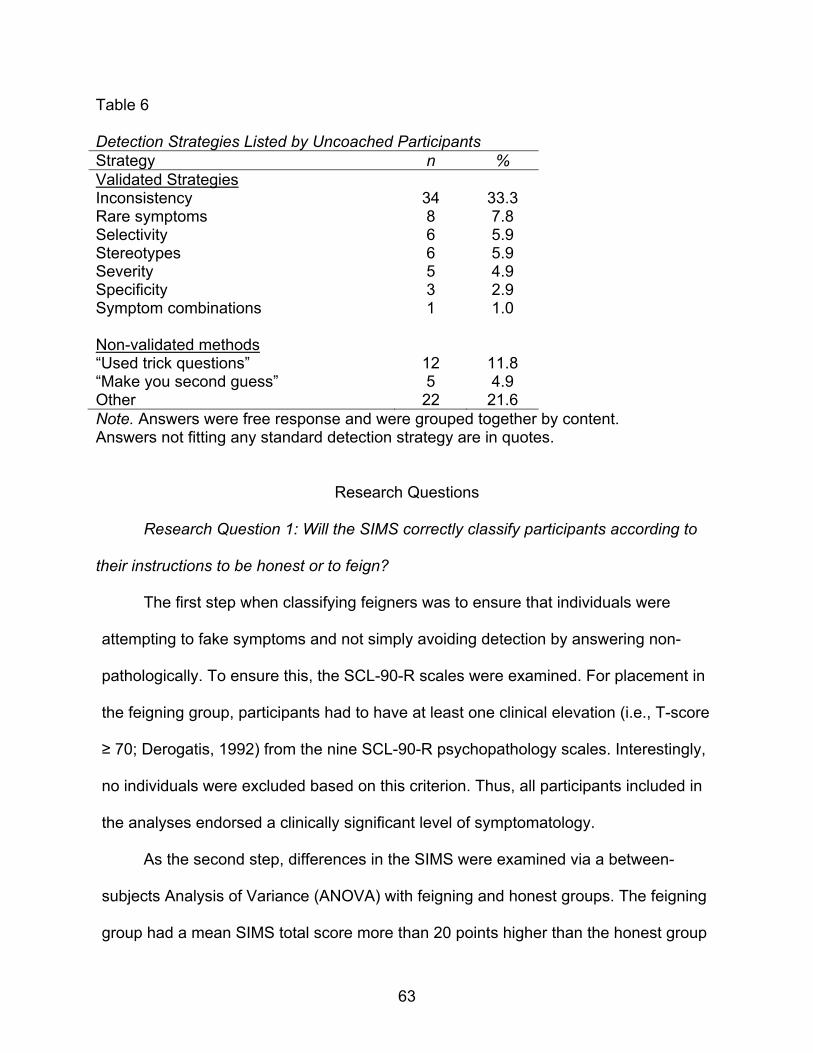
Table 6 Detection Strategies Listed by Uncoached Participants Strategy n % Validated Strategies Inconsistency 34 33.3 Rare symptoms 8 7.8 Selectivity 6 5.9 Stereotypes 6 5.9 Severity 5 4.9 Specificity 3 2.9 Symptom combinations 1 1.0 Non-validated methods “Used trick questions” 12 11.8 “Make you second guess” 5 4.9 Other 22 21.6 Note. Answers were free response and were grouped together by content. Answers not fitting any standard detection strategy are in quotes.
Research Questions
Research Question 1: Will the SIMS correctly classify participants according to
their instructions to be honest or to feign?
The first step when classifying feigners was to ensure that individuals were
attempting to fake symptoms and not simply avoiding detection by answering non-
pathologically. To ensure this, the SCL-90-R scales were examined. For placement in
the feigning group, participants had to have at least one clinical elevation (i.e., T-score
≥ 70; Derogatis, 1992) from the nine SCL-90-R psychopathology scales. Interestingly,
no individuals were excluded based on this criterion. Thus, all participants included in
the analyses endorsed a clinically significant level of symptomatology.
As the second step, differences in the SIMS were examined via a between-
subjects Analysis of Variance (ANOVA) with feigning and honest groups. The feigning
group had a mean SIMS total score more than 20 points higher than the honest group
63

(see Table 7), which resulted in a very large effect size (d = 1.58). Feigners scored
significantly higher on all of the SIMS subscales, with effect sizes ranging from 0.85 to
1.67.
While all SIMS scale scores followed the same basic pattern, the specific scale
elevations highlight the type of symptoms that feigners apparently found most relevant
to their task. The SIMS scale measuring feigned mood symptoms (AF) yielded the
highest scores and the largest effect sizes (d = 1.67), exceeding even the SIMS total
score. This very high effect size is partially the result of low variation in the feigning
group, indicating that mood disorder symptoms are feigned consistently. As a
comparison, feigners were much more variable (i.e., had a comparably large SD) in
their simulation of psychotic symptoms (P), leading to a lower effect size. In stark
contrast to these scales, the feigning group reported very few symptoms of cognitive
impairment (LI; d = 0.85). This type of impairment was likely not seen as germane to
the hypothetical situations in this study.
Table 7 SIMS Scale Scores by Response Style Condition Honest (n = 25) Feigning (n = 240) Scale M SD M SD F d NI 0.76 1.36 5.13 3.81 32.34 1.20 AF 4.00 2.04 8.41 2.70 62.56 1.67 P 0.52 0.65 5.21 4.73 24.49 1.04 LI 0.96 1.14 3.32 2.88 16.55 0.85 AM 0.88 1.09 5.33 4.56 23.62 1.02 Total 7.12 3.31 27.35 13.41 56.32 1.58 Note. NI = Neurological Impairment, AF = Affective Disorders, P = Psychosis, LI = Low Intelligence, AM = Amnesia, Total = SIMS Total Score. All F ratios are significant, p < .0001.
64

For Research Question 1, the central focus was on the accuracy of the SIMS
classification. As noted, Smith (2008) recommended a cut-score of ≥ 14 on the SIMS
Total Score for classifying feigners in college samples. Using this cut-score, most in the
honest group (24 or 96.0%) were classified correctly (see Table 8). Of those in the
simulation group, 197 (82.4%) were classified correctly as feigning, while 43 (17.6%)
were incorrectly classified as honest. Predictably, simulators were significantly more
likely that those in the honest group to be classified as feigning on the SIMS total score,
χ2 (1, N = 264) = 74.24, p < .001.
This study had a very high base rate (90%) due to the need for simulators in the
factorial design. This base rate affects positive and negative predictive power.
Therefore, we calculated utility estimates at a lower base-rate and included them in
Table 8. When base rate was reduced to the more realistic level of 20% that would likely
be found in forensic settings (Rogers, 2008a), Smith’s (2008) cut-scores for college
samples (≥14) and clinical samples (≥16) worked very well. Specifically, the standard
cut-score (i.e., ≥ 14) had excellent specificity and PPP, but lower sensitivity and NPP.
This pattern was even more pronounced at the ≥ 16 cut-score. Alternative cut-scores for
suspected feigning were investigated in an attempt to improve sensitivity and NPP.
Although this goal was accomplished, the negative effect on sensitivity and PPP was
substantial. Smith’s original suggestion of ≥ 14 was therefore supported.
Table 8 Utility Estimates Using SIMS Total Score 90% Base-Rate 20% Base-Rate
Cut score (≥) Sensitivity Specificity PPP NPP OCC PPP NPP OCC Standard 14 0.82 0.96 0.99 0.36 0.83 0.84 0.95 0.93
(table continues)
65

Table 8 (continued). 90% Base-Rate 20% Base-Rate
Note. PPP = Positive Predictive Power, NPP = Negative Predictive Power, OCC = Overall Classification Rate.
Cut score (≥) Sensitivity Specificity PPP NPP OCC PPP NPP OCC 16 0.78 1.00 1.00 0.32 0.80 1.00 0.95 0.96 Optimized 13 0.84 0.92 0.99 0.38 0.85 0.73 0.96 0.90 12 0.86 0.88 0.99 0.40 0.86 0.64 0.96 0.88 11 0.90 0.88 0.99 0.47 0.89 0.65 0.97 0.88
The clinical content of the SCL-90-R scales provided an opportunity to examine
what type of impairment simulators chose to feign. Using separate between-subjects
ANOVAs, simulators scored significantly higher than the honest group on all nine
clinical scales as well as the two global indexes (see Table 9). The feigning group had
scores that were an average of 33.68T higher on each scale, which indicated a
substantial change in endorsement. Those differences are reflected in the moderate to
large effect sizes (M d = 1.35, range from 0.96 to 1.67).
Clinical scale endorsements by the simulation groups show that anxiety,
psychosis, and interpersonal sensitivity exhibited the greatest differences (ds > 1.50).
Scales including depressive and phobic symptoms, as well as paranoia and hostility,
also produced large effect sizes (ds > 1.25). Given the nature of the scenarios in this
study, these constellations of symptoms appear to be the most relevant to feign. In
contrast, physical symptoms were less likely to be elevated by simulators. Beyond
individual scales, the number and severity of symptoms appeared to be hallmarks of
feigned presentations and produced very large effect sizes (i.e., d for GSI = 1.74, PST =
1.73).
66

Table 9 SCL-90-R T-Scores by Response Style Condition
_Honest (n = 25)_ Feigning (n = 240) M SD M SD F d
Scale SOM 53.57 10.77 72.40 20.17 21.10 0.96 O-C 61.51 9.87 82.86 17.22 37.06 1.27 I-S 64.05 14.89 96.74 22.33 48.85 1.50 DEP 61.82 17.51 89.31 21.03 39.85 1.33 ANX 55.66 17.21 103.60 29.71 60.56 1.67 HOS 60.56 13.88 95.73 29.25 33.99 1.25 PHOB 50.99 6.97 95.96 36.51 36.34 1.30 PAR 61.69 14.45 90.33 22.20 38.34 1.33 PSY 62.40 23.14 116.77 35.49 50.06 1.52
Indexes
GSI 61.91 14.73 100.50 22.41 67.06 1.74 PST 60.15 10.68 80.58 11.74 67.68 1.73 Note. SOM = Somatization, O-C = Obsessive-Compulsive, I-S = Interpersonal Sensitivity, DEP = Depression, ANX = Anxiety, HOS = Hostility, PHOB = Phobic Anxiety, PAR = Paranoid Ideation, PSY = Psychoticism, GSI = Global Severity Index, PST = Positive Symptom Total. All F ratios statistical significant at p < .0001.
Research Question 2: Will the familiarity of the scenario improve simulators’
ability to avoid detection of feigning on the SIMS?
Toward the goal of achieving ecological validity, the familiarity of the
experimental scenario has been posited to play a key role in motivating participants to
successfully feign disorders and concomitant impairment. For the current study, two
related facets were examined: (a) scenario’s effect on the clinical presentation of
symptoms, and (b) its impact on the capacity to avoid detection. Along with two other
variables, incentives and coaching, this was investigated using Factorial (2 X 3 X 2)
ANOVAs with all scales of the SCL-90-R and SIMS used as dependent variables.
67
Prior to examining differences in clinical presentation and detection avoidance, it
was important to investigate whether self-reported effort via manipulation check could
account for clinical differences. When asked directly about their level of effort during the
current study, no significant differences were found between familiar and unfamiliar
scenario groups using a five-point Likert-like rating scale, F(1,239) = 1.18, p =.28. The
mean effort scores for both groups were above four, indicating “good effort.” Put another
way, 89.20% of the familiar group and 84.20% of the unfamiliar group indicated at least
a good effort. Importantly, the high average score for both groups likely indicates the
presence of a ceiling effect.
The effects of familiarity on the SCL-90-R produced mixed results. Only three
scales, all pertaining to hostility and psychosis, were affected in the predicted direction.
Specifically, the unfamiliar group scored significantly higher on scales HOS, PAR, and
PSY with effect sizes ranging from 0.27 to 0.47. Unexpectedly, the familiar group scored
much higher (d = -0.52) on a scale measuring depression. However, given the nature of
the two scenarios, this constellation of findings fits well with the demands of each:
feigned depression when failing academically and feigned hostility and psychosis when
faced with a violent criminal charge. All other scales evidenced no significant
differences. However, many of these scales (e.g., those measuring obsessive-
compulsive or phobic symptoms) were not expected to be affected by the scenarios,
and the lack of significant differences reflects this.
68

Table 10 SIMS Scale Scores and SCL-90-R T-scores for the Familiar and Unfamiliar Simulation Groups Familiar (n = 120) Unfamiliar (n = 120) M SD M SD F dSIMS scales
Total 25.23 13.13 29.22 13.82 5.45* 0.30 NI 4.97 3.78 5.26 3.86 0.367 0.08 AF 7.92 2.60 8.61 3.13 4.51* 0.24 P 4.49 4.56 6.04 4.67 6.92** 0.34 LI 3.33 2.82 3.31 2.93 0.01 -0.01 AM 4.62 4.30 6.00 4.72 5.53* 0.31 SCL-90-R Scales
SOM 74.28 19.54 70.51 20.69 2.23 -0.19 O-C 84.70 17.12 81.02 17.20 2.93 -0.01 I-S 96.86 22.98 96.62 21.76 0.01 -0.21 DEP 94.62 20.65 84.01 20.13 16.83*** -0.52 ANX 104.23 30.83 102.98 28.66 0.11 -0.04 HOS 89.03 26.67 102.43 30.28 13.48*** 0.47 PHOB 97.23 39.66 94.69 33.18 0.30 -0.07 PAR 86.12 22.21 94.55 21.46 9.22*** 0.39 PSY 111.97 33.72 121.57 36.69 5.16* 0.27 SCL-90-R Indexes
GSI 101.44 21.57 99.57 23.28 0.45 -0.08 PST 80.85 11.98 80.31 11.54 0.12 0.05 Note. Positive effect sizes indicate a larger mean for the “unfamiliar” group. * p < .05, ** p < .01, ***p < .001
The type of scenario had a significant effect on the SIMS Total Score, with those
in the familiar scenario group achieving significantly lower scores (see Table 10). Based
on Cohen’s (1992) standards, the magnitude of this difference was moderate (d = .30).
At the subscale level, the familiar group scored lower on scales AF and P, which focus
on mental disorders, and AM, which measures feigned memory impairment. Scales AF
and P are of the most interest in the current study because they match more closely to
69
the type of impairment associated with the scenarios. These scales had effect sizes in
the low to moderate range (ds = .24 and .34), as did Scale AM (d = .31). The AM finding
suggests that amnesia may have been seen as a relevant impairment, especially in the
unfamiliar scenario involving violence, even though it was not specifically mentioned in
either scenario. Two other scales, addressing neurological impairment and low
intelligence, evidenced negligible differences (ds < .10).
In conclusion, scenario had a significant effect on a number of scales of both
feigning and general clinical measures. As expected, participants generally responded
more believably (i.e., with lower SIMS scores), when given a familiar scenario. This
trend held true especially when dealing with scales that measure severe
symptomatology, such as psychosis, and when dealing with hostility. However, there is
also evidence that familiarity is not always associated with lower scores, especially on
the SCL-90-R. Specifically, the depression scale was found to be higher in the familiar
group. This finding likely reflects the different scenario demands associated with the
academic situation compared to the crime scenario, rather than the degree of familiarity.
Research Question 3: Will coaching improve simulators’ ability to avoid detection
of feigning on the SIMS?
The effectiveness of detection strategy coaching has been demonstrated in
simulation studies and in real-world cases of feigning. Rather than study coaching in
isolation, this study investigated both the main effect and interactions it might have with
variations in scenario and incentives. Towards that goal, it was included in the same
factorial ANOVA used to test the role of the scenario in the previous research question.
70

As predicted, members of the coached group were more successful at feigning than
their uncoached counterparts (see Table 11).
The coached group scored lower on the SIMS Total score (d = .42) and all
individual scales except LI and AM. This lack of significance for LI and AM is not
surprising given that these two scales address the domain of cognitive feigning. As
stated by Rogers (2008b), detection strategies are domain specific; those used to detect
feigned mental disorders cannot typically be used to detect feigned cognitive
impairment. In the current study, the coaching warned participants of items based on
rare symptoms and rare combinations detection strategies. Therefore, it provided no
help for the cognitive detection strategies included on LI and AM, likely leading the
groups to have similar elevations on these scales.
Table 11 SIMS Scale Scores and SCL-90-R T-scores for Coached and Uncoached Simulation Groups Coached (n = 120) Uncoached (n = 120)
Scale M SD M SD F dSIMS Total 24.42 13.16 30.03 13.51 10.75*** 0.42 NI 4.38 3.43 5.84 4.04 9.16** 0.39 AF 7.63 2.53 8.90 3.09 11.98*** 0.45 P 4.46 4.56 6.08 4.65 7.52** 0.35 LI 3.10 3.06 3.54 2.67 1.41 0.15 AM 4.84 4.57 5.79 4.52 2.63 0.21 SCL-90-R Scales
SOM 68.20 19.08 76.60 20.43 11.07*** 0.42 O-C 78.26 16.57 87.46 16.69 18.24*** 0.49 I-S 91.40 22.52 102.08 20.90 14.62*** 0.55 DEP 85.19 21.98 93.44 19.26 10.18** 0.40 ANX 98.82 30.14 108.38 28.60 6.20** 0.33 HOS 91.11 30.16 100.35 27.68 6.40** 0.32
(table continues)
71

Table 11 (continued). Coached (n = 120) Uncoached (n = 120)
Scale M SD M SD F dPHOB 88.47 36.08 103.45 35.53 10.45*** 0.42 PAR 85.58 22.81 95.08 20.59 11.72*** 0.44 PSY 103.37 34.61 130.17 31.14 40.25*** 0.81 SCL-90-R Indexes
GSI 93.76 21.28 107.25 21.55 23.41*** 0.63 PST 77.32 12.00 83.84 10.56 19.98*** 0.58 Note. Positive effect sizes indicate a larger uncoached group mean. * p<.05, ** p<.01, ***p<.001
The SCL-90-R scales followed the same pattern as the majority of SIMS scales,
with the coached group feigning more successfully on all scales. This pattern was seen
in the predominately moderate effect sizes (d = .35 to .55), while one SCL-90-R scale
(PSY) and the two impairment indexes showed greater differentiation between the
groups (d = .58 to .81). It is very interesting that the clinical scales of the SCL-90-R were
equally, if not more affected by coaching when compared to the SIMS because the
SCL-90-R scales do not make use of any detection strategies. This result may imply
that many participants believed that the symptoms found on the clinical scales were rare
or unbelievable when in fact they were not intended to be. However, the results could
also indicate that coached participants exercised greater caution generally.
The critical issue in coaching studies is whether it allows more feigners to elude
detection. For this comparison, false negative rate (i.e., 1 – sensitivity) is the most
appropriate utility estimate. The coached group, with a false negative rate of 0.14,
improved only marginally (χ2 (N = 240, 1) = 1.04, p = .31) over the uncoached group,
with a false negative rate of 0.21. This lack of a significant difference indicates that
72

although scale and T-scores differed between groups, this did not lead to a change in
classification accuracy.
Coached feigning has been extensively researched but never in combination with
familiarity of the scenario or the type of incentive. It was hypothesized that the combined
effect of the variables would be above those of each alone. However, only one
significant interaction effect was found between coaching and scenario on the NI
(Neurological Impairment) scale of the SIMS. Specifically, under the familiar scenario,
the coached and uncoached groups performed similarly (M difference = .33), but when
given the unfamiliar scenario, coached participants scored much lower, while
uncoached participants’ scores were raised (M difference = 2.58). Across all other
scales, coached participants performed better (i.e., their scores decreased), regardless
of the type of scenario or incentive they received. The meaning of this interaction is
difficult to determine because it occurred on only one scale, which measured
impairment not emphasized in this study.
Research Question 4: Will the type of incentive affect simulators’ ability to avoid
detection of feigning on the SIMS?
The role that external incentives play in malingering is contained in the very
definition of malingering. Via a between-subjects ANOVA, the effects of incentives were
investigated with three levels: positive only, negative only, and both positive and
negative. Because more than two levels of incentive were used, post hoc analyses
using Bonferroni corrections were also applied. Unexpectedly, incentive level did not
have a significant effect on any of the SIMS or SCL-90-R scales (Table 12). Even the
“both” group did not produce any appreciable effect over either of the single incentive
73

conditions. Beyond non-significance, the effect sizes for the SIMS yielded negligible
differences; for example, ds between positive and negative averaged 0.08, with a range
from -0.14 to 0.06.
Table 12 The Effects of Incentives on Feigning Ability Positive (n = 80) Negative (n = 80) Both (n = 80) Scale M SD M SD M SD F dSIMS Total 27.64 12.74 26.91 15.11 27.11 12.99 0.06 -0.05 NI 4.93 3.64 5.14 4.05 5.28 3.78 0.18 0.06 AF 8.46 2.51 8.20 3.52 8.14 2.54 0.29 -0.08 P 5.54 4.85 5.19 4.88 5.08 4.30 0.22 -0.07 LI 3.31 2.66 3.45 3.26 3.20 2.69 0.15 0.05 AM 5.58 4.50 4.94 4.70 5.43 4.51 0.44 -0.14 SCL-90-R Scales
SOM 71.04 18.41 70.40 19.69 75.75 22.06 1.79 -0.03 O-C 82.25 17.24 83.58 16.83 82.75 17.78 0.13 -0.23 I-S 99.37 23.15 94.10 22.26 96.77 21.52 1.19 0.08 DEP 92.34 21.13 87.25 20.26 88.34 21.61 1.43 -0.25 ANX 104.69 30.38 103.19 30.27 102.93 28.79 0.08 -0.05 HOS 95.21 27.12 95.73 31.80 96.25 29.02 0.03 0.02 PHOB 95.63 34.87 96.44 40.41 95.81 34.39 0.01 0.02 PAR 91.18 22.70 89.05 23.27 90.76 20.76 0.22 -0.09 PSY 118.25 34.89 113.35 37.31 118.70 34.39 0.66 -0.14 SCL-90-R Indexes
GSI 101.40 21.51 99.01 23.70 101.11 22.18 0.29 -0.10 PST 81.04 11.06 79.64 11.87 81.05 12.36 0.38 -0.12 Note. None of the F ratios reached statistical significance. Cohen’s d calculated between the positive vs. negative incentive groups. The level of incentive had virtually no effect on the SIMS scales, with no group
achieving a mean difference over 0.73 (range 0.06 to 0.73 on a score range from 0 to
15; see Appendix J). Similarly, on the SCL-90-R scales, no incentive group pairing had
a mean difference score over 5.35T. Unexpectedly, the group receiving both incentives
did not exhibit any additive effects.
74

Like scenarios, the most critical analysis involves feigners’ success at eluding
detection depending on the type of incentive. Despite low effect sizes and similar mean
scores, the negative incentive group was able to avoid detection more often than the
other two groups. Specifically, the negative group had a false negative rate of 0.24,
while those of the other two groups were 0.15 and 0.14, respectively (χ2 (N = 240, 2) =
3.25, p <.05). To achieve mean scores that are almost equal yet avoid detection more
often, two things must occur. First and most obviously, more negative group participants
were below the cut score. Second, since more people were below the cut score, others
must have been high above it to balance out the mean and make it similar to that of the
positive incentive group. This is also reflected in the higher SD for the negative group on
most scales. Taken together, this implies that the negative incentives were helpful and
motivating for some, while others ignored those consequences and feigned in a very
unbelievable (i.e., detectable) way. It is difficult to determine which individuals found the
negative incentives to be motivating; there were no demographic or background
characteristics that predicted these scores.
Research Question 5: What are the relative contributions of coaching, incentive,
and scenario to differences in SIMS Total scores?
Research on methodological issues has traditionally focused on individual
effects; the current study afforded an opportunity to compare across variables. The
relative contributions of coaching, incentive, and scenario were investigated with the
hope of giving future researchers guidance on which instructions to emphasize most
heavily. Coaching has been found in the past to have a moderate to large effect on
feigning scores and was therefore correctly predicted to have the largest effect in the
75

current study. However, while it was predicted that incentive would have a larger effect
than scenario, the results support the opposite conclusion. On the SIMS total score, the
d between coaching groups was 0.42, while it was 0.30 for scenario, and 0.05 for
incentive type. This same pattern was found for all SIMS subscales; the average d for
coaching was 0.32, 0.21 for scenario, and 0.04 for incentive.
A limitation of this analysis is that the type of levels used for each variable do not
allow for a comparison of the relative contributions of each. The effect size for each
component, to be truly comparable, would need to be between the presence and
absence of that component rather than between varied levels of each component.
Fortunately, this does not negate any of the other findings. We already knew that
including a scenario, an incentive, and coaching would be helpful and the current study
had the purpose of deciding how these variables are best used. Researchers should not
conclude that scenario is more important that incentives, simply that familiar scenarios
are more effective that unfamiliar, while positive and negative incentives may have
similar effects to one another.
Supplementary Research Questions
Supplementary Question 1: Which SCL-90-R scales will be the most often
elevated in the feigning condition?
Determining simulators’ choices of disorders has the potential to guide future
scale content and to enhance our understanding of the perceived “feignability” of
different disorders. Studies have rarely investigated what disorders are chosen most
often. To answer this, the frequency of clinical elevations on each scale were analyzed
(see Table 13). Overall, participants elevated the Psychoticism scale most often
76
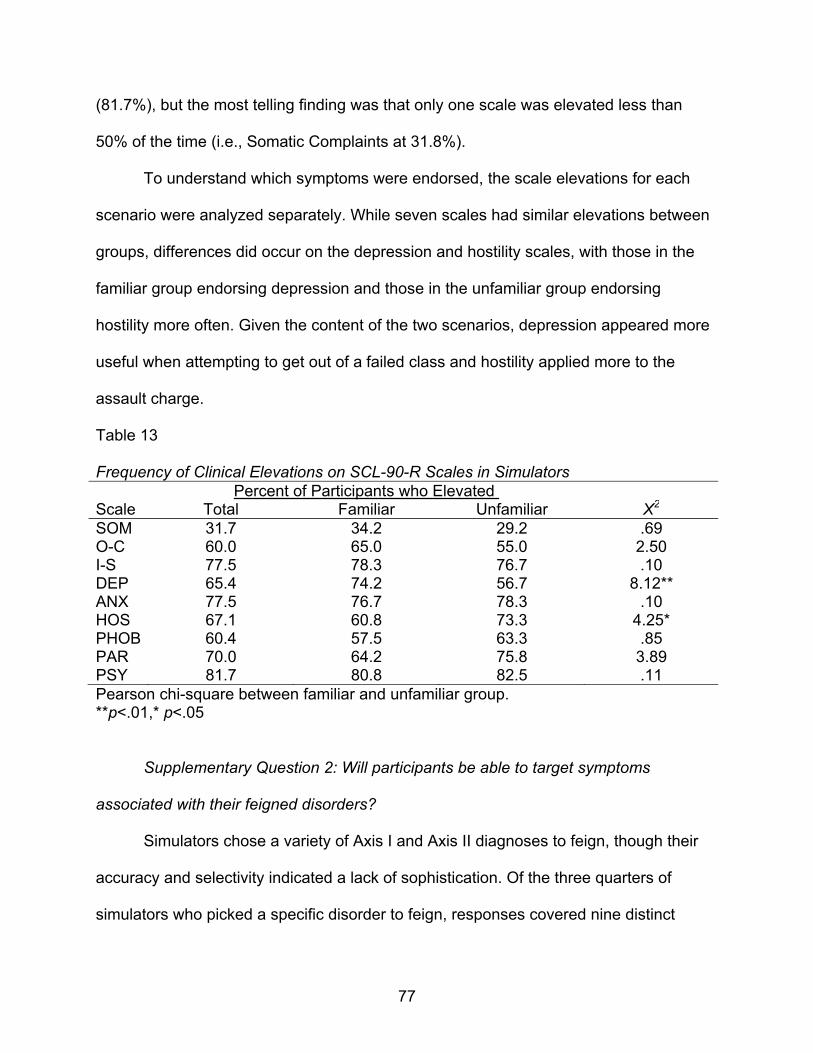
(81.7%), but the most telling finding was that only one scale was elevated less than
50% of the time (i.e., Somatic Complaints at 31.8%).
To understand which symptoms were endorsed, the scale elevations for each
scenario were analyzed separately. While seven scales had similar elevations between
groups, differences did occur on the depression and hostility scales, with those in the
familiar group endorsing depression and those in the unfamiliar group endorsing
hostility more often. Given the content of the two scenarios, depression appeared more
useful when attempting to get out of a failed class and hostility applied more to the
assault charge.
Table 13 Frequency of Clinical Elevations on SCL-90-R Scales in Simulators Percent of Participants who Elevated Scale Total Familiar Unfamiliar Χ2
SOM 31.7 34.2 29.2 .69 O-C 60.0 65.0 55.0 2.50 I-S 77.5 78.3 76.7 .10 DEP 65.4 74.2 56.7 8.12** ANX 77.5 76.7 78.3 .10 HOS 67.1 60.8 73.3 4.25* PHOB 60.4 57.5 63.3 .85 PAR 70.0 64.2 75.8 3.89 PSY 81.7 80.8 82.5 .11 Pearson chi-square between familiar and unfamiliar group. **p<.01,* p<.05
Supplementary Question 2: Will participants be able to target symptoms
associated with their feigned disorders?
Simulators chose a variety of Axis I and Axis II diagnoses to feign, though their
accuracy and selectivity indicated a lack of sophistication. Of the three quarters of
simulators who picked a specific disorder to feign, responses covered nine distinct
77
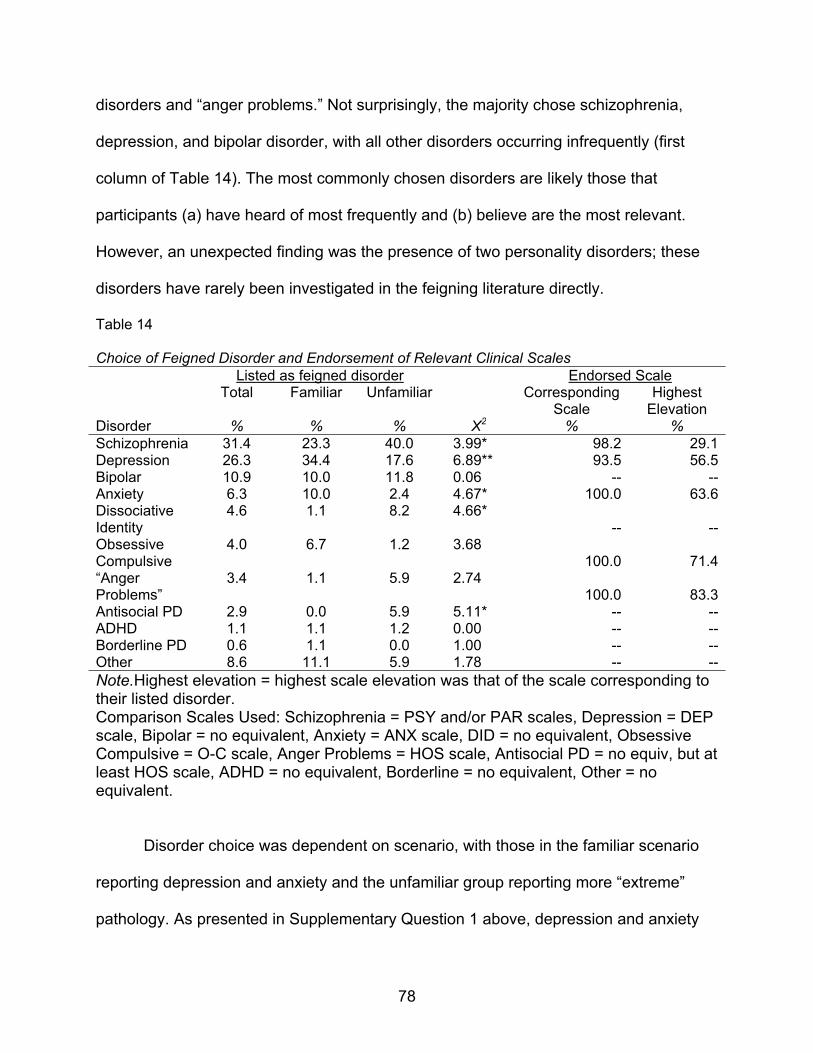
disorders and “anger problems.” Not surprisingly, the majority chose schizophrenia,
depression, and bipolar disorder, with all other disorders occurring infrequently (first
column of Table 14). The most commonly chosen disorders are likely those that
participants (a) have heard of most frequently and (b) believe are the most relevant.
However, an unexpected finding was the presence of two personality disorders; these
disorders have rarely been investigated in the feigning literature directly.
Table 14 Choice of Feigned Disorder and Endorsement of Relevant Clinical Scales Listed as feigned disorder Endorsed Scale
Total Familiar Unfamiliar Corresponding Scale
Highest Elevation
Disorder % % % X2 % % Schizophrenia 31.4 23.3 40.0 3.99* 98.2 29.1Depression 26.3 34.4 17.6 6.89** 93.5 56.5Bipolar 10.9 10.0 11.8 0.06 -- --Anxiety 6.3 10.0 2.4 4.67* 100.0 63.6Dissociative Identity
4.6 1.1 8.2 4.66* -- --
Obsessive Compulsive
4.0 6.7 1.2 3.68 100.0 71.4
“Anger Problems”
3.4 1.1 5.9 2.74 100.0 83.3
Antisocial PD 2.9 0.0 5.9 5.11* -- --ADHD 1.1 1.1 1.2 0.00 -- --Borderline PD 0.6 1.1 0.0 1.00 -- --Other 8.6 11.1 5.9 1.78 -- --Note.Highest elevation = highest scale elevation was that of the scale corresponding to their listed disorder. Comparison Scales Used: Schizophrenia = PSY and/or PAR scales, Depression = DEP scale, Bipolar = no equivalent, Anxiety = ANX scale, DID = no equivalent, Obsessive Compulsive = O-C scale, Anger Problems = HOS scale, Antisocial PD = no equiv, but at least HOS scale, ADHD = no equivalent, Borderline = no equivalent, Other = no equivalent.
Disorder choice was dependent on scenario, with those in the familiar scenario
reporting depression and anxiety and the unfamiliar group reporting more “extreme”
pathology. As presented in Supplementary Question 1 above, depression and anxiety
78

were reported most often by the familiar group (Table 14) and subsequently, DEP was
the only scale elevated significantly more often by that same group (Table 13). In other
words, the disorder picked ahead of time was also the most often elevated. For the
unfamiliar group, the Hostility scale was elevated most often, while schizophrenia,
dissociative identity disorder, and antisocial personality disorder were listed most often
by the same group. It is clear that the unfamiliar group participants picked disorders
commonly thought to be the most impairing or dangerous.
Simulators often feigned in a nonspecific way, endorsing many symptoms in
addition to those of their listed disorder. While almost all (93.5% – 100.0%) were able to
elevate the corresponding scale, fewer than half (47.2%) had their highest elevation on
the correct scale. In addition, the sheer number of elevations per person (M = 5.68;
Table 15) was very high. However, it should be noted that the SCL-90-R is not intended
to be a diagnostic measure and assesses constellations of general distress (Caprarros-
Caparros, Villar-Hoz, Juan-Ferrer, & Vinas-Posh, 2007). Due to strong interdependency
among its scales, the number of scale elevations shows only that many feigners
endorse a wide variety of symptoms, many of which have little to do with the disorder
they are attempting to feign.
Table 15 Number and Type of Scale Elevations for Each Feigned Disorder Participants Elevating Each Scale
Feigned Disorder
Elevated scales SOM O-C I-S DEP ANX HOS PHOB PAR PSY
M (SD) % % % % % % % % % Schizophrenia 6.38
(2.11) 29.1 49.1 74.5 56.4 94.5 70.9 83.6 85.5 94.5
Depression 5.74 (2.59)
32.6 58.7 84.8 93.5 58.7 63.0 39.1 65.2 78.3
(table continues)
79
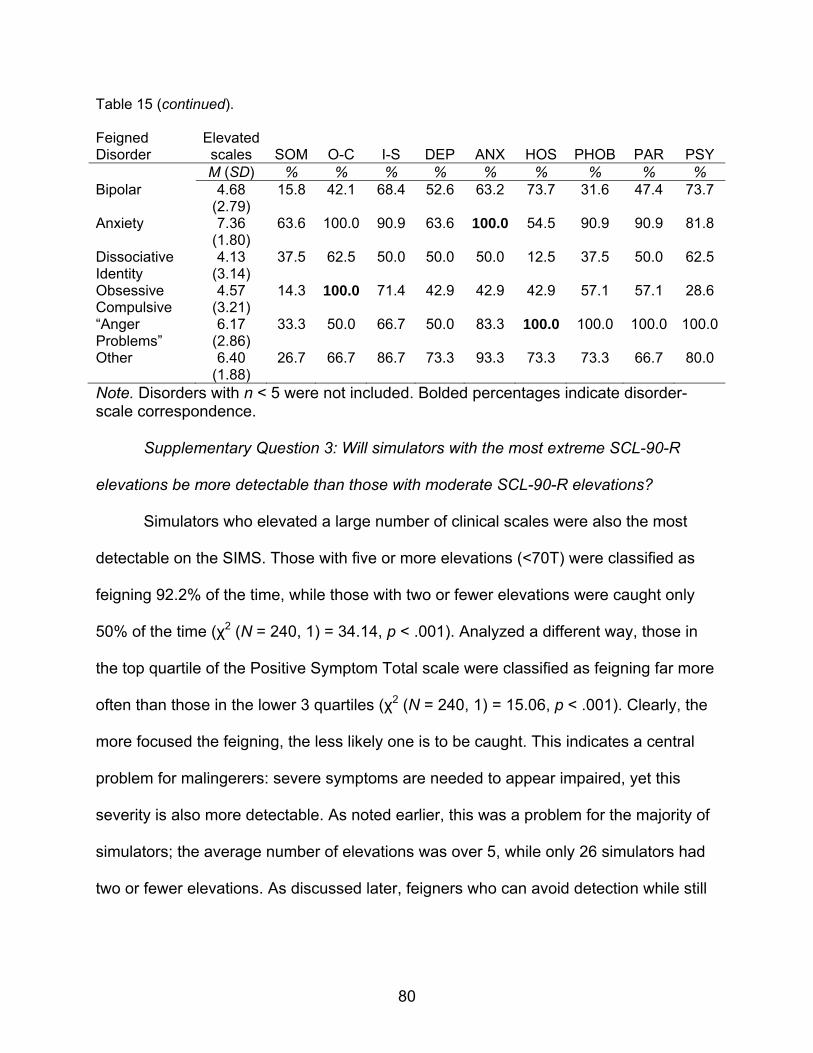
Table 15 (continued). Feigned Disorder
Elevated scales SOM O-C I-S DEP ANX HOS PHOB PAR PSY
M (SD) % % % % % % % % % Bipolar 4.68
(2.79) 15.8 42.1 68.4 52.6 63.2 73.7 31.6 47.4 73.7
Anxiety 7.36 (1.80)
63.6 100.0 90.9 63.6 100.0 54.5 90.9 90.9 81.8
Dissociative Identity
4.13 (3.14)
37.5 62.5 50.0 50.0 50.0 12.5 37.5 50.0 62.5
Obsessive Compulsive
4.57 (3.21)
14.3 100.0 71.4 42.9 42.9 42.9 57.1 57.1 28.6
“Anger Problems”
6.17 (2.86)
33.3 50.0 66.7 50.0 83.3 100.0 100.0 100.0 100.0
Other 6.40 (1.88)
26.7 66.7 86.7 73.3 93.3 73.3 73.3 66.7 80.0
Note. Disorders with n < 5 were not included. Bolded percentages indicate disorder-scale correspondence.
Supplementary Question 3: Will simulators with the most extreme SCL-90-R
elevations be more detectable than those with moderate SCL-90-R elevations?
Simulators who elevated a large number of clinical scales were also the most
detectable on the SIMS. Those with five or more elevations (<70T) were classified as
feigning 92.2% of the time, while those with two or fewer elevations were caught only
50% of the time (χ2 (N = 240, 1) = 34.14, p < .001). Analyzed a different way, those in
the top quartile of the Positive Symptom Total scale were classified as feigning far more
often than those in the lower 3 quartiles (χ2 (N = 240, 1) = 15.06, p < .001). Clearly, the
more focused the feigning, the less likely one is to be caught. This indicates a central
problem for malingerers: severe symptoms are needed to appear impaired, yet this
severity is also more detectable. As noted earlier, this was a problem for the majority of
simulators; the average number of elevations was over 5, while only 26 simulators had
two or fewer elevations. As discussed later, feigners who can avoid detection while still
80

81
raising one or more clinical scales past standard impairment levels are the most
successful.

CHAPTER 4
DISCUSSION
Psychological assessments and subsequent treatments are built on the
presumption of accurate reporting, making it critically important to ensure that clients’
are as forthright as possible. However, clinicians have long recognized that naively
assuming the accuracy of clients’ self-reports is untenable in most professional settings.
This recognition does not indicate a widespread distrust of patients as much as a
realization that less-than-genuine responses can occur for a wide variety of deliberate
and unintentional reasons (Rogers, 2008a). As a classic example, this realization is
reflected in the interpretation rules for the Minnesota Multiphasic Personality Inventory
(MMPI) and MMPI-2. Before any clinical scales are examined, the validity of the
protocol must be considered in terms of omissions, consistency and accuracy (Greene,
2000, p. 43). Other clinical measures, especially multiscale inventories, also consider
these same issues. Evaluation of validity scales constitute a necessary first step prior to
any clinical interpretations.
Malingering represents one inaccurate response style and involves conscious
exaggeration or fabrication when motivated by external incentives (APA, 2000). It has
been found to occur in almost all professional settings with varying frequencies;
therefore, the assessment of malingering is recommended in most clinical contexts.
Moreover, its evaluation is essential in forensic and correctional settings where (a) the
incentives may be much greater and (b) the consequences of classification errors are
more severe. As noted in the Introduction, past research has shown that adversarial
settings with the potential for high gain or loss typically have higher rates of malingering
82

than the general clinical population (Bianchini, Curtis, & Greves, 2006; Binder, 1993;
Mittenburg et al., 2002; Rogers, 1997).
In the assessment of malingering, validity scales must find a way to address two
types of inaccuracies: (a) missed malingerers, and (b) misclassified malingerers. Missed
malingerers, those who are mistakenly classified as genuinely disordered clients, may
avoid punishment or gain rewards that are a burden on the system (e.g., disability
payments). Misclassified malingerers endure unjustified consequences as well; they are
often denied needed treatment or sanctioned further for their “attempted” malingering.
Misclassification deprives those with genuine disorders of help, creates long-lasting
social stigma that will follow them in future professional services, and can even lead to
unjust punishment.
The misclassification of genuine patients is not simply an academic interest.
Recent research supports the position that misclassifications can happen easily even
with modern assessment measures. While the exact number of falsely accused
malingerers in forensic cases is difficult to determine, Rogers and colleagues (2003)
found extreme elevations for genuine patients diagnosed with schizophrenia, PTSD,
and major depression on the F scale of the MMPI-2 when scoring just one standard
deviation above the normative mean. Such extreme scores indicate that a substantial
number of genuine patients with these disorders are likely to be misclassified as
feigners. Other researchers have obtained similar results. For example, Elhai, Frueh,
Davis, Jacobs, and Hammer (2003) found that PTSD-diagnosed veterans were likely to
be seen as having invalid profiles. Thus, the goal of developing better feigning
83

measures is not only to accurately classify feigners, but also to lower the number of
false alarms.
The research to accomplish this goal of increased accuracy has evolved over
time and includes many different factors. This evolution includes major developments
such as new research designs and the use of relevant clinical comparison samples.
Among these changes are methodological advances to increase ecological validity,
such as the ones included in this thesis.
Research Design and Malingering
Methods for the detection of feigning have progressed over the last century from
case studies to standardized measures with demonstrable validity (Rogers & Correa,
2008). Starting in the early 1800s, attempts to identify malingerers relied heavily on
case studies that were of dubious quality with questionable generalizability (Geller et al.,
1990). Despite their unsophisticated methodology, their conceptualization of
malingering detection was both original and insightful. For instance, an 1843 paper on
the detection of “feigned and factitious diseases of soldiers and seamen” gave “hints
and rules for the detection of impostors” (Gavin, 1843, p. 1). While giving no
standardized criteria, four of Gavin’s five “hints” have modern parallels with the SIRS
primary scales, while the fifth hint corresponds to a supplementary scale.
Gavin’s seminal contribution also comes remarkably close to the DSM-IV-TR
“screening criteria” for malingering by listing three of the four conditions for strongly
suspecting the presence of malingering. Specifically, Gavin lists indicators that parallel
the presence of a medicolegal context, a marked discrepancy in claimed distress and
objective findings, and a lack of cooperation. Of those listed in DSM-IV-TR, he omits
84

only the idea of antisocial personality disorder (Gavin, 1843). This omission could be
explained by his primary sample: soldiers who wish to avoid military service, which
differs from a typical forensic sample. As noted, Gavin’s contributions are conceptual in
nature; the methodology of his time was based on case studies with their inherent
limitations (Borum, Otto, & Golding, 1993; Rogers, 1997; Rogers & Correa, 2008; see
also the Introduction chapter for a further discussion on these points).
The development of the MMPI in 1940 ushered in a new wave of measures using
group differences to evaluate response styles, including the assessment of feigning. In
a major departure from case studies, scale items were chosen with the main criteria of
differentiating groups, an approach described as empirical keying. While problems with
the original MMPI became obvious over the years, especially with its exclusive reliance
on empirical keying and absence of conceptually-based scales (Ben-Porath & Tellegan,
2008), its systematic use of group differences signified a watershed in the validation of
feigning measures. Importantly, it avoided reliance on single case studies, with
unknown generalizability to wider populations. It also adeptly side-stepped frequent
misuses of common characteristics as discriminating characteristics (see Introduction).
The MMPI-2 continues to be the most often-used measure for feigning (Lally, 2003),
and its popularity has led to the development of other multiscale and feigning-specific
measures.
Researchers have recognized an inherent conceptual problem with traditional
feigning scales that focus on empirical keying. Starting in the 1980s, researchers began
to turn their attention to the validation of specific detection strategies (Rogers, 1984).
Until this time, group differences were exclusively emphasized, with success focused on
85

individual scales and measured by statistical significance and, to a lesser extent, effect
sizes (Rogers & Correa, 2008). With detection strategies, the emphasis could be placed
on the common strategies used across scales instead of relying on particular scales
themselves. This improvement opened the way for the development of effective
strategies and the differentiation of strategies across the varying malingering domains
(see the Introduction chapter for a discussion of domains). Many of these strategies
were first recognized over a century ago (see Gavin, 1843); but they are now being
implemented with strong conceptual and empirical underpinnings.
Improved methods for evaluating detection strategies relied on four basic designs
(i.e., known-groups comparisons, differential prevalence, simulation, and bootstrap
comparisons). Of these options, simulation design has dominated malingering research
for over fifty years in the creation and validation of feigning scales. This design has
been used since around the beginning of standardized testing, with the earliest
published example occurring more than six decades ago (see Goldstein, 1944). As
evidence of its predominant use, a recent count of validation studies of the Structured
Interview of Reported Symptoms (SIRS; Rogers, Sewell, & Gillard, 2010) found that 18
of the 22 group difference studies used simulation design.3 However, despite this,
known groups and bootstrap designs have also played an essential role in feigning
research. A detailed analysis of the strengths and weaknesses of these design options
can be found by Rogers (2008) and the Research Design section of this thesis.
Comparison of Designs
Simulation and known-groups comparison designs have been investigated using
the same feigning measure and clinical comparison groups in a handful of studies.
86
While cross-study comparisons are difficult due to methodological and scale
development differences, each study provides an excellent internal comparison
between simulators and suspected malingerers.
As the first example, Gillis, Rogers, and Bagby (1991) investigated the use of the
M-Test in a clinical setting using both simulation and known-groups design (i.e.,
simulators and suspected malingerers). Across the three feigning scales of the M-Test,
the average Cohen’s d effect size was 1.40 for simulators, while the comparison
between suspected malingerers and the same honest inpatients was significantly lower
(M d = .80). Although this is the only direct comparison using the M-Test in this manner,
it suggests that real-world, suspected malingerers respond more carefully than
simulators.
One additional study (Gothard, Rogers, & Sewell, 1995) used a similar design to
Gillis, Rogers, and Babgy (1991) and provided similar results: simulators scored higher
than suspected malingerers did on most feigning scales on the SIRS. Specifically,
simulators scored higher than suspected malingerers did when compared to a group of
genuine responders (M d = 2.21 and 2.01, respectively). In another comparison of the
SIRS, a group of the test’s original validation studies (Rogers, Gillis, & Bagby, 1990;
Rogers, Gillis, Bagby, & Monteiro, 1991; Rogers, Gillis, Dickens, & Bagby, 1991;
Rogers, Kropp, Bagby, & Dickens, 1992) found that across primary scales, the mean d
was almost identical between the two comparisons. Differences in either direction
depended on the specific scale. This final finding may reflect the fact that the SIRS was
validated using both research designs, leading to a more balanced set of scores.
87

Taken together, two of the three groups of past studies indicate that simulators
obtained more extreme scores than known malingerers, while the third had mixed
scores that resulted in no difference on average. These studies highlight two important
facts. First, simulators often do not respond in the same way as “known” malingerers.
Second, the designs used to validate a measure’s cut scores can greatly affect that
test’s accuracy in later studies. As noted, the SIRS was validated with both designs and
is generally considered one of the best feigning measures available. On the other hand,
the M-Test has more obvious items and the known-groups design was a more effective
test of its utility. While this teaches us that we must work to improve the validity of
simulation design, it also indicates a need to use multiple designs during validation.
Ecological Validity of the Simulation Design
Simulation design for malingering research allows for excellent internal validity,
but its ecological validity has been questioned for many years (Haines & Norris, 1995;
Rogers et al., 1992). As a major example, most early studies, and some current
research, use non-clinical samples of convenience (Brennan & Gouvier, 2006).
However, this approach represents a methodological problem. The most relevant
comparison group is a clinical sample, allowing for the direct comparison of simulated
mental disorders to genuine mental disorders (Rogers, 1997).
While this is an important improvement, it still does not address another relevant
concern briefly outlined in the previous section: Do simulated feigners respond in the
same way, or with the same sustained motivation, as feigners in the real world?
Researchers have taken important steps to address this concern, namely the use of
instructions to make the situation more relevant and motivating to the participant
88

(Rogers, 2008c). But what types of instructions are needed, and exactly what should
they say? Very few studies (i.e., Rogers & Cruise, 1998; Merckelbach, Smeets, &
Jelicic, 2009) have examined the actual effect that instructional changes have on test
results.
Role of Scenario
Simulation design creates an inherently difficult situation that was first defined by
Rogers and Cavanaugh (1983, p. 447) as the simulation malingering paradox;
specifically, “individuals are asked to comply with instructions to fake to study those who
fake when asked to comply.” This situation is quite different from that of a true
malingerer, creating a major threat to external validity. To take an example from the
deception literature, Miller and Stiff (1993) point out that the reason for lying during most
deception experiments is to satisfy the requirements of the study. Since this type of
lying is requested by the experimenter, it is called sanctioned lying. Feeley and DeTurck
(1998) point out that people lie for a multitude of reasons in real life without being
prompted. These prevarications are considered unsanctioned lies and the reasons for
telling these types of lies differ greatly from sanctioned lying. Comparisons between the
two types of lying show significant differences in the verbal and nonverbal behaviors
that participants exhibit during questioning (see Feeley & DeTurck, 1998).
The Feeley and DeTurck (1998) findings underscore the general point that
asking someone to deceive is not the same as when someone deceives for self-
motivated reasons. Similar differences to those found between sanctioned and
unsanctioned lying may be present in malingering research as well. Like the deception
studies, malingering research using simulation design is conducted in a laboratory
89

setting; therefore, participants have no true reason to feign other than being told to do
so (i.e., sanctioned deception). Absent is a situational motivation to feign. Rogers
(2008c) noted that this lack of motivation could lead to poor effort, a hypothesis that fits
well with the adaptational model (Rogers & Cavanaugh, 1983), which postulates that
malingering is largely motivated by the presence of both difficult circumstances and
valuable incentives. If we use the adaptational model, we cannot blithely assume that
someone will feign adequately or believably without some extrinsic motivation.
Early studies of malingering placed little or no emphasis on participant
investment or externally-relevant scenarios in the simulation condition. Instead,
instructions were used simply to express the idea of malingering, with a statement to
“fake,” and no further elaboration. As a rare exception, Crowley (1952) sought to
motivate college students with a scenario in which they must avoid being drafted into
the military by feigning “feeblemindedness.” Given that the Korean War began in 1950,
this scenario was an excellent, and relevant, attempt to increase external validity.
More recently, simulation studies have attempted to engage and motivate
simulators by providing familiar scenarios for the sample in question. The scenarios
have covered broad domains including civil and criminal cases, insurance and disability
compensation, treatment access, and academic failure. The SIRS provides an excellent
illustration of this diversity, with 18 simulation investigations that provided a scenario
description (Rogers, Sewell, & Gillard, 2010). Summarized in Table 16, the majority of
simulation studies of the SIRS have been conducted in forensic or correctional settings,
and 84% used forensically-relevant scenarios. Studies using academic and clinical
samples have also used applicable scenarios, while those conducted in community
90

settings have generally used inapplicable scenarios or no scenarios. This set of studies
illustrates two important points. First, a variety of scenarios are available that can easily
be adapted to a given sample. Second, scenarios that are relevant to reality as well as
familiar and motivating are easier to enact for forensic and correctional samples.
However, even in community settings, where relevant scenarios are more difficult to
choose, scenarios can still provide increased motivation. Studies should always include
scenarios that are as relevant and motivating as possible.
Table 16 Scenarios Used in Simulation Studies of the SIRS Study Sample type for
Simulators Scenario description
Rogers et al. (1990)
Correctional Move to harsher unit in prison unless seen as impaired.
Rogers et al. (1991a)
College Expulsion from college for failing unless mentally disordered.
Rogers (1991b) Community No scenario reported in article. Cornell (1991) Correctional Not Guilty by Reason of Insanity or incompetence
plea to avoid trial for serious crime. No specific charge given.
Kropp (1992) Forensic Same as Rogers et al. (1990). Kurtz (1992) Forensic/
Correctional Move to a hospital that has good treatment, recreation and education options if seen as “insane” or “crazy.”
Rogers et al. (1992)
Forensic No scenario reported in article. Instructed to feign one of three disorders.
Linblad (1993) Forensic Serious criminal charge, must “look crazy” to avoid conviction.
Gothard et al. (1995)
Forensic/ Correctional
Serious criminal charge, want to look incompetent to stand trial.
Rogers et al. (1996)
Correctional No scenario reported, description of disorders only.
Pollock (1998) Correctional Open ended, but given example – try to appear mentally disordered to be transferred to hospital.
Goodness (1999) Forensic Modified from Rogers et al., 1990 – while in prison, allowed to go home or to hospital if found legally insane at time of crime.
(table continues)
91
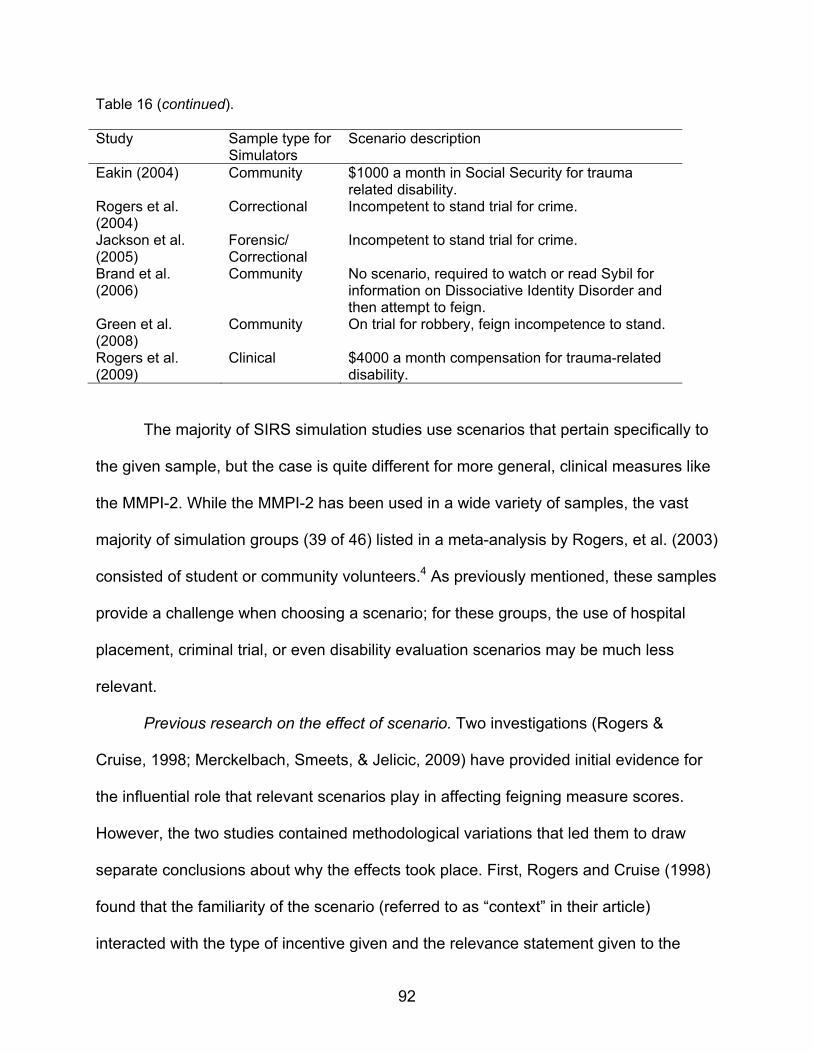
Table 16 (continued). Study Sample type for
Simulators Scenario description
Eakin (2004) Community $1000 a month in Social Security for trauma related disability.
Rogers et al. (2004)
Correctional Incompetent to stand trial for crime.
Jackson et al. (2005)
Forensic/ Correctional
Incompetent to stand trial for crime.
Brand et al. (2006)
Community No scenario, required to watch or read Sybil for information on Dissociative Identity Disorder and then attempt to feign.
Green et al. (2008)
Community On trial for robbery, feign incompetence to stand.
Rogers et al. (2009)
Clinical $4000 a month compensation for trauma-related disability.
The majority of SIRS simulation studies use scenarios that pertain specifically to
the given sample, but the case is quite different for more general, clinical measures like
the MMPI-2. While the MMPI-2 has been used in a wide variety of samples, the vast
majority of simulation groups (39 of 46) listed in a meta-analysis by Rogers, et al. (2003)
consisted of student or community volunteers.4 As previously mentioned, these samples
provide a challenge when choosing a scenario; for these groups, the use of hospital
placement, criminal trial, or even disability evaluation scenarios may be much less
relevant.
Previous research on the effect of scenario. Two investigations (Rogers &
Cruise, 1998; Merckelbach, Smeets, & Jelicic, 2009) have provided initial evidence for
the influential role that relevant scenarios play in affecting feigning measure scores.
However, the two studies contained methodological variations that led them to draw
separate conclusions about why the effects took place. First, Rogers and Cruise (1998)
found that the familiarity of the scenario (referred to as “context” in their article)
interacted with the type of incentive given and the relevance statement given to the
92

participants. While a significant interaction was found only for the Low Intelligence scale
(LI) on the Structured Inventory of Malingered Symptoms (SIMS), the authors
hypothesized that the combination of different variables led to a type of “reality check”
(Rogers & Cruise, 1998, p. 281). These findings provided some initial evidence that a
familiar scenario could improve the believability of feigning measure responses. As
discussed later, the details of the scenarios used in Rogers et al. may have contributed
to a lack of main effects.
Merckelbach et al. (2009) used three different scenarios (personal injury,
manslaughter, and wrongful death cases), which produced significant differences in
feigning scores. Specifically, the researchers found differences between the personal
injury case and the other two cases involving the death of another individual, with no
differences between the latter two cases.5 Unlike Rogers and Cruise, Merckelbach and
colleagues varied the type of feigning along with the scenario. For instance, simulation
in the personal injury case involved toxic encephalopathy, while in the two other cases,
it was a “serious psychological condition” or mental retardation, each expected to
diminish responsibility. While very interesting, it is difficult to separate the effect of the
scenarios from the varied disorders participants were asked to feign.
The current study provides evidence that scenarios that are more familiar to
participants will lead to more believable scores. The type of scenario contributed to
differences in scale elevations in two major ways. First, participants given the familiar
scenario had lower scores on a number of scales on the SIMS and SCL-90-R. Second,
a different pattern of scale elevations emerged for each scenario, indicating that the
93
type of impairment relevant to each scenario was perceived to be different. These
differences are examined in subsequent paragraphs.
Based on self-reported motivation and effort, simulators in both the familiar and
unfamiliar scenario groups attempted to feign convincingly. However, the unfamiliar
group produced less believable results with their extreme endorsement of symptoms.
This result is an important combination of points: both groups attempted to feign by
increasing symptom endorsement, but the familiar group endorsed fewer symptoms
than the unfamiliar group. Put a different way, the familiar group was more believable
than the unfamiliar group in its endorsement of symptoms. This result is markedly
different from the findings of Rogers and Cruise (1998). While they also found that both
feigning groups scored much higher than honest responders did, they found only
modest differences between scenario types. Moreover, in that study, there were no
scale differences based on scenario alone. As discussed in depth below, this is a
function of the types of scenarios used in each study.
Scale differences in the current study did not occur in a uniform fashion, and
these variations likely reflect the type of impairment groups thought was relevant to their
scenario. Aside from a few exceptions noted below, the unfamiliar group scored higher
than its familiar counterpart on mood and psychotic symptoms. This is interesting
because both scenarios asked the participant to fake the same thing: complete
impairment.
Scales with cognitive and somatic content were an exception in the previous
analysis; they did not show group differences. These types of impairments were likely
seen as less relevant to the scenarios and the goals given for feigning. It appears that
94

familiarity alone is not an effective tool; a familiar scenario alone will not lead to
improved feigning across all impairment types. Familiarity must occur with
symptomatology that participants also feel is relevant. In the current study, participants
did not feel that somatic and cognitive complains were relevant to either scenario;
therefore, the scenarios did not result in any differences on those scales.
Feigning across domains may complicate the assessment of scenario effect.
Differences between this study, with its focus on mental disorders in both scenarios,
and Merckelbach et al. (2009), highlight this complication. In Merckelbach et al. (2009),
the scenario changed (i.e., civil vs. criminal proceedings), but participants were also
given the freedom to focus on physical and cognitive complaints if they felt that they
would be more useful. Specifically, those in the “civil” scenario were asked to feign toxic
encephalopathy, which is associated with neurological and personality changes,
depression, and a host of physical symptoms. Not surprisingly then, effect sizes were
smaller for this group when measured on the Wildman Symptom Checklist (WSC;
Wildman &Wildman, 1999) than were the two other groups feigning a “serious
psychological condition to minimize criminal responsibility” and “insufficient cognitive
capabilities” (Merckelbach et al., 2009, p. 381). As Rogers (2008) noted, the areas of
medical and cognitive feigning are quite different from mental disorder feigning and
therefore require different detection strategies. Clearly, a scenario focusing on physical
complaints will elicit a different type of feigning, making the difference impossible to
impute to the situational aspect of the scenario alone. With the type of impairment kept
consistently within the realm of feigned mental disorder, the current study showed that
95

using a more relevant, familiar scenario can lead to more believable feigning across
measures.
One scale measuring depression broke the general pattern of lower familiar
group scores in the current data. The only scale across both measures that had a
higher mean score in the familiar group was the Depression scale of the SCL-90-R (d =
.52). This finding was opposite all other scales and may indicate that depression was
seen as a very relevant problem in the academic failure situation. It appears that
familiarity not only led to more believable scores in the form of lower scores, but to more
directed responding. Those in the familiar (i.e., academic failure) group chose
depression and those in the unfamiliar (i.e., criminal assault) group chose psychosis
and hostility most often and other symptoms to a lesser extent. However, participants in
each group still elevated close to six scales on average, indicating that some major
elevations were directed, but overall feigning was still quite general.
Memory impairment on the SIMS Am scale exhibited unexpected differences,
with higher scores in the unfamiliar group. This difference was unexpected because the
scale focuses on cognitive impairment. This suggests that memory impairment may
have been considered relevant to the unfamiliar scenario involving violence. However, it
is also possible that this is another indication of less selective feigning, given that the
unfamiliar scenario group also elevated scales related to psychotic and mood
symptoms. One study (Rogers & Cruise, 1998) has examined this scale previously.
However, since simulators were asked to feign major depression specifically, there were
no significant differences between groups on this scale.
96

The familiarity of the scenario in the current study affected symptom
endorsement more than in previous research. The difference may be attributed to the
specific “unfamiliar” scenarios in each investigation. For instance, Rogers and Cruise
(1998) used a minor drug charge, specifically possession of marijuana; in contrast, the
current study used a much more severe charge of felony assault. According to 2006
data from the FBI, the number of arrests for drug possession alone was 340% higher
than that for aggravated assault (FBI, 2007). While most college students have not been
arrested for drug possession, it is still likely that this is a more familiar scenario than
aggravated assault. A Substance Abuse and Mental Health Services Administration
(SAMHSA; 2005) study spanning 2002 to 2004 found an average annual “past year
drug use” rate of 37.5% for full-time college students. According to the Office of
Postsecondary Education’s (n.d.) data on campus crime from more than 6,000
postsecondary schools, 23,632 arrests and an additional 58,075 disciplinary actions
occurred in 2008 related to drug use (not including alcohol). For the same year, only
3,647 arrests for aggravated assault were recorded, with no evidence of non-criminal
disciplinary actions.6 Looking at arrest rates alone, drugs were responsible for 6.5 times
more arrests that aggrevated assault in college populations. The drug charge used in
Rogers and Cruise (1998) may have been familiar to many students, while the current
investigation’s use of an aggravated assault charge was unfamiliar enough to produce
an effect.
Role of Coaching
Coaching likely occurs in a majority of real-world forensic cases and is often
endorsed by attorneys as a legitimate practice (Wetter & Corrigan, 1995; Youngjohn,
97

Lees-Haley, & Binder, 1999). For self-coaching, examinees can obtain information from
readily available sources including articles and books written about feigning tests, or
even the tests themselves (Nichols & Greene, 1997). Outside of these published
materials, finding information has become much easier in the last decade as access to
the internet has greatly expanded (Ruiz, 2002). As an example, a quick Google search
on November 13, 2009 of the key word “MMPI” elicited detailed information on scale
content and cut scores as well as direct tips for attorneys to give to clients and to use
against professionals on cross-examination. Given its ease and the real-world
implications, the effects of coaching must be considered for the ecological validity of
simulation research.
The inclusion of coaching is a relatively modern methodological advance in
feigning research. Early research with the MMPI (for an example, see Goldstein, 1944)
and other standardized psychological measures simply gave a warning to “be
believable” but did not provide coaching regarding how this might be accomplished.
However, in the last three decades, coaching has appeared more frequently in
malingering research (e.g., Albert, Fox, & Kahn, 1980).
There is an important difference between symptom and detection strategy
coaching. Early coaching studies focused on symptom coaching, a method which has
since been proven to be ineffective. Rogers (2008c) pointed out that this method is
fatally flawed for multiple reasons. Briefly, symptom coaching can be unhelpful because
there is no “correct” pattern or codetype on multiscale inventories; therefore, this is a
distraction. An evaluee may also focus exclusively on symptom endorsement and
neglect the possibility of detection. Many studies (Edens, Otto, & Dwyer, 1998; Rogers,
98

Bagby, & Chakraborty, 1993; Wetter, Baer, Berry, Robison, & Sumpter, 1993), with a
vast array of settings and disorder types, have concluded that this type of coaching
leads to little or no decrease in detection rates.
Studies on detection strategy coaching have proven it to be effective at reducing
detection (Lamb, Berry, Wetter, & Baer, 1994; Rogers et al., 1993; Storm & Graham,
2000). For example, Rogers et al. (1993) found that most feigners (78.6%) coached on
detection strategies alone avoided detection on the MMPI-2 F scale. In contrast,
combined coaching (i.e., symptom and strategy) was less effective (53.3%), whereas
symptom coaching (26.6%) was the least successful. These data suggest that symptom
coaching can be a major distraction, even when detection strategy coaching is also
included. In some cases, non-specific warnings, or cautions, about the presence of
detection strategies have been effective, even when no further information on how they
work is provided (e.g., Suhr & Gunstad, 2000).
The current study found that detection strategy coaching worked better than
these caution statements, in agreement with past research. Specifically, the coached
simulators had significantly lower scores on all SCL-90-R clinical scales and all except
two SIMS scales. These results are supported by all but one past study. Bagby,
Nicholson, Bacchiochi, Ryder, and Bury (2002) found no significant differences between
coached and uncoached groups on the clinical or validity scales of the MMPI-2 and PAI.
However, the authors note that differences in design may account for these conflicting
findings. Specifically, they used a more general statement to “feign a mental disorder,”
while the two previous studies that found differences used specific disorders (i.e.,
schizophrenia and closed head injury). Interestingly, the current study also used a
99

general statement with no specific disorders noted and found significant effects for
coaching. These results were found not only for the SIMS, but for a general clinical
measure as well.
While the SCL-90-R is not designed to detect feigning, it appears that individuals
who were coached responded to its items in a more credible manner, with fewer
extreme elevations. Lower SCL-90-R scores were not expected because these scales
do not contain items that the coaching would seemingly affect. The coaching
instructions included information on the three SIMS detection strategies for mental
disorders – rare symptoms, improbable symptoms, and symptom combinations, all of
which are classified as “unlikely strategies” (see Introduction). The SCL-90-R does not
contain any identified unlikely strategy items and contains only a small number of items
that could be seen as “rare” according to the description given in the coaching
instructions. With its existing items, the SCL-90-R would only be able to use “amplified”
strategies, which were not coached. The results therefore suggest that coaching may
motivate responders to be more careful about their presentation in a generalized way.
Coaching has also been found to affect clinical elevations in two past studies
(Rogers, Bagby, & Chakraborty, 1993; Lamb, Berry, Wetter, & Baer, 1994.) Rogers,
Bagby, and Chakraborty (1993) found that coached participants not only scored
significantly lower on MMPI-2 feigning scales, but on the clinical scales as well.7 While
effect sizes cannot be calculated for this study, detection strategy coaching resulted in
29.78% fewer participants elevating scales to a clinical range (defined as 65T in this
study). Similarly, Lamb, Berry, Wetter, and Baer (1994) concluded that detection
strategy information exhibited the largest effect (M d =.40) on clinical scales when
100

coached closed-head injury patients were compared to uncoached simulators. This
effect is similar to that in the current study (M d = .47). A third study (Bagby, Nicholson,
Bacchiochi, Ryder, & Bury, 2002) using the MMPI-2 and PAI found that coached and
uncoached groups did not differ significantly on any clinical scales or validity scales.
Bagby et al. (2002) is one of the few studies to find no coaching effect. Interestingly, this
study included similar detection strategy coaching to the other studies discussed above
and used a similar sample of college or community non-patients. An examination of the
mean elevations in each group shows that both groups had substantially lower T-scores
than the other studies. The authors suggest that this was due to a higher incentive,
which may have erased the effect of coaching.
In summary, detection strategy coaching appears to decrease scores more than
simply cautioning about the presence of detection strategies or symptom coaching.
Specifically, those who were coached had mean SIMS Total scores almost six points
lower, with an effect size of 0.47 when compared to those who received only a caution.
Similar results have been obtained in past studies (Rogers, Bagby, & Chakraborty,
1993; Lamb, Berry, Wetter, & Baer, 1994), but were questioned by one more recent
study (Bagby, Nicholson, Bacchiochi, Ryder, & Bury, 2002). Rogers (2008c)
recommended that simple cautionary statements be included in all studies; however,
researchers should consider including detection strategy coaching in all simulation
design research to increase ecological validity.
Role of Incentives
According to the adaptational model, malingering is more likely to occur when an
individual has a substantial personal investment (Rogers, 2008a). Indeed, past meta-
101

analytic data (Binder & Rohling, 1996) shows that in disability cases, the amount of the
possible monetary reward is positively correlated with the reported impairment. When
controlling for injury severity, this correlation suggests that some examinees exaggerate
their impairment more when presented with a high potential reward. In the realm of
neuropsychological feigning, litigants have been found to perform more poorly than non-
litigants with similar injuries (Meyers & Volbrecht, 1998). Specifically, 4.1% of the non-
litigants compared to 48.9% of the litigants were classified as malingering. These real-
world examples suggest that greater potential rewards increase investment in the
evaluation.
Past experimental research has shown some evidence that larger monetary
incentives increase both the self-reported motivation to feign convincingly (Wilhelm et
al., 1991) and performance on feigning measures (Elhai et al., 2007; Bernard, 1990;
Shum, O’Gorman, & Alpar, 2004; Frederick, Sarfaty, Johnston, & Powel, 1994; Orey,
Cragar, & Berry, 2000). In many of these investigations, the effect sizes between
incentive levels have been quite small, and in many cases, only certain scales, and not
entire measures, were affected. The small effects are likely a product of the modest size
of “larger” rewards in experimental settings, typically ten to twenty dollars. Such modest
rewards can hardly be expected to have the same effect as real-world disability cases,
often with thousands or millions of dollars as a potential incentive.
The body of literature on incentives in simulation research can be broken into two
domains: feigned mental disorders and feigned cognitive impairment. Two studies, by
Elhai and his colleagues (2007) and Rogers and Cruise (1998) have specifically
examined the effect of incentive level on feigned mental disorders. Rogers and Cruise
102

(1998) offered the possibility of a $50 reward to the “most successful” feigner in addition
to extra credit and recognition via a posted list. Elhai et al. (2007) offered a similar
monetary reward to the top three feigners in their study. Effect sizes in the Rogers and
Cruise study (.18) and the Elhai study (.19 on the main outcome scale) were almost
identically small. The current thesis provides a good comparison to the earlier study by
using the same measure with a similar comparison (positive vs. negative incentive).
However, unlike the earlier study, no significant differences were found.
In general, the five published experimental studies on feigned cognitive
impairment indicate that incentives as small as $20 are associated with a decrease in
the number of participants who are detected by feigning measures. A detailed
discussion of these studies’ methodologies can be found in the Introduction of this
thesis, but across three of the five studies, incentive groups produced more credible
results. Shum, O’Gorman, and Alpar (2004) found that an incentive of $20 improved
scores on a memory task (d = .44), while another study (Frederick, Sarfaty, Johnston, &
Powel, 1994) found that a $20 incentive lowered the detection rate from 84.2% to
65.4%. Orey, Cragar, and Berry (2000) studied a group offered $25 that was asked to
feign head injury and found that they performed better on a varied of cognitive tasks (M
d = .94). A study by Wilhelm and colleagues (1991) was the only exception to this
pattern: they found increased scores (i.e., an increase in impairment instead of
believability) for a group offered a larger incentive.
The generalizability of incentive results across domains is inappropriate due to
both conceptual and methodological differences. First, the task of cognitive feigning
involves tactics unlike those used when feigning mental disorders. Second, the
103
incentives in the cognitive research have generally been given in a different manner.
Specifically, most studies have used rewards of $20-$25, given to all feigners, with an
additional reward sometimes offered only to the successful feigners or those that win a
lottery. In the feigned mental disorder studies to date, rewards were given only to the
best feigners. It is possible that simulators were not as motivated by this, feeling that
their chances for reward were quite low, including in the current study. Alternatives to
simple monetary incentives may be needed to motivate simulators.
Negative incentives can be seen as ecologically-valid additions to the typical
monetary incentives, but research on them is necessarily constrained by ethical
considerations. As noted in the Introduction, two previous studies using negative
incentives are available to compare to the current study, with promising results that
suggest increased credibility in simulators’ responses (Patrick & Iacono, 1989; Rogers &
Cruise, 1998). Rogers and Cruise investigated the effect that a threat of posting the
names of unsuccessful feigners would have (d = .18 on the main outcome scale) while
Patrick and Iacono (1989) also used a negative incentive involving a loss of money in
an inmate population (effect sizes not available). While it is difficult to compare Patrick
and Iacono (1989) to Rogers and Cruise (1998) because the former used polygraph
results and not feigning measures, both studies provide excellent examples of the use
of negative incentives. Both investigations used incentives that were sufficiently
motivating to their samples. Specifically, Rogers and Cruise (1998) used the threat of
embarrassment with undergraduates, while Patrick and Iacono (1989) used not only the
loss of money but the retribution of other inmates as motivation. It should be noted that
this may not pass some Institutional Review Boards today.
104

While the current study did not find any differences between groups of feigners
based on the incentive given, a methodological difference may be hiding a true effect.
The study does not contain a “no incentive” group; therefore, a comparison between the
presence and absence of incentives is impossible, just as was the case in the Rogers
and Cruise (1998) study. However, that study did find that negative incentives lowered
scores more so than positive incentives for scales AM and LI (d = .36 and .26,
respectively, Total score d = .18), while the current study found a negligible effect in the
same direction (i.e., no significant differences, Total score d = .05). It is possible that
Rogers and Cruise’s threat of posting the names of failed feigners was seen as a more
serious consequence than having to stay late in the laboratory, as in the current study.
Putting Instructional Changes in Perspective
Those familiar with the feigning literature may note that the effect sizes in the
current study are very small when compared to those obtained when comparing
feigners to honest responders. When making this extreme comparison, a moderate
effect size is considered ≥0.75 (Rogers, Sewell, Martin, & Vitacco, 2003). However,
clearly we should not expect to find similar effects when looking at the differences
between subtle subsets of feigners (i.e., those given varied instructions) as when we are
comparing extreme groups, such as feigners and genuine responders. When
considered in this context, the current results are quite promising.
The use of relevant and motivating instructions is clearly associated with more
successful feigning in simulation studies. The Cohen’s d effect sizes for the three
instructional variables in this study were all in the low to low medium range according to
Cohen’s (1992) standards. Specifically, the use of a familiar scenario produced more
105

believable scores than the unfamiliar scenario (d = .30), while coaching had a
predictably larger effect (d = .42). No differences were found between the two types of
incentives investigated, possibly indicating that positive and negative incentives are
equally efficacious. The use of these instructional variables in the current study served
to test the measure in a more realistic manner, one that attempted to recreate some of
the motivation that real-world malingerers may actually have. When using simulation
design, researchers are likely to find that effective scales will differentiate genuine
responding from feigning to a considerable degree whether or not the most effective
variants of instructions are used. But using the best possible instructions will provide a
more stringent test of the scale. It will also provide further evidence that that scale is
likely to be effective when used in research with a known-groups comparison or in
clinical practice.
Simulators’ Choice of Feigned Disorders
When given a specific disorder to feign, participants are quite successful at
elevating the intended scales (Rogers, Ornduff, & Sewell, 1993; Rogers, Sewell, Morey,
& Ustad, 1996; Edens et al., 1999). For example, participants feigning schizophrenia in
Rogers et al. (1993) almost never (90.9%) avoided detection, while those feigning major
depression (55.9%) or generalized anxiety disorder (38.7%) were less likely to be
detected. These differences likely reflect both the content of the PAI feigning scales
(Rogers, et al., 1993) and participants’ understanding of the symptoms characterizing
these different disorders.
An oft-overlooked question is whether feigners succeed at simulating the
disorders they intent to when the choice is left to them. Some researchers instruct
106

participants to think of a disorder to feign before testing, while others ask them to feign
“impairment.” Real-life examples would likely indicate that the choice of disorder
depends on the setting and the goal for that particular feigner. For example, Cornell and
Hawk (1989) reported that feigned psychosis was attempted by 8% of pretrial
defendants being evaluated for competency to stand trial, but they did not report
percentages for any other feigned disorders.
In the current study, three-quarters of participants instructed to “think about what
disorder and type of impairment you want to fake” reported that they had a specific
disorder in mind. Of these, more than 70% reported they had attempted to feign
schizophrenia, depression, or bipolar disorder, while the remaining participants listed a
variety of other disorders in small numbers. These numbers differed by scenario: those
in the familiar scenario feigned depression and anxiety more, while those in the
unfamiliar scenario chose schizophrenia more often.8 The participants concentrated on
only a few diagnoses, leading to two major observations about what guides this choice.
First, the type of scenario may affect the type of impairment participants think is
necessary or the most severe. Second, undergraduates may be more familiar with
several disorders through popular media and may attempt to use this knowledge. With
the knowledge of which disorders are being feigned, we were able to examine whether
participants were able to present themselves as such on clinical measures.
Participants were able to endorse the scale corresponding to their disorder, but
were often not selective in their symptom choices. Almost all participants were able to
elevate at least the SCL-90-R scale associated with their disorder, even if others were
raised as well, while very few (4.0%) were successful at elevating only the clinical scale
107

corresponding to their disorder. Participants’ selectivity of endorsement is also
questioned because (a) less than half of the participants had their highest elevation on
the scale corresponding to their disorder and (b) the mean number of elevated scales
was over six.
Limitations
The current study had several methodological limitations. The first involved the
choice of clinical and feigning measures. Although the SCL-90-R is a widely used
measure to access the features of major Axis I disorders, it cannot be used for DSM-IV-
TR diagnostic purposes. As the first study to examine selectivity across scales, the
current investigation provides some interesting initial information about the disorder
choices of simulators. However, the use of a structured clinical interview or other
diagnostic tool would allow for a clearer comparison. With diagnostic information, direct
comparisons could be made between the self-reported choice of simulated disorder and
the resulting responses. In addition, a more valid estimate of how accurately
participants are able to simulate a disorder when given varied instructions could be
obtained. Future research may consider the use of measures such as the SADS or
SCID-I to obtain this information.
Replication of the current study should be completed with a variety of feigning
measures, including those most frequently used: the SIRS and MMPI-2. Although the
SIMS has undergone adequate validation and is one of the most frequently used
screens for malingering, a more stringent measure like the SIRS would provide the best
possible data. However, one advantage of the SIMS that would be lost is its
organization based on item content, allowing comparisons to clinical measures.
108

The second set of limitations concerns the exclusion of “absent” conditions from
each independent variable. “Absent” refers to a condition in which the variable is not
given (e.g., no scenario or no incentives). In the current study, only coaching included
such a condition. The main drawback of excluding this circumstance for all variables is
the inability to analyze whether such an absence affects results. For example, we
cannot ascertain whether a moderate incentive is better than no incentive at all. In
addition, the relative contribution of each variable in indeterminable; an effect size
between positive and negative incentives means something quite different from one
between a familiar and unfamiliar scenario. Ultimately, the reason for choosing to
exclude absence conditions was based on the enormous sample size that would be
needed when adding levels to our factorial design. Even the inclusion of two more levels
(i.e., a 3 x 3 x 3 design) would lead to a need for at least 300 additional participants,
assuming a cell size of at least 20. The supplementary question about the relative
contribution of each variable was considered secondary to the main objective of
investigating differences between levels of the same variable (e.g., familiar vs.
unfamiliar scenarios).
The purpose of the current study was to investigate various methodological
factors used with simulators, making the use of a clinical comparison group of
secondary concern. While clinical comparisons are a key element of simulation design
research, they were not used here primarily because this study was not comparing
honest to feigning groups. This also allowed for a cleaner design that put the focus on
the relevant instructional variables. However, this limits the comparisons that can be
drawn between these findings and those of studies that do use clinical participants.
109

Future Directions
The current study was one of the first to address the integrated examination of
familiarity, coaching, and incentive levels and it provides some initial evidence for the
most effective levels of each. Future research should further elucidate the most effective
levels of each of these variables (i.e., those that cause feigners to report the most
motivation and result in scores that are more believable). For instance, this investigation
found evidence for the use of a familiar scenario; however, the most fitting scenario will
vary based on the setting of the sample and the specific characteristics of the
participants. Future research should investigate various scenarios to find those that
appear to be the most motivating to that specific population. This research would then
be available to future researchers using simulation design, who could use the most
effective scenario in similar samples.
Future research should also investigate alternate levels of positive and negative
incentives that correspond to real-world circumstances. Although we found no evidence
that negative incentives were more effective than positive ones, a study by Patrick and
Iacono (1989) provided a completely different example of such incentives, which were
quite effective (see Discussion). Creating negative incentives that comply with ethical
guidelines, yet motivate participants to feign in realistic ways, is important. However,
researchers must keep in mind that effectiveness will vary by setting, and incentives will
need to be devised based on sample-specific considerations. What is motivating to a
college student may not be to a correctional inmate or inpatient. Given the small number
of studies on this subject, replication is needed before definitive guidelines can be made
about negative incentives.
110
Although only supplementary questions in the current study, simulators’ choices
of disorders and their ability to accurately portray those disorders deserves further
investigation. Common disorder choices will help to structure the content of future
feigning scales. Most feigning measures do not base scales on content, but rather on
the feigning strategies. For example, scales using a rare symptoms strategy contain
items with content that may span psychotic, dissociative, anxiety, and affective
disorders. The emphasis is on the fact that the items are rare in any case. Feigning
scales based on content may be developed for settings where specific disorders are
being attempted. Alternatively, patterns of clinical elevations may provide evidence of
generalized feigning, as the PAI’s RDF scale does, though with an empirical
development (Rogers, Sewell, Morey, & Ustad, 1996).
Most feigning studies use one research design – known groups comparisons,
simulation, or bootstrapping. Rarely are two designs used in the same investigation (i.e.,
one or more genuine, known, and simulation groups), which would allow for direct
comparisons of the two designs (see Gothard, Rogers, & Sewell, 1995; Rogers &
Bagby, 1991). More combined studies are needed to understand the extent to which
suspected malingerers differ from simulators in their responses.
Conclusions
Feigning research using simulation design has grown drastically in the last thirty
years. Only recently have concerns about ecological validity being given more attention.
For years, little attention was paid to who the participants were or what their motivation
was for completing the study. In the last two decades, many methodological changes
have been implemented, but few studies have investigated how well these factors work.
111

Given the predominate use of this research design and the drastic implication of
malingering in practice, clinicians have a substantial investment in both the accuracy of
the measures they are using and the methods used to validate them.
The current study provides evidence for the inclusion of a familiar scenario,
detection strategy coaching, and incentives. Scenarios should be designed that are
relevant and familiar to the sample. No longer should murder charges be used with
college students or irrelevant civil charges with psychiatric inpatients. Additionally,
incentives should be included in investigations. Given the low cost and relative ease of
implementing negative incentives, they should always be included in studies. Lastly, this
study, as well as others before it, support the sole use of detection strategy coaching.
The use of these variables will increase ecological validity while costing little extra.
Instead of considering them optional, they should be framed as any other
methodologically sound practice would be: necessary. The greater the ecological
validity of our feigning studies, the more accurate our measures and understanding of
feigning will be.
Endnotes
1. Because this study does not examine feigned cognitive impairment in depth, its
detection strategies were not discussed in the Major Detection Strategy section.
Briefly, Performance curve detects malingerers’ failure to tailor their incorrect
responses to the level of difficulty of the measure. Magnitude of error analyzes
the chosen incorrect responses of malingerers. Often times, malingerers’ do not
focus on which incorrect answers should be chosen. These answers often vary
from the predictable pattern of genuine patients (Berry & Schipper, 2008).
112

113
2. Studies used in the sample were as follows: Arbisi and Ben-Porath, 1998; Arbisi,
Ben-Porath, and McNulty, 2006; Bagby, Rogers, Nicholson, Buis, Seeman, and
Rector, 1997; Iverson, Franzen, and Hammond, 1995; Storm and Graham, 2000;
Wetter, Baer, Berry, Smith, and Larson, 1992. Some studies included two
simulation groups, in which case both instructional sets were averaged.
3. Two of these 18 studies used other designs as well, but all used simulation
design.
4. Not all of these simulation studies were conducted exclusively with students or
community volunteers. The comparison, or honest group is often from a clinical,
forensic, or correctional population. However, the simulators, the participants
assigned to feign with the scenario, are from student or community populations.
5. Merchelbach et al. (2009) classify wrongful death as a criminal charge. However,
this is technically a civil charge involving death.
6. These numbers reflect arrests on-campus and in resident halls only.
7. Scales 6, 7, 8, and 9 were the only clinical scales reported in this study.
8. Dissociative identity disorder and antisocial personality disorder were also
chosen by the unfamiliar group more often, but these frequencies were too small
to draw firm conclusions.

114
APPENDIX A
INFORMED CONSENT FORM

University of North Texas Institutional Review Board
Informed Consent Form
Before agreeing to participate in this research study, it is important that you read and understand the following explanation of the purpose and benefits of the study and how it will be conducted.
Title of Study: Methodological Issues in Malingering Research: The Use of Simulation Designs.
Principal Investigator: Nathan Gillard, a graduate student in the University of North Texas (UNT) Department of Psychology.
Purpose of the Study: You are being asked to participate in a research study which seeks to understand better how individuals respond to questions when they are trying to fake a mental disorder for their own gain.
Study Procedures: You will be asked to follow the instructions given to you and fill out two questionnaires about symptoms of a mental disorder that will take about thirty to forty minutes of your time. In certain conditions, you may be asked to complete an additional questionnaire if you were unsuccessful on the first two measures.
Foreseeable Risks: The potential risks involved in this study are very minimal. You will be asked general questions about mental disorders, some of which may bring about thoughts that may be uncomfortable, such as questions about depression. Benefits to the Subjects or Others: While we do not expect this study to benefit you directly immediately, we expect the project to provide us with valuable information about individuals who may be seeking to fake mental disorders. Individuals who do this can cost taxpayers money by taking funds from those who are experiencing true mental disorders. In addition, individuals may seek to avoid punishment such as prison or gain rewards such as disability payments unfairly. Compensation for Participants: Everyone who completes the task, or an alternative assignment, will receive extra credit. Further compensation for this task will be discussed later in the study. Procedures for Maintaining Confidentiality of Research Records: Once you sign this consent form, it will be removed from all other testing material and be stored in a separate, secure location in the department of psychology. All testing materials will include only a participant number, which after the completion of the task today will not be linked to your name in any way. The confidentiality of your individual information will be maintained in any publications or presentations regarding this study.
115

Questions about the Study: If you have any questions about the study, you may contact Nathan Gillard at telephone number (940) 565-2671 or the faculty advisor, Dr. Richard Rogers, UNT Department of Psychology, at telephone number (940) 565-2671.
Review for the Protection of Participants: This research study has been reviewed and approved by the UNT Institutional Review Board (IRB). The UNT IRB can be contacted at (940) 565-3940 with any questions regarding the rights of research subjects.
Research Participants’ Rights: Your signature below indicates that you have read or have had read to you all of the above and that you confirm all of the following:
• The researcher has explained the study to you and answered all of your questions.
• You have been told the possible benefits and the potential risks and/or discomforts of the study.
• You understand that you do not have to take part in this study, and your refusal to participate or your decision to withdraw will involve no penalty or loss of rights or benefits. The study personnel may choose to stop your participation at any time.
• You understand why the study is being conducted and how it will be performed.
• You understand your rights as a research participant and you voluntarily consent to participate in this study.
• You have been told that you will receive a copy of this form.
________________________________ Printed Name of Participant
________________________________ ____________ Signature of Participant Date
For the Principal Investigator or Designee: I certify that I have reviewed the contents of this form with the participant signing above. I have explained the possible benefits and the potential risks and/or discomforts of the study. It is my opinion that the participant understood the explanation.
________________________________________ ___________ Signature of Principal Investigator or Designee Date
116

117
APPENDIX B
GENERAL HONEST INSTRUCTIONS

Today you will be asked to complete a number of short questionnaires. These
questionnaires ask about your psychological health. Your goal is simply to be
open and honest. It is important that you tell us the way it really is— please don’t
hide your problems or exaggerate your symptoms. You will receive 2 research
credit points for your cooperation.
As the Consent form you signed said, some people are being asked to “fake” a
mental disorder. However, we need you to be completely honest so we can
compare their fake results to your honest results.
Remember, just answer all the questions completely honestly.
118

119
APPENDIX C
INSTRUCTION SHEET 1: GENERAL INSTRUCTIONS FOR FAKERS

You will be asked to pretend that you have a mental disorder. You will be given a
number of questionnaires that are designed to measure the type and level of mental
disorder you are pretending to have. Do your best to fake in a believable way so you are
not caught.
120

121
APPENDIX D
INSTRUCTION SHEET 2a: FAMILIAR SCENARIO AND
INSTRUCTION SHEET 2b: UNFAMILIAR SCENARIO

Imagine that you are in the final weeks of a class that you need to graduate. You
have not even started a major project that counts for 50% of your final grade.
Without it, you have no hope of passing. The university makes special
exceptions for dropping classes if a student experiences a mental disorder. You
decide that you must fake a breakdown. A psychologist will give you a few
questionnaires to decide if you are impaired. You can avoid failing only if you
are able to convince the psychologist that you really are impaired. Please take a
minute to think about what type of disorder and impairment you would like to
fake before completing the materials – remember, you must appear
convincingly disabled.
Imagine you were involved in a fight outside of a restaurant and you broke a
bottle over the other person’s head. You escaped with a few cuts, but the other
person was hospitalized. Felony Assault charges are now being filed against
you. You decide you must pretend to have a mental disorder that explains your
behavior outside the restaurant. A psychologist will give you a few
questionnaires to decide if you are impaired. You can avoid a conviction and
possible jail time only if you can convince the psychologist that you are
mentally impaired. Please take a minute to think about what type of disorder
and impairment you would like to fake before completing the materials –
remember, you must appear convincingly disabled.
122

123
APPENDIX E
INSTRUCTION SETS 3: POSITIVE, NEGATIVE, AND BOTH INCENTIVES

InstructionSet 3a: Positive Incentive
If you succeed at “faking out” the questionnaires without being caught, you will
receive extra credit and be entered to win $50. Remember, you must appear
genuinely impaired and avoid detection to win a chance at $50.
Instruction Set 3b: Negative Incentive
If you succeed at “faking out” the questionnaires about your pretend mental
disorder without being caught, you will receive extra credit and complete the
study early. However, if you are caught trying to deceive the tests, you will not
receive the extra credit. In addition, you will be required to stay for an
additional 20 minutes to fill out more measures to find out why you failed.
Instruction Set 3c: Positive and Negative Incentive
If you succeed at “faking out” the questionnaires without being caught, you will
receive extra credit and be entered to win $50. Remember, you must appear
genuinely impaired and avoid detection to win a chance at $50. However, if you
are caught trying to deceive the tests, you will not receive the extra credit or the
money. In addition, you will be required to stay for an additional 20 minutes to
fill out more measures to find out why you failed.
124

125
APPENDIX F
INSTRUCTION SET 4a: COACHING

There are scales on these tests that are designed to catch those who are faking a
mental disorder. These scales use several methods to tell those with genuine
disorders from those faking disorders. One method for identifying fakers is to
ask about very strange or unlikely symptoms. For example, if you indicate that
you are deathly afraid of flowers (almost never a real symptom), the test will see
you are likely faking. Another way the test detects faking is by asking about
symptoms that rarely happen together. For example, increased appetite and
hearing voices are symptoms of different mental disorders. Therefore, they are
unlikely to happen at the same time. Please watch for the items that are designed
to catch you faking. Remember, you want to appear mentally disordered, but
you want to be believable – otherwise you will be caught.
126
127
APPENDIX G
DEMOGRAPHIC QUESTIONNAIRE
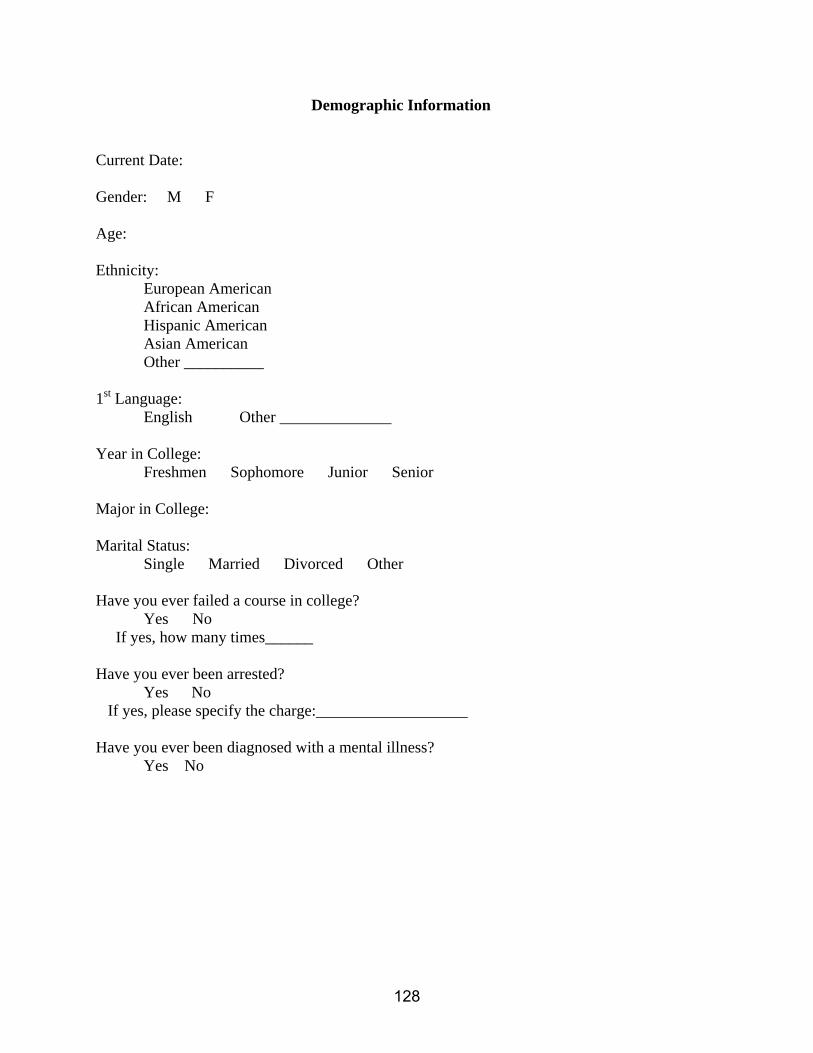
Demographic Information
Current Date: Gender: M F Age: Ethnicity: European American
African American Hispanic American Asian American
Other __________ 1st Language: English Other ______________ Year in College: Freshmen Sophomore Junior Senior Major in College: Marital Status: Single Married Divorced Other Have you ever failed a course in college? Yes No If yes, how many times______ Have you ever been arrested? Yes No If yes, please specify the charge:___________________ Have you ever been diagnosed with a mental illness? Yes No
128

129
APPENDIX H
DEBRIEFING

As a participant in this study, you were randomly placed in one of a number of possible groups. Each group received slightly different instructions. For some, these instructions stated that failure to fake out the tests would result in having your extra credit taken away. However, this was done only to motivate you to try your best on the tests. In reality, everyone who participated in the study will receive 2 research credit points. Please keep this a secret. Other friends or students may participate in this study at a later date and we do not want them to know this beforehand. Thank you for your cooperation and participation!
130

131
APPENDIX I
MANIPULATION CHECKS

Honest
ID # _______
The study you just participated in asked you to follow the instructions you were given.
Please briefly describe what your instructions asked you to do.
______________________________________________________________________________
______________________________________________________________________________
______________________________________________________________________________
How hard did you try to follow the instructions?
1. Didn’t try hard, its just a study ______
2. Tried a little bit _____
3. Gave a medium effort _____
4. A good effort, I tried hard _____
5. Excellent effort, I really tried to do my best _____
Thank you for your participation. Your help in this study is greatly appreciated.
132

Feign-Negative-No coach
ID # _______
The study you just participated in asked you to follow the instructions you were given.
Please briefly describe what your instructions asked you to do.
______________________________________________________________________________
______________________________________________________________________________
______________________________________________________________________________
What situation were you asked to pretend you were in?
______________________________________________________________________________
______________________________________________________________________________
What were the reasons given for following the instructions? In other words, what would
a happen if you did not do well?
______________________________________________________________________
______________________________________________________________________
How hard did you try to follow the instructions?
1. Didn’t try hard, its just a study ______
2. Tried a little bit _____
3. Gave a medium effort _____
4. A good effort, I tried hard _____
5. Excellent effort, I really tried to do my best _____
Do you think you were successful at deceiving the tests?
Yes No
When faking, did you have a particular disorder in mind?
Yes No
133

If yes, what was it?
__________________________________________________________
Were you aware that there were items designed to trip you up?
Yes No
How do you think those items were supposed to work?
______________________________________________________________________________
______________________________________________________________________________
Thank you for your participation. Your help in this study is greatly appreciated.
134

Feign-Positive-No coach
ID # _______
The study you just participated in asked you to follow the instructions you were given.
Please briefly describe what your instructions asked you to do.
______________________________________________________________________________
______________________________________________________________________________
______________________________________________________________________________
What situation were you asked to pretend you were in?
______________________________________________________________________________
______________________________________________________________________________
What were the reasons given for following the instructions? In other words, what would
you receive for doing well?
______________________________________________________________________
______________________________________________________________________
How hard did you try to follow the instructions?
1. Didn’t try hard, its just a study ______
2. Tried a little bit _____
3. Gave a medium effort _____
4. A good effort, I tried hard _____
5. Excellent effort, I really tried to do my best _____
Do you think you were successful at deceiving the tests?
Yes No
When faking, did you have a particular disorder in mind?
Yes No
135

If yes, what was it?
__________________________________________________________
Were you aware that there were items designed to trip you up?
Yes No
How do you think those items were supposed to work?
______________________________________________________________________________
______________________________________________________________________________
Thank you for your participation. Your help in this study is greatly appreciated.
136

Feign-both-No coach
ID # _______
The study you just participated in asked you to follow the instructions you were given.
Please briefly describe what your instructions asked you to do.
______________________________________________________________________________
______________________________________________________________________________
______________________________________________________________________________
What situation were you asked to pretend you were in?
______________________________________________________________________________
______________________________________________________________________________
What were the reasons given for following the instructions? In other words, what would
you receive for doing well? What would happen if you did not do well?
______________________________________________________________________
______________________________________________________________________
How hard did you try to follow the instructions?
1. Didn’t try hard, its just a study ______
2. Tried a little bit _____
3. Gave a medium effort _____
4. A good effort, I tried hard _____
5. Excellent effort, I really tried to do my best _____
Do you think you were successful at deceiving the tests?
Yes No
When faking, did you have a particular disorder in mind?
Yes No
137

If yes, what was it?
__________________________________________________________
Were you aware that there were items designed to trip you up?
Yes No
How do you think those items were supposed to work?
______________________________________________________________________________
______________________________________________________________________________
Thank you for your participation. Your help in this study is greatly appreciated.
138

Feign-Positive-coach
ID # _______
The study you just participated in asked you to follow the instructions you were given.
Please briefly describe what your instructions asked you to do.
______________________________________________________________________________
______________________________________________________________________________
______________________________________________________________________________
What situation were you asked to pretend you were in?
______________________________________________________________________________
______________________________________________________________________________
What were the reasons given for following the instructions? In other words, what would
you receive for doing well?
______________________________________________________________________
______________________________________________________________________
How hard did you try to follow the instructions?
1. Didn’t try hard, its just a study ______
2. Tried a little bit _____
3. Gave a medium effort _____
4. A good effort, I tried hard _____
5. Excellent effort, I really tried to do my best _____
Do you think you were successful at deceiving the tests?
Yes No
When faking, did you have a particular disorder in mind?
Yes No
139

If yes, what was it?
__________________________________________________________
You were given information on how some items were supposed to “catch” you. Do you feel like
this coaching was useful?
Yes No
Did you think about the advice given when answering questions?
Yes No
Thank you for your participation. Your help in this study is greatly appreciated.
140

Feign-Negative-coach
ID # _______
The study you just participated in asked you to follow the instructions you were given.
Please briefly describe what your instructions asked you to do.
______________________________________________________________________________
______________________________________________________________________________
______________________________________________________________________________
What situation were you asked to pretend you were in?
______________________________________________________________________________
______________________________________________________________________________
What were the reasons given for following the instructions? In other words, what would
a happen if you did not do well?
______________________________________________________________________
______________________________________________________________________
How hard did you try to follow the instructions?
1. Didn’t try hard, its just a study ______
2. Tried a little bit _____
3. Gave a medium effort _____
4. A good effort, I tried hard _____
5. Excellent effort, I really tried to do my best _____
Do you think you were successful at deceiving the tests?
Yes No
When faking, did you have a particular disorder in mind?
Yes No
141
If yes, what was it?
__________________________________________________________
You were given information on how some items were supposed to “catch” you. Do you feel like
this coaching was useful?
Yes No
Did you think about the advice given when answering questions?
Yes No
Thank you for your participation. Your help in this study is greatly appreciated.
142

Feign-both-coach
ID # _______
The study you just participated in asked you to follow the instructions you were given.
Please briefly describe what your instructions asked you to do.
______________________________________________________________________________
______________________________________________________________________________
______________________________________________________________________________
What situation were you asked to pretend you were in?
______________________________________________________________________________
______________________________________________________________________________
What were the reasons given for following the instructions? In other words, what would
you receive for doing well? What would happen if you did not do well?
______________________________________________________________________
______________________________________________________________________
How hard did you try to follow the instructions?
1. Didn’t try hard, its just a study ______
2. Tried a little bit _____
3. Gave a medium effort _____
4. A good effort, I tried hard _____
5. Excellent effort, I really tried to do my best _____
Do you think you were successful at deceiving the tests?
Yes No
When faking, did you have a particular disorder in mind?
Yes No
143

If yes, what was it?
__________________________________________________________
You were given information on how some items were supposed to “catch” you. Do you feel like
this coaching was useful?
Yes No
Did you think about the advice given when answering questions?
Yes No
Thank you for your participation. Your help in this study is greatly appreciated.
144

145
APPENDIX J
ABSOLUTE MEAN DIFFERENCES BETWEEN INCENTIVE GROUPS TABLE

146
Appendix J Absolute Mean Differences Between Incentive Groups Scale |Pos – Neg| |Pos – Both| |Neg – Both| SIMS Total 0.73 0.53 0.20 NI 0.21 0.35 0.14 AF 0.26 0.32 0.06 P 0.35 0.46 0.11 LI 0.14 0.11 0.25 AM 0.64 0.15 0.49 Mean 0.39 0.32 0.21 SCL-90-R SOM 0.64 4.71 5.35 O-C 1.33 0.50 0.83 I-S 5.27 2.60 2.67 DEP 5.09 4.00 1.09 ANX 1.50 1.76 0.26 HOS 0.52 1.04 0.52 PHOB 0.81 0.18 0.63 PAR 2.13 0.42 1.71 PSY 4.90 0.45 5.35 GSI 2.39 0.29 2.10 Mean 2.46 1.60 2.05 Note. Pos = Positive Incentive, Neg = Negative Incentive, Both = Both Incentives.

REFERENCES
Albert, S., Fox, H., & Kahn, M. (1980). Faking psychosis on the Rorschach: Can expert
judges detect malingering?. Journal of Personality Assessment, 44(2), 115-119.
doi:10.1207/s15327752jpa4402_1.
Alwes, Y. R., Clark, J. A., Berry, D. T. R., & Granacher, R. P. (2006). Screening for
feigning in a civil forensic setting. Journal of Clinical and Experimental
Neuropsychology, 30(2), 1-8.
American Psychiatric Association (2000). Diagnostic and statistical manual of mental
disorder (4thed. – text revision). Washington, D.C.: Author.
Arbisi, P. A., & Ben-Porath, Y. S. (1995). On MMPI – 2 infrequency response scale for
use with psychopathological populations: The Infrequency Psychopathology
Scale F(p). Psychological Assessment, 7, 424-431.
Arbisi, P. A., & Ben-Porath, Y. S. (1998). The ability of Minnesota Multiphasic
Personality Inventory-2 validity scales to detect fake-bad responses in psychiatric
inpatients. Psychological Assessment, 10, 221–228.
Arbisi, P. A., Ben-Porath, Y. S., & McNulty, J. (2006). The ability of the MMPI-2 to detect
feigned PTSD within the context of compensation seeking. Psychological
Services, 3(4), 249-261.
Archer, R. P., Buffington-Vollum, J. K., Stredny, R. V., & Handel, R. W. (2006). A survey
of psychological test use patterns among forensic psychologists. Journal of
Personality Assessment, 87, 84-94.
147

Archer, R. P., Handel, R. W., Greene, R. L., Baer, R. A., & Elkins, D. E. (2001). An
evaluation of the usefulness of the MMPI-2 F(p) scale. Journal of Personality
Assessment, 76, 282-295.
Baer, R. A., & Miller, J. (2002). Underreporting of psychopathology on the MMPI-2: A
meta-analytic review. Psychological Assessment, 14, 16-26.
Baer, R., & Wetter, M. (1997). Effects of information about validity scales on
underreporting of symptoms on the Personality Assessment Inventory. Journal of
Personality Assessment, 68, 402-413.
Baer, R. A., Wetter, M. W., & Berry, D. T. R. (1992). Detection of underreporting of
psychopathology on the MMPI: A meta-analysis. Clinical Psychology Review, 12, 509-525.
Bagby, R. M., Buis, T. E., & Nicholson, R. A. (1995). Relative effectiveness of the
standard validity scales in detecting fake-good and fake-bad responding: Replication and extension. Psychological Assessment, 7, 84-92.
Bagby, R. M., Gillis, J. R., & Dickens, S. E. (1990). Detection of dissimulation on a new
generation of objective personality measures. Behavioral Sciences and the Law,
8, 93-102.
Bagby, R. M., Nicholson, R. A., Bacchiochi, J. R., Ryder, A. G. V., & Bury, A. S. (2002).
The predictive capacity of the MMPI-2 and PAI validity scales and indexes to
detect coached and uncoached feigning. Journal of Personality Assessment, 78,
69-86.
148

Bagby, R. M., Rogers, R., Nicholson, R. A., Buis, T., Seeman, M. V., & Rector, N. A.
(1997). Does clinical training facilitate feigning schizophrenia on the MMPI-2?
Psychological Assessment, 9, 106-112.
Baity, M. R., Siefert, C. J., Chambers, A., & Blais, M. A. (2007). Deceptiveness on the
PAI: A study of naïve faking with psychiatric inpatients. Journal of Personality
Assessment, 88, 16-24.
Beaber, R. J., Marston, A., Michelli, J., & Mills, M. J. (1985). A brief test for measuring
malingering in schizophrenic individuals. American Journal of Psychiatry, 142,
1478-1481.
Bernard, L. (1990). Prospects for faking believable memory deficits on
neuropsychological tests and the use of incentives in simulation research.
Journal of Clinical and Experimental Neuropsychology, 12, 715-728.
Berney, T. P. (1973). A review of simulated illness. South African Medical Journal, 47,
1429-1434.
Berry, D. T. R., Baer, R. A., & Harris, M. J. (1991). Detection of malingering on the
MMPI: A meta-analytic review. Clinical Psychology Review, 11, 585-598.
Bianchini, K. J., Curtis, K. L., & Greve, K. W. (2006). Compensation and malingering in
traumatic brain injury: A dose-response relationship? Clinical Neuropsychologist,
20, 831–847
Binder, L. M. (1993). Assessment of malingering after mild head trauma with the Portland Digit Recognition Test: Erratum. Journal of Clinical and Experimental Neuropsychology, 15(2), 170-182.
149

Binder, L. M., & Rohling, M. L. (1996). Money matters: A meta-analytic review of the
effects of financial incentives on recovery after closed head injury. American
Journal of Psychiatry, 153, 7-10.
Blau, T. H. (1998). The psychologist as expert witness (2nd ed.). Hoboken, NJ: John
Wiley & Sons, Inc.
Boccaccini, M. T., Murrie, D. C., & Duncan, S. A. (2006). Screening for malingering in a
criminal-forensic sample with the Personality Assessment Inventory.
Psychological Assessment, 18(4), 415-423.
Borum, R., Otto, R., & Golding, S. (1993). Improving clinical judgment and decision
making in forensic evaluation. Journal of Psychiatry and Law, 21, 35-76.
Bourg, S., Connor, E. J., Landis, E. E. (1995). The impact of expertise and sufficient
information on psychologists’ ability to detect malingering. Behavioral Sciences &
the Law, 13(4), 505-515.
Brandt, J. (1988). Malingered amnesia. In R. Rogers (Ed.), Clinical assessment of
malingering and deception (pp. 65-83). New York: Guilford Press.
Brennan, A. M., & Gouvier, W. D. (2006). Are we honestly studying malingering? A
profile and comparison of simulated and suspected malingerers. Applied
Neuropsychology, 13(1), 1-11.
Butcher, J. N., & Han, K. (1995). Development of an MMPI-2 scale to assess the
presentation of self in a superlative manner: The S scale. In J. N. Butcher & C. D.
Spielberger (Eds.), Advances in personality assessment (Vol. 10, pp. 25-50).
Hillsdale, NJ: Erlbaum.
150
Butcher, J. N., Dahlstrom, W. G., Graham, J. R., Tellegen, A., & Kaemmer, B. (1989).
MMPI-2: Manual for administration and scoring. Minneapolis: University of
Minnesota Press.
Butcher, J. N., Rouse, S. V. (1996). Personality: Individual differences and clinical
assessment. Annual Review of Psychology, 47, 87-111.
Caparrós-Caparrós, B., Villar-Hoz, E., Juan-Ferrer, J., & Viñas-Poch, F. (2007).
Symptom Check-List-90-R: Fiabilidad, datos normativos y estructura factorial en
estudiantes universitarios [Symptom Checklist-90-R: Psychometric properties in
a representative sample of university students]. International Journal of Clinical
and Health Psychology, 7(3), 781-794.
Cashel, M. L., Rogers, R., Sewell, K. W., & Martin-Cannici, C. (1995). The Personality
Assessment Inventory (PAI) and the detection of defensiveness. Assessment, 2,
333-342.
Clark, M. E., Gironda, R. J., & Young, R. W. (2003). Detection of back random
responding: Effectiveness of MMPI-2 and Personality Assessment validity
indices. Psychological Assessment, 15, 223-234.
Cornell, D., & Hawk, G. (1989). Clinical presentation of malingerers diagnosed by
experienced forensic psychologists. Law and Human Behavior, 13(4), 375-383.
doi:10.1007/BF01056409.
Crowley, M. E. (1952). The use of the Kent EGY for the detection of malingering.
Journal of Clinical Psychology, 8, 332-337.
Dahlstrom, W. G, Welsh, G. S., & Dahlstrom, L. E. (1972). An MMPI handbook: I.
Clinical interpretation. Oxford, England: University of Minnesota Press.
151
Derogatis, L.R. (1994). SCL-90-R: Administration, scoring and procedures manual (3rd
ed.). Minneapolis, MN: National Computer Systems.
Derogatis, L. R. (2000). SCL-90-R. In A. E. Kazdin (Ed.), Encyclopedia of psychology
(Vol. 7, pp. 192-193). New York, NY: Oxford University Press.
Edens, J. F., Cruise, K. R., & Buffington-Vollum, J. K. (2001). Forensic and correctional
applications of the Personality Assessment Inventory. Behavioral Sciences and
the Law, 19, 519-543.
Edens, J., Otto, R., & Dwyer, T. (1998). Susceptibility of the Trauma Symptom Inventory
to malingering. Journal of Personality Assessment, 71(3), 379-392.
doi:10.1207/s15327752jpa7103.
Edens, J. F., Otto, R. K., & Dwyer, T. (1999). Utility of the Structured Inventory of
Malingered Symptomatology in identifying persons motivated to malinger
psychopathology. Journal of the American Academy of Psychiatry and the Law,
27, 387-396.
Edens, J., Poythress, N., & Watkins-Clay, M. (2007). Detection of malingering in
psychiatric unit and general population prison inmates: A comparison of the PAI,
SIMS, and SIRS. Journal of Personality Assessment, 88(1), 33-42.
doi:10.1207/s15327752jpa8801_05.
Elhai, J. D., Butcher, J. J., Reeves, A. N., Baugher, S. N., Gray, M. J., Jacobs, G. A.,
Fricker-Elhai, A. E., North, T. C., & Arbisi, P. (2007). Varying cautionary
instructions, monetary incentives, and comorbid diagnostic training in malingered
psychopathology research. Journal of Personality Assessment, 88(3), 328-337.
152

Elhai, J., Frueh, B., Davis, J., Jacobs, G., & Hammer, M. (2003). Clinical presentations
in combat veterans diagnosed with posttraumatic stress disorder. Journal of
Clinical Psychology, 59(3), 385-397. doi:10.1002/jclp.10135.
Feeley, T., & deTurck, M. (1998). The behavioral correlates of sanctioned and
unsanctioned deceptive communication. Journal of Nonverbal Behavior, 22(3),
189-204. doi:10.1023/A:1022966505471.
FBI (2007). Uniform crime reports: Estimated number of arrests, U.S., 2006). Retrieved
on March, 25, 2010 from http://www.fbi.gov/about-us/cjis/ucr/crime-in-the-
u.s/2006.
Fishbain, D. A., Cutler, R., Rosomoff, H. L., & Rosomoff, R. S. (1999). Chronic pain
disability exaggeration/malingering and submaximal effort research. Clinical
Journal of Pain, 15, 244-274.
Frederick, R. I., Sarfaty, S. D., Johnston, J. D., & Powel, J. (1994). Validation of a
detector of response bias on a forced-choice test of nonverbal ability.
Neuropsychology, 8(1), 118–125.
Gacono, C.B., Meloy, J. R., & Sheppard, K. (1995). A clinical investigation of
malingering and psychopathy in hospitalized insanity aquittees. Bulletin of the
American Academy of Psychiatry & the Law, 23(3), 387-397.
Gavin, H. (1843). On the feigned and factitious diseases of soldiers and seamen; with
hints for the examination, and rules for the detection of impostors. On feigned
and factitious diseases, chiefly of soldiers and seamen, on the means used to
simulate or produce them, and on the best modes of discovering impostors:
Being the prize essay in the class of military surgery in the University of
153
Edinburgh, session 1835-6, with additions (pp. 9-35). London Great Britain: John
Churchill. doi:10.1037/11951-001.
Geller, J. L., Erlen, J., Kaye, N. S., & Fisher, W. H. (1990). Feigned insanity in
nineteenth-century America: Tactics, trials and truth. Behavioral Sciences and
the Law, 8(1), 3-26.
Gillis, J., Rogers, R., & Bagby, R. (1991). Validity of the M Test: Simulation-design and
natural-group approaches. Journal of Personality Assessment, 57(1), 130-140.
doi:10.1207/s15327752jpa5701_15.
Gothard, S., Rogers, R., & Sewell, K. (1995). Feigning incompetency to stand trial: An
investigation of the Georgia Court Competency Test. Law and Human Behavior,
19(4), 363-373. doi:10.1007/BF01499137.
Gough, H. (1947). Simulated patterns on the Minnesota Multiphasic Personality
Inventory. Journal of Abnormal and Social Psychology, 42(2), 215-225.
doi:10.1037/h0063295.
Gough, H. G. (1954). Some common misconceptions about neuroticism. Journal of
Consulting Psychology, 18, 287-292.
Gough, H. G. (1957). California Psychological Inventory manual. Palo Alto, CA:
Consulting Psychologists Press.
Graham, J. R., Watts, D., & Timbrook, R. E. (1991). Detecting fake-good and fake-bad
MMPI-2 profiles. Journal of Personality Assessment, 57, 264-277.
Greene, R. L. (1991). The MMPI – 2/MMPI: An interpretive manual. Boston: Allyn &
Bacon.
154

Greene, R. L. (1997). Assessment of malingering and defensiveness on multiscale
inventories. In R. Rogers (Ed.), Clinical assessment of malingering and deception
(2nd ed., pp. 169-207). New York, NY: Guilford.
Greene, R. L. (2000). The MMPI-2: An interpretive manual (2nd ed.). Needham Heights,
MA: Allyn & Bacon.
Greene, R. L. (2008). Malingering and defensiveness on the MMPI-2. In R. Rogers (Ed.)
Clinical assessment of malingering and deception (3rd ed., pp. 159-181). New
York, NY: Guilford Press.
Greiffenstein, M. F., Baker, W. J., & Gola, T. (1994). Validation of malingered amnesic
measures with a large clinical sample. Psychological Assessment, 6, 218-224.
Guy, L. S., & Miller, H. A. (2004). Screening for malingered psychopathology in a
correctional setting: Utility of the Miller-Forensic Assessment of Symptoms Test
(M-FAST). Criminal Justice and Behavior, 31(6), 695-716.
Haines, M. E., & Norris, M. P. (1995). Detecting the malingering of cognitive deficits: An
update. Neuropsychology Review, 5(2), 125-148.
Hathaway, S. R., & McKinley, J. C. (1940). A multiphasic personality schedule
(Minnesota): I. Construction of the schedule. Journal of Psychology:
Interdisciplinary and Applied, 10, 249-254.
Hathaway, S. R., & McKinley, J. C. (1943). The Minnesota Multiphasic Personality
Inventory manual. New York: Psychological Corporation.
Hay, G. G. (1983). Feigned psychosis: A review of the simulation of mental illness.
British Journal of Psychiatry, 143, 8-10.
155
Heinze, M. C., & Purisch, A. D. (2001). Beneath the mask: Use of psychological tests to
detect and subtype malingering in criminal defendants. Journal of Forensic
Psychology Practice, 1(4), 23-52.
Iverson, G. L., Franzen, M. D., & Hammond, J. A. (1995). Examination of inmates' ability
to malinger on the MMPI-2. Psychological Assessment, 7, 118-121.
Jackson, R. L., Rogers, R., & Sewell, K. W. (2005). Forensic applications of the Miller
Forensic Assessment of Symptoms Test (M-FAST): Screening for feigned
disorders in competency to stand trial evaluations. Law and Human Behavior, 29,
199-210.
Jelicic, M., Hessels, A., & Merckelbach, H. (2006). Detection of feigned psychosis with
the structured inventory of malingered symptomatology (SIMS): A study of
coached and uncoached simulators. Journal of Psychopathology and Behavioral
Assessment, 28(1), 19-22.
Jelicic, M., Merckelbach, H., Candel, I., & Geraerts, E. (2007). Detection of feigned
cognitive dysfunction using special malinger tests: A simulation study in naïve
and coached malingerers. International Journal of Neuroscience, 117(8), 1185-
1192. doi:10.1080/00207450600934697.
Johnson, K. L., & Lesniak-Karpiak, K. (1997). The effect of warning on malingering on
memory and motor tasks in college samples. Archives of Clinical
Neuropsychology, 12(3), 231-238.
Kincaid, J. P., Fishburne, R. P., Rogers, R. L., & Chissom, B. S. (1975). Derivation of
new readability formulas (Automated Readability Index, Fog Count, Flesch
156

Reading Ease Formula) for Navy enlisted personnel (Research Branch Report 8-
75). Memphis: Naval Air Station.
Kropp, P. R., & Rogers, R. (1993). Understanding malingering: Motivation, method, and
detection. In M. Lewis & C. Saarni (Eds.), Lying and deception in everyday life
(pp. 201-216). New York: Guilford Press.
Kucharski, L. T., Falkenbach, D. M., Egan, S. S., & Duncan, S. (2006). Antisocial
personality disorder and the malingering of psychiatric disorder: A study of
criminal defendants. International Journal of Forensic Mental Health, 5(2), 195-
204.
Kucharski, L. T., Tooney, J. P., Fila, K., & Duncan, S. (2007). Detection of malingering
of psychiatric disorder with the Personality Assessment Inventory: An
investigation of criminal defendants. Journal of Personality Assessment, 88, 25-
32.
Lally, S. J. (2003). What tests are acceptable for use in forensic evaluations?
Professional Psychology: Research and Practice, 34, 491-498.
Lamb, D. G., Berry, D. T. R., Wetter, M. W., & Baer, R. A. (1994). Effects of two types of
information on malingering of closed head injury on the MMPI-2: An analog
investigation. Psychological Assessment 6(1), 8-13.
Larrabee, G. J. (Ed.). (2005). Forensic neuropsychology: A scientific approach. New
York: Oxford University Press.
Lees-Haley, P. R., English, L. T., & Glenn, W. J. (1991). A fake bad scale for the MMPI
– 2 for personal-injury claimants. Psychological Reports, 68, 203-210.
157

Lewis, J. L. (2001). Detection of malingering in a forensic population: The utility of the
SIMS. Dissertation Abstracts International: Section B: The Sciences and
Engineering, 61(11-B), 6140. (Doctoral dissertation, www.il.proquest.com/umi.)
Lewis, J., Simcox, A., & Berry, D. (2002). Screening for feigned psychiatric symptoms in
a forensic sample by using the MMPI-2 and the Structured Inventory of
Malingered Symptomatology. Psychological Assessment, 14(2), 170-176.
doi:10.1037/1040-3590.14.2.170.
Liff, C. D. (2003). The detection of neuropsychological malingering. Unpublished
doctoral dissertation, University of North Texas.
Meehl, P. E., & Hathaway, S. R. (1946). The K factor as a suppressor variable in the
MMPI. Journal of Applied Psychology, 30, 525-564.
Merckelbach, H., Smeets, T., & Jelicic, M. (2009). Experimental simulation: Type of
malingering scenario makes a difference. Journal of Forensic Psychiatry &
Psychology, 20(3), 378-386. doi:10.1080/14789940802456686.
Meyers, J., & Volbrecht, M. (1998). Validation of Reliable Digits for detection of
malingering. Assessment, 5(3),303–307.
Miller, H. A. (2001). M-Fast: Miller Forensic Assessment of Symptoms Test professional
manual. Odessa, FL: Psychological Assessment Resources.
Miller, G., & Stiff, J. (1993). Deceptive communication. Thousand Oaks, CA US: Sage
Publications, Inc.
Millon, T. (1983). Millon Clinical Multiaxial Inventory. Minneapolis: National Computer
Systems.
158

Mittenburg, W., Patton, C., Canyock, E. M., & Condit, D. C. (2002). Base rates of
malingering and symptom exaggeration. Journal of Clinical and Experimental
Neuropsychology, 24, 1094-1102.
Morey, L. C. (1991). The Personality Assessment Inventory professional manual.
Odessa, FL: Psychological Assessment Resources.
Morey, L. C. (1996). An interpretive guide to the Personality Assessment Inventory.
Odessa, FL: Psychological Assessment Resources.
Morey, L. C., & Lanier, V. W. (1998). Operating characteristics of six response distortion
indicators for the Personality Assessment Inventory. Assessment, 5, 203-214.
Nichols, D. S., & Greene, R. L. (1997). Dimensions of deception in personality
assessment: The example of the MMPI-2. Journal of Personality Assessment,
68(2), 251-266.
North, C. S., & Yutzy, S. H. (2005). Dissociative disorders, factitious disorders, and
malingering. In Rubin, E. H. & Zorumski, C. F. (Eds.), Adult Psychiatry (2nd ed.,
pp. 125-143). Malden, MA: Blackwell Publishing.
Office of Postsecondary Education (n.d.). The Campus security data analysis cutting
tool. Retrieved March, 25, 2010 from http://ope.ed.gov/security/
Orey, S. A., Cragar, D. E., & Berry, D. T. R. (2000). The effects of two motivational
manipulations on the neuropsychological performance of mildly head-injured
college students. Archives of Clinical Neuropsychology, 15, 335–348.
Palermo, G. B. (2004). Editorial: A look at malingering. International Journal of Offender
Therapy and Comparative Criminology, 48(3), 265-267.
159

Patrick, C. J., & Iacono, W. G. (1989). Psychopathy, threat, and polygraph test
accuracy. Journal of Applied Psychology, 74(2), 347-355.
Resnick, P. J. (1988). Malingered psychosis. In Rogers, R. (Ed.) Clinical assessment of
malingering and deception (pp. 84-103). New York, NY: Guilford Press.
Resnick, P. J. (1997). Malingered psychosis. In Rogers, R. (Ed.) Clinical assessment of
malingering and deception (2nd ed., pp. 135-157). New York, NY: Guilford Press.
Resnick, P. J. (1997). Malingering of posttraumatic disorders. In R. Rogers (Ed.),
Clinical assessment of malingering and deception (2nd ed., pp. 84-103). New
York: Guilford Press.
Resnick, P. J., & Knoll, J. L. (2008). Malingered psychosis. In R. Rogers (Ed.), Clinical
assessment of malingering and deception (3rd ed., pp. 51-68). New York: Guilford
Press.
Resnick, P. J., West, S., & Payne, J. W. (2008). Malingering of posttraumatic disorders.
In R. Rogers (Ed.), Clinical assessment of malingering and deception (3rd ed., pp.
109-127). New York: Guilford Press.
Rogers, R. (1984). Toward an empirical model of malingering and deception. Behavioral
Science and the Law, 2, 93-112.
Rogers, R. (Ed.) (1988). Clinical assessment of malingering and deception (1st ed.).
New York, NY: Guilford Press.
Rogers, R. (Ed.) (1997). Clinical assessment of malingering and deception (2nd ed.).
New York, NY: Guilford Press.
160
Rogers, R. (2008a).An introduction to response styles. In R. Rogers (Ed.), Clinical
assessment of malingering and deception (3rd ed., pp. 3-13). New York, NY:
Guildford Press.
Rogers, R. (2008b). Detection strategies in malingering and defensiveness. In R.
Rogers (Ed.), Clinical assessment of malingering and deception (3rd ed., pp. 14-
38). New York, NY: Guildford Press.
Rogers, R. (2008c). Researching response style. In R. Rogers (Ed.), Clinical
assessment of malingering and deception (3rd ed., pp. 411-434). New York, NY:
Guildford Press.
Rogers, R. (2008d). Structured interviews and dissimulation. In R. Rogers (Ed.), Clinical
assessment of malingering and deception (3rd ed., pp. 411-434). New York, NY:
Guildford Press.
Rogers, R.., Bagby, R. M., & Chakraborty, D. (1993). Feigning schizophrenic disorders
on the MMPI-2: Detection of coached simulators. Journal of Personality
Assessment, 60(2), 215-226.
Rogers, R., Bagby, R. M., & Dickens, S. E. (1992). Structured Interview of Reported
Symptoms professional manual. Odessa, FL: Psychological Assessment
Resources.
Rogers, R., & Bender, S. D. (2003). Evaluation of malingering and deception. In A. M.
Goldstein (Ed.), Handbook of psychology: forensic psychology, Vol. 11 (pp. 109-
129). Hoboken, NJ: John Wiley & Sons, Inc.
Rogers, R., & Cavanaugh, J. L. (1983). ‘Nothing but the truth’…A reexamination of
malingering. Journal of Psychiatry & Law, 11(4), 443-459.
161

Rogers, R., & Correa, A. (2008). Determinations of malingering: Evolution from case-
based methods to detection strategies. Psychiatry, Psychology and Law, 15(2),
213-223. doi:10.1080/13218710802014501.
Rogers. R., & Cruise, K. R. (1998). Assessment of malingering with simulation designs:
Threats to external validity. Law and Human Behavior, 22(3), 273-285.
Rogers, R., Gillis, J., & Bagby, R. (1990). The SIRS as a measure of malingering: A
validation study with a correctional sample. Behavioral Sciences & the Law, 8(1),
85-92. doi:10.1002/bsl.2370080110.
Rogers, R., Gillis, J. R., Bagby, R. M., & Monteiro, E. (1991). Detection of malingering
on the structured interview of reported symptoms (SIRS): A study of coached and
uncoached simulators. Psychological Assessment: A Journal of Consulting and
Clinical Psychology, 3(4), 673-677.
Rogers, R., Gillis, J., Dickens, S., & Bagby, R. (1991). Standardized assessment of
malingering: Validation of the Structured Interview of Reported Symptoms.
Psychological Assessment: A Journal of Consulting and Clinical Psychology,
3(1), 89-96. doi:10.1037/1040-3590.3.1.89.
Rogers. R., Harrell, E. H., & Liff, C. D. (1993). Feigning neuropsychological impairment:
A critical review of methodological and clinical considerations. Clinical
Psychology Review, 13(3), 255-274.
Rogers, R., Hinds, J. D., & Sewell, K. W. (1996). Feigning psychopathology among
adolescent offenders: Validation of the SIRS, MMPI-A, and SIMS. Journal of
Personality Assessment, 67, 244-257.
162

Rogers, R., Jackson, R. L., & Kaminski, P. L. (2005). Factitious psychological disorders:
The overlooked response style in forensic evaluations. Journal of Forensic
Psychology Practice, 5, 21-41.
Rogers, R., Jackson, R. L., Sewell, K. W., & Salekin, K. L. (2005). Detection strategies
for malingering: A confirmatory factor analysis of the SIRS. Criminal Justice and
Behavior, 32(5), 511-525.
Rogers, R., Kropp, P., Bagby, R., & Dickens, S. (1992). Faking specific disorders: A
study of the Structured Interview of Reported Symptoms (SIRS). Journal of
Clinical Psychology, 48(5), 643-648. doi:10.1002/1097-
4679(199209)48:5<643::AID-JCLP2270480511>3.0.CO;2-2.
Rogers, R., Ornduff, S. R., & Sewell, K. W. (1993). Feigning specific disorders: A study
of the Personality Assessment Inventory (PAI). Journal of Personality
Assessment, 60(3), 554-561.
Rogers, R., Salekin, R. T., Sewell, K. W., Goldstein, A., & Leonard, K. (1998). A
comparison of forensic and nonforensic malingerers: A prototypical analysis of
explanatory models. Law and Human Behavior, 22, 353-367.
Rogers, R., Sewell, K. W., Cruise, K. R., Wang, E. W., & Ustad, K. L. (1998). The PAI
and feigning: A cautionary note on its use in forensic-correctional settings.
Assessment, 5, 399-405.
Rogers, R., Sewell, K. W., & Goldstein, A. M. (1994). Explanatory models of
malingering. Law and Human Behavior, 18(5), 543-551.
163

Rogers, R., Sewell, K. W., & Gillard, N. D. (2010). Structured Interview of Reported
Symptoms, Second Edition, Test Manual. Lutz, FL: Psychological Assessment
Resources, Inc.
Rogers, R., Sewell, K. W., Martin, M. A., & Vitacco, M. J. (2003). Detection of feigned
mental disorders: A meta-analysis of the MMPI-2 and malingering. Assessment,
10, 160-177.
Rogers, R., Sewell, K. W., Morey, L. C., & Ustad, K. L. (1996). Detection of feigned
mental disorder on the Personality Assessment Inventory: A discriminant
analysis. Journal of Personality Assessment, 67, 629-640.
Rogers, R., Sewell, K. W., & Salekin, R. (1994). A meta-analysis of malingering on the
MMPI-2. Assessment, 1, 227-237.
Rogers, R., & Shuman, D. W. (2005). Fundamentals of forensic practice: Mental health
and criminal law. New York, NY: Springer Science & Business Media, 445.
Rogers. R., & Vitacco, M. J. (2002). Forensic assessment of malingering and related
response styles. In B. Van Dorsen (Ed.), Forensic psychology: From classroom
to courtroom. New York, NY: Kluwer Academic/Plenum Publishers.
Ruiz, M. A., Drake, E. B., Glass, A., Marcotte, D., & van Gorp, W. G. (2002). Trying to
beat the system misuse of the internet to assist in avoiding detection of
psychological symptom dissimulation. Professional Psychology: Research and
Practice, 33, 294–299.
SAMHSA - Office of Applied Studies, Substance Abuse and Mental Health Services
Administration (2005). The National Survey on Drug Use and Health. Retrieved
March 25, 2010, from http://www.oas.samhsa.gov/2k5/college/college.cfm
164

Sellbom, M., & Bagby, R. M. (2008). Response styles on multiscale inventories. In R.
Rogers (Ed.), Clinical assessment of malingering and deception (3rd ed., pp. 182-
206). New York, NY: Guilford Press.
Sellbom, M., & Ben-Porath, Y. S. (2006). The Minnesota multiphasic personality
inventory-2. In R. P. Archer (Ed.), Forensic uses of clinical assessment
instruments (pp. 19-55). Mahwah, NJ: Lawrence Erlbaum Associates, Inc.
Sewell, K. W., & Rogers, R. (1994). Response consistency and the MMPI – 2:
Development of a simplified screening scale. Assessment, 1, 293-299.
Shadish, W., Cook, T., & Campbell, D. (2002) Experimental and quasi-experimental
designs for generalized causal inference. New York: Houghton Mifflin.
Shum, D. H., O’Gorman, J. G., & Alpar, A. (2004). Effects of incentive and preparation
time on performance and classification accuracy of standard and malingering-
specific memory tasks. Archives of Clinical Neuropsychology, 19, 817–823.
Slick, D. J., Sherman, E., & Iverson, G. (1999). Diagnostic for malingered
neurocognitive dysfunction: Proposed standards for clinical practice and
research. The Clinical Neuropsychologist, 13, 545-561.
Smith, G. P. (1992). Detection of malingering: A validation study of the SLAM test.
Unpublished dissertation. University of Missouri-St. Louis.
Smith, G. P. (2008). Brief screening measures of the detection of feigned
psychopathology. In R. Rogers (Ed.), Clinical assessment of malingering and
deception. (3rd ed., pp. 323-339). New York, NY: Guilford Press.
165

Suhr, J., & Gunstad, J. (2000). The effects of coaching on the sensitivity and specificity
of malingering measures. Archives of Clinical Neuropsychology, 15(5), 415-424.
doi:10.1016/S0887-6177(99)00033-5.
Storm, J., & Graham, J. (2000). Detection of coached general malingering on the MMPI-
2. Psychological Assessment, 12, 158-165.
Timbrook, R., Graham, J., Keiller, S., & Watts, D. (1993). Comparison of the Wiener-
Harmon Subtle-Obvious scales and the standard validity scales in detecting valid
and invalid MMPI-2 profiles. Psychological Assessment, 5(1), 53-61.
doi:10.1037/1040-3590.5.1.53.
Trueblood, W., & Schmidt, M. (1993). Malingering and other validity considerations in
the neuropsychological evaluation of mild head injury. Journal of Clinical and
Experimental Neuropsychology, 15, 578-590.
Ustad, K. L. (1998). Assessment of malingering in a jail referral population: Screening
and comprehensive evaluation. Unpublished doctoral dissertation, University of
North Texas, Denton.
Ustad, K. L., & Rogers, R. (1996). Malingering and deception: Conceptual and clinical
issues in forensic practice. In L.B. Schlesinger (Ed.), Explorations in criminal
psychopathology: Clinical syndromes with forensic implications (pp. 300-319).
Springfield, IL: Charles C Thomas.
Veazet, C. H., Hays, J. R., Wagner, A. L., & Miller, H. A. (2005). Validity of the Miller
Forensic Assessment of Symptoms Test in psychiatric patients. Psychological
Reports, 96, 771-774.
166

Viglione, D. J., Fals-Stewart, W., & Moxham, E. (1995). Maximizing internal and
external validity in MMPI malingering research: A study of a military population.
Journal of Personality Assessment, 65, 502-513.
Vitacco, M. J., Rogers, R., Gabel, J., & Munizza, J. (2007). An evaluation of malingering
screens with competency to stand trial patients: A known-groups comparison.
Law and Human Behavior, 31(3), 249-260.
Walker, J. N. (1962). An examination of the role of experimentally determined response
set in evaluating Edwards’ Social Desirability Scale. Journal of Consulting
Psychology, 26, 162-166.
Wang, E. W., Rogers, R., Giles, C. L., Diamond, P. M., Herrington-Wang, L. E., &
Taylor, E. R. (1997). A pilot study of the Personality Assessment Inventory (PAI)
in corrections: Assessment of malingering, suicide risk, and aggression in male
inmates. Behavioral Sciences and the Law, 15, 468-482.
Warren, J., Fitch, W., Dietz, P., & Rosenfeld, B. (1991). Criminal offense, psychiatric
diagnosis, and psycholegal opinion: An analysis of 894 pretrial referrals. Bulletin
of the American Academy of Psychiatry & the Law, 19(1), 63-69.
Weiner, D. N. (1948). Subtle and obvious keys for the MMPI. Journal of Consulting
Psychology, 12, 164-170.
Wetter, M., Baer, R., Berry, D., Robison, L. H., & Sumpter, J. (1993). MMPI-2 profiles of
motivated fakers given specific symptom information: A comparison to matched
patients. Psychological Assessment, 5(3), 317-323.
167

168
Wetter, M., Baer, R., Berry, D., Smith, G., & Larsen, L. (1992). Sensitivity of MMPI-2
validity scales to random responding and malingering. Psychological
Assessment, 4, 369-374.
Wetter, M., & Corrigan, S. (1995). Providing information to clients about psychological
tests: A survey of attorneys' and law students' attitudes. Professional
Psychology: Research and Practice, 26(5), 474-477. doi:10.1037/0735-
7028.26.5.474.
Widows, M., & Smith, G. P. (2005). Structured Inventory of Malingered Symptomatology
(SIMS) and professional manual. Odessa, FL: Psychological Assessment
Resources.
Wiggins, J. S. (1959). Interrelationships among MMPI measures of dissimulation under
standard and social desirability instructions. Journal of Consulting Psychology,
23, 419-427.
Wiggins, J. S. (1962). Social desirability under role playing instructions: A reply to
Walker. Journal of Consulting Psychology, 2, 107-111.
Wildman, R., & Wildman, R. (1999). The detection of malingering. Psychological
Reports, 84(2), 386-388. doi:10.2466/PR0.84.2.386-388.
Wilhelm, K. L., Franzen, M. D., Grinvalds, V. M., & Dews, S. M. (1991, November). Do
people given knowledge and offered money fake better? Paper presented at the
annual conference of the National Academy of Neuropsychology, Dallas, TX.
Youngsjohn, J. R., Lees-Hayley, P. R., & Binder, L. M. (1999). Comment: Warning
malingerers produces more sophisticated malingering. Archives of Clinical
Neuropsychology, 14(6), 511-515.