methodological and analytical issues in using the british crime survey to model the impact of...
Post on 21-Dec-2015
217 views
TRANSCRIPT

Methodological and analytical issues in using the British Crime Survey to model the impact of respondent Ethnicity:
Difficulties and solutions arising from an ESRC-UPTAP funded research project
Dr. Paula M. Kautt
BACKGROUND
Ethnicity and the BCS

The British Crime Survey• The British Crime Survey (BCS) is a face-to-face
victimisation survey utilising a nationally representative sample of adult, private household residents
• Since 1982, it has been used to examine a broad range of criminological questions– Yet, few analyses use it to examine variation in criminological
experiences between black and minority ethnic groups (BME) or the factors influencing those experiences
– Several methodological issues are associated with doing so• Design changes in 2001 means that data from previous
years are not comparable– Today’s discussion focuses on post-2001 BCS issues
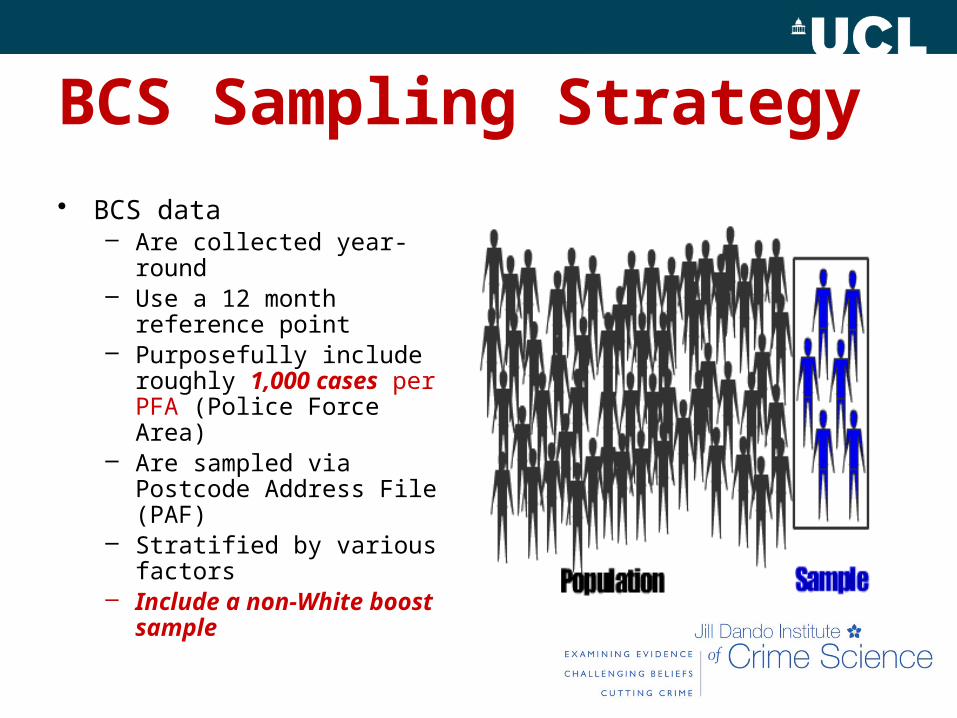
BCS Sampling Strategy
• BCS data– Are collected year-round– Use a 12 month reference
point– Purposefully include roughly
1,000 cases per PFA (Police Force Area)
– Are sampled via Postcode Address File (PAF)
– Stratified by various factors– Include a non-White boost
sample
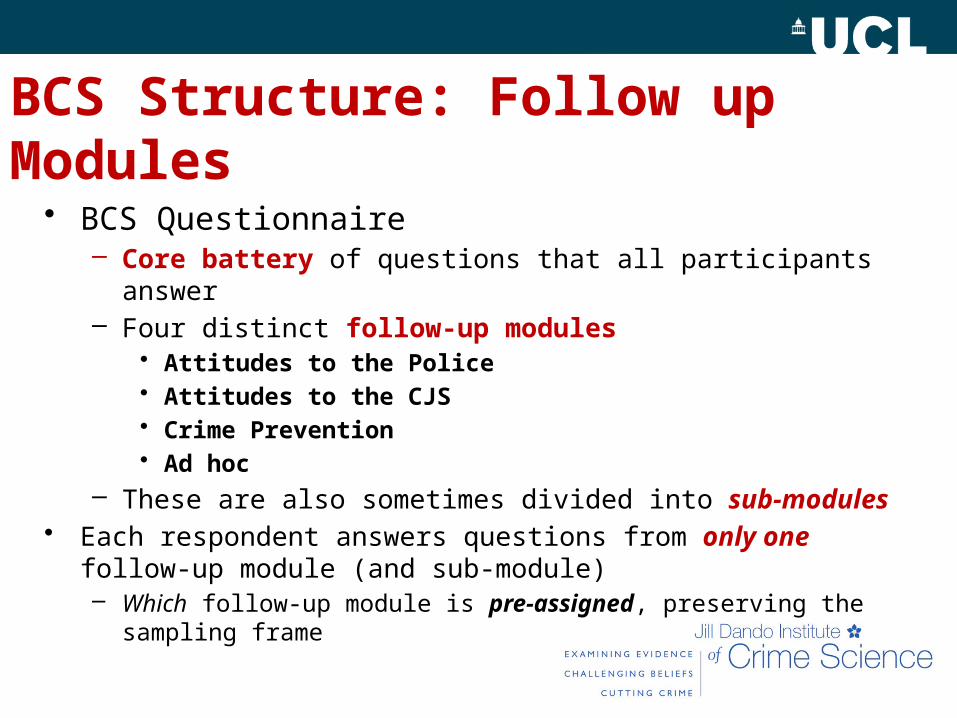
BCS Structure: Follow up Modules
• BCS Questionnaire– Core battery of questions that all participants answer– Four distinct follow-up modules
• Attitudes to the Police• Attitudes to the CJS• Crime Prevention • Ad hoc
– These are also sometimes divided into sub-modules• Each respondent answers questions from only one follow-up module
(and sub-module)– Which follow-up module is pre-assigned, preserving the sampling frame

DEFINING ETHNICITY
Ethnicity and the BCS
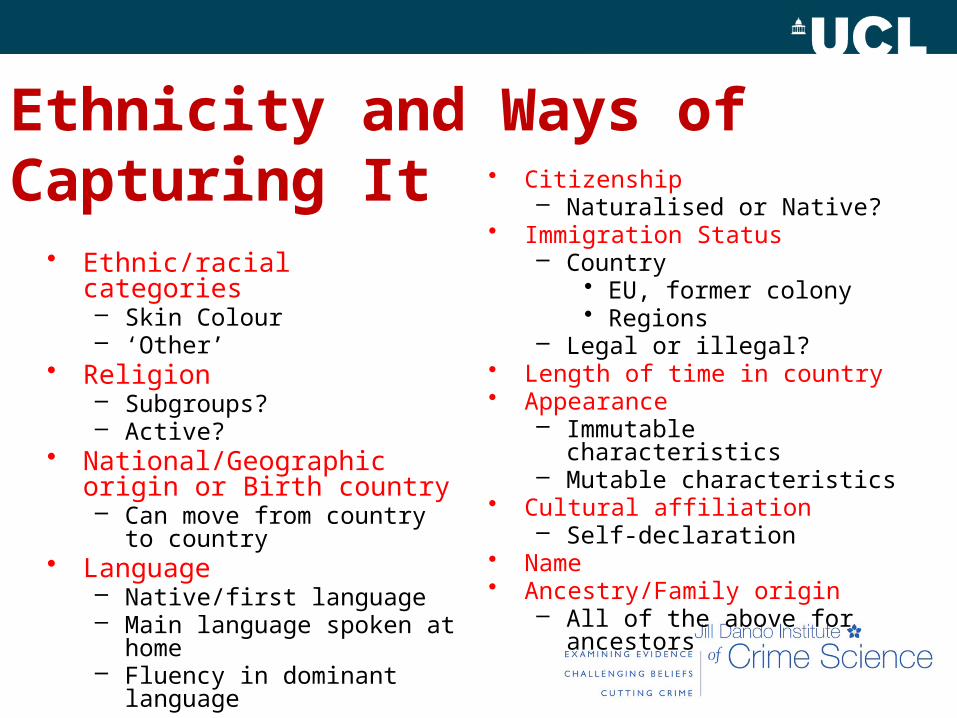
Ethnicity and Ways of Capturing It
• Ethnic/racial categories– Skin Colour– ‘Other’
• Religion– Subgroups?– Active?
• National/Geographic origin or Birth country– Can move from country to
country• Language
– Native/first language– Main language spoken at home– Fluency in dominant language
• Citizenship – Naturalised or Native?
• Immigration Status– Country
• EU, former colony• Regions
– Legal or illegal?• Length of time in country• Appearance
– Immutable characteristics– Mutable characteristics
• Cultural affiliation– Self-declaration
• Name• Ancestry/Family origin
– All of the above for ancestors

ANCESTRY
PhysicalAppearance
ETHNICIDENTITY
ReflectedAppearance
Group History
Components of Self-Identified Ethnic Identity (as modified from Hirschman & Perez, 2007)
Culture&
Language
Community Attachment &Participation
FamilySocialization
CollectiveMemory
Citizenship & Immigration Status
Religion & its Importance
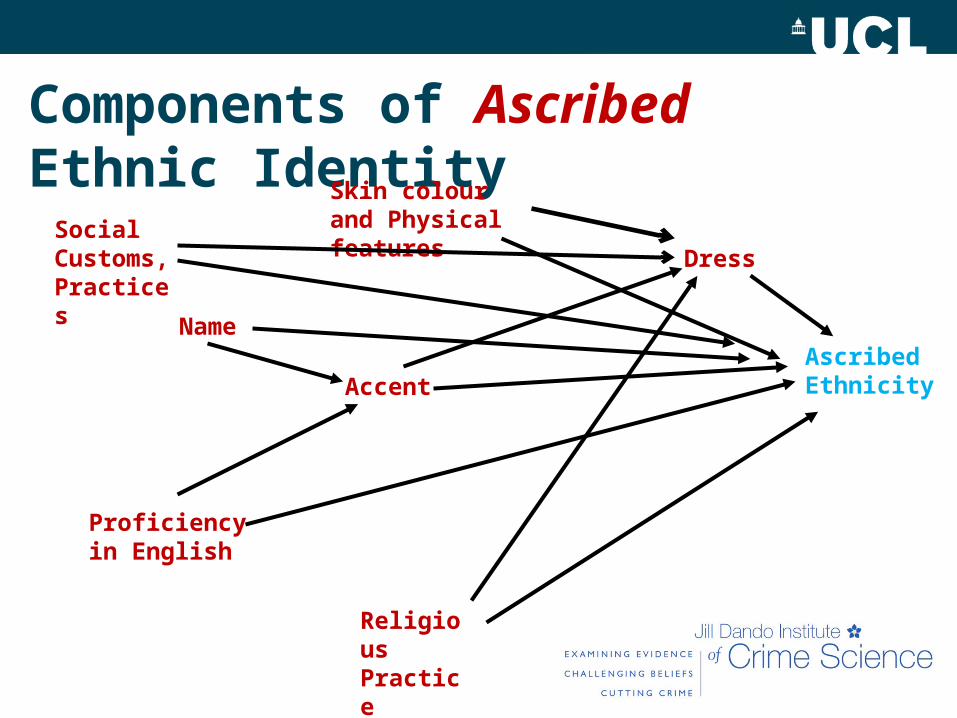
Components of Ascribed Ethnic Identity
Ascribed Ethnicity
Skin colour and Physical features
Name
Dress
Accent
Religious Practice
Proficiency in English
Social Customs, Practices
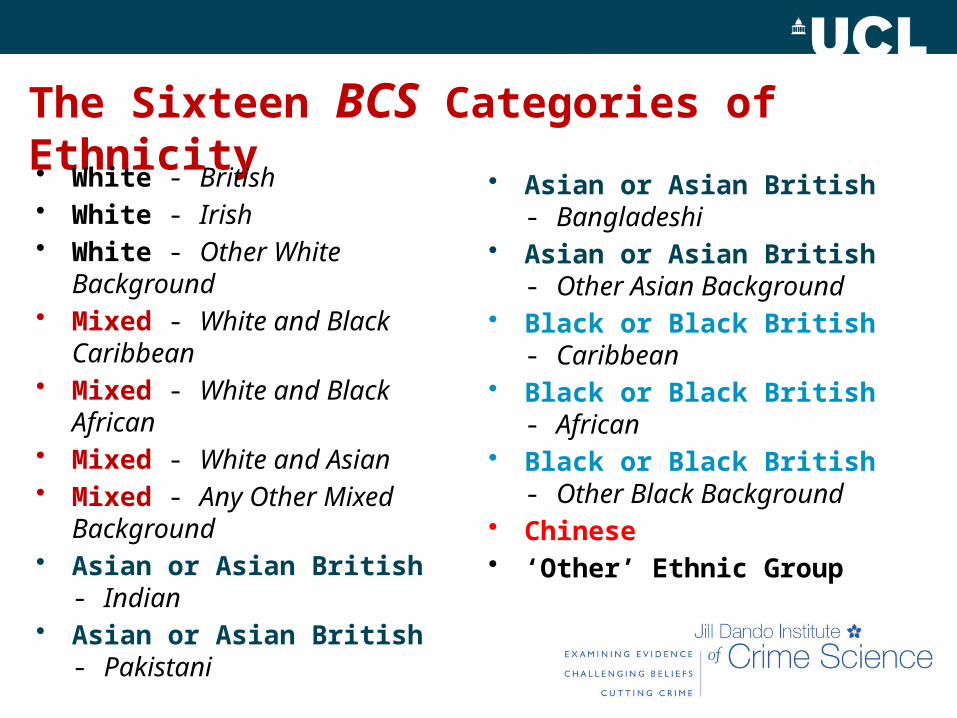
The Sixteen BCS Categories of Ethnicity
• White - British • White - Irish • White - Other White
Background • Mixed - White and Black
Caribbean • Mixed - White and Black African • Mixed - White and Asian • Mixed - Any Other Mixed
Background • Asian or Asian British - Indian • Asian or Asian British -
Pakistani
• Asian or Asian British - Bangladeshi
• Asian or Asian British - Other Asian Background
• Black or Black British - Caribbean
• Black or Black British - African
• Black or Black British - Other Black Background
• Chinese • ‘Other’ Ethnic Group

BCS-Captured EthnicityBenefits• Same 16 categories as
the UK Census – Permits consistency
between these data
• Respondent classifies self by categories
• Improvement over capturing only national origin
• Latest version captures year of arrival in country
Liabilities• Triple-barrelled question
– Traditional ‘race’• Asian, Black, White
– National origin• Pakistani, Indian, etc
– Regional origin• African, Caribbean
• Inconsistent and oversimplified• Non-representative
– ‘Nationality’ and ‘Country of birth’ only covers the British Isles
• Unwieldy– 15 Dummy variables for analysis

Changing Ethnic Definitions• Recommended improvements to the ethnicity
measure are slated for the 2011 UK Census– Two ethnic categories to be added
• Arab (under ‘Other’)• ‘Travelers’ and ‘gypsies’ (under White)• Plus a ‘write in’ option for ‘Other’
• In addition, it also captures– Language
• Respondent’s main language• How well respondent speaks English
• What does this mean for the BCS?
ANCESTRY
PhysicalAppearance
ETHNICIDENTITY
ReflectedAppearance
Group History
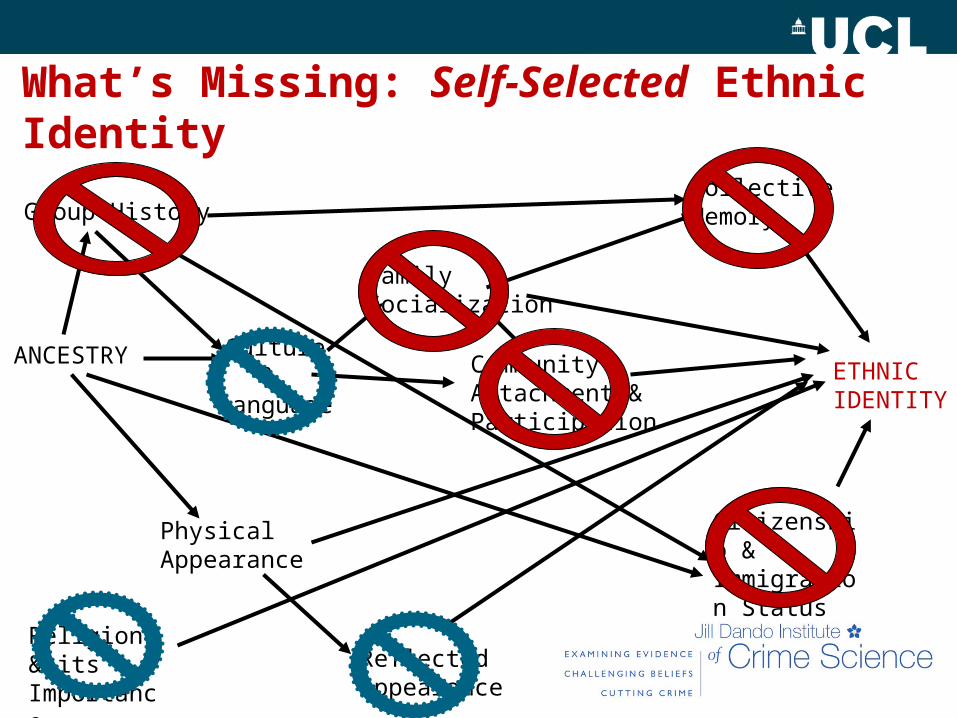
What’s Missing: Self-Selected Ethnic Identity
Culture&
Language
Community Attachment &Participation
FamilySocialization
CollectiveMemory
Citizenship & Immigration Status
Religion & its Importance

What’s missing?: Ascribed Ethnic Identity
Ascribed Ethnicity
Skin colour and Physical features
Name
Dress
Accent
Religious Practice
Proficiency in English
Social Customs & Practices

Improving BCS Ethnicity Measures• Census ethnicity measure must be incorporated into the
BCS to ensure comparability– This does not mean this need be the only ethnicity measure
included
• Options:– Include separate indicators for each pertinent aspect
• Language as with the Census• Consistently capture comprehensive measures for Nationality and
Country of Birth• Present the ‘write-in’ results for the ‘other’ ethnicities in the data set
– Use existing Multi-faceted Ethnicity Classification Instruments• e.g. Multi-Ethnic Identity Measure (MEIM)
– Combining methods– Do nothing; continue with current classification

ANALYTICAL SOLUTIONS
Ethnicity and the BCS

Anomalies of BCS data • As captured, only ‘Whites’ can be
simply ‘British’ – ‘White-British’
• It is not possible for ‘Black’ or ‘Asian’ respondents to simply be ‘British’ – Rather, specific ethnicity is always
attached. For example• ‘Black or Black-British–
Caribbean’• ‘Asian or Asian-British—Indian’
• The Data do not capture different ‘White’ ethnicities beyond ‘British’, ‘Irish’ and ‘Other’– ‘English,’ ‘Scottish’ and ‘Welsh’
are the ‘Other’ options– Thus, other ‘White’ ethnicities,
such as ‘Polish’, are not captured

Practical Analytical Solutions
• The BCS ethnicity categorisation scheme permits partitioning at two tiers– General Ethnicity
• A larger group differentiated mainly by traditional ‘race’ groupings
– White, Black, Asian– ‘Other’
– Specific Ethnicity• A more refined comparison of
groups falling within a general ethnicity
– Under ‘Asian’, the sub-groups ‘Indian’, ‘Pakistani’, ‘Bangladeshi’ can be compared
– Partially addresses consistency issue
• This split is precise but potentially non-representative of reality

What about ‘Other’?• The general ‘Other’ category
can be treated as another General Ethnicity
• The ‘Black—Other’ and ‘Asian—Other’ can also be treated as other Specific Ethnicity categories
• HOWEVER: currently no meaningful way to talk about these groups because they – Comprise an unknown
number of different ethnicities– The proportion of these
ethnicities is also unknown
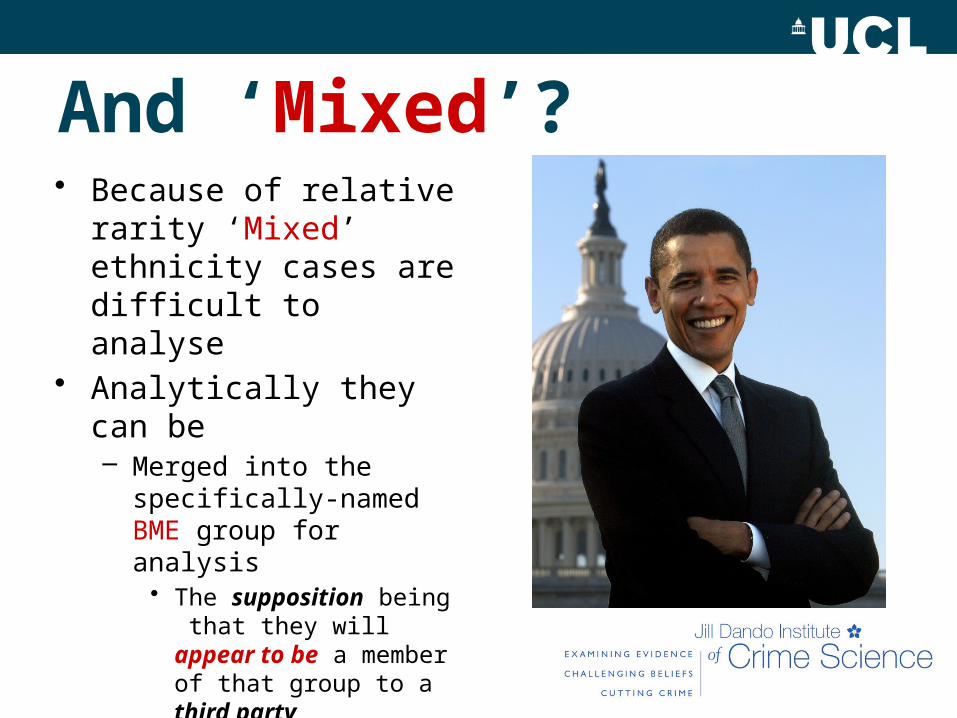
And ‘Mixed’?• Because of relative rarity
‘Mixed’ ethnicity cases are difficult to analyse
• Analytically they can be – Merged into the
specifically-named BME group for analysis
• The supposition being that they will appear to be a member of that group to a third party
– Pooled by year (see below) for independent analysis
• Limited techniques available due to low counts

Comparison Problems• Sample Size for Ethnicity
– Majority of respondents are ‘White British’
• Much smaller numbers of the Asian and Black General Ethnicities
• Makes meaningful statistical comparisons between ‘White’ and other General Ethnicities problematic
– There are even fewer of the specific ethnicities
• These are not evenly distributed
– e.g. There are many more Indians than Chinese
– Especially problematic for the ‘follow-on’ modules and sub-modules

Solution?: Pooling the Data• Because BMEs comprise only a small proportion of the
BCS sample (approximately 10% total across all BME groups), can be combined across years to: – Meaningfully analyse responses by specific ethnic group – Provide sufficient numbers to support ethnically separate
analyses• Despite this, for some categories, there are still too few cases
even when all data since 2001 is used– In such instances, an ethnically pooled model is the only option
• NOTE: when pooling by year, only indicators available for all years can be used– e.g. religion and sexual orientation cannot be controlled in
analyses employing data from years prior to their inclusion

Incorporating Location: Criminal Justice Areas • England and Wales are
currently divided into 43 Criminal Justice Areas– These specify jurisdictional
and administrative boundaries for CJS agencies
• The Police Service• The Courts• The Prison Service• The Probation Service
• This is the smallest geographic subunit universally* available in the BCS– Distribution of BMEs varies
substantially across them• Important for multilevel analyses

Representation: PFA & Ethnicity

To understand the complexity, multiply by ten…
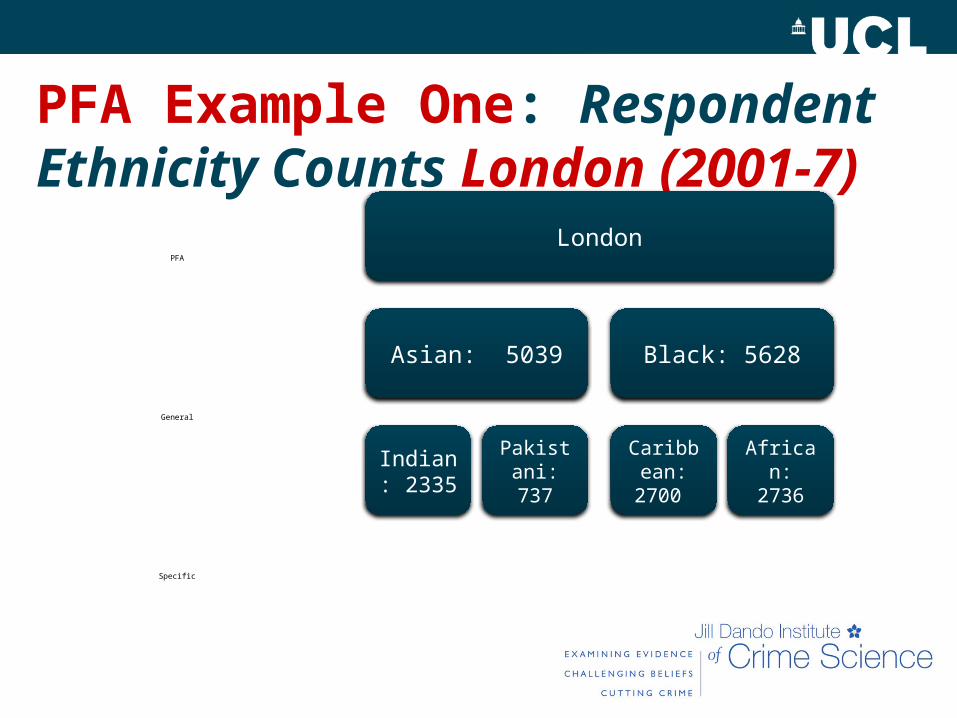
PFA Example One: Respondent Ethnicity Counts London (2001-7)
London
Asian: 5039
Indian: 2335
Pakistani: 737
Black: 5628
Caribbean:
2700
African:2736
PFA
General
Specific

PFA Example Two: Respondent Ethnicity Counts Cumbria (2001-7)
Cumbria
Asian: 32
Indian:6
Pakistani: 2
Black: 13
Caribbean: 4
African: 7
PFA
General
Specific

PFA Sample Size Solution?: Analysis by Ethnic Centres• Low counts in minority
ethnicities make the BCS unfit for examining ethnic differences nationwide
• London and the West Midlands have the highest concentrations– Focus analyses on these areas,
which will :• Maximise the number of ethnic
minority respondents• Better represent actual diversity
levels and composition• Better capture how crime-related
outcomes vary by ethnicity– Use Local Authority rather than PFA as
the smallest geographic subunit (special license only)

Conclusions• Using the BCS to analyse the impact of minority
ethnicity status over criminological outcomes is difficult but not impossible– Currently, definitional and methodological compromises
must be made• Improvements to the BCS could make these compromises
unnecessary
– Limited utility for comparisons by context and geographic location• Wider release of the ‘special license’ data would ease this