method for improving nfdrs wind forecasts using … for improving nfdrs wind forecasts using the...
TRANSCRIPT
Method for Improving NFDRS Wind Forecasts using the Graphical Forecast Editor and Individual Station Forecasts
Jon Bonk1, Joe Solomon, and Wade Earle National Weather Service Pendleton, Oregon
1Currently aff il iated with NWS Portland, Oregon
1. Background
National Weather Service offices create weather forecasts used as inputs to the National Fire
Danger Rating System (NFDRS). Forecasted elements include temperature, relative humidity,
and wind among other variables. Weather forecasts, observations from permanent Remote
Automated Weather Stations (RAWS), and manual observations act as inputs to the fire danger
models. Outputs from the fire danger models provide guidance on the current state of modeled
fire danger to Land Management Agencies. Current and expected danger drives staffing levels
and this system aids with near term (within 1-2 weeks) decisions. NFDRS provides guidance on
individual points that are expected to be representative of an area approximately 10,000 to
100,000 acres (S-491 Student Manual, August 2002).
Typical NWS weather forecast input into NFDRS comes from average trends across an entire
fire weather zone or as specific forecasted values for individual stations. Many NWS offices,
including Pendleton, have provided zone trend forecasts encompassing the average expected
increase or decrease in values across the broad area since the inception of NFDRS. An example
of a zone trend forecast appears in Figure 1.
Application of these trend forecasts to current day observations results in the following day’s
forecast resulting in the weather input for NFDRS. For a simplified example, two stations had
observations within a fire weather zone. Station A recorded: temperature of 87 degrees, humidity
of 21 percent, and wind speed of 7 mph. Station B recorded: temperature of 92 degrees, humidity
of 17 percent, and wind speed of 2 mph. The forecast as illustrated in figure 1 would produce the
following results for the next day. For Station A, a forecasted temperature of 94 degrees,
humidity of 15 percent, wind speed of 3 mph. For Station B, a forecasted temperature of 99
degrees, humidity of 11 percent, wind speed of -2 mph but truncated to 0 (calm). Forecast
verification results from calculating differences between forecasts versus observations then
comparing the difference between a persistence forecast and observations. A March 6, 2001
Memorandum of Understanding between Pacific Northwest Wildfire Coordination Group
representing land management agency interests and the NWS, established standards for
improvement over persistence. Forecast improvement over persistence should exceed 35% for
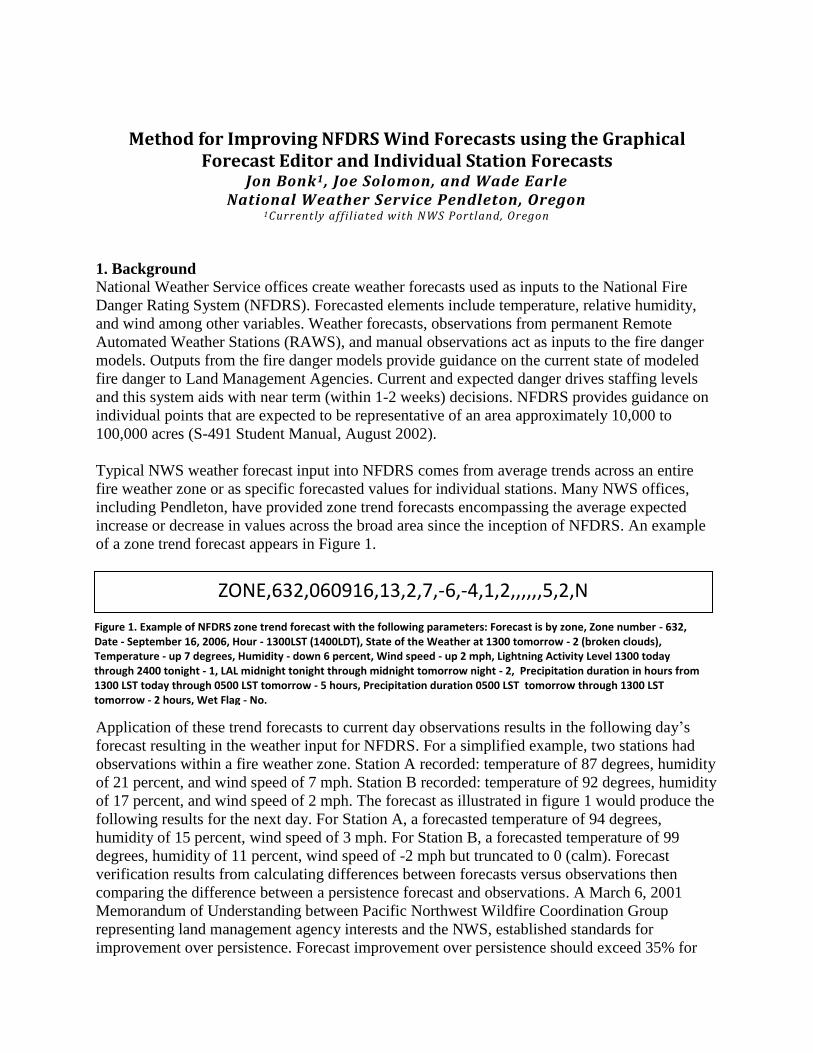
ZONE,632,060916,13,2,7,-6,-4,1,2,,,,,,5,2,N
Figure 1. Example of NFDRS zone trend forecast with the following parameters: Forecast is by zone, Zone number - 632, Date - September 16, 2006, Hour - 1300LST (1400LDT), State of the Weather at 1300 tomorrow - 2 (broken clouds), Temperature - up 7 degrees, Humidity - down 6 percent, Wind speed - up 2 mph, Lightning Activity Level 1300 today through 2400 tonight - 1, LAL midnight tonight through midnight tomorrow night - 2, Precipitation duration in hours from 1300 LST today through 0500 LST tomorrow - 5 hours, Precipitation duration 0500 LST tomorrow through 1300 LST tomorrow - 2 hours, Wet Flag - No.
temperature, 25% for humidity, and 10% for wind speed. These annual forecast goals are now
listed in Appendix B of the Pacific Northwest Fire Weather Annual Operating Plan found at:
http://www.nwccweb.us/admin/publications.aspx
Across the complex terrain of the western continental United States, daily station trend details
rarely conform to the assumed uniform changes provided in zone trend forecasts. Horizontal
spacing of tens, if not hundreds, of miles combined with vertical differences up to a few
thousand feet result in a wide variation of weather element response under the same synoptic or
mesoscale regimes. Additionally, inconsistent station siting quality across the RAWS network
further complicates the use of uniform trend changes. Stations within forested areas are often
surrounded and wind sheltered by tree stands. Thus, they do not show much observation
response despite significant winds just above the canopy. NWS forecasts are for winds 20 feet
above the average vegetation height yet observations may actually occur many tens of feet below
the canopy under significantly sheltered conditions. Hence the problem lies in how can we
reasonably improve upon and show skill against persistence under such conditions which remain
out of our control. Persistence has a clear statistical edge especially at stations which do not
show corresponding changes in wind speed despite clear changes in synoptic conditions.
2. Intermediate Trials
The most practical solution to handle the spatial differences was to implement the use of
providing station specific forecasts. This was a significant challenge given NWS Pendleton has
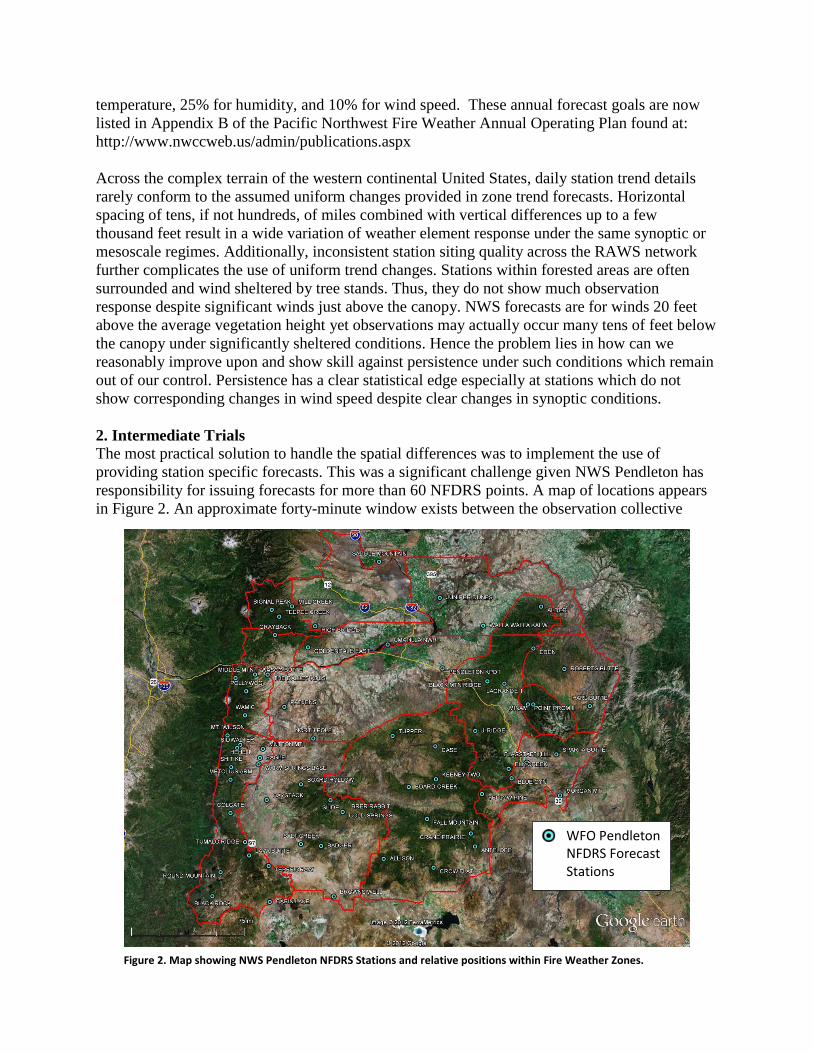
responsibility for issuing forecasts for more than 60 NFDRS points. A map of locations appears
in Figure 2. An approximate forty-minute window exists between the observation collective
Figure 2. Map showing NWS Pendleton NFDRS Stations and relative positions within Fire Weather Zones.
WFO Pendleton NFDRS Forecast Stations

arriving in AWIPS and the next day’s forecast being sent back for inclusion in the NFDRS
calculations. During this window, observations must be quality controlled, forecasts must be
generated, forecasts must be quality controlled, and the product sent. This is a very time
consuming process to cycle through for over 60 stations. Station forecasts provide specific values
with additional elements included beyond the zone trends. Figure 3 provides an example of a
station forecast along with the respective elements.
Fortunately, increased skill in the use of the Graphical Forecast Editor has resulted in 2.5 km2
grids that appropriately reflect daily and seasonal changes for the remote locations typically
served by RAWS. Anecdotally, specific temperature and humidity forecast changes seemed
reasonable when informally compared to RAWS observations.
A study during the 2007 season attempted to validate the anecdotal experience to see if
producing individual station forecasts was indeed viable given technology improvements. The
forecast personnel continued to produce the zone trend forecasts for NFDRS while GFE derived
individual station forecasts occurred behind the scenes and without forecaster intervention. The
GFE individual station forecasts went through an internal local verification process against actual
observations. The study confirmed the anecdotal evidence showing the grids held a minimal
improvement in temperature skill and a slight loss of humidity skill against the zone trends.
Moreover, the grids showed significant skill forecasting the appropriate trend direction. Thus the
temperature and humidity grids appeared adequate to continue the effort at improving the
NFDRS wind forecasts via the use of individual station forecasts.
Forecast changes in wind speed, however, continued to exceed observed increases and decreases
along matching grid points during synoptic wind events. In fact, the raw gridded winds
performed worse than persistence when averaged across all stations during the 2007 peak fire
season. Again, excessive sheltering was likely the cause as forecasted wind speed changes up or
down often exceeded twice that of the observations. In contrast, GFE point forecast trends
roughly mirrored observed trends and magnitudes for Airport Surface Observation System
(ASOS) locations and known exposed RAWS locations.
3. Operational Solution
Clearly, there needed to be some way of accounting for high variability among individual station
wind response. The challenge was producing a method that retained meteorological reasonability
without artificially reducing the overarching wind grids. A detailed study of wind data covering
June 1 through September 30 from the 2005, 2006, and 2007 seasons looked for trends regarding
wind response. Specifically, data plots from 1300, 1400, and 1500 hours LDT looked at the
FCST,452406,110810,13,0,73,40,1,1,NW,16,,82,55,78,26,0,0,N
Figure 3. Example of NFDRS station forecast with the following parameters: Forecast is by station, Station number - 452406, Date - August 10, 2011, Hour - 1300LST (1400LDT), State of the Weather at 1300 LST tomorrow - 0 (clear skies), Temperature - 73 degrees, Humidity - 40 percent, Lightning Activity Level 1300 LST today through 2400 LST tonight - 1, LAL midnight LST tonight through midnight LST tomorrow night - 1, Wind direction - Northwest, Wind Speed - 16 mph, 10 hour fuel moisture - Not forecasted, 24 hour maximum temperature - 82 degrees, 24 hour minimum temperature - 55 degrees, 24 hour maximum humidity - 78 percent, 24 hour minimum humidity - 26 percent, Precipitation duration in hours from 1300 LST today through 0500 LST tomorrow - 0 hours, Precipitation duration 0500 LST tomorrow through 1300 LST tomorrow - 0 hours, Wet Flag - No.
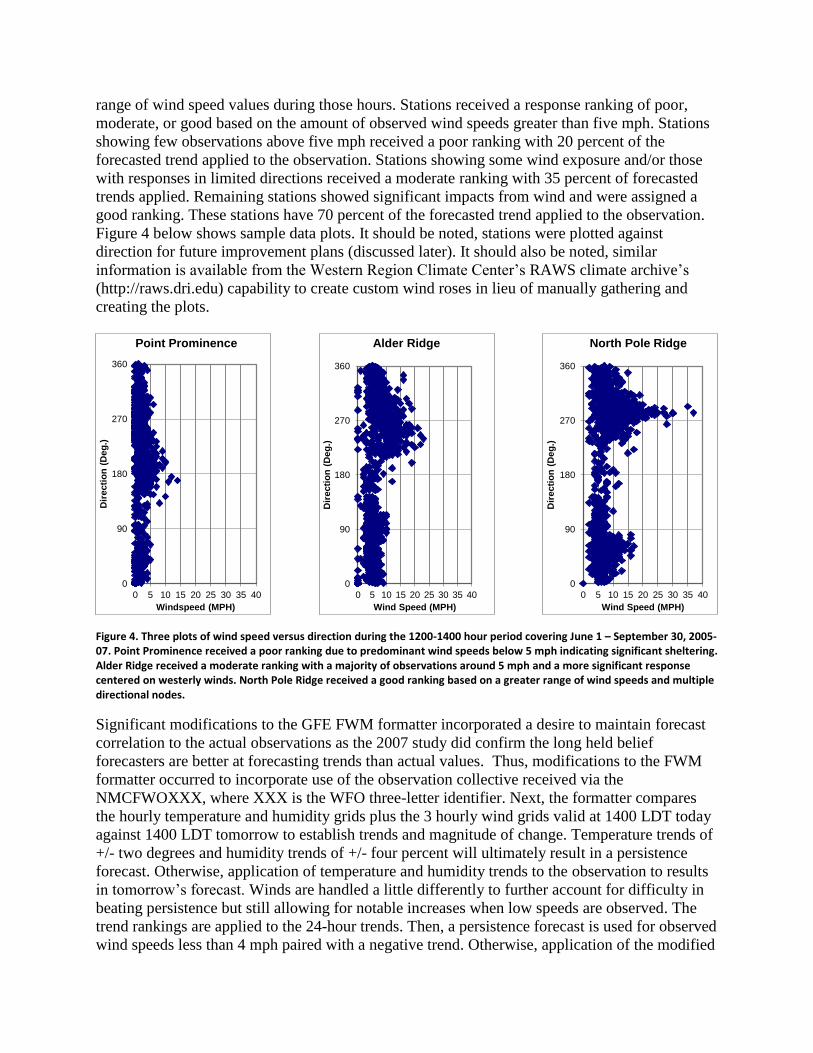
range of wind speed values during those hours. Stations received a response ranking of poor,
moderate, or good based on the amount of observed wind speeds greater than five mph. Stations
showing few observations above five mph received a poor ranking with 20 percent of the
forecasted trend applied to the observation. Stations showing some wind exposure and/or those
with responses in limited directions received a moderate ranking with 35 percent of forecasted
trends applied. Remaining stations showed significant impacts from wind and were assigned a
good ranking. These stations have 70 percent of the forecasted trend applied to the observation.
Figure 4 below shows sample data plots. It should be noted, stations were plotted against
direction for future improvement plans (discussed later). It should also be noted, similar
information is available from the Western Region Climate Center’s RAWS climate archive’s
(http://raws.dri.edu) capability to create custom wind roses in lieu of manually gathering and
creating the plots.
Figure 4. Three plots of wind speed versus direction during the 1200-1400 hour period covering June 1 – September 30, 2005-07. Point Prominence received a poor ranking due to predominant wind speeds below 5 mph indicating significant sheltering. Alder Ridge received a moderate ranking with a majority of observations around 5 mph and a more significant response centered on westerly winds. North Pole Ridge received a good ranking based on a greater range of wind speeds and multiple directional nodes.
Significant modifications to the GFE FWM formatter incorporated a desire to maintain forecast
correlation to the actual observations as the 2007 study did confirm the long held belief
forecasters are better at forecasting trends than actual values. Thus, modifications to the FWM
formatter occurred to incorporate use of the observation collective received via the
NMCFWOXXX, where XXX is the WFO three-letter identifier. Next, the formatter compares
the hourly temperature and humidity grids plus the 3 hourly wind grids valid at 1400 LDT today
against 1400 LDT tomorrow to establish trends and magnitude of change. Temperature trends of
+/- two degrees and humidity trends of +/- four percent will ultimately result in a persistence
forecast. Otherwise, application of temperature and humidity trends to the observation to results
in tomorrow’s forecast. Winds are handled a little differently to further account for difficulty in
beating persistence but still allowing for notable increases when low speeds are observed. The
trend rankings are applied to the 24-hour trends. Then, a persistence forecast is used for observed
wind speeds less than 4 mph paired with a negative trend. Otherwise, application of the modified
0
90
180
270
360
0 5 10 15 20 25 30 35 40
Dir
ecti
on
(D
eg
.)
Windspeed (MPH)
Point Prominence
0
90
180
270
360
0 5 10 15 20 25 30 35 40
Dir
ecti
on
(D
eg
.)
Wind Speed (MPH)
Alder Ridge
0
90
180
270
360
0 5 10 15 20 25 30 35 40
Dir
ecti
on
(D
eg
.)
Wind Speed (MPH)
North Pole Ridge
forecast trend to the observed wind speed results in tomorrow’s wind speed forecast.
Tomorrow’s wind direction valid at 1400 LDT also becomes the forecasted wind direction.
Finally, a set of steps are completed to incorporate afternoon observations into the forecast
database prior to running the FWM formatter. This technique for capturing appropriate
temperature and humidity trends largely relies upon accurate diurnal curves for the hourly
forecast grids. Thus, after the 1500 LDT observation database is populated into GFE, the forecast
database is updated to reflect the estimated final observed values. Then, a new diurnal curve is
run using the Diurnal_from_Obs smart tool to replace the curve used for the public set of grids
run at least an hour earlier. Recently, Western Region SSD recommended using
DiurnalFromModel; however, Diurnal_from_Obs is preferred in this case as it better reflects the
persistent timing of peak heating during the heat of summer. Under high confidence cold frontal
situations, some anecdotal success from use of DiurnalFromModel was seen by the primary
author. Additionally, observational wind grids across complex terrain have not reached the
quality of temperature and humidity grids. Thus, today’s forecast wind grid encompassing 1400
LDT must be manually edited if it is not representative of observed conditions in order to reflect
an appropriate trend for tomorrow.
The FWM formatter is run once adjustments to today’s forecast grids are complete and new
diurnal trends are generated. The forecaster is encouraged to focus wind speed edits since the
2007 study showed forecasters added minimal value above the gridded temperature and humidity
forecasts. Situations with higher confidence wind forecasts should lead toward making stronger
adjustments across wind-exposed stations as all forecast trends receive some reduction. As
forecasters develop a better understanding of this method and of individual station performance,
they can add greater value by pushing the actual forecasted wind speeds closer to expected
observed values versus the systematic determined change limits.
4. Results
Operational use of this technique began with the 2008 fire season. Results have been very
positive with improvements seen each season through 2010. 2011 showed a negative trend of
improvement over persistence and is addressed later. Figure 5 displays a plot of improvement
covering all stations from 2002-2011. No significant methodological changes or station wind
ratings have occurred since inception. Performance has exceeded goals established in the 2001
MOU since beginning use of this technique in 2008. Credit is largely directed toward the overall
skill and quality improvement of the temperature and humidity grids over the last several years.
Keep in mind, this success cannot be used as representative verification of actual grid values
since forecast grid trends are applied to the observations. Wind improvements, however, are
largely believed to be a direct result of tuning the forecast grid trends to better match observed
wind responses for each individual station. Further wind performance gains can occur as the
forecaster gains confidence using the system and recognizes opportunities to override the system.
Whereas improvement in models and grid techniques have played a notable role, raw model
output would have likely resulted in significantly larger speed variances that does not get
reflected by sheltered observation sites. Additional studies are required to accurately assess the
impacts from model and grid technique changes and separate them from improvements gained
from the trend adjustments. Belief is that as overall skill and quality of forecast grids improve,
skill over persistence will continue to increase for a given weather regime.
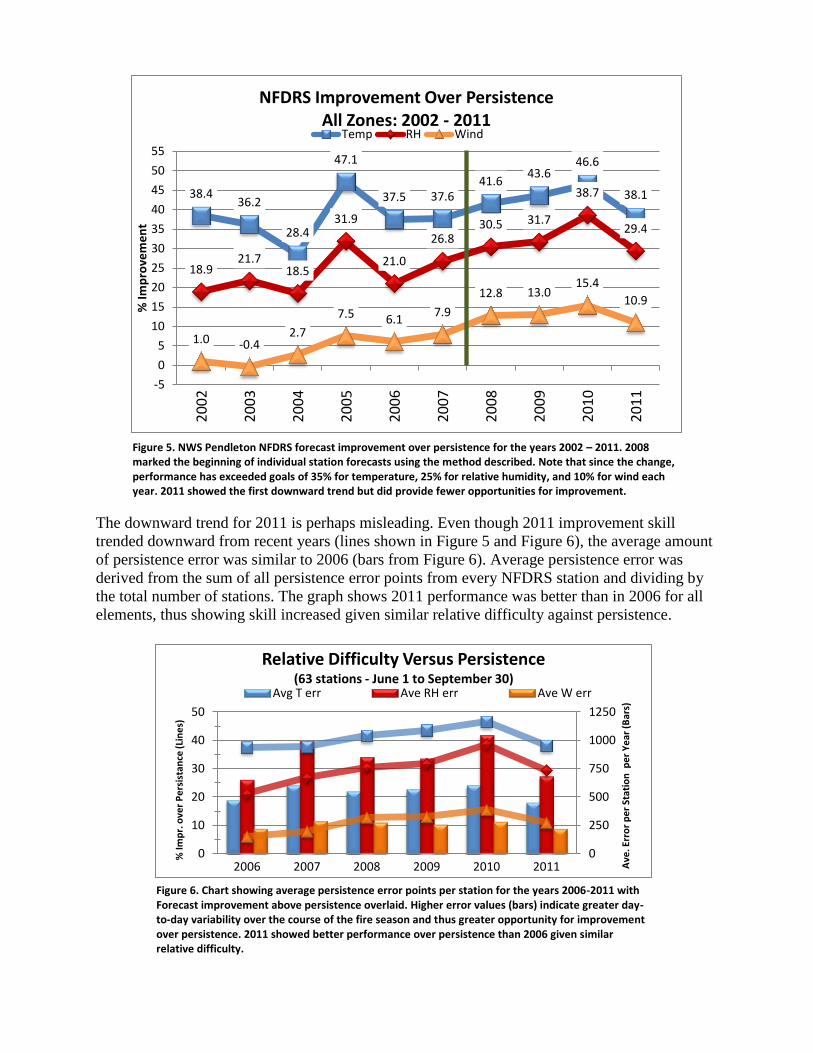
The downward trend for 2011 is perhaps misleading. Even though 2011 improvement skill
trended downward from recent years (lines shown in Figure 5 and Figure 6), the average amount
of persistence error was similar to 2006 (bars from Figure 6). Average persistence error was
derived from the sum of all persistence error points from every NFDRS station and dividing by
the total number of stations. The graph shows 2011 performance was better than in 2006 for all
elements, thus showing skill increased given similar relative difficulty against persistence.
38.4 36.2
28.4
47.1
37.5 37.6 41.6
43.6 46.6
38.1
18.9 21.7
18.5
31.9
21.0
26.8 30.5 31.7
38.7
29.4
1.0 -0.4 2.7
7.5 6.1 7.9
12.8 13.0 15.4
10.9
-5
0
5
10
15
20
25
30
35
40
45
50
55
20
02
20
03
20
04
20
05
20
06
20
07
20
08
20
09
20
10
20
11
% Im
pro
vem
en
t
NFDRS Improvement Over Persistence All Zones: 2002 - 2011
Temp RH Wind
Figure 5. NWS Pendleton NFDRS forecast improvement over persistence for the years 2002 – 2011. 2008 marked the beginning of individual station forecasts using the method described. Note that since the change, performance has exceeded goals of 35% for temperature, 25% for relative humidity, and 10% for wind each year. 2011 showed the first downward trend but did provide fewer opportunities for improvement.
Figure 6. Chart showing average persistence error points per station for the years 2006-2011 with Forecast improvement above persistence overlaid. Higher error values (bars) indicate greater day-to-day variability over the course of the fire season and thus greater opportunity for improvement over persistence. 2011 showed better performance over persistence than 2006 given similar relative difficulty.
0
250
500
750
1000
1250
0
10
20
30
40
50
2006 2007 2008 2009 2010 2011 Ave
. Err
or
pe
r St
atio
n p
er
Ye
ar (
Bar
s)
% Im
pr.
ove
r P
ers
ista
nce
(Lin
es)
Relative Difficulty Versus Persistence (63 stations - June 1 to September 30)
Avg T err Ave RH err Ave W err

5. Future Work
With four years of operational use, a reanalysis of the wind response rankings versus actual
improvements over persistence should occur to determine which stations show a need for
reclassification. Additionally, the initial ranking analysis revealed several stations showed a
greater range of wind speeds given certain wind directions. This implies possible additional trend
skill through directional filtering beyond the current set of rankings. Stations that respond well to
one particular direction or a range of directions may receive a better performance ranking than in
other directions. Individual station analysis might also reveal where our forecast temperature and
humidity trends have room for improvement via a similar system currently used for wind. The
ultimate goal, however, should be to maintain meteorological consistency with the actual
forecast grids. Future efforts at improving NWS gridded forecasts will continue influencing
NFDRS forecasts and thus most improve service to our fire weather customers.
6. Summary
This methodology of producing individual station NFDRS forecasts resulted in significant
performance improvements over the prior method using zone average trends. Since the
procedures were implemented, National Weather Service Pendleton has exceeded performance
goals as established in the 2001 MOU between the between the National Weather Service and
the Pacific Northwest Wildfire Coordination Group representing land management agency
interests. The primary investment of time to implement this method comes from the background
research needed to rank stations based on how well each NFDRS station responds to synoptic
wind regime changes. This is a non-trivial investment, but thus far, the results have more than
justified the invested time.
The primary author wishes to acknowledge Joe Solomon for conceiving this methodology and
Wade Earle for his technical expertise in making modifications to GFE formatters during
implementation.