method development and validation of...
TRANSCRIPT

Human Journals
Research Article
June 2016 Vol.:6, Issue:3
© All rights are reserved by Mr. R.D. Khaire et al.
Method Development and Validation of Candesartan by RP-HPLC
www.ijppr.humanjournals.com
Keywords: Candesartan, HPLC Method, Mobile phase
ABSTRACT
A simple, sensitive, rapid and selective isocratic reversed phase
High Performance Liquid Chromatographic (HPLC) method
has been developed for estimation of Candesartan from bulk
drug dosage from using a mobile phase consisting mixture of
Acetonitrile : KH2PO4 Buffer (pH 2.8) (80:20 v/v)
Composition of buffer: (0.272gm in 200ml HPLC water and
pH adjusted to 2.8 using orthophosphoric acid) at the flow rate
of 1.2mL/min using cosmosil C18 (250 cm x 4.6 mm, 5 μm)
column as stationary phase. The retention time of Candesartan
found to be 6.39 min. The eluent was detected at 230 nm.
Linearity was observed in the concentration range of 100-180
ppm for Candesartan. Percent recoveries obtained for
Candesartan were 96.33% . The correlation coefficient for
Candesartan was found to be 0.995. After performing analysis
by different analysts, it was found that the RP-HPLC method
for the determination of Candesartan was found to be Rugged.
Percent RSD for robustness was well within the acceptable USP
limits, ensuring that the proposed method was robust. For
candesartan the LOD were found to be 0.095 µg/ml and the
LOQ were found to be 0.58 µg/ml. This demonstrated that the
developed RP-HPLC method was simple, linear, precise,
accurate, robust, and rugged, could be conveniently adopted for
the routine quality control analysis of Candesartan, from its
pharmaceutical formulations and bulk drug. Developed method
was found to precise, accurate and validated as per
pharmacopeial standard.
Mr. R.D. Khaire*1
, Jayshree Landge2,Vijay Wagh
2
PRES,College of Pharmacy (D.Pharm),Chincholi-
Mohu,Tal-Sinnar,Dist-Nashik.
PRES,College of Pharmacy (For Women),Chincholi-
Mohu,Tal-Sinnar,Dist-Nashik, India.
Submission: 7 June 2016
Accepted: 12 June 2016
Published: 25 June 2016

www.ijppr.humanjournals.com
Citation: Mr. R.D. Khaire et al. Ijppr.Human, 2016; Vol. 6 (3): 345-360.
346
INTRODUCTION
VALIDATION OF ANALYTICAL METHODS 1-12
:
Validation of an analytical procedure is the process by which it is established, by laboratory
studies, that the performance characteristics of the procedure meet the requirements for the
intended analytical applications1. The International Conference on Harmonization (ICH) of
Technical Requirements for the Registration of Pharmaceuticals for Human Use has developed a
text on the validation of analytical procedures2. The United States Food and Drug Administration
(USFDA) have proposed guidelines on submitting samples and analytical data for methods
validation3-5
. The United States Pharmacopoeia (USP) has published specific guidelines for
method validation for compound evaluation6.
USP/ ICH Method Validation Parameters
Method needs to be validated or revalidated13-14
:
Before their introduction into routine use.
Whenever the conditions changes for which the method has been validated. E.g. Instrument
with different characteristics.
Whenever the method is changed, and the change is outside the original scope of the method.
Typical validation characteristics which should be considered are as follows:
Accuracy

www.ijppr.humanjournals.com
Citation: Mr. R.D. Khaire et al. Ijppr.Human, 2016; Vol. 6 (3): 345-360.
347
Precision
Repeatability
Intermediate precision
Specificity
Detection limit
Quantitation limit
Linearity
Range
MATERIALS AND METHODS
MATERIALS
1. Drug sample suppliers & Manufacturer:
Sr. No. Name of Drugs Drug supplies & Manufacturer.
1 Candesartan Macleods Pharmaceuticals (Mumbai),
Maharashtra,India.
2. Instrument used:
Equipment Company
Maxia220 electronic balance Shinko Denshi Co Ltd, Japan
UV 150-02 ,Visible double beam spectrophotometer Shimadzu corporation ,Japan
Digital PH
Meter Global , Ltd. Model No:-PGB100
Sonicator Wenser
HPLC Binary Gradient System
Model No:-3000 series
HPLC pump : LC-P-4000
Column: Cosmosil C-18 (4.6mm×250mm,Partical
size 5µm)
UV-VIS detector
Analytical Technologies Ltd.
Analytical Balance
Model No. PGB 100 Wenser

www.ijppr.humanjournals.com
Citation: Mr. R.D. Khaire et al. Ijppr.Human, 2016; Vol. 6 (3): 345-360.
348
3. List of Reagents and Chemicals used:
Name of chemicals Suppliers
Double distilled Water RAP Analytical Lab, Nasik.
Potassium Di hydrogen Phosphate Research Lab Fine Chem Industries.
Ortho Phosphoric acid Research Lab Fine Chem Industries, Mumbai.
Acetonitrile HPLC grade MerkSpecialitiesPvt Ltd, Mumbai.
Software used:
HPLC Workstation.
METHODS:
1. Selection of analytical wavelength:
1.1 Standard stock solution of Candesartan:
10mg of Candesartan were accurately weighed, transferred to separate 10 ml volumetric flasks,
dissolved in the mobile phase and dilute to volume with the same solvent mixture to furnish
stock solutions containing 1000µg/ml of Candesartan. 1 ml of above solution transferred to 10
ml volumetric flask and the volume was made with diluents. The concentration of Candesartan is
100μg/ml.
1.2 Determination of λmax of Candesartan:
Standard stock solution of Candesartan was diluted separately with diluents to obtain final
concentration of 10 μg/ml. Solution was scanned using UV-Visible Spectrophotometer in the
spectrum mode between the wavelength range of 400 nm to 200 nm.
1.3 Determination of Absorption maxima:
By appropriate dilution of standard drug solutions with acetonitrile, solutions containing 10
µg/ml Candesartan were scanned separately in the range of 400-200nm to determine the
wavelength of maximum absorption for the drugs.

www.ijppr.humanjournals.com
Citation: Mr. R.D. Khaire et al. Ijppr.Human, 2016; Vol. 6 (3): 345-360.
349
2. HPLC method development:
2.1 Selection of Mobile phase:
Candesartan was injected into the HPLC system and run in different solvent systems. Mixture of
different solvents were tried in order to determine optimum chromatographic conditions for
effective separation. After several permutation and combination, it was found that mixture of
Acetonitrile : Buffer, with orthophosphoric acid to adjust the pH pH,gives satisfactory results as
compared to other mobile phases. Finally, the optimal composition of the mobile phase contains
about 80 volume of Acetonitrile and 20 volume of Buffer [pH 2.8], as it gave high resolution of
Candesartan with minimal tailing.
2.2 Preparation of mobile phase:
2.3 Preparation of Buffer:
An accurately weighed quantity of about 0.272gm of Potassium Dihydrogenortho Phosphate was
taken in 500 ml volumetric flask dissolved in sufficient quantity of HPLC water, then sonicated
for 15 min and diluted to 200ml with the HPLC water. Then adjust the pH up to 2.8 with
orthophosphoric acid and filter through a 0.45µm membrane filter., gives the formation of buffer.
2.4 Mobile phase
Finally, the optimal composition of the mobile phase contains about 20 volume of buffer and 80
volume of Acetonitrile. [Acetonitrile : KH2PO4 Buffer(80:20)]
2.5 Preparation of standard stock solution:
10 mg of Candesartan were accurately weighed, transferred to separate 10 ml volumetric flasks,
dissolved in the mobile phase and dilute to volume with the same solvent mixture to furnish
stock solutions containing 1000µg/ml of Candesartan. 1 ml of above solution transferred to 10
ml volumetric flask and the volume was made with diluents. The concentration of Candesartan is
100μg/ml.
2.6 Loading of mobile phase:
Filtered & degassed mobile phase was loaded in the reservoir. Priming was done for each freshly
prepared mobile phase.
www.ijppr.humanjournals.com
Citation: Mr. R.D. Khaire et al. Ijppr.Human, 2016; Vol. 6 (3): 345-360.
350
2.7 Baseline stabilization:
The detector was turned on for an hour before the actual run in order to obtain the stable UV
light. The mobile phase run was started at desired flow rate & the run was continued until the
stable baseline was obtained.
2.8 Loading of samples:
Well prepared & filtered samples of Candesartan were loaded into the Rheodyne injector port
using a syringe & the sample was then injected.
2.9 Washing the column:
Once the analysis of samples was finished, the column was first washed by flushing with the
mobile phase for half an hour.
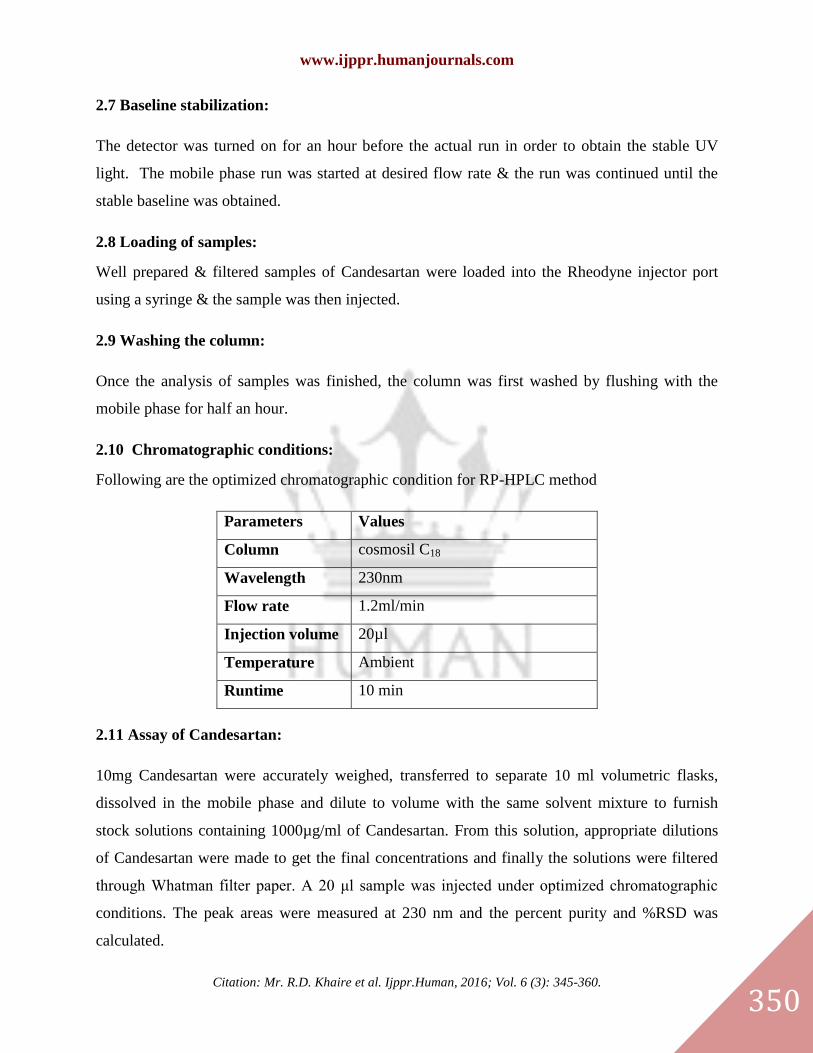
2.10 Chromatographic conditions:
Following are the optimized chromatographic condition for RP-HPLC method
Parameters Values
Column cosmosil C18
Wavelength 230nm
Flow rate 1.2ml/min
Injection volume 20µl
Temperature Ambient
Runtime 10 min
2.11 Assay of Candesartan:
10mg Candesartan were accurately weighed, transferred to separate 10 ml volumetric flasks,
dissolved in the mobile phase and dilute to volume with the same solvent mixture to furnish
stock solutions containing 1000µg/ml of Candesartan. From this solution, appropriate dilutions
of Candesartan were made to get the final concentrations and finally the solutions were filtered
through Whatman filter paper. A 20 μl sample was injected under optimized chromatographic
conditions. The peak areas were measured at 230 nm and the percent purity and %RSD was
calculated.

www.ijppr.humanjournals.com
Citation: Mr. R.D. Khaire et al. Ijppr.Human, 2016; Vol. 6 (3): 345-360.
351
RESULTS AND DISCUSSION
The results of Method Development and Validation of Candesartan including all the analytical
data with chromatograms were given as follows:
1. UV ANALYSIS FOR DETECTION OF WAVELENGTH:
1.1. Determination of λmax of Candesartan:
The standard solution of Candesartan was scanned at different concentrations in the range of
200-400nm and the λmax was found to be 230 nm against reagent blank.
Figure no 1: UV spectrum for Candesartan.
2. HPLC METHOD DEVELOPMENT:
2.1. Optimized Chromatographic Conditions:
Following are the optimized chromatographic condition for RP-HPLC method.

www.ijppr.humanjournals.com
Citation: Mr. R.D. Khaire et al. Ijppr.Human, 2016; Vol. 6 (3): 345-360.
352
2.2. Assay of Candesartan:
Figure no 2: Chromatograph for standard Candesartan.
Time Conc. Area Resolution T. Plate Asymmetry
6.39 10 ug/ml 15043894 00 6592 1.36
Figure no 3: Chromatograph for Tablet Sample of Candesartan

www.ijppr.humanjournals.com
Citation: Mr. R.D. Khaire et al. Ijppr.Human, 2016; Vol. 6 (3): 345-360.
353
Time Conc. Area Resolution T. Plate Asymmetry
6.25 10 ug/ml 14904195 00 6993 1.34
Data for Assay of Candesartan
Wt. of Std
(mg)
Area of
standard
Area of
sample
Purity of
the Std (%)
10
15010535 14905285
100%
15011056 14903254
15023085 14925755
15023884 14994451
15038656 14913432
15043894 14904195
Mean 15025185 14924395
SD 13797 35355
RSD 0.09 0.23
Percentage Assay obtained for Candesartan is 100 % (Standard-NLT 98.0 and NMT 102.0%). As
the result obtained is within the limits, hence this assay method used to perform the validation.
System suitability test for Candesartan
Sr. No. Area of
standard
Retention
time (Rt)
USP
tailing
(Tf)
Theoretical
plate count
(N)
Resolution (Rs)
1 15010535 6.39 1.25 6532 00
2 15011056 6.36 1.27 6590 00
3 15023085 6.38 1.24 6555 00
4 15023884 6.39 1.25 6584 00
5 15038656 6.37 1.20 6592 00
Average 15031270 6.38 1.24 6570 00
SD 12266
% RSD 0.08
www.ijppr.humanjournals.com
Citation: Mr. R.D. Khaire et al. Ijppr.Human, 2016; Vol. 6 (3): 345-360.
354
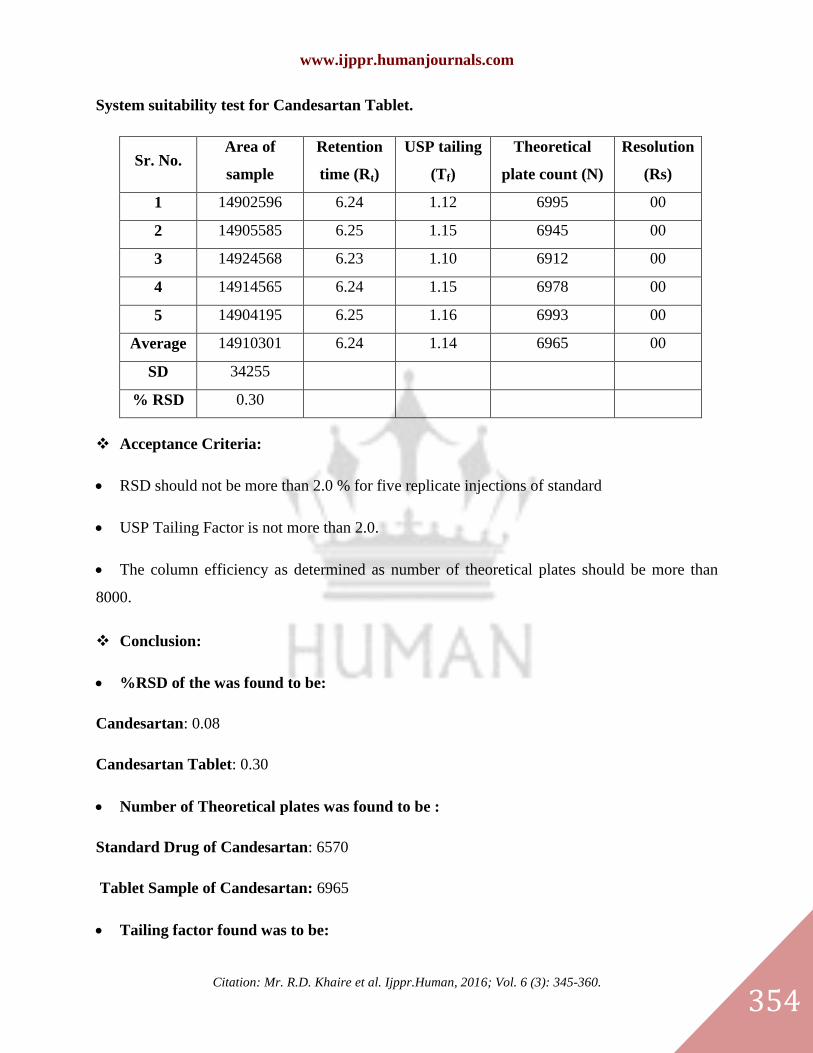
System suitability test for Candesartan Tablet.
Sr. No. Area of
sample
Retention
time (Rt)
USP tailing
(Tf)
Theoretical
plate count (N)
Resolution
(Rs)
1 14902596 6.24 1.12 6995 00
2 14905585 6.25 1.15 6945 00
3 14924568 6.23 1.10 6912 00
4 14914565 6.24 1.15 6978 00
5 14904195 6.25 1.16 6993 00
Average 14910301 6.24 1.14 6965 00
SD 34255
% RSD 0.30
Acceptance Criteria:
RSD should not be more than 2.0 % for five replicate injections of standard
USP Tailing Factor is not more than 2.0.
The column efficiency as determined as number of theoretical plates should be more than
8000.
Conclusion:
%RSD of the was found to be:
Candesartan: 0.08
Candesartan Tablet: 0.30
Number of Theoretical plates was found to be :
Standard Drug of Candesartan: 6570
Tablet Sample of Candesartan: 6965
Tailing factor found was to be:
www.ijppr.humanjournals.com
Citation: Mr. R.D. Khaire et al. Ijppr.Human, 2016; Vol. 6 (3): 345-360.
355
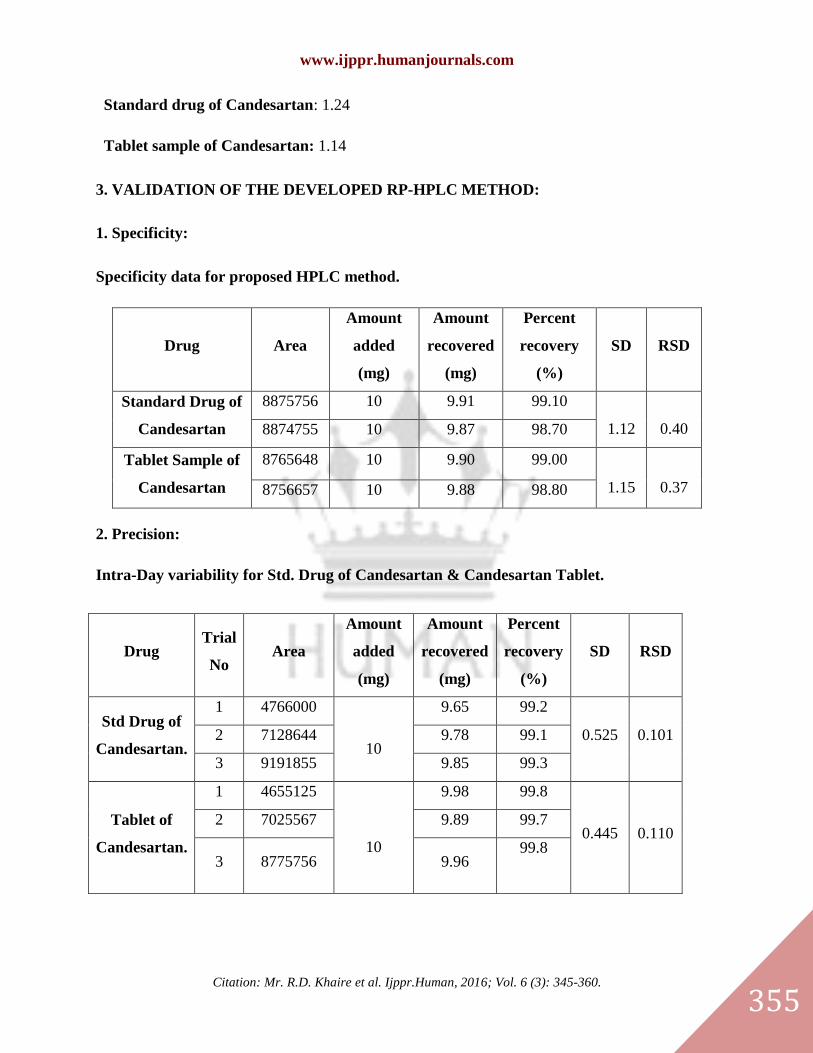
Standard drug of Candesartan: 1.24
Tablet sample of Candesartan: 1.14
3. VALIDATION OF THE DEVELOPED RP-HPLC METHOD:
1. Specificity:
Specificity data for proposed HPLC method.
Drug Area
Amount
added
(mg)
Amount
recovered
(mg)
Percent
recovery
(%)
SD RSD
Standard Drug of
Candesartan
8875756 10 9.91 99.10
1.12
0.40 8874755 10 9.87 98.70
Tablet Sample of
Candesartan
8765648 10 9.90 99.00
1.15
0.37 8756657 10 9.88 98.80
2. Precision:
Intra-Day variability for Std. Drug of Candesartan & Candesartan Tablet.
Drug Trial
No Area
Amount
added
(mg)
Amount
recovered
(mg)
Percent
recovery
(%)
SD RSD
Std Drug of
Candesartan.
1 4766000
10
9.65 99.2
0.525 0.101 2 7128644 9.78 99.1
3 9191855 9.85 99.3
Tablet of
Candesartan.
1 4655125
10
9.98 99.8
0.445 0.110 2 7025567 9.89 99.7
3 8775756 9.96 99.8

www.ijppr.humanjournals.com
Citation: Mr. R.D. Khaire et al. Ijppr.Human, 2016; Vol. 6 (3): 345-360.
356
Inter-Day variability for Standard Drug of Candesartan and Candesartan Tablet.
Drug Trial
No Area
Amount
added
(mg)
Amount
recovere
d
(mg)
Percent
recovery
(%)
SD RSD
Std Drug of
Candesartan
1 4766000
10
9.98 99.8
0.387
0.154 2 7127297 9.88 98.8
3 9191885 9.96 99.6
Tablet of
Candesartan
1 4665101
10
10.1 100
0.256
0.220 2 7028532 9.95 99.5
3 9088522 9.97 99.7
3. Linearity:
Linearity Data for Standard Drug of Candesartan.
Sr. No. Conc. Area
1. 100 4577414
2. 120 6046054
3. 140 7062839
4. 160 8257643
5. 180 9261710
Figure no 4 : Linearity graph for Standard Drug of Candesartan.

www.ijppr.humanjournals.com
Citation: Mr. R.D. Khaire et al. Ijppr.Human, 2016; Vol. 6 (3): 345-360.
357
Linearity Data for Tablet Sample of Candesartan.
Sr. No. Conc. Area
1. 100 4465312
2. 120 5836037
3. 140 6952728
4. 160 8154604
5. 180 9091821
Figure no 5: Linearity graph for Standard Drug of Candesartan.
4. Accuracy (recovery):
Accuracy data of Standard Drug Candesartan and Candesartan Tablet.
Drug
Conc. Of
Accuracy
ug/ml
Area
Amount
added
(mg)
Amount
recovered
(mg)
Percent
recovery
(%)
SD
%
RS
D
Std Drug of
Candesartan
100 4768984 10 9.85 99.6
1.20
0.65 140 7078075 10 9.98 98.4
180 9196240 10 10.01 100
Tablet of
Candesartan
100 4658803 10 9.95 98.4
0.98
1.01 140 6945064 10 9.87 99.8
180 9085231 10 9.92 99.4

www.ijppr.humanjournals.com
Citation: Mr. R.D. Khaire et al. Ijppr.Human, 2016; Vol. 6 (3): 345-360.
358
5. Ruggedness:
Drug Area
Amount
added
(mg)
Amount
recovered
(mg)
Percent
recovery
(%)
SD %
RSD
Std Drug of
Candesartan.
4768982 10 9.86 99.84
0.542
0.061 7078026 10 9.85 99.84
Tablet of
Candesartan.
4685893 10 9.95 99.50
0.539
0.052 6968057 10 9.89 99.86
6. Robustness:
Robustness data of Standard Drug Candesartan and Candesartan Tablet
Drug
Robustness
Test ug/ml
Area
Amount
added
(mg)
Amount
recovered
(mg)
Percent
recovery
(%)
SD
%
RS
D
Standard Drug of
Candesartan.
100 4781800 10 10 100
0.54
0.85
120 5841830 10 9.89 99.95
140 6661311 10 9.75 99.85
160 7593400 10 9.98 99.98
Tablet sample of
Candesartan.
100 4680701 10 10.1 100.1
1.25
0.95
120 5736742 10 9.86 99.86
140 6453232 10 9.99 99.90
160 7483412 10 9.85 99.80
7. Limit of Detection and Quantitation:
The limits of detection (LOD) and quantification (LOQ) were determined separately, on the basis
of the standard deviation of the y intercept and slope of the calibration plots. The LOD were
0.095 and 0.084µg/ml for Standard Drug of Candesartan and Tablet Sample of Candesartan
respectively. For Standard Drug of Candesartan and Tablet Sample of Candesartan the LOQ

www.ijppr.humanjournals.com
Citation: Mr. R.D. Khaire et al. Ijppr.Human, 2016; Vol. 6 (3): 345-360.
359
were found to be 0.58 and 0.44 µg/ml respectively. At these levels, RSD values were less than
2%, in accordance with ICH guidelines.
CONCLUSION
This developed RP-HPLC method for estimation of Candesartan is accurate, precise, robust,
specific and stability-indicating. The method has been found to be better than previously reported
method, because of its less retention time, use of an economical and readily available mobile
phase, UV detection and better resolution of peaks. The run time is relatively short, which will
enable rapid quantification of many samples in routine and quality-control analysis of various
formulations containing Candesartan. All these factors make this method suitable for
quantification of Candesartan in bulk drugs and in pharmaceutical dosage forms without any
interference. The results of stress testing undertaken according to the International Conference
on Harmonization (ICH) guidelines reveal that the method is selective and specific.
ACKNOWLEDGEMENT
Authors are thankful to Mr. S. S. Dengale Asst. Prof. & Head Dept. of Pharmaceutical
Chemistry, and Principal Pravara Rural College of Pharmacy, Loni for providing necessary
facilities for work.
Successful completion of a project is not achieved single handedly; it is always backed by the
constant silent support and guidance of several well-wishers and loved ones. First and foremost, I
bow before the almighty god for showering his blessings on me and giving me the strength to
carry out the present work with utmost dedication and enthusiasm.
With great pleasure and deep sense of gratitude, I express my most pleasant and modest thank to
my respected guide Mr. S. S. Dengale Asst. Prof. & Head Dept. of Pharmaceutical
Chemistry, Pravara Rural College of Pharmacy, Loni. for his valuable support, inspiration and
encouragement through my project work. His simplicity, untiring and meticulous guidance and
provision of hard work environment will be cherished in all walks of my life. It was an enriching
experience to work under him.

www.ijppr.humanjournals.com
Citation: Mr. R.D. Khaire et al. Ijppr.Human, 2016; Vol. 6 (3): 345-360.
360
REFERENCES
1. Sethi P.D. HPLC ‘High Performance Liquid Chromatography’, Quantitative Analysis of Pharmaceutical
Formulations, 1st Ed., CBS Publishers and Distributors, New Delhi, 2001,Page No. 3-39, 116-120.
2. Christen G. D., Analytical Chemistry, 6th
Edition, John Wiley and Sons, 2003, Page No. 1-15.
3. G.C.Christian. Analytical chemistry. 6th
Edn. 2008, pp. 61, 65-66.
4. M.Z. Ahmad and M. Ali. Textbook of Pharmaceutical Drug Analysis. 1stEdn. 2009, pp.254-264.
5. P. Parimoo. Pharmaceutical Analysis. 1stEdn. CBS Public Dist. 2005. pp. 164-189.
6. K.A. Connors. A textbook of Pharmaceutical Analysis. 3rd
ed. Jhon Wiley and sons, 1999, pp.373-390.
7. Skoog D. A., Holler F. J., Nieman T. A., Principles of Instrumental Analysis, 5th
Edition, Eastern Press,
Bangalore, 2004, Page No. 1-2, 674-688,695-698.
8. Sharma B. K., Instrumental methods of chemical analysis, Introduction to analytical chemistry, Goel publishing
house, Meerut, 19th
edition, 2000, Page No.1-4, 200-203.
9. Sharma B.K, Instrumental Methods of Chemical Analysis, Introduction to analytical chemistry 21st ed., Goel
Publishing House, Meerut, 2002, Page No. 3-5, 10.
10. Willard, H. H., Merritt, L. L. Jr., Dean, J. a. Frank, A. S., Instrumental methods of analysis, CBS Publishers and
distributors, New Delhi, 7th
edition, 1986, Page No. 1- 53, 513-522, 530-535.
11. Chromatography [Internet]. 2011 [Updated 2011 June 6; cited 2011 June 14]. Available from
http://en.wikipedia.org/wiki/Chromatography.
12. Fifield FW, Kealey D. Principles and Practice of Analytical Chemistry. 5th
ed. UK: Blackwell Science Ltd;
2000:81
13. Ahuja S, Dong MW, editors. Handbook of Pharmaceutical Analysis by HPLC. In: Ahuja S. Separation Science
and Technology. UK: Elsevier Inc; 2005; 6:p. 22-30.
14. Michael E. Analytical method Development and validationUnited States Pharmacopeia.