methane turnover in desert soilsarchiv.ub.uni-marburg.de/diss/z2010/0654/pdf/dra.pdf · methane...
TRANSCRIPT

Methane Turnover in Desert Soils
Doctoral thesis
Submitted in partial fulfilment of the requirements for a doctoral degree
“Doktorgrad der Naturwissenschaften (Dr. rer. nat.)”
to the faculty of biology – Philipps-Universität Marburg
by
Roey Angel
from Holon, Israel
Marburg/ Lahn | 2010

The research for the completion of this work was carried out from
October 2007 to September 2010 in the Department of Biogeochemistry
at the Max-Planck Institute for Terrestrial Microbiology under the
supervision of Prof. Dr. Ralf Conrad.
Thesis was submitted to the Dean, Faculty of Biology, Philipps-
Universität Marburg
on: October 14th 2010
First reviewer: Prof. Dr. Ralf Conrad
Second reviewer: Prof. Dr. Diethart Matthies
Date of oral examination:

The following manuscripts originated from this work and
were published or are in preparation:
Angel R and Conrad R. Microbial ecology of desert soils – a minireview (in
preparation)
Angel R, Soares MIM, Ungar ED, and Gillor O. (2010) Biogeography of soil
Archaea and Bacteria along a steep rainfall gradient, The ISME Journal,
4:553-563.
Angel R and Conrad R. (2009) in situ measurement of methane fluxes and
analysis of transcribed particulate methane monooxygenase in desert
soils. Environmental Microbiology, 11:2598–2610.
Angel R, Claus P, and Conrad R. Methanogenic archaea are globally
ubiquitous in aerated soils and become active under anoxic conditions (in
preparation).
Angel R, Matthies D, and Conrad R. Activation of methanogenesis in arid biological soil crusts despite the presence of oxygen (in preparation).


To my father

"... I find that the plains of Patagonia frequently cross before my eyes; yet
these plains are pronounced by all wretched and useless. They can be
described only by negative characters; without habitations, without
water, without trees, without mountains, they support merely a few dwarf
plants. Why, then, and the case is not peculiar to myself, have these arid
wastes taken so firm a hold on my memory?"
Charles Darwin
The Voyage of the Beagle, 1839
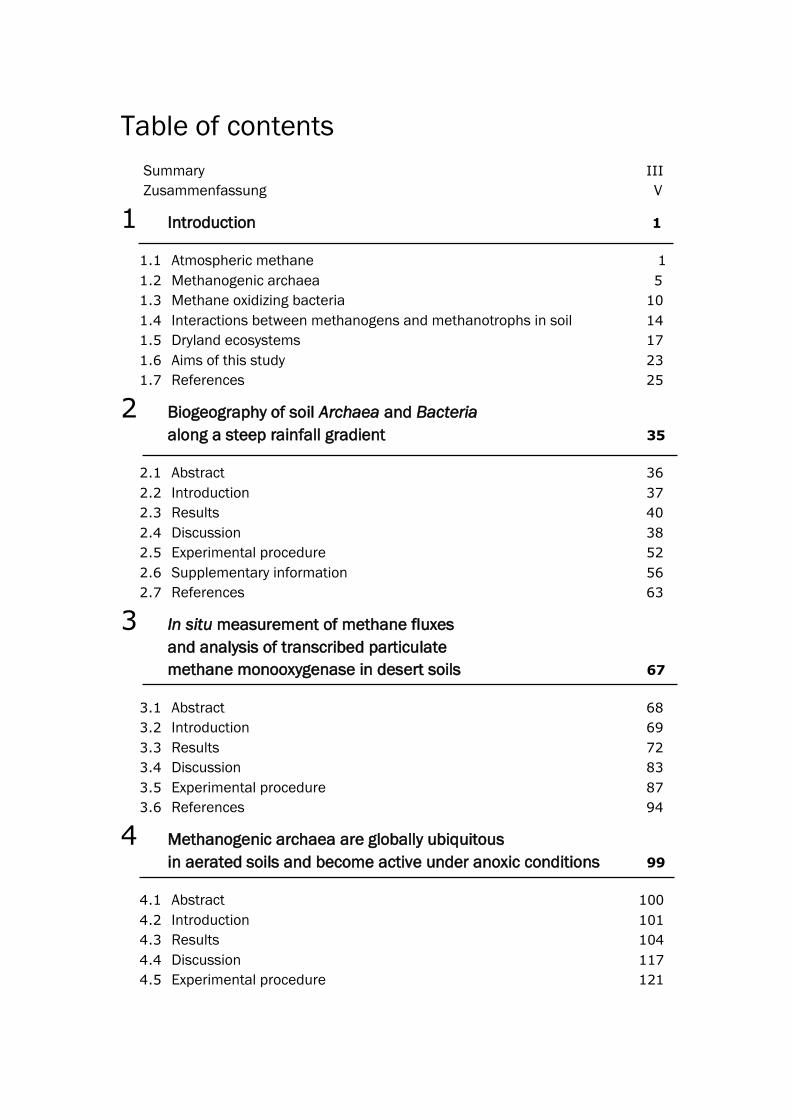
Table of contents
Summary III
Zusammenfassung V
1 Introduction 1
1.1 Atmospheric methane 1
1.2 Methanogenic archaea 5
1.3 Methane oxidizing bacteria 10
1.4 Interactions between methanogens and methanotrophs in soil 14
1.5 Dryland ecosystems 17
1.6 Aims of this study 23
1.7 References 25
2 Biogeography of soil Archaea and Bacteria
along a steep rainfall gradient 35
2.1 Abstract 36
2.2 Introduction 37
2.3 Results 40
2.4 Discussion 38
2.5 Experimental procedure 52
2.6 Supplementary information 56
2.7 References 63
3 In situ measurement of methane fluxes
and analysis of transcribed particulate
methane monooxygenase in desert soils 67
3.1 Abstract 68
3.2 Introduction 69
3.3 Results 72
3.4 Discussion 83
3.5 Experimental procedure 87
3.6 References 94
4 Methanogenic archaea are globally ubiquitous
in aerated soils and become active under anoxic conditions 99
4.1 Abstract 100
4.2 Introduction 101
4.3 Results 104
4.4 Discussion 117
4.5 Experimental procedure 121
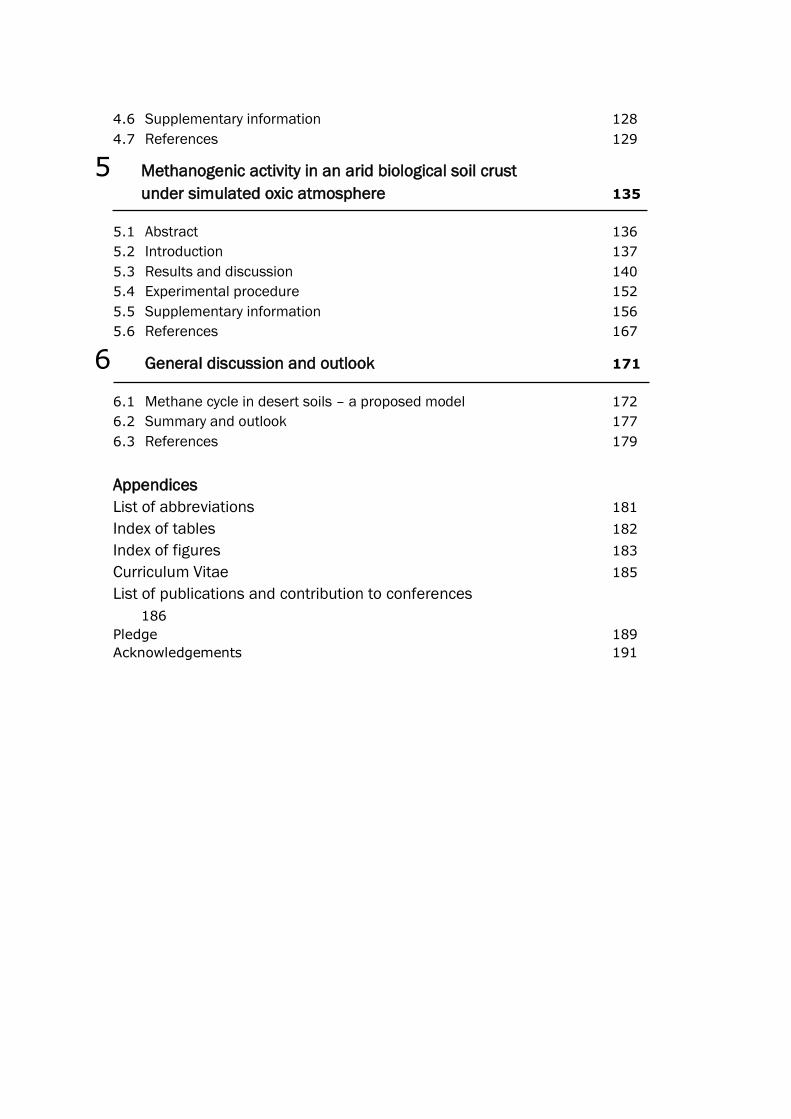
4.6 Supplementary information 128
4.7 References 129
5 Methanogenic activity in an arid biological soil crust
under simulated oxic atmosphere 135
5.1 Abstract 136
5.2 Introduction 137
5.3 Results and discussion 140
5.4 Experimental procedure 152
5.5 Supplementary information 156
5.6 References 167
6 General discussion and outlook 171
6.1 Methane cycle in desert soils – a proposed model 172
6.2 Summary and outlook 177
6.3 References 179
Appendices
List of abbreviations 181
Index of tables 182
Index of figures 183
Curriculum Vitae 185
List of publications and contribution to conferences
186
Pledge 189
Acknowledgements 191
Summary
III
Deserts cover about a third of the land surface on Earth. However, despite
their size, their ecology – and particularly their microbial ecology – is far less
understood than the ecology of more humid regions. Previous studies have
indicated that desert soils might be involved in the production and
consumption of methane, an important greenhouse gas. The turnover of
atmospheric gases involves many microorganisms, and methane is no
exception – it is both produced and consumed by microbes. Despite the
extensive research methane has been subjected to, a rigorous study striving
to elucidate methane turnover patterns in arid regions and aiming to detect
the active organisms involved has not been conducted so far.
This work comprises three parts. The first part deals with
biogeographical patterns of soil microbial communities along a steep rainfall
gradient in Israel ranging from less than 100 to more than 900 mm yr-1. We
show that community profiles of both Archaea and Bacteria do not change
continuously along the gradient, but rather cluster into three groups that we
have defined as arid, semi-arid and Mediterranean. These three categories
demonstrate a qualitative difference in the microbiology of arid soil
compared to more humid regions.
In the second part we show that pristine arid soils in the Negev
Desert, Israel, are sinks for atmospheric methane, but that disturbed sites
and pristine hyper-arid sites are probably not. The methanotrophic activity
was located in a narrow layer in the soil down to about 20 cm depth.
Interestingly, the biological soil crust (BSC) which is typically the most active
layer in desert soils showed no methane uptake activity and was apparently
devoid of methanotrophs. Transcripts of the key methanotrophic gene –
encoding for the particulate methane monooxygenase (PMMO) – were
detected in the active soils and their sequences showed that they are
affiliated with two clusters of uncultured methanotrophs: USC and JR3.
Based on a correlation of the relative abundance of each methanotroph to
the methane oxidation rate we concluded that JR3 is the dominant
atmospheric methane oxidizer in this arid system.
The third part deals with methanogenesis in upland soils with a focus
on drylands. Following previous work we show that many upland soils,
Summary
IV
sampled globally, possess a methanogenic potential, when incubated
anoxically, despite being aerated most of the time. Only two active
methanogens were detected – Methanosarcina and Methanocella – which
appear to be universal upland soil methanogens. Under these conditions,
acetoclastic methanogenesis, mediated by Methanosarcina, was the
dominant methanogenic pathway and cell numbers of Methanosarcina were
well correlated with methane production rates.
Lastly, we show that the BSC was the source for methanogenic
activity in arid soils while the deeper layers showed little or no methanogenic
potential. When the BSC was incubated in a wet state in microcosms and in
the presence of oxygen methanogens could still grow and methane was still
produced albeit at relatively low amounts. Both methanogens expressed the
gene encoding for the oxygen detoxifying enzyme catalase giving at least
some explanation to their ability to remain viable in the presence of oxygen.
Under these conditions, Methanocella was the dominant methanogen and
most methane was produced from H2/CO2, indicating niche differentiation
between the two methanogens.
The findings of this work suggest that under standard dry conditions
pristine arid soils are a net sink for atmospheric methane but that following
a rain event they might turn into net sources.

Zusammenfassung
V
Wüsten bedecken circa ein Drittel der Erdoberfläche. Trotz dieser Ausmaße
ist ihre Ökologie – insbesondere ihre mikrobielle Ökologie – weit weniger
erforscht als die Ökologie feuchter Gebiete. Einige Studien deuten an, dass
Wüstenböden an der Produktion und dem Verbrauch von Methan – einem
wichtigen Treibhausgas – beteiligt sein konnen. Mikroorganismen sind
verantwortlich für den Umsatz atmosphärischer Gase. Methan stellt hierbei
keine Ausnahme dar. Es wird sowohl von Mikroben produziert, als auch
umgesetzt. Trotz umfangreicher Forschung sind grundlegende
Untersuchungen der Methanumsetzung in ariden Gebieten und den aktiv
beteiligten Organismen bisher ausgeblieben.
Diese Arbeit besteht aus drei Teilen. Der erste Teil beschäftigt sich mit
biogeographischen Verteilungsmustern mikrobieller Bodengemeinschaften
entlang eines ansteigenden Niederschlagsradientens in Israel (100 bis über
900 mm Niederschlag yr-1). Es konnte gezeigt werden, dass sich die
Zusammensetzung von Bakterien- und Archeengemeinschaften nicht
kontinuierlich über den Gradienten ändert, sondern sich eher in drei
Gruppen zusammenfassen lässt, welche als arid, semi-arid und mediterran
definiert wurden. Diese drei Kategorieren demonstrieren einen qualitativen
Unterschied in der Mikrobiologie arider Böden im Vergleich zu feuchten
Regionen.
Im zweiten Teil zeigen wir, dass ursprüngliche aride Böden der Negev
Wüste in Israel eine Senke für atmosphärisches Methan darstellen, während
anthropogen beeinflusste, ebenso wie ursprüngliche hyper-aride Böden dies
nicht zu sein scheinen. Die methanotrophe Aktivität wurde in einer
schmalen Schicht in ca. 20 cm Bodentiefe gefunden. Interessanterweise
zeigte die Oberflächenkruste, welche die typischerweise die aktivste Schicht
im Wüstenboden darstellt, keine Methanaufnahme und methanotrophe
Bakterien konnten in dieser Schicht nicht nachgewiesen werden.
Transkripte des pmoA Gens, welches eine Untereinheit des Schlüsselenzyms
der Methanoxidation kodiert, wurden in den aktiven Bodenschichten
detektiert und die phylogenetische Analyse zeigte eine Zugehörigkeit zu den
zwei Umweltclustern USCg und JR3. Die Korrelation von relativen
Sequenzhäufigkeiten mit Methanoxidationsraten deutet darauf hin, dass
Zusammenfassung
VI
bislang unkultivierte Bakterien des Clusters JR3 die dominant aktiven
Methanoxidierer in diesem ariden System sind.
Der dritte Teil dieser Arbeit beschäftigt sich mit der Methanogenese in
upland soils (gut durchlüftete Böden) mit dem Fokus auf trockene Böden.
Anknüpfend an frühere Arbeiten zeigen wir, dass viele upland soils, global
verteilt, ein methanogenes Potential besitzen, wenn sie anoxisch inkubiert
werden, auch wenn sie in unter natürlichen Bedingungen überwiegend gut
durchlüftet vorkommen. Nur zwei aktive methanogene Archeen wurden
detektiert – Methanosarcina und Methanocella – die in upland soils allgemein
verbreitet zu sein scheinen. Unter den getesteten Bedingungen stellte die
acetoclastische Methanogenese – katalysiert von Methanosarcina - den
dominanten methanogenen Stoffwechselweg dar und Zellzahlen korrelierten
gut mit der Methanproduktionsrate.
Zuletzt zeigen wir, dass die Metanogenese in ariden Böden in der
Oberflächenkruste stattfindet und tiefere Schichten kaum oder nur wenig
metanogenes Potential aufweisen. Selbst bei Inkubation der
Oberflächenkruste in Anwesenheit von Sauerstoff zeigten die Methanogenen
noch Wachstum und Methan wurde produziert, wenn auch in
vergleichsweise niedrigen Raten. Beide nachgewiesenen methanogenen Arten
besitzen Katalase-Aktivität, was zumindest zum Teil ein Überleben in
sauerstoffreicher Umgebung erklären könnte. Unter diesen Bedingungen
dominierte Methanocella als methanogene Art und das Meiste Methan wurde
über H2/CO2 produziert. Dies weist auf eine Nischendifferenzierung
zwischen den beiden Methanogenen hin.
Die Ergebnisse dieser Arbeit lassen annehmen, dass ursprüngliche
aride Böden unter trockenen Bedingungen Senken für atmosphärisches
Methan darstellen, jedoch könnten Regenfälle diese Senken in
Methanquellen verwandeln.

1
Chapter 1| Introduction
1.1 Atmospheric methane
Methane is the simplest possible hydrocarbon; it is very light and flammable,
and readily volatile. The discovery of methane is attributed to Allesandro
Volta. In 1778 he collected gas which emerged when the shallow sediment of
Lake Maggiore, Italy, was disturbed and observed that it is very flammable.
The experiment was later repeated in 1822 by John Dalton who termed the
gas ‘carbonated hydrogen’ (Dalton, 2005). From a human perspective,
methane is of interest for two main reasons: first, burning methane can be
utilized for the production of energy, such as in electrical generators.
Second, it possesses greenhouse properties and thus contributes to global
warming, which is rightly considered one of the greatest threats humanity is
currently facing (Houghton, 2005). In fact, methane is the third most
important greenhouse gas, after water vapours and CO2, making it a subject
of interest for extensive research. Traditionally it was assumed that methane
is approximately 25 times more potent than CO2 as a greenhouse gas over a
100-years time horizon, but recent modelling which accounted for direct and
indirect interactions with aerosols now estimate that it is 26-41 times more
potent than CO2 as a greenhouse gas (Shindell et al., 2009).
Methane has probably existed on planet Earth soon after its formation
some 4.5 billion years ago due to early volcanic activities. However, it
apparently did not accumulate in significant amounts and contributed little
to the developing atmosphere (Kasting, 1993; Canfield et al., 2006). Today,
geological methane seeps still play an important ecological role in some
marine environments and contribute partly to the atmospheric methane
pool, but overall geological methane sources contribute little to the global
1| Introduction
2
budget (Reeburgh, 2007; Alperin and Hoehler, 2010). Starting from the
emergence of methanogenesis – probably in the mid-Archean era – and up to
our present times, most methane produced on earth (up to 80%), and as a
consequence most methane in the atmosphere, is of biogenic origin (Bréas et
al., 2001). From the mid-Archean and up to the early Proterozoic era, prior
to the oxidation the atmosphere, methane accumulated substantially in the
atmosphere, up to 105 – 106 ppbv, and played a much greater role as a
greenhouse gas (Catling et al., 2001). The only known way where biogenic
methane is formed in nature is through the anaerobic methanogenesis
process, for which a single guild of microorganisms – the methanogenic
Archaea – is responsible.
Present levels of atmospheric methane are 1,774 ± 1.8 ppbv making
methane the most abundant hydrocarbon and the 7th most abundant gas in
the atmosphere (excluding water; Forster et al., 2007). This present
concentration, however, is not all the result of natural ecosystem processes.
For the past 800,000 years, methane levels in the atmosphere varied
between 350-800 ppbv (Spahni et al., 2005; Loulergue et al., 2008) but in
the past 250 years or so they have increased dramatically up to the present
concentration, primarily due to increasing anthropogenic activity (Forster et
al., 2007).
Natural wetlands are, according to most estimates, the largest source of
atmospheric methane, emitting over 200 Tg CH4 yr-1, yet the combined
contribution of human induced activities is larger (Figure 1.1). These
comprise the largest part of the present global budget and include primarily
cattle raising, rice agriculture, and fossil fuel mining which, along with other
activities, emit some 350 tons of methane into the atmosphere annually. An
additional source of methane of global importance has been recently
recognized – non-biogenic methane emission from plant leaves (Keppler et
al., 2006). It is currently believed that this methane is formed by
photochemical cleavage of methyl groups from the pectin found in leaf
tissues by UV radiation (McLeod et al., 2008). Reliable estimates of the
magnitude of this source on a global scale are presently still missing and it
is therefore not yet incorporated into most global methane balances.
1| Introduction
3
While it is believed that the major sources and sinks of methane are
known, there are great uncertainties regarding the exact magnitude of each
of them (Figure 1.1). These uncertainties are manifested in the often large
differences between global models (Potter et al., 1996; Lelieveld et al., 1998;
Bréas et al., 2001). Particularly, the magnitude of the different sources is
debatable and the existence of a missing source has been postulated. One
possible missing source is plant leaves as described above, but others have
suggested earlier that it lies in wetlands and water reservoirs in the Amazon
Basin (Melack et al., 2004; Frankenberg et al., 2005). In addition, although
methane has been increasing at an average rate of 4.4 ppbv yr-1, a large
interannual variability in methane emissions has been observed and also
long term changes (Blake and Rowland, 1986). The rise in atmospheric
methane concentrations seems to have been slowing down since the late
80’s (Wang et al., 2004; Dlugokencky et al., 1998) and has virtually ceased
since 1999 (Dlugokencky et al., 2003) probably due to changes in
anthropogenic activity (Bousquet et al., 2006; Rigby et al., 2008; Worthy et
al., 2009). Whether the rise in atmospheric methane has really ceased is still
in question and a recent study suggests a renewed increase (Rigby et al.,
2008).

1| Introduction
4
Figure 1.1| Sources and sinks of atmospheric methane. Bar widths represent
estimate ranges, the line within each bar represents the mean. Total budget is
estimated at 574 + 91 Tg yr-1; present atmospheric concentration of methane is
approximately 1.8 ppmv. Data: Denman et al., 2007.
It is estimated that about one to two percent of all photosynthetically
fixed carbon is ultimately degraded into biogenic methane. A minor part of it
gets trapped and buried and exits the carbon cycle, but most if it diffuses to
the oxic zone. In the intestines of ruminants and termites methane is
released directly into the air, but in soil and freshwater sediments, where an
oxic/anoxic interface exists, a large part of that methane is consumed by
methane oxidizing bacteria (methanotrophs) and only some of it ends up in
the atmosphere. The fate of most geological methane is similar. Geological
methane which is released due to human activities such as fossil fuel mining
is almost directly and fully released into the atmosphere, but the methane
which bubbles naturally in oceanic methane seeps and mud volcanoes is
mostly oxidised by anaerobic methane oxidisers (Knittel and Boetius, 2009).
Eventually, it is estimated, only about 42% of the methane formed on earth
from either biological or geological sources reaches the atmosphere while the
rest is consumed by microorganisms (Reeburgh, 2006). In these
1| Introduction
5
environments, the difference in activity between methanogens and
methanotrophs and their independent population dynamics, is what
determines their magnitude as methane sources (Conrad, 1996).
1.2 Methanogenic Archaea
Methanogens are a guild of microorganisms that produce methane as
part of their energy metabolism. All known methanogens are part of the
Euryarchaeota phylum; they are strict anaerobes and can only use
methanogenesis for energy production (Whitman et al., 2006). Unlike other
archaeal groups, and in fact most prokaryotes, methanogens are relatively
easy to cultivate and a cultured representative exists for virtually every
phylogenetic group of methanogens. Methanogens were the first (and for a
long time, the only) cultivated representatives of the domain Archaea.
Indeed, it was the polymorphic characteristics of the ribosomal RNA of
methanogenic species of Methanobacterium and Methanosarcina which were
used by Woese and Fox to postulate the tripartite structure of the Tree of
Life in their seminal work from 1977.
Although all methanogens belong to the Euryarchaeota their diversity
within this single phylum is quite extensive and deeply branching – a further
evidence for the primordial emergence of this form of life. Currently there are
30 recognized genera of methanogens (including Candidatus Methanoregula)
which in turn belong to 11 families and 6 orders spread throughout the
euryarchaeal phylogenetic tree: Methanomicrobiales, Methanocellales,
Methanosarcinales, Methanobacteriales, Methanococcales and
Methanopyrales.
In somewhat of a contrast to their extensive phylogenetic diversity, the
metabolic diversity of methanogens is rather limited. Methanogens take a
pivotal role in anaerobic degradation of organic matter, yet they are unable
to utilize most degradation products and depend on secondary fermenters
and syntrophs to provide them with substrates. Methanogenic pathways are
often classified into three types: hydrogenotrophic (CO2 reduction), C1
compounds demethylation and acetate cleavage (Table 1.1).

1| Introduction
6
Table 1.1| Most common methanogenic reactions. After Hedderich and Whitman (2006)
Reaction Go‘ (kJ/mol CH4)
Hydrogenotrophic CO2 + 4 H2 → CH4 + 2 H2O -130 4 HCOOH → CH4 + 3 CO2 + 2 H2O -120 CO2 + 4 (isorpoanol) → CH4 + 4 CH3COOH + 2 H2O -37 C1 compounds demethylation CH3OH + H2 → CH4 + H2O -113 4 CH3OH → 3CH4 + CO2 + H2O -103 4 CH3NH3Cl + 2 H2O → 3 CH4 + CO2 + 4 NH4Cl -74 2 (CH3)2S + 2 H2O → 3 CH4 + CO2 + 2 H2S -49 Acetate cleavage CH3COOH → CH4 + CO2 -33
Different pathways are used by different methanogens and the
distribution is not random but rather linked to phylogenetic origin. Thauer
and colleagues (2008) proposed to classify methanogens, according to their
ecophysiology, into those that posses cytochromes and those that do not.
The cytochromes containing methanogens are from the order
Methanosarcinales, they are characterized by high growth yields and high
threshold for hydrogen (when a hydrogenotrophic pathway exists). With the
exception of the family Methanocellaceae which are strict hydrogenotrophs,
all cytochromes containing methanogens are able to produce methane from
methylated compounds and/or from acetate. Methanogens which do not
contain cytochromes are all strict hydrogenotrophs (with the exception of
Methanosphaera), have lower threshold values for H2 but also lower growth
yields.
The first type of methanogenesis uses CO2 as an electron acceptor and
hydrogen is normally the electron donor (hydrogenotrophic methanogenesis).
Since CO2 is usually abundant in anoxic environments, hydrogen
concentration usually limits this reaction. Methanogenesis based on H2/CO2
is the most commonly found pathway in nature and is common among all
methanogens. In some environments such as in ruminants and termites it is
the dominant pathway and probably the only one (Liu and Whitman, 2008).
Methanogenesis from formate is performed in a similar way to H2/CO2 based
methanogenesis since formate is first converted to hydrogen and CO2
intracellularly, and it seems to be restricted to methanogens without
cytochromes. In addition, few methanogens are also able to utilize secondary
alcohols such as isopropanol and isobutanol as well as ethanol as hydrogen

1| Introduction
7
donors for CO2 reduction. Methanogenesis through demethylation of C1
compounds is found only in members of the family Methanosarcinaceae
(cytochromes containing methanogens), and for most genera it is an
obligatory pathway. A methanogen outside the Methanosarcinaceae family,
classified in this metabolic group, is the genus Methanosphaera (of the
Methanobacteriaceae) which can utilize methanol in addition to H2/CO2
(Thauer et al., 2008). The last type is methanogenesis through acetate
cleavage into methane and CO2 (acetoclastic methanogenesis). This type is to
be found only in two genera of cytochromes containing methanogens –
Methanosarcina and Methanosaeta, for the latter this pathway is obligatory
(Liu and Whitman, 2008).
Despite the different pathways, the biochemical machinery involved in
methane production shares key components amongst all methanogens
(Figure 1.2). The components of the biochemical pathways of
methanogenesis through CO2 reduction and demethylation of C1
compounds are nearly identical (but the step order in the pathway is
reversed). These two pathways are somewhat different from the acetoclastic
one, but they share the coenzymes tetrahydromethanopterin (H4MPT;
although it is used to bind different functional groups) and F420-
hydrogenase. Above all, all methanogenic pathways converge into a single
final step – the reduction of the methyl group bound to the coenzyme M
(CH3-S-CoM) by a hydrogen bound to coenzyme B (H-S-CoB; Thauer 1998).
The reaction is catalyzed by the enzyme methyl coenzyme reductase M which
is homologous in all methanogens and is relatively well conserved. Because
it is common to all methanogens and is conserved, the mcr gene, or more
precisely it’s subunit – mcrA, makes a good functional genetic marker and
is often used to identify methanogens in the environment through molecular
means (Luton et al., 2002).
Methanogens are key components in nearly all anoxic environments.
When oxygen and other electron acceptors such as Fe3+, NO3-, SO42- are
absent methane production acts as the sole terminal sink for electrons and
is the rate limiting step for all upstream reactions. In the absence of
methanogens, hydrogen and acetate quickly accumulate and many
anaerobic fermentation reactions become thermodynamically unfavorable. In
1| Introduction
8
this case, the entire degradation cascade ceases or is reduced to minimum.
It is therefore not surprising that methanogens are found in abundance in
most anoxic environments around the world (Liu and Whitman, 2008).
In most environments, the dominant methanogenic pathways are
acetoclastic and hydrogenotrophic while methane formation from methylated
compounds and secondary alcohols is marginal, primarily due to substrate
limitation (Conrad, 2005). Therefore, in environmental modeling of
methanogenic pathways often only the acetoclastic and hydrogenotrophic
ones are taken into account while the others are neglected, and so was done
in this work as well. Important exceptions to this rule are marine sediments
and hypersaline mats. In these environments, sulfate is usually abundant
and sulfate reducers outcompete methanogens for hydrogen and acetate
(Martens and Berner, 1974; Cappenberg and Prins, 1974). It was therefore
puzzling for several years to find active methanogenesis in these sediments
(Oremland et al., 1982). As it turned out, methanogenesis was occurring
primarily from methylated compounds such as trimethylamine, compounds
which cannot be utilized by sulfate reducers or not as effectively as
methanogens (Hippe et al., 1979). Trimethylamine is a degradation product
of the compatible solute glycine-betain. These compounds are found in
abundance in the sediments of saline water bodies since it is used by fish,
algae and cyanobacteria to maintain intercellular osmotic pressure
(Oremland, 1988).
In non-saline environments where methanogenesis from compatible
solutes is marginal, the complete degradation of organic carbon (usually
polysaccharides) should theoretically lead to two thirds of the methane being
formed from acetate and only a third from H2/CO2 (Conrad, 1999). In many
environments, a deviation is observed from this classical ratio most probably
due to either homoacetogenesis (less hydrogenotrophic methanogenesis)
and/or incomplete degradation of organic carbon (less acetoclastic
methanogenesis; Conrad et al., 2009).
Competition for substrates is the main reason why methanogens
require a highly reduced environment to thrive. As it turned out in several
studies, the redox potential of the environment in itself does not hamper
methanogenesis significantly, up to about 400 mV (Fetzer and Conrad,
1| Introduction
9
1993; Yu et al., 2007). This is not the case, however, for oxygen. As with
most anaerobes, methanogens too cannot cope with the damage caused by
reactive oxygen species to their membranes, proteins and nucleic acids
(Storz et al., 1990). Additionally, the F420-hydrogenase, a crucial electron
transporter in methanogenesis, is particularly sensitive to oxygen (Schönheit
et al., 1981). For these reasons it was considered for years that methanogens
could only be found in anoxic and highly reduced environments such as
those mentioned above. Indeed, all isolation strategies for methanogens
include strong reducing agents and keeping the media from oxygen
contamination is often tricky (Atlas, 2010).
But in 1995 Peters and Conrad reported that samples of upland soils
(soils which are aerate throughout most of the year) taken from various
parts around the world, representing different ecosystems, could exhibit
methanogenic potential (as well as sulfate reduction and homoacetogenesis).
Sample types ranged from temperate forest to savanna and desert soils;
though overall the number of samples was very small and did not include
true replicates. While their experiments were performed under anoxic/highly
reduced conditions, viable methanogens could nevertheless be detected in
these soils and could be readily activated with just the addition of water,
even after being exposed to oxygen for long periods in the field and then
stored in a dry state at room temperature for periods ranging from several
months to nearly nine years. The core methanogenic population in these
samples was small and methanogenesis was apparently limited to some
extent by population size and not only competition (Peters and Conrad,
1996). Only few researchers followed up on these experiments, trying to
reproduce the observations and in addition to detect the methanogens which
are involved in these process (West and Schmidt, 2002; Teh et al., 2005;
Nicol et al., 2003; Radl et al., 2007; Gattinger et al., 2007). In many of these
cases, however, the authors focused on soils which are heavily impacted by
grazing and thus attributed most of the methanogenic activity to the effect
livestock had on the soil by enriching it with nutrients from urine and
manure and by inoculating it with rumen microflora. In contrast, we
hypothesized that the occurrence of methanogens in aerated soils and their
ability to survive long periods of exposure to oxygen might indicate that they
1| Introduction
10
are also active in nature under certain conditions and that at least some are
native to aerated soils.
1.3 Methane oxidizing bacteria
Biological methane oxidation is the primary mechanism in nature by which
methane is degraded and the carbon is recycled. It is now agreed that
methane is oxidised in nature in both aerobic and anaerobic pathways and
that both types of methane oxidation are of global significance. The first
methane oxidizing bacteria was isolated already in 1906 by N. L. Söhngen
but only in 1970, following the work of Whittenbury and his colleagues,
could a large set of pure cultures of methanotrophs from various sources be
generated and maintained (Dalton, 2005). Today there are over two hundred
isolates of aerobic methane oxidisers from 17 different genera (Bowman et
al., 1993; Lüke, 2010).
In contrast to aerobic methane oxidation, anaerobic oxidation of
methane (AOM) has only recently been recognized and presently no cultured
representative exists. The first indications for the occurrence of AOM
coupled to sulphate reduction came in the mid 70’s and early 80’s
(Reeburgh, 1976; Zehnder and Brock, 1980). It was initially thought that
methanogens were responsible for the process which they performed
simultaneously with methane production, but the rates measured in the lab
for methanogens could not account for the fluxes measured in the field
(Zehnder and Brock, 1979). It took more than 20 years for the first
molecular evidence to appear tying AOM to an unknown group of
Euryarchaeota which are closely related to Methanosarcinales and
Methanomicrobiales (Hinrichs et al., 1999). Later it could be shown
microscopically that anaerobic methane oxidisers (termed ANME) live in
aggregates with sulphate reducing bacteria (Boetius et al., 2000). While it is
currently recognized that ANME are phylogenetically different from
methanogens it appears that Zehnder and Brock were not entirely wrong in
their prediction since ANME contain the mcr gene and apparently use a
reverse methanogenic cycle for methane oxidation (Shima and Thauer,
2005). Recently, a methane oxidizing bacteria that uses nitrite as an electron
acceptor and produces oxygen was isolated from anoxic freshwater sediment
1| Introduction
11
in the Netherland (Ettwig et al., 2010). Currently, however, there is no
indication for the existence of anaerobic methane oxidation in soils and
these microbial groups are therefore not discussed in this work.
Aerobic methanotrophs are a guild of phylogenetically different
bacteria which oxidise methane for both energy and carbon assimilation
(Mancinelli, 1995). They are all obligatory aerobes and most of them are also
obligatory methane oxidisers (Bowman, 2006). Aerobic methanotrophs are a
subset of a larger guild known as methylotrophs which metabolize a variety
of C1 compounds. The basic taxonomy of the aerobic methanotrophs was
established in 1970 with the seminal work of Whittenbury and his
colleagues. The distinction remains in use till today though with
modifications and reservations as more and more exceptional
methanotrophs are discovered (Semrau et al., 2010). Accordingly,
methanotrophs are classified as either type I or type II based to the structure
of their phylogeny, internal membrane, membrane lipids composition and
their resting stages. The ‘classical’ aerobic methanotrophs lie all within the
proteobacteria phylum. Those classified as type I all belong to the family
Methylococcaceae of the Proteobacteria and include genera such as
Methylomonas Methylobacter and Methylomicrobium while type II
methanotrophs lie within the Proteobacteria and include the families
Methylocystaceae (e.g. Methylosinus) and Beijerinckiaceae (e.g.
Methylocapsa). Type I is in itself further divided into type Ia and type Ib with
the aforementioned genera classified as type Ia. Type Ib (initially termed type
x) comprises of Methylococcus and Methylocaldum which also belong to the
Proteobacteria but posses several key traits which differ from type Ia
methanotrophs. Among these are some differences in the biochemical
machinery for methane oxidation (see below), high G+C content and high
optimal growth temperatures (Hanson and Hanson, 1996). A recent addition
to these classical methanotrophs is the isolation of thermophilic and highly
acidophilic aerobic methane oxidisers from hot springs in New Zeeland, Italy
and Russia. These isolates are members of the Verrucomicrobia phylum
rather than the Proteobacteria (Dunfield et al., 2007; Pol et al., 2007; Islam
et al., 2008). These new isolates were classified under the new genus
1| Introduction
12
Methylacidiphilum and so far seem to be highly adapted and restricted to
high temperature/low pH environments (Camp et al., 2009).
Types I and II methanotrophs use different biochemical pathways to
oxidise methane but they all use the same initial steps. The first step in the
aerobic oxidation of methane is its oxidation to methanol by the methane
monooxygenase (MMO) which comes in two forms. All known methanotrophs
apart from Methylocella possess the membrane bound type of the enzyme –
the particulate methane monooxygenase (pMMO) - which is embedded in the
intricate system of internal membranes of the cell (Dedysh et al., 2000). The
second type – the soluble methane monooxygenase (sMMO) – is a
cytoplasmatic type and exists only in some species (Murrell et al., 2000). In
those species which possess both types of the enzyme it was found that the
availability of copper ions (which are required for the synthesis of pMMO)
regulates the differential expression of these enzymes (Stanley et al., 1983;
Nielsen et al., 1996; Semrau et al., 2010). Because pMMO is found in nearly
all methanotrophs and because it is very conserved one of its subunits - the
pmoA subunit (27 kDa) – is the most commonly used genetic marker for the
detection of methanotrophs (Murrell et al., 1998). The next steps in the
pathway are also identical for both type I and II – conversion of methanol to
formaldehyde then to formate and finally to CO2. The more prominent
biochemical distinctions between the different methanotrophic types (and
the Verrucomicrobia) relates to the pathway in which carbon is assimilated
by the cell. Type II and Verrucomicrobia methanotrophs use primarily
different versions of the serine cycle to assimilate formaldehyde into cellular
carbon, while Type I methanotrophs use primarily the RuMP pathway
(though there’s some level of expression of genes of the serine pathway in
type Ib methanotrophs Hanson and Hanson, 1996; Camp et al., 2009). Some
species of methanotrophs are also able to fix carbon using the Calvin-
Benson-Bassham cycle (Trotsenko and Murrell, 2008).
An additional distinction made with regards to methanotrophs is
related to their ecophysiology. Upland soils are a biological sink of
atmospheric methane and consume approximately 30 Tg per year (Figure
1.1). To be able to consume methane at such trace amounts these
methanotrophs must possess a methane monooxygenase with a low Km
1| Introduction
13
property. Indeed, Bender and Conrad determined the apparent Km for
various upland soils and reported values around 50 nM and a threshold
value of down to 0.2 ppmv of methane (Bender and Conrad, 1992). These
values are much lower than those known for methanotrophs from pure
culture studies which are normally in the M range (Knief and Dunfield,
2005). On the basis of these observations it was postulated that two types of
methanotrophs exist: low affinity methanotrophs which are adapted to high
methane concentration end encompass all cultivated strains and high
affinity methanotrophs which are able to oxidise atmospheric methane and
which are not present in culture collections (Conrad, 1999). This dichotomy
has been somewhat undermined by the alternative notion that some known
methanotrophs might hold both qualities by possessing two sets of MMOs
with different Km values (Knief and Dunfield, 2005). As a support for this
alternative theory it was found that many type II methanotrophs possess an
alternative MMO operon, termed pmoCAB2, which has only a low similarity
to the known pmoCAB1 operon (Yimga et al., 2003; Ricke et al., 2004). Later,
Baani and Liesack (2008) could show that in Methylocystis sp. strain SC2
the pmoCAB1 was responsible for the low affinity methane oxidation activity
while its counterpart pmoCAB2 operon showed a high affinity methane
oxidation property. Nevertheless, while Methylocystis and other similar type
II methanotrophs are abundant in upland soils, most pmoA sequences
detected in soils with active atmospheric methane uptake form clusters (e.g.
upland soil cluster alpha, USC) that are different from those of the known
methanotrophs (Holmes et al., 1999; Henckel et al., 1999; Knief et al., 2003;
Kolb et al., 2005). It therefore remains to be discovered whether these
upland soil pmoA sequences are alternative operons of known
methanotrophs or belong to novel species (Kolb, 2009).
1| Introduction
14
1.4 Interactions between methanogens and methanotrophs
in soil
Oxygen has low solubility in water and its diffusive flux in most wet
environments is much lower than its consumption rate by heterotrophic
microorganisms. Because of these traits, wet environments (salt and fresh
water bodies, wetland soils etc.) tend to develop a typical structure by which
the sediment is almost entirely anoxic and trace amounts of oxygen may or
may not be present in the topmost few millimetres (Fenchel et al., 1998a).
Once oxygen is detectable, either in the sediment or the water column, its
concentration rises steadily from the bottom along the water column up to
the air-water interface where it might be at saturation for that temperature
or at hyper-saturation (if photosynthesis is taking place in the water
column). In the anoxic sediment anaerobic degradation processes take place
degrading the carbon which originates from photosynthetic activity in the
upper layers of the water column, by plants and microorganisms, or from
land. The specific oxygen diffusion rates and the availability of alternative
electron acceptors determine the redox potential of the sediment and the
specific nature of the anaerobic degradation processes which take place
(Fenchel et al., 1998b). Two types of sequential patterns, a spatial and a
temporal, are acknowledged with respect to redox reactions in anoxic
sediments. On the spatial level, vertical layers are formed according to the
dominant electron acceptor, with oxygen at the topmost layer. Once oxygen
is depleted alternative electron acceptors become dominant in the deeper
layers according to their redox potential and their availability. These are
usually NO3-, Mn4+, Fe3+ and SO42-, in this order (Zehnder and Stumm,
1988). The same process is seen temporally when oxic soils get flooded, for
the same thermodynamic reasons, with oxygen being depleted first followed
by the depletion of available electron acceptors. Methanogenesis (based on
acetate or H2/CO2) being the least thermodynamically favourable is found at
the bottom layer of the sediments or last in a sequential reduction process
(Yao et al., 1999).
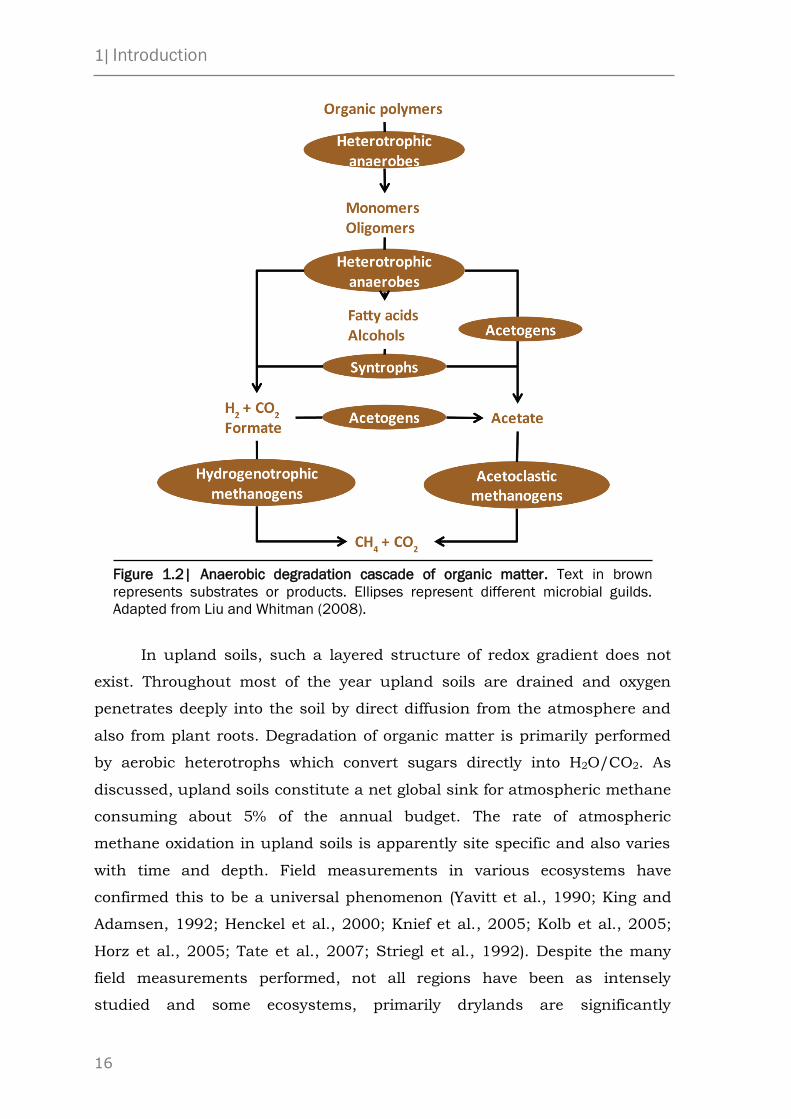
Since methanogens are unable to degrade organic polymers or utilize
short chain fatty acids (SCFA) they rely on a cascade of anaerobic

1| Introduction
15
degradation processes for methanogenesis (Figure 1.2; Zinder, 1993). These
start from the secretion of hydrolytic enzymes by fermenting bacteria
(anaerobic heterotrophs) hydrolyzing polymers (such as polysaccharides) to
monomers. The monomers are then further fermented to H2, acetate and
SCFA. H2 and acetate can be directly used by methanogens but fatty acids
need to be further degraded. The degradation of SCFA is usually
thermodynamically unfavourable under standard conditions, but it is
nevertheless achieved by an association of syntrophic bacteria and
methanogens. The latter utilize hydrogen directly transferred to them by
syntrophs thereby reducing its concentration to a minimum and making the
degradation of SCFA by syntrophs energetically possible (Stams and Plugge,
2009). In addition to these reactions, homoacetogenesis might be occurring
in parallel, generating acetate from H2/CO2, though this is energetically
unfavourable when hydrogenotrophic methanogenesis occurs
(Siriwongrungson et al., 2007). Lastly, acetate itself might be consumed
syntrophically by syntrophic acetate-oxidizing bacteria, usually at high
temperatures (Liu and Conrad, 2010).
Methane which is formed in these anoxic sediments is transported to
the atmosphere either through plant aerenchyma or by direct diffusion and
bubbling through the sediment and the water column (Conrad, 2004). In the
second transport mechanism, methane reaches the oxic-anoxic interface
where it is consumed by methanotrophs (Damgaard et al., 1998; Gilbert and
Frenzel, 1998).
1| Introduction
16
Figure 1.2| Anaerobic degradation cascade of organic matter. Text in brown
represents substrates or products. Ellipses represent different microbial guilds.
Adapted from Liu and Whitman (2008).
In upland soils, such a layered structure of redox gradient does not
exist. Throughout most of the year upland soils are drained and oxygen
penetrates deeply into the soil by direct diffusion from the atmosphere and
also from plant roots. Degradation of organic matter is primarily performed
by aerobic heterotrophs which convert sugars directly into H2O/CO2. As
discussed, upland soils constitute a net global sink for atmospheric methane
consuming about 5% of the annual budget. The rate of atmospheric
methane oxidation in upland soils is apparently site specific and also varies
with time and depth. Field measurements in various ecosystems have
confirmed this to be a universal phenomenon (Yavitt et al., 1990; King and
Adamsen, 1992; Henckel et al., 2000; Knief et al., 2005; Kolb et al., 2005;
Horz et al., 2005; Tate et al., 2007; Striegl et al., 1992). Despite the many
field measurements performed, not all regions have been as intensely
studied and some ecosystems, primarily drylands are significantly

1| Introduction
17
underrepresented (Smith et al., 2000). Soil type and land use as well as
season all affect oxidation rates (through temperature and soil water content
(Adamsen and King, 1993; Reay et al., 2001, 2005; Menyailo and Hungate,
2003). Upland soils do get temporarily anoxic, though, when water displaces
air in the soil pores. While it has been shown in principle that the same
sequential reduction processes can occur in upland soils, when becoming
anoxic, and that even methane can be formed, this behaviour has not been
confirmed under field conditions and the ecological significance of this
phenomenon is unknown (Peters and Conrad, 1996)
1.5 Dryland ecosystems
What are deserts?
Deserts (semiarid, arid and hyperarid regions) span over 44 mil. km2
which make up 33% of the earth’s land surface. Together with dry sub-
humid areas these regions are defined as drylands and make up 44% of the
land surface (Verstraete and Schwartz, 1991). This estimation excludes polar
deserts which span over another 5.5 million km2 and are not covered in this
work. The most distinctive feature of deserts, and what in fact defines them,
is water deficiency. This is most often measured by the aridity indices which
are also used to classify drylands. A common index – AIU – determined by
UNESCO is defined as the ratio of precipitation (P) to potential
evapotranspiration (PET; Middleton and Thomas, 1997). In addition to the
classifications described above deserts are further divided into subtropical
deserts, cold winter deserts, and cool coastal deserts. In English (and the
romance languages) the noun ‘desert’ is related to the verb of the same name
– to abandon – both stemming from the Latin dēserere – to forsake. But
deserts are not entirely forsaken, in fact half of the world’s countries are in
part or entirely located in drylands environments and they are home to
nearly 40% of the human population (Ffolliott et al., 2003).

1| Introduction
18
Desertification
All deserts on Earth are currently expanding at their margins in a
process termed desertification. Much of this is attributed to human activity,
either indirectly through climate change or directly through unsustainable
land use practices such as logging, overgrazing and cultivation of unsuitable
crops (Cloudsley-Thompson, 1988; Dregne, 1991). Once soil degradation has
started it often exhibits positive feedback cycles such as invasion of desert
species and nutrient loss through fluvial and aeolian processes which
perpetuate the desertification process and even exacerbate it (Schlesinger et
al., 1990; Thomas et al., 2005). Because of that and because of the
detrimental effects of desertification on human populations global efforts are
made to study the process and combat it (Kassas, 1995; UNCCD, 2009)
Stress factors
The desert environment is perceived by us as an extreme environment.
For humans and animals solar radiation is strong and temperatures are
high, plants are scarce and so food is difficult to obtain, and water resources
are rarely encountered. It’s no wonder then that deserts always have a low
density of human settlements, animals and plants (but not low diversity).
However, is this also the case for soil bacteria? If we examine these stress
factors from the bacteria’s perspective we see that most of them are
irrelevant or do not represent extreme conditions. While exposure to direct
sun radiation is detrimental to microorganisms for much of the same
reasons that it is for plants and animals – namely mutagenesis by UV
radiation – it is primarily not a problem to any cell living just a few m below
ground as soil particles effectively screen out radiation. Those living on top
do have to deal with it and indeed many desert dwelling bacteria were found
to possess various ‘sunscreen’ pigments (Bowker et al., 2002; Belnap et al.,
2007). This point can be demonstrated easily by simply spreading some top
soil on an agar plate. While a sample taken from, say, a forest soil would
produce primarily white and similarly looking colonies a desert soil sample
would produce a variety of colourful colonies which can effectively deal with
high solar radiation. High temperatures might be the first association for
1| Introduction
19
most people when it comes to deserts but for most microorganisms they
could hardly be more comfortable. Once again soil acts as a strong buffering
matrix and temperatures tend to be very mild throughout the year even just
a few millimetres below ground. Low plant coverage in deserts is the primary
reason for low levels of nutrients in desert soils, primarily of carbon and
nitrogen. Soil dwelling cyanobacteria, microalgae, lichens and mosses are
responsible instead for much of the primary production in desert
environments and in some cases they can even outperform plants in terms
of net ecosystem carbon fixation (Lange, 2002). Cyanobacteria are also
responsible for nitrogen fixation in deserts and in some cases are even the
primary nitrogen fixers. The one true limiting factor for all life forms in
deserts including microorganisms is water availability. Precipitation in
deserts is very limited and tends to be highly unpredictable both in time and
space. Low air moisture and high radiation dry the soil very quickly after a
rain event had occurred giving plants and microorganism a narrow window
of time to complete their life cycles. Water potential in desert soils tends to
be very low and is the primary factor limiting microbial growth in the soil.
Interestingly, low water potential is perhaps the only environmental stress
factor for which bacteria are not the most tolerant organisms. While certain
halophilic bacterial strains can tolerate water potential down to
approximately -40 MPa, some yeasts and fungi can survive desiccation down
to even -70 MPa (Skujins, 1984). Because the primary water resource – rain
– is very limited, marginal water resources such as dew gain more
importance. Dew alone was found to reactivate 80% of the activity of
photosystem II in a dry cyanobacterial crust from Hopq desert in China
while light and temperature accounted only for the remaining 20% (Rao et
al., 2009). For supporting biomass growth in the cyanobacterial crust,
however, liquid water seems to be necessary (Lange et al., 1993).
1| Introduction
20
Distinctive features of desert biomes
Patchiness
Water scarcity limits plant proliferation. This generates in semiarid and arid
ecosystems a typical pattern of landscape patchiness by which ‘islands’ of
shrubs or low trees are scattered across the landscape, in a more or less
ordered pattern, and between them is barren soil where annuals might grow
in rainy years (Whitford, 2002). Patches are first formed primarily by fluvial
processes causing spatial heterogeneity on the small geographic scale and
are later maintained by both physical – fluvial and aeolian – as well as
biological processes in a positive feedback cycle (Ludwig and Tongway,
1995). Garcia-Moya and McKell coined in 1970 the term ‘islands of fertility’
to describe the contrast between shrub and intershrub patches. At first the
term referred only to the accumulation of nitrogen under the canopies of
shrubs in deserts compared to the surrounding area (Charley and West,
1975; Charley and West, 1977) but later it was found that also organic
carbon and in fact virtually all nutrients are significantly more concentrated
under shrub canopies in deserts (Barth and Klemmedson, 1982; Virginia
and Jarrell, 1983; Whitford et al., 1997).
But an ecological vacuum rarely exists on earth and the barren soil
areas in the interspaces between shrub patches are not left abiotic, instead
they allow the development of the most distinctive feature of desert soils –
the biological soil crust.
Biological soil crusts
The most unique and interesting feature of desert soils, for microbiologists at
least, is the biological soil crust (BSC). Soils in more temperate regions are
usually comprised of different layers formed as a result of two inverse
gradients – a decreasing level of organic matter from top to bottom and an
increasing degree of bedrock erosion from bottom to top. The typical desert
soils (Ardisols, Entisols and sometimes Vertisols) are usually comprised of a
bulk of undifferentiated eroded bedrock with only a low degree of soil
development (cambic horizon) with minerals differentiated along the profile

1| Introduction
21
according to solubility (Sombroek, 1987). The topmost few millimetres of the
soil are significantly different. This layer is densely colonized by
microorganisms which interact with each other in complex ways and form a
mat. These microorganisms secrete polymeric substances (mostly
polysaccharides) which aggregate the soil and create a physically separate
layer. The specific microbial members of different BSCs differ from one
location to another but they all rely on a combination of at least some of the
following groups: cyanobacteria, microalgae, fungi, lichens and mosses.
Which of the groups is dominant is a function of climatic region and
precipitation, but they all rely on photosynthesis as a primary source of
energy and carbon.
BSCs are in theory not restricted to deserts; what really limits their
development is the presence of plants. Most of the soil on earth is covered by
plants unless water availability restricts them, such as in deserts (or if it is
covered by ice or snow). Also, in some ecosystems such as coastal sand
dunes, plants have difficulty establishing themselves and BSCs are formed
(Belnap et al., 2002). BSCs are typically a few millimetres in thickness; they
form a solid crust on top of the soil that tends to brake easily when the soil
is dry. Photosynthetic activity occurs when the BSC is wet at the top
millimetre and pH tends to be somewhat higher in this section. Oxygen
levels vary between night and day when the crust is active. In the dark,
oxygen levels drop sharply from atmospheric levels to zero in a linear fashion
and it penetrates only to approximately 1-2 mm depth. The crust is anoxic
below that layer and so is the bulk soil underneath. During daytime, intense
photosynthetic activity takes place and oxygen penetrates much deeper. The
oxygen profile is not linear but rather tends to increase in concentration at
the top micrometres and the soil in this part is hyperoxic (Garcia-Pichel and
Belnap, 1996). BSCs have a considerable mechanical strength thus
providing protection to their microbial inhabitants. A developed BSC
provides resistance to weathering and reduces soil migration by wind
(Gillette et al., 1980; Neuman et al., 1996), but usually also reduces
infiltration of water (Kidron, 2007). BSCs are however very sensitive to
mechanical destruction by animals and humans (Beymer and Klopatek,
1992).

1| Introduction
22
Some members of BSCs are nitrogen fixers. Particularly, the
cyanobacteria genera Nostoc and Scytonema are common in mature crusts
and active nitrogen fixers (Belnap, 2002; Abed et al., 2010). In some
ecosystems, particularly in arid ones, nitrogen fixation by cyanobacteria can
be the primary nitrogen source for the soil (Evans and Ehleringer, 1993).
The preservation of nitrogen in the soil depends on the BSC remaining intact
and considerable nitrogen losses from dryland soils were measured after
disturbance (Evans and Ehleringer, 1993; Evans and Belnap, 1999). In
parallel, BSCs are also inhabited by nitrifying and denitrifying bacteria and
nitrogen loss through nitrification/denitrification has also been reported
(Nejidat, 2005; Johnson et al., 2005; Angel et al., 2009).
Development of a BSC is a successional process. The initial colonisers
are filamentous cyanobacteria, most commonly of the genera Phormidium,
Oscillatoria, Microcoleus and Schizothrix. These colonise the subsurface and
produce copious amounts of exopolysaccharides which coagulate soil
particles and assist in generating a uniform crust layer (Mazor et al., 1996).
They are later joined by microalgae and also by saprophytic fungi living on
the secretions and debris of the former colonisers. At the end of this stage a
physically stable crust has been formed and colonization of the surface can
begin. Typical surface colonising cyanobacteria are dark pigmented, most
commonly Nostoc and Scytonema types (Garcia-Pichel, 2002). If the crust
reaches advanced development stages, and is not disturbed, then over the
years lichens will be able to establish shifting the crust community from
cyanobacteria dominated to lichens dominated, or in more humid regions –
mosses dominated (Belnap and Eldridge, 2002).
Recovery of disturbed crusts may take years. Kidron and colleagues
measured full recovery of chlorophyll a, proteins and carbohydrates after 8
to 9 years in arid sand dunes in the eastern part of the Negev Desert, Israel,
receiving 95 mm rain per year. Recovery of mosses took far longer and
required 17-22 years (Kidron et al., 2008). This process can be speeded up,
however, by inoculating the soil with cyanobacterial cultures (Wang et al.,
2009)
1| Introduction
23
1.6 Aims of this study
Drylands span over 33% of the earth’s land surface and are expanding due
to desertification, yet they are much underrepresented in scientific research.
The soil structure and composition in drylands is distinct from that in more
humid regions. Nevertheless, as far as microbial ecology is concerned, only
few studies characterized the general microbial population in desert soils,
and no comparative study was done on the differences and similarities
between arid and temperate soils.
Extensive literature on specific parts of the microbial community in
drylands exists; it primarily focuses on cyanobacteria, algae and fungi living
in the biological soil crust. Very little is known about other prokaryotes
living in dryland soils. Moreover, much of this body of research is old and
precedes the molecular paradigm in microbial ecology and thus is largely not
comparable to present works.
Desert soils have been shown to be involved in the consumption of
atmospheric methane and also to have methanogenic potential, but extent of
these phenomena and the microorganisms which are involved in these
processes are unknown.
In this work I tried shedding some light on the microbial inhabitants
of deserts, particularly on their involvement in the turnover of the
greenhouse gas methane. Specifically, the following questions were
addressed:
Chapter 2| Biogeography of soil Archaea and Bacteria along a steep rainfall
gradient
Biogeography is a well described ecological phenomenon in plants and
animals and the forces which shape it are largely known, but as for Bacteria
and Archaea the existence of biogeography is still a debatable question.
Do Bacteria and Archaea communities follow large scale geographic gradients
of precipitation or are they only affected by local conditions on the microscopic
level?

1| Introduction
24
Chapter 3| In situ measurement of methane fluxes and analysis of
transcribed particulate methane monooxygenase in desert soils
Methane uptake by upland soils has been repeatedly measured in virtually
all aerated soils on earth, yet for dryland environments only a single study
exists. How ubiquitous is methane uptake in desert soils? Does the activity
vary with land use? Which methanotrophs are responsible for methane uptake
in dryland ecosystems?
Chapter 4| Methanogenic Archaea are globally ubiquitous in aerated soils
and become active under anoxic conditions
Methanogenesis was shown to occur in many types of aerated soils when
incubated anoxically but the identity of the methanogens is unknown. Which
methanogens are present in aerated soils? Are they different at different sites
or are there universal species?
Chapter 5| Activation of Methanogenesis in Arid Biological Soil Crusts despite
the Presence of Oxygen
The occurrence of methanogenic activity in desert crust soils under anoxic
conditions proves only a potential activity. Does methanogenesis occur in
desert crusts even when they exposed to oxygen? Is the community
composition affected by the presence of oxygen?

1| Introduction
25
1.7 References
Abed RM, Kharusi SA, Schramm A, Robinson MD. (2010). Bacterial Diversity, Pigments and Nitrogen Fixation of Biological Desert Crusts from the Sultanate of Oman. FEMS Microbiol. Ecol. 72:418-428.
Adamsen APS, King GM. (1993). Methane Consumption in Temperate and Subarctic Forest Soils: Rates, Vertical Zonation, and Responses to Water and Nitrogen. Appl. Environ. Microbiol. 59:485-490.
Alperin M, Hoehler T. (2010). The Ongoing Mystery of Sea-Floor Methane. Science 329:288-289.
Angel R, Asaf L, Ronen Z, Nejidat A. (2009). Nitrogen Transformations and Diversity of Ammonia-Oxidizing Bacteria in a Desert Ephemeral Stream Receiving Untreated Wastewater. Microb. Ecol. 59:46-58.
Atlas RM. (2010). Handbook of Microbiological Media. Taylor and Francis.
Baani M, Liesack W. (2008). Two Isozymes of Particulate Methane Monooxygenase with Different Methane Oxidation Kinetics Are Found in Methylocystis Sp. Strain SC2. Proc. Natl. Acad. Sci.. USA. 105:10203–10208.
Barth RC, Klemmedson JO. (1982). Amount and Distribution of Dry Matter, Nitrogen, and Organic Carbon in Soil-Plant Systems of Mesquite and Palo Verde. J Range. Manage. 35:412-418.
Belnap J. (2002). Factors Influencing Nitrogen Fixation and Nitrogen Release in Biological Soil Crusts. In:Biological Soil Crusts, Belnap, J and Lange, OL, eds (ed)., Springer, pp. 241-261.
Belnap J, Buedel B, Lange OL. (2002). Biological Soil Crusts: Characteristics and Distrbution. In:Biological Soil Crusts, Belnap, J and Lange, OL, eds (ed)., Springer, pp. 3-30.
Belnap J, Eldridge D. (2002). Disturbance and Recovery of Biological Soil Crusts. In:Biological Soil Crusts, Belnap, J and Lange, OL, eds (ed)., Springer, pp. 363-383.
Belnap J, Phillips SL, Smith SD. (2007). Dynamics of Cover, UV-protective Pigments, and Quantum Yield in Biological Soil Crust Communities of an Undisturbed Mojave Desert Shrubland. Flora 202:674-686.
Bender M, Conrad R. (1992). Kinetics of CH4 Oxidation in Oxic Soils Exposed to Ambient Air or High CH4 Mixing Ratios. FEMS Microbiol. Lett. 101:261-270.
Beymer RJ, Klopatek JM. (1992). Effects of Grazing on Cryptogamic Crusts in Pinyon-juniper Woodlands in Grand Canyon National Park. Am. Midl. Nat. 127:139-148.
Blake D, Rowland F. (1986). World-wide Increase in Tropospheric Methane, 1978-1983. J. Atm. Chem. 4:43-62.
Boetius A, Ravenschlag K, Schubert CJ, Rickert D, Widdel F, Gieseke A, et al. (2000). A Marine Microbial Consortium Apparently Mediating Anaerobic Oxidation of Methane. Nature 407:623-626.
Bousquet P, Ciais P, Miller JB, Dlugokencky EJ, Hauglustaine DA, Prigent C, et al. (2006). Contribution of Anthropogenic and Natural Sources to Atmospheric Methane Variability. Nature 443:439-443.
Bowker M, Reed S, Belnap J, Phillips S. (2002). Temporal Variation in Community

1| Introduction
26
Composition, Pigmentation, and Fv/Fm of Desert Cyanobacterial Soil Crusts. Microb. Ecol. 43:13-25.
Bowman J. (2006). The Methanotrophs — The Families Methylococcaceae and Methylocystaceae. In: The Prokaryotes, pp. 266-289.
Bowman JP, Sly LI, Nichols PD, Hayward AC. (1993). Revised Taxonomy of the Methanotrophs: Description of Methylobacter gen. nov., Emendation of Methylococcus, Validation of Methylosinus and Methylocystis Species, and a Proposal that the Family Methylococcaceae Includes Only the Group I Methanotrophs. Int. J. Syst. Bacteriol. 43:735-753.
Bréas O, Guillou C, Reniero F, Wada E. (2001). The Global Methane Cycle: Isotopes and Mixing Ratios, Sources and Sinks. Isotopes in Environmental and Health Studies 37:257.
Camp HJMOD, Islam T, Stott MB, Harhangi HR, Hynes A, Schouten S, et al. (2009). Environmental, Genomic and Taxonomic Perspectives on Methanotrophic Verrucomicrobia. Environ. Microbiol. Rep.
Canfield DE, Rosing MT, Bjerrum C. (2006). Early Anaerobic Metabolisms. Philos. Trans. R. Soc. Lond. ,Ser. B 361:1819 -1836.
Cappenberg TE, Prins RA. (1974). Interrelations between sulfate-reducing and methane-producing bacteria in bottom deposits of a fresh-water lake. III. Experiments with 14C-labeled substrates. Anton. van Lee. 40:457-469.
Catling DC, Zahnle KJ, McKay C. (2001). Biogenic Methane, Hydrogen Escape, and the Irreversible Oxidation of Early Earth. Science 293:839-843.
Charley J, West N. (1977). Micro-Patterns of Nitrogen Mineralization Activity in Soils of Some Shrub-Dominated Semi-Desert Ecosystems of Utah. Soil Biol. and Biochem. 9:357-365.
Charley JL, West NE. (1975). Plant-Induced Soil Chemical Patterns in Some Shrub-Dominated Semi-Desert Ecosystems of Utah. J. Ecol. 63:945-963.
Cloudsley-Thompson JL. (1988). Desertification or Sustainable Yields from Arid Environments. Environ. Conserv. 15:197-204.
Conrad R. (1999). Contribution of Hydrogen to Methane Production and Control of Hydrogen Concentrations in Methanogenic Soils and Sediments. FEMS Microbiol. Ecol. 28:193-202.
Conrad R. (1996). Soil Microorganisms as Controllers of Atmospheric Trace Gases (H2, CH, CH4, OCS, N2O, and NO). Microbiol. Rev. 60:609-640.
Conrad R. (1999). Soil Microorganisms Oxidizing Atmospheric Trace Gases (CH4, CO, H2, NO). Ind. J. Microbiol. 39:193-203.
Conrad R. (2004). Methanogenic Microbial Communities Associated with Aquatic Plants. In: Plant Surface Microbiology, Varma, A, Abbott, L, Werner, D, and Hampp, R, eds (ed)., Springer: Berlin, pp. 35-50.
Conrad R. (2005). Quantification of Methanogenic Pathways Using Stable Carbon Isotopic Signatures: A Review and a Proposal. Organic Geochemistry 36:739-752.
Conrad R, Claus P, Casper P. (2009). Characterization of Stable Isotope Fractionation During Methane Production in the Sediment of a Eutrophic Lake, Lake Dagow, Germany. Limnol. Oceanogr. 54:457-471.
1| Introduction
27
Dalton H. (2005). The Leeuwenhoek Lecture 2000 The natural and unnatural history of methane-oxidizing bacteria. Philos. Trans. R. Soc. Lond. ,Ser. B 360:1207 -1222.
Damgaard L, Revsbech N, Reichardt W. (1998). Use of an Oxygen-Insensitive Microscale Biosensor for Methane to Measure Methane Concentration Profiles in a Rice Paddy. Appl. Environ. Microbiol. 64:864-870.
Dedysh S, Liesack W, Khmelenina V, Suzina N, Trotsenko Y, Semrau J, et al. (2000). Methylocella palustris gen. nov., sp nov., a New Methane-Oxidizing Acidophilic Bacterium from Peat Bags, Representing a Novel Subtype of Serine-Pathway Methanotrophs. Int. J. Syst. Evol. Microbiol. 50:955-969.
Denman K, Brasseur G, Chidthaisong A, Clais P, Cox R, Dickinson D, et al. (2007). Couplings Between Changes in the Climate System and Biogeochemistry. In:Climate Change 2007: The Physical Science Basis. Contribution of Working Group I to the Fourth Assessment Report of the Intergovernmental Panel on Climate Change, Solomon, S, Qin, D, Manning, M, Chen, Z, Marquis, M, Averyt, K, et al., eds (ed)., Cambridge University Press: Cambridge, United Kingdom and New York, NY, USA.
Dlugokencky EJ, Masarie KA, Lang PM, Tans PP. (1998). Continuing Decline in the Growth Rate of the Atmospheric Methane Burden. Nature 393:447-450.
Dlugokencky E, Houweling S, Bruhwiler L, Masarie K, Lang P, Miller J, et al. (2003). Atmospheric Methane Levels Off: Temporary Pause or a new Steady-State? Geophys. Res. Lett.
Dregne HE. (1991). Human Activities and Soil Degradation. In: Semiarid Lands and Deserts: Soil Resource and Reclamation, Skujins, J, ed (ed)., Marcel Dekkerm INC: New York, New York, pp. 335-361.
Dunfield PF, Yuryev A, Senin P, Smirnova AV, Stott MB, Hou S, et al. (2007). Methane Oxidation by an Extremely Acidophilic Bacterium of the Phylum Verrucomicrobia. Nature 450:879-82.
Ettwig KF, Butler MK, Le Paslier D, Pelletier E, Mangenot S, Kuypers MMM, et al. (2010). Nitrite-Driven Anaerobic Methane Oxidation by Oxygenic Bacteria. Nature 464:543-548.
Evans RD, Belnap J. (1999). Long-Term Consequences of Disturbance on Nitrogen Dynamics in an Arid Ecosystem. Ecology 80:150-160.
Evans RD, Ehleringer JR. (1993). A Break in the Nitrogen Cycle in Aridlands? Evidence from d15N of Soils. Oecologia 94:314-317.
Fenchel T, Blackburn H, King G. (1998a). Aquatic Sediments. In: Bacterial Biogeochemistry, Second Edition: The Ecophysiology of Mineral Cycling, Academic Press, pp. 85-116.
Fenchel T, Blackburn H, King G. (1998b). Biogecochemical Cycling in Soils. In:Bacterial Biogeochemistry, Second Edition: The Ecophysiology of Mineral Cycling, Academic Press, pp. 85-116.
Fetzer S, Conrad R. (1993). Effect of Redox Potential on Methanogenesis by Methanosarcina Barkeri. Arch. Microbiol. 160:108-113.
Ffolliott PF, Dawson JO, Fisher JT, Moshe I, Fulbright TE, Al Musa A, et al. (2003). Dryland Environments. In: Proceedings of the IALC Conference and Workshop, Assessing Capabilities of Soil and Water Resources in Drylands: The role of Information Retrieval and Dissemination Technologies, pp. 3-18.
Forster P, Ramaswamy V, Artaxo P, Berntsen T, Betts R, Fahey D, et al. (2007). Changes
1| Introduction
28
in Atmospheric Constituents and in Radiative Forcing. In:Climate Change 2007: The Physical Science Basis. Contribution of Working Group I to the Fourth Assessment Report of the Intergovernmental Panel on Climate Change, Solomon, S, Qin, D, Manning, M, Chen, Z, Marquis, M, Averyt, K, et al., eds (ed)., Cambridge University Press: Cambridge, United Kingdom and New York, NY, USA.
Frankenberg C, Meirink JF, van Weele M, Platt U, Wagner T. (2005). Assessing Methane Emissions from Global Space-Borne Observations. Science 308:1010-1014.
Garcia-Moya E, McKell CM. (1970). Contribution of Shrubs to the Nitrogen Economy of a Desert-Wash Plant Community. Ecology 51:81-88.
Garcia-Pichel F. (2002). Desert Environments: Biological Soil Crusts. In: Encyclopedia of Environmental Microbiology 6 Volume Set, Bitton, G, ed (ed)., Wiley-Interscience.
Garcia-Pichel F, Belnap J. (1996). Microenvironments and Microscale Productivity of Cyanobacterial Desert Crusts. J. Phycol. 32:774-782.
Gattinger A, Höfle MG, Schloter M, Embacher A, Böhme F, Munch JC, et al. (2007). Traditional Cattle Manure Application Determines Abundance, Diversity and Activity of Methanogenic archaea in Arable European Soil. Environ. Microbiol. 9:612-624.
Gilbert B, Frenzel P. (1998). Rice Roots and CH4 oxidation - the Activity of Bacteria, Their Distribution and the Microenvironment. Soil Biol.Biochem. 30:1903-1916.
Gillette DA, Adams J, Endo A, Smith D, Kihl R. (1980). Threshold Velocities for Input of Soil Particles Into the Air by Desert Soils. J. Geophys. Res. 85:PP. 5621-5630.
Hanson R, Hanson T. (1996). Methanotrophic Bacteria. Microbiol. Rev. 60:439-471.
Hedderich R, Whitman WB. (2006). Physiology and Biochemistry of the Methane-Producing Archaea. In:The Prokaryotes, Dworkin, M, Falkow, S, Rosenberg, E, Schleifer, K, and Stackebrandt, E, eds (ed)., Springer New York.
Henckel T, Friedrich M, Conrad R. (1999). Molecular Analyses of the Methane-Oxidizing Microbial Community in Rice Field Soil by Targeting the Genes of the 16S rRNA, Particulate Methane Monooxygenase, and Methanol Dehydrogenase. Appl. Environ. Microbiol. 65:1980-1990.
Henckel T, Jackel U, Schnell S, Conrad R. (2000). Molecular Analyses of Novel Methanotrophic Communities in Forest Soil That Oxidize Atmospheric Methane. Appl. Environ. Microbiol. 66:1801-1808.
Hinrichs K, Hayes JM, Sylva SP, Brewer PG, DeLong EF. (1999). Methane-Consuming Archaebacteria in Marine Sediments. Nature 398:802-805.
Hippe H, Caspari D, Fiebig K, Gottschalk G. (1979). Utilization of Trimethylamine and Other N-Methyl Compounds for Growth and Methane Formation by Methanosarcina Barkeri. Proc. Natl. Acad. Sci. USA 76:494-498.
Holmes AJ, Roslev P, McDonald IR, Iversen N, Henriksen K, Murrell JC. (1999). Characterization of Methanotrophic Bacterial Populations in Soils Showing Atmospheric Methane Uptake. Appl. Environ. Microbiol. 65:3312-3318.
Horz H, Rich V, Avrahami S, Bohannan BJM. (2005). Methane-Oxidizing Bacteria in a California Upland Grassland Soil: Diversity and Response to Simulated Global Change. Appl. Environ. Microbiol. 71:2642-2652.
Houghton J. (2005). Global warming. Rep. Prog. Phys. 68:1343-1403.
Islam T, Jensen S, Reigstad LJ, Larsen Ø, Birkeland N. (2008). Methane Oxidation at
1| Introduction
29
55°c and Ph 2 by a Thermoacidophilic Bacterium Belonging to the Verrucomicrobia Phylum. Proc. Natl. Acad. Sci. USA 105:300-304.
Johnson SL, Budinoff CR, Belnap J, Garcia-Pichel F. (2005). Relevance of Ammonium Oxidation Within Biological Soil Crust Communities. Environ. Microbiol. 7:1-12.
Kassas M. (1995). Desertification: A General Review. J. Arid Environ. 30:115-128.
Kasting J. (1993). Earth's early atmosphere. Science 259:920-926.
Keppler F, Hamilton JTG, Braß M, Rockmann T. (2006). Methane Emissions from Terrestrial Plants under Aerobic Conditions. Nature 439:187-191.
Kidron GJ. (2007). Millimeter-Scale Microrelief Affecting Runoff Yield Over Microbiotic Crust in the Negev Desert. CATENA 70:266-273.
Kidron GJ, Vonshak A, Abeliovich A. (2008). Recovery Rates of Microbiotic Crusts Within a Dune Ecosystem in the Negev Desert. Geomorphology 100:444-452.
King GM, Adamsen APS. (1992). Effects of Temperature on Methane Consumption in a Forest Soil and in Pure Cultures of the Methanotroph Methylomonas rubra. Appl. Environ. Microbiol. 58:2758-2763.
Knief C, Dunfield PF. (2005). Response and Adaptation of Different Methanotrophic Bacteria to Low Methane Mixing Ratios. Environ. Microbiol. 7:1307-1317.
Knief C, Lipski A, Dunfield PF. (2003). Diversity and Activity of Methanotrophic Bacteria in Different Upland Soils. Appl. Environ. Microbiol. 69:6703-6714.
Knief C, Vanitchung S, Harvey NW, Conrad R, Dunfield PF, Chidthaisong A. (2005). Diversity of Methanotrophic Bacteria in Tropical Upland Soils under Different Land Uses. Appl. Environ. Microbiol. 71:3826-3831.
Knittel K, Boetius A. (2009). Anaerobic Oxidation of Methane: Progress with an Unknown Process. Annu. Rev. Microbiol. 63:311-334.
Kolb S. (2009). The Quest for Atmospheric Methane Oxidizers in Forest Soils. Environ. Microbiol. Rep. 1:336-346.
Kolb S, Knief C, Dunfield PF, Conrad R. (2005). Abundance and Activity of Uncultured Methanotrophic Bacteria Involved in the Consumption of Atmospheric Methane in Two Forest Soils. Environ. Microbiol. 7:1150-1161.
Lange OL, Büdel B, Meyer A, Kilian E. (1993). Further Evidence That Activation of Net Photosynthesis by Dry Cyanobacterial Lichens Requires Liquid Water. The Lichenologist 25:175-189.
Lange O. (2002). Photosynthesis of Soil-Crust Biota as Dependent on Environmental Factors. In: Biological Soil Crusts, Belnap, J and Lange, OL, eds (ed)., Springer, pp. 363-383.
Lelieveld J, Crutzen PJ, Dentener F. (1998). Changing Concentration, Lifetime and Climate Forcing of Atmospheric Methane. Tellus B 50:128-150.
Liu F, Conrad R. (2010). Thermoanaerobacteriaceae Oxidize Acetate in Methanogenic Rice Field Soil at 50°C. Environ. Microbiol. 12:2341-2354.
Liu Y, Whitman W. (2008). Metabolic, Phylogenetic, and Ecological Diversity of the Methanogenic Archaea. Annals of the New York Academy of Sciences 1125:171-189.
Loulergue L, Schilt A, Spahni R, Masson-Delmotte V, Blunier T, Lemieux B, et al. (2008). Orbital and Millennial-Scale Features of Atmospheric CH4 over the Past 800,000

1| Introduction
30
years. Nature 453:383-386.
Ludwig JA, Tongway DJ. (1995). Spatial Organisation of Landscapes and Its Function in Semi-Arid Woodlands, Australia. Landscape Ecol 10:51-63.
Lüke C. (2010). Molecular Ecology and Biogeography of Methanotrophic Bacteria in Wetland Rice Fields. Doctorate, Philipps-Universität Marburg.
Luton PE, Wayne JM, Sharp RJ, Riley PW. (2002). The mcrA Gene as an Alternative to 16S rRNA in the Phylogenetic Analysis of Methanogen Populations in Landfill. Microbiology 148:3521-3530.
Mancinelli RL. (1995). The Regulation of Methane Oxidation in Soil. Ann. Rev. Mic. 49:581-605.
Martens CS, Berner RA. (1974). Methane Production in the Interstitial Waters of Sulfate-Depleted Marine Sediments. Science 185:1167-1169.
Mazor G, Giora J. Kidron, Ahuva Vonshak, Aharon Abeliovich. (1996). The Role of Cyanobacterial Exopolysaccharides in Structuring Desert Microbial Crusts. FEMS Microbiol. Ecol. 21:121-130.
McLeod AR, Fry SC, Loake GJ, Messenger DJ, Reay DS, Smith KA, et al. (2008). Ultraviolet Radiation Drives Methane Emissions from Terrestrial Plant Pectins. New Phytologist 180:124-132.
Melack J, Hess L, Gastil M, Forsberg B, Hamilton S, Lima I, et al. (2004). Regionalization of Methane Emissions in the Amazon Basin with Microwave Remote Sensing. Global Change Biol. 10:530-544.
Menyailo OV, Hungate BA. (2003). Interactive Effects of Tree Species and Soil Moisture on Methane Consumption. Soil Biology and Biochemistry 35:625-628.
Middleton N, Thomas D. (1997). World Atlas of Desertification. 2nd ed. UNEP: London.
Murrell JC, Gilbert B, McDonald IR. (2000). Molecular Biology and Regulation of Methane Monooxygenase. Archives of Microbiology 173:325-332.
Murrell J, McDonald IR, Bourne DG. (1998). Molecular Methods for the Study of Methanotroph Ecology. FEMS Microbiology Ecology 27:103-114.
Nejidat A. (2005). Nitrification and Occurrence of Salt-Tolerant Nitrifying Bacteria in the Negev Desert Soils. FEMS Microbiol. Ecol. 52:21-29.
Neuman CM, Maxwell CD, Boulton JW. (1996). Wind Transport of Sand Surfaces Crusted with Photoautotrophic Microorganisms. CATENA 27:229-247.
Nicol GW, Glover LA, Prosser JI. (2003). Molecular Analysis of Methanogenic Archaeal Communities in Managed and Natural Upland Pasture Soils. Global Change Biol 9:1451-1457.
Nielsen AK, Gerdes K, Degn H, Murrell JC. (1996). Regulation of Bacterial Methane Oxidation: Transcription of the Soluble Methane Monooxygenase Operon of Methylococcus Capsulatus (bath) Is Repressed by Copper Ions. Microbiology - UK 142:1289-1296.
Oremland RS, Marsh LM, Polcin S. (1982). Methane Production and Simultaneous Sulphate Reduction in Anoxic, Salt Marsh Sediments. Nature 296:143-145.
Oremland R. (1988). Biogeochemistry of Methanogenic Bacteria. In:Biology of Anaerobic Microorganisms, Zehnder, AJ, ed (ed)., John Wiley and Sons, Ltd.

1| Introduction
31
Peters V, Conrad R. (1995). Methanogenic and Other Strictly Anaerobic Bacteria in Desert Soil and Other Oxic Soils. Appl. Environ. Microbiol. 61:1673-1676.
Peters V, Conrad R. (1996). Sequential Reduction Processes and Initiation of CH4 Production Upon Flooding of Oxic Upland Soils. Soil Biology and Biochemistry 28:371-382.
Pol A, Heijmans K, Harhangi HR, Tedesco D, Jetten MSM, Op den Camp HJM. (2007). Methanotrophy Below pH 1 by a New Verrucomicrobia Species. Nature 450:874-878.
Potter CS, Davidson EA, Verchot LV. (1996). Estimation of Global Biogeochemical Controls and Seasonality in Soil Methane Consumption. Chemosphere 32:2219-2246.
Radl V, Gattinger A, Chronakova A, Nemcova A, Cuhel J, Simek M, et al. (2007). Effects of Cattle Husbandry on Abundance and Activity of Methanogenic Archaea in Upland Soils. ISMEJ 1:443-452.
Rao B, Liu Y, Wang W, Hu C, Dunhai L, Lan S. (2009). Influence of Dew on Biomass and Photosystem II Activity of Cyanobacterial Crusts in the Hopq Desert, Northwest China. Soil Biology and Biochemistry 41:2387-2393.
Reay DS, Nedwell DB, McNamara N, Ineson P. (2005). Effect of Tree Species on Methane and Ammonium Oxidation Capacity in Forest Soils. Soil Biology and Biochemistry 37:719-730.
Reay DS, Radajewski S, Murrell JC, McNamara N, Nedwell DB. (2001). Effects of Land-Use on the Activity and Diversity of Methane Oxidizing Bacteria in Forest Soils. Soil Biology and Biochemistry 33:1613-1623.
Reeburgh WS. (1976). Methane Consumption in Cariaco Trench Waters and Sediments. Earth Planet. Sci. Lett. 28:337-344.
Reeburgh W. (2006). Global Methane Biogeochemistry. In:The Atmosphere: Treatise on Geochemistry, Volume 4, Keeling, RK, ed (ed)., Elsevier.
Reeburgh WS. (2007). Oceanic Methane Biogeochemistry. Chem. Rev. 107:486-513.
Ricke P, Erkel C, Kube M, Reinhardt R, Liesack W. (2004). Comparative Analysis of the Conventional and Novel pmo (particulate Methane Monooxygenase) Operons from methylocystis Strain SC2. Appl. Environ. Microbiol. 70:3055-3063.
Rigby M, Prinn RG, Fraser PJ, Simmonds PG, Langenfelds RL, Huang J, et al. (2008). Renewed Growth of Atmospheric Methane. Geophys. Res. Lett. 35:6 PP.
Schlesinger WH, Reynolds JF, Cunningham GL, Huenneke LF, Jarrell WM, Virginia RA, et al. (1990). Biological Feedbacks in Global Desertification. Science 247:1043-1048.
Schönheit P, Keweloh H, Thauer RK. (1981). Factor F420 degradation in Methanobacteriu hermoautotrophicum during exposure to oxygen. FEMS Microbiol. Lett. 12:347-349.
Semrau JD, DiSpirito AA, Yoon S. (2010). Methanotrophs and Copper. FEMS Micr. Rev. 34:496-531.
Shima S, Thauer RK. (2005). Methyl-coenzyme M reductase and the anaerobic oxidation of methane in methanotrophic Archaea. Curr. Opin. Microbiol. 8:643-648.
Shindell DT, Faluvegi G, Koch DM, Schmidt GA, Unger N, Bauer SE. (2009). Improved Attribution of Climate Forcing to Emissions. Science 326:716-718.
Siriwongrungson V, Zeny R, Angelidaki I. (2007). Homoacetogenesis as the alternative pathway for H2 sink during thermophilic anaerobic degradation of butyrate under suppressed methanogenesis. Water Res. 41:4204-4210.

1| Introduction
32
Skujins J. (1984). Microbial Ecology of Desert Soils. Adv Microb Ecol. 7:49-91.
Smith KA, Dobbie KE, Ball BC, Bakken LR, Sitaula BK, Hansen S, et al. (2000). Oxidation of Atmospheric Methane in Northern European Soils, Comparison with Other Ecosystems, and Uncertainties in the Global Terrestrial Sink. Global Change Biol. 6:791-803.
Sombroek WG. (1987). Aridisols of the World, Occurence and Potential. In: Lubbock, Texas.
Spahni R, Chappellaz J, Stocker TF, Loulergue L, Hausammann G, Kawamura K, et al. (2005). Atmospheric Methane and Nitrous Oxide of the Late Pleistocene from Antarctic Ice Cores. Science 310:1317-1321.
Stams AJM, Plugge CM. (2009). Electron Transfer in Syntrophic Communities of Anaerobic Bacteria and Archaea. Nat. Rev. Micro. 7:568-577.
Stanley SH, Prior SD, Leak DJ, Dalton H. (1983). Copper Stress Underlies the Fundamental Change in Intracellular Location of Methane Mono-Oxygenase in Methane-Oxidizing Organisms: Studies in Batch and Continuous Cultures. Biotechnol. Lett. 5:487-492.
Storz G, Tartaglia L, Farr S, Ames B. (1990). Bacterial Defenses Against Oxidative Stress. Trends Genet. 6:363-368.
Striegl RG, McConnaughey TA, Thorstenson DC, Weeks EP, Woodward JC. (1992). Consumption of Atmospheric Methane by Desert Soils. Nature 357:145-147.
Tate K, Ross D, Saggar S, Hedley C, Dando J, Singh B, et al. (2007). Methane Uptake in Soils from Pinus Radiata Plantations, a Reverting Shrubland and Adjacent Pastures: Effects of Land-Use Change, and Soil Texture, Water and Mineral Nitrogen. Soil Biol. Biochem. 39:1437-1449.
Teh YA, Silver WL, Conrad ME. (2005). Oxygen Effects on Methane Production and Oxidation in Humid Tropical Forest Soils. Global Change Biol. 11:1283-1297.
Thauer RK. (1998). Biochemistry of Methanogenesis: A Tribute to Marjory Stephenson:1998 Marjory Stephenson Prize Lecture. Microbiology 144:2377-2406.
Thauer RK, Kaster A, Seedorf H, Buckel W, Hedderich R. (2008). Methanogenic Archaea: Ecologically Relevant Differences in Energy Conservation. Nat. Rev. Micro. 6:579-591.
Thomas DSG, Knight M, Wiggs GFS. (2005). Remobilization of southern African desert dune systems by twenty-first century global warming. Nature 435:1218-1221.
Trotsenko YA, Murrell JC. (2008). Metabolic Aspects of Aerobic Obligate Methanotrophy[small star, filled]. In:Advances in Applied Microbiology, Allen I. Laskin, SSAGMG, ed (ed). Vol. Volume 63, Academic Press, pp. 183-229.
UNCCD. (2009). Round table 1: The global trends of desertification, land degradation and drought - liaison with other problems and challenges for decision makers and stakeholders. In:Report of the Conference of the Parties on its ninth session, held in Buenos Aires from 21 September to 2 October 2009, Buenos Aires.
Verstraete MM, Schwartz SA. (1991). Desertification and Global Change. Vegetatio 91:3-13.
Virginia RA, Jarrell WM. (1983). Soil Properties in a Mesquite-Dominated Sonoran Desert Ecosystem1. Soil Sci. Soc. Am. J. 47:138-144.

1| Introduction
33
Wang JS, Logan JA, McElroy MB, Duncan BN, Megretskaia IA, Yantosca RM. (2004). A 3-D Model Analysis of the Slowdown and Interannual Variability in the Methane Growth Rate from 1988 to 1997. Global Biogeochem. Cycles.
Wang W, Liu Y, Li D, Hu C, Rao B. (2009). Feasibility of Cyanobacterial Inoculation for Biological Soil Crusts Formation in Desert Area. Soil Biol. Biochem. 41:926-929.
West A, Schmidt S. (2002). Endogenous Methanogenesis Stimulates Oxidation of Atmospheric CH4 in Alpine Tundra Soil. Microb. Ecol. 43:408-415.
Whitford WG. (2002). Ecology of Desert System. Academic Press: San Diego.
Whitford WG, Anderson J, Rice PM. (1997). Stemflow Contribution to the [`]fertile Island' Effect in Creosotebush,larrea Tridentata. J. Arid Environ. 35:451-457.
Whitman WB, Bowen T, Boone D. (2006). The Methanogenic Bacteria. In: The Prokaryotes, Dworkin, M, Falkow, S, Rosenberg, E, Schleifer, K, and Stackebrandt, E, eds (ed)., Springer New York.
Whittenbury R, Phillips KC, Wilkinson JF. (1970). Enrichment, Isolation and Some Properties of Methane-utilizing Bacteria. J. Gen. Microbiol. 61:205-218.
Woese CR, Fox GE. (1977). Phylogenetic Structure of the Prokaryotic Domain: The Primary Kingdoms. Proc. Natl. Acad. Sci. USA 74:5088-5090.
Worthy D, Chan E, Ishizawa M, Chan D, Poss C, Dlugokencky E, et al. (2009). Decreasing anthropogenic methane emissions in Europe and Siberia inferred from continuous carbon dioxide and methane observations at Alert, Canada. J. Geophys. Res.-Atm.
Yao H, Conrad R, Wassmann R, Neue HU. (1999). Effect of Soil Characteristics on Sequential Reduction and Methane Production in Sixteen Rice Paddy Soils from China, the Philippines, and Italy. Biogeochemistry 47:269-295.
Yavitt JB, Downey DM, Lang GE, Sexston AJ. (1990). Methane Consumption in Two Temperate Forest Soils. Biogeochemistry 9:39-52.
Yimga M, Dunfield P, Ricke P, Heyer H, Liesack W. (2003). Wide Distribution of a Novel pmoA-Like Gene Copy Among Type Ii Methanotrophs, and Its Expression in methylocystis Strain SC2. Appl. Environ. Microbiol. 69:5593-5602.
Yu K, Bohme F, Rinklebe J, Neue HU, DeLaune RD. (2007). Major Biogeochemical Processes in Soils-a Microcosm Incubation from Reducing to Oxidizing Conditions. Soil Sci. Soc. Am. J. 71:1406.
Zehnder AJ, Brock TD. (1980). Anaerobic Methane Oxidation: Occurrence and Ecology. Appl. Environ. Microbiol. 39:194-204.
Zehnder AJ, Brock TD. (1979). Methane formation and methane oxidation by methanogenic bacteria. J. Bacteriol. 137:420-432.
Zehnder A, Stumm W. (1988). Geochemistry and Biogeochemistry of Anaerobic Habitats. In:Biology of Anaerobic Microorganisms, Zehnder, A, ed (ed)., Wiley: New York, pp. 1-38.
Zinder S. (1993). Physiological Ecology of Methanogens. In:Methanogenesis. Ecology, Physiology, Biochemistry and Genetics, Chapman and Hall: New York, pp. 128-206.

1| Introduction
34
35
Chapter 2| Biogeography of Soil Archaea and Bacteria along a Steep Precipitation Gradient
Roey Angel1, M. Ines M. Soares2, Eugene D. Ungar3 and Osnat Gillor2
Published in The ISME Journal (2010) 4, 553-556.6
1 Max-Planck-Institute for Terrestrial Microbiology, Karl-von-Frisch-Strasse 10,
Marburg, D-35043, Germany
2 Zuckerberg Institute for Water Research, J. Blaustein Institutes for Desert Research,
Ben-Gurion University, Sede Boqer Campus 84990, Israel
3 Department of Agronomy and Natural Resources, Institute of Plant Sciences,
Agricultural Research Organization, The Volcani Center, Bet Dagan 50250, Israel
Contributions:
RA, OG and MIMS designed the study; RA, OG and EDU designed the sampling
scheme and performed the sampling; RA performed all lab experiments, design of
Matlab codes and data analyses; RA, MIMS and OG wrote the manuscript.

2| Biogeography of soil archaea and bacteria
36
2.1 Abstract
For centuries, biodiversity has spellbound biologists focusing mainly on
macroorganism’s diversity and almost neglecting the geographic mediated
dynamics of microbial communities. We surveyed the diversity of soil
Bacteria and Archaea along a steep precipitation gradient ranging from the
Negev Desert in the south of Israel (<100 mm annual rain) to the
Mediterranean forests in the north (>900 mm annual rain). Soil samples
were retrieved from triplicate plots at five long-term ecological research
stations, collected from two types of patches: plant interspaces and
underneath the predominant perennial at each site. The molecular
fingerprint of each soil sample was taken using terminal restriction length
polymorphism of the 16S rRNA gene to evaluate the bacterial and archaeal
community composition and diversity within and across sites.
The difference in community compositions was not statistically significant
within sites (P = 0.33 and 0.77 for Bacteria and Archaea, respectively), but it
differed profoundly by ecosystem type. These differences could largely be
explained by the precipitation gradient combined with the vegetation cover:
the archaeal and bacterial operational taxonomic units were unique to each
climatic region, that is, arid, semiarid and Mediterranean (P = 0.0001 for
both domains), as well as patch type (P = 0.009 and 0.02 for Bacteria and
Archaea, respectively). Our results suggest that unlike macroorganisms that
are more diverse in the Mediterranean ecosystems compared with the desert
sites, archaeal and bacterial diversities are not constrained by precipitation.
However, the community composition is unique to the climate and
vegetation cover that delineates each ecosystem.
2| Biogeography of soil archaea and bacteria
37
2.2 Introduction
For centuries, ecologists have observed the profound differences between dry
and temperate regions with respect to vegetation cover and animal
abundance. Studies on how communities respond to precipitation gradients
led to the search for diversity patterns across a wide variety of taxonomic
groups, including annuals, trees, mammals, birds, reptiles and insects
(Hawkins et al., 2003). Emerging patterns showed a general increase in the
diversity of plants and animals with an increase in available water. The bulk
of these studies established an ecological paradigm claiming that an
increase in water availability is followed by elevated diversity and abundance
of biological communities.
Although patterns of variation in species richness along precipitation
gradients have been studied extensively, much less is known about the
manner in which, and the extent to which, precipitation interacts with
landscape diversity in determining patterns of species richness (van
Rensburg et al., 2002; Gardezi and Gonzalez, 2008). On a local scale,
studies of community and landscape ecology of both macro- and
microorganisms have indicated a relationship between species richness,
internal structure of the habitat and landscape heterogeneity as the main
controllers of biodiversity. In water-limited environments, one of the most
widely accepted theories is the ‘fertility’ or ‘resource island’ hypothesis,
which states that shrubs create heterogeneity in soils by localizing soil
fertility under their canopies (Schlesinger et al., 1996). Indeed, heterotrophic
Bacteria (Herman et al., 1995) and protozoa (Robinson et al., 2002) have
been found to be more abundant under shrubs than in their interspaces.
The links between microbial biogeography, local diversity of microorganisms
and the factors that shape them represent largely unexplored territory. Here,
we integrated a study of local-scale microbial diversity in bare soil and under
a plant canopy with that of distinct climatic regions.
In the last three decades, microbial ecologists have experienced a
quantum leap in the study of microbial ecosystems independent of their
ability to culture the resident species. Microbiologists have gone to remote
corners of the earth to analyze the microbial inhabitants of every
2| Biogeography of soil archaea and bacteria
38
environment. Of the microbial groups that are abundant in the soil, Bacteria
have been the most extensively studied. Nevertheless, our understanding of
the spatial distribution patterns of bacterial diversity is limited, mainly
because most studies are limited to local scales (Navarro-Gonzalez et al.,
2003; Zhou et al., 2004). Recent large-scale surveys have revealed that
different ecosystems support unique microbial populations (Zhou et al.,
2002; Fierer and Jackson, 2006; Green and Bohannan, 2006; Vishniac,
2006; Adler and Levine, 2007), giving rise to the notion that microbial
populations can exhibit geographic distribution. These emerging microbial
distribution patterns suggest that the ecological rules followed by
macroorganisms do not necessarily apply to microorganisms (Fierer and
Jackson, 2006; Green and Bohannan, 2006; Bryant et al., 2008).
The majority of microbial biogeography studies have focused on the
bacterial domain (Fierer, 2008). However, members of the Archaea domain,
once thought to be present only in extreme environments, have been found
to be significant or even major components in mundane habitats such as
ocean waters, freshwater sediments and soils (Kent and Triplett, 2002;
Chaban et al., 2006). Archaeal diversity has been relatively well documented
in rice paddy soils (Grosskopf et al., 1998) and peat bogs (Hoj et al., 2008),
and has also been reported in temperate, tropical and agricultural soils
(Kent and Triplett, 2002). Those studies were confined mainly to local scales,
but a handful of researchers have examined biodiversity patterns of Archaea
along spatial or temporal gradients (Ochsenreiter et al., 2003; Nemergut et
al., 2005; Walsh et al., 2005; Oline et al., 2006; Hansel et al., 2008). In this
study, we compare and contrast the diversity patterns of soil Archaea with
those of Bacteria. We explored the diversity of these domains on local and
regional scales, addressing their richness and community composition. A
prudent hypothesis would be that each domain is characterized by distinct
patterns of diversity, with Archaea having a unique distribution pattern, as
they occupy specific soil niches, whereas Bacteria are more widely
distributed and thus are subjected to biogeographical patterns. Alternatively,
niche occupation and abundance of Archaea in the soil might not be a
determinant, in which case the forces structuring biodiversity across the
precipitation gradient would be the same for both domains, resulting in
2| Biogeography of soil archaea and bacteria
39
similar phylogenetic biogeographical patterns. To test these hypotheses, we
adopted an approach that examines local and regional relationships with
respect to microbial biodiversity.
As mentioned above, traditional precipitation diversity studies relied
heavily on the sampling and identification of large number of plant and
animal species, and were focused on how patterns of richness, abundance
and phenotype change with water availability. As culturing techniques are
currently limited for most Bacteria and Archaea, microbial ecologists use
molecular techniques that are dependent on the universal marker gene
encoding for the 16S rRNA to document microbial presence at every level,
from division to strain. However, comprehensive sequencing of the 16S rRNA
gene in soil samples is both labour-intensive and expensive. Consequently,
true replication and statistical characterization of microbial diversity in an
environment, performed as demanded by plant ecologists, for instance, are
rarely achieved. In this study, we addressed questions of local- and regional-
scale distribution and diversity patterns by using a multiscale nested
sampling approach. Five long-term ecological research (LTER) sites ranging
from the Negev Desert in the south of Israel (with less than 100 mm annual
rain) to the Mediterranean forests in the north (with over 900 mm annual
rain) were examined and the diversity patterns of their soil Bacteria and
Archaea were elucidated. Our nested sampling scheme consisted of the
following: (i) triplicates of approximately 1000 m2 plots in each site; (ii) two
patches in each plot, one under the canopy of the predominant perennial
(woody patch) and one in the perennial interspace (open patch) and (iii) a
composite of eight soil samples taken from each patch type, at each plot.
This scheme enabled us to compare patches within each plot, plots within
each site and the different sites, answering, at least in part, the
requirements for a comprehensive ecological survey.

2| Biogeography of soil archaea and bacteria
40
2.3 Results
We surveyed the diversity of soil Bacteria and Archaea along a steep
precipitation gradient ranging from an arid area with less than 100 mm
annual rain to a meso-Mediterranean forest receiving over 900 mm
precipitation (Table 2.1 and Supplementary Figure 2.1). Thirty soil
samples (each a composite of eight samples) were retrieved from five LTER
stations, collected from open and woody patches at each site. Using TRFLP
analysis of the 16S rRNA-encoding gene, the molecular fingerprint of each
soil sample was taken to evaluate the diversity and composition of the
microbial community within and across sites. Here, we present the patterns
obtained when the bacterial and archaeal small subunit rRNA gene
amplicons were digested with a single enzyme (TaqI for Bacteria and MseI for
Archaea). Analyses of the 16S rRNA gene fragments digested with the
additional enzymes used in this study (see Experimental procedure) are
presented in Supplementary Figure 2.2.
Bacterial and archaeal community distribution
To observe the differences in the overall distribution patterns of both the
bacterial and archaeal communities in each sample, the rank and relative
abundance of the TRFs were calculated and plotted (Figure 2.1). A
Kolmogorov–Smirnov test was performed on all possible sample pairs
(separately for each domain) to test whether they are derived from the same
distribution. The test showed that in 83.7% and 85.5% of the cases, for
Bacteria and Archaea, respectively, any two random samples were drawn
from the same distribution at a 0.05 confidence level. Moreover, for both
domains, only two samples showed distinctly different distributions from the
rest of the samples (Supplementary Table 2.1).
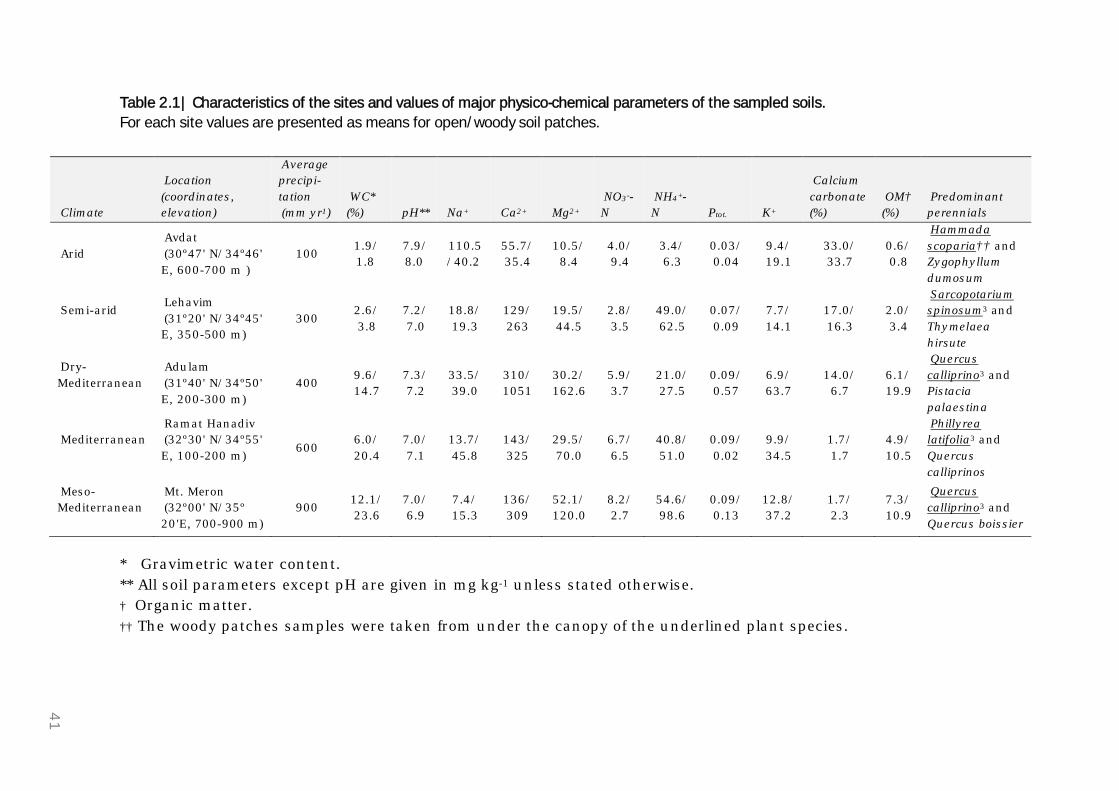
Table 2.1| Characteristics of the sites and values of major physico-chemical parameters of the sampled soils.
For each site values are presented as means for open/woody soil patches.
* Gravimetric water content.
** All soil parameters except pH are given in mg kg-1 unless stated otherwise.
† Organic matter.
†† The woody patches samples were taken from under the canopy of the underlined plant species.
Climate
Location
(coordinates,
elevation)
Average
precipi-
tation
(mm yr1)
WC*
(%) pH** Na+ Ca2+ Mg2+
NO3--
N
NH4+-
N Ptot. K+
Calcium
carbonate
(%)
OM†
(%)
Predominant
perennials
Arid
Avdat
(30º47' N/34º46'
E, 600-700 m )
100 1.9/
1.8
7.9/
8.0
110.5
/40.2
55.7/
35.4
10.5/
8.4
4.0/
9.4
3.4/
6.3
0.03/
0.04
9.4/
19.1
33.0/
33.7
0.6/
0.8
Hammada
scoparia†† and
Zygophyllum
dumosum
Semi-arid
Lehavim
(31º20' N/34º45'
E, 350-500 m)
300 2.6/
3.8
7.2/
7.0
18.8/
19.3
129/
263
19.5/
44.5
2.8/
3.5
49.0/
62.5
0.07/
0.09
7.7/
14.1
17.0/
16.3
2.0/
3.4
Sarcopotarium
spinosum3 and
Thymelaea
hirsute
Dry-
Mediterranean
Adulam
(31º40' N/34º50'
E, 200-300 m)
400 9.6/
14.7
7.3/
7.2
33.5/
39.0
310/
1051
30.2/
162.6
5.9/
3.7
21.0/
27.5
0.09/
0.57
6.9/
63.7
14.0/
6.7
6.1/
19.9
Quercus
calliprino3 and
Pistacia
palaestina
Mediterranean
Ramat Hanadiv
(32º30' N/34º55'
E, 100-200 m)
600 6.0/
20.4
7.0/
7.1
13.7/
45.8
143/
325
29.5/
70.0
6.7/
6.5
40.8/
51.0
0.09/
0.02
9.9/
34.5
1.7/
1.7
4.9/
10.5
Phillyrea
latifolia3 and
Quercus
calliprinos
Meso-
Mediterranean
Mt. Meron
(32º00' N/35º
20'E, 700-900 m)
900 12.1/
23.6
7.0/
6.9
7.4/
15.3
136/
309
52.1/
120.0
8.2/
2.7
54.6/
98.6
0.09/
0.13
12.8/
37.2
1.7/
2.3
7.3/
10.9
Quercus
calliprino3 and
Quercus boissier
41
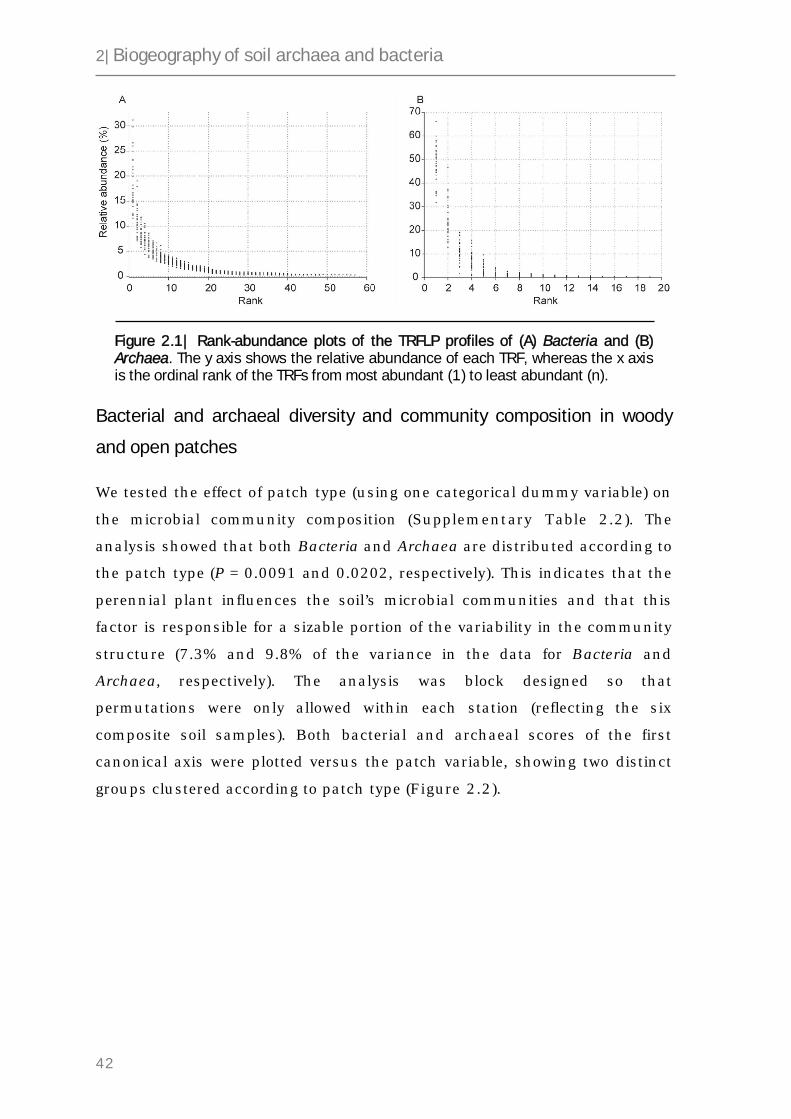
2| Biogeography of soil archaea and bacteria
42
Figure 2.1| Rank-abundance plots of the TRFLP profiles of (A) Bacteria and (B) Archaea. The y axis shows the relative abundance of each TRF, whereas the x axis is the ordinal rank of the TRFs from most abundant (1) to least abundant (n).
Bacterial and archaeal diversity and community composition in woody
and open patches
We tested the effect of patch type (using one categorical dummy variable) on
the microbial community composition (Supplementary Table 2.2). The
analysis showed that both Bacteria and Archaea are distributed according to
the patch type (P = 0.0091 and 0.0202, respectively). This indicates that the
perennial plant influences the soil’s microbial communities and that this
factor is responsible for a sizable portion of the variability in the community
structure (7.3% and 9.8% of the variance in the data for Bacteria and
Archaea, respectively). The analysis was block designed so that
permutations were only allowed within each station (reflecting the six
composite soil samples). Both bacterial and archaeal scores of the first
canonical axis were plotted versus the patch variable, showing two distinct
groups clustered according to patch type (Figure 2.2).
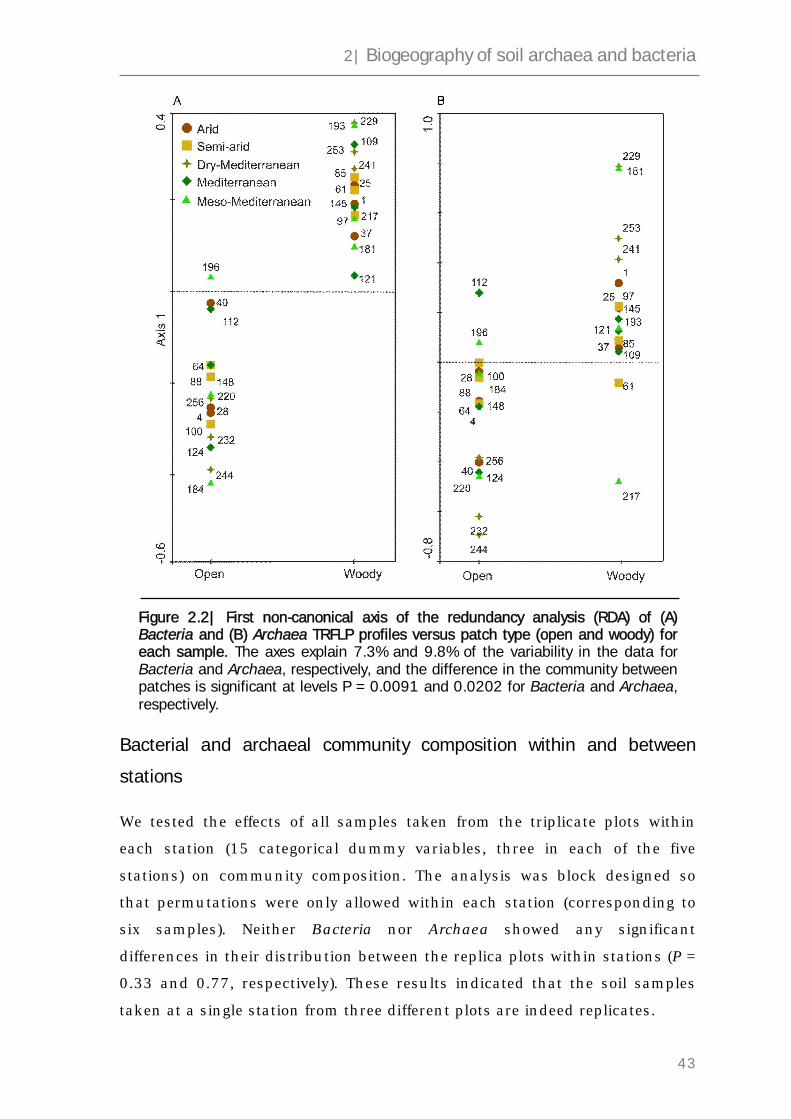
2| Biogeography of soil archaea and bacteria
43
Figure 2.2| First non-canonical axis of the redundancy analysis (RDA) of (A) Bacteria and (B) Archaea TRFLP profiles versus patch type (open and woody) for each sample. The axes explain 7.3% and 9.8% of the variability in the data for Bacteria and Archaea, respectively, and the difference in the community between patches is significant at levels P = 0.0091 and 0.0202 for Bacteria and Archaea, respectively.
Bacterial and archaeal community composition within and between
stations
We tested the effects of all samples taken from the triplicate plots within
each station (15 categorical dummy variables, three in each of the five
stations) on community composition. The analysis was block designed so
that permutations were only allowed within each station (corresponding to
six samples). Neither Bacteria nor Archaea showed any significant
differences in their distribution between the replica plots within stations (P =
0.33 and 0.77, respectively). These results indicated that the soil samples
taken at a single station from three different plots are indeed replicates.
2| Biogeography of soil archaea and bacteria
44
Our next step was to test the effect of stations (five categorical dummy
variables) on community composition. The analysis was performed with
unrestricted permutations between the stations. The community
compositions of both Bacteria and Archaea were significantly different
between different stations (P = 0.0001, R2 = 0.174 and P = 0.0001, R2 =
0.386, respectively), suggesting that the community composition is
biogeographically structured. Bacterial and archaeal diversity across the
precipitation gradient Figure 2.3 reflects the results of two-way cluster
analysis of the samples (rows) and TRFs (columns). The consensus profiles
of both Bacteria and Archaea were used in this cluster analysis,
corresponding to the TRFs generated by two of the restriction enzymes used
in this study (see Experimental procedure): TaqI for 16S rRNA fragments
amplified with the bacterial primers (Figure 2.3A) and MseI for fragments
amplified using the archaeal primers (Figure 2.3B). Each individual square
in the central coloured matrix represents the relative abundance (indicated
by colour) of a single TRF. The top right Scree plot represents the distance
between each of the two levels of clustering versus cluster number.
Analyses of both Bacteria and Archaea showed a clear clustering of
the arid soil samples (marked dark brown) and, to a lesser extent, of the
semiarid samples (marked light brown). Interestingly, the three
Mediterranean stations (marked bronze green, dark green and light green)
did not cluster: the bacterial heat map showed two major clusters at both
ends, whereas the archaeal TRFs amplified from the Mediterranean soil
samples clustered together.
Heat maps were constructed on the basis of the bacterial and archaeal
16S rRNA-encoding gene-amplified fragments digested with HhaI,
HpyCH4IV, TaqI and MboI (Supplementary Figure 2.2). The bacterial TRFs
(Supplementary Figures 2.2A and B) followed the pattern described above,
unlike the archaeal TRFs (Supplementary Figures 2.2C and D) that
clustered into dissimilar patterns.
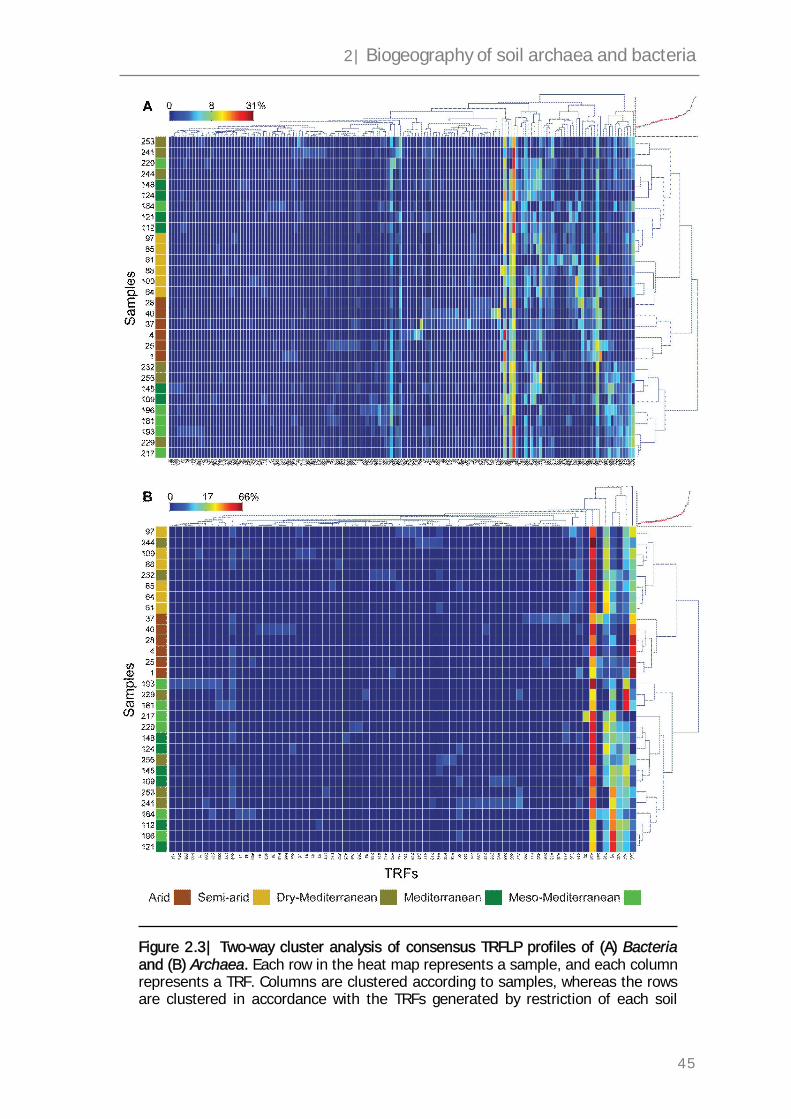
2| Biogeography of soil archaea and bacteria
45
Figure 2.3| Two-way cluster analysis of consensus TRFLP profiles of (A) Bacteria and (B) Archaea. Each row in the heat map represents a sample, and each column represents a TRF. Columns are clustered according to samples, whereas the rows are clustered in accordance with the TRFs generated by restriction of each soil

2| Biogeography of soil archaea and bacteria
46
sample’s amplified 16S rRNA fragment using the restriction enzymes TaqI for Bacteria (A) and MseI for Archaea (B). The colour-coded column to the left of the heat map corresponds to the origin of each sample (see legend at the bottom for colour coding). Heat map colours represent the relative abundance of the TRFs. Clustering was performed on a Euclidean distance matrix of the standardized and transformed TRFLP profiles (see Experimental procedure). Scree plots (top right of each map) show the distance between each of the two hierarchical clusters versus cluster number.
Relationship between abiotic factors and bacterial and archaeal
communities
Eleven physicochemical factors were measured in the soil samples used for
the analyses of Bacteria and Archaea community composition (Table 2.1).
The standardized values of these parameters were correlated to the bacterial
and archaeal TRF scores using a partial RDA model.
In a forward selection method, only water content, organic carbon and
calcium carbonate correlated significantly with the community profiles of
both domains (P = 0.0001). In addition, the bacterial distribution correlated
to Mg2+ and nitrate (P = 0.0051 and 0.0152, respectively). All the above
parameters (except Mg2+ for the Bacteria domain) were also found to be
significant in a model that excluded the effect of the sites (i.e., allowing
permutation testing only within sites). The analysis results indicated that
the effect of these parameters is evident not only at a regional, but also at a
local scale (data not shown). However, although showing significant
correlations, all the above-mentioned parameters were also strongly auto-
correlated (data not sown), making it difficult to determine which is the
driving force of microbial soil diversity in this setting. Of these parameters,
water content was found to have the strongest fit to the bacterial and
archaeal community structures. Figure 2.4 shows how the communities of
both domains are positioned along the water-content concentration axis. The
Bacteria and Archaea communities amplified from arid environment soil
samples clustered at the low end of the soil water content, whereas the
Mediterranean communities clustered along the higher end. Much like in the
cluster analysis (Figure 2.3), the community compositions of Bacteria and
Archaea did not strictly follow the water-content gradient, but rather formed
three separate clusters of arid, semiarid and Mediterranean communities
(Supplementary Figure 2.3).
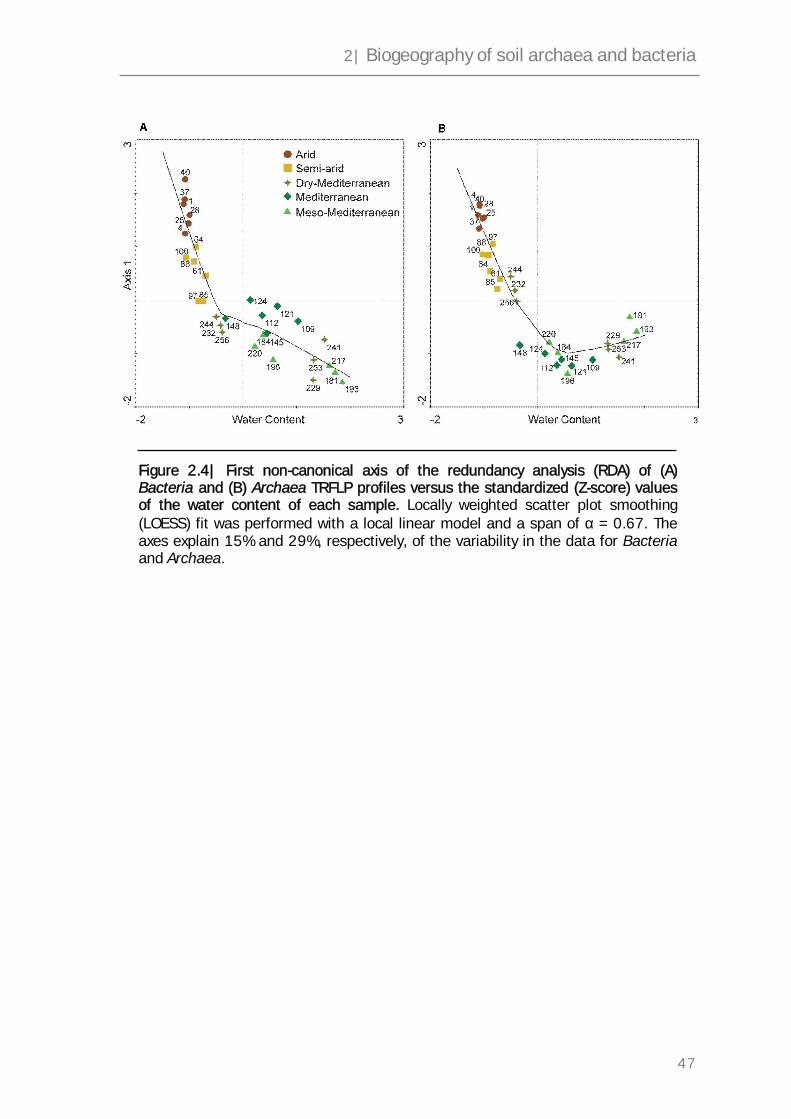
2| Biogeography of soil archaea and bacteria
47
Figure 2.4| First non-canonical axis of the redundancy analysis (RDA) of (A) Bacteria and (B) Archaea TRFLP profiles versus the standardized (Z-score) values of the water content of each sample. Locally weighted scatter plot smoothing (LOESS) fit was performed with a local linear model and a span of α = 0.67. The axes explain 15% and 29%, respectively, of the variability in the data for Bacteria and Archaea.

2| Biogeography of soil archaea and bacteria
48
2.4 Discussion
A major goal in biogeography and ecology is to understand the causes of
taxonomic diversity gradients. Such gradients occur on spatial scales
ranging from a few centimetres (Carson et al., 2009) to thousands of
kilometres (Fierer and Jackson, 2006). For microorganisms, research has
primarily focused on local scales (Fierer, 2008); however, the drivers of
diversity and their relative influence may differ with scale, and
understanding diversity gradients may require analyses of their variation
relative to various spatial scales. To the best of our knowledge, this study is
the first to link local and regional scales of bacterial and archaeal
community diversities. We tested both domains within each of the five LTER
sites, using a scheme that enabled us to examine a triplicate composite of
eight soil samples in each patch at each site; this procedure ensured that
the samples reflect the entire plot. Statistical analysis of bacterial and
archaeal fingerprints in this sampling scheme revealed that the differences
in diversity within sites are not statistically significant, unlike the diversity
between sites across the precipitation gradient. This encompasses our most
surprising result, that is, the spatial patterns of OTU diversity for Archaea
and Bacteria are very similar in structure, despite the profound biological
differences between these two domains.
Fingerprinting methods, such as TRFLP, are robust and can be applied to
a large number of samples; however, the TRFLP technique entails two major
drawbacks. The first is inherent to all known fingerprinting techniques and
concerns their detection limit; abundant species are well represented,
whereas the rare species remain unseen. Consequently, the majority of
species in a highly diversified environment, such as soil remains undetected
and hence taxa–area relationships within microbial communities are difficult
to decipher (Curtis et al., 2006; Woodcock et al., 2006). However, theoretical
modelling has indicated that if significant shifts in microbial community are
spatially correlated, as shown in this report, then the models will yield closer
estimates reflecting the ‘true’ taxa–area relationship (Woodcock et al., 2006).
The other drawback concerns the choice of enzymes for restricting the
amplified 16S rRNA fragment, which strongly influences the observed TRFs
2| Biogeography of soil archaea and bacteria
49
and thus the emerging diversity patterns (Schutte et al., 2008). Although the
enzymes used in our study were chosen in accordance with in silico analysis
of the RDP database (see Experimental procedure), the outcome varied
between the two domains: archaeal and bacterial TRFs were each analyzed
using three distinct restriction enzymes, however, in contrast to Bacteria,
archaeal TRF clusters of the enzymes TaqI and MboI did not follow the same
biogeographical structure across the precipitation gradient (compare Figure
2.3b with Supplementary Figures 2.1c and d). This observation could be
attributed to the choice of the restriction enzymes.
Both domains followed similar biogeographical patterns (Figure 2.2),
their diversity apparently unrelated to variables that typically govern plant
and animal diversity. Diversity gradients of macroorganisms have been
described on different scales in relation to latitude, climate, productivity and
temperature, documenting the generality of the latitudinal diversity gradient,
with stronger and steeper diversity gradients on regional as opposed to local
scales (Hawkins et al., 2003). Those studies have shown a positive
relationship between annual precipitation (an index of productivity in arid
regions), species richness and phylogenetic composition. For instance, in
grasslands, the number of species per square meter was shown to increase
by one with each 100 mm increase in precipitation (Cornwell and Grubb,
2003; Adler and Levine, 2007); the diversity and community organization of
North American ants (Keil et al., 2008) and rodents (Bowers et al., 1987)
were shown to be tightly correlated to annual precipitation, and a survey
across Western Europe and Northern Africa showed that water availability
limits the richness of Odonata (dragonfly) species (Keil et al., 2008). In
contrast to macroorganisms, our results showed similar diversity and
richness of the soil bacterial and archaeal communities across sites,
whereas the taxonomic composition differed by ecosystem type. The species
abundance distribution of the 30 soil samples showed a similar pattern for
bacterial and archaeal communities: domination of a few of the more
abundant OTUs, whereas most of the OTUs are relatively rare, exemplifying
the classic ‘long tail’ phenomenon (Fuhrman, 2009).
The microbial communities in the arid, semiarid and Mediterranean sites
were significantly different (P = 0.0001), whereas the microbial communities

2| Biogeography of soil archaea and bacteria
50
within the Mediterranean sites (although the annual precipitation differed
markedly, at 400, 500 and 900 mm per year) shared key characteristics,
with no significant differences among them (P = 0.079 and 0.244 for Bacteria
and Archaea, respectively). The clustering of the microbial communities
according to the ecosystem (arid, semiarid and Mediterranean) rather than
strictly according to the precipitation gradient could be largely explained by
a combination of precipitation, as reflected by the soil water content (Figure
2.4) and vegetation cover as reflected by the soil organic matter content
(Table 2.1). It has been suggested that microbial biogeographical patterns
are shaped by environmental factors (Fierer, 2008). For instance, pH has
been found to be the best predictor of the continent-scale patterns exhibited
by soil Bacteria (Fierer and Jackson, 2006). Diversity of Antarctic soil
Bacteria changed along a temperature gradient, yet was comparable in
locations with dense vegetation cover (Yergeau et al., 2007), and the diversity
of soil microbial community assemblages in the Chihuahuan Desert followed
the precipitation patterns (Clark et al., 2009). In this study, numerous
factors were measured for each of the 30 soil samples (Table 2.1) including
pH, salinity, calcium carbonate and nutrients (e.g. phosphorus, nitrogen,
carbon, magnesium and potassium), yet the distribution pattern of both
Bacteria and Archaea correlated mainly with soil water content (Figure 2.4),
organic matter that is stored in the soil and calcium carbonate. We suggest
that precipitation and vegetation cover are the major factors shaping the
structure of the soil microbial community in the arid, semiarid and
Mediterranean sites. Indeed, patch types were found to vary in both
bacterial and archaeal communities, with different OTUs found in the open
areas and under the plant canopies (Figure 2.2). We speculate that the
structures of the bacterial and archaeal communities were comparable
among the three Mediterranean sites because of a combination of selection
pressure exerted by plants and the protection from environmental
fluctuations provided by the vegetation. However, in the exposed arid and
semiarid sites, where vegetation is scarce and the open patches are devoid of
plants, the resource islands support distinct microbial communities
(Herman et al., 1995).
2| Biogeography of soil archaea and bacteria
51
Numerous studies have shown the strong correlation between
precipitation and macroorganism richness and diversity, especially in water-
limited regions (Hawkins et al., 2003). Until recently, however,
microorganisms’ spatial diversity has received little attention, as the
requisite sampling and analysis efforts were unrealistic considering the
number of Bacteria in a gram of soil (Schloss and Handelsman, 2006). The
introduction of quick and reproducible fingerprinting techniques 12 years
ago (Liu et al., 1997; Fisher and Triplett, 1999) has enabled microbiologists
to compare large number of soil samples and move beyond local-scale
observations. Here, we examined local and regional diversity patterns of both
Bacteria and Archaea and found that the two domains cluster in a similar
manner. The fingerprint-based analysis suggests that separate evolutionary
and ecological processes have directed the biogeography of micro- and
macroorganisms, resulting in distinct patterns. Further work is needed to
elucidate the following: (i) whether these biogeographical patterns are stable
over time; (ii) the phylogenetic patterns in the three separate ecosystems
delineated here and (iii) the functional groups within each community. Such
comprehensive examination would improve our understanding of the spatial
and temporal patterns of microbial life in different habitats and provide a
link to the full breadth of the ecosystems.

2| Biogeography of soil archaea and bacteria
52
2.5 Experimental procedure
Site description
Sampling was performed in May and June of 2007 at five LTER stations in
Israel (http://lter.bgu.ac.il/) located in areas with mean annual
precipitation ranging from 100 to 900 mm per year (Supplementary Figure
2.1). At each station, sampling was performed in triplicate plots of 4025 m2,
all fenced and thus protected from grazing livestock and undisturbed by
human activity.
At each plot, eight randomly selected subsamples were taken from the
bare soil in the interspaces between the dominant perennial plants (open
patch) and under the perennial canopy (woody patch). The predominant
perennial was singled out at each station) and we sampled under its canopy
alone. The eight subsamples of each patch type at each plot were composited
to represent an average for that site, resulting in a total of six composite soil
samples per station (Supplementary Figure 2.1).
Soil collection and physicochemical characterization
After crust and litter removal, the top 5 cm of the soil was collected into
sterile Whirl-Pak sample bags (Nasco, Fort Atkinson, WI, USA) and placed in
a cooler. The samples were transported to the laboratory and homogenized
within 24 h of sampling. A 50 g subsample of each soil sample was stored at
-80 °C for molecular analysis, whereas the rest was used for
physicochemical analysis.
Soil chemical analysis was performed according to standard methods for
soil analyses (SSSA, 1996): soil water content by gravimetric method;
percentage organic matter by dichromate oxidation method; pH and
electrical conductivity in saturated soil extract (SSE); sodium, calcium and
magnesium in SSE by inductively coupled plasma spectroscopy; sodium
adsorption ratio by calculation from Na+ and Ca2+ + Mg2+ concentrations;
total phosphate by the ‘Olsen method’ (sodium bicarbonate extract); K+ in
SSE by flame spectrophotometer; nitrogen as nitrate in aqueous extract;

2| Biogeography of soil archaea and bacteria
53
nitrogen as ammonium in KCl solution extract (including adsorbed
nitrogen); percentage of calcium carbonate by hydrochloric acid digestion.
As different units were used to measure the various physicochemical
parameters, they all had to be brought into an equal range before any
analysis. In addition, the distribution in each factor had to approach
normality to better meet the assumptions of the statistical models. Testing
different transformation techniques showed standardization (Z-score) to
yield the best results in terms of eliminating scale differences and achieving
normality under Kolmogorov–Smirnov test.
DNA extraction, PCR amplification and TRFLP analysis
Bacterial and archaeal community fingerprints were obtained using terminal
restriction fragment length polymorphism (TRFLP; Liu et al., 1997). DNA was
extracted from triplicate soil subsamples, each consisting of 0.25 g (wet
weight), using the PowerSoil DNA Isolation Kit (MoBio, West Carlsbad, CA,
USA).
Polymerase chain reaction (PCR) amplification was performed with the
primer pairs 341F (Ishii and Fukui, 2001): 50 -CCTACGGGAGGCAGCAI-30
and 908R (Lane et al., 1985): 5’-CCGTCAATTCMTTTGAGTTI-3’ targeting
Bacteria, and 109F (Grosskopf et al., 1998): 5’-ACKGCTCAGTAACACGI-3’
and 934R (Stahl and Amann, 1991): 5’-GTGCTCCCCCGCCAATTCCI-3’
targeting Archaea. All primers were modified by the addition of inosine at the
3’ end in an attempt to broaden their target scope (Ben-Dov et al., 2006). In
both primer pairs, the forward primer was labelled with the fluorescent dye
6-FAM (6-carboxyfluorescein; Metabion, Martinsried, Germany) at the 5’
end. PCRs were conducted in triplicates of 50 µl to minimize reaction bias.
In addition, the following steps were taken to minimize some of the artefact
effects of PCR, such as the appearance of chimeras and pseudo-terminal
restriction fragments (TRFs; Egert and Friedrich, 2003): (i) the number of
PCR cycles was reduced to 24 and 25 for Bacteria and Archaea, respectively,
and elongation time was extended to 3min; (ii) before cleanup and digestion
with restriction enzymes, amplified DNA samples were treated with mung
bean exonuclease (TaKara, Shiga, Japan) according to the manufacturer’s
instructions. Each PCR contained 2.5 µl 10 × buffer (Bioneer, Daejeon,
2| Biogeography of soil archaea and bacteria
54
South Korea), 0.25 mM of each dNTP (Larova, Teltow, Germany), 2.5 mM
MgCl2, 0.5 µM of each primer (Metabion), 1 µg µl 1 BSA (New England
Biolabs (NEB), Ipswich, MA, USA), 2.5 units Taq DNA polymerase (HyLabs,
Rehovot, Israel) and 1 µl DNA template. The PCRs were carried out as
follows: after an initial 5min denaturation step at 95 °C, 24 or 25 cycles (for
Bacteria and Archaea, respectively) were run at 94 °C for 45 s, 45 °C for 1
min and 72 °C for 3 min, followed by a final elongation step at 72 °C for 10
min. After amplification, the triplicate PCRs were pooled, treated with mung
bean exonuclease and purified using a PCR purification kit (Bioneer). The
purified PCR products were digested with the restriction enzymes TaqI, HhaI
(TaKara) and HpyCH4IV (NEB) for samples amplified using the bacterial
primers (341F/908R). The restriction enzymes TaqI, MseI and MboI (TaKara)
were used for the amplicons generated with the archaeal primers
(109F/934R). For each enzyme, digestions were performed in reactions of 20
µl containing 2 µl of digestion buffer (TaKara), 20 units of restriction enzyme
and approximately 200 ng of the purified PCR product. Digestion was
followed by precipitation using standard ethanol precipitation with Pellet
Paint (Novagen, Darmstadt, Germany), and resuspension in double-distilled
water. These samples were analyzed with an ABI Prism 3100 genetic
analyzer (Applied Biosystems, Foster City, CA, USA). The peaks in each
profile were related to specific fragment lengths based on a size marker (70–
500 MapMarker, BioVentures, Murfreesboro, TN, USA). Data were retrieved
using Peak Scanner software v1.0 (Applied Biosystems). Each sample was
loaded at least twice and the profiles were treated as replicates.
Data manipulation and statistical analysis
Raw TRFLP data cannot be used directly for analysis, and therefore the
following standardization and normalization procedures were applied prior
to all statistical analyses. The size in base pairs of each peak (TRF) was used
to indicate an operational taxonomic unit (OTU), whereas the area under the
peak was used to determine its relative abundance in the profile. The TRFLP
patterns of the replicates (method replicates) of each sample were
standardized as described elsewhere (Dunbar et al., 2001). Profiles were
then aligned and a consensus profile was computed for each sample from its
2| Biogeography of soil archaea and bacteria
55
replicates by eliminating non reproducible peaks and averaging shared
peaks. The procedure was then applied again to standardize the consensus
profiles and they were aligned to generate a sample-by-species matrix, which
was used in subsequent analyses. The above procedure was repeated for
each restriction enzyme separately. For a better fit of the data set to the
assumptions of the statistical models, two additional transformations were
applied. (i) To deal with possible skewness of the data set, a Log (x + 1)
transformation was applied; this greatly improved the overall performance of
the samples in a Kolmogorov–Smirnov test for normality (data not shown).
(ii) To deal with the problem of null values in the matrix, it was transformed
to give Hellinger distances between the samples when Euclidean distances
were computed (Legendre and Gallagher, 2001). The matrix was tested
under a detrended correspondence analysis (DCA) model and the length of
the first gradient was found to be less than 4 SD, and hence linear models
were constructed (data not shown). A two-way cluster analysis was
simultaneously performed on the TRFs and the samples, using Euclidean
distances and Ward’s linkage. A Scree plot showing the distance between the
clusters as a function of clustering order was used to determine the relevant
number of clusters. To test for the differences between species distributions,
the standardized TRFLP data of each sample were ordered from the most
abundant to the least abundant TRF (rank abundance) and a Kolmogorov–
Smirnov test was performed on every pair of samples to test whether they
were drawn from the same distribution.
All standardization and normalization procedures were performed using
MATLAB 7 (http://www.mathworks.com) and the codes are available at
http://www.staff.uni-marburg.de/~angel. Cluster and distribution analyses
were computed using MATLAB. Hypothesis testing was performed using
block-design redundancy analysis (RDA) and tested using Monte Carlo
permutation tests (ter Braak and Smilauer, 1998). Correlations to
physicochemical characteristics were performed using RDA with forward
selection procedure (ter Braak and Smilauer, 1998). All RDA models were
computed using Canoco 4.53 (http://www.canoco.com).
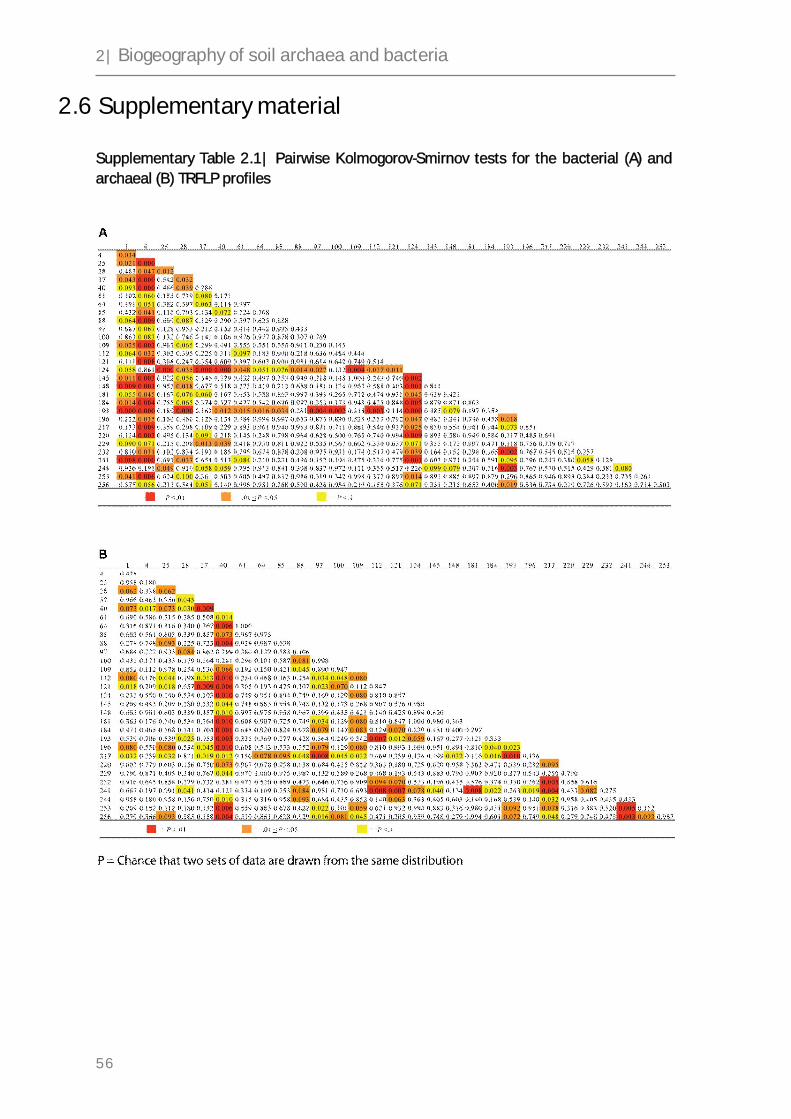
2| Biogeography of soil archaea and bacteria
56
2.6 Supplementary material
Supplementary Table 2.1| Pairwise Kolmogorov-Smirnov tests for the bacterial (A) and
archaeal (B) TRFLP profiles

Supplementary Table 2.2| Statistical tests for the effect of different geographic scales on the community compositions (see text for
methods description)
* Significance of the first canonical axis
** Variance of the species data explained by the first canonical axis
Bacteria Archaea
Test Matrix Permutations Significance* Variance** Significancea Varianceb
Sites Correlation Unrestricted F = 5.279
P = 0.0001 17.4%
F = 15.736
P = 0.0001 38.6%
Plots Covariance Only within
stations
F = 1.763
P = 0.3297 -
F = 2.455
P = 0.7683 -
Patch type Covariance Only within
stations
F = 1.878
P = 0.0091 7.3%
F = 2.596
P = 0.0202 9.8%
57
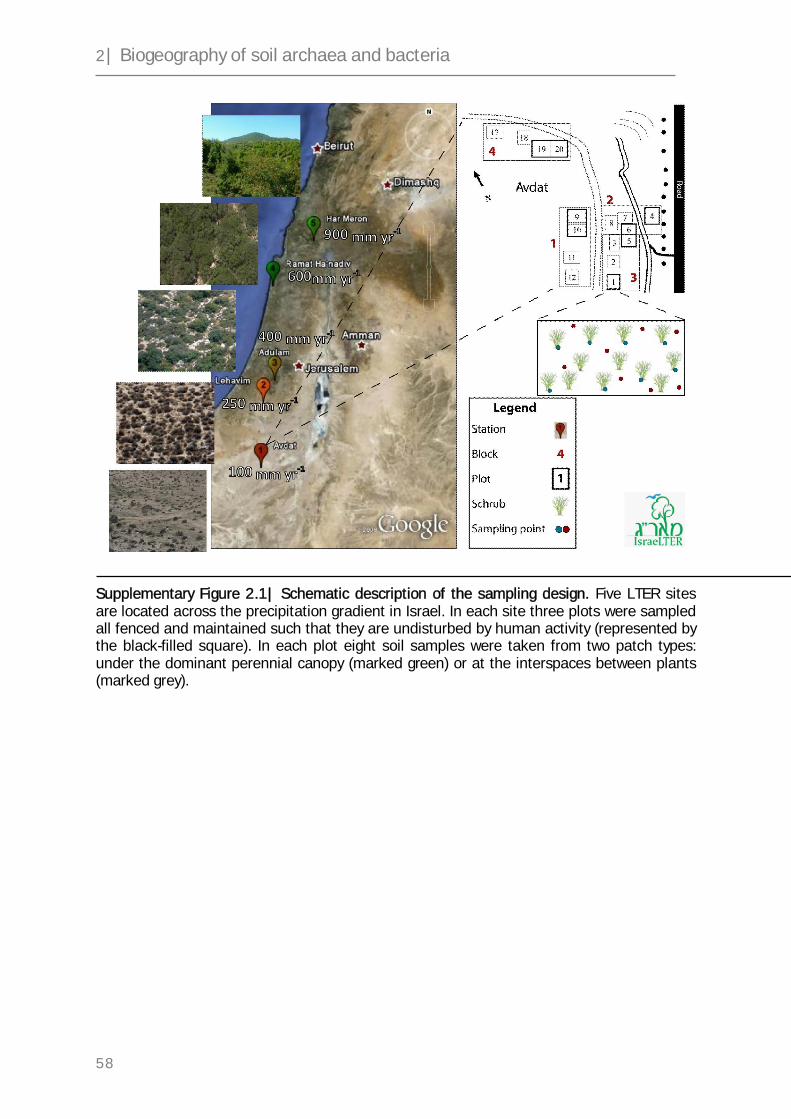
2| Biogeography of soil archaea and bacteria
58
Supplementary Figure 2.1| Schematic description of the sampling design. Five LTER sites are located across the precipitation gradient in Israel. In each site three plots were sampled all fenced and maintained such that they are undisturbed by human activity (represented by the black-filled square). In each plot eight soil samples were taken from two patch types: under the dominant perennial canopy (marked green) or at the interspaces between plants (marked grey).

2| Biogeography of soil archaea and bacteria
59
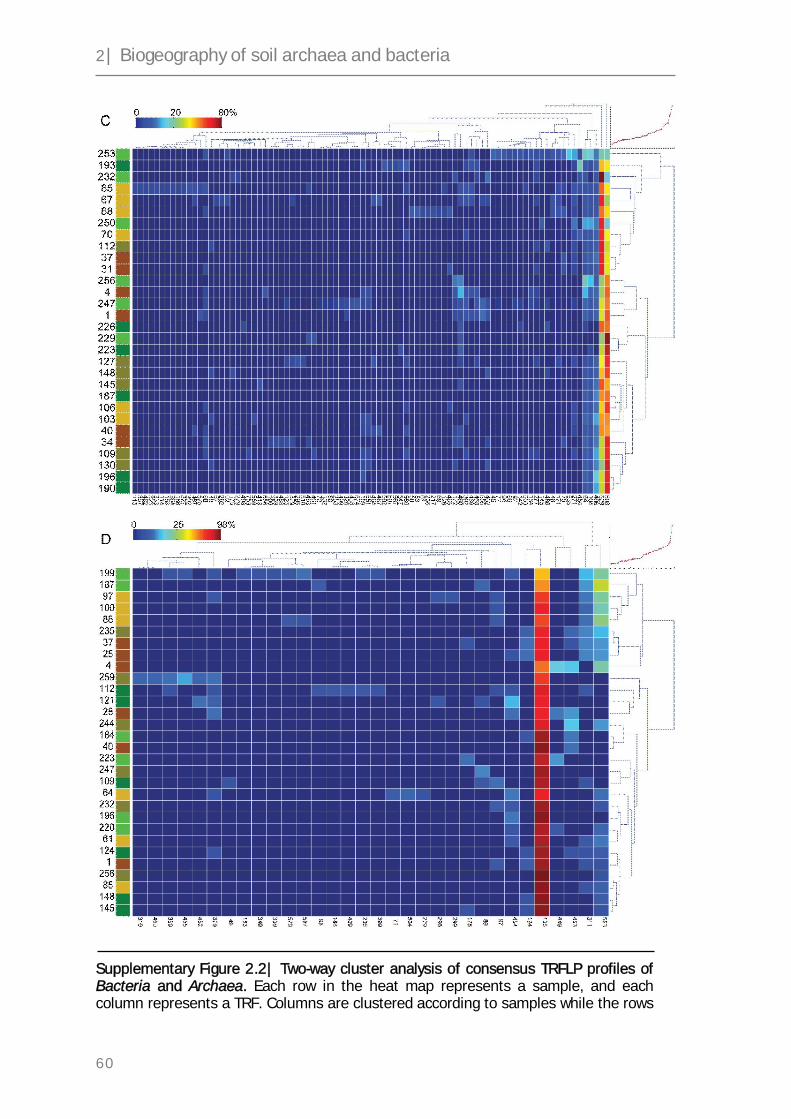
2| Biogeography of soil archaea and bacteria
60
Supplementary Figure 2.2| Two-way cluster analysis of consensus TRFLP profiles of Bacteria and Archaea. Each row in the heat map represents a sample, and each column represents a TRF. Columns are clustered according to samples while the rows

2| Biogeography of soil archaea and bacteria
61
are clustered in accordance to the TRFs generated by restriction of each soil sample’s amplified 16S rRNA fragment using the restriction enzymes (A) HhaI and (B) HpyCH4IV for Bacteria and (C) TaqI and (D) MboI for Archaea. The colour-coded column to the left of the heat map corresponds to the origin of each sample (see legend at the bottom for colour coding). Heat map colours represent relative abundance of the TRFs. Clustering was done on a Euclidean distance matrix of the standardized and transformed TRFLP profiles (see Experimental procedure). Scree plots (top right of each map) show the distance between each two hierarchical clusters vs. cluster number.
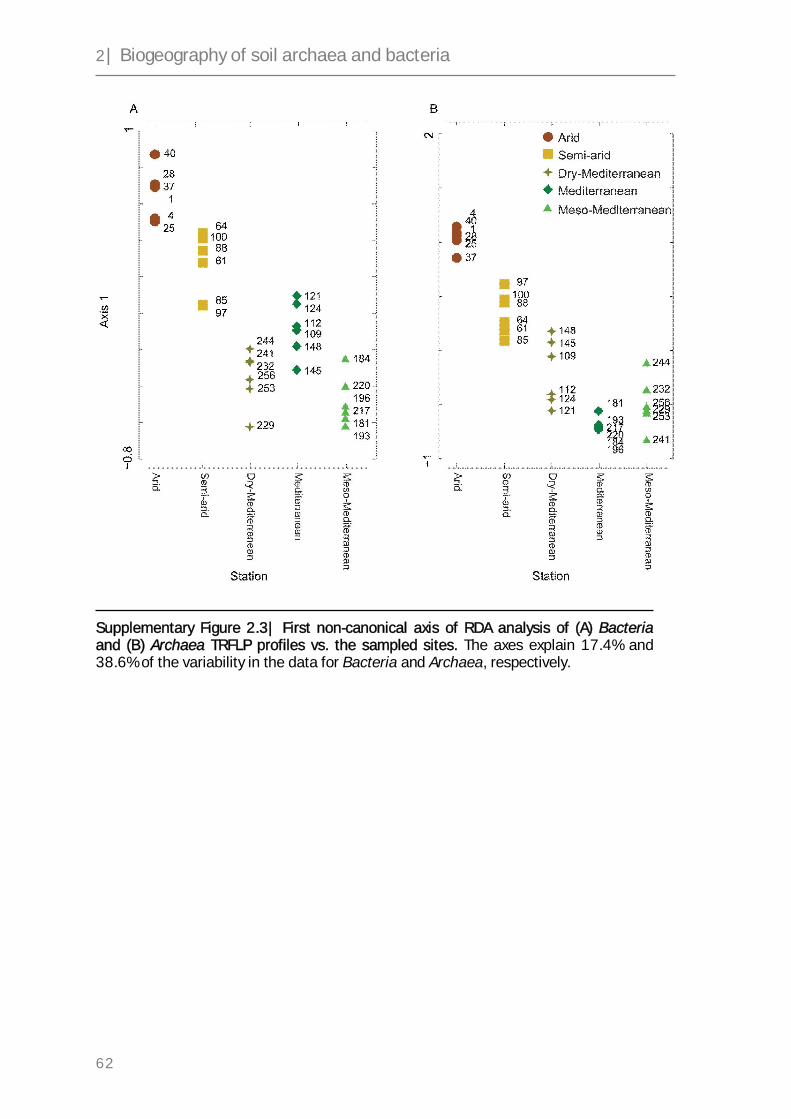
2| Biogeography of soil archaea and bacteria
62
Supplementary Figure 2.3| First non-canonical axis of RDA analysis of (A) Bacteria and (B) Archaea TRFLP profiles vs. the sampled sites. The axes explain 17.4% and 38.6% of the variability in the data for Bacteria and Archaea, respectively.
2| Biogeography of soil archaea and bacteria
63
2.7 References
Adler PB, Levine JM. (2007). Contrasting relationships between precipitation and
species richness in space and time. Oikos 116: 221–232.
Ben-Dov E, Shapiro OH, Siboni N, Kushmaro A. (2006). Advantage of using inosine at
the 3’ termini of 16S rRNA gene universal primers for the study of microbial diversity.
Appl Environ Microbiol 72: 6902–6906.
Bowers MA, Thompson DB, Brown JH. (1987). Spatial-organisation of a desert rodent
community—food addition and species removal. Oecologia 72: 77–82.
Bryant JA, Lamanna C, Morlon H, Kerkhoff AJ, Enquist BJ, Green JL. (2008). Microbes
on mountainsides: contrasting elevational patterns of bacterial and plant diversity. Proc
Natl Acad Sci USA 105: 11505–11511.
Carson JK, Campbell L, Rooney D, Clipson N, Gleeson DB. (2009). Minerals in soil
select distinct bacterial communities in their microhabitats. FEMS Microbiol Ecol 67:
381–388.
Chaban B, Ng SYM, Jarrell KF. (2006). Archaeal habitats — from the extreme to the
ordinary. Can J Microbiol 52: 73–116.
Clark J, Campbell J, Grizzle H, Acosta-Martinez V, Zak J. (2009). Soil microbial
community response to drought and precipitation variability in the Chihuahuan Desert.
Microb Ecol 57: 248–260.
Cornwell WK, Grubb PJ. (2003). Regional and local patterns in plant species richness
with respect to resource availability. Oikos 100: 417–428.
Curtis TP, Head IM, Lunn M, Woodcock S, Schloss PD, Sloan WT. (2006). What is the
extent of prokaryotic diversity? Philos Trans R Soc Lond B Biol Sci 361: 2023–2037.
Dunbar J, Ticknor LO, Kuske CR. (2001). Phylogenetic specificity and reproducibility
and new method for analysis of terminal restriction fragment profiles of 16S rRNA genes
from bacterial communities. Appl Environ Microbiol 67: 190–197.
Egert M, Friedrich MW. (2003). Formation of pseudo-terminal restriction fragments, a
PCR-related bias affecting terminal restriction fragment length polymorphism analysis
of microbial community structure. Appl Environ Microbiol 69: 2555–2562.
Fierer N. (2008). Microbial biogeography: patterns in the microbial diversity across
space and time. In Zengler K (ed) Accessing Uncultivated Microorganisms: from the
2| Biogeography of soil archaea and bacteria
64
Environment to Organisms and Genomes and Back. ASM Press; Washington DC, pp 95–
115.
Fierer N, Jackson RB.. (2006). The diversity and biogeography of soil bacterial
communities. Proc Natl Acad Sci USA 103: 626–631.
Fisher MM, Triplett EW. (1999). Automated approach for ribosomal intergenic spacer
analysis of microbial diversity and its application to freshwater bacterial communities.
Appl Environ Microbiol 65: 4630–4636.
Fuhrman JA. (2009). Microbial community structure and its functional implications.
Nature 459: 193–199.
Gardezi T, Gonzalez A. (2008). Scale dependence of species–energy relationships:
evidence from fishes in thousands of lakes. Am Nat 171: 800–815.
Green J, Bohannan BJM. (2006). Spatial scaling of microbial biodiversity. Trends Ecol
Evol 21: 501–507.
Grosskopf R, Janssen PH, Liesack W. (1998). Diversity and structure of the
methanogenic community in anoxic rice paddy soil microcosms as examined by
cultivation and direct 16S rRNA gene sequence retrieval. Appl Environ Microbiol 64:
960–969.
Hansel CM, Fendorf S, Jardine PM, Francis CA. (2008). Changes in bacterial and
archaeal community structure and functional diversity along a geochemically variable
soil profile. Appl Environ Microbiol 74: 1620–1633.
Hawkins BA, Field R, Cornell HV, Currie DJ, Guegan JF, Kaufman DM et al. (2003).
Energy, water, and broad-scale geographic patterns of species richness. Ecology 84:
3105–3117.
Herman RP, Provencio KR, Herreramatos J, Torrez RJ. (1995). Resource islands predict
the distribution of heterotrophic bacteria in Chihuahuan desert soils. Appl Environ
Microbiol 61: 1816–1821.
Hoj L, Olsen RA, Torsvik VL. (2008). Effects of temperature on the diversity and
community structure of known methanogenic groups and other archaea in high Arctic
peat. ISME J 2: 37–48.
Ishii K, Fukui M. (2001). Optimization of annealing temperature to reduce bias caused
by a primer mismatch in multitemplate PCR. Appl Environ Microbiol 67: 3753–3755.
2| Biogeography of soil archaea and bacteria
65
Keil P, Simova I, Hawkins BA. (2008). Water-energy and the geographical species
richness pattern of European and North African dragonflies (Odonata). Insect Conserv
Divers 1: 142–150.
Kent AD, Triplett EW. (2002). Microbial communities and their interactions in soil and
rhizosphere ecosystems. Annu Rev Microbiol 56: 211–236.
Lane DJ, Pace B, Olsen GJ, Stahl DA, Sogin ML, Pace NR. (1985). Rapid determination
of 16S ribosomal RNA sequences for phylogenetic analyses. Proc Natl Acad Sci USA 82:
6955–6959.
Legendre P, Gallagher ED. (2001). Ecologically meaningful transformations for
ordination of species data. Oecologia 129: 271–280.
Liu WT, Marsh TL, Cheng H, Forney LJ. (1997). Characterization of microbial diversity
by determining terminal restriction fragment length polymorphisms of genes encoding
16S rRNA. Appl Environ Microbiol 63: 4516–4522.
Navarro-Gonzalez R, Rainey FA, Molina P, Bagaley DR, Hollen BJ, de la Rosa J et al.
(2003). Mars-like soils in the Atacama Desert, Chile, and the dry limit of microbial life.
Science 302: 1018–1021.
Nemergut DR, Costello EK, Meyer AF, Pescador MY, Weintraub MN, Schmidt SK. (2005).
Structure and function of alpine and arctic soil microbial communities. Res Microbiol
156: 775–784.
Ochsenreiter T, Selezi D, Quaiser A, Bonch-Osmolovskaya L, Schleper C. (2003).
Diversity and abundance of Crenarchaeota in terrestrial habitats studied by 16S RNA
surveys and real time PCR. Environ Microbiol 5: 787–797.
Oline DK, Schmidt SK, Grant MC. (2006). Biogeography and landscape-scale diversity of
the dominant crenarchaeota of soil. Microb Ecol 52: 480–490.
Robinson BS, Bamforth SS, Dobson PJ. (2002). Density and diversity of protozoa in
some arid Australian soils. J Eukaryot Microbiol 49: 449–453.
Schlesinger WH, Raikes JA, Hartley AE, Cross AE. (1996). On the spatial pattern of soil
nutrients in desert ecosystems. Ecology 77: 364–374.
Schloss PD, Handelsman J. (2006). Toward a census of bacteria in soil. PLoS Comput
Biol 2: e92.
Schutte UME, Abdo Z, Bent SJ, Shyu C, Williams CJ, Pierson JD et al. (2008). Advances
in the use of terminal restriction fragment length polymorphism (T- RFLP) analysis of
16S rRNA genes to characterize microbial communities. Appl Microbiol Biotechnol 80:
2| Biogeography of soil archaea and bacteria
66
365–380. SSSA (1996). Methods of Soil Analysis, Part 3. Soil Science Society of America:
Madison, WI, USA.
Stahl DA, Amann R. (1991). Development and application of nucleic acid probes in
bacterial systematics. In: Stackebrandt E and Goodfellow M (eds). Nucleic Acid
Techniques in Bacterial Systematics. John Wiley & Sons Ltd Chichester: England, pp
205–248.
ter Braak CJF, Smilauer P. (1998). Canoco Reference Manual and User’s Guide to
Canoco for Windows. Centre for Biometry Wageningen: Wageningen, The Netherlands.
van Rensburg BJ, Chown SL, Gaston KJ. (2002). Species richness, environmental
correlates, and spatial scale: a test using South African birds. Am Nat 159: 566–577.
Vishniac HS. (2006). A multivariate analysis of soil yeasts isolated from a latitudinal
gradient. Microb Ecol 52: 90–103.
Walsh DA, Papke RT, Doolittle WF. (2005). Archaeal diversity along a soil salinity
gradient prone to disturbance. Environ Microbiol 7: 1655–1666.
Woodcock S, Curtis TP, Head IM, Lunn M, Sloan WT. (2006). Taxa–area relationships for
microbes: the unsampled and the unseen. Ecol Lett 9: 805–812.
Yergeau E, Newsham KK, Pearce DA, Kowalchuk GA. (2007). Patterns of bacterial
diversity across a range of Antarctic terrestrial habitats. Environ Microbiol 9: 2670–
2682.
Zhou J, Xia B, Treves DS, Wu LY, Marsh TL, O’Neill RV et al. (2002). Spatial and
resource factors influencing high microbial diversity in soil. Appl Environ Microbiol 68:
326–334.
Zhou JZ, Xia BC, Huang H, Palumbo AV, Tiedje JM. (2004). Microbial diversity and
heterogeneity in sandy subsurface soils. Appl Environ Microbiol 70: 1723–1734.

67
Chapter 3| In situ Measurement of Methane
Fluxes and Analysis of Transcribed
Particulate Methane Monooxygenase in
Desert Soils
Roey Angel and Ralf Conrad
Published in Environmental Microbiology (2010) 11(10), 2598–2610
Max-Planck-Institute for Terrestrial Microbiology, Karl-von-Frisch-Strasse 10, 35043
Marburg, Germany
Contributions:
RA and RC designed the study and the sampling scheme; RA performed the field
work, the sampling, all lab experiments, design of Matlab codes and data analyses;
RA and RC wrote the manuscript.
3| Methanotrophic bacteria in desert soils
68
3.1 Abstract
Aerated soils are a biological sink for atmospheric methane. However, the
activity of desert soils and the presence of methanotrophs in these soils have
hardly been studied. We studied on-site atmospheric methane consumption
rates as well as the diversity and expression of the pmoA gene, coding for a
subunit of the particulate methane monooxygenase, in arid and hyperarid
soils in the Negev Desert, Israel. Methane uptake was only detected in
undisturbed soils in the arid region (~90 mm yr-1) and vertical methane
profiles in soil showed the active layer to be at 0–20 cm depth. No methane
uptake was detected in the hyperarid soils (~20 mm yr-1) as well as in
disturbed soils in the arid region (i.e. agricultural field and a mini-
catchment). Molecular analysis of the methanotrophic community using
terminal restriction fragment length polymorphism (TRFLP) and
cloning/sequencing of the pmoA gene detected methanotrophs in the active
soils, whereas the inactive ones were dominated by sequences of the
homologous gene amoA, coding for a subunit of the ammonia
monooxygenase. Even in the active soils, methanotrophs (as well as in situ
activity) could not be detected in the soil crust, which is the biologically most
important layer in desert soils. All pmoA sequences belonged to yet
uncultured strains. Transcript analysis showed dominance of sequences
clustering within the JR3, formerly identified in Californian grassland soils.
Our results show that although active methanotrophs are prevalent in arid
soils they seem to be absent or inactive in hyperarid and disturbed arid
soils. Furthermore, we postulate that methanotrophs of the yet uncultured
JR3 cluster are the dominant atmospheric methane oxidizers in this
ecosystem.
3| Methanotrophic bacteria in desert soils
69
3.2 Introduction
Aerated soils constitute a global biological sink for atmospheric methane, a
potent greenhouse gas whose atmospheric abundance has been steadily
increasing since the beginning of the industrial revolution (Prather et al.,
2001; Khalil, 2000). The magnitude of the soil methane sink has been
estimated to be 30 Tg CH4 yr-1 being 5% of the annual global methane
budget (Prather et al., 2001; Dunfield, 2007). The site-specific methane
uptake rates vary significantly and are affected by soil type and land use
(Adamsen and King, 1993; Reay et al., 2001; 2005; Menyailo and Hungate,
2003). Thus, the estimate of the global sink strength for CH4 uptake by soils
has been criticized due to the large variation found in field measurements
both spatially and temporarily. Smith and colleagues (2000) performed a set
of measurements, compared it with field data from previous studies, and
estimated the global biological methane sink to range from 7 to > 100 Tg CH4
yr-1. Although oxidation of atmospheric methane was measured in nearly all
types of aerated soils including tundra (West and Schmidt, 1998), boreal,
temperate and tropical forests (Yavitt et al., 1990; King and Adamsen, 1992;
Henckel et al., 2000; Knief et al., 2005; Kolb et al., 2005), grasslands and
cultivated soils (Horz et al., 2005; Tate et al., 2007), as well as deserts
(Striegl et al., 1992), most data come from North America and northern
Europe while data from other regions and ecosystems are limited or non-
existent (Smith et al., 2000).
Methane uptake in soils is mediated by the methane-oxidizing bacteria,
or simply methanotrophs, which oxidize methane for both energy
(dissimilatory methane oxidation) and carbon assimilation (assimilatory
methane oxidation; Mancinelli, 1995). Nearly all methanotrophs species are
affiliated to the alpha and gamma subdivisions of the Proteobacteria
(Bowman, 2006) and were traditionally thought to be exclusively limited to
these phylogenetic groups. Recent work, however, demonstrated the
existence of extreme thermo-acidophilic methanotrophs within the
Verrucomicrobia phylum (e.g. Dunfield et al., 2007). Methanotrophs of the
Proteobacteria are commonly divided into type I and type II based on their
phylogeny, morphology and physiology (Bowman, 2006). A third group, type

3| Methanotrophic bacteria in desert soils
70
X, is phylogenetically affiliated with type I but possesses several
distinguishing biochemical features. The key enzyme in the oxidation of
methane is the methane monooxygenase which is known to exist in two
versions, a cytoplasmic one which is referred to as the soluble methane
monooxygenase (sMMO) and a membrane-bound protein referred to as the
particulate methane monooxygenase (pMMO; Murrell et al., 2000). The pmoA
subunit (27 kDa) of the pMMO is the most commonly used genetic marker
for the detection of methanotrophs as this form of methane monooxygenase
is present in all methanotrophs except Methylocella, while the sMMO is
limited to certain groups (Murrell et al., 1998).
Until recently it was believed that all cultured representatives of
methanotrophs are able to oxidize methane only at far higher concentrations
than our current atmospheric concentration. This notion has been revised
with the discovery of a second pmo operon in some type II methanotrophs
which encodes an isozyme of the pMMO that is able to oxidize methane at
low and even atmospheric levels (Baani and Liesack, 2008). In addition, it
had been noted that the dominant pmoA sequences detected in soils with
active uptake of CH4 from the atmosphere form clusters (e.g. upland soil
cluster alpha, USCa) that are different from those of the known
methanotrophs (Henckel et al., 1999; Holmes et al., 1999; Knief et al., 2003;
Kolb et al., 2005). However, since the methanotrophs possessing these pmoA
sequence clusters have not yet been cultured, the evidence for them being
atmospheric methane oxidizers is only indirect.
Drylands (semiarid, arid and hyperarid regions) cover around 31–38% of
the Earth’s surface, with deserts (arid and hyperarid regions) alone covering
19–20% (Middleton and Thomas, 1997; Ffolliott et al., 2003). Half of the
world’s countries are in part or entirely located in dryland environments and
they are home to nearly 40% of the human population (Ffolliott et al., 2003).
Despite their significant size and importance drylands tend to be under-
represented in research and are often less understood compared with other
ecosystems. The importance of studying drylands stems not only from their
current size but also from the fact that they expand through desertification
(Navone and Abraham, 2006). Evidence exists of the involvement of desert

3| Methanotrophic bacteria in desert soils
71
soils the turnover of atmospheric gases in general (e.g. Bitton, 2002) and of
methane in particular (Striegl et al., 1992; Peters and Conrad, 1996).
The goal of this study was to characterize the diversity of methanotrophs,
the expression of the pmoA gene as well as the spatial heterogeneity of
methane uptake in arid and hyperarid environments. We hypothesized that
water limitation conditions associated with arid and hyperarid environments
might act as a strong selection force for specifically adapted methanotrophs
and might also limit the extent of atmospheric methane oxidation in these
soils. To this aim we performed field measurements of methane uptake and
methane concentrations in soils of different habitats in arid and hyperarid
parts of the Negev Desert in Israel. In addition, we characterized the
methanotrophic community using the pmoA gene marker and its mRNA
transcripts.

3| Methanotrophic bacteria in desert soils
72
3.3 Results
Field measurements of methane uptake and methane vertical profiles
Of the five sites studied (Table 3.1) only one, the natural site at Avdat,
showed a decrease in methane concentration over time inside the chambers,
indicating uptake of atmospheric methane by the soil (Figure 3.1). This
could be seen in the intershrub patches and also under shrub canopies
(Figure 3.1A). Methane levels dropped from an initial atmospheric
concentration of ~0.07 mol per litre of air down to 0.033 ± 0.004 and 0.045
± 0.01 mol per litre of air in the open and shrub patches, respectively.
Methane concentration in the chamber decreased logarithmically with time
and thus matched first-order kinetics, as expected for methane uptake by
soil (Bender and Conrad, 1993). The methane uptake rates at the Avdat
natural site, as deduced from a linear approximation during the first 80 min,
were 39.4 ± 16.79 and 62.4 ± 5.8 mol CH4 m-2 d-1 for the shrub and
intershrub patches, respectively (Table 3.2). At all the other sites, closed
chamber measurements showed no decrease in methane concentration over
80 min enclosure (Figure 3.1B).

Table 3.1| Characteristics of sites and soils*
Location Site
Texture (%) Water content (%) pH
Ntot., Corg.(%)
Sand Silt Clay N C Predominant vegetation
Avdat, Negev Plateau, Israel
Natural field
(30 o 47’57N/ 34 o 45’57E) 29 57.5 13.5 2.4 8.6 0.01 0.33 Hamada scoparia
Liman (constructed mini-
catchment)
(30 o 48’52N/ 34 o 45’26E)
13.35 56.75 29.9 4.6 7.9 0.09 1.27
Cupressus sempervirens
Ziziphus spina-christi
Balanites aegyptiaca
Agricultural field
(30 o 52’33N/ 34 o 48’16E) 33.9 47.8 18.3 3.0 8.5 - 0.28 Potatoes
Arava Valley South, Israel
Wadi (dry riverbed)
(29 o 58’44N/ 35 o 05’16E) 88.2 7.51 4.29 - 8.4 - 0.06 Acacia tortilis
Agricultural field
(30 o 04’11N/ 35 o 08’45E) 91.5 5.81 2.69 ND 8.5 0.14 0.38 Spring onions
* All analyses presented here were preformed on the 0-10 cm soil fraction of each sample.
– Below limits of detection.
ND – not determined.
73
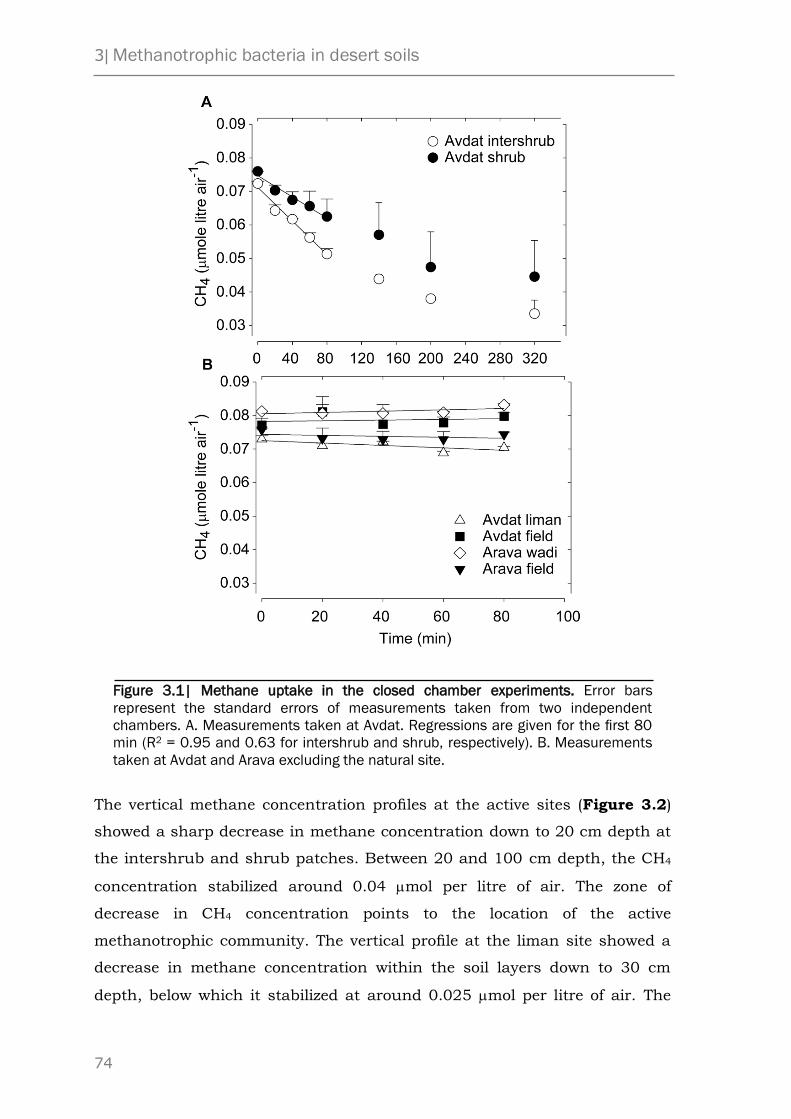
3| Methanotrophic bacteria in desert soils
74
Figure 3.1| Methane uptake in the closed chamber experiments. Error bars
represent the standard errors of measurements taken from two independent
chambers. A. Measurements taken at Avdat. Regressions are given for the first 80
min (R2 = 0.95 and 0.63 for intershrub and shrub, respectively). B. Measurements
taken at Avdat and Arava excluding the natural site.
The vertical methane concentration profiles at the active sites (Figure 3.2)
showed a sharp decrease in methane concentration down to 20 cm depth at
the intershrub and shrub patches. Between 20 and 100 cm depth, the CH4
concentration stabilized around 0.04 mol per litre of air. The zone of
decrease in CH4 concentration points to the location of the active
methanotrophic community. The vertical profile at the liman site showed a
decrease in methane concentration within the soil layers down to 30 cm
depth, below which it stabilized at around 0.025 mol per litre of air. The

3| Methanotrophic bacteria in desert soils
75
vertical profile measured in the agricultural field at Avdat also showed a
decrease in methane concentration with soil depth, but unlike the previously
mentioned profiles methane concentration decreased continuously down to
about 0.04 mol per litre of air at 100 cm depth. Lastly, the vertical profile
measured in the wadi site at Arava showed no decrease in methane
concentration with soil depth down to 110 cm.
Figure 3.2| Vertical profiles of methane concentrations in the soil. (A) Avdat –
intershrub, (B) Avdat – shrub, (C) Avdat – liman, (D) Avdat – agricultural field, (E)
Arava – wadi. Vertical profile measurements could not be obtained for Arava –
agricultural field. Error bars represent the standard errors of measurements taken
from two independent cores.

Table 3.2| On site and in situ methane uptake rates of the soils
Potential CH4 uptake
(mole day-1 kg DW-1)
On site CH4 uptake
(mole day-1 m-2)
Predicted flux a
(mole day-1 m-2)
Sample/replicate I II III
AV_IS_cr - - -
AV_IS_0-10 0.37 0.35 0.21 62.4 + 5.8 42.0
AV_IS_10-20 0.26 0.20 0.20
AV_S_cr - - -
AV_S_0-10 0.34 0.38 0.15 39.4 + 16.8 34.2
AV_S_10-20 0.27 - 0.04
AV_Lim_cr - - - -
AV_Lim_0-10 - - - - 32.5
AV_Lim_10-20 - - - -
AV_Ag_0-10 - - - -
9.9 AV_Ag_10-20 - - - -
KT_W_cr - - - -
KT_W_0-10 - - - - -
KT_W_10-20 - - - -
KT_Ag_0-10 - - - -
ND KT_Ag_10_20 - - - -
a. Fluxes were predicted from vertical CH4 concentration profiles using Fick’s first law of diffusion (see Experimental
Procedure). DW – dry weight; – Below limits of detection; ND – not determined; AV – Avdat, KT – Arava, IS – intershrub,
S – shrub, W – wadi, Ag – agricultural field, cr – crust, 0-10 and 10-20 – depth in cm.
76

3| Methanotrophic bacteria in desert soils
77
A comparison between the values of the CH4 flux measured directly using
the closed chamber and those estimated from the vertical profiles using
Fick’s first law shows a good agreement between the two methods for the
natural site at Avdat (Table 3.2).
In contrast, the calculation for the liman site predicts a theoretical flux
almost of the same magnitude as that at the natural site, but this flux was
not detected by the closed chamber measurements. Also for the agricultural
field at Avdat, the theoretical calculations indicate flux of CH4 into the soil.
However, this flux was below the detection limit of the closed chamber
measurement of approximately 13 mol d-1 m-2.
Response of soil activity to addition of water
Shortly after application of water, the CH4 uptake rate decreased
dramatically compared with the base level measured at time zero (Figure
3.3). This was probably due to inhibition of diffusion as water filled the soil’s
pore spaces. Uptake rate returned to base level after 12 h and further
increased after 24 h. After 36 and 48 h, uptake rates were still > 150% of the
initial rate.
Potential methane oxidation of the soil samples
Methane consumption by soil samples mirrored the field observation with
the closed chamber experiments. Thus, only soils from the natural site at
Avdat showed methane consumption activity after 14 days of incubation,
while all the other soil samples did not (Table 3.2). However, not all sections
of the soil profile taken at the active sites showed potential methane
oxidation activity. The samples taken at depths of 0–10 and 10–20 cm
showed methane oxidation activity (AV_S_10–20 II being the only exception),
but the samples taken from the surface crust layer showed no activity. This
lack of activity probably indicates the absence of methanotrophs in the crust
layer. The samples taken from the intershrub patches generally showed
somewhat higher methane consumption rates than those taken from below
the shrub (Hamada scoparia) canopies, and samples taken from the top
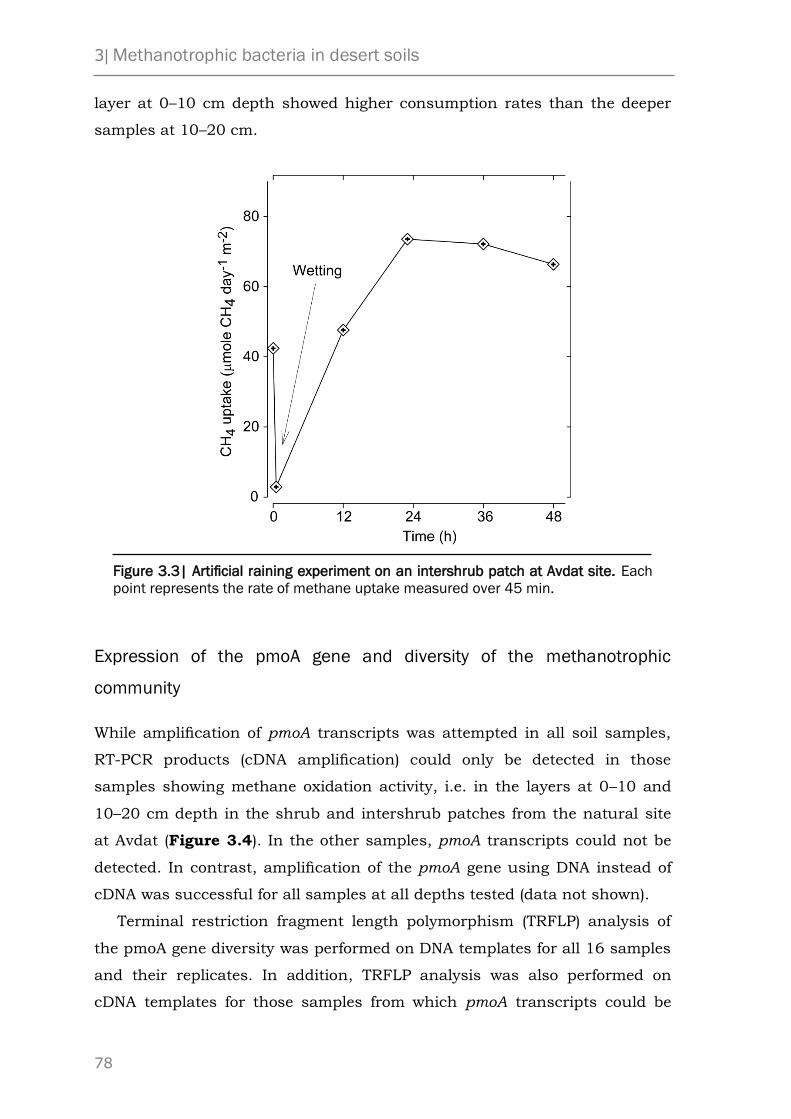
3| Methanotrophic bacteria in desert soils
78
layer at 0–10 cm depth showed higher consumption rates than the deeper
samples at 10–20 cm.
Figure 3.3| Artificial raining experiment on an intershrub patch at Avdat site. Each
point represents the rate of methane uptake measured over 45 min.
Expression of the pmoA gene and diversity of the methanotrophic
community
While amplification of pmoA transcripts was attempted in all soil samples,
RT-PCR products (cDNA amplification) could only be detected in those
samples showing methane oxidation activity, i.e. in the layers at 0–10 and
10–20 cm depth in the shrub and intershrub patches from the natural site
at Avdat (Figure 3.4). In the other samples, pmoA transcripts could not be
detected. In contrast, amplification of the pmoA gene using DNA instead of
cDNA was successful for all samples at all depths tested (data not shown).
Terminal restriction fragment length polymorphism (TRFLP) analysis of
the pmoA gene diversity was performed on DNA templates for all 16 samples
and their replicates. In addition, TRFLP analysis was also performed on
cDNA templates for those samples from which pmoA transcripts could be
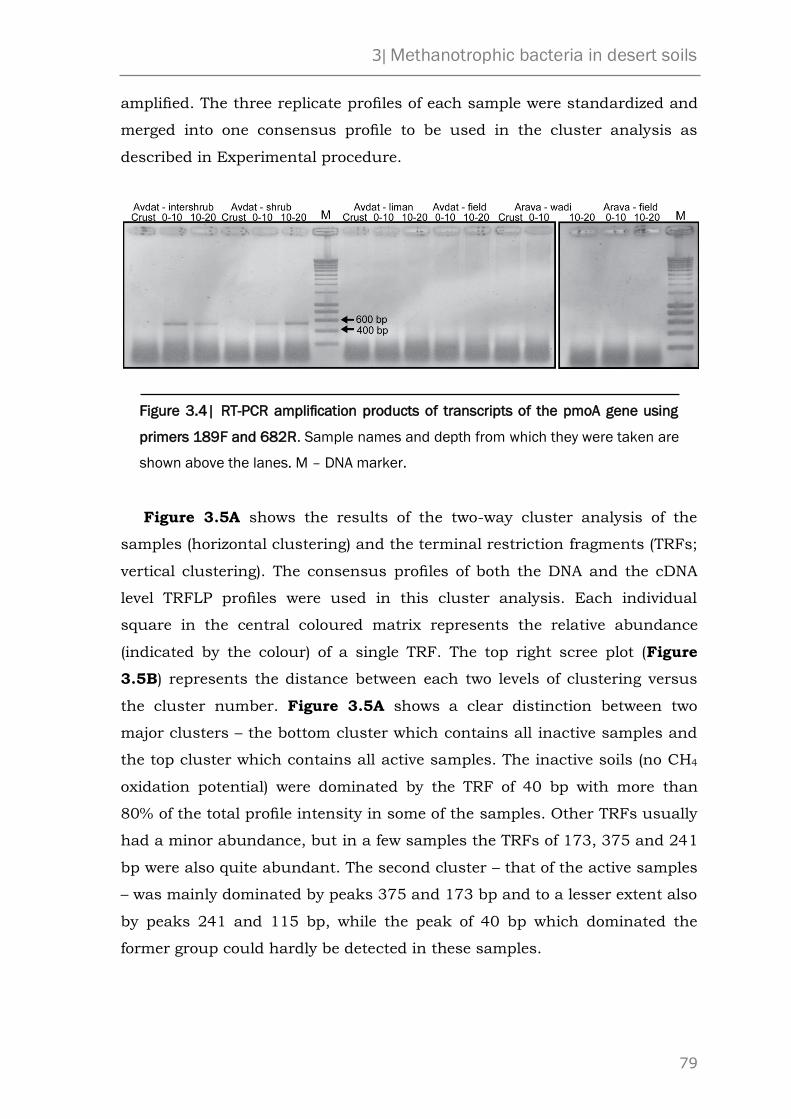
3| Methanotrophic bacteria in desert soils
79
amplified. The three replicate profiles of each sample were standardized and
merged into one consensus profile to be used in the cluster analysis as
described in Experimental procedure.
Figure 3.4| RT-PCR amplification products of transcripts of the pmoA gene using
primers 189F and 682R. Sample names and depth from which they were taken are
shown above the lanes. M – DNA marker.
Figure 3.5A shows the results of the two-way cluster analysis of the
samples (horizontal clustering) and the terminal restriction fragments (TRFs;
vertical clustering). The consensus profiles of both the DNA and the cDNA
level TRFLP profiles were used in this cluster analysis. Each individual
square in the central coloured matrix represents the relative abundance
(indicated by the colour) of a single TRF. The top right scree plot (Figure
3.5B) represents the distance between each two levels of clustering versus
the cluster number. Figure 3.5A shows a clear distinction between two
major clusters – the bottom cluster which contains all inactive samples and
the top cluster which contains all active samples. The inactive soils (no CH4
oxidation potential) were dominated by the TRF of 40 bp with more than
80% of the total profile intensity in some of the samples. Other TRFs usually
had a minor abundance, but in a few samples the TRFs of 173, 375 and 241
bp were also quite abundant. The second cluster – that of the active samples
– was mainly dominated by peaks 375 and 173 bp and to a lesser extent also
by peaks 241 and 115 bp, while the peak of 40 bp which dominated the
former group could hardly be detected in these samples.

3| Methanotrophic bacteria in desert soils
80
Figure 3.5| A. Two-way cluster analysis of the consensus profiles of samples
(horizontal clustering) and TRFs (vertical clustering) with a heat map (middle). Each
row represents a sample while each column – a TRF. Heat map colours represent
relative abundance of the TRFs. The clustering was performed using weighted
arithmetic average clustering (WPGMA) methods on Euclidean distance matrix of
the standardized and transformed TRFLP profiles (see Experimental procedure). B.
Scree plot showing the distance between each two hierarchical clusters versus
cluster number. AV, Avdat; KT, Arava; S, shrub; IS, intershrub; Lim, liman; cr, crust;
0–10 and 10–20, depth in cm.
The peak of 375 bp tended to be more dominant in the intershrub samples
compared with the shrub samples and also to be more dominant in the
cDNA profiles compared with the DNA profiles of each sample.
For the taxonomic affiliation of the different TRFs, a phylogenetic
maximum likelihood tree was constructed from the sequences (Figure 3.6).
In parallel, an in silico analysis of the sequences was performed to determine
their expected terminal restriction sites. This allowed the affiliation of
individual TRFs to pmoA sequences. The TRFs of 40 and 110 bp, which
dominated all inactive samples, were affiliated to amoA rather than pmoA.
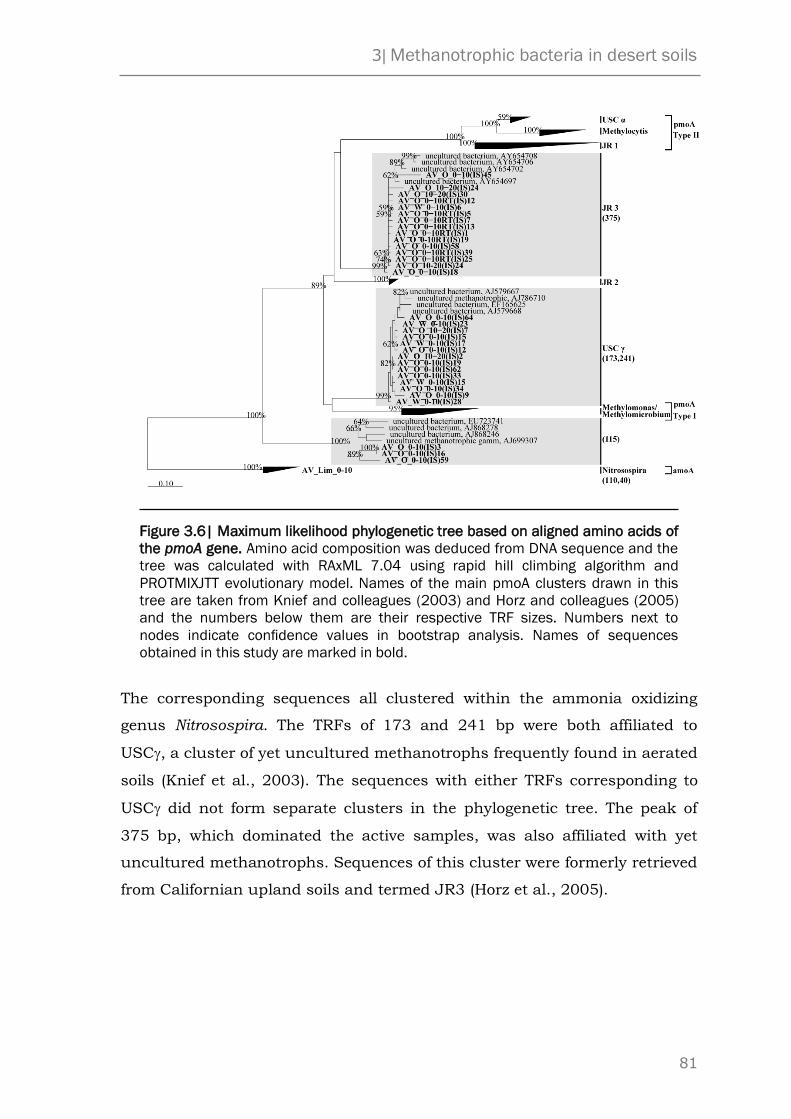
3| Methanotrophic bacteria in desert soils
81
Figure 3.6| Maximum likelihood phylogenetic tree based on aligned amino acids of
the pmoA gene. Amino acid composition was deduced from DNA sequence and the
tree was calculated with RAxML 7.04 using rapid hill climbing algorithm and
PROTMIXJTT evolutionary model. Names of the main pmoA clusters drawn in this
tree are taken from Knief and colleagues (2003) and Horz and colleagues (2005)
and the numbers below them are their respective TRF sizes. Numbers next to
nodes indicate confidence values in bootstrap analysis. Names of sequences
obtained in this study are marked in bold.
The corresponding sequences all clustered within the ammonia oxidizing
genus Nitrosospira. The TRFs of 173 and 241 bp were both affiliated to
USC, a cluster of yet uncultured methanotrophs frequently found in aerated
soils (Knief et al., 2003). The sequences with either TRFs corresponding to
USC did not form separate clusters in the phylogenetic tree. The peak of
375 bp, which dominated the active samples, was also affiliated with yet
uncultured methanotrophs. Sequences of this cluster were formerly retrieved
from Californian upland soils and termed JR3 (Horz et al., 2005).
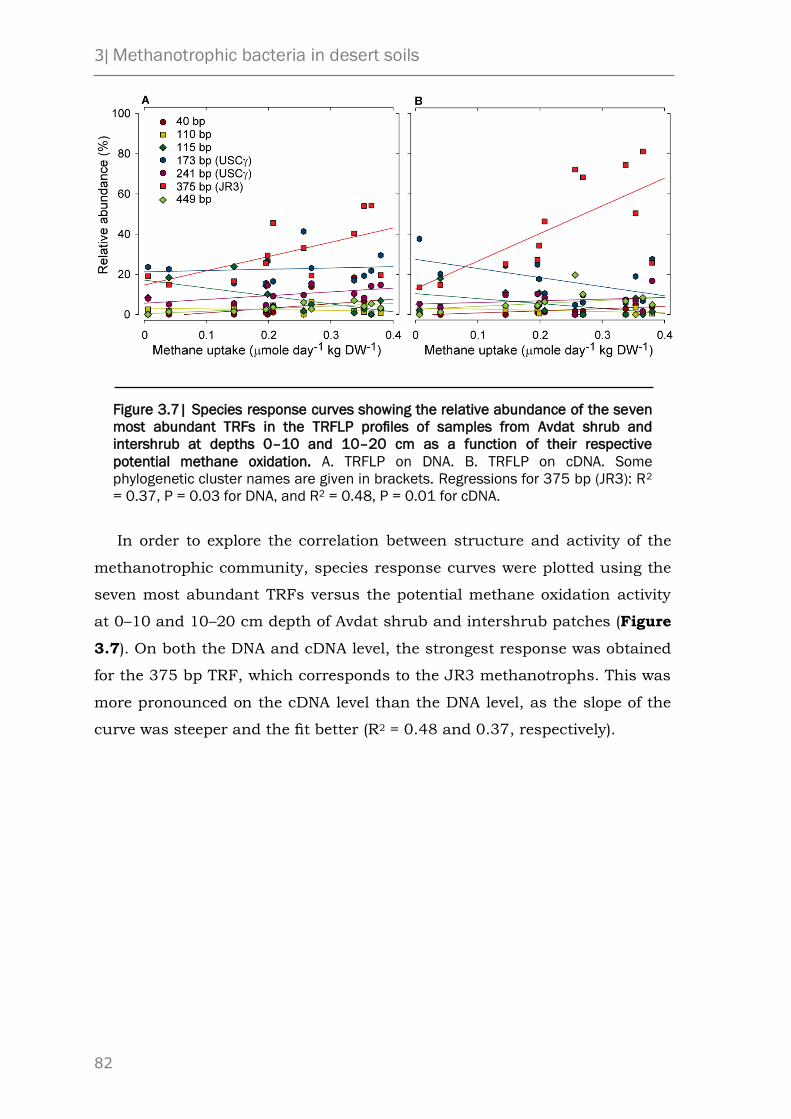
3| Methanotrophic bacteria in desert soils
82
Figure 3.7| Species response curves showing the relative abundance of the seven
most abundant TRFs in the TRFLP profiles of samples from Avdat shrub and
intershrub at depths 0–10 and 10–20 cm as a function of their respective
potential methane oxidation. A. TRFLP on DNA. B. TRFLP on cDNA. Some
phylogenetic cluster names are given in brackets. Regressions for 375 bp (JR3): R2
= 0.37, P = 0.03 for DNA, and R2 = 0.48, P = 0.01 for cDNA.
In order to explore the correlation between structure and activity of the
methanotrophic community, species response curves were plotted using the
seven most abundant TRFs versus the potential methane oxidation activity
at 0–10 and 10–20 cm depth of Avdat shrub and intershrub patches (Figure
3.7). On both the DNA and cDNA level, the strongest response was obtained
for the 375 bp TRF, which corresponds to the JR3 methanotrophs. This was
more pronounced on the cDNA level than the DNA level, as the slope of the
curve was steeper and the fit better (R2 = 0.48 and 0.37, respectively).
3| Methanotrophic bacteria in desert soils
83
3.4 Discussion
We measured atmospheric methane uptake and characterized the active
methanotrophic community in different soils from an arid and a hyperarid
region in the Negev Desert, Israel. These soils included natural sites as well
as disturbed sites, such as agricultural fields and a liman (constructed mini-
catchment). Our field work showed that the natural site in the arid region
(Avdat) of the Negev Desert was an active sink for atmospheric methane. The
CH4 uptake rates measured in shrub and intershrub patches were
comparable to those measured by Striegl and colleagues (1992) in the
Mojave Desert, USA, who reported average values ranging from 18.7 mol
CH4 m-2 d-1 for dry soils to 116.6 mol CH4 m-2 d-1 for soils after
precipitation. However, all the other sites in the Negev Desert, i.e. disturbed
sites in the arid region and both disturbed and natural sites in the hyperarid
region (Arava), did not exhibit CH4 uptake from the atmosphere. Vertical
profiles of CH4 concentrations in the soil largely corroborated these results.
For the Avdat natural site CH4 concentrations decreased with soil depth
indicating that the active layer was between 0 and 20 cm depth, which is in
agreement with what has been reported for other soils such as temperate
forests (Koschorreck and Conrad, 1993; Butterbach-Bahl and Papen, 2002),
montane (Torn and Harte, 1996) and meadow soils (Bender and Conrad,
1994). In contrast, the hyperarid soils showed no decrease in CH4
concentration down to 1 m depth being consistent with the lack of CH4
uptake from the atmosphere. The Liman site in the arid region, on the other
hand, exhibited a steep CH4 gradient in the vertical soil profile, but no CH4
uptake. Right at the soil surface, the CH4 gradient was close to zero. We
assume that this was the reason why CH4 was not taken up from the
atmosphere. The lacking CH4 gradient just below the soil surface may be an
indication for a shallow zone of CH4 production, which is reasonable due to
the fact that the liman is periodically flooded. Indeed, we found a marked
potential for CH4 production in this soil layer (publication in preparation). In
addition, it is also possible that the methanotrophic layer in this site lies
below 20 cm depth. Indeed, the vertical profiles show a decrease in CH4
concentration down to a depth of 40 cm, which is below the sampling layers.

3| Methanotrophic bacteria in desert soils
84
If indeed methanotrophs reside at a deeper layer, this can explain our
inability to detect any methane oxidation activity or pmoA genes in the soil
samples taken. The agricultural field in the arid region showed a relatively
flat gradient down to more than 1 m depth indicating that a zone with
methanotrophic activity may exist in >1m depth, but this deep zonation did
not result in detectable CH4 uptake within the 80 min during which the flux
chambers were closed. Cultivated and disturbed soils are known to show
lower rates of methane oxidation compared with native soils; however, the
reason is yet unclear (Jensen and Olsen, 1998; Knief et al., 2005). A possible
explanation may be that the continuous ploughing of the soil disrupts the
active layer of methanotrophs which then translocate to deeper soil causing
a longer diffusion path and thus lower CH4 flux.
We were also able to show a response to increased soil moisture of the
natural soil in the arid region. After an initial drop in CH4 uptake rate which
was probably caused by diffusion limitation due to the saturation of the soil
with water, CH4 uptake increased with time. This observation is in
agreement with a unimodal response of soil CH4 uptake to water content
(Schnell and King, 1996; Torn and Harte, 1996) resulting from the increase
in metabolic activity with increasing soil water content on the one hand and
the reduced methane diffusion coefficient on the other hand.
The results of the field observations were confirmed by potential CH4
oxidation experiments. Here also, only the soil samples from the natural site
at Avdat showed potential activity at 0–10 and 10–20 cm depth.
Interestingly, this experiment showed lack of any CH4 oxidation activity in
the crust layer. This, together with the TRFLP profiles, which showed nearly
no methanotrophs in the crust samples, provides strong evidence for the
absence of methanotrophs in the crust layer. This is a surprising result,
since the crust layer in drylands is thought to be the biologically most active
and diverse layer in the soil (Skujins, 1991). However, many studies have
shown that the top layers of soils usually contain a considerably lower
activity compared with subsurface soil or lack it completely (Adamsen and
King, 1993; Koschorreck and Conrad, 1993).
The primer set (189F-682R) which was used for amplification of pmoA
gene of methanotrophs is known to target also some sequences of the amoA

3| Methanotrophic bacteria in desert soils
85
gene present in ammonia oxidizers (Bourne et al., 2001). The attempts to
obtain an amplification product from a DNA template using this primer set
were successful for all samples regardless of whether they showed activity or
not. However, the community composition in the samples being inactive in
CH4 oxidation was comprised almost solely of ammonia oxidizers (amoA
gene). In the active soils, on the other hand, amoA accounted for less than
10% and pmoA for more than 90% of the total TRFLP profiles’ intensity. The
attempts to amplify transcripts using these primers were, in contrast,
successful only for the samples with active CH4 oxidation.
We observed only a limited diversity of the pmoA gene in our soils. All
pmoA sequences that were retrieved clustered in the phylogenetic tree within
three different clusters of yet uncultivated methanotrophs, i.e. JR3, USC
and a yet unclassified cluster. In the TRFLP profiles cluster JR3 was
represented by a TRF of 375 bp of which the relative abundance reached >
50% in some of the profiles. This cluster was previously discovered in
grassland soils in California, but only as a minor member of a diverse
community of methanotrophs (Horz et al., 2005). These authors reported
cluster JR1, JR2 and JR4 being the dominant group. Clusters JR1, JR2 and
JR4 were not detected in our soils. Instead we observed cluster USC
represented by the TRFs of 173 and 241 bp. USC reached over 30% in
relative abundance in some profiles. This cluster was previously described in
neutral and alkaline soils and was postulated to represent a high-affinity
methane oxidizer (Knief et al., 2003). Finally, we observed a cluster
represented by the TRF of 115 bp, reaching 20% in relative abundance in
some profiles.
We assume that cluster JR3 is the most active methanotroph in the soils
from the arid region of the Negev Desert. The relative abundance of cluster
JR3 showed a significantly positive relation with the potential CH4 oxidation
activity. While this relation was shown for both DNA-based and cDNA-based
TRFs, the stronger response was found for the latter. Since mRNA
transcripts are assumed to be a proxy for metabolic activity, one may expect
higher expression for the more active members of the community. While
relative abundance in TRFLP profiles is not a quantitative measure of the
template, it is reasonable to assume that the most active members in a
3| Methanotrophic bacteria in desert soils
86
community will exceed the rest in relative abundance as well as in absolute
abundance.
It is also worth mentioning that the TRFs of 375 and 173 bp were present
in significant relative abundances at 0–10 and 10–20 cm depths at the site
of Arava wadi. While these samples did not show any CH4 uptake or
potential CH4 oxidation activity, nor were we able to detect pmoA transcripts
in them, methanotrophs of the clusters JR3 and USC might be activated
given the right conditions (e.g. after rain) and then be able to consume CH4
and result in CH4 uptake from the atmosphere.
Conclusion
The soil methane sink is of great importance for the global cycle of the
greenhouse gas methane. However, the notion that aerated soils are usually
a sink for atmospheric CH4 is not necessarily true for soils in arid and
hyperarid regions, where uptake of CH4 from the atmosphere, potential CH4
oxidation activity and transcription of the pmoA gene could be demonstrated
only at some of the studied field sites. In addition, pmoA cluster JR3 may be
the most important methane oxidizer for arid soils. Although the identity of
these bacteria is yet unknown, the notion of their importance may be crucial
for future understanding of factors governing their behaviour and that of the
methane sink in arid soils.

3| Methanotrophic bacteria in desert soils
87
3.5 Experimental procedure
Sites description
The arid and hyperarid regions which were studied are both located in the
Negev Desert, Israel. Avdat – the arid region – is located on the Negev Desert
Plateau in proximity to the town of Mitzpe Ramon. The area is elevated and
hilly (approximately 800 m) with a mean annual precipitation (P) of 89.5 mm
(between 1989 and 2007) and soil surface temperatures ranging from 9 °C
(January) to 32 °C (July) [Israel Space Agency (English), http://
nasa.proj.ac.il/, and desert meteorology group, Ben-Gurion University of the
Negev (Hebrew) http://bidr.bgu.ac.il/bidr/research/phys/meteorology/
index.html]. The potential evapotranspiration (PET) for this region is
estimated at 1600–1800 mm yr-1 (Gvirtzman, 2002) giving an aridity index
(AIU = P/PET) of 0.053 which classifies it as arid (Ffolliott et al., 2003). The
landscape is characterized by patchy shrub vegetation dominated by the
shrub H. scoparia. Three sites were measured and sampled in this region: (i)
a natural site where both H. scoparia shrub and intershrub patches were
measured and sampled, (ii) a constructed mini-catchment (Liman) planted
with Cupressus sempervirens, Ziziphus spina-christi and Balanites
aegyptiaca trees, and (iii) an agricultural field.
Arava – the hyperarid region – is located in the southern part of the Arava
Valley close to Kibbutz Ketura. The area is a sea-level valley with an average
annual precipitation of 22.9 mm (between 1989 and 2007) and soil surface
temperatures ranging from 27.1 °C (January) to 48.4 °C (July) [Israel Space
Agency (English), and Arava R&D (Hebrew),
http:// www.arava.co.il/haklaut/]. The potential evapotranspiration for this
region is estimated at 2400–2600 mm yr-1 (Gvirtzman, 2002) giving an
aridity index of 0.009 which classifies it as hyperarid. The landscape is
mostly barren with sparse Accacia tortilis trees. Two sites were measured
and sampled in this region: (i) natural wadi soil close to a patch of A. tortilis
trees and (ii) an agricultural field. The exact geographic coordinates for these
sites are given in Table 3.1. Physicochemical characterization Gravimetric
water content was determined by drying 50 g of soil at 110 °C until reaching
3| Methanotrophic bacteria in desert soils
88
equilibrium of weight. pH was determined on a 1:1 dry soil/water mixture
tilted for 2 h. Soil content of total carbon and total nitrogen were analysed
using a CN analyser by the Analytical Chemical Laboratory of the Philipps-
Universität, Marburg, after treatment with 10% HCl. Grain size distribution
was determined using the laser diffraction method by the Chair of Physical
Geography and Geoecology at the Aachen University. Physicochemical
characteristics of the soil samples are given in Table 3.1.
Field measurements
Atmospheric methane flux was measured using the closed chamber method
(Hutchinson and Livingston, 2001; Davidson et al., 2002): a steel frame of
36 by 36 cm was hammered 20 cm into the ground, and covered by a
transparent 40 by 40 by 14 cm Plexiglas box. Degassed water was used in
the interface between the cover and the frame to minimize gas exchange
between the trapped air and the atmosphere. Two butyl rubber septa were
installed on the top part of the box; one had a 12 cm syringe needle inserted
in it to be used as a pressure vent while the other was used as a sampling
port. The whole chamber was covered with an Emergency Isothermal
Blanket to minimize temperature changes inside the chamber as well as to
prevent any potential effects of direct sunlight. Vertical methane profiles in
soil were determined using a gas sampling corer. The corer was made of a
stainless steel tube (120 cm, 0.4″) to which a 1/16 inch stainless steel
capillary was welded from the inside. The tube was capped on its bottom
leaving a 1 cm edge of the capillary to minimize dead volume. A 5 cm
punctured stainless steel tip was screwed to the bottom of the tube for
protection. Gas samples of 20 ml were taken in duplicates from the chamber
(directly) and the corer (after disposing one sample to rid the dead volume)
using a plastic syringe. The sampled gas was immediately transferred to a
25 ml glass vial filled completely with saturated NaCl solution and capped
with a butyl rubber stopper (the butyl stoppers had been boiled in water
before usage). The solution was then partially displaced by the gas sample
through a second needle. The vials were kept upside down in Styrofoam
racks with the gas bubble in contact with the glass and the remaining NaCl
solution only. Samples were analysed within 12 h from sampling using an

3| Methanotrophic bacteria in desert soils
89
SRI gas chromatograph equipped with a flame ionization detector (SRI). The
method’s detection limit was estimated at 3 × 10⁻³ mol L-1. Predictions of
CH4 fluxes from the vertical concentration profiles were calculated using
Fick’s first law of diffusion:
jCH4 = DoCH4 D/Do CCH4, (1)
where jCH4 is the CH4 consumption flux (mmol d-1 m-2), DoCH4 is the
diffusion coefficient of CH4 in air, D/Do is the normalized diffusivity in
aggregated media, and ΔCCH4 is the change in the methane concentration in
the relevant soil section (mmol cm-1). DoCH4 was taken from Potter and
colleagues (1996). D/Do was estimated at 0.13 for dry medium/coarse soils,
also following Potter and colleagues (1996).
Artificial raining experiment
One metal frame was hammered into the ground at an intershrub patch at
Avdat natural site and methane flux was determined over 45 min as
described above. Afterwards, 15 mm of deionized water were sprinkled on an
area of 1 m2 whose centre was the frame. The area was allowed to drain and
a second measurement of methane flux was taken. The following
measurements were taken at 12 h intervals. Sample collection, handling and
transfer Samples of approximately 250 g where collected in triplicates, ~30
m apart, from each site at depths of 0–10 and 10–20 cm filled into Whirl-
Pak® bags (Nasco). In addition, the topmost layer – the desert crust – was
also collected except in the agricultural fields where it did not exist. For
nucleic acid extraction, approximately 750 ml of soil from the same patches
was collected into 1.5 ml tubes containing 1 ml of RNAlater® solution
(Ambion). The tubes were stored at -80 °C upon arrival to the lab and were
later transported on wet ice back to Germany.
3| Methanotrophic bacteria in desert soils
90
Potential methane oxidation measurements
Ten grams of each replicate soil sample was incubated in a 120 ml glass
serum bottle and was amended with 1 ml of sterile double-distilled water.
The bottles were capped with butyl rubber stoppers and kept at 25 °C in the
dark for 14 days. Gas samples were taken with a glass syringe and analysed
for methane concentration using an SRI gas chromatograph equipped with a
flame ionization detector.
Total nucleic acids extraction
Total nucleic acids were extracted from 0.5 g of the preincubated soil
samples (preserved in RNAlater® solution) using a modified version of the
method described by Bürgmann and colleagues (2003). For the extraction
buffer, 2.5% sodium dodecyl sulfate (SDS) was used instead of
hexadecyltrimethylammonium bromide (CTAB). For PCR amplification of
DNA, the crude extract was used directly, whereas for cDNA synthesis RNA
was purified the following way: following extraction of total nucleic acids,
87.5 ml of the crude extract was treated with DNase I (Qiagen) according to
the manufacturer’s instructions and was purified using RNeasy MinElute
Cleanup Kit (Qiagen) and quantified using a NanoDrop 1000
spectrophotometer (Thermo). Complete DNA removal was verified by failure
to obtain PCR amplification product with the purified RNA template using
the conditions described below.
cDNA synthesis and PCR amplification
Complete cDNA was synthesized using ImProm-II™ Reverse Transcriptase
(Promega) by the following procedure: 10 ng of purified RNA and 0.5 g/l of
random hexamer primers were incubated at 70 °C for 5 min followed by 5
min chilling on ice. The following mixture was then directly added to the
tubes: 4 l of 5× ImProm-II™ Reaction Buffer, 3 mM MgCl2, 0.5 mM of each
dNTP, 20 g of bovine serum albumin (BSA; Roche) and 20 U of
Recombinant RNasin Ribonuclease Inhibitor (Promega). The reaction tubes
were incubated at 25 °C for 5 min followed by 52 °C for 1 h, and then
denaturation at 70 °C for 15 min. The resulting cDNA product was used

3| Methanotrophic bacteria in desert soils
91
directly as a template for consecutive PCR reactions. PCR amplification was
performed identically for both DNA and cDNA templates. The primer pairs
A189f and A682r (Holmes et al., 1995), targeting a segment of the pMMO
gene, were used. This primer pair had been successfully used in previous
studies to target upland soil methanotrophs not detected by other primers
(McDonald et al., 2008). For TRFLP analysis the forward primer was labelled
with the fluorescent dye 6-FAM (6-carboxyfluorescein). PCR reactions were
conducted in triplicates of 50 l which were later combined to minimize
reaction bias. Each PCR reaction contained 5 l of 10× AccuPrime™ PCR
Buffer I or II (for the amplification of cDNA and DNA templates, respectively;
Invitrogen), additional 1.5 mM MgCl2 (to a final concentration of 3 mM), 0.5
mM of each primer (Sigma), 50 g of BSA (Roche), 1 l of Taq DNA
polymerase (Invitrogen) and 2 l of template. The following programme was
used: 94 °C for 4 min followed by 10 touch-down cycles of 94 °C for 1 min,
62 °C - 52 °C for 1 min and 68 °C for 1 min followed by 25 cycles of 94 °C for
1 min, 52 °C for 1 min and 68 °C for 1 min, and a single step of final
elongation at 68 °C for 10 min. After amplification, the triplicate PCR
reactions were pooled and loaded on 1.2% agarose gel stained with ethidium
bromide. The right-sized fragments were excised and the DNA was eluted
using GeneElute™ Gel Extraction Kit (Sigma) and quantified on a NanoDrop
1000 Spectrophotometer.
Cloning and sequencing and phylogenetic analysis
Samples Avdat-intershrub 0–10 cm (DNA and cDNA) and 10–20 (DNA),
Avdat-shrub 0–10 cm (DNA), and 0–10 cm of the liman (DNA) were used for
cloning. Libraries were constructed using cleaned PCR products and pGEM-
T Easy cloning kit (Promega). Sequencing service was provided by ADIS
(Cologne, Germany) using the primers T7f and M13r targeting flanking
regions of the insert. A total of 134 clones were analysed: 25 from the
AV_W_0–10_I_D library, 13 from the AV_Lim_0–10_I_D library, 51 from the
AV_O_0–10_I_D library, 23 from the AV_O_0–10_I_RT library and 22 from
the AV_O_10–20_III_D library. All sequences were deposited into the
GenBank® (http://www.ncbi.nlm.nih.gov) and received the following
Accession No.: FJ970508–FJ970626. Raw sequence data were analysed
3| Methanotrophic bacteria in desert soils
92
using SeqMan software (DNAStar) where the primers and vector data were
trimmed. Using ARB, sequences were converted to amino acid sequences
and aligned against an ARB database of publicly available pmoA sequences
obtained from EMBL Nucleotide Sequence Database. Reconstruction of a
maximum likelihood phylogenetic tree was conducted with RAxML 7.04
using rapid hill climbing algorithm and PROTMIXJTT evolutionary model
(http://icwww.epfl.ch/~stamatak/index-Dateien/Page443.htm; Stamatakis,
2006).
TRFLP analysis
Approximately 200 ng of cleaned PCR products were digested overnight at 37
°C with 20 U of the restriction enzyme MspI and 2 l of 10× Buffer Tango™
(Fermentas). Following digestion, samples were desalted on SigmaSpin™
Post-Reaction Clean-up Columns (Sigma, Germany); aliquots of 3 ml were
mixed with 10 ml of HiDi™ Formamide (Applied Biosystems) and 0.3 ml of
the internal DNA standard MapMarker®1000 (BioVentures). The samples
were denatured at 94 °C for 2 min and loaded into an ABI 3100 automated
gene sequencer (Applied Biosystems) for separation of the TRFs. TRFLP data
were retrieved by comparison with the internal standard using GeneScan
3.71 software (Applied Biosystems).
Analysis of TRFLP data and cluster analysis
Raw TRFLP cannot be used directly for statistical analysis. Therefore, the
following standardization and normalization procedures were applied prior to
all statistical analyses. The size in base pairs of each peak (TRF) was used to
indicate an operational taxonomic unit (OTU) while the peak’s area was used
to determine its relative abundance in the profile. The TRFLP patterns of the
triplicates of each sample were standardized as described elsewhere (Dunbar
et al., 2001). Profiles were then aligned and a consensus profile was
computed for each sample from its replicates by eliminating non-
reproducible peaks and averaging shared peaks. The standardization
procedure was then applied again to standardize the consensus profiles and
they were aligned to generate a sample by species matrix which was used in

3| Methanotrophic bacteria in desert soils
93
the cluster. TRFLP data set poses another problem by the presence of many
null values in the matrix. These are treated as genuine zero value
observations in the computation procedure and could lead to an
overestimation of the similarity between samples. Following Legendre and
Gallagher (2001) the matrix was therefore transformed to give Hellinger
distances between the samples when Euclidean distances are computed.
Cluster analysis was then performed on the transformed data set using a
Euclidean distance matrix and the weighted arithmetic average clustering
(WPGMA) clustering methods. All standardization and normalization
procedures were performed using MATLAB (http://www.mathworks.com)
and the codes are available at http://www.staff.uni-marburg.de/~angel.

3| Methanotrophic bacteria in desert soils
94
3.6 References
Adamsen, A.P.S., and King, G.M. (1993) Methane consumption in temperate and
subarctic forest soils: rates, vertical zonation, and responses to water and nitrogen. Appl
Environ Microbiol 59: 485–490.
Baani, M., and Liesack, W. (2008) Two isozymes of particulate methane monooxygenase
with different methane oxidation kinetics are found in methylocystis sp. strain SC2. Proc
Natl Acad Sci USA 105: 10203–10208.
Bender, M., and Conrad, R. (1993) Kinetics of methane oxidation in oxic soils.
Chemosphere 26: 687–696.
Bender, M., and Conrad, R. (1994) Methane oxidation activity in various soils and
freshwater sediments: occurrence, characteristics, vertical profiles, and distribution on
grain size fractions. J Geophys Res 99: 16531–16540.
Bourne, D.G., McDonald, I.R., and Murrell, J.C. (2001) Comparison of pmoA PCR primer
sets as tools for investigating methanotroph diversity in three Danish soils. Appl
Environ Microbiol 67: 3802–3809.
Bowman, J. (2006) The methanotrophs – the families Methylococcaceae and
Methylocystaceae. In The Prokaryotes. Dworkin, M., Falkow, S., Rosenberg, E.,
Schleifer, K.H., and Stackebrandt, E. (eds). New York, NY, USA: Springer, pp. 266–289.
Bürgmann, H., Widmer, F., Sigler, W.V., and Zeyer, J. (2003) mRNA extraction and
reverse transcription-PCR protocol for detection of nifH gene expression by Azotobacter
vinelandii in soil. Appl Environ Microbiol 69: 1928–1935.
Butterbach-Bahl, K., and Papen, H. (2002) Four years continuous record of CH4-
exchange between the atmosphere and untreated and limed soil of a N-saturated spruce
and beech forest ecosystem in Germany. Plant Soil 240:77–90.
Davidson, E.A., Savage, K., Verchot, L.V., and Navarro, R. (2002) Minimizing artifacts
and biases in chamber-based measurements of soil respiration. Agric Forest Meteorol
113: 21–37.
Dunbar, J., Ticknor, L.O., and Kuske, C.R. (2001) Phylogenetic specificity and
reproducibility and new method for analysis of terminal restriction fragment profiles of
16S rRNA genes from bacterial communities. Appl Environ Microbiol 67: 190–197.
Dunfield, P.F. (2007) The soil methane sink. In Greenhouse Gas Sinks. Reay, D., Hewitt,
C.N., Smith, K.A., and Grace, J. (eds). Oxfordshire, UK: CABI, pp. 152–170.

3| Methanotrophic bacteria in desert soils
95
Dunfield, P.F., Yuryev, A., Senin, P., Smirnova, A.V., Stott, M.B., Hou, S., et al. (2007)
Methane oxidation by an extremely acidophilic bacterium of the phylum
Verrucomicrobia. Nature 450: 879–882.
Ffolliott, P.F., Dawson, J.O., Fisher, J.T., Moshe, I., Fulbright, T.E., Al Musa, A., et al.
(2003) Dryland environments. In Proceedings of the IALC Conference and Workshop,
Assessing Capabilities of Soil and Water Resources in Drylands: The Role of Information
Retrieval and Dissemination Technologies. Tucson, AZ, USA: IALC, pp. 3–18.
Garcia Pichel, F. (2002) Desert environments: biological soil crusts. In Encyclopedia of
Environmental Microbiology 6 Volume Set. Bitton, G. (ed). New York, NY, USA: Wiley
Interscience, pp. 1119–1023.
Gvirtzman, H. (2002) Israel Water Resources, Chapters in Hydrology and Environmental
Sciences. Jerusalem, Israel: Yad Ben-Zvi Press.
Henckel, T., Friedrich, M., and Conrad, R. (1999) Molecular analyses of the methane-
oxidizing microbial community in rice field soil by targeting the genes of the 16S rRNA,
particulate methane monooxygenase, and methanol dehydrogenase. Appl Environ
Microbiol 65: 1980–1990.
Henckel, T., Jäckel, U., Schnell, S., and Conrad, R. (2000) Molecular analyses of novel
methanotrophic communities in forest soil that oxidize atmospheric methane. Appl
Environ Microbiol 66: 1801–1808.
Holmes, A.J., Costello, A., Lidstrom, M.E., and Murrell, J.C. (1995) Evidence that
participate methane monooxygenase and ammonia monooxygenase may be
evolutionarily related. FEMS Microbiol Lett 132: 203–208.
Holmes, A.J., Roslev, P., McDonald, I.R., Iversen, N., Henriksen, K., and Murrell, J.C.
(1999) Characterization of methanotrophic bacterial populations in soils showing
atmospheric methane uptake. Appl Environ Microbiol 65: 3312–3318.
Horz, H., Rich, V., Avrahami, S., and Bohannan, B.J.M. (2005) Methane-oxidizing
bacteria in a California upland grassland soil: diversity and response to simulated global
change. Appl Environ Microbiol 71: 2642–2652.
Hutchinson, G.L., and Livingston, G.P. (2001) Vents and seals in non-steady-state
chambers used for measuring gas exchange between soil and the atmosphere. Eur J
Soil Sci 52: 675–682.
Jensen, S., and Olsen, R.A. (1998) Atmospheric methane consumption in adjacent
arable and forest soil systems. Soil Biol Biochem 30: 1187–1193.

3| Methanotrophic bacteria in desert soils
96
Khalil, M.A.K. (2000) Atmospheric Methane: Its Role in the Global Environment. Berlin,
Germany: Springer.
King, G.M., and Adamsen, A.P.S. (1992) Effects of temperature on methane
consumption in a forest soil and in pure cultures of the methanotroph Methylomonas
rubra. Appl Environ Microbiol 58: 2758–2763.
Knief, C., Lipski, A., and Dunfield, P.F. (2003) Diversity and activity of methanotrophic
bacteria in different upland soils. Appl Environ Microbiol 69: 6703–6714.
Knief, C., Vanitchung, S., Harvey, N.W., Conrad, R., Dunfield, P.F., and Chidthaisong,
A. (2005) Diversity of methanotrophic bacteria in tropical upland soils under different
land uses. Appl Environ Microbiol 71: 3826–3831.
Kolb, S., Knief, C., Dunfield, P.F., and Conrad, R. (2005) Abundance and activity of
uncultured methanotrophic bacteria involved in the consumption of atmospheric
methane in two forest soils. Environ Microbiol 7: 1150–1161.
Koschorreck, M., and Conrad, R. (1993) Oxidation of atmospheric methane in soil –
measurements in the field, in soil cores and in soil samples. Global Biogeochem Cycles
7:109–121.
Legendre, P., and Gallagher, E. (2001) Ecologically meaningful transformations for
ordination of species data. Oecologia 129: 271–280.
McDonald, I.R., Bodrossy, L., Chen, Y., and Murrell, J.C. (2008) Molecular ecology
techniques for the study of aerobic methanotrophs. Appl Environ Microbiol 74: 1305–
1315.
Mancinelli, R.L. (1995) The regulation of methane oxidation in soil. Annu Rev Microbiol
49: 581–605.
Menyailo, O.V., and Hungate, B.A. (2003) Interactive effects of tree species and soil
moisture on methane consumption. Soil Biol Biochem 35: 625–628.
Middleton, N., and Thomas, D. (1997) World Atlas of Desertification, 2nd edn. UNEP,
London. Nairobi, Kenya: United Nations Environment Programme.
Murrell, J., McDonald, I.R., and Bourne, D.G. (1998) Molecular methods for the study of
methanotroph ecology. FEMS Microbiol Ecol 27: 103–114.
Murrell, J.C., Gilbert, B., and McDonald, I.R. (2000) Molecular biology and regulation of
methane monooxygenase. Arch Microbiol 173: 325–332.
3| Methanotrophic bacteria in desert soils
97
Navone, S., and Abraham, E. (2006) State and trends of the world’s deserts. In Global
Deserts Outlook. Ezcurra, E. (ed.). Nairobi, Kenya: United Nations Environment
Programme, pp. 73–88.
Peters, V., and Conrad, R. (1996) Sequential reduction processes and initiation of CH4
production upon flooding of oxic upland soils. Soil Biol Biochem 28: 371–382.
Potter, C.S., Davidson, E.A., and Verchot, L.V. (1996) Estimation of global
biogeochemical controls and seasonality in soil methane consumption. Chemosphere
32: 2219–2246.
Prather, M., Ehhalt, D., Dentener, F., Derwent, R., Dlugokencky, E., Holland, E., et al.
(2001) Atmospheric chemistry and greenhouse gases. In Climate Change 2001: The
Scientific Basis. Contribution of Working Group I to the
Third Assessment Report of the Intergovernmental Panel on Climate Change. Houghton,
J., Ding, Y., Gripps, M., Noguer, M., van der Linden, P., Dai, X., et al. (eds). Cambridge,
UK: Cambridge University Press, pp. 239–288 (881).
Reay, D.S., Radajewski, S., Murrell, J.C., McNamara, N., and Nedwell, D.B. (2001)
Effects of land-use on the activity and diversity of methane oxidizing bacteria in forest
soils. Soil Biol Biochem 33: 1613–1623.
Reay, D.S., Nedwell, D.B., McNamara, N., and Ineson, P. (2005) Effect of tree species on
methane and ammonium oxidation capacity in forest soils. Soil Biol Biochem 37: 719–
730.
Schnell, S., and King, G. (1996) Responses of methanotrophic activity in soils and
cultures to water stress. Appl Environ Microbiol 62: 3203–3209.
Skujins, J. (1991) Semiarid Lands and Deserts: Soil Resource and Reclamation. New
York, NY, USA: Marcel Dekker.
Smith, K.A., Dobbie, K.E., Ball, B.C., Bakken, L.R., Sitaula, B.K., Hansen, S., et al.
(2000) Oxidation of atmospheric methane in northern European soils, comparison with
other ecosystems, and uncertainties in the global terrestrial sink. Global Change Biol 6:
791–803.
Stamatakis, A. (2006) RAxML-vi-hpc: maximum likelihood-based phylogenetic analyses
with thousands of taxa and mixed models. Bioinformatics 22: 2688–2690.
Striegl, R.G., McConnaughey, T.A., Thorstenson, D.C., Weeks, E.P., and Woodward, J.C.
(1992) Consumption of atmospheric methane by desert soils. Nature 357: 145–147.
Tate, K., Ross, D., Saggar, S., Hedley, C., Dando, J., Singh,

3| Methanotrophic bacteria in desert soils
98
B., and Lambie, S. (2007) Methane uptake in soils from Pinus radiata plantations, a
reverting shrubland and adjacent pastures: effects of land-use change, and soil texture,
water and mineral nitrogen. Soil Biol Biochem 39: 1437–1449.
Torn, M.S., and Harte, J. (1996) Methane consumption by montane soils: implications
for positive and negative feedback with climatic change. Biogeochemistry 32: 53–67.
West, A.E., and Schmidt, S.K. (1998) Wetting stimulates atmospheric CH4 oxidation by
alpine soil. FEMS Microbiol Ecol 25: 349–353.
Yavitt, J.B., Downey, D.M., Lang, G.E., and Sexston, A.J. (1990) Methane consumption
in two temperate forest soils. Biogeochemistry 9: 39–52.

99
Chapter 4| Methanogenic Archaea are Globally
Ubiquitous in Upland Soils and Become
Active Under Anoxic Conditions
Roey Angel, Peter Claus and Ralf Conrad
Max-Planck-Institute for Terrestrial Microbiology, Karl-von-Frisch-Strasse 10, Marburg,
D-35043, Germany
Contributions:
RA and RC designed the study and the sampling scheme; RA, RC and others
performed the sampling. RA and PC performed the soil incubations and isotopic
measurements. RA performed all molecular and data analyses; RA and RC wrote the
manuscript.
4| Methanogens in upland soil
100
4.1 Abstract
Members of the domain Archaea were once considered to inhabit mostly
extreme environments, a reminiscence of an ancient Earth in which they
supposedly originated. However in recent years, evidence accumulated for
the ubiquitous occurrence of Archaea (mostly Crenarchaeota) in many
temperate environments, such as upland soils. The prototypical
representatives of the Euryarchaeota – the methanogens – are particularly
sensitive to oxygen and are thought to occur only in highly reduced, anoxic
environments. In contrast to this textbook notion, we found methanogens of
the genera Methanosarcina and Methanocella to be present in many types of
upland (including dryland) soils sampled globally. These methanogens could
be readily activated by incubating the soils as slurry under anoxic
conditions, as seen by rapid methane production within a few days without
any additional carbon source. Analysis of the archaeal 16S rRNA gene
community profile and gene copy numbers indicated dominance of
Methanosarcina, and their 16S rRNA gene copy numbers correlated with
methane production rates. Analysis of the δ13C of the methane further
supported this as the dominant methanogenic pathway was in most cases
acetoclastic, which Methanocella cannot perform. Sequences of the key
methanogenic enzyme methyl-CoM reductase (mcrA) retrieved from the soil
samples prior to incubation confirmed that Methanosarcina and
Methanocella are the dominant methanogens, though some sequences of
Methanobrevibacter and Methanobacterium were also detected. The global
occurrence of only two methanogenic genera supports the hypothesis that
these are autochthonous members of the upland soil biome and are well
adapted to their environment.

4| Methanogens in upland soil
101
4.2 Introduction
The methanogenic Arachaea (methanogens) are the only known organisms
capable of producing methane. All known methanogens fall into the phylum
Euryarchaeota where they form six distinct orders: Methanomicrobiales,
Methanocellales, Methanosarcinales, Methanobacteriales, Methanococcales
and Methanopyralles. The pathways for generating methane in methanogens
vary and include: methanol and CO2 reduction, acetate cleavage as well as
methane production from a variety of methylated compounds. With the
exception of marine sediments and hypersaline mats (Oremland, 1988),
methanogenesis in natural systems is dominated by CO2 reduction
(hydrogenotrophic methanogenesis) and acetate cleavage (acetoclasitc
methanogenesis) while other pathways can be neglected (Conrad, 2005).
Methanogens are strict anaerobes and methanogenesis was shown to
be fully suppressed upon exposure to high levels of oxygen (Yuan et al.,
2009). In addition, the typical energetic yields for hydrogenotrophic and
acetoclasitc methanogenesis (G = -131 and -36 kJ, respectively) are lower
than those obtained by Iron, nitrate, and sulphate and reduction (G = -
228.3, -163.2 and -152.2 kJ, respectively) which compete with methanogens
over hydrogen (Thauer et al., 1977, 1989). As a result, methanogenesis
typically occurs only in highly reduced anoxic environments where oxygen is
absent and alternative electron acceptors such as nitrate and sulphate are
depleted (Whitman et al., 2006).
While the biochemical machinery in methanogens varies with the
pathway used, few functional genes which encode for key enzymes in the
production of methane are common to all known methanogens (Hedderich
and Whitman, 2006). Of those, the methyl coenzyme reductase M which is
responsible for the last step in all methanogenic pathways – the reduction of
the methyl group bound to the Methyl-Coenzyme M – is typically used as
functional gene marker for analysis of methanogenic communities (Luton et
al., 2002)
In contrast to the notions presented above, Peters and Conrad (1995)
demonstrated that several types of aerated soils could become methanogenic
when incubated under anoxic conditions as slurry. Among these soils was a
South African desert soil which was stored in dry state at room temperature

4| Methanogens in upland soil
102
for nearly 10 years prior to incubation. In a further experiment they
demonstrated that typical sequential reduction processes occurred in these
soils with nitrate, iron, manganese and sulphate depleted prior to onset of
methanogenesis (Peters and Conrad, 1996). The precursors for
methanogenesis were, however, present in sufficient concentrations in the
slurries before methanogenesis started indicating that the methanogenic
population was limited by size. Few others have reported the occurrence of
methanogenesis in aerated soils and/or the presence of methanogens. For
example West and Schmidt (2002) were able to induce methanogenesis in
alpine soils when incubated under H2 and CO2 enriched atmosphere (but not
under pure N2 atmosphere) and Teh and colleagues (2005) found
methanogenesis occurring in tropical forest soils containing up to 19% O2.
In two other cases, researchers measured methanogenic activity in pasture
soil and were able to retrieve sequences affiliated to methanogens (Radl et
al., 2007; Nicol et al., 2003; Gattinger et al., 2007). However, the authors
have attributed most of this activity to the effect livestock had on the soil by
enriching with nutrients from urine and manure and by inoculating the soil
with rumen microflora. Lastly, Poplawski and colleagues (2007) retrieved
sequences of Methanosarcina and Methanocella in a Swedish barley field but
have not attempted to measure potential methanogenic activity.
The discovery of potential methanogenesis in arid soils is of particular
interest as it is least expected to be found where soil is dry and oxic for most
of the year and where input of organic carbon is particularly low and grazing
ruminants are scarce. Nevertheless, particularly for these reasons if active
methanogens are to be found in arid soils it can demonstrate their
autochthonous origin and ability to survive in anoxic microniches of aerated
soils around the world.
Arid soils differ from other soils by their unique profile. Unlike most
soils, soils in arid parts don’t display a profile of layers representing different
stages of bedrock erosion and a gradient of nutrient concentrations. Rather,
the bulk soil is undifferentiated eroded bedrock poor in nutrients and is in
turn covered by a densely populated mat of microorganisms termed the
biological soil crust (BSC). The BSC is an association of microorganisms
which is formed practically in any soil whose water budget restricts the
4| Methanogens in upland soil
103
development of higher plants. The primary members and first colonizers of
BSCs are cyanobacteria and microalgae who aggregate the soil using
exopolysaccharide. Fungi and lichens are often also associated with mature
BSCs and sometimes moss as well (Belnap et al., 2002).
An extensive literature exists on the above mentioned members of BSCs but
studies (particularly molecular) on the prokaryotic inhabitants of this mat
(other than cyanobacteria) are scarce (Garcia-Pichel, 2002).
Our goals in this study were to compare the methanogenic potential of
different aerated soils collected globally and, more importantly, to uncover
the identity of the active methanogens in these soils and the potential
methanogenic pathways. We focused primarily on dryland soils and collected
samples from dryland environments in Israel, Australia and Utah but also
from a forest and a grassland meadow in Germany for comparison. We
screened the soil samples for methanogenic potential and attempted to
decipher the methanogenic pathways through stable isotopes analysis and
the use of an inhibitor for acetoclasitc methanogenesis. We then analysed
the identity of the archaeal population in these soils and quantified its size
through specific qPCR essays.

4| Methanogens in upland soil
104
4.3 Results
Methanogenic potential in upland soils
Of the 27 soil samples we tested 22 produced at least some methane during
the incubation time (Table 4.1). We observed stark differences in the extent
of the methanogenic potential of the soils which was expressed in up to four
orders of magnitude difference in daily production rates. Of the 22 samples
we classified 10 as having a strong methanogenic potential (highly
methanogenic soils) meaning, they had methane production rates in the
hundreds or thousands nmol gdw-1 d-1. In most samples methane was
detected within 7 – 14 days but a linear methane production began, on
average, at day 21. Interestingly, methane production rates and lag time did
not correlate with parameters such as precipitation, soils water content and
organic matter which would seem to be most important for supporting
methanogenesis. For examples, desert crust samples from the Negev Desert
had more than double the rate of methane production than the meadow
samples. With respect to the desert samples we observed that the biological
soil crust (BSC) layer was the only truly active layer in the soil while those
below had a very low or not methanogenic potential. The only exception to
this is the Liman whose soil: 1. periodically behaves like pond sediments
when the Liman is flooded; 2. builds up much quicker than the surrounding
due to alluviation.
Isotopic analysis
In parallel to measuring potential methane production rates of the soils, we
have also determined the isotopic signature of the carbon in the methane
being produced. This was done in order to estimate the proportion of each of
the two main methanogenic pathways – hydrogenotrophic and acetoclasitc –
in our experiments. Additionally, those samples which we classified as
highly methanogenic were also incubated with CH3F in order to inhibit
acetoclasitc methanogenesis. This allowed us to specifically determine the
isotopic signature of the methane produced through hydrogenotrophic
methanogenesis (mc).

Table 4.1| Characteristics of the sites and values of major physico-chemical parameters of the soil samples
Location Site Soil type (USDA)* Sampling layer pH Ctot Norg (%)
Methane production rate (nmol gdw-1 d-1)
Y0**
(d) R2
Inhibited methane production rate (nmol gdw-1 d-1 †
Y0
(d) R2
Avdat, Negev Plateau, Natural field - Intershrub Silt loam BSC 8.3 0.46, 0.30 3081.6 20 0.99 629.02 24 0.96
(30° 47’ N 34° 45’ E) 0-10 cm 0.33, 0.01 1.03 24 0.90 10-20 cm 0.38, 0.01 0.46 23 0.94
- “ - Shrub Silt loam BSC 8.4 0.66, 0.05 3710.73 16 0.96 1793.76 21 0.96
0-10 cm 0.34, 0.01 1.54 22 0.93 10-20 cm 0.26, BLD 1.23 23 0.82
Liman (constructed mini-catchment)
Silt loam BSC 7.9 2.00, 0.15 5657.59 11 0.99 3471.14 15 1.00
(30° 48’ N 34° 45’ E) 0-10 cm 1.27, 0.09 540.95 16 1.00
10-20 cm 0.96, 0.05 224.6 16 1.00
Agricultural field Loam 0-10 cm 8.5 0.28, BLD 0.62 23 0.71
(30° 52’ N 34° 48’ E) 10-20 cm 0.25, 0.03 BLD
Arava Valley South, Israel Wadi (dry riverbed) Sand BSC 8.4 0.98, BLD 4.39 22 0.99
(29° 58’ N 35° 05’ E) 0-10 cm 0.06, BLD BLD
10-20 cm 0.08, BLD BLD
Agricultural field Sand 0-10 cm 8.5 0.38, 0.14 BLD (30° 04’ N 35° 08’ E) 10-20 cm 0.18, BLD BLD
105
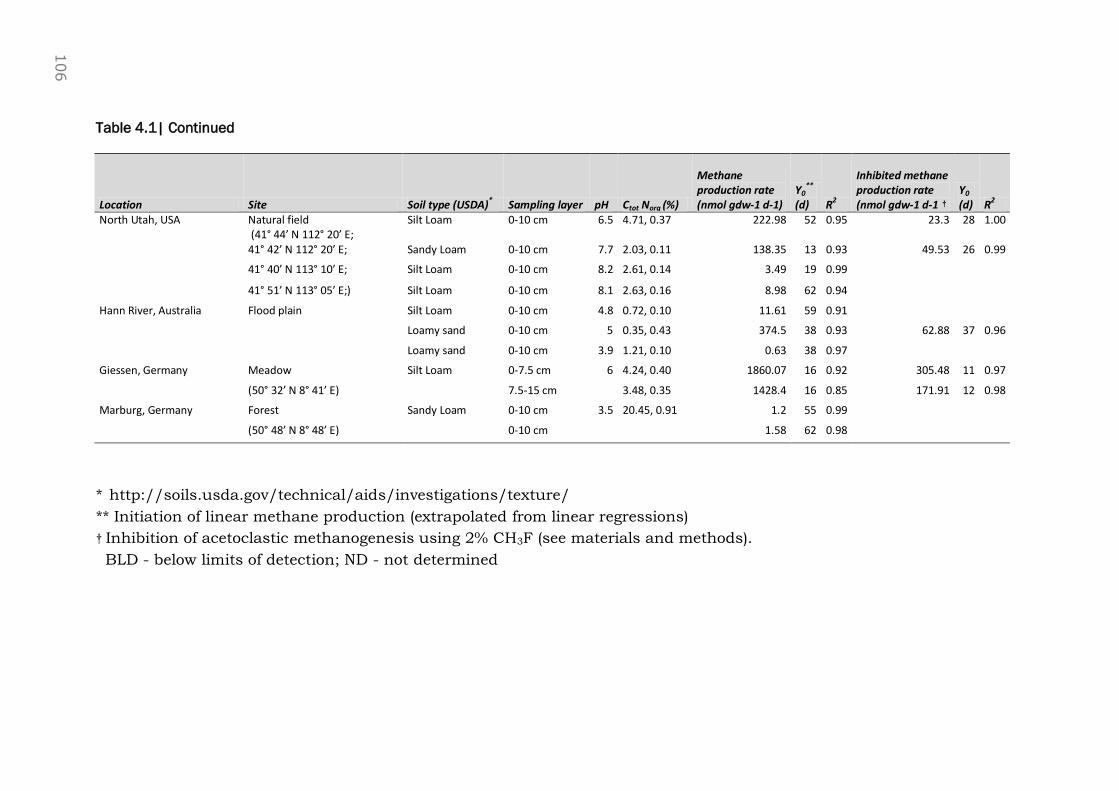
Table 4.1| Continued
Location Site Soil type (USDA)* Sampling layer pH Ctot Norg (%)
Methane production rate (nmol gdw-1 d-1)
Y0**
(d) R2
Inhibited methane production rate (nmol gdw-1 d-1 †
Y0
(d) R2
North Utah, USA Natural field (41° 44’ N 112° 20’ E;
Silt Loam 0-10 cm 6.5 4.71, 0.37 222.98 52 0.95 23.3 28 1.00
41° 42’ N 112° 20’ E; Sandy Loam 0-10 cm 7.7 2.03, 0.11 138.35 13 0.93 49.53 26 0.99
41° 40’ N 113° 10’ E; Silt Loam 0-10 cm 8.2 2.61, 0.14 3.49 19 0.99
41° 51’ N 113° 05’ E;) Silt Loam 0-10 cm 8.1 2.63, 0.16 8.98 62 0.94
Hann River, Australia Flood plain Silt Loam 0-10 cm 4.8 0.72, 0.10 11.61 59 0.91
Loamy sand 0-10 cm 5 0.35, 0.43 374.5 38 0.93 62.88 37 0.96
Loamy sand 0-10 cm 3.9 1.21, 0.10 0.63 38 0.97 Giessen, Germany Meadow Silt Loam 0-7.5 cm 6 4.24, 0.40 1860.07 16 0.92 305.48 11 0.97
(50° 32’ N 8° 41’ E) 7.5-15 cm 3.48, 0.35 1428.4 16 0.85 171.91 12 0.98
Marburg, Germany Forest Sandy Loam 0-10 cm 3.5 20.45, 0.91 1.2 55 0.99 (50° 48’ N 8° 48’ E) 0-10 cm 1.58 62 0.98
* http://soils.usda.gov/technical/aids/investigations/texture/
** Initiation of linear methane production (extrapolated from linear regressions)
† Inhibition of acetoclastic methanogenesis using 2% CH3F (see materials and methods).
BLD - below limits of detection; ND - not determined
106

4| Methanogens in upland soil
107
The BSC samples from Israel showed a temporal trend by which
methane began with a light isotopic signature of the carbon (-57‰ on
average) and became heavier with time (up to -35‰ on average) while the
isotopic signature of the carbon in the CO2 became slightly lighter over time
starting from -9 to -15‰ on average (Table 4.2). A similar phenomenon with
respect to methane but not to CO2 was observed for the samples from Utah
while the other soil samples showed a relatively stable isotopic signature of
both methane and CO2 over time. Fractionation factors in all non-inhibited
incubations were lower than those in the inhibited incubations (which were
1.050 – 1.076) but higher than those obtained for purely acetoclastic
methanogenesis which typically range between 1.021-1.027 (Krzycki et al.,
1987; Gelwicks et al., 1994) indicating a mixture of both pathways. To
precisely determine the contribution of hydrogenotrophic and acetoclasitc
methanogenesis knowledge of the exact isotopic signatures ma and mc are
required. We can, however, estimate the relative contribution of each
pathway if we use the 13C-CH4 produced in the inhibited incubations as the
specific signature for methane produced from H2/CO2 alone (mc) and use
the isotopic signature of the organic carbon in the soil to estimate the
signature of methane produced from acetate. The measured 13C of the
organic carbon in the soil samples (which is the substrate for acetate)
differed somewhat between sites but ranged between -20.20 and -27.9. The
fractionation factor for acetoclastic methanogenesis in pure cultures varies
with respect to substrate concentration but ranges between ≈5.6 and -
25.6‰ (Goevert and Conrad, 2009). Since acetate concentrations were low
in our incubations (relative to those used by Goevert and Conrad, 2009) we
can expect a relatively high turnover and assume a low fractionation factor (-
10‰). By using equation 3 and these assumptions we can thus estimate the
fraction of hydrogenotrophic methanogenesis in the system (Table 4.2). In
all cases methanogenesis began with a dominance of hydrogenotrophic
methanogenesis but in samples from Israel and Utah this fraction dropped
to about 10-20% only of the methane being produced.
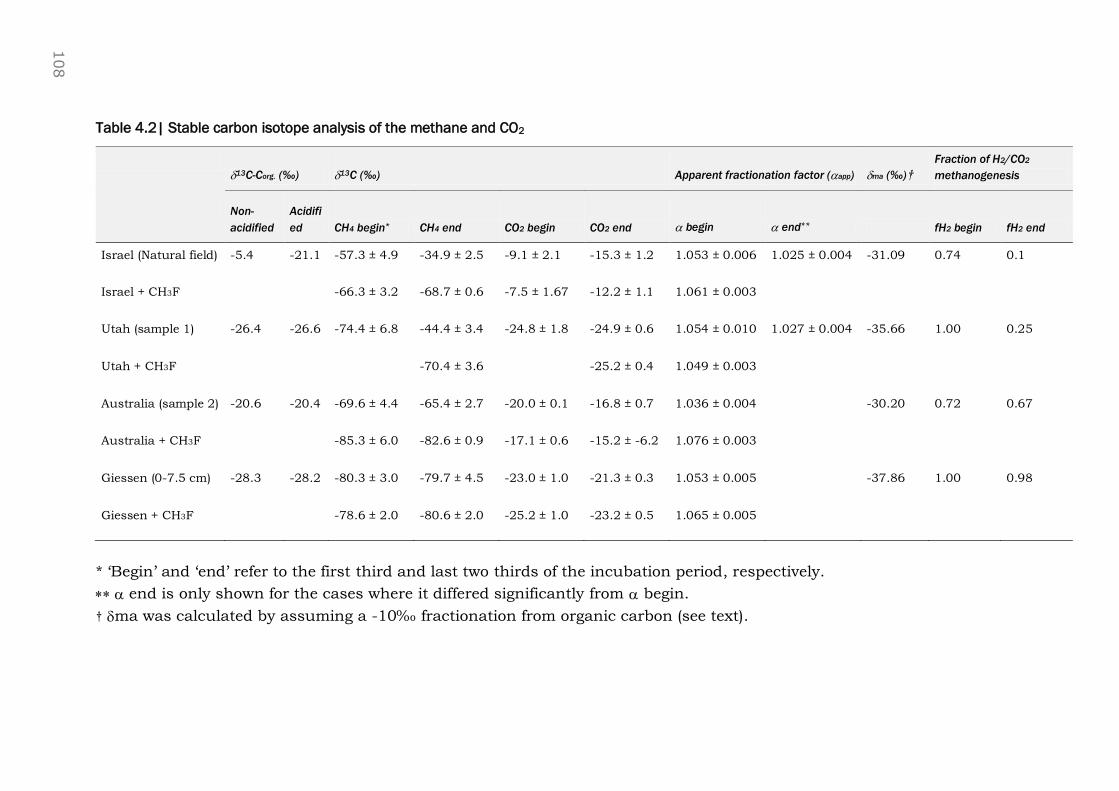
Table 4.2| Stable carbon isotope analysis of the methane and CO2
13C-Corg. (‰) 13C (‰) Apparent fractionation factor (app) ma (‰)†
Fraction of H2/CO2
methanogenesis
Non-
acidified Acidifi
ed CH4 begin* CH4 end CO2 begin CO2 end begin end** fH2 begin fH2 end
Israel (Natural field)
-5.4
-21.1
-57.3 ± 4.9
-34.9 ± 2.5
-9.1 ± 2.1
-15.3 ± 1.2
1.053 ± 0.006
1.025 ± 0.004
-31.09
0.74
0.1
Israel + CH3F
-66.3 ± 3.2
-68.7 ± 0.6
-7.5 ± 1.67
-12.2 ± 1.1
1.061 ± 0.003
Utah (sample 1)
-26.4
-26.6
-74.4 ± 6.8
-44.4 ± 3.4
-24.8 ± 1.8
-24.9 ± 0.6
1.054 ± 0.010
1.027 ± 0.004
-35.66
1.00
0.25
Utah + CH3F
-70.4 ± 3.6
-25.2 ± 0.4
1.049 ± 0.003
Australia (sample 2)
-20.6
-20.4
-69.6 ± 4.4
-65.4 ± 2.7
-20.0 ± 0.1
-16.8 ± 0.7
1.036 ± 0.004
-30.20
0.72
0.67
Australia + CH3F
-85.3 ± 6.0
-82.6 ± 0.9
-17.1 ± 0.6
-15.2 ± -6.2
1.076 ± 0.003
Giessen (0-7.5 cm)
-28.3
-28.2
-80.3 ± 3.0
-79.7 ± 4.5
-23.0 ± 1.0
-21.3 ± 0.3
1.053 ± 0.005
-37.86
1.00
0.98
Giessen + CH3F
-78.6 ± 2.0
-80.6 ± 2.0
-25.2 ± 1.0
-23.2 ± 0.5
1.065 ± 0.005
* ‘Begin’ and ‘end’ refer to the first third and last two thirds of the incubation period, respectively.
end is only shown for the cases where it differed significantly from begin.
† ma was calculated by assuming a -10‰ fractionation from organic carbon (see text).
108
4| Methanogens in upland soil
109
Molecular characterization of the methanogenic community
We characterized the archaeal community in our soil samples through
cloning and TRFLP profiling and compared the pre-incubated state with the
post incubated of both inhibited and non-inhibited incubations.
Surprisingly, the diversity of the methanogenic community in our samples
was extremely poor and nearly identical although samples were obtained
from different parts around the world. In all of our post-incubated samples
we identified only Methanosarcina and Methanocella related sequences along
with a variety of crenarchaeal sequences typically associated with aerated
soils such as Soil Crenarchaeotic Group (SCG) 1.1b and occasionally
sequences related to Thermoplasmatales (Figure 4.1). The latter two groups
were detected as sole members of the archaeal communities in the samples
prior to incubation while none of the methanogens could be detected in our
16S rRNA clone libraries or TRFLP profiles. Inhibition with CH3F resulted in
lower methane production rates but did not change the identity of the
methanogenic community. Not only did we detect nothing but
Methanosarcina and Methanocella as methanogenic members in our post-
incubated samples, their within group sequence diversity was itself very low.
For example, the average sequence similarity between Methanosarcina from
Avdat BSC and Giessen meadow soil was only 1.81% ± 0.025 and that
between the Methanocella members only 3.3% ± 0.1.
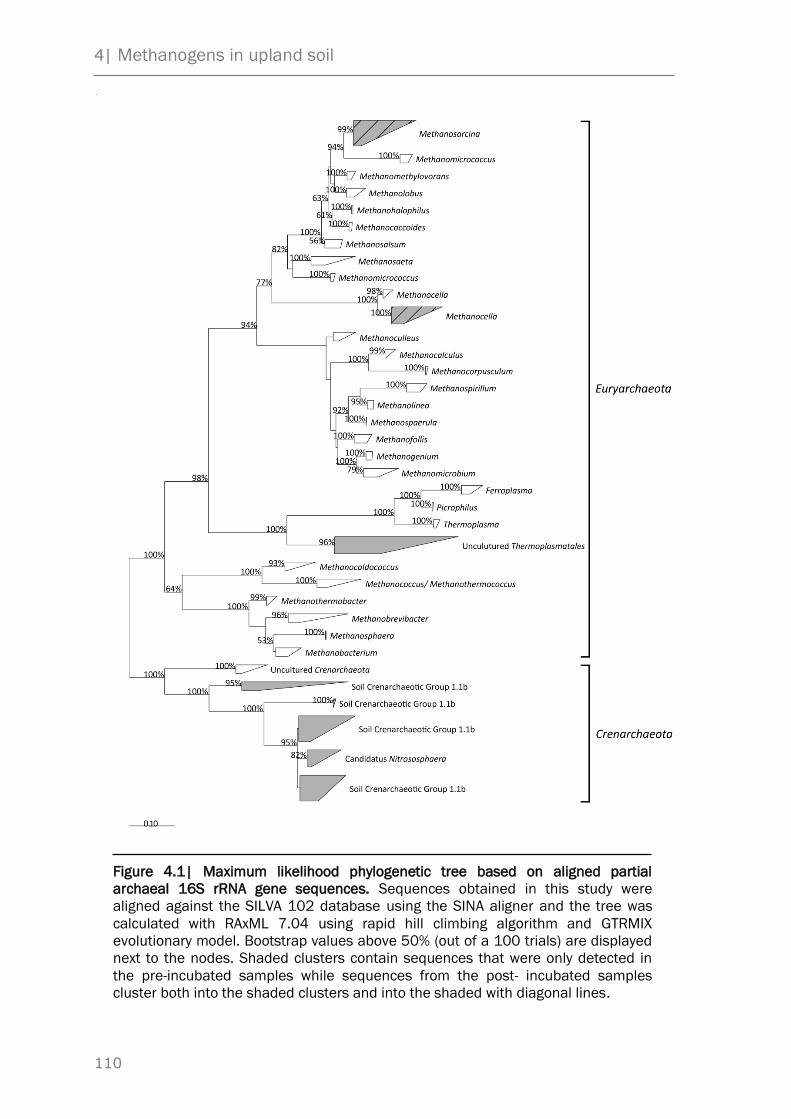
4| Methanogens in upland soil
110
Figure 4.1| Maximum likelihood phylogenetic tree based on aligned partial
archaeal 16S rRNA gene sequences. Sequences obtained in this study were
aligned against the SILVA 102 database using the SINA aligner and the tree was
calculated with RAxML 7.04 using rapid hill climbing algorithm and GTRMIX
evolutionary model. Bootstrap values above 50% (out of a 100 trials) are displayed
next to the nodes. Shaded clusters contain sequences that were only detected in
the pre-incubated samples while sequences from the post- incubated samples
cluster both into the shaded clusters and into the shaded with diagonal lines.
4| Methanogens in upland soil
111
TRFLP analysis
We used TRFLP profiling to decipher relative changes in the archaeal
community from in situ to post-incubated state and with respect to the effect
of inhibition with CH3F. 67 replicated TRFLP profiles are summarized in
Figure 4.2. As expected, all pre-incubated samples (green circles) had
similar 16S rRNA profiles on both DNA and RNA levels and clustered very
tightly with respect to the primary principal component. Most post-
incubated samples (red and blue circles) are to be found on the right to the
ordinate indicating methanogenic activity and their approximate methane
production rates can be deduced from the isolines. Those samples which did
not demonstrate potential methanogenic activity remained close to the pre-
incubated samples in these plots. The relative abundance of each of the
archaeal types can be estimated from the perpendicular projection of each
sample on the individual arrows while the length of each arrow indicates the
variance (range of relative abundance values) of its respective archaeal type.
Methanosarcina was more abundant than Methanocella in most
methanogenic samples on the DNA level and seemed to have been
overwhelmingly dominant on the RNA level. Moreover, the most
methanogenic samples seem to have been those with the highest relative
abundance of Methanosarcina. It seems that the inhibition with CH3F, while
reducing methanogenic activity, did not have an effect on the composition of
the methanogenic community. Particularly, there does not seem to be an
increase of Methanocella on the expense of Methanosarcina as would be
expected from such inhibition.

4| Methanogens in upland soil
112
Figure 4.2| Principal component analysis plots of the archaeal community as
deciphered from 16S rRNA gene. Circles indicate individual samples. The
perpendicular projection of each sample on an arrow gives an estimation of the
relative abundance of each archaeal type while its length indicates the species
variance. CH3F was used to inhibit acetoclastic methanogenesis. Fitted methane
production rates are shown as isolines.

4| Methanogens in upland soil
113
Molecular characterisation using the mcrA marker gene
Our inability to detect methanogens in the 16S rRNA gene TRFLP profiles
and clone libraries is most likely the result of their low relative abundance
compared with the populations of Crenarchaeota and Thremoplasmatales.
Any community member who comprises 1% or less of the community would
be undetected in TRFLP profiles (due to method’s threshold and
standardization procedures) and also in the clone libraries (considering our
sequencing efforts). We therefore attempted to perform analysis of the
methanogenic community using the mcrA functional gene. While we were not
able to amplify the gene in all our samples we did obtain PCR products from
at least one sample in each site. The phylogenetic affiliation of these
sequences in presented in Figure 4.3. The majority of the mcrA sequences
belonged to either Methanosarcina or Methanocella, confirming our
observation from the analysis of the 16S rRNA gene. We did, however, detect
several sequences which belong to Methanobrevibacter and
Methanobacterium which were not detected in the post incubated samples.

4| Methanogens in upland soil
114
Figure 4.3| Maximum likelihood phylogenetic tree based on aligned partial amino
acid sequences of the methyl coenzyme reductase M gene (mcrA). Amino acid
composition was deduced from DNA sequences and the tree was calculated with
RAxML 7.04 using rapid hill climbing algorithm and PROTMIX - JTT evolutionary
model. Bootstrap values above 50% (out of a 100 trials) are displayed next to the
nodes. Shaded clusters contain sequences that were only detected in the pre-
incubated samples while sequences from the post- incubated samples cluster both
into the shaded clusters and into the shaded with diagonal lines
4| Methanogens in upland soil
115
Quantification of the methanogenic community
Copy numbers of archaeal 16S rRNA gene rose between 0.5 – 2 orders of
magnitude during the incubation period in the highly methanogenic samples
and were moderately correlated to methane production rates (Figure 4.4A).
Both methanogen types were undetected in the in situ and non reactive
samples (below 103 copies) but reached up to 109 copies gdw-1 after the
incubation. Copy numbers of Methanosarcina and Methanocella 16S rRNA
gene were within one order of magnitude from each other with those of
Methanosarcina always exceeding Methanocella except in the inhibited
samples (data not shown). Since both methanogen types contain 3 copies of
the 16S rRNA gene in their genomes the actual number of methanogenic
cells is a third of the gene copy numbers displayed in the figure. Both
methanogen types were positively correlated to methane production rates
but that of Methanosarcina was much better (Figure 4.4C and D). In
contrast, gene copy numbers of Crenarchaeota did not change in most
samples between the pre and post incubated states and showed no
correlation to methane production rates (Figure 4.4B). Treatment with CH3F
had only a minor effect on the Methanosarcina population, by decreasing its
copy numbers, and no apparent affect on the numbers of Methanocella (data
not shown).

4| Methanogens in upland soil
116
Figure 4.4| 16S rRNA gene copy numbers plotted against methane production
rates. Zero on the X-axis indicates pre-incubated or non-reactive samples.

4| Methanogens in upland soil
117
4.4 Discussion
When the domain Archaea was first described by Woese and Fox (1977) it
was thought to be an ancient lineage of prokaryotes (hence the name). The
slow rate of changes of the rRNA genes in Archaea, which gives this domain
a basal location in the tree of life and short branch lengths (Pace, 2009),
along with its predominance in extreme environments, particularly anoxic
and hyperthermic (Woese et al., 1990; Takai and Horikoshi, 1999), led to the
notion that Archaea had evolved early in the evolutionary history in a world
which was hotter and whose atmosphere and hydrosphere were much more
reduced. This notion has been challenged in recent years by two major lines
of discovery. From biochemical and genetic studies of isolated archaea it
became clear that the phylogenetic split of Archaea occurred later in the
evolution, after the domain Bacteria had already split (Pace, 1997; Werner,
2008). Complementary to these studies, environmental surveys using
molecular screening tools have been revealing more and more archaeal
sequences in virtually all mesospheric environments including aerated soils,
ocean water and freshwater bodies (Bintrim et al., 1997; DeLong, 1992;
Schleper et al., 1997). It thus stems from these studies that Archaea are as
cosmopolitan as Bacteria, adapted to their ecological niches and perform a
variety of metabolic activities (DeLong, 1998; Schleper et al., 2005; Auguet et
al., 2009).
In this study we have shown that methanogens are also ubiquitous in
mesophillic, aerated soils around the world. While not all samples displayed
methanogenic activity, at least one of each site did. Many of our samples had
very low or no methanogenic potential and long lag times but some samples
reacted very quickly and produced ample amounts of methane within a few
days. Particularly intriguing is the fact that in the arid samples from Israel it
was the topmost part of the soil – the biological soil crust (BSC) – which held
nearly all of the methanogenic potential of the soil. While it is true that BSCs
contain most of the microbial biomass and activity in desert soils (Garcia-
Pichel and Belnap, 2002) it is also the layer most exposed to oxygen in the
soil. In fact, since BSCs are mostly formed by photosynthetic
microorganisms it becomes hyperoxic at parts when moist during day time
(Garcia-Pichel and Belnap, 1996). The existence of soils with such high

4| Methanogens in upland soil
118
methanogenic potential and fast response gives at least circumstantial
evidence for the fact that they are also active, at least at certain times, under
natural conditions and might comprise a yet unaccounted for global
methane source.
Similar to many natural environments, we found a mixture of both
acetoclastic and hydrogenotrophic methanogenesis in our incubations
(Conrad, 1999), but the specific proportion of each pathway varied between
samples and even within certain samples as incubation proceeded. All
incubations began with methane being produced mostly or entirely out of
hydrogen and CO2 but in the case of the samples from Israel and Utah
methanogenesis shifted to being predominantly acetoclasitc as the
incubation proceeded. The ratio of acetoclasitc methanogenesis in these
samples thus stabilized between 60-70%, which is very close to the ratio
found in most natural environments (Conrad, 1999). Methanogenesis in the
samples from Australia and Giessen, on the other hand, remained
predominantly hydrogenotrophic throughout the incubation.
Although methanogenic potential thus seems to be a global trait of
aerated soils (albeit of different characteristics), we have recovered a
remarkably low diversity of methanogens in our samples. Of the 30 known
methanogenic genera we found only two closely related genera in our post-
incubated samples belonging to Methanosarcina and Methanocella, both
types are of high ecological importance. Methanosarcina are, along with
Methanosaeta, the only methanogens capable of performing acetoclasitc
methanogenesis and are therefore the predominant methanogens in most
natural environments (Liu and Whitman, 2008). Methanocella are a newly
discovered genus, also globally distributed but colonises rice roots in
particular (Conrad et al., 2006). They were also shown to be of high
importance as one of the primary methane producers in rice fields, probably
feeding on fermentation products of root exudates (Lu and Conrad, 2005).
Although phylogenetically closely related to Methanosarcina and similar in
their cellular structure, Methanocella species can only perform
hydrogenotrophic methanogenesis (Sakai et al., 2010; Thauer et al., 2008).
In our samples, it appears that Methanosarcina were the dominant
methanogens. Certainly this is the case in the samples from Israel and Utah
4| Methanogens in upland soil
119
where acetoclasitc methanogenesis accounted for roughly two thirds of the
newly formed methane, but also generally speaking Methanosarcina were
had higher relative abundance in the TRFLP profiles and their absolute
abundance correlated better with methane production rates. Similarly,
Methanosarcina and Methanocella were also the methanogenic types which
were found by Nicol and colleagues (2003) in a pasture soil in Scotland and
by Poplawski and colleagues (2007) in a barley field in Sweden thus
reinforcing our notion that these types are universal upland soil
methanogens. In cases where heavy grazing was involved, the authors have
also found Methanosarcina as dominant methanogens but along with it
other types which could be directly associated to rumen microflora (Radl et
al., 2007; Gattinger et al., 2007).
Our phylogenetic analysis of the pre-incubated soils using mcrA
revealed also the presence of a few other methanogens which are closely
affiliated with Methanobrevibacter and Methanobacterium. None of these
Methanogens could be enriched in our incubations and it remains unclear
whether these were viable cells. Nevertheless, their presence does imply that
the diversity of the methanogenic community in these aerated soils is
potentially wider.
The formation of biogenic methane when aerated soils are incubated
anoxically testifies not only for the presence of active methanogens but also
for the presence many other anaerobic microorganisms. Since methane is
only an end product in a long cascade of anaerobic degradation processes,
other viable anaerobic microorganisms starting from primary fermenters to
secondary fermenters to acetogens and syntrophs need to be present in the
soil and for it to be formed (Garcia et al., 2000; Stams and Plugge, 2009). It
thus stems that upland soil host not just methanogens but entire consortia
of anaerobes capable, at least potentially, to carry a full anaerobic
degradation pathway.
4| Methanogens in upland soil
120
Conclusion
Methanogens of the type Methanosarcina and Methanocella appear to be
autochthonous and universal members of the biome in aerated soils. Despite
being exposed to constant oxygen flux, a core population of these
methanogens is able to survive and become rapidly active when conditions
fit. Several key issues remain unanswered for the moment: 1. If and to what
extent are upland soil methanogens active under natural conditions? (i.e.
under an oxic atmosphere); 2. Is there a niche differentiation between
Methanosarcina and Methanocella in aerated soils? 3. What are the factors
that determine whether a soil would display a high methanogenic potential:
lack of methanogens or very low initial population size, presence of
inhibitors, absence or inhibition of one or more members of the microbial
consortium required for anaerobic degradation such as syntrophs or
acetogens?
4| Methanogens in upland soil
121
4.5 Experimental procedure
Soil samples and soil characterization
Soil samples were collected from several sites around the world as listed in
Table 4.1. The sampling done in the Negev Desert, Israel comprises our
most comprehensive sampling. The sites were previously described by Angel
and Conrad (2009). Samples were taken from the biological soil crust where
it existed, from 0-10 cm below ground layer and from 10-20 cm below
ground layer. Apart from the Negev Desert samples, samples from Utah and
Australia were also from dryland environments while the samples obtained
in Germany were from temperate forest and grassland.
Incubation conditions and gas measurements
For determining the methanogenic potential of the soils, samples were
incubated under anoxic conditions the following way: 5 g of sample was
placed in a 26 ml glass tube with 5 ml of sterile distilled deionised water
(DDW) and the tube was capped with a pre-boiled butyl rubber stopper. The
headspace was repeatedly evacuated and flushed with N2 for 10 min and left
with a 0.5 bar overpressure. Each sample was set up in triplicate and
incubated at 25 oC in the dark for 48 days. Those samples which
demonstrated methanogenic activity were later incubated again using fresh
soil but supplemented with methyl-fluoride (CH3F) in order to inhibit
acetoclasitc methanogenesis (Janssen and Frenzel, 1997). Gas samples were
taken from the tube headspaces every 6 days using a gas-tight pressure-
lok® syringe (Vici) and analyzed immediately. Methane and CO2 levels in the
headspace were analyzed using a gas chromatograph (GC) equipped with a
methanizer (Ni-catalyst at 350 oC, Chrompack) and a flame ionization
detector (SRI).

4| Methanogens in upland soil
122
Slurry sampling
After incubation was completed the tubes were opened and approximately 1
g of soil was sampled for nucleic acids extraction, immediately frozen in
liquid nitrogen and stored at -80 oC until analysis.
Analysis of stable carbon isotopes
The carbon isotope ratio 13C:12C was determined using a gas chromatograph
combustion isotope ratio mass spectrometer (GC-C-IRMS) against the V-PDB
standard as described previously (Conrad et al., 2009). Isotopic calculations
and estimation of the approximate fraction of hydrogenotrophic
methanogenesis of the total methanogenesis were done after Conrad (2005).
Briefly, the fraction of the newly formed methane between two time points is
given by:
2 = fnn + (1 – fn)1 [1]
where 1,2 and n are the isotopic signatures of the methane at times 1
and 2 and of the newly formed, respectively, while fn is the fraction of the
newly formed methane at time 2.
The apparent fractionation factor for the conversion of CO2 to CH4 is given
by:
app = (CO2 + 1000) / (CH4 + 1000) [2]
where CO2 and CH4 are the isotopic signatures of the carbon in CO2 and CH4,
respectively. The relative fraction of H2/CO2-derived CH4 in the total
generated CH4 was determined from
fH2 = (CH4 - ma) / (mc - ma) [3]
where ma and mc are the specific isotopic signatures of the carbon in
methane produced solely from acetate and H2/CO2, respectively. 13C in the
organic matter was analysed at the Institute for Soil Science and Forest
Nutrition (IBW) at the University of Göttingen, Germany (courtesy of Heinz
Flessa), using an elemental analyzer coupled to mass spectrometer.
Measurements were done before and after acidification, the difference being
due to carbonate (Nüsslein et al., 2003).

4| Methanogens in upland soil
123
Nucleic acids extraction, RNA purification and cDNA synthesis
Total nucleic acids were extracted the following way: 0.5 g of frozen soil
sample was placed in a Lysing Matrix E tube (MP). 375 l SPB (10 mM
sodium phosphate buffer, pH 8.0) and 125 l TNS buffer (500 mM Tris HCL,
100 mM NaCl, 10% sodium dodecyl sulphate) were added to the tube; both
solutions taken from Henckel and colleagues (1999) (Henckel et al., 1999).
Then, 500 l of Tris EDTA saturated phenol solution (pH 8.0; Fluka) were
added to the tube and it was processed immediately in a FastPrep®-24 bead
beating instrument for 30 s at 6.5 m s-1. The tube was immediately
transferred to ice and chilled for a minute and then centrifuged for 5 min at
14,000 rpm. Supernatant (including phenolic phase) was transferred to a 2
ml tube which was kept on ice and the beads tube containing the soil
sample was retained. This process was repeated twice more with fresh
aliquots of buffers and phenol solution. At the third time, the supernatant
(excluding the phenolic phase) was distributed between the two 2 ml tubes
used in to store the supernatant in the previous steps and the beads tube
was discarded. Approx. 800 µl phenol/chloroform/isoamylalcohol (25:24:1;
Fluka) were added to each of the tubes containing the extractant to a 2 ml
total volume. The phases were homogenised by mixing and the tubes were
centrifuged for 3 min at 14,000 rpm. The supernatants were transferred
from each tube to fresh 2 ml tubes, and 1 volume of chloroform/
isoamylalcohol (24:1; Sigma-Aldric) was added to each. Phases were
homogenised again by mixing and the tubes were centrifuged for 3 min at
14,000 rpm. The supernatants were transferred from each tube to Non-Stick
RNase-free Microfuge Tubes (Ambion). To each tube 1 µl of glycogen (5 mg
ml-1; Ambion) and 1.5 ml PEG precipitation solution (20% polyethylen
glycol, 2.5 M NaCl) were added and the tubes were centrifuged for 90 min at
14,000 rpm and 4 oC. After centrifugation, the entire supernatant was
discarded and the pellets were washed with ice cold 75% ethanol and
centrifuged again for 20 min at 14,000 rpm and 4 oC. The entire supernatant
was removed again, the pellets were dried under a stream of filtered N2, then
resuspended in 100 l of low TE buffer (10mM Tris, 1mM EDTA) and the
content of the two tubes was combined. In cases when the extractant had
4| Methanogens in upland soil
124
colour it was further purified using MicroSpin S-200 HR (GE Healthcare). 10
l of the extractant was diluted in 90 l of low TE buffer and was used as
DNA template. For synthesis of complete cDNA, 50 l of nucleic acids
extractant were digested with TURBO™ DNase (Ambion) and later purified
using RNeasy® MinElute® Cleanup Kit (Qiagen) and quantified using a
NanoDrop 1000 spectrophotometer (Thermo). Complete DNA removal was
verified by failure to obtain PCR amplification product with the purified RNA
template using the conditions described below. Complete cDNA was
synthesized using ImProm-II™ Reverse Transcriptase (Promega) by the
following procedure: 100 ng purified RNA and 0.5 g/l of random hexamer
primers were incubated at 70°C for 5 min followed by 5 min chilling on ice.
The following mixture was then directly added to the tubes: 4 µl of 5×
ImProm-II™ Reaction Buffer, 3 mM MgCl2, 1 mM of each dNTP, 20 g of
bovine serum albumin (BSA) (Roche), and 20 U of Recombinant RNasin
Ribonuclease Inhibitor (Promega). The reaction tubes were incubated at
25°C for 5 min followed by 52°C for 1 h, and then denaturation at 70°C for
15 min. The resulting cDNA product was used directly as a template for
consecutive PCR reactions. PCR amplifications were performed identically for
both DNA and cDNA templates.
Primers and probes used in this study
Table S4.1 summarizes the primers and probes used in this study to
monitor and quantify the archaeal population. For sequence affiliation,
oligonucleotide design and evaluation, and reconstruction of phylogenetic
trees we used the ARB software package (Ludwig et al. 2004). Analysis and
oligonucleotide design of 16S rRNA-gene sequences were done using the
Silva database (Pruesse et al. 2007; http://www.arb-silva.de/), while for
analyses of mcrA sequences a specific ARB databases was built. The mcrA
database was built using 5200 translated nucleic acid sequences which were
obtained from EMBL (http://www.ebi.ac.uk/embl/) and aligned using
Promals (Pei and Grishin 2007). The mcrA ARB database is available at:
http://www.staff.uni-marburg.de/~angel/. The qPCR primers and probe
targeting the 16S rRNA gene of Methanocella was designed using Primrose
(Ashelford et al., 2002).

4| Methanogens in upland soil
125
PCR amplification
For T-RFLP analysis, the forward primer was labelled with the fluorescent
dye 6-FAM (6 – carboxyfluorescein). PCR reactions were conducted in
triplicates of 50 µl which were later pooled to minimize reaction bias. Each
PCR reaction contained 10 µl GoTaq®Flexi 5× Green Buffer (Promega), 1.5
mM MgCl2, 40 mg BSA (Roche), 1.5 U of GoTaq® DNA polymerase (Promega)
and 2 µl of template. For amplification of 16S rRNA gene, 0.5 M of each
primer were used while for amplification of mcrA 0.8 M were used. The
following programme was used for amplification of the 16S rRNA gene: 94 °C
for 4 min followed by 28 cycles of 94 °C for 1 min, 52 °C for 30 s and 72 °C
for 45 s and a single step of final elongation at 72 °C for 10 min. For
amplification of mcrA the following programme was used: 94°C for 4 min
followed by 5 touchdown cycles of 94 °C for 30 s, 60 °C - 1°C for 45 s and 72
°C for 30 s followed by 30 cycles of 94 °C for 30 s, 55°C for 30 s and 72 °C
for 30 s, and a single step of final elongation at 72 °C for 10 min. After
amplification, the PCR product was purified using GeneElute™ PCR
purification Kit (Sigma) and quantified on a NanoDrop 1000
Spectrophotometer.
Cloning and sequencing and phylogenetic analysis
Active samples from the following locations were used for cloning of both
16S rRNA and mcrA genes: Avdat natural field, Liman – BSC; Giessen 0-7.5
cm; Hann River 0-10 cm. Libraries were constructed using purified PCR
products and pGEM-T Easy cloning kit (Promega). Sequencing service was
provided by ADIS (Germany) and GATC (Germany) using the primers T7f and
M13r targeting flanking regions of the insert. A total of 250 clones
containing 16S rRNA gene insert and 78 clones containing mcrA gene inserts
were analyzed. All sequences were deposited into the GenBank®
(www.ncbi.nlm.nih.gov) and received the following Accession Numbers:
HQ268968 - HQ269217. Raw sequence data were analyzed using SeqMan
software (DNAStar) where the primers and vector data were trimmed. 16S
rRNA gene sequences were aligned using the SINA Webaligner
(http://www.arb-silva.de/aligner/) against the Silva 102 database. mcrA

4| Methanogens in upland soil
126
sequences were converted to amino acid sequences and aligned against the
ARB database described above. Reconstruction of a maximum likelihood
phylogenetic trees was conducted with RAxML 7.04 using rapid hill climbing
algorithm and with GTRMIX and PROTMIX - JTT evolutionary models for
16S rRNA and mcrA genes, respectively (http://icwww.epfl.ch/~stamatak/
index-Dateien/Page443.htm;Stamatakis 2006).
qPCR essays
qPCR was used in this study to quantify the numbers of 16S rRNA gene
copies of the general archaeal, crenarchaeal, Methanosarcina, and
Methanocella populations. All qPCR reactions were performed on an iCycler
thermocycler equipped with a MyiQ™ detection system (Bio-Rad) and the
data was analyzed using iQ5 Optical System software (Bio-Rad). For all
essays we used standards containing known numbers of DNA copies of the
target gene. Standards were serially diluted and used for construction of
calibration curves in each reaction. A standard for the general archaeal and
the Methanosarcina essays was prepared from a pure culture of
Mehtanosarcina thermophila according to Lueders and colleagues (2004).
Standards for Crenaraeota and Methanocella essays were prepared from
clones containing 16S rRNA genes affiliated with either Crenaraeote or
Methanocella as a plasmid insert the following way. The samples from Avdat
Liman before and after incubation were used for cloning. DNA was amplified
using the general primers ARC109F_mod and 1406R and cloned as
described above. Clones containing the desired insert were identified
through sequencing and the insert was amplified using the T7f and M13r
primers. The PCR product was purified and quantified using
Quant‐iT™ PicoGreen®. The weight of a single amplicon was calculated from
its sequence and that of the flanking regions
(http://www.basic.northwestern.edu/biotools/oligocalc.html#helpMW) and
the number of copies per microlitre was obtained by simple division of the
total quantity by the weight of an amplicon. Total Archaea and
Crenarchaeota essays were based on SYBR® Green. Each reaction was 25 l
in volume and contained the following mixture: 12.5 l SYBR® Green
JumpStart™ Taq ReadyMix™, 3 or 2 mM MgCl2 (Total Archaea and

4| Methanogens in upland soil
127
Crenarchaeota essays resp.), 0.8 ng l-1 BSA (Ambion), 0.66 or 0.44 M of
each primer (Total Archaea and Crenarchaeota essays resp.), and 5 l of
template. For the two essays, the programme used was: 94 °C for 4 min
followed by 40 cycles of 94 °C for 30 s, 66 or 63 °C for 30 s (Total Archaea
and Crenarchaeota essays resp.), 72 °C for 30 s and 85 °C for 10 s for signal
reading. The essays targeting the 16S rRNA gene of Methanosarcina and
Methanocella were based on dual labelled probes. Each reaction was 25 l in
volume and contained the following mixture: 12.5 l JumpStart™ Taq
ReadyMix™, 4 mM MgCl2, 0.8 ng l-1 BSA (Ambion), 0.5 M of each primer,
0.2 M of the dual labelled probe and 5 l of template. For the two essays,
the programme used was: 94 °C for 4 min followed by 40 cycles of 94 °C for
30 s, 60 °C for 60 s for annealing, extension and signal reading.
TRFLP analysis
Approximately 200 ng of purified PCR products were digested overnight at
37°C with 20 U of the restriction enzyme TaqI and 2 l of 10× Buffer TaqI™
(Fermentas). Following digestion, samples were desalted using SigmaSpin™
Post-Reaction Clean-up Columns (Sigma, Germany), aliquots of 3 µl were
mixed with 10 µl of HiDi™ Formamide (Applied Biosystems) and 0.3 µl of the
internal DNA standard MapMarker®1000 (BioVentures). The samples were
denatured at 94°C for 2 min and loaded into an ABI 3100 automated gene
sequencer (Applied Biosystems) for separation of the TRFs. TRFLP data was
retrieved by comparison with the internal standard using GeneScan 3.71
software (Applied Biosystems).
Data transformation and statistical analysis
Affiliation of TRFs to their respective archaeal taxa was done using in silico
prediction of the restriction sites in the sequence data. For PCA analysis,
TRFLP data was transformed and standardised as described previously
(Angel et al., 2010). PCA plots were computed using Canoco 4.53 and plotted
using CanoDraw 4.12 (http://www.canoco.com).

4.6 Supplementary material
Supplementary Table 4.1| Primers and probes used in this study
Oligo. name* Target Oligo. sequence (5’-3’) Position** GC (%) Tm† Amplicon size Essay Reference
ARCH109 - F
Archaea 16S rRNA gene
AHDGCTCAGTAACACRT 109-125 42.2 56
826 TRFLP/
Sequencing
Miyashita et al. 2009
ARCH934 - R GTGCTCCCCCGCCAATTCCT 915-934 65 68 Grosskopf et al. 1998
U1406 - R ACGGGCGGTGTGTRC 1392-1406 70 63 1298 qPCR std. Amann et al. 1995
ARCH364 - F CGGGGYGCASCAGGGGCGAA 364-383 75-80 75 553 QPCR Burggrafet al. 1997
MSL812 - F
Methanosarcinales
16S rRNA gene
GTAAACGATRYTCGCTAGGT 812-831 40-50 62
354
MSL860 - P AGGGAAGCCGTGAAGCGARCC 860-880 62-67 70 QPCR Yu et al. 2005
MSL1159 - R GGTCCCCACAGWGTACC 1143-1159 65 63
MCL282 – F
MethanocellaI
16S rRNA gene
ATCMGTACGGGTTGTGGG 282-299 56-61 65
510
MCL609 – P ATCCAGCGGCTTAACCGTTGGKCK 609-632 54-63 72 QPCR This study
MCL832 – R CACCTAGCGRGCATCGTTTAC 813-832 52-57 64
771F Crenarchaeota
16S rRNA gene
ACGGTGAGGGATGAAAGCT 753-771 53 63 203 QPCR
Ochsenreiter et al. 2003
957R CGGCGTTGACTCCAATTG 957-974 56 62
mlas-mod – F Universal mcrA gene
GGYGGTGTMGGDTTCACMCARTA 976-998a 43-65 68 469
Sequencing
/ QPCR
Modified from: Steinberg
and Regan 2009
mcrA-rev - R CGTTCATBGCGTAGTTVGGRTAGT 1421-1444a 42-54 66 Steinberg and Regan 2009
* The following primer name suffixes are used: - F – forward primer, - R – reverse primer, - P – dual labelled probe.
** Position is based on the following: primers targeting the 16S rRNA gene - E.coli; primers targeting the mcrA gene - Methanothermobacter
thermautotrophicus mcrA gene accession number: AAA73445 (following Steinberg and Regan, 2009);
† Calculated using Nearest Neighbour method with OligoAnalyzer 3.1 (http://eu.idtdna.com/analyzer/Applications/OligoAnalyzer/).
128
4| Methanogens in upland soil
129
4.7 References
Amann R, Ludwig W, Schleifer K. (1995). Phylogenetic identification and in situ
detection of individual microbial cells without cultivation. Microbiol. Rev. 59:143-169.
Angel R, Conrad R. (2009). in situ Measurement of Methane Fluxes and Analysis of
Transcribed Particulate Methane Monooxygenase in Desert Soils. Environ. Microbiol.
Angel R, Soares MIM, Ungar ED, Gillor O. (2010). Biogeography of Soil Archaea and
Bacteria Along a Steep Precipitation Gradient. ISME J. 4:553-563.
Ashelford KE, Weightman AJ, Fry JC. (2002). PRIMROSE: a Computer Program for
Generating and Estimating the Phylogenetic Range of 16S rRNA Oligonucleotide Probes
and Primers in Conjunction with the RDP-II database. Nucl. Acids Res. 30:3481-3489.
Auguet J, Barberan A, Casamayor EO. (2009). Global Ecological Patterns in Uncultured
Archaea. ISME J. 4:182-190.
Belnap J, Buedel B, Lange OL. (2002). Biological Soil Crusts: Characteristics and
Distrbution. In: Biological Soil Crusts, Belnap, J and Lange, OL, eds (ed)., Springer,
pp. 3-30.
Bintrim S, Donohue T, Handelsman J, Roberts G, Goodman R. (1997). Molecular
Phylogeny of Archaea from Soil. Proc. Nat. Acad. Sci. USA 94:277 -282.
Burggraf S, Huber H, Stetter KO. (1997). Reclassification of the Crenarchaeal Orders
and Families in Accordance with 16S rRNA Sequence Data. Int. J. Syst. Bacteriol.
47:657-660.
Conrad R. (1999). Contribution of Hydrogen to Methane Production and Control of
Hydrogen Concentrations in Methanogenic Soils and Sediments. FEMS Microbiol. Ecol.
28:193-202.
Conrad R. (2005). Quantification of Methanogenic Pathways Using Stable Carbon
Isotopic Signatures: A Review and a Proposal. Org. Geochem 36:739-752.
Conrad R, Claus P, Casper P. (2009). Characterization of Stable Isotope Fractionation
During Methane Production in the Sediment of a Eutrophic Lake, Lake Dagow,
Germany. Limnol. Oceanogr. 54:457-471.
Conrad R, Erkel C, Liesack W. (2006). Rice Cluster I Methanogens, an Important Group
of Archaea Producing Greenhouse Gas in Soil. Curr. Opin. Biotechnol. 17:262-267.
DeLong EF. (1992). Archaea in Coastal Marine Environments. Proc. Nat. Acad. Sci. USA
89:5685 -5689.
4| Methanogens in upland soil
130
DeLong EF. (1998). Everything in moderation: Archaea as `non-extremophiles'. Curr.
Opin. Genet. Dev 8:649-654.
Garcia J, Patel BKC, Ollivier B. (2000). Taxonomic, Phylogenetic, and Ecological
Diversity of Methanogenic Archaea. Anaerobe 6:205-226.
Garcia-Pichel F, Belnap J. (2002). Small-Scale Environments and Distribution of
Biological Soil Crust. In: Biological Soil Crusts, Belnap, J and Lange, OL, eds (ed).,
Springer.
Garcia-Pichel F. (2002). Desert Environments: Biological Soil Crusts. In: Encyclopedia of
Environmental Microbiology 6 Volume Set, Bitton, G, ed (ed)., Wiley-Interscience.
Garcia-Pichel F, Belnap J. (1996). Microenvironments and Microscale Productivity of
Cyanobacterial Desert Crusts. Journal of Phycology 32:774-782.
Gattinger A, Höfle MG, Schloter M, Embacher A, Böhme F, Munch JC, et al. (2007).
Traditional Cattle Manure Application Determines Abundance, Diversity and Activity of
Methanogenic Archaea in Arable European Soil. Environ. Microbiol. 9:612-624.
Gelwicks JT, Risatti JB, Hayes JM. (1994). Carbon Isotope Effects Associated with
Aceticlastic Methanogenesis. Appl. Environ. Microbiol. 60:467-472.
Goevert D, Conrad R. (2009). Effect of Substrate Concentration on Carbon Isotope
Fractionation During Acetoclastic Methanogenesis by Methanosarcina barkeri, M.
acetivorans and in Rice Field Soil. Appl. Environ. Microbiol. AEM.02680-08.
Grosskopf R, Janssen PH, Liesack W. (1998). Diversity and Structure of the
Methanogenic Community in Anoxic Rice Paddy Soil Microcosms as Examined by
Cultivation and Direct 16S rRNA Gene Sequence Retrieval. Appl. Environ. Microbiol.
64:960-969.
Hedderich R, Whitman WB. (2006). Physiology and Biochemistry of the Methane-
Producing Archaea. In: The Prokaryotes, Dworkin, M, Falkow, S, Rosenberg, E,
Schleifer, K, and Stackebrandt, E, eds (ed)., Springer New York.
Henckel T, Friedrich M, Conrad R. (1999). Molecular Analyses of the Methane-Oxidizing
Microbial Community in Rice Field Soil by Targeting the Genes of the 16S rRNA,
Particulate Methane Monooxygenase, and Methanol Dehydrogenase. Appl. Environ.
Microbiol. 65:1980-1990.
Janssen P, Frenzel P. (1997). Inhibition of Methanogenesis by Methyl Fluoride: Studies
of Pure and Defined Mixed Cultures of Anaerobic Bacteria and Archaea. Appl. Environ.
Microbiol. 63:4552-4557.
4| Methanogens in upland soil
131
Krzycki JA, Kenealy WR, DeNiro MJ, Zeikus JG. (1987). Stable Carbon Isotope
Fractionation by Methanosarcina barkeri during Methanogenesis from Acetate,
Methanol, or Carbon Dioxide-Hydrogen. Appl. Environ. Microbiol. 53:2597-2599.
Liu Y, Whitman W. (2008). Metabolic, Phylogenetic, and Ecological Diversity of the
Methanogenic Archaea. Ann. N.Y. Acad. Sci. 1125:171-189.
Lu Y, Conrad R. (2005). In Situ Stable Isotope Probing of Methanogenic Archaea in the
Rice Rhizosphere. Science 309:1088-1090.
Ludwig W, Strunk O, Westram R, Richter L, Meier H, Yadhukumar, et al. (2004). ARB: A
Software Environment for Sequence Data. Nucl. Acids Res. 32:1363-1371.
Lueders T, Manefield M, Friedrich MW. (2004). Enhanced Sensitivity of DNA- and rRNA-
Based Stable Isotope Probing by Fractionation and Quantitative Analysis of Isopycnic
Centrifugation Gradients. Environ. Microbiol. 6:73-78.
Luton PE, Wayne JM, Sharp RJ, Riley PW. (2002). The mcrA Gene as an Alternative to
16S rRNA in the Phylogenetic Analysis of Methanogen Populations in Landfill.
Microbiology 148:3521-3530.
Miyashita A, Hanako Mochimaru, Hiromi Kazama, Akiyoshi Ohashi, Takashi
Yamaguchi, Takuro Nunoura, et al. (2009). Development of 16S rRNA Gene-Targeted
Primers for Detection of Archaeal Anaerobic Methanotrophs (ANMEs). FEMS Microbiol.
Lett. 297:31-37.
Nicol GW, Glover LA, Prosser JI. (2003). Molecular Analysis of Methanogenic Archaeal
Communities in Managed and Natural Upland Pasture Soils. Global Change Biol.
9:1451-1457.
Nüsslein B, Eckert W, Conrad R. (2003). Stable Isotope Biogeochemistry of Methane
Formation in Profundal Sediments of Lake Kinneret (Israel). Limnol Oceanogr. 48:1439-
1446.
Ochsenreiter T, Selezi D, Quaiser A, Bonch-Osmolovskaya L, Schleper C. (2003).
Diversity and Abundance of Crenarchaeota in Terrestrial Habitats Studied by 16S RNA
Surveys and Real Time PCR. Environmental Microbiology 5:787-797.
Oremland R. (1988). Biogeochemistry of Methanogenic Bacteria. In:Biology of Anaerobic
Microorganisms, Zehnder, AJ, ed (ed)., John Wiley & Sons, Ltd.
Pace NR. (1997). A Molecular View of Microbial Diversity and the Biosphere. Science
276:734-740.
Pace NR. (2009). Mapping the Tree of Life: Progress and Prospects. Microbiol. Mol. Biol.
Rev. 73:565-576.

4| Methanogens in upland soil
132
Pei J, Grishin NV. (2007). PROMALS: Towards Accurate Multiple Sequence Alignments
of Distantly Related Proteins. Bioinformatics 23:802-808.
Peters V, Conrad R. (1995). Methanogenic and Other Strictly Anaerobic Bacteria in
Desert Soil and Other Oxic Soils. Appl. Environ. Microbiol. 61:1673-1676.
Peters V, Conrad R. (1996). Sequential Reduction Processes and Initiation of CH4
Production Upon Flooding of Oxic Upland Soils. Soil Biol. Biochem. 28:371-382.
Poplawski AB, Mårtensson L, Wartiainen I, Rasmussen U. (2007). Archaeal Diversity
and Community Structure in a Swedish Barley Field: Specificity of the
Ek510r/(EURY498) 16S rDNA Primer. J. Microbiol. Methods 69:161-173.
Pruesse E, Quast C, Knittel K, Fuchs BM, Ludwig W, Peplies J, et al. (2007). SILVA: a
Comprehensive Online Resource for Quality Checked and Aligned Ribosomal RNA
Sequence Data Compatible with ARB. Nucl. Acids Res. 35:7188-7196.
Radl V, Gattinger A, Chronakova A, Nemcova A, Cuhel J, Simek M, et al. (2007). Effects
of Cattle Husbandry on Abundance and Activity of Methanogenic Archaea in Upland
Soils. ISME J. 1:443-452.
Sakai S, Conrad R, Liesack W, Imachi H. (2010). Methanocella arvoryzae sp. nov., a
hydrogenotrophic methanogen, isolated from Italian rice field soil. Int. J. Syst. Evol.
Microbiol.
Schleper C, Holben W, Klenk H. (1997). Recovery of Crenarchaeotal Ribosomal Dna
Sequences from Freshwater-Lake Sediments. Appl. Environ. Microbiol. 63:321-323.
Schleper C, Jurgens G, Jonuscheit M. (2005). Genomic Studies of Uncultivated Archaea.
Nat. Rev. Micro. 3:479-488.
Stamatakis A. (2006). Raxml-Vi-Hpc: Maximum Likelihood-Based Phylogenetic Analyses
with Thousands of Taxa and Mixed Models. Bioinformatics 22:2688-2690.
Stams AJM, Plugge CM. (2009). Electron Transfer in Syntrophic Communities of
Anaerobic Bacteria and Archaea. Nat. Rev. Micro. 7:568-577.
Steinberg LM, Regan JM. (2008). Phylogenetic Comparison of the Methanogenic
Communities from an Acidic, Oligotrophic Fen and an Anaerobic Digester Treating
Municipal Wastewater Sludge. Appl. Environ. Microbiol. 74:6663-6671.
Takai K, Horikoshi K. (1999). Genetic Diversity of Archaea in Deep-Sea Hydrothermal
Vent Environments. Genetics 152:1285-1297.
Teh YA, Silver WL, Conrad ME. (2005). Oxygen Effects on Methane Production and
4| Methanogens in upland soil
133
Oxidation in Humid Tropical Forest Soils. Global Change Biol. 11:1283-1297.
Thauer RK, Jungermann K, Decker K. (1977). Energy Conservation in Chemotrophic
Anaerobic Bacteria. Microbiol. Mol. Biol. Rev 41:100-180.
Thauer RK, Zinkhan DM, Spormann AM. (1989). Biochemistry of Acetate Catabolism in
Anaerobic Chemotrophic Bacteria. Ann. Rev. Microbiol. 43-67.
Thauer RK, Kaster A, Seedorf H, Buckel W, Hedderich R. (2008). Methanogenic Archaea:
Ecologically Relevant Differences in Energy Conservation. Nat. Rev. Micro. 6:579-591.
Werner F. (2008). Structural Evolution of Multisubunit RNA Polymerases. Trends in
Microbiology 16:247-250.
West A, Schmidt S. (2002). Endogenous Methanogenesis Stimulates Oxidation of
Atmospheric CH4 in Alpine Tundra Soil. Microb. Ecol. 43:408-415.
Whitman WB, Bowen T, Boone D. (2006). The Methanogenic Bacteria. In: The
Prokaryotes, Dworkin, M, Falkow, S, Rosenberg, E, Schleifer, K, and Stackebrandt, E,
eds., Springer New York.
Woese CR, Fox GE. (1977). Phylogenetic Structure of the Prokaryotic Domain: The
Primary Kingdoms. Proc. Nat. Acad. Sci. USA 74:5088-5090.
Woese CR, Kandler O, Wheelis ML. (1990). Towards a natural system of organisms:
proposal for the domains Archaea, Bacteria, and Eucarya. Proc. Nat. Acad. Sci. USA
87:4576 -4579.
Yu Y, Lee C, Kim J, Hwang S. (2005). Group-Specific Primer and Probe Sets to Detect
Methanogenic Communities Using Quantitative Real-Time Polymerase Chain Reaction.
Biotechnol. Bioeng. 89:670-679.
Yuan Y, Conrad R, Lu Y. (2009). Responses of Methanogenic Archaeal Community to
Oxygen Exposure in Rice Field Soil. Environ. Microbiol. Rep. 1:347-35.

4| Methanogens in upland soil
134
135
Chapter 5|
Activation of Methanogenesis in Arid
Biological Soil Crusts Despite the
Presence of Oxygen
Roey Angel1, Diethart Matthies2 and Ralf Conrad1
1 Max-Planck-Institute for Terrestrial Microbiology, Karl-von-Frisch-Strasse 10, 35043,
Marburg, Germany
2 Department of Ecology, Faculty of Biology, University of Marburg, Karl-von-Frisch-
Strasse 8, 35032 Marburg, Germany
Contributions:
RA and RC designed the study; RA performed all lab work and data analyses; DM
assisted in statistical analysis; RA, DM and RC wrote the manuscript.

5| Methanogenesis in soil crusts
136
5.1 Abstract
Methanogenesis is traditionally thought to occur only in highly reduced,
anoxic environments. Wetland and rice field soils are well known sources
for atmospheric methane, while upland soils are considered sinks. Although
methanogens have been detected in low numbers in some upland, and even
in desert soils, it remains unclear whether they are active under natural oxic
conditions, such as in biological soil crusts (BSCs) of arid regions. To answer
this question we carried out a factorial experiment using microcosms under
simulated natural conditions. The BSC on top of an arid soil was incubated
under moist conditions in all possible combinations of flooding and
drainage, light and dark, air and nitrogen headspace. In the light, oxygen
was produced by photosynthesis. Methane production was detected in all
the microcosms, though rates were much lower when oxygen was present. In
addition, the δ13C of the methane differed between the oxic/oxygenic and
anoxic microcosms. While under anoxic conditions methane was mainly
produced from acetate, it was almost entirely from H2/CO2 under
oxic/oxygenic conditions. Only two genera of methanogens were identified in
the BSC – Methanosarcina and Methanocella; their abundance and activity in
transcribing the mcrA gene (coding for methyl-CoM reductase) was higher
under anoxic than oxic/oxygenic conditions, respectively. Both methanogens
also actively transcribed the oxygen detoxifying gene catalase. Since
methanotrophs were not detectable in the BSC, all the methane produced
was released into the atmosphere. Our findings point to a formerly unknown
participation of desert soils in the global methane cycle.

5| Methanogenesis in soil crusts
137
5.2 Introduction
Methane is the third most important greenhouse gas on earth after water
vapor and CO2 (Forster et al., 2007). Traditionally, methane is thought to
have 25 times the global warming potential (GWP) of CO2, but recent models,
which take into account direct and indirect interactions with aerosols,
estimate its GWP to be as high as 26 to 41 times that of CO2 over a 100-year
horizon (Shindell et al., 2009). Of the 500 – 600 Tg CH4 emitted annually
into the atmosphere about 74% is biogenic, i.e. the product of
methanogenesis (Denman et al., 2007). Despite the biogeochemical
importance of methanogenesis as a terminal electron sink in anoxic
environments, only one group of microorganisms, the methanogenic Archaea
(methanogens), are able to produce methane. The methanogens themselves
are phylogeneticaly divided into 5 families within the phylum Euryarchaea
and are comprised of 31 known genera. Biogenic methane can be produced
from a wide range of methylated compounds, but in most natural systems
methane arises from two pathways only: reduction of CO2 (hydrogenotrophic
methanogenesis) and cleavage of acetate (acetoclastic methanogenesis)
(Conrad, 2005). One exception is saline and hypersaline environments such
as marine sediments and salt lakes where methanogenesis from methylated
compounds such as trimethylamine can play a significant role (Oremland,
1988).
The traditional textbook notion is that methanogens are found only in
highly reduced, anoxic environments such as wetlands, rice fields, lentic and
marine sediments as well as in rumens and in the guts of termites. This
notion is based on two features of the physiology of methanogens: 1) they
are strict anaerobes and the presence of oxygen leads to the formation of
reactive oxygen species (ROS) which cause damages to cell membranes, DNA
and proteins (Storz et al., 1990). Particularly in methanogens, oxygen causes
an irreversible dissociation of the F420-hydrogenase enzyme complex, a
crucial electron transporter in methanogenesis (Schönheit et al., 1981).
Indeed, methane production in an active rice paddy soil was shown to cease
completely upon oxygen stress (Yuan et al., 2009). 2) Methanogens are poor
competitors for hydrogen and acetate with nitrate, iron and sulfate reducers.
5| Methanogenesis in soil crusts
138
Thus, even in the absence of oxygen, hydrogenotrophic or acetoclastic
methanogenesis only commences once most nitrate, ferric iron and sulfate in
the system are depleted (Zehnder and Stumm, 1988). Nevertheless, it has
been previously shown that many soils which are typically aerated, including
a desert soil, can turn methanogenic when incubated under anoxic
conditions as slurry (Peters and Conrad, 1995).
Deserts (semiarid, arid and hyperarid regions) span over 44 mil. km2
and make up 33% of the earth’s land surface (Verstraete and Schwartz,
1991). Desert soils are typically covered by a unique crust, of a few
millimeters, densely colonized by microorganisms. These include primarily
polysaccharide secreting/photosynthetic microorganisms such as
cyanobacteria and microalgae but also fungi, lichens and mosses as well as
an array of prokaryotic species about which little is known (Garcia-Pichel,
2002). These biological soil crusts (BSCs) are mostly inactive when dry but
regain near full photosynthetic activity within hours to a few days upon
wetting (Jeffries et al., 1993). As a result of their high microbial activity and
of their compact structure oxygen becomes limiting very quickly in active
BSCs and anoxic microniches are formed within it, where anaerobic
degradation processes can potentially take place (Garcia-Pichel and Belnap,
1996). We hypothesized that despite being strict anaerobes, some
methanogens are able to endure long periods of exposure to oxygen in the
BSC when it is dry and take advantage of anoxic micro-niches and fresh
organic matter which are formed after a rain event.
We used microcosms and simulated different natural conditions
following a rain event to investigate a possible methanogenic activity BSCs,
in particular when exposed to atmospheric oxygen levels. We set up a three-
factorial experiment with the following treatments: microcosms were
incubated under flooded or wet-drained conditions (denoted F and W resp.
in the text and figures), in the light or dark (denoted L and D resp.), and
under an oxic (air) or anoxic (N2) gas headspace (denoted O and N resp.), in
all possible combinations (Figure S5.1).
We followed gas evolution in the headspace of the microcosms as well
as the signature of the stable carbon isotopes (δ13C) in the CO2 and methane
to deduce the pathway in which the latter was formed. In addition, we used

5| Methanogenesis in soil crusts
139
molecular techniques to identify the active methanogens, quantify their
population size and transcription level using the 16S rRNA gene and the
marker gene for methanogenesis – methyl coenzyme M reductase (mcrA).
Finally, we quantified the expression of catalase (katE), which is part of the
microbial oxygen detoxification mechanism.
5| Methanogenesis in soil crusts
140
5.3 Results and Discussion
Methanogenesis under oxic atmosphere
Methane was detectable in the headspace of all microcosms seven days after
the start of the experiment and its accumulation was linear after the 14th
day, regardless of treatment (Figure 5.1). A strong, two orders of magnitude,
difference in the methanogenic activity was seen between the oxic and the
anoxic microcosms incubated in the dark. These anoxic treatments - FDN
and WDN - accumulated methane at a rate of 3800 + 400 and 1500 + 400
nmol gdw-1 d-1, respectively, while the corresponding oxic treatments – FDO
and WDO – accumulated methane at a rate of 41.6 + 12.4 and 9.2 + 4.3
nmol gdw-1 d-1, respectively. The microcosms incubated in the light showed
an average methane production of 21.7 + 3.7 nmol gdw-1 d-1. This average
rate was similar to that measured for the oxic microcosms in the dark, and
indeed methane production rates between these treatments were not
significantly different indicating no apparent effect of initial oxygen levels (P
= 0.66 in a t-test).
Active production of oxygen due to photosynthesis was observed in
the microcosms incubated in the light (Figure S5.2A). The oxygen fluxes
modeled from vertical oxygen concentration profiles ranged between 10 - 20
nmol cm-2 s-1 (Figure S5.3). Oxygen in these microcosms penetrated down to
about 1500 m, i.e. half the depth of the crust, below which the soil was
completely anoxic, while in the two oxic microcosms incubated in the dark
oxygen penetrated somewhat deeper down to about 2-2.5 mm. Overall,
oxygen penetration depth was in agreement with field measurements of a
BSC following a rain event (Garcia-Pichel and Belnap, 1996). Most of the
CO2 released from the BSCs accumulated in the microcosm headspaces
within the first week, but was much lower in the light treatment where it
was most likely used for photosynthesis (Figure S5.2B). Hydrogen levels
were, however, higher in the light than in the dark treatments (Figure
S5.2C). In fact, hydrogen in the oxic dark treatment was below the detection
limit throughout the experiment.
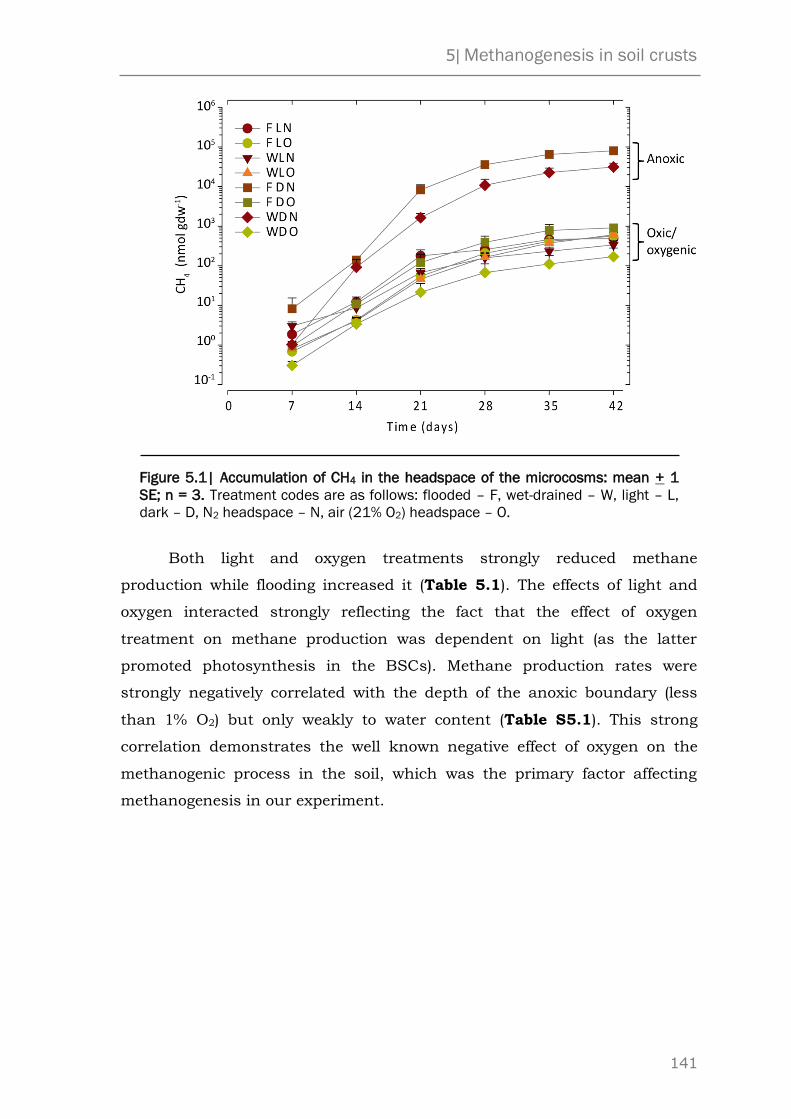
5| Methanogenesis in soil crusts
141
Figure 5.1| Accumulation of CH4 in the headspace of the microcosms: mean + 1
SE; n = 3. Treatment codes are as follows: flooded – F, wet-drained – W, light – L,
dark – D, N2 headspace – N, air (21% O2) headspace – O.
Both light and oxygen treatments strongly reduced methane
production while flooding increased it (Table 5.1). The effects of light and
oxygen interacted strongly reflecting the fact that the effect of oxygen
treatment on methane production was dependent on light (as the latter
promoted photosynthesis in the BSCs). Methane production rates were
strongly negatively correlated with the depth of the anoxic boundary (less
than 1% O2) but only weakly to water content (Table S5.1). This strong
correlation demonstrates the well known negative effect of oxygen on the
methanogenic process in the soil, which was the primary factor affecting
methanogenesis in our experiment.

Table 5.1| ANOVA analyses (least squares) testing the effect of the various incubation conditions on methane production rates
and ratios of gene and transcript copies
Log methane production rate 16S MSL/ARC* msar/mcrA gen. DNA** msar/mcrA gen. cDNA†
Source of variation Mean
square
F Sig. ††
P > |F|
Mean
square
F Sig.
P > |F|
Mean
square
F Sig.
P > |F|
Mean
square
F Sig.
P > |F|
Light 6.45 59.61 <0.01 0.64 12.74 <0.01 0.80 8.70 0.01 0.36 8.25 0.01
Oxygen 5.82 53.82 <0.01 0.44 8.62 0.01 0.84 9.11 0.01 0.45 10.16 0.01
Flooding 1.32 12.25 0.03 0.02 0.39 0.54 0.00 0.00 0.99 0.13 2.98 0.10
Light * Oxygen 10.14 93.75 <0.01 0.15 3.02 0.10 0.00 0.00 0.96 0.84 19.20 <0.01
Light * Flooding 0.43 3.99 0.06 0.08 1.59 0.22 0.70 7.57 0.01 0.00 0.04 0.85
Oxygen * Flooding 0.02 0.20 0.66 0.01 0.15 0.70 0.15 1.63 0.22 0.53 12.04 <0.01
Light * Oxygen *
Water
0.29 2.76 0.12 0.11 2.24 0.15 0.08 0.85 0.37 0.05 1.10 0.31
Error§ 0.11 0.05 0.09 0.04
* Ratio of 16S rRNA gene copies of Methanosarcina to general Archaea
** Ratio of mcrA gene copies of Methanosarcina to general mcrA
† Ratio of mcrA transcript copies of Methanosarcina to general mcrA
†† Values in red are significant at P < 0.05
§ Degrees of freedom for error in all tests: 16
142
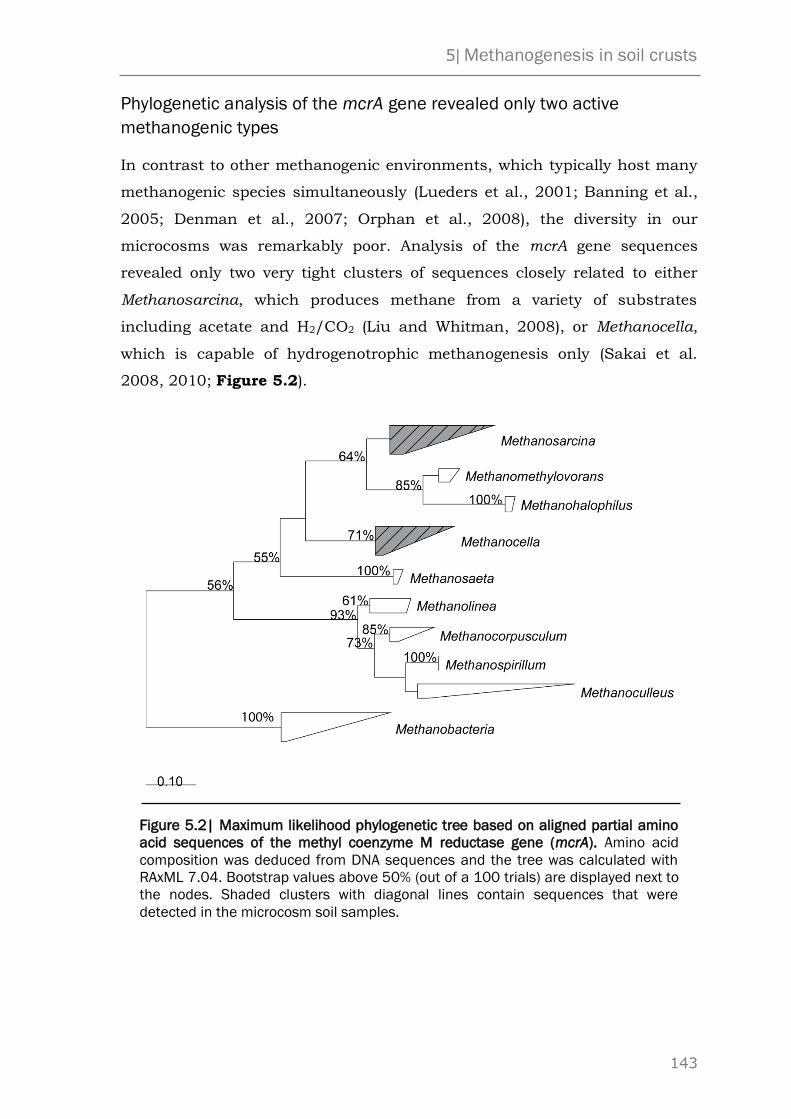
5| Methanogenesis in soil crusts
143
Phylogenetic analysis of the mcrA gene revealed only two active
methanogenic types
In contrast to other methanogenic environments, which typically host many
methanogenic species simultaneously (Lueders et al., 2001; Banning et al.,
2005; Denman et al., 2007; Orphan et al., 2008), the diversity in our
microcosms was remarkably poor. Analysis of the mcrA gene sequences
revealed only two very tight clusters of sequences closely related to either
Methanosarcina, which produces methane from a variety of substrates
including acetate and H2/CO2 (Liu and Whitman, 2008), or Methanocella,
which is capable of hydrogenotrophic methanogenesis only (Sakai et al.
2008, 2010; Figure 5.2).
Figure 5.2| Maximum likelihood phylogenetic tree based on aligned partial amino
acid sequences of the methyl coenzyme M reductase gene (mcrA). Amino acid
composition was deduced from DNA sequences and the tree was calculated with
RAxML 7.04. Bootstrap values above 50% (out of a 100 trials) are displayed next to
the nodes. Shaded clusters with diagonal lines contain sequences that were
detected in the microcosm soil samples.
5| Methanogenesis in soil crusts
144
Because of this low complexity of the methanogenic community we could
individually quantify the 16S rRNA gene copies and mcrA gene and
transcripts copies for the different methanogenic types as well as generally
quantify the 16S rRNA gene of the archaeal community, and the total mcrA
gene and transcript copies. We observed differences between individual
treatment combinations, but by far the strongest effects were a smaller
methanogenic community and lower transcription levels in the oxic/oxygenic
microcosms (Figure 5.3).
16S rRNA and mcrA gene copies were in the range of 108 – 109 copies
gdw-1 in the anoxic but only 103 – 107 in the oxic/oxygenic microcosms. In
all treatments we observed an increase in the quantity of mcrA gene copies
from 3.15 x 10⁴ copies gdw-1 in the soil before incubation to at least 4.16 x
105 copies gdw-1 (a tenfold increase in the WLO treatment) and up to 1.15 x
109 copies gdw-1 in the FDN treatment (an increase of almost five orders of
magnitude). Apart from a general effect of oxygen on the community size and
gene expression, we noted a differential effect of oxygen on Methanocella and
Methanosarcina. The ratio of Methanosarcina to total 16S rRNA gene copies
was significantly lower in the light and oxygen-dark than in the anoxic
treatments (Table 5.1, Figure 5.3). In contrast to the effect on methane
production, flooding did not have a significant effect on the ratio of
Methanosarcina to total 16S rRNA gene copies. The same trend was seen for
the ratio of Methanosarcina versus the general mcrA gene and transcript
copies.

5| Methanogenesis in soil crusts
145
Figure 5.3| Gene and transcript copy numbers quantified using qPCR plotted
against methane production rates: mean + 1 SE; n = 3. In situ refers to the dry BSC
prior to any treatment. A. mcrA gene and transcript copy numbers. B. 16S rRNA
gene copy numbers.
Stable isotope analysis reveals different methanogenic pathways
under oxic and anoxic atmospheres. We also analyzed the stable isotope
5| Methanogenesis in soil crusts
146
signature of the carbon in methane and CO2 (13C: 12C) to decipher the
proportional contribution of different methanogenic pathways (Conrad,
2005). Our analysis of isotopic signatures (Figure 5.4) revealed two distinct
clusters: all strictly anoxic microcosms had 13C-nCH4 (isotopic signature of
the newly formed methane) values ranging from -63‰ on average in the first
week of incubation and stabilizing at -35‰ on average throughout the rest
of the incubation period, and 13C-CO2 values of -16 to -7‰. The
oxic/oxygenic microcosms showed lighter isotopic signatures with average
13C values of -75‰ and -20‰ for methane and CO2, respectively, and were
stable over time. The difference between the two clusters in the isotopic
signatures of the CO2 (Figure 5.4) can be related to the difference in the
signature of the organic carbon and the carbonate reservoir in the soil,
which constituted up to 34% of the soil mass (Angel et al., 2010). The 13C of
carbonate (-4.09‰) was heavier than that of organic carbon (-20.5‰). In
the oxic/oxygenic microcosms CO2 was probably produced from organic
matter only. However, in the anoxic microcosms, the CO2 was apparently
also generated from the carbonate. The contribution of carbonate may be
attributed to the higher acidity associated with anaerobic (compared to
aerobic) degradation processes.
The 13C values of CO2 and CH4 allow the calculation of mean
apparent fractionation factors (app; eq.2). The app for the strictly anoxic
microcosms was 1.025 + 0.002, which was much smaller than the app =
1.065 + 0.003 obtained for the oxic/oxygenic microcosms, indicating
different methanogenic pathways under the two treatments. The large
fractionation factor obtained for the oxic/oxygenic microcosms is well within
the range of 1.040 - 1.080, typically seen for hydrogenotrophic
methanogenesis in pure cultures and in soils at moderate temperatures (20-
30 oC; Conrad, 2005). Indeed, also for this soil we obtained a fractionation
factor of 1.066 when acetoclastic methanogenesis was inhibited using CH3F.
We therefore conclude that in oxic/oxygenic microcosms CH4 was almost
entirely produced from H2/CO2. The nearly complete lack of acetoclastic
methanogenesis in the oxic/oxygenic microcosms could be the result of
competition with heterotrophs that oxidize acetate aerobically. Indeed,
acetate concentrations were generally much lower in the pore water of
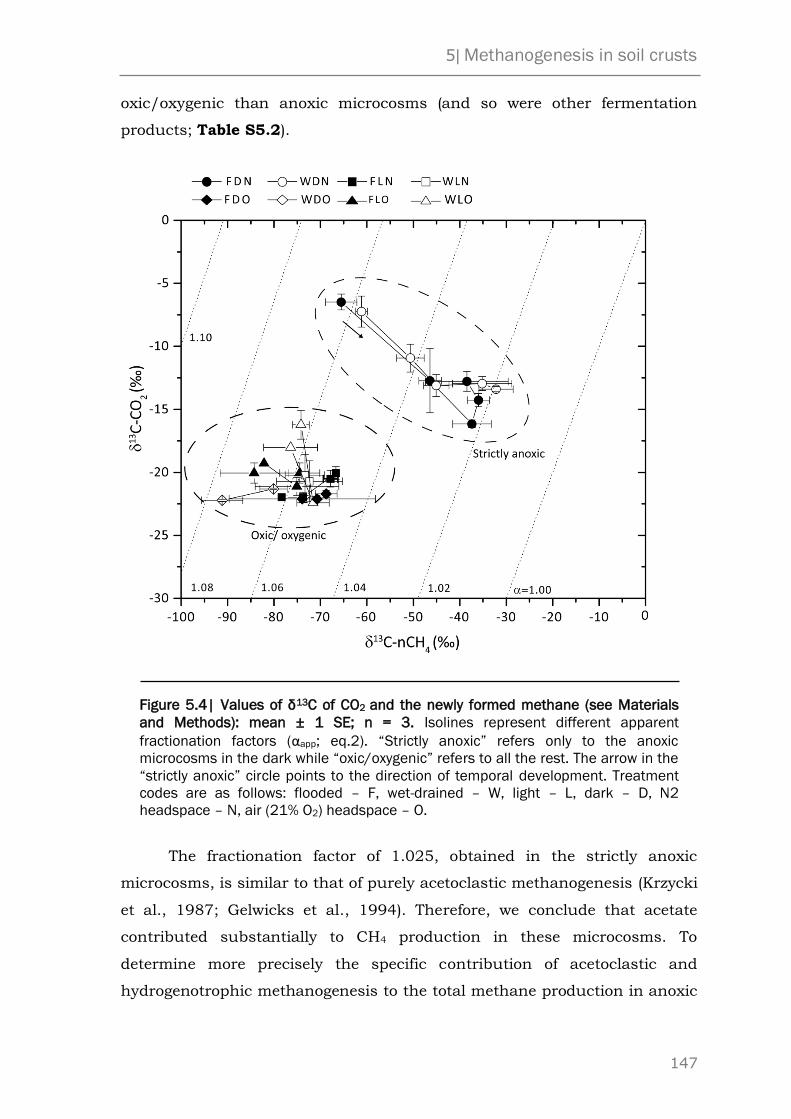
5| Methanogenesis in soil crusts
147
oxic/oxygenic than anoxic microcosms (and so were other fermentation
products; Table S5.2).
Figure 5.4| Values of δ13C of CO2 and the newly formed methane (see Materials
and Methods): mean ± 1 SE; n = 3. Isolines represent different apparent
fractionation factors (αapp; eq.2). “Strictly anoxic” refers only to the anoxic
microcosms in the dark while “oxic/oxygenic” refers to all the rest. The arrow in the
“strictly anoxic” circle points to the direction of temporal development. Treatment
codes are as follows: flooded – F, wet-drained – W, light – L, dark – D, N2
headspace – N, air (21% O2) headspace – O.
The fractionation factor of 1.025, obtained in the strictly anoxic
microcosms, is similar to that of purely acetoclastic methanogenesis (Krzycki
et al., 1987; Gelwicks et al., 1994). Therefore, we conclude that acetate
contributed substantially to CH4 production in these microcosms. To
determine more precisely the specific contribution of acetoclastic and
hydrogenotrophic methanogenesis to the total methane production in anoxic
5| Methanogenesis in soil crusts
148
microcosms, we made the following reasonable assumptions. We assumed
that the isotopic signature of the methane in the oxic/oxygenic microcosms
was characteristic for hydrogenotrophically produced methane. We further
estimated the 13-C of acetoclastically produced methane from the 13-C the
soil organic carbon (-20.5‰), assuming that the fractionation of organic C to
acetate was only small, and that of acetate to methane was either zero or
was -25.6‰ (Goevert and Conrad, 2009). By using equation 3 we could then
confine the fraction of acetoclastic methanogenesis in the anoxic microcosms
to 0.72-1.00 following the first week of incubation.
The BSC lacks methane oxidizing bacteria.
Our comparison of methane production rates and isotopic signatures is
based on the assumption that all methane which had been produced was
released into the headspace and none of it was oxidized by methane-
oxidizing bacteria in the soil, which could potentially reduce the measured
concentrations and alter the isotopic signature (Whiticar, 1999). We
previously showed (Angel and Conrad, 2009) that active methanotrophs
appear to reside only below the BSC, down to a depth of approx. 20 cm. No
methane uptake activity and no transcription of the key enzyme in aerobic
methane oxidation – the particulate methane monooxygenase (pmmo) – could
be detected in the BSC itself. We have confirmed this observation also in this
study as no pmmo transcripts could be detected in the microcosm samples
by PCR.
BSC methanogens transcribe oxygen detoxification genes
For methanogens to be active in a system such as the BSC, which is exposed
to atmospheric levels of oxygen throughout most of the year, when dry, and
to a constant flux of oxygen, albeit at sub-atmospheric levels, when wet and
active, they need to be able to efficiently detoxify reactive oxygen species
(ROS). Indeed, it has been previously noted that both Methanosaricna and
Methanocella contain a range of genes encoding enzymes that detoxify
reactive oxygen species. These include enzymes such as catalase (kat),
superoxic dismutase (sod), superoxic reductase (sor) and others (Erkel et al.,

5| Methanogenesis in soil crusts
149
2006). The metgenome sequence of RC-I strain MRE50 (now Methanocella
arvoryzae) contained 7 different putative genes whose function is associated
with detoxification of ROS (Erkel et al., 2006). Since Methanosarcina only
contains 6 such genes, Methanocella is potentially the most oxygen-tolerant
methanogen. We tested for the presence of catalase E (KatE) gene transcripts
using katMsl and katRCI primer pairs for Methanosarcina and Methanocella,
respectively (Table S5.3), and performed phylogenetic analysis. All
sequences clustered tightly to their respective methanogen cultivar from
which the primers were designed (Figure S5.4). Indeed, the KatE sequences
retrieved from our microcosms showed a remarkable similarity to those of
the cultivated methanogens with only a 1.8% and 4.7% difference in the
amino acid sequence for Methanocella and Methanosarcina, respectively. By
comparison, there is a 7.4% and 6.3% difference, respectively, in the mcrA
sequence at the amino acid level. We compared also the relative expression
(transcripts to genes) in differently treated microcosms with respect to the
set level of oxygen using qPCR (Table 5.2). Our results show that while katE
is being expressed we see no significant over expression in response to
oxygen. This is in agreement with the results by Zhang and colleagues
(2006) who reported no up regulation of catalase in Methanosarcina barkeri
in response to air exposure (Zhang et al., 2006), but in contrast to
Brioukhanov and colleagues (2006) who reported the opposite in response to
oxidative stress.

5| Methanogenesis in soil crusts
150
Table 5.2| Differences in relative expression of katE (ΔΔCt*) in Methanocella and
Methanosarcina between paired treatments. Mean ± 1 SE.
Treatment
comparison Methanocella Methanosarcina
FLN - FLO -2.2† ± 1.3 -5.6 ± 4.3
WLN - WLO 1.4 ± 2.3 -0.4 ± 0.9
FDN - FDO 1.7 ± 0.6 -1.5 ± 1.4
WDN - WDO 1.1 ± 1.6 -3.4 ± 3.0
* Each Ct unit represents a two-fold difference in expression. † Positive values represent upregulation in the second matched treatment
compared to the first. Treatment codes are as follows: flooded – F, wet-drained – W, light – L, dark – D, N2 headspace – N, air (21% O2) headspace – O.
Conclusions
The results presented show that while methanogens are strict anaerobes, at
least some of them are more resilient than so far assumed. Former studies
have demonstrated the ability of certain methanogenic cultures to endure
desiccation and exposure to high levels of oxygen, probably in resting forms
(Liu et al., 2008; Fetzer et al., 1993). Here we showed that Methanosarcina
and Methanocella species, in particular, are able to tolerate long periods of
desiccation in an arid soil and become metabolically active and start growing
within just a few days after wetting.
It was previously shown that Methanocella are usually the most
abundant and active methanogens in rice fields (Ramakrishnan et al., 2001;
Lu and Conrad, 2005). It appears that they are also the dominant
methanogens in BSCs. Methanocella and Methanosarcina spp. have
apparently different ecological roles in nature. Although both are
cytochrome-containing methanogens, they differ in their substrate range,
threshold level to hydrogen concentrations and growth yield (Thauer et al.,
2008). Our experiments showed differential activity and growth of either
methanogen under different conditions and it is possible that niche
differentiation or dominance of either methanogen under different natural
conditions permits their coexistence in soil.
5| Methanogenesis in soil crusts
151
The production of biogenic methane in a BSC proves not just the
activity of methanogens but indicates that of a whole cascade of anaerobes
which constitute a formerly unrecognized part of the BSC biome. These
include primary and secondary fermenters, syntrophs and maybe acetogens
whose identity in these systems is yet to be elucidated but which are
required for the different stages of the anaerobic degradation process
(Zinder, 1993; Stams and Plugge, 2009). This array of microbes remains
inactive during long periods when the soil is dry and saturated with oxygen
but is apparently able to react quickly and take advantage of short periods
when water is available and anoxic microniches can be formed.
Additionally, some hydrogen might be directly transferred from
cyanobacteria to the methanogens and used as substrate for
methanogenesis as occurs in some hypersaline mats (Hoehler et al., 2001).
Plant litter constitutes most likely part of the organic substrate but primary
producing microorganisms such as cyanobacteria probably also play a role
in releasing fresh organic exudates into the soil even when water availability
is very low (Wilske et al., 2008; Rao et al., 2009; Lange et al., 1994). While
cyanobacteria have been shown to be activated by as little as 0.2 mm of rain
or even fog or dew (Lange et al., 1992), it is currently not known what
amount of water is required to activate the anaerobic part of the BSC. Our
findings shed light on a new and unexpected function of arid soils and might
point to a previously unknown contribution of biological soil crusts, and
perhaps other aerated soils, to the global methane cycle.
5| Methanogenesis in soil crusts
152
5.4 Experimental procedure
Soil sampling and characterization
In April 2009 the top 3-4 millimeters of the soil comprising the biological soil
crust in an arid site located in the northern Negev Desert in Israel were
sampled. The soil is a calcareous silty loam and was previously
characterized (Angel and Conrad, 2009).
Microcosm design and incubation conditions
Microcosms were designed after Murase and Frenzel (2007) with few
technical modifications. In principle, the microcosm were gas-tight plastic
vessels, which consisted of a lower compartment (approximately 60 ml) and
hydrophilic polyamide membrane (Whatman). Non-sieved, homogenized
fractures of BSC (20 g, approximately 3 mm ø on average) were placed on
top of the membrane and amended with sterile deionized water, thus
generating a wet soil layer of approximately 3 mm, mimicking its actual
thickness in the field. The bottom compartment of the microcosm contained
either sterile deionized water (“flooded” treatment) or 0.1-0.3 mm quartz
sand, baked (180 oC, 24 h), saturated with sterile deionized water and then
drained (“wet-drained”). The upper compartment served as gas headspace,
which was flushed with either N2 (“anoxic”) or 80% N2, 21% O2 (“oxic”).
Oxygen was supplemented daily to maintain atmospheric levels (“oxic”) or
was flushed several times during the incubation with N2 to maintain levels at
below 5% O2 (“anoxic” under light). Three replicate microcosms of each of the
four possible combinations of treatments were incubated at 25o C in full
darkness (“dark”) or under constant light (3000 Lux) for 42 days (“light”;
Figure S5.1).
5| Methanogenesis in soil crusts
153
Gas measurements
Gas samples were taken from the headspace of the microcosms at regular
time intervals using a gas-tight pressure-lok® syringe (Vici) and analyzed
immediately using a gas chromatograph (GC) and a gas chromatograph
combustion isotope ratio mass spectrometer (GC-C-IRMS). Methane
production rates (nmol gdw-1 d-1) were calculated for the entire incubation
period using linear regression.
Stable isotopes analysis
The carbon isotope signature 13C was determined using GC-C-IRMS against
the V-PDB standard as described previously (Ralf Conrad et al. 2009). 13C
in the organic matter was analysed at the Institute for Soil Science and
Forest Nutrition (IBW) at the University of Göttingen, Germany (courtesy of
Heinz Flessa), using an elemental analyzer coupled to mass spectrometer.
Measurements were done before and after acidification, the difference being
due to carbonate (Nüsslein et al., 2003).
Isotopic calculations and estimation of the approximate fraction of
hydrogenotrophic methanogenesis of the total methanogenesis were done
after Conrad (2005). Briefly, the fraction of the newly formed methane
between two time points is given by:
2 = fnn + (1 – fn)1 [1]
where 1,2 and n are the isotopic signatures of the methane at times 1
and 2 and of the newly formed, respectively, while fn is the fraction of the
newly formed methane at time 2.
The apparent fractionation factor for the conversion of CO2 to CH4 is given
by:
app = (CO2 + 1000) / (CH4 + 1000) [2]
where CO2 and CH4 are the isotopic signatures of the carbon in CO2 and CH4,
respectively. The relative fraction of H2/CO2-derived CH4 in the total
generated CH4 was determined from
fH2 = (CH4 - ma) / (mc - ma) [3]
5| Methanogenesis in soil crusts
154
where ma and mc are the specific isotopic signatures of the carbon in
methane produced solely from acetate and H2/CO2, respectively. To
determine mc, 5 g of BSC was incubated with sterile deionized water (1:1) in
a glass tube and supplemented with 3% CH3F which gave complete
inhibition of acetoclasitc methanogenesis (Janssen and Frenzel, 1997). The
carbon isotope signature was determined during 42 days of incubation as
described above.
Pore water analysis and oxygen profiles
After incubation was completed, microcosms were opened and
approximately 1 g of soil was sampled for nucleic acid extraction,
immediately frozen in liquid nitrogen and stored at -80 oC until analysis.
Additionally, approximately 2 ml of pore water were collected and analyzed
using high pressure liquid chromatography. Water content was determined
gravimetrically and oxygen profiles in the soil were determined using an OX-
50 glass microsensor (Unisense). The oxygen fluxes were modelled using the
Profile V1.0 tool (Berg et al., 1998). The anoxic boundary was determined as
the depth bellow which oxygen concentration was below 1% was.
Molecular characterization and quantification of archaeal 16S rRNA,
mcrA and catalase genes
Total nucleic acids were extracted by disrupting 0.5 g of soil in a FastPrep®-
24 bead beater in the presence of phosphate buffer, 10% SDS solution and
phenol. Following phenol/chloroform purification a subsample was treated
with DNase, and the RNA was purified. Random hexamer primers (0.5 g)
were used for complete cDNA synthesis which was used for amplification of
the 16S rRNA and catalase (KatE) genes, while for amplification of the mcrA
gene 2 pmol of the mcrA-rev primer (Table S5.3) were used for mcrA cDNA
synthesis. All molecular characterizations were done using the primers listed
in Table S5.3. Phylogenetic characterization of the methanogenic
community was performed by amplifying and cloning the methyl coenzyme
reductase M gene (mcrA) and catalase (KatE). Gene and transcript
quantifications were done via qPCR (iCycler; Bio-Rad) using either SYBR®
5| Methanogenesis in soil crusts
155
Green or dual labelled probe technology. For more details see supplementary
information.
Phylogenetic analysis
Phylogenetic analysis was based on aligned partial amino acid sequences of
mcrA performed using PROMALS (Pei and Grishin, 2007). Amino acid
composition was deduced from DNA sequences and the tree was calculated
with RAxML 7.04 using rapid hill climbing algorithm and PROTMIX - JTT
evolutionary model (Stamatakis, 2006).
Statistical analysis
The effects of the three treatments on methane production rates, 16S rRNA
and mcrA gene copy ratios were analyzed by three-factorial analysis of
variance using MATLAB (http://www.mathworks.com). Methane production
rates and gene copy numbers obtained by QPCR were log transformed prior
to analysis. As anoxic boundary, the depth where oxygen level dropped
below 1% was used.

5| Methanogenesis in soil crusts
156
5.5 Supplementary material
Molecular characterization of archaeal 16S rRNA, mcrA and KatE genes.
Table S5.3 summarizes the primers and probes used in this study to
monitor and quantify the Archaeal population. For reconstruction of
phylogenetic trees we used the ARB software package (Ludwig et al., 2004).
Analysis and oligonucleotide design of 16S rRNA gene sequences were done
using the Silva database (Pruesse et al., 2007), while for analyses of mcrA
and KatE gene sequences specific ARB databases were built. The mcrA
database was built from 5200 translated nucleic acid sequences and aligned
using Promals (Pei and Grishin, 2007). Catalase database was based on 26
translated nucleic acid sequences and aligned in ARB using the Clustal
algorithm (Higgins and Sharp, 1988). All sequences were obtained from
EMBL (http://www.ebi.ac.uk/embl/) and the databases are available at:
http://www.staff.uni-marburg.de/~angel/. Reconstruction of the catalase
gene maximum likelihood phylogenetic tree was conducted with RAxML 7.04
using rapid hill climbing algorithm and PROTMIX-JTT evolutionary model
(Stamatakis, 2006). The new qPCR probe and PCR primers used in this
study were designed using PRIMROSE (Ashelford et al., 2002). Primers for
katE of Methanocella and Methanosarcina were designed from the catalase
gene sequences of Methanocella arvoryzae (formerly RC-IMRE50; CAJ36024)
and Methanosarcina mazei (AAM32253), respectively. qPCR probe for mcrA of
Methanocella was designed from the environmental sequences obtained in
this study as well as from the mcrA gene sequence of Methanocella arvoryzae
(formerly RC-IMRE50 ;YP_686530.1).
For sequencing of mcrA the primer pair mlas-mod – mcrA-rev was
used and for katE the primer pairs katRCI and katMsr were used. As
templates for both clone libraries we used DNA obtained from FDN and FLO
treatments. Libraries were constructed using purified PCR products and
pGEM-T Easy cloning kit (Promega). PCR amplifications were done using the
following mixture: Each PCR reaction contained 5 µl 10X AccuPrime™ PCR
Buffer II (Invitrogen), additional 1.5 mM MgCl2 (to a final concentration of 3
mM), 0.5 M of each primer (Sigma), 50 g BSA (Roche), 1 µl of Taq DNA
5| Methanogenesis in soil crusts
157
polymerase (Invitrogen) and 2 µl of template. The following program was
used for katE amplification: 94°C for 4 min followed by 10 touchdown cycles
of 94°C for 1 min, 62°C - 1°C for 1 min and 68°C for 1 min followed by 25
cycles of 94°C for 1 min, 52°C for 1 min and 68°C for 1 min, and a single
step of final elongation at 68°C for 10 min. For amplification of the mcrA
gene the following program was used: 94°C for 4 min followed by 5
touchdown cycles of 94°C for 30 s, 60°C - 1°C for 45 s and 72°C for 30 s
followed by 30 cycles of 94°C for 30 s, 55°C for 30 s and 72°C for 30 s, and a
single step of final elongation at 72°C for 10 min. Sanger sequencing services
were provided by GATC (Germany). The primer M13r targeting flanking
regions of the insert was used to sequence a total of 96 clones (48 from each
library) of mcrA and 48 clones of katE (12 from each library and primer pair).
Verification for lack of transcription of pmmo was done using RT-PCR as
described previously (Angel and Conrad, 2009).
Gene and transcript quantification using qPCR
All qPCR reactions were performed on an iCycler thermocycler equipped with
a MyiQ™ detection system and the data was analyzed using iQ5 Optical
System software (Bio-Rad). Quantification of universal archaeal 16S rRNA
gene, mcrA and katE copy numbers were based on SYBR® Green. Each
reaction was 25 l in volume and contained the following mixture: 12.5 l
SYBR® Green JumpStart™ Taq ReadyMix™, 3 mM MgCl2, 0.8 g l-1 BSA
(Ambion), 0.66 (16S rRNA gene) or 0.5 (other) M of each primer, and 5 or 2
l of template (DNA and cDNA resp.). The program used was: 94°C for 5 min
followed by 40 cycles of 94°C for 30 s, 66 (16SrRNA gene) or 57°C (other) for
45 s, 72°C for 30 s and 84°C for 10 s for signal reading.
The essays targeting the 16S rRNA and mcrA genes of Methanosarcina and
Methanocella were based on dual labelled probes. Each reaction was 25 l in
volume and contained the following mixture: 12.5 l JumpStart™ Taq
ReadyMix™, 4 mM MgCl2, 0.8 g l-1 BSA (Ambion), 0.5 M of each primer,
0.2 M of the dual labelled probe and 5 or 2 l of template (DNA and cDNA
resp.). For the 16S rRNA gene essays, the programme used was: 94°C for 5
5| Methanogenesis in soil crusts
158
min followed by 40 cycles of 94°C for 30 s, 57°C (mcrA gene) or 60°C (16S
rRNA gene) for 45 s for annealing and 62°C for 30 s for elongation and signal
reading. DNA standard for the universal archaeal and Methanosarcina 16S
rRNA gene essays was prepared from a pure culture of Mehtanosarcina
thermophila according to Lueders and colleagues (2004), while for
Methanocella 16S rRNA gene essay it was prepared from a clone containing
16S rRNA gene affiliated with Methanocella as a plasmid insert. A standard
for the universal mcrA essay and the Methanosarcina mcrA essays was
prepared from a pure culture of Mehtanosarcina thermophila. For
Methanocella mcrA essay, a clone containing an environmental sequence was
used as template for a standard. For quantification of cDNA, mRNA
transcripts of mcrA were synthesized from the clones used for making the
DNA standard using Riboprobe® (Promega). Remaining DNA was digested
using TURBO™ DNase (Ambion) and the RNA was purified using RNeasy®
MinElute® Cleanup Kit (Qiagen). Pure RNA was quantified using Quant-iT™
RiboGreen® (Invitrogen) and cDNA was synthesized using mcrA-rev primer.
The cDNAs were used as standards for quantification of mcrA transcripts.
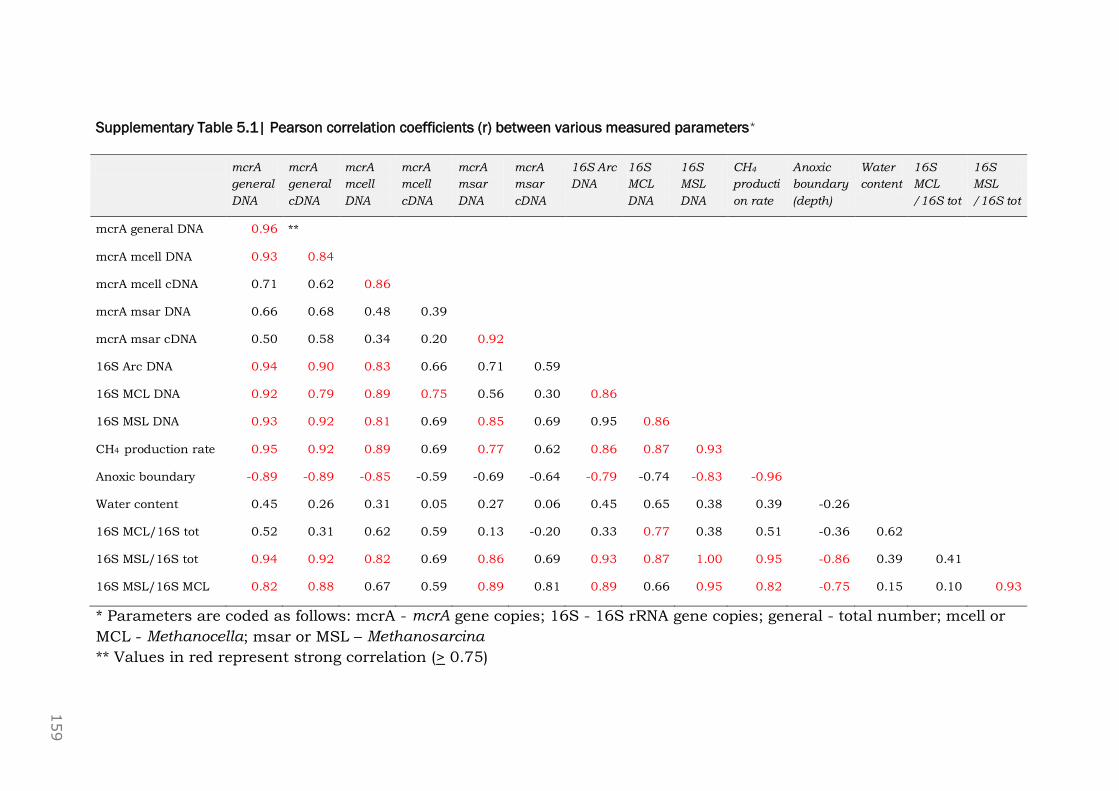
Supplementary Table 5.1| Pearson correlation coefficients (r) between various measured parameters*
mcrA
general
DNA
mcrA
general
cDNA
mcrA
mcell
DNA
mcrA
mcell
cDNA
mcrA
msar
DNA
mcrA
msar
cDNA
16S Arc
DNA
16S
MCL
DNA
16S
MSL
DNA
CH4
producti
on rate
Anoxic
boundary
(depth)
Water
content
16S
MCL
/16S tot
16S
MSL
/16S tot
mcrA general DNA 0.96 **
mcrA mcell DNA 0.93 0.84
mcrA mcell cDNA 0.71 0.62 0.86
mcrA msar DNA 0.66 0.68 0.48 0.39
mcrA msar cDNA 0.50 0.58 0.34 0.20 0.92
16S Arc DNA 0.94 0.90 0.83 0.66 0.71 0.59
16S MCL DNA 0.92 0.79 0.89 0.75 0.56 0.30 0.86
16S MSL DNA 0.93 0.92 0.81 0.69 0.85 0.69 0.95 0.86
CH4 production rate 0.95 0.92 0.89 0.69 0.77 0.62 0.86 0.87 0.93
Anoxic boundary -0.89 -0.89 -0.85 -0.59 -0.69 -0.64 -0.79 -0.74 -0.83 -0.96
Water content 0.45 0.26 0.31 0.05 0.27 0.06 0.45 0.65 0.38 0.39 -0.26
16S MCL/16S tot 0.52 0.31 0.62 0.59 0.13 -0.20 0.33 0.77 0.38 0.51 -0.36 0.62
16S MSL/16S tot 0.94 0.92 0.82 0.69 0.86 0.69 0.93 0.87 1.00 0.95 -0.86 0.39 0.41
16S MSL/16S MCL 0.82 0.88 0.67 0.59 0.89 0.81 0.89 0.66 0.95 0.82 -0.75 0.15 0.10 0.93
* Parameters are coded as follows: mcrA - mcrA gene copies; 16S - 16S rRNA gene copies; general - total number; mcell or
MCL - Methanocella; msar or MSL – Methanosarcina
** Values in red represent strong correlation (> 0.75)
159
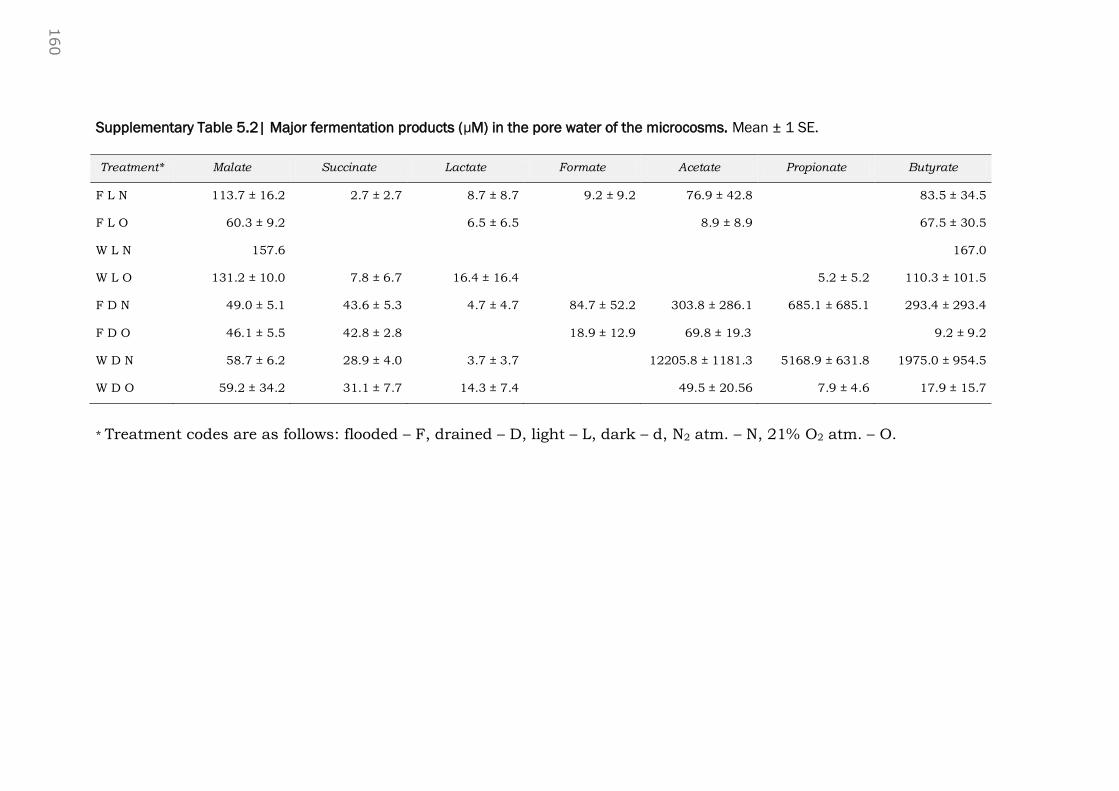
Supplementary Table 5.2| Major fermentation products (µM) in the pore water of the microcosms. Mean ± 1 SE.
Treatment* Malate Succinate Lactate Formate Acetate Propionate Butyrate
F L N 113.7 ± 16.2 2.7 ± 2.7 8.7 ± 8.7 9.2 ± 9.2 76.9 ± 42.8 83.5 ± 34.5
F L O 60.3 ± 9.2 6.5 ± 6.5 8.9 ± 8.9 67.5 ± 30.5
W L N 157.6 167.0
W L O 131.2 ± 10.0 7.8 ± 6.7 16.4 ± 16.4 5.2 ± 5.2 110.3 ± 101.5
F D N 49.0 ± 5.1 43.6 ± 5.3 4.7 ± 4.7 84.7 ± 52.2 303.8 ± 286.1 685.1 ± 685.1 293.4 ± 293.4
F D O 46.1 ± 5.5 42.8 ± 2.8 18.9 ± 12.9 69.8 ± 19.3 9.2 ± 9.2
W D N 58.7 ± 6.2 28.9 ± 4.0 3.7 ± 3.7 12205.8 ± 1181.3 5168.9 ± 631.8 1975.0 ± 954.5
W D O 59.2 ± 34.2 31.1 ± 7.7 14.3 ± 7.4 49.5 ± 20.56 7.9 ± 4.6 17.9 ± 15.7
* Treatment codes are as follows: flooded – F, drained – D, light – L, dark – d, N2 atm. – N, 21% O2 atm. – O.
160

5| Methanogenesis in soil crusts
161
Supplementary Table 5.3| Primers and Probes used in this study
Oligo. name* Target Oligo. sequence (5’-3’) Position** GC (%) Tm† Amplicon size Essay Reference
ARC364 - F Archaea 16S rRNA gene
CGGGGYGCASCAGGGGCGAA 364-383 75-80 75 553
QPCR Burggraf et al. 1997
ARCH 934 - R GTGCTCCCCCGCCAATTCCT 915-934 65 71 Grosskopf et al. 1998
MSL812 - F
Methanosarcinales
16S rRNA gene
GTAAACGATRYTCGCTAGGT 812-831 40-50 62
354
MSL860 - P AGGGAAGCCGTGAAGCGARCC 860-880 62-67 70 QPCR Yu et al. 2005
MSL1159 - R GGTCCCCACAGWGTACC 1143-1159 65 63
MCL282 - F
Methanocella/ RC-I
16S rRNA gene
ATCMGTACGGGTTGTGGG 282-299 56-61 65
510
MCL609 - P ATCCAGCGGCTTAACCGTTGGKCK 609-632 54-63 72 QPCR Chapter 4
MCL832 - R CACCTAGCGRGCATCGTTTAC 813-832 52-57 64
mlas-mod - F
Universal mcrA gene
GGYGGTGTMGGDTTCACMCARTA 976-998 43-65 68
469 PCR/
QPCR
Modified from:
Steinberg and Regan
2009
mcrA-rev - R CGTTCATBGCGTAGTTVGGRTAGT 1421-1444 42-54 66 Steinberg and Regan
2009
msar - P Methanosarcina mcrA gene TCTCTCWGGCTGGTAYCTCTCCAT
GTAC 1269-1296 50-54 68 QPCR
Steinberg and Regan
2009
mcel/rc-I - P
Methanocella mcrA gene
CTVGGMTTCTWCGGBTACGACYT
1269-1296
43-61
66
QPCR This study
161
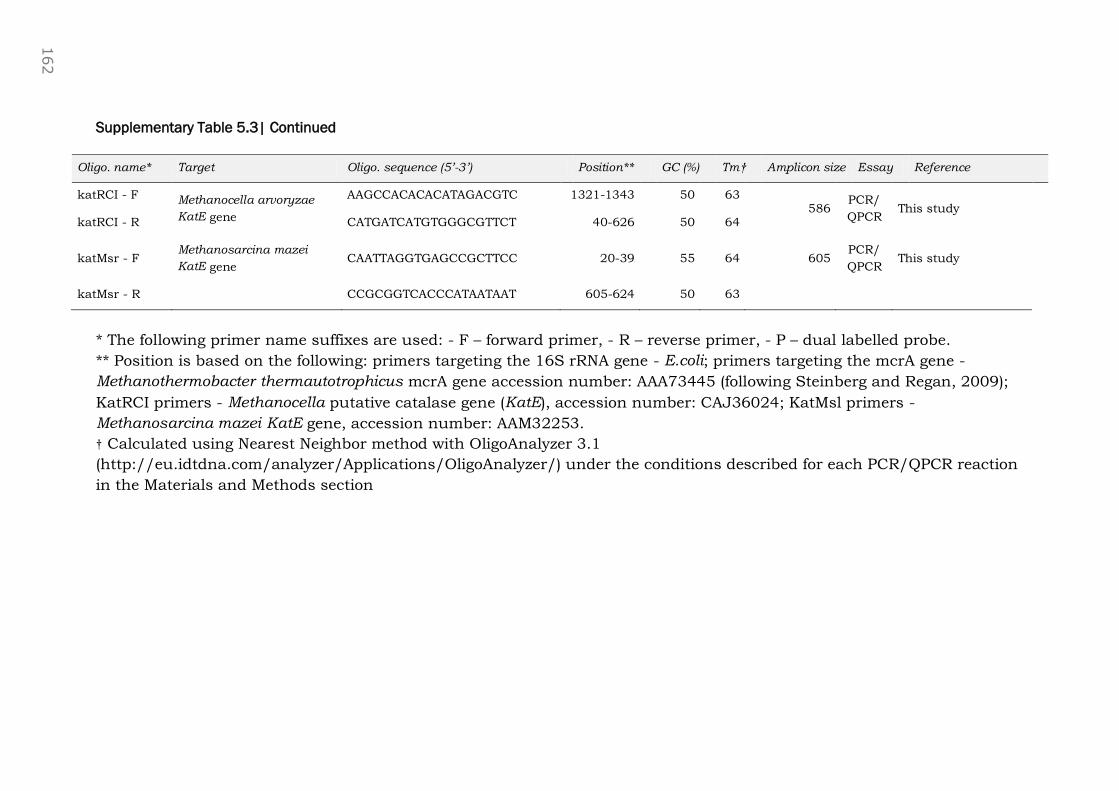
Supplementary Table 5.3| Continued
Oligo. name* Target Oligo. sequence (5’-3’) Position** GC (%) Tm† Amplicon size Essay Reference
katRCI - F Methanocella arvoryzae
KatE gene
AAGCCACACACATAGACGTC 1321-1343 50 63 586
PCR/
QPCR This study
katRCI - R CATGATCATGTGGGCGTTCT 40-626 50 64
katMsr - F Methanosarcina mazei
KatE gene CAATTAGGTGAGCCGCTTCC 20-39 55 64 605
PCR/
QPCR This study
katMsr - R CCGCGGTCACCCATAATAAT 605-624 50 63
* The following primer name suffixes are used: - F – forward primer, - R – reverse primer, - P – dual labelled probe.
** Position is based on the following: primers targeting the 16S rRNA gene - E.coli; primers targeting the mcrA gene -
Methanothermobacter thermautotrophicus mcrA gene accession number: AAA73445 (following Steinberg and Regan, 2009);
KatRCI primers - Methanocella putative catalase gene (KatE), accession number: CAJ36024; KatMsl primers -
Methanosarcina mazei KatE gene, accession number: AAM32253.
† Calculated using Nearest Neighbor method with OligoAnalyzer 3.1
(http://eu.idtdna.com/analyzer/Applications/OligoAnalyzer/) under the conditions described for each PCR/QPCR reaction
in the Materials and Methods section
162
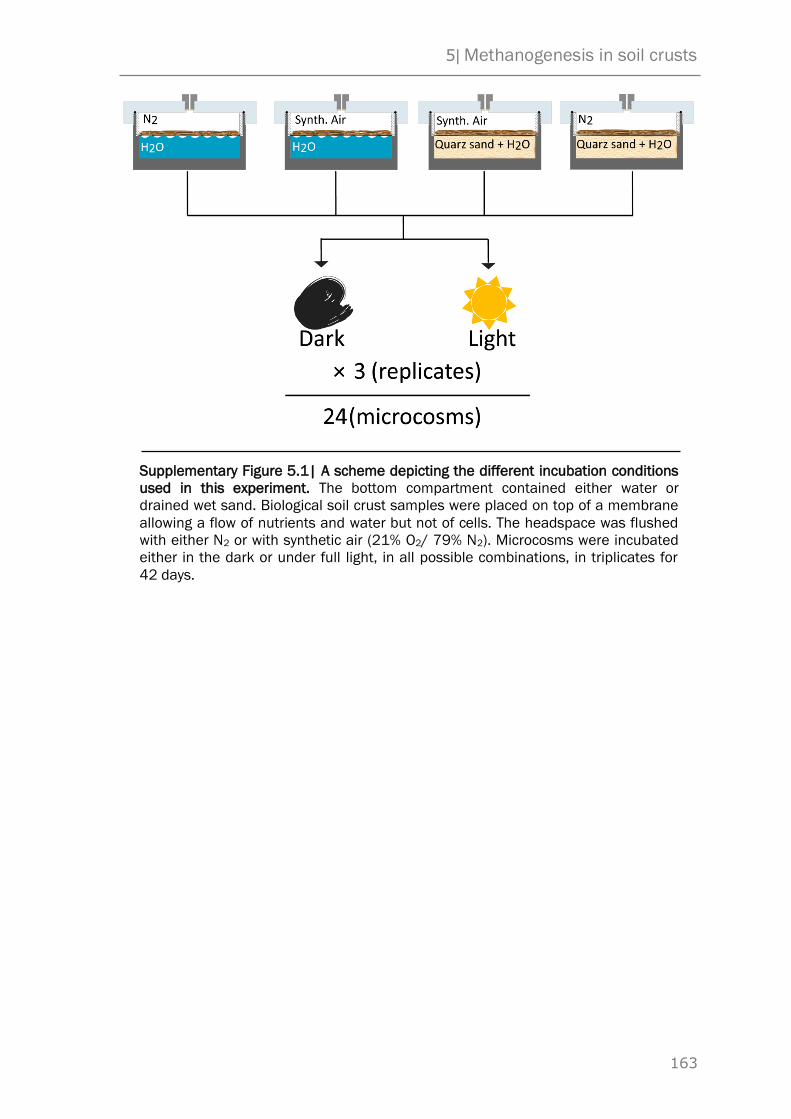
5| Methanogenesis in soil crusts
163
Supplementary Figure 5.1| A scheme depicting the different incubation conditions
used in this experiment. The bottom compartment contained either water or
drained wet sand. Biological soil crust samples were placed on top of a membrane
allowing a flow of nutrients and water but not of cells. The headspace was flushed
with either N2 or with synthetic air (21% O2/ 79% N2). Microcosms were incubated
either in the dark or under full light, in all possible combinations, in triplicates for
42 days.

5| Methanogenesis in soil crusts
164
Supplementary Figure 5.2| Evolution of: a. O2, b. CO2, c. H2 in the microcosm
headspaces during the incubation period: mean + 1 SE; n = 3. Treatment codes are
as follows: flooded – F, wet-drained – W, light – L, dark – D, N2 atm. – N, 21% O2
atm. – O.
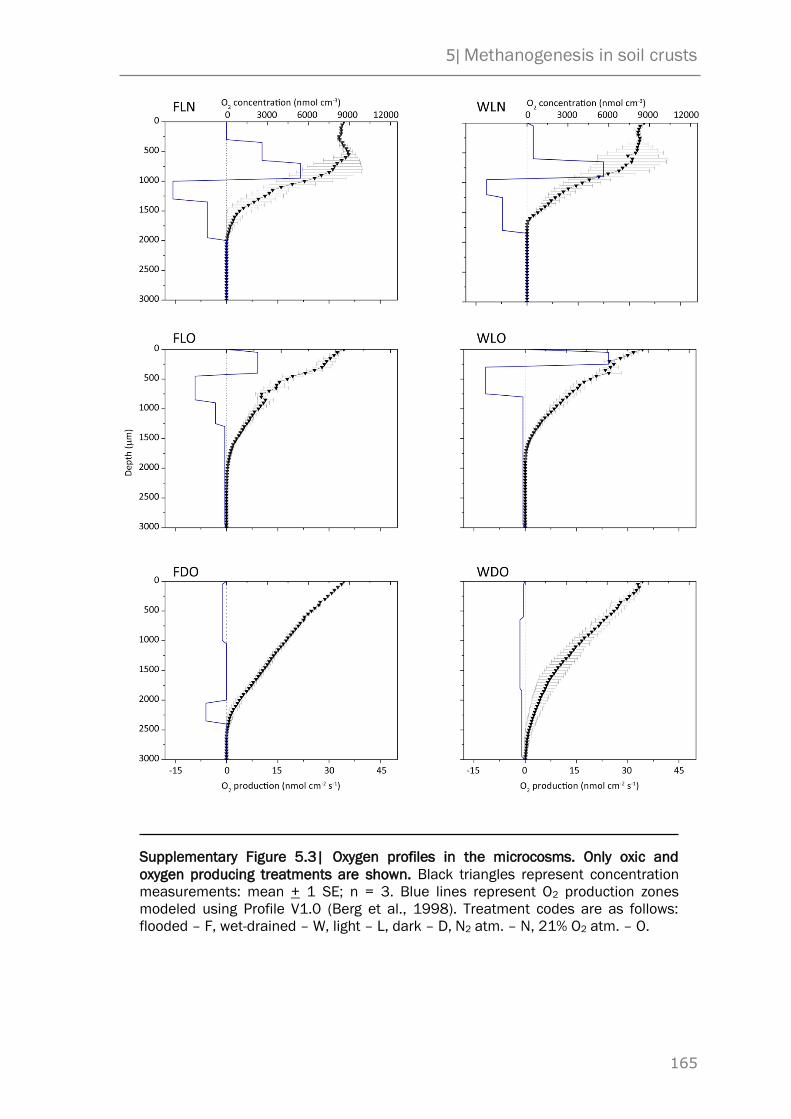
5| Methanogenesis in soil crusts
165
Supplementary Figure 5.3| Oxygen profiles in the microcosms. Only oxic and
oxygen producing treatments are shown. Black triangles represent concentration
measurements: mean + 1 SE; n = 3. Blue lines represent O2 production zones
modeled using Profile V1.0 (Berg et al., 1998). Treatment codes are as follows:
flooded – F, wet-drained – W, light – L, dark – D, N2 atm. – N, 21% O2 atm. – O.
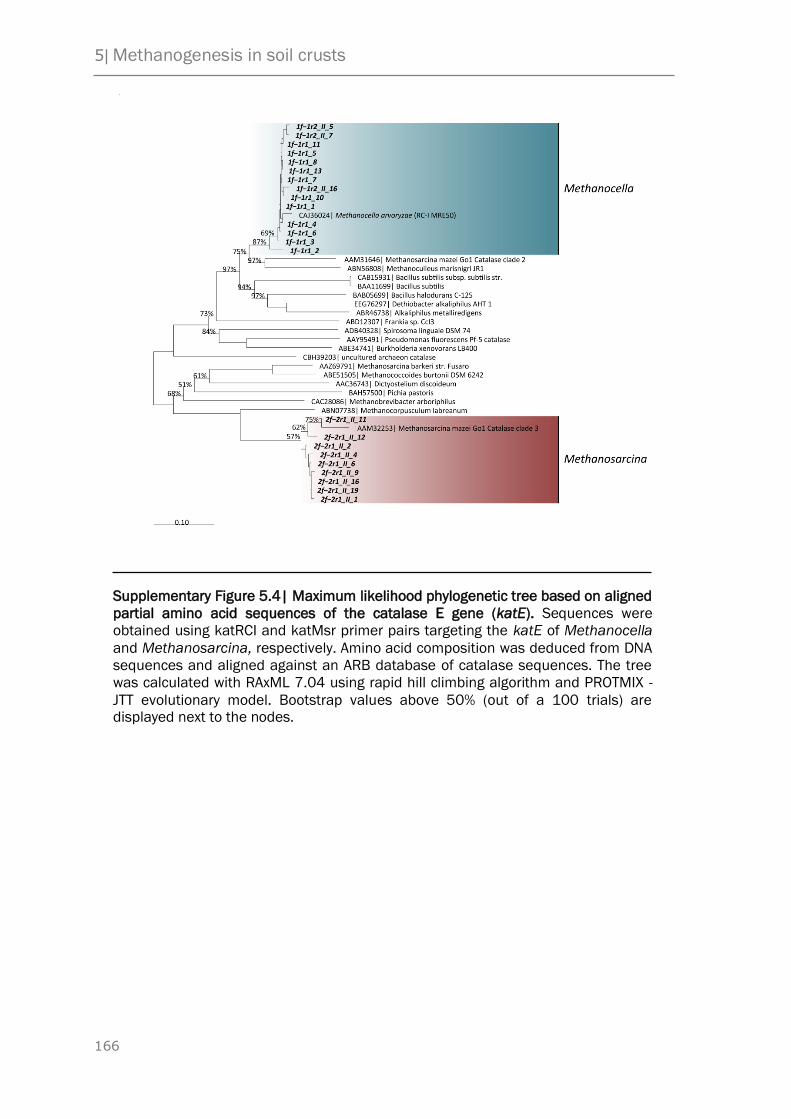
5| Methanogenesis in soil crusts
166
Supplementary Figure 5.4| Maximum likelihood phylogenetic tree based on aligned
partial amino acid sequences of the catalase E gene (katE). Sequences were
obtained using katRCI and katMsr primer pairs targeting the katE of Methanocella
and Methanosarcina, respectively. Amino acid composition was deduced from DNA
sequences and aligned against an ARB database of catalase sequences. The tree
was calculated with RAxML 7.04 using rapid hill climbing algorithm and PROTMIX -
JTT evolutionary model. Bootstrap values above 50% (out of a 100 trials) are displayed next to the nodes.

5| Methanogenesis in soil crusts
167
5.7 References
Angel R, Conrad R. (2009). in situ Measurement of Methane Fluxes and Analysis of Transcribed Particulate Methane Monooxygenase in Desert Soils. Environ. Microbiol.
Angel R, Soares MIM, Ungar ED, Gillor O. (2010). Biogeography of Soil Archaea and Bacteria Along a Steep Precipitation Gradient. ISME J. 4:553-563.
Ashelford KE, Weightman AJ, Fry JC. (2002). PRIMROSE: a Computer Program for Generating and Estimating the Phylogenetic Range of 16S rRNA Oligonucleotide Probes and Primers in Conjunction with the RDP-II database. Nucl. Acids Res. 30:3481-3489.
Banning N, Brock F, Fry JC, Parkes RJ, Hornibrook ERC, Weightman AJ. (2005). Investigation of the Methanogen Population Structure and Activity in a Brackish Lake Sediment. Environ. Microbiol. 7:947-960.
Berg P, Risgaard-Petersen N, Rysgaard S. (1998). Interpretation of Measured Concentration Profiles in Sediment Pore Water. Limnology and Oceanography 43:1500-1510.
Brioukhanov AL, Netrusov AI, Eggen RIL. (2006). The Catalase and Superoxide Dismutase Genes Are Transcriptionally up-Regulated Upon Oxidative Stress in the Strictly Anaerobic Archaeon Methanosarcina Barkeri. Microbiology 152:1671-1677.
Burggraf S, Huber H, Stetter KO (1997) Reclassification of the Crenarchaeal Orders and Families in Accordance with 16S rRNA Sequence Data. Int. J Syst. Bacteriol. 47:657-660.
Conrad R. (2005). Quantification of Methanogenic Pathways Using Stable Carbon Isotopic Signatures: A Review and a Proposal. Organ. Geochem. 36:739-752.
Conrad R, Claus P, Casper P. (2009). Characterization of Stable Isotope Fractionation During Methane Production in the Sediment of a Eutrophic Lake, Lake Dagow, Germany. Limnol. Oceanogr. 54:457-471.
Denman K, Brasseur G, Chidthaisong A, Clais P, Cox R, Dickinson D, et al. (2007). Couplings Between Changes in the Climate System and Biogeochemistry. In:Climate Change 2007: The Physical Science Basis. Contribution of Working Group I to the Fourth Assessment Report of the Intergovernmental Panel on Climate Change, Solomon, S, Qin, D, Manning, M, Chen, Z, Marquis, M, Averyt, K, et al., eds (ed)., Cambridge University Press: Cambridge, United Kingdom and New York, NY, USA.
Denman SE, Tomkins NW, McSweeney CS. (2007). Quantitation and Diversity Analysis of Ruminal Methanogenic Populations in Response to the Antimethanogenic Compound Bromochloromethane. FEMS Microbiol. Ecol. 62:313-322.
Erkel C, Kube M, Reinhardt R, Liesack W. (2006). Genome of Rice Cluster I Archaea--the Key Methane Producers in the Rice Rhizosphere. Science 313:370-372.
Fetzer S, Bak F, Conrad R. (1993). Sensitivity of Methanogenic Bacteria from Paddy Soil to Oxygen and Desiccation. FEMS Microbiol.Ecol. 12:107-115.
Forster P, Ramaswamy V, Artaxo P, Berntsen T, Betts R, Fahey D, et al. (2007). Changes in Atmospheric Constituents and in Radiative Forcing. In:Climate Change 2007: The Physical Science Basis. Contribution of Working Group I to the Fourth Assessment Report of the Intergovernmental Panel on Climate Change, Solomon, S, Qin, D, Manning, M, Chen, Z, Marquis, M, Averyt, K, et al., eds (ed)., Cambridge University Press: Cambridge, United Kingdom and New York, NY, USA.
Garcia-Pichel F. (2002). Desert Environments: Biological Soil Crusts. In: Encyclopedia of
5| Methanogenesis in soil crusts
168
Environmental Microbiology 6 Volume Set, Bitton, G, ed (ed)., Wiley-Interscience.
Garcia-Pichel F, Belnap J. (1996). Microenvironments and Microscale Productivity of Cyanobacterial Desert Crusts. J. Phycol. 32:774-782.
Gelwicks JT, Risatti JB, Hayes JM. (1994). Carbon Isotope Effects Associated with Aceticlastic Methanogenesis. Appl. Environ. Microbiol. 60:467-472.
Goevert D, Conrad R. (2009). Effect of Substrate Concentration on Carbon Isotope Fractionation During Acetoclastic Methanogenesis by Methanosarcina barkeri, M. acetivorans and in Rice Field Soil. Appl. Environ. Microbiol. AEM.02680-08.
Grosskopf R, Janssen PH, Liesack W (1998) Diversity and Structure of the Methanogenic Community in Anoxic Rice Paddy Soil Microcosms as Examined by Cultivation and Direct 16S rRNA Gene Sequence Retrieval. Appl. Environ. Microbiol. 64:960-969.
Henckel T, Friedrich M, Conrad R. (1999). Molecular Analyses of the Methane-Oxidizing Microbial Community in Rice Field Soil by Targeting the Genes of the 16S rRNA, Particulate Methane Monooxygenase, and Methanol Dehydrogenase. Appl. Environ.
Higgins DG, Sharp PM. (1988). CLUSTAL: a package for performing multiple sequence alignment on a microcomputer. Gene 73:237-244. Microbiol. 65:1980-1990.
Hoehler TM, Bebout BM, Des Marais DJ. (2001). The Role of Microbial Mats in the Production of Reduced Gases on the Early Earth. Nature 412:324-327.
Janssen P, Frenzel P. (1997). Inhibition of Methanogenesis by Methyl Fluoride: Studies of Pure and Defined Mixed Cultures of Anaerobic Bacteria and Archaea. Appl. Environ. Microbiol. 63:4552-4557.
Jeffries DL, Link SO, Klopatek JM. (1993). CO2 Fluxes of Cryptogamic Crusts. I. Response to Resaturation. New Phytol. 125:163-173.
Krzycki JA, Kenealy WR, DeNiro MJ, Zeikus JG. (1987). Stable Carbon Isotope Fractionation by Methanosarcina barkeri during Methanogenesis from Acetate, Methanol, or Carbon Dioxide-Hydrogen. Appl. Environ. Microbiol. 53:2597-2599.
Lange OL, Kidron GJ, Budel B, Meyer A, Kilian E, Abeliovich A. (1992). Taxonomic Composition and Photosynthetic Characteristics of the `Biological Soil Crusts' Covering Sand Dunes in the Western Negev Desert. Funct. Ecol. 6:519-527.
Lange OL, Meyer A, Zellner H, Heber U. (1994). Photosynthesis and Water Relations of Lichen Soil Crusts: Field Measurements in the Coastal Fog Zone of the Namib Desert. Funct. Ecol. 8:253-264.
Liu C, Miyaki T, Aono T, Oyaizu H. (2008). Evaluation of Methanogenic Strains and Their Ability to Endure Aeration and Water Stress. Curr. Microbiol. 56:214-218.
Liu Y, Whitman W. (2008). Metabolic, Phylogenetic, and Ecological Diversity of the Methanogenic Archaea. Ann. N.Y. Acad. Sci. 1125:171-189.
Lu Y, Conrad R. (2005). In Situ Stable Isotope Probing of Methanogenic Archaea in the Rice Rhizosphere. Science 309:1088-1090.
Ludwig W, Strunk O, Westram R, Richter L, Meier H, Yadhukumar, et al. (2004). ARB: A Software Environment for Sequence Data. Nucl. Acids Res. 32:1363-1371.
Lueders T, Kuk-Jeong Chin, Ralf Conrad, Michael Friedrich. (2001). Molecular Analyses
of Methyl-Coenzyme M Reductase -Subunit (mcrA) Genes in Rice Field Soil and Enrichment Cultures Reveal the Methanogenic Phenotype of a Novel Archaeal Lineage.

5| Methanogenesis in soil crusts
169
Environ. Microbiol. 3:194-204.
Lueders T, Manefield M, Friedrich MW. (2004). Enhanced Sensitivity of DNA- and rRNA-Based Stable Isotope Probing by Fractionation and Quantitative Analysis of Isopycnic Centrifugation Gradients. Environ. Microbiol. 6:73-78.
Murase J, Frenzel P. (2007). A Methane-Driven Microbial Food Web in a Wetland Rice Soil. Environ. Microbiol. 9:3025-3034.
Nüsslein B, Eckert W, Conrad R. (2003). Stable Isotope Biogeochemistry of Methane Formation in Profundal Sediments of Lake Kinneret (Israel). Limnol. and Oceanogr. 48:1439-1446.
Oremland R. (1988). Biogeochemistry of Methanogenic Bacteria. In:Biology of Anaerobic Microorganisms, Zehnder, AJ, ed (ed)., John Wiley & Sons, Ltd.
Orphan VJ, Jahnke LL, Embaye T, Turk KA, Pernthaler A, Summons RE, et al. (2008). Characterization and Spatial Distribution of Methanogens and Methanogenic Biosignatures in Hypersaline Microbial Mats of Baja California. Geobiology 6:376-393.
Pei J, Grishin NV. (2007). PROMALS: towards accurate multiple sequence alignments of distantly related proteins. Bioinformatics 23:802-808.
Pruesse E, Quast C, Knittel K, Fuchs BM, Ludwig W, Peplies J, et al. (2007). SILVA: a comprehensive online resource for quality checked and aligned ribosomal RNA sequence data compatible with ARB. Nucl. Acids Res. 35:7188-7196.
Peters V, Conrad R. (1995). Methanogenic and Other Strictly Anaerobic Bacteria in Desert Soil and Other Oxic Soils. Appl. Environ. Microbiol. 61:1673-1676.
Ramakrishnan B, Tillmann Lueders, Peter F. Dunfield, Ralf Conrad, Michael W. Friedrich. (2001). Archaeal Community Structures in Rice Soils from Different Geographical Regions Before and After Initiation of Methane Production. FEMS Microbiol. Ecol. 37:175-186.
Rao B, Liu Y, Wang W, Hu C, Dunhai L, Lan S. (2009). Influence of Dew on Biomass and Photosystem II Activity of Cyanobacterial Crusts in the Hopq Desert, Northwest China. Soil Biol. Biochem. 41:2387-2393.
Sakai S, Conrad R, Liesack W, Imachi H. (2010). Methanocella arvoryzae sp. nov., a hydrogenotrophic methanogen, isolated from Italian rice field soil. Int. J. Syst. Evol. Microbiol (in press).
Sakai S, Imachi H, Hanada S, Ohashi A, Harada H, Kamagata Y. (2008). Methanocella Paludicola Gen. Nov., Sp. Nov., a Methane-Producing Archaeon, the First Isolate of the Lineage 'rice Cluster I', and Proposal of the New Archaeal Order Methanocellales ord. nov. Int. J. Syst. Evol. Microbiol. 58:929-936.
Schönheit P, Keweloh H, Thauer RK. (1981). Factor F420 degradation in Methanobacteriu hermoautotrophicum during exposure to oxygen. FEMS Microbiol Lett. 12:347-349.
Shindell DT, Faluvegi G, Koch DM, Schmidt GA, Unger N, Bauer SE. (2009). Improved Attribution of Climate Forcing to Emissions. Science 326:716-718.
Stamatakis A. (2006). Raxml-Vi-Hpc: Maximum Likelihood-Based Phylogenetic Analyses with Thousands of Taxa and Mixed Models. Bioinformatics 22:2688-2690.
Stams AJM, Plugge CM. (2009). Electron Transfer in Syntrophic Communities of Anaerobic Bacteria and Archaea. Nat. Rev. Micro. 7:568-577.
Steinberg LM, Regan JM (2009) mcrA-Targeted Real-Time Quantitative PCR Method To
5| Methanogenesis in soil crusts
170
Examine Methanogen Communities. Appl. Environ. Microbiol. 75:4435-4442.
Storz G, Tartaglia L, Farr S, Ames B. (1990). Bacterial Defenses Against Oxidative Stress. Trends Genet. 6:363-368.
Thauer RK, Kaster A, Seedorf H, Buckel W, Hedderich R. (2008). Methanogenic Archaea: Ecologically Relevant Differences in Energy Conservation. Nat. Rev. Micro. 6:579-591.
Verstraete MM, Schwartz SA. (1991). Desertification and Global Change. Vegetatio 91:3-13.
Whiticar MJ. (1999). Carbon and Hydrogen Iisotope Systematics of Bacterial Formation and Oxidation of Methane. Chem. Geol. 161:291-314.
Wilske B, Burgheimer J, Karnieli A, Zaady E, Andreae MO, Yakir D, et al. (2008). The CO2 Exchange of Biological Soil Crusts in a Semiarid Grass-Shrubland at the Northern Transition Zone of the Negev desert, Israel. Biogeosciences 5:1411-1423.
Yu Y, Lee C, Kim J, Hwang S (2005) Group-Specific Primer and Probe Sets to Detect Methanogenic Communities Using Quantitative Real-Time Polymerase Chain Reaction. Biotechnol Bioeng. 89:670-679.
Yuan Y, Conrad R, Lu Y. (2009). Responses of Methanogenic Archaeal Community to Oxygen Exposure in Rice Field Soil. Environ. Microbiol. Rep. 1:347-354.
Zehnder A, Stumm W. (1988). Geochemistry and Biogeochemistry of Anaerobic Habitats. In: Biology of Anaerobic Microorganisms, Zehnder, A, ed (ed)., Wiley: New York, pp. 1-38.
Zhang W, Culley D, Nie L, Brockman F. (2006). DNA Microarray Analysis of Anaerobic Methanosarcina Barkeri Reveals Responses to Heat Shock and Air Exposure. J. Ind. Microbiol. Biotechnol. 33:784-790.
Zinder S. (1993). Physiological Ecology of Methanogens. In: Methanogenesis. Ecology, Physiology, Biochemistry and Genetics, Chapman & Hall: New York, pp. 128-206.
171
Chapter 6|
General Discussion and outlook
Deserts comprise a third of the Earth land surface but are nevertheless far
less understood as ecosystems compared to other, more humid, regions.
From a microbial ecology perspective there are indications that desert soil
communities are unique, and their habitats are hence a source of untapped
biodiversity (Garcia-Pichel, 2002). While there have been former indications
for the involvement of desert soils in the turnover of the greenhouse gas
methane to the best of my knowledge no one had previously studied the
subject in depth.
This work explored the microbial diversity and the functional activity
of microorganisms in desert soils. In particular, I was interested in detecting
the consumption of atmospheric methane and the potential for production of
that gas, which is one of the more potent greenhouse gases. To answer these
questions I used a combination of field study techniques (measuring fluxes
and sampling statistically representative set of samples) and lab experiments
(which combined incubations and in situ analyses). I made use of an array of
molecular techniques along with analyses of the isotopic signature of the
carbon to detect and quantify the microbes involved in methane turnover
and to decipher which of them is active and what pathways they use.
First, we were able to show that general community profiles of both
Bacteria and Archaea in arid and semiarid soils are different from those in
more humid regions forming three distinct clusters rather than a continuum
along a precipitation gradient (Chapter 2). Our finding thus supported the
hypothesis that desert soils, because of their distinctive features, harbour a
qualitatively different microbial community. In the following part (Chapter 3)
we demonstrated the ability of desert soils to consume atmospheric methane
thus confirming past observations of Striegel and colleagues (1992). We
6| General discussion and outlook
172
showed, however, that the hyper-arid site that was studied, in contrast to
the arid site, did not consume atmospheric methane and did not harbour
active methanotrophs. In addition, we have detected transcription of the
particulate methane monooxygenase gene. The sequences of these
transcribed monooxygenases were associated with putative high affinity
methanotrophs.
In the third part of the work (Chapters 4 and 5) we studied the
methanogenic potential and the archaeal diversity in upland soils. We
showed that methanogenic potential is a global trait of upland soils and that
two types of methanogens – Methanosarcina and Methanocella – are,
apparently, universal upland soil methanogens. Biological soil crust (BSC)
samples from the Negev Desert in Israel were shown to produce methane
even in the presence of oxygen. The methanogenic community in these
samples continuously expressed the gene for catalase, which apparently
enables them to detoxify oxygen and survive under these conditions.
6.1 Methane cycle in desert soils – a proposed model
If both methane production and consumption occur in upland soils, in what
way are they different from wetland soils? Figure 6.1 illustrates the
similarities and differences between two model soil systems: an arid soil
such as the one studied at Negev Desert, Israel, and a simplified rice
plant/rice field soil system which is the most established model for studying
biogeochemical processes in wetland soils. When the soils are drained and
atmospheric gases can diffuse no methane is produced in both soil types
(Figure 6.1 A). This is the common state in desert soils while in rice fields
such conditions occur only when the soil is drained and left to dry between
crops. Under these conditions, the arid soil is a sink for atmospheric
methane and consumption rate is at least partly dependent on water
content. The rice field is also inhabited by methanotrophs but apparently,
with the exception of upland rice fields (Singh et al., 1998), it is unable to
consume methane at trace atmospheric levels and it therefore rarely acts as
a net sink for atmospheric methane. The active layer for methane
consumption in the arid soil is approximately within the upper 20-cm soil
layer; below this depth methane concentration stabilizes at approximately 1
6| General discussion and outlook
173
ppmv. Interestingly, the BSC is apparently devoid of methanotrophs and
consequently does not consume atmospheric methane. This stands in
contrast to the general notion that the BSC is the most biologically active
layer of the soil. Indeed, other layers of desert soils have hardly been
examined by microbiologists. It is virtually impossible to conclusively
determine that something is absent and also to reason why it is absent, if
only for epistemological reasons. Nevertheless, the lack, or at least the
scarcity, of methanotrophs in the upper layer of upland soils has been
previously reported (Henckel et al., 2000; Kolb et al., 2005). Higher ammonia
levels in the upper soil layers which are known to inhibit methanotrophs
have been proposed as an explanation for that, but considering the relatively
low nitrogen levels in desert soils this could hardly serve as an argument in
our case. Unlike desert soils, the upper layer of rice paddies is where
methanotrophs preferentially reside since it is where the oxic/anoxic
interface is located (Conrad and Frenzel, 2002).
The particulate methane monooxygenase (pmoA) sequences that were
retrieved in the arid soil were always affiliated with the high affinity
methanotrophs of the types USCand JR3, but ‘classical’, low affinity
methanotrophs could not be detected. This is noteworthy as this is so far the
only study on soil methanotrophs where no low affinity methanotrophs
could be detected (Lüke, 2010). In rice fields, the diversity of methanotrophs
is extensive and includes a large variety of type I and II methanotrophs,
most of which are represented in culture collections (Lüke et al., 2010).
Methanotrophs in rice fields are known to heavily colonise the root surfaces
thus utilizing the oxygen which diffuses out of the plant – a logical strategy
for aerobes living in anoxic soil. We detected no significant difference
between methane oxidation rates of the soil under shrubs and in the inter-
shrub patch, although the presence of methanotrophs on the root surfaces
was not directly examined.
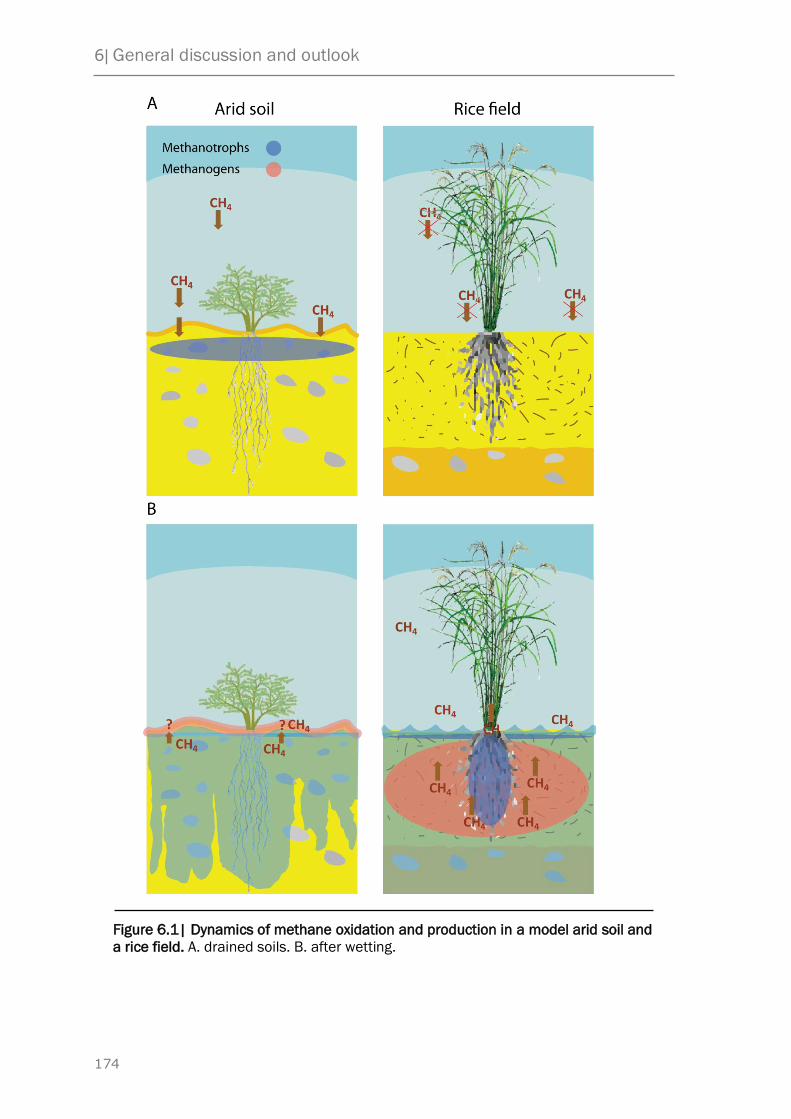
6| General discussion and outlook
174
Figure 6.1| Dynamics of methane oxidation and production in a model arid soil and
a rice field. A. drained soils. B. after wetting.

6| General discussion and outlook
175
High affinity methanotrophs are also apparently very sensitive to land
use changes and lower methane oxidation rates in agricultural fields
compared with pristine sites have been repeatedly reported (e.g. Jensen and
Olsen, 1998; Knief et al., 2005). Once again, high ammonia concentrations
in the soil or the use of agrochemicals have been proposed as an explanation
(Dunfield, 2007). Our results however, particularly the soil gas profile,
suggest that the reason for that might be the mechanical disturbance
caused by ploughing. Ploughing physically mixes soil layers and dislocates
cells away from their preferred site of activity. Because of their low growth
rates (an inevitable outcome of their limited supply of substrate) activity is
only slowly recovered. In rice fields, soils are constantly mixed by ploughing,
yet no effect on the activity of methanotrophs has been reported.
Several distinct clusters of ‘high-affinity’ methanotrophs have been
detected in upland soils; among them are USC USC, RA21, MR1, JR2 and
JR3, to name just a few. The occurrence of different clusters in different
soils raises the question of what, if any, are the ecological forces driving their
distribution. It has already been postulated in the past that, for instance,
USC (and Methylocystis species) are adapted to soils of low pH while
USCand Cluster1 are adapted to soils of high pH (Knief et al., 2003; Kolb,
2009). Similarly, according to Horz and colleagues (2005), clusters JR1 and
JR2 seem to be dominant among upland soil methanotrophs in a semi-arid
site in California while other clusters (such as JR3) seem to be minor
members. In our study, JR3 was the dominant type while the other clusters
(JR1, JR2) were not detected. While so far not tested explicitly, a distribution
of upland soil methanotroph clusters according to biogeographical
parameters such as precipitation and soil type thus seems plausible.
When the arid soil becomes wet, usually after heavy rain, methane
uptake ceases due to diffusion limitations (Figure 6.1 B). Our lab
incubations have shown that the lower layer of the BSC becomes anoxic
while the upper layer remains oxic due to atmospheric oxygen diffusion or
photosynthesis by BSC primary producers. Anaerobic degradation processes
commence at the bottom layer of the BSC and methane is detected within a
week or so. In contrast to our observations regarding methanotrophs,
methanogens are probably only present in the BSC since the deeper layers
6| General discussion and outlook
176
(0-20 cm belowground) had little or no methanogenic potential. In rice field
soil, the entire bulk of the soil and the root surfaces become methanogenic
shortly after flooding when oxygen and alternative electron acceptors such
as nitrate, ferric iron and sulphate are depleted. Rice fields normally possess
a diverse community of methanogens including species of Methanosarcina,
Methanosaeta, Methanocella, Methanobrevibacter, Methanobacterium and
others (Grosskopf et al., 1998; Watanabe et al., 2006). A niche differentiation
is recognized in the rice system: the bulk soil is dominated by
Methanosarcina and Methanosaeta species and most methane which
originates from this part of the soil is derived from acetate. The root
surfaces, on the other hand, are primarily dominated by methanogens of the
genus Methanocella and as a result most methane produced in this niche is
H2/CO2 based (Lu and Conrad, 2005). The community structure in the BSC
is far more limited. In fact, throughout the various upland soils (and layers)
that were examined only Methanocella and Methanosarcina related
sequences were found as active members of the methanogenic community.
When the soils were incubated as anoxic slurries to detect methanogenic
potential, acetoclastic methanogenesis was the dominant pathway for
generating methane and consequently Methanosarcina outnumbered
Methanocella. Under oxic conditions, however, it was found that
methanogenesis, which was much less active, was almost entirely
hydrogenotrophic, acetate was probably consumed by aerobic heterotrophs,
and Methanocella often outnumbered Methanosarcina. Based on this these
observations we hypothesize that a niche differentiation might exist between
the two dominant methanogens. According to it, oxygen level in the soil
determines the level of activity of each methanogen and the specific
contribution of each pathway to the total methane being produced. When
the BSC is mostly anoxic, acetate accumulates and Methanosarcina become
dominant by converting it to methane. This can occur for instance when the
soil water content and the overall metabolic activity in the BSC are high, but
possibly also during night time when all photosynthetic microorganisms
switch to net oxygen consumption. When soil oxygen level is higher,
Methanocella become dominant and with it hydrogenotrophic
methanogenesis becomes the primary pathway for methane production. This

6| General discussion and outlook
177
can occur either because of competition with heterotrophs over acetate as
proposed, but an alternative possibility is that Methanocella are better
equipped for coping with oxygen as has been proposed before (Erkel et al.,
2006; Conrad et al., 2006)
Methane which is produced in rice paddies quickly diffuses upwards. As
discussed in Chapter 1, much of it is consumed by methanotrophs which
colonise the rice roots and the top layer of the soil at the oxic/anoxic
interface. This acts as an attenuating mechanism which decreases potential
methane emission from rice fields (Conrad and Rothfuss, 1991). Methane in
the arid soil is already produced at the topmost layer of the soil and the
diffusion route to the atmosphere is short. Since this top layer – the BSC –
apparently lacks methanotrophs, no attenuation can occur in this case.
While field studies are still required to confirm methanogenesis in BSCs, it
appears that methane which is produced in the BSC is released into the
atmosphere in its entirety.
Quantifications of methanotrophs and methanogens in rice paddies using
qPCR suggest that their cell densities range from 104 to 107 and 106 to 107
for methanotrophs and methanogens, respectively (Conrad and Frenzel,
2002). These numbers seem to be fairly stable throughout the growth season
and even afterwards when the soil is dry (Ueki et al., 1997; Watanabe et al.,
2007). In the arid soil, numbers of methanogens were estimated at 104 cells
gdw-1 before incubations and rising up to 109 cells gdw-1 after incubations.
While the cell density of methanotrophs was not directly quantified in this
work, former studies estimate their numbers to be around 104-106 cells gdw-
1 in upland soils (Kolb et al., 2005; Knief et al., 2006). Assuming oxidation
rates of atmospheric methane are primarily a factor of cell density, we can
estimate that the numbers of methanotrophs in the arid site which was
studied are similar and probably somewhat lower to those mentioned above.
6.2 Summary and outlook
The analysis of the archaeal and bacterial communities in desert soils
showed that they consist of different microbes compared to soils in more
humid regions. I have shown that at least pristine arid soils have the
capacity to consume atmospheric methane and that methanotrophs

6| General discussion and outlook
178
belonging to a unique cluster are probably the agents performing this
activity. The fact that a unique cluster of methanotrophs was found in the
studied site as well as the patterns which stem from other works suggest
that high affinity methanotrophs might correspond to biogeographic patters.
Studying these patterns systematically and correlating them to methane
oxidation rates and dynamics could enhance our understanding of the soil
methane sink on a global scale.
The methanogens in arid soils are apparently not unique. Methanosarcina
and Methanocella seem to be universal species, but this should not end the
study on upland soil methanogenesis. The occurrence of methanogenesis in
the BSC under oxic conditions can testify for the existence of an entire
anaerobic biome. This formerly unrecognized side of the ecology of BSC
opens paths for much further research. Further work is therefore needed to
elucidate which are the players involved in the entire anaerobic degradation
cascade which takes place in an active BSC. One possible approach to
answer this question is metatranscriptomics. Recent advances in high
throughput sequencing and microarray technology enable the simultaneous
analysis of all mRNAs transcribed in an environmental sample (Urich et al.,
2008; Yin et al., 2010). Using these approaches it might be possible to
reconstruct much of the biochemical networks which govern the degradation
process in a BSC which precede methanogenesis.
In summary, Methanotrophs and Methanogens are present and active in
desert soils. With an estimated total microbial population size of 107-108
cells gdw-1 for the arid site at the Negev Desert (Bachar et al., 2010),
methanotrophs and methanogens comprise only 0.01% of the total microbial
population and they are therefore part of the ‘rare biosphere’ as defined by
Pedros-Alio (2007). Still, when active, these microbes play important roles in
their ecosystems and are able to influence atmospheric methane
concentrations on a global level.
6| General discussion and outlook
179
6.3 References
Bachar A, Al-Ashhab A, Soares MIM, Sklarz MY, Angel R, Ungar ED, et al. (2010). Soil Microbial Abundance and Diversity Along a Low Precipitation Gradient. Microb. Ecol.
Conrad R, Frenzel P. (2002). Flooded soils. In: Encyclopedia of Environmental Microbiology, John Wiley & Sons, Inc.: New York, pp. 1316-1333.
Conrad R, Rothfuss F. (1991). Methane Oxidation in the Soil Surface Layer of a Flooded Rice Field and the Effect of Ammonium. Biol. Fertil. Soils 12:28-32.
Conrad R, Erkel C, Liesack W. (2006). Rice Cluster I Methanogens, an Important Group of Archaea Producing Greenhouse Gas in Soil. Curr. Opin. Biotechnol. 17:262-267.
Dunfield PF. (2007). The Soil Methane Sink. In: Greenhouse Gas Sinks, Reay, D, Hewitt, CN, Smith, KA, & Grace, J, eds (ed)., CABI: Oxfordshire, UK, p. 290.
Erkel C, Kube M, Reinhardt R, Liesack W. (2006). Genome of Rice Cluster I Archaea--the Key Methane Producers in the Rice Rhizosphere. Science 313:370-372.
Garcia-Pichel F. (2002). Desert Environments: Biological Soil Crusts. In: Encyclopedia of Environmental Microbiology 6 Volume Set, Bitton, G, ed (ed)., Wiley-Interscience.
Grosskopf R, Janssen PH, Liesack W. (1998). Diversity and Structure of the Methanogenic Community in Anoxic Rice Paddy Soil Microcosms as Examined by Cultivation and Direct 16S rRNA Gene Sequence Retrieval. Appl. Environ. Microbiol. 64:960-969.
Henckel T, Jackel U, Schnell S, Conrad R. (2000). Molecular Analyses of Novel Methanotrophic Communities in Forest Soil That Oxidize Atmospheric Methane. Appl. Environ. Microbiol. 66:1801-1808.
Horz H, Rich V, Avrahami S, Bohannan BJM. (2005). Methane-Oxidizing Bacteria in a California Upland Grassland Soil: Diversity and Response to Simulated Global Change. Appl. Environ. Microbiol. 71:2642-2652.
Jensen S, Olsen RA. (1998). Atmospheric Methane Consumption in Adjacent Arable and Forest Soil Systems. Soil Biol. Biochem. 30:1187-1193.
Knief C, Kolb S, Bodelier PLE, Lipski A, Dunfield PF. (2006). The Active Methanotrophic Community in Hydromorphic Soils Changes in Response to Changing Methane Concentration. Environ. Microbiol. 8:321-333.
Knief C, Lipski A, Dunfield PF. (2003). Diversity and Activity of Methanotrophic Bacteria in Different Upland Soils. Appl. Environ. Microbiol. 69:6703-6714.
Knief C, Vanitchung S, Harvey NW, Conrad R, Dunfield PF, Chidthaisong A. (2005). Diversity of Methanotrophic Bacteria in Tropical Upland Soils under Different Land Uses. Appl. Environ. Microbiol. 71:3826-3831.
Kolb S. (2009). The Quest for Atmospheric Methane Oxidizers in Forest Soils. Environ. Microbiol. Rep. 1:336-346.
Kolb S, Knief C, Dunfield PF, Conrad R. (2005). Abundance and Activity of Uncultured Methanotrophic Bacteria Involved in the Consumption of Atmospheric Methane in Two Forest Soils. Environ. Microbiol. 7:1150-1161.
Lu Y, Conrad R. (2005). In Situ Stable Isotope Probing of Methanogenic Archaea in the Rice Rhizosphere. Science 309:1088-1090.
Lüke C. (2010). Molecular Ecology and Biogeography of Methanotrophic Bacteria in
6| General discussion and outlook
180
Wetland Rice Fields. Doctorate thesis, Philipps-Universität Marburg.
Lüke C, Krause S, Cavigiolo S, Greppi D, Lupotto E, Frenzel P. (2010). Biogeography of Wetland Rice Methanotrophs. Environ. Microbiol. 12:862-872.
Pedros-Alio C. (2007). Ecology: Dipping into the Rare Biosphere. Science 315:192-193.
Singh JS, Raghubanshi A, Reddy V, Singh S, Kashyap A. (1998). Methane Flux from Irrigated Paddy and Dryland Rice Fields, and From Seasonally Dry Tropical Forest and Savanna Soils of India. Soil Biol. Biochem. 30:135-139.
Striegl RG, McConnaughey TA, Thorstenson DC, Weeks EP, Woodward JC. (1992). Consumption of Atmospheric Methane by Desert Soils. Nature 357:145-147.
Ueki A, Ono K, Tsuchiya A, Ueki K. (1997). Survival of Methanogens in Air-Dried Paddy Field Soil and Their Heat Tolerance. Water Sci.Tech. 36:517-522.
Urich T, Lanzén A, Qi J, Huson DH, Schleper C, Schuster SC. (2008). Simultaneous Assessment of Soil Microbial Community Structure and Function through Analysis of the Meta-Transcriptome. PLoS ONE. 3:e2527.
Watanabe T, Kimura M, Asakawa S. (2006). Community Structure of Methanogenic Archaea in Paddy Field Soil Under Double Cropping (rice-Wheat). Soil Biol. Biochem. 38:1264-1274.
Watanabe T, Kimura M, Asakawa S. (2007). Dynamics of Methanogenic Archaeal Communities Based on rRNA Analysis and Their Relation to Methanogenic Activity in Japanese Paddy Field Soils. Soil Biol. Biochem. 39:2877-2887.
Yin Y, Liebich J, Hazen TC, Zhou J, He Z, Deng Y, et al. (2010). GeoChip 3.0 as a High-Throughput Tool for Analyzing Microbial Community Composition, Structure and Functional activity. ISME J. 4:1167-1179.

Appendices
181
List of abbreviations
16S-rRNA small subunit of the ribosomal RNA
6-FAM 6-Carboxyfluoresceine
bp base pairs
BSA Bovine serum albumin
BSC Biological soil crust
EDTA Ethylenediaminetetraacetic acid
fH2 Fraction of methane produced from H2/CO2
FID Flame ionization detector
GC Gas chromatography
HPLC High performance liquid chromatography
IC Ion chromatography
IRMS Isotope ratio mass spectrometer
katE Catalase E
LTER Long term ecological research
mcrA Methane Co-M reductase subunit
OTU Operational taxonomic unit
PCA Principal component analysis
pmoA Particulate methane monooxygenase A subunit
qPCR Quantitative PCR
RDA Redundancy analysis
SCG Soil crenarchaeotic group
SPB Sodium phosphate buffer
TNS Tris, HCl, SDS buffer
TRF Terminal restriction fragment
TRFLP Terminal restriction fragment length polymorphism
δ13C Stable carbon isotope ratio relative to the international
standard
δac δ13C of acetate
δmc δ13C of methane which originated from CO2
ε und Isotope fractionation factors

182
Index of tables
Table 1.1: Most common methanogenic reactions..........................................................6
Table 2.1: Characteristics of the sites and values of major physico-chemical
parameters of the sampled soils...................................................................41
Table S2.1: Pairwise Kolmogorov-Smirnov tests for the bacterial (A) and archaeal (B)
TRFLP profiles.................................................................................................56
Table S2.2: Statistical tests for the effect of different geographic scales on the
community compositions (see text for methods description)......................57
Table 3.1: Characteristics of sites and soils...................................................................73
Table 3.2: On site and in situ methane uptake rates of the soils.................................76
Table 4.1: Characteristics of the sites and values of major physico-chemical
parameters of the soil samples...................................................................105
Table 4.2: Stable carbon isotope analysis of the methane and CO2..........................118
Table S4.1: Primers and probes used in this study.......................................................128
Table 5.1: ANOVA analyses (least squares) testing the effect of the various incubation
conditions on methane production rates and ratios of gene and transcript
copies............................................................................................................142
Table 5.2: Differences in relative expression of katE gene in Methanocella and
Methanosarcina between paired treatments.............................................150
Table S5.1: Pearson correlation coefficients (r) between various measured
parameters....................................................................................................159
Table S5.2: Major fermentation products (M) in the pore water of the
microcosms...................................................................................................160
Table S5.3: Primers and Probes used in this study.......................................................161
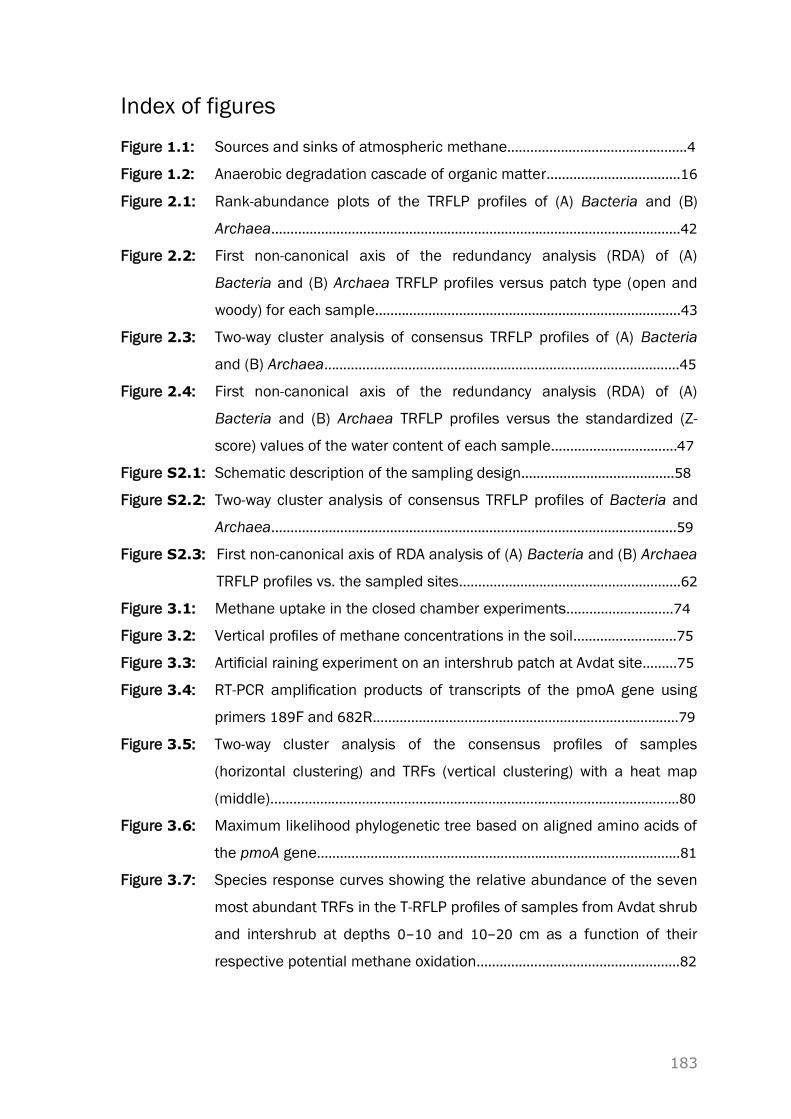
183
Index of figures
Figure 1.1: Sources and sinks of atmospheric methane...............................................4
Figure 1.2: Anaerobic degradation cascade of organic matter...................................16
Figure 2.1: Rank-abundance plots of the TRFLP profiles of (A) Bacteria and (B)
Archaea...........................................................................................................42
Figure 2.2: First non-canonical axis of the redundancy analysis (RDA) of (A)
Bacteria and (B) Archaea TRFLP profiles versus patch type (open and
woody) for each sample................................................................................43
Figure 2.3: Two-way cluster analysis of consensus TRFLP profiles of (A) Bacteria
and (B) Archaea.............................................................................................45
Figure 2.4: First non-canonical axis of the redundancy analysis (RDA) of (A)
Bacteria and (B) Archaea TRFLP profiles versus the standardized (Z-
score) values of the water content of each sample.................................47
Figure S2.1: Schematic description of the sampling design........................................58
Figure S2.2: Two-way cluster analysis of consensus TRFLP profiles of Bacteria and
Archaea..........................................................................................................59
Figure S2.3: First non-canonical axis of RDA analysis of (A) Bacteria and (B) Archaea
TRFLP profiles vs. the sampled sites..........................................................62
Figure 3.1: Methane uptake in the closed chamber experiments............................74
Figure 3.2: Vertical profiles of methane concentrations in the soil...........................75
Figure 3.3: Artificial raining experiment on an intershrub patch at Avdat site.........75
Figure 3.4: RT-PCR amplification products of transcripts of the pmoA gene using
primers 189F and 682R................................................................................79
Figure 3.5: Two-way cluster analysis of the consensus profiles of samples
(horizontal clustering) and TRFs (vertical clustering) with a heat map
(middle)...........................................................................................................80
Figure 3.6: Maximum likelihood phylogenetic tree based on aligned amino acids of
the pmoA gene...............................................................................................81
Figure 3.7: Species response curves showing the relative abundance of the seven
most abundant TRFs in the T-RFLP profiles of samples from Avdat shrub
and intershrub at depths 0–10 and 10–20 cm as a function of their
respective potential methane oxidation.....................................................82
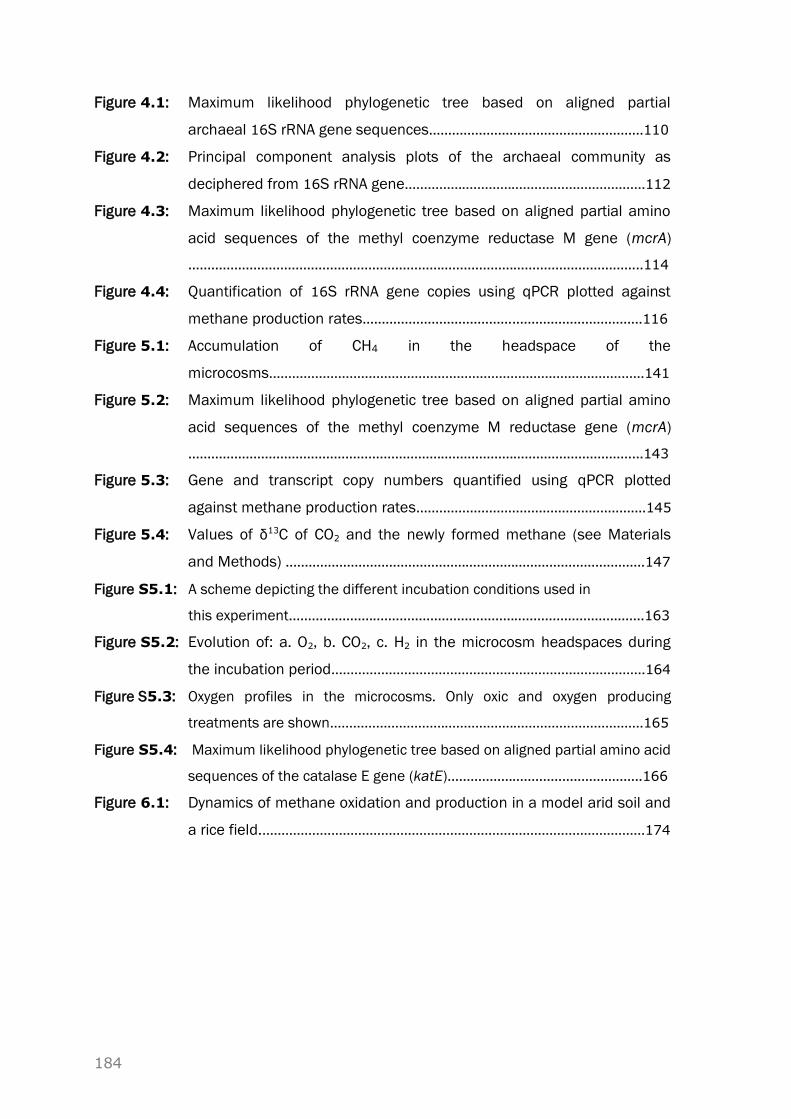
184
Figure 4.1: Maximum likelihood phylogenetic tree based on aligned partial
archaeal 16S rRNA gene sequences........................................................110
Figure 4.2: Principal component analysis plots of the archaeal community as
deciphered from 16S rRNA gene...............................................................112
Figure 4.3: Maximum likelihood phylogenetic tree based on aligned partial amino
acid sequences of the methyl coenzyme reductase M gene (mcrA)
.......................................................................................................................114
Figure 4.4: Quantification of 16S rRNA gene copies using qPCR plotted against
methane production rates.........................................................................116
Figure 5.1: Accumulation of CH4 in the headspace of the
microcosms..................................................................................................141
Figure 5.2: Maximum likelihood phylogenetic tree based on aligned partial amino
acid sequences of the methyl coenzyme M reductase gene (mcrA)
.......................................................................................................................143
Figure 5.3: Gene and transcript copy numbers quantified using qPCR plotted
against methane production rates............................................................145
Figure 5.4: Values of δ13C of CO2 and the newly formed methane (see Materials
and Methods) ..............................................................................................147
Figure S5.1: A scheme depicting the different incubation conditions used in
this experiment.............................................................................................163
Figure S5.2: Evolution of: a. O2, b. CO2, c. H2 in the microcosm headspaces during
the incubation period..................................................................................164
Figure S5.3: Oxygen profiles in the microcosms. Only oxic and oxygen producing
treatments are shown..................................................................................165
Figure S5.4: Maximum likelihood phylogenetic tree based on aligned partial amino acid
sequences of the catalase E gene (katE)...................................................166
Figure 6.1: Dynamics of methane oxidation and production in a model arid soil and
a rice field.....................................................................................................174
185
Curriculum Vitae
Roey Angel
EDUCATION
2007 - present: Doctoral studies at the International Max Planck Research
School for Environmental, Cellular and Molecular
Microbiology; Max-Planck-Institute for Terrestrial
Microbiology, Germany. Supervisor: Prof. Dr. Ralf Conrad.
2004 - 2006: M.Sc. Summa Cum Laude in Desert Studies (Environmental
Studies Specialization), Ben Gurion University of the Negev,
Israel. Supervisors: Prof. Ali Nejidat, Dr. Zeev Ronen, and
Dr. Lior Assaf.
2000 - 2004: B.Sc. Cum Laude in Life Sciences, the Open University. Israel.
ADDITIONAL TRAINING AND FELLOWSHIPS AWARDED
2007: Doctorate fellowship from the International Max Planck
Research School for Environmental, Cellular and Molecular
Microbiology.
2007: Fulbright Doctoral Fellowship (I declined).
2005: Beyond Boundaries: Vermont-Israel-Arab Peace Partners
Project. Supervisor: Dr. Greg Druschel.
PROFESSIONAL EXPERIENCE
2006-2007: Research Assistant: Ben Gurion University of the Negev.
Supervisors: Dr. Osnat Gillor and Dr. Ines Soares
2006: Teaching Assistant: The Arava Institute for Environmental
Studies.

186
List of publications and contribution to conferences
Publications in peer reviewed journals
Bachar, A, Al-Ashhab, A, Soares, MIM, Sklarz, MY, Angel, R, Ungar, ED, Gillor, O
(2010) Soil Microbial Abundance and Diversity Along a Low Precipitation Gradient. Microbial
Ecololgy 60: 453-461
Tal A, Al Khateeb Nader, Nagouker Neta, Akerman Hila, Diabat Mousa, Nassar Alice, Angel R, Sadah MA, Hershkovitz Y, Gasith A, Aliewi A, Halawani D, Abramson A, Assi A, Laronne JB, Asaf L. (2010). Chemical and biological monitoring in ephemeral and intermittent streams: a study of two transboundary Palestinian–Israeli watersheds. International Journal of River Basin Management 8:185-205.
Tal A, Al Khateeb Nader, Nagouker Neta, Akerman Hila, Diabat Mousa, Nassar Alice, Angel R, Sadah MA, Hershkovitz Y, Gasith A, Aliewi A, Halawani D, Abramson A, Assi A, Laronne JB, Asaf L. (2010). Israeli/Palestinian transboundary stream restoration and management: lessons for the future. International Journal of River Basin Management 8:207-213.
Angel R, Soares MIM, Ungar ED, and Gillor O. (2010) Biogeography of soil archaea and
bacteria along a steep rainfall gradient. The ISME Journal 4: 553-563.
Angel R, Asaf L , Ronen Z, and Nejidat A. (2010) Ammonia Transformations and
Diversity of Ammonia-Oxidizing Bacteria in a Desert Ephemeral Stream receiving untreated
wastewater. Microbial Ecology, 59: 46-58.
Sklarz MY, Angel R, Gillor O, and Soares MIM. (2009) Evaluating amplified rDNA
restriction analysis assay for identification of bacterial communities. Antonie van
Leeuwenhoek, 96: 659-664.
Angel R and Conrad R. (2009) In situ measurement of methane fluxes and analysis of
transcribed particulate methane monooxygenase in desert soils. Environmental Microbiology,
11: 2598–2610.
Book chapters
Sklarz MY, Angel R, Gillor O, Soares MIM. Amplified rDNA restriction analysis (ARDRA)
for identification and phylogenetic placement of 16S-rDNA clones. In: Handbook of
Molecular Microbial Ecology (ed. FJ de-Bruijn), Submitted invited contribution
187
Reports and other publications
Tal A, Al Khatib N, Asaf L, Assi A, Nassar A, Abu Sadah M, Gazith A, Laronne JB, Zeev
R, Hirshkovitz Y, Halawani D, Nagouker N, Angel R, Akerman H and Diabat M. 2006.
Watershed modeling: biomonitoring and economic analysis to determine optimal restoration
strategies for transboundary streams, Second year report. MERC project M23-019. Arava
Institute for Environmental Studies.
Tal A, Al Khatib N, Asaf L, Assi A, Nassar A, Abu Sadah M, Gazith A, Laronne JB, Zeev
R, Hirshkovitz Y, Halawani D, Nagouker N, Angel R, Akerman H and Diabat M. 2006.
Watershed modeling: biomonitoring and economic analysis to determine optimal restoration
strategies for transboundary streams, First year report. MERC project M23-019. Arava
Institute for Environmental Studies.
Conference presentations
International Society for Microbial Ecology 13th (2010)
Angel R and Conrad R. Methanogens Are Globally Ubiquitous in Aerated Soils and are Active
Under Simulated Natural Conditions — The Rare Biosphere in Action.
International Society for Microbial Ecology 13th (2010)
Angel R , Sklartz M, Soares M, Conrad R, Gillor, O. Biogeography of Active and Dormant
Soil Microbial Communities Along a Steep Precipitation Gradient
BAGECO 10 - Bacterial Genetics and Ecology (2009) Angel R and Conrad R. in-situ
Measurements of Methane Fluxes and Analysis of Transcribed Particulate Methane
Monooxygenase in Desert Soils.
BAGECO 10 - Bacterial Genetics and Ecology (2009) Angel R, Bachar A, Unger ED,
Soares MIM and Gillor O. Biogeography of Soil Archaea and Bacteria Along a Steep Rainfall
Gradient.
BAGECO 10 - Bacterial Genetics and Ecology (2009) Bachar A, Ashhab A, Soares MIM, M
Sklarz, Angel R, Unger ED, and Gillor O. Trends in the Spatial Variation of Arid Soil
Microbial Communities Along a Precipitation Gradient.
Israeli Society for Ecology and Environmental Sciences (2007)
Angel R, Ronen Z, Asaf L, and Nejidat A. Nitrification and the Effect of Pollution on
Nitrifying Bacteria in the Bed of the Beer Sheva/Hebron Stream.
Israel Society for Microbiology (2007)
Angel R., Ronen Z, Asaf L, and Nejidat A. Nitrification and Diversity of Ammonia-Oxidizing
Bacteria in the Bed of the Beer Sheva/Hebron Stream.
American Geophysical Union Fall Meeting (2006)
Asaf L, Nagouker N, Angel R, Ronen Z, Nejidat A, Tal A, Laronne J, and Al Khateeb N.

188
Hydro-Chemical Characterization and Microbiology Monitoring to Determine Optimal
Restoration Strategies for the Ephemeral Hebron-Besor Transboundary Streams.
International Society for Microbial Ecology 11th (2006)
Angel R, Ronen Z, Nejidat A, and Asaf L. Nitrification and Diversity of Ammonia Oxidizing
Bacteria (AOB) in the bed of a polluted ephemeral desert stream with respect to pollution.
Israel Society for Microbiology (2006)
Angel R, Nagouker N, and Druschel G. Community Analysis of Bacteria Using T-RFLP
Technique across the Redox Gradient in the Sediment at St. Albans Bay, Lake Champlain VT,
USA.

189
Pledge
I certify that the present thesis entitled:
“Methane Turnover in Desert Soils”
was carried out without any unlawful means; no literature resources, reagents
and technical devices were used other than those stated. This work has never
been submitted before in this or similar format to any other university and has
not been used before any examination.
Marburg, October 2010
Roey Angel
190
Acknowledgments
First and foremost, I’d like to thank Prof. Ralf Conrad for introducing me to
the fascinating field of microorganisms as controllers of atmospheric trace
gases, for allowing me to combine it with my love for deserts, for countless
fruitful discussions and ideas and for generating a productive and pleasant
working environment.
Next I’d like to thank my thesis committee for the support along the way and
for providing helpful advice at our meetings. Specifically, I’d like to thank
Prof. Peter Frenzel for providing invaluable assistance in the design of the
apparatus used for the field work and the microcosms experiment and Prof.
Diethart Matthies for giving help and guidance in the various statistical
analyses performed in this work.
I’d like to thank my lab mates and colleagues. Particularly Marc Dumont for
helping me with RNA extractions; Fred Guérin for providing advice for the
field measurements; my lab mates: Fred Guérin, Judith Pump, Angela
Cabezas, Claudia Lüke, and Sascha Karuse for the great working
environments and discussions; Carmen Stubner for translating the abstract
to German; Caludia Lüke for inspiring and helping me out with the thesis
formatting and for helping with the abstract translation; Horst Henseling for
constructing the field work equipment and the microcosms; Melanie Klose
and Peter Claus for all the technical help and for maintaining the labs and
all the equipment at such great condition.
Thanks to the Max-Planck Society for the funding of my fellowship and
work.
Lastly, I’d like to thank Lin Chalozin-Dovrat for providing me with the best
possible writing environment for parts of my thesis and for going through
with me these past few months.

191
The following people are acknowledged for providing specific assistance
for the work presented in the different chapters.
Chapter 2| We gratefully acknowledge Diethart Matthies, Itamar Giladi and
Suzanna K Remold for their help with the statistical analyses. We thank
Eduard Jurkevitch and Zohar Pasternak for their insightful comments on
the manuscript. We also thank Fred A Rainey for introducing us to the topic.
Chapter 3|We thank Professor Peter Frenzel of the Max-Planck-Institute for
Terrestrial Microbiology for his help in the design of the equipment used in
the field work; RazAvni and Tamir Caras for their help in the field
measurements and sampling; the Zuckerberg Institute for Water Research of
Ben-Gurion University of the Negev, Israel for allowing the use of their
facilities, and the Arava Institute for Environmental Studies, Israel for
providing boarding services and administrative assistance; the Analytical
Chemical Laboratory of the Philipps University, Marburg for the CN
analyses; and the Chair of the Physical Geography, Aachen, for analysis of
the soil texture.
Chapter 4| We thank Dr. Claudia Kamman of Giessen FACE Experiment for
providing some of the samples; Prof. Andreas Brune for sampling in
Australia; The Zuckerberg Institute for Water Research of Ben-Gurion
University of the Negev, Israel for allowing the use of their facilities, and the
Arava Institute for Environmental Studies, Israel for providing boarding
services and administrative assistance; The Analytical Chemical Laboratory
of the Philipps University, Marburg for the CN analyses; and the Chair of the
Physical Geography, Aachen, for analysis of the soil texture; Heinz Flessa
(University of Göttingen) for determining the isotopic signature of the soil
organic carbon.
Chapter 5| We thank Prof. Peter Frenzel of the Max-Planck-Institute for
Terrestrial Microbiology in Marburg, Germany for his help in the design of
the microcosms and Horst Henseling for constructing them; Dr. Osnat Gillor
of Ben Gurion University of the Negev, Israel for her assistance in sampling
of the soil; Heinz Flessa (University of Göttingen) for determining the isotopic
signature of the soil organic carbon.

192