meteorological background and tornado events of … background and tornado events of spring 2011...
TRANSCRIPT

TORNADO OUTBREAK OF 2011 MITIGATION ASSESSMENT TEAM REPORT 2-1
2Meteorological Background and Tornado Events of 2011The most violent tornadoes, with wind speeds of more than 200 mph near ground level, are capable of tremendous destruction.
From 1950 through 2006, tornadoes caused 5,506 deaths and 93,287 injuries, as well as devastating personal and property losses.1 According to tornado occurrence data obtained from the NOAA SPC more than 1,275 tornadoes have been reported nationwide each year since 1997. The number of reported tornadoes has increased over the period 1950–2007 (Simmons and Sutter 2011), attributed in part to better reporting of tornadoes and better technology.
1 The majority of the information contained in this section was obtained from the NOAA NWS SPC, http://www.spc.noaa.gov. The SPC, part of NWS, is responsible for forecasting the risk of severe thunderstorms and tornadoes in the contiguous United States.
According to the Glossary of Meteorology (American Meteorological Society 2000), a tornado is “a violently rotating column of air, pendant from a cumuliform cloud or underneath a cumuliform cloud, and often (but not always) visible as a funnel cloud.”

2-2 MITIGATION ASSESSMENT TEAM REPORT TORNADO OUTBREAK OF 2011
METEOROLOGICAL BACKGROUND AND TORNADO EVENTS OF SPRING 2011
Despite the increase in tornado reports, high intensity tornadoes are still rare. The 2011 tornado season was remarkable for the number of strong and violent tornadoes that impacted populated areas, but it was not the most active tornado year in history (SPC).2 Super outbreaks similar to the April 27, 2011 and severe and isolated events like the Joplin, MO, tornado have occurred in the past (e.g., April 3–4, 1974). Strong and violent tornadoes such as those in 2011 can be expected to occur with 20–50 year periodicities in tornado-prone regions.3
This chapter presents a background on tornadoes and a detailed discussion of the events that led up to the April 25–28, 2011 tornado outbreak in the mid-south region of the United States and the May 22, 2011 Joplin, MO, tornado. This chapter introduces the events on which the observations, conclusions, and recommendations in the following chapters of this report are based. Included are a discussion on tornado prediction; a description of the Enhanced Fujita (EF) scale, the method used to rate tornado intensity based on observed damage; a general description of tornadoes and their associated wind and damage patterns; a discussion of NOAA’s NWS tornado warning systems and its method for applying EF ratings to tornadoes; and a narrative of the history, severity, and meteorological events of the spring 2011 tornadoes in Alabama, Georgia, Mississippi, Tennessee, and Missouri.
2.1 Tornado PredictionMeteorologists use several parameters to predict the likelihood and type of severe weather that will occur. Two of the most important parameters for predicting long-track violent tornadoes (LTVTs) are Convective Available Potential Energy (CAPE) and Storm-Relative Helicity (SRH). Since the potential for tornadic storms can be predicted reasonably well using these two parameters, a third parameter, the Energy-Helicity Index (EHI) combines CAPE and SRH. High CAPE values represent an unstable atmosphere and are associated with warm weather and sunny skies. High SRH values reflect the potential for rotating updrafts and are associated with wind shear (changing wind speed and/or wind direction with height in the atmosphere). Generally, when the resulting EHI is greater than 4, there is a good possibility of severe tornadoes (EF2 and greater; refer to Section 2.2 for additional information related to EF scale ratings). Typically, the EHI is in the 5 to 6 range during most large tornadic outbreaks. A summary of these and other severe weather parameters can be found at NOAA’s NWS Weather Forecast Office Web site.4
Tornado Season in the Mid-South Region: Locations in the mid-south, including those areas subjected to the 2011 tornado events, experience their highest CAPE values during the summer months. However, SRH values are typically higher in the cooler months of late fall, winter, and spring, when active frontal systems and undulations in the flow pattern of the upper atmosphere are common. Most severe weather events in the mid-south are therefore characterized by one parameter being much higher relative to the other, and days when high CAPE values coexist with high SRH values are rare. During transitional months in the mid-south region, however, both SRH values and CAPE values can be high. Thus, the mid-south region has two main severe weather/tornado seasons, though tornadoes can occur throughout the year. A peak season occurs from late February
2 The most active year on record is 1974 (http://www.ncdc.noaa.gov/oa/climate/severeweather/tornadoes.html#history)
3 NOAA National Climatic Data Center, Weather/Climate Events, http://www.ncdc.noaa.gov/oa/climateresearch.html. See U.S. Storm Events Database.
4 NOAA NWS Weather Forecast Office, Louisville, KY, http://www.crh.noaa.gov/lmk/soo/docu/indices.php

TORNADO OUTBREAK OF 2011 MITIGATION ASSESSMENT TEAM REPORT 2-3
METEOROLOGICAL BACKGROUND AND TORNADO EVENTS OF SPRING 2011
through mid-April, and a secondary season sometimes occurs in November. The April 25–28, 2011 outbreak was a little past the mean peak of the spring tornado season in the mid-south region.
Tornado Season in the Joplin, MO, Region: The tornado season in Joplin, MO, resembles more of a classic Great Plains regime where peak activity occurs in the spring. May is the peak month for the tornado season in Oklahoma, Kansas, and Missouri, with increased activity commonly occurring from April through June. The probability of tornadoes outside of these 3 months is much lower than it is in the mid-south region.
2.2 Enhanced Fujita ScaleAn important step in classifying tornado intensity was the development of the Fujita scale and the updated EF scale. These tornado intensity rating scales remain an important factor considered by architects and engineers in their evaluation of damage following a tornado. The Fujita scale, originally developed by Dr. Tetsuya T. Fujita in 1971, provided a method to rate tornado intensity by examining the affected area, allowing people to distinguish between weak and strong tornadoes. Since there was no reliable way to accurately determine wind speed of a tornado via instrumentation, the Fujita scale provided a method to rate the intensity of tornadoes based on the damage caused. While the Fujita scale was used for 33 years, it had its limitations. The Fujita scale did not include damage indicators (DIs) and did not provide a method to correlate construction quality with the observed variability in damage resulting from similar wind speeds.
The EF scale, a new tornado strength rating model, was published in 2004 in A Recommendation for an Enhanced Fujita Scale (TTU 2004) and updated in 2006 (TTU 2006).5 The 2006 revision to this document updated the steps in assigning an EF scale rating to a tornado event. More detailed information can be found at the TTU Wind Science and Engineering Research Center Web site.6 In comparison with the Fujita scale, use of the EF scale has led to a more realistic understanding of tornadic wind speeds. It has made it easier to distinguish the areas outside of the central tornado track, which have lesser wind speeds, and areas where wind-resistant design practices may reduce damage.
The EF scale follows the same basic format as the original Fujita scale and also includes six categories, from 0 to 5, representing increasing degrees of wind damage; however, the EF scale was developed using improved examinations of tornado damage to better classify the correlation of tornado damage with associated wind speeds. Table 2-1 lists the 3-second gust speeds based on the original Fujita and EF scale ratings.
5 Available online from TTU at http://www.depts.ttu.edu/weweb/Pubs/fscale/EFScale.pdf
6 TTU Wind Science and Engineering Research Center Website, www.wind.ttu.edu
Tornadoes may travel in any direction, but most move from southwest to northeast or west to east. Unless noted otherwise, the tornadoes that caused the damage observed by the MAT moved from southwest to northeast.

2-4 MITIGATION ASSESSMENT TEAM REPORT TORNADO OUTBREAK OF 2011
METEOROLOGICAL BACKGROUND AND TORNADO EVENTS OF SPRING 2011
Table 2‑1: Fujita Scale Converted to EF Scale
Fujita Scale Fujita Scale: 3-Second Gust (mph) EF Scale EF Scale: 3-Second Gust (mph)
F0 45–78 EF0 65–85
F1 79–117 EF1 86–110
F2 118–161 EF2 111–135
F3 162–209 EF3 136–165
F4 210–261 EF4 166–200
F5 262–317 EF5 Over 200mph = miles per hour; EF = Enhanced Fujita
The EF scale uses 28 DIs to categorize building use and type of construction. Each DI includes damage description categories; each is assigned a number termed the degree of damage (DOD), and each has a damage description associated with an expected estimated wind speed. An example of the DOD and damage descriptions for a single-family residence as well as descriptions of the 28 DIs can be found in Appendix E. The DOD includes the expected wind speed as well as a lower- and upper-bound wind speed that would most likely produce the in observed damage. Photographs are included in the supporting documentation for the EF scale in A Recommendation for an Enhanced Fujita Scale (TTU 2006) to assist investigators. Appendix E provides additional information on the EF scale, including a list of the DIs and examples of damage description categories.
2.3 Tornado Winds and Damage Patterns The visible funnel cloud associated with and typically labeled the vortex of a tornado is not always the edge of the strongest winds. The radius of highest wind speeds in a tornado can be larger than the visible funnel cloud’s radius. The visible funnel cloud boundary is determined by the temperature and moisture content of the tornado’s inflowing air. It is important to remember that a tornado’s wind speeds cannot be determined just by looking at the tornado. In a tornado, the diameter of the vortex can change with time, so it is impossible to say precisely where a less intense region of the tornado’s wind flow ends and a more intense region begins.
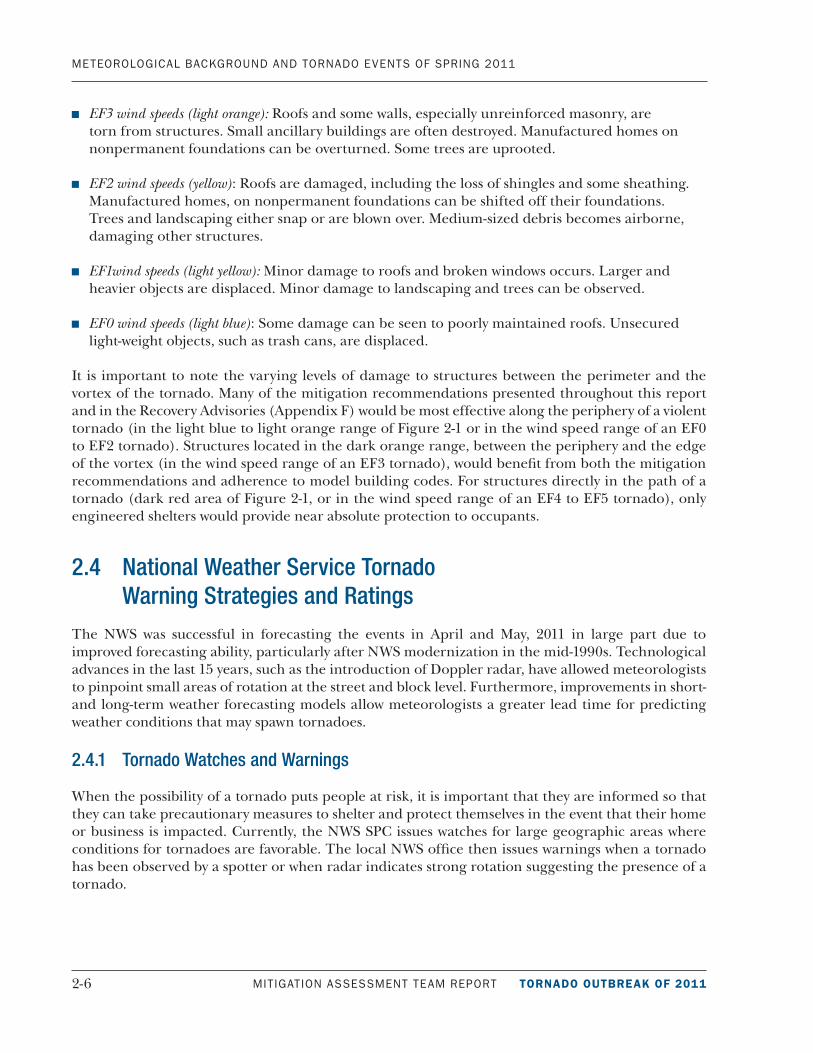
Figure 2-1 shows the types of damage that can be caused by the tornadic winds of a violent tornado. In general, as shown in the figure, the severity of the damage varies with distance from the vortex and wind speeds within the vortex. Note, however, that the rotation of a tornado can cause winds flowing into the vortex on one side to be greater than those on other sides. As a result, it is not uncommon for the area of damage on one side of the tornado to be more extensive. The colors in Figure 2-1 illustrate the expected tornado damage near the vortex of the tornado (darkest red) to the periphery of the tornado swath (lightest yellow). The damage expected at each of these wind speeds is explained below:
Inflow is rapidly moving air near the surface that is being pulled ra-dially into the vortex. Inflow speeds range from approximately 45–135 mph depending on distance from the vortex and the intensity of the tornado.
For information on how the NWS uses the EF scale to derive its tor-nado ratings, refer to Section 2.4.2.

TORNADO OUTBREAK OF 2011 MITIGATION ASSESSMENT TEAM REPORT 2-5
METEOROLOGICAL BACKGROUND AND TORNADO EVENTS OF SPRING 2011
Figure 2‑1: Potential tornado damage pattern SOURCE: ADAPTED FROM FIGURE 2-2 OF FEMA 342 (1999A)
++ EF5 wind speeds (dark red): Strong frame houses and engineered buildings are lifted from their foundations or are significantly damaged or destroyed. Automobile-sized debris is moved significant distances. Trees are uprooted and splintered
++ EF4 wind speeds (dark orange): Well-constructed homes, as well as manufactured homes, are destroyed, and some structures are lifted off their foundations. Automobile-sized debris is displaced and often tumbles. Trees are often uprooted and blown over.
2-6 MITIGATION ASSESSMENT TEAM REPORT TORNADO OUTBREAK OF 2011
METEOROLOGICAL BACKGROUND AND TORNADO EVENTS OF SPRING 2011
++ EF3 wind speeds (light orange): Roofs and some walls, especially unreinforced masonry, are torn from structures. Small ancillary buildings are often destroyed. Manufactured homes on nonpermanent foundations can be overturned. Some trees are uprooted.
++ EF2 wind speeds (yellow): Roofs are damaged, including the loss of shingles and some sheathing. Manufactured homes, on nonpermanent foundations can be shifted off their foundations. Trees and landscaping either snap or are blown over. Medium-sized debris becomes airborne, damaging other structures.
++ EF1wind speeds (light yellow): Minor damage to roofs and broken windows occurs. Larger and heavier objects are displaced. Minor damage to landscaping and trees can be observed.
++ EF0 wind speeds (light blue): Some damage can be seen to poorly maintained roofs. Unsecured light-weight objects, such as trash cans, are displaced.
It is important to note the varying levels of damage to structures between the perimeter and the vortex of the tornado. Many of the mitigation recommendations presented throughout this report and in the Recovery Advisories (Appendix F) would be most effective along the periphery of a violent tornado (in the light blue to light orange range of Figure 2-1 or in the wind speed range of an EF0 to EF2 tornado). Structures located in the dark orange range, between the periphery and the edge of the vortex (in the wind speed range of an EF3 tornado), would benefit from both the mitigation recommendations and adherence to model building codes. For structures directly in the path of a tornado (dark red area of Figure 2-1, or in the wind speed range of an EF4 to EF5 tornado), only engineered shelters would provide near absolute protection to occupants.
2.4 National Weather Service Tornado Warning Strategies and Ratings
The NWS was successful in forecasting the events in April and May, 2011 in large part due to improved forecasting ability, particularly after NWS modernization in the mid-1990s. Technological advances in the last 15 years, such as the introduction of Doppler radar, have allowed meteorologists to pinpoint small areas of rotation at the street and block level. Furthermore, improvements in short- and long-term weather forecasting models allow meteorologists a greater lead time for predicting weather conditions that may spawn tornadoes.
2.4.1 Tornado Watches and Warnings
When the possibility of a tornado puts people at risk, it is important that they are informed so that they can take precautionary measures to shelter and protect themselves in the event that their home or business is impacted. Currently, the NWS SPC issues watches for large geographic areas where conditions for tornadoes are favorable. The local NWS office then issues warnings when a tornado has been observed by a spotter or when radar indicates strong rotation suggesting the presence of a tornado.

TORNADO OUTBREAK OF 2011 MITIGATION ASSESSMENT TEAM REPORT 2-7
METEOROLOGICAL BACKGROUND AND TORNADO EVENTS OF SPRING 2011
The NWS warning comes in the form of a list of cities and towns that are predicted to be in the path of the storm and the times when the storm will reach a given location. These tornado warnings are disseminated through multiple media sources in different formats in order to convey the information to the public. Residents of communities are alerted about a tornado warning via television, radio, social media, internet, and sirens. Television coverage often includes a tornado polygon of the projected path that is based on the NWS warnings, giving viewers an easily understood graphic representation of the warnings.
False Alarm Ratios
There are times when a tornado warning is issued, but no tornado touches down. This occurs because radar-indicated rotation within a thunderstorm often does not indicate the actual presence of a tornado. For this reason, the majority of severe weather events and tornado warnings are for weak storms, producing winds with speeds in the EF0 or EF1 range. Often, circulation cannot be confirmed without a spotter in the field, so for these events it is difficult to tell whether or not they are actually tornadoes. The volume of such low intensity events may diminish the value of a warning when one is issued for a more serious storm, similar to those that occurred in the spring of 2011. Statistics documented by the NWS for tornado false alarm ratios in 2008 indicate a rate of 75 percent. The NWS is trying to reduce this number to 70 percent (Brotzge et al. 2011). The false alarm ratio statistics can be misleading because forecasters are not given credit for close calls.
New Experimental Tornado Warnings
An experimental tornado warning method will be introduced at select NWS field offices beginning April 2, 2012. The traditional tornado warning will be retained in a modified form and two new categories will be added. The experimental warnings will be as follows:
++ Tornado warning: A tornado indicated by radar, but not confirmed by field spotters.
++ Particularly dangerous situation (PDS) tornado warning: A tornado confirmed on the ground by field spotters or residents.
++ Tornado emergency: The highest level of tornado warning; this warning will be issued if a large and potentially violent tornado is about to impact a densely populated area.
2.4.2 NWS EF Rating Assignments
NWS assigns tornado ratings using the EF scale rating system. For events with damage that is potentially greater than EF3 level, the NWS forms a Quick Response Team (QRT) consisting of meteorologists and one or two structural engineers. The QRT conducts a thorough evaluation of damage to structures along the tornado’s path and note any unusual observations. Unusual observations include tree debarking, pavement scouring, and other difficult to quantify phenomena associated with very high winds.
The SPC has issued probabilistic fore-casts of atmospheric hazards for many years. It issues a three-tiered and col-or coded probabilistic forecast on its Web site that shows risk categories of slight (light green), moderate (light red), and high (magenta) for areas forecast-ed to be impacted by severe weather (http://www.spc.noaa.gov).

2-8 MITIGATION ASSESSMENT TEAM REPORT TORNADO OUTBREAK OF 2011
METEOROLOGICAL BACKGROUND AND TORNADO EVENTS OF SPRING 2011
The QRT rates EF scale intensities for individual and surrounding structures while using multiple DIs and DODs (refer to Appendix E for additional information DIs and DODs). The data and ratings gathered by the QRT are used by NWS to construct wind speed contours that show wind speed decay from the vortex to the periphery of the damage swath.
For lower intensity tornadoes, the NWS forms a smaller assessment team to conduct a damage survey with specific objectives. The team locates the beginning, end, and widest section of the damage swath, and then rates the maximum intensity of the tornado using multiple DIs and DODs (refer to Section 2.2 for more information on DIs and DODs). The NWS assessment of weaker tornadoes is not as detailed as that performed by a QRT. All assessment personnel, whether QRT or not, undergo training on how to use the EF scale rating system.
The NWS considers several DIs when assigning an EF scale rating to a tornado event. For this reason, structures along the path of a tornado may be assigned several different EF ratings ranging from EF0 to EF5, while the overall tornado intensity may be labeled EF4. For archival purposes, a tornado is officially labeled by the NWS according to its highest intensity along its path.
2.5 Tornado Events of Spring 2011This section summarizes the events in the mid-south region of the United States from April 25 to 28 and the events in Joplin, MO, on May 22. The information is summarized from post-storm assessments from NWS offices in Jackson, MS; Memphis, TN; Birmingham, AL; Huntsville, AL; and Springfield, MO, unless otherwise noted. Links to specific post-storm assessments are found in the references. EF ratings in this chapter are from NWS post-storm assessments.
2.5.1 April 25–28, 2011 Tornadoes in the Mid‑South Area of the United States
The following subsections present the events of the April 25–28, 2011 tornadoes in the mid-south area of the United States. The events are presented chronologically, rather than geographically, in order to trace the outbreak from beginning to end using the perspective of those who witnessed the events. The tornado tracks for the April 25–28, 2011 outbreak in Alabama are shown in Figure 2-2 and in Mississippi in Figure 2-3. The tornado tracks from the neighboring States of Tennessee and Georgia are not shown since the tornadoes that impacted those States originated in Alabama and Mississippi, where they caused much greater damage. The names referenced for the tornadoes are those that were widely used by NWS and the media in the aftermath of the tornadoes.
2.5.1.1 April 18–24, 2011
During the week of April 18–22, 2011, the meteorological community began to discuss a potentially significant severe weather scenario developing in forecasted model runs for the following week. As early as Tuesday, April 19, broadcast meteorologists and NWS personnel in Alabama were discussing the possibility of a major severe weather event within 8 days or so. Discussions among forecasters in
NWS EF scale training and rating practices can be viewed on the following Web sites:
http://www.spc.noaa.gov/efscale/
http://www.wdtb.noaa.gov/courses/ EF-scale/index.html

TORNADO OUTBREAK OF 2011 MITIGATION ASSESSMENT TEAM REPORT 2-9
METEOROLOGICAL BACKGROUND AND TORNADO EVENTS OF SPRING 2011
Figure 2‑2: Map of tornado tracks associated with the April 27, 2011 outbreak in AlabamaSOURCE: HTTP://WWW.SRH.NOAA.GOV/BMX/?N=EVENT_04272011 APRIL 27, 2011, 12:00 P.M. TO 6:00 P.M
the Southeast escalated throughout the weekend after every model update. Forecasters thought that conditions suggested a very strong potential for supercells with LTVTs.
By Sunday, April 24, forecast soundings and severe weather parameters showed a high combination of CAPE and SRH values for the afternoon of Wednesday, April 27. The corresponding EHI values were forecasted in some areas to have an extremely high value of EHI greater than 9. Generally, when the EHI is over 4, there is a good possibility of strong (EF2 to EF3) and violent (EF4 to EF5) tornadoes. Typically, EHI is in the 5 to 6 range during large outbreaks. On Monday, April 27, when

2-10 MITIGATION ASSESSMENT TEAM REPORT TORNADO OUTBREAK OF 2011
METEOROLOGICAL BACKGROUND AND TORNADO EVENTS OF SPRING 2011
new model updates showed better agreement in timing and evolution of the event, meteorologists had greater confidence in the development of supercells with LTVT. This began a 48-hour period of warning.
2.5.1.2 April 25, 2011
The situation began to materialize in the early morning hours of April 25, when a very strong trough in the upper atmosphere strengthened and moved southward along the leeward side of the Rockies into the Great Plains, bringing cold polar air
NWS and forecasters successfully predicted the severe tornado event. Broadcast meteorologists and NWS personnel began predicting the possi-bility of severe weather a week before the event (http://weather.gov). By 48 hours before the severe tornado events of April 25–28, they were actively warn-ing the public about a historic severe weather day.
Figure 2‑3: Map of tornado tracks associated with the April 26–27, 2011 outbreak in MississippiSOURCE: HTTP://WWW.SRH.NOAA.GOV/JAN/?N=2011_04_25_27_SVR

TORNADO OUTBREAK OF 2011 MITIGATION ASSESSMENT TEAM REPORT 2-11
METEOROLOGICAL BACKGROUND AND TORNADO EVENTS OF SPRING 2011
from Canada. Unseasonably warm, moist, and unstable air from the Gulf of Mexico was in place throughout much of the southern United States. A 1,000-millibar (mb) surface low was centered just west of Lubbock, TX, at 7:00 p.m. Central Daylight Time (CDT)7 on April 25 in an area of active cyclogenesis. Severe storms began to develop in the diffluent zone to the east of the developing system on the afternoon of April 25 across northeast Texas, southwest Arkansas, and northwest Louisiana. These storms formed into bow echoes that produced high winds and several tornadoes across Arkansas. The atmosphere briefly settled in the early morning hours of April 26 before quickly recharging.
2.5.1.3 April 26, 2011
At 7:00 a.m. on April 26, a 992 mb low was located near Davenport, IA, with a trailing cold front stretching south-southwest into Texas. A secondary surface low developed and deepened over Texas while a jet streak (faster-moving section of the jet stream) promoted uplift in the late afternoon hours. These conditions prompted the SPC to issue a high risk, severe weather outlook for southern Arkansas. High risk warnings are rare and indicate a significantly higher than normal chance for tornadic storms. According to the SPC archives, there were only seven high risk warnings between January 2007 and August 2011.
Numerous tornadoes evolved in Arkansas on the afternoon and evening of April 26 as the storms initially developed as supercells and transitioned into a quasi-linear convective system (QLCS). The QLCS raced eastward into Mississippi and Alabama overnight, evolving into a squall line and knocking out power for thousands. There were hundreds of reports of severe straight-line winds and 21 tornadoes.
2.5.1.4 April 27, 2011, 2:00 a.m. to 12:00 p.m.
Linear squall line events normally produce isolated, weaker tornadoes in the EF0 and EF1 range, but some of the early morning (2:00 a.m. – 3:00 a.m.) tornadoes in Alabama on April 27 were rated EF2 and EF3. Squall line events are common in Alabama, and the early morning events may have left many residents assuming that the worst of the severe weather had simply arrived half a day early. Furthermore, the morning weather caused numerous power outages, depriving many people of access to local TV meteorologists during the critical afternoon hours.
In the wake of the QLCS/squall line, skies slowly began to clear across northern Mississippi and Alabama, giving way to mostly sunny and very humid conditions with sustained southerly winds of 15 to 25 mph. Despite the clear skies, the forecasted conditions from the model runs of the preceding days were materializing into the perfect combination of instability and wind shear capable of creating the super outbreak of tornadoes on the afternoon of that day.
The SPC issued a PDS (particularly dangerous situation) tornado watch for Mississippi, Alabama, and portions of Tennessee shortly after noon. A 996 mb surface low had formed overnight in Arkansas
7 All times given as CDT unless otherwise noted.
A bow echo is a bow-shaped line of convective storm cells often associated with swaths of dam-aging straight-line winds and small tornadoes.

2-12 MITIGATION ASSESSMENT TEAM REPORT TORNADO OUTBREAK OF 2011
METEOROLOGICAL BACKGROUND AND TORNADO EVENTS OF SPRING 2011
and was tracking toward Memphis while strengthening. At the same time, a potent shortwave in the upper atmosphere was arriving and promoting further uplift over Mississippi and Alabama during the peak hours of afternoon heating. In the early afternoon, small supercell thunderstorms started to form and take on classic supercell characteristics.
2.5.1.5 April 27, 2011, 2:30 p.m. to 3:00 p.m.: Philadelphia, MS, Tornado #24, and Cullman, AL, Tornado #38
The first major tornado of the day formed near Philadelphia, MS, at approximately 2:30 p.m. and tracked northeast for 29 miles while briefly attaining EF5 status (shown as Tornado #24 on Figure 2-3). Though over rural areas, this tornado produced three fatalities when it tossed a manufactured home several hundred yards.8
A short time later at 2:43 p.m., the 43-mile-long EF4 Cullman, AL, tornado (shown as Tornado #38 on Figure 2-2) formed over Smith Lake and tracked northeast through the heart of Cullman, a city of 15,000. It was characterized by multiple vortices during the first 15 miles of its path. The base reflectivity image for the Cullman, AL, tornado is shown in Figure 2-4. The hook echo is circled in white on the image (Figure 2-4). The tornado continued northeasterly and reached peak intensity over rural areas as it passed north of Fairview, AL. This tornado was the first tornado of the day to be filmed via skycam and broadcast live to residents of north-central Alabama.
8 NOAA NWS, Weather Forecast Office, Jackson, MS, Tornado Outbreak April 25–27, 2011, http://www.srh.noaa.gov/jan/?n=2011_04_25_27_svr
Figure 2‑4: Base reflectivity and hook echo (white circle) for Cullman, AL
Cullman, AL
A PDS tornado watch provides the same recommended actions to the public, school officials, and emergency man-agers as other tornado watches. This terminology is often used by meteorologists and even occasionally used when broadcasting storm situations on the air.
A shortwave trough (or shortwave) is a disturbance in the mid or upper part of the atmosphere which induces upward motion ahead of it. If other conditions are favorable, this up-ward motion can contribute to thunderstorm development ahead of a shortwave trough. (SOURCE: NWS GLOSSARY, HTTP://NWS.NOAA.GOV/GLOSSARY)

TORNADO OUTBREAK OF 2011 MITIGATION ASSESSMENT TEAM REPORT 2-13
METEOROLOGICAL BACKGROUND AND TORNADO EVENTS OF SPRING 2011
2.5.1.6 April 27, 2011, 3:00 p.m.: Hackleburg to Huntsville, AL, Tornado #40
Just before 3:00 p.m., a discrete supercell rapidly evolved to the west as it crossed the Mississippi/Alabama State line and began to acquire tornadic characteristics on radar. The Hackleburg-to-Huntsville tornado that developed from this supercell tracked an amazing 107 miles before dissipating north of Huntsville, AL. It was rated at EF5 intensity in Hackleburg and Phil Campbell, and possibly reached peak intensity after Phil Campbell near Oak Grove, AL. The NWS justification for the EF5 status was based on numerous pieces of evidence, described below and in the body of this report. According to the SPC database updated in January 2012 (NOAA 2012), the Hackleburg-to-Huntsville tornado caused 72 fatalities, which ranks it as the sixth deadliest single tornado since 1950.
A tornado warning was issued by the NWS Birmingham office at 2:59 p.m. for the Hackleburg/Phil Campbell area, and at 3:24 p.m., a tornado struck the town of Hackleburg, AL (shown as Tornado #40 on Figure 2-2). The base reflectivity radar image showing the hook echo in Hackleburg, AL, is shown in Figure 2-5. In Hackleburg, there was evidence of debris rowing (the piling of debris into rows aligned with wind direction), which occurs in a small percentage of the most violent tornadoes.
The tornado then continued northeast and struck the neighboring town of Phil Campbell 10 minutes later. The base reflectivity and relative velocity radar images for the tornado in Phil Campbell are shown in Figure 2-6. In Phil Campbell, which is located 10 miles northeast of Hackleburg, the damage was similar but more extensive.
In Oak Grove, 20 miles northeast of Phil Campbell, the tornado caused widespread damage, including complete tree debarking in Oak Grove, the most noticeable compared to any other point along its track. Tree debarking is an indication of very intense winds; however, exact wind thresholds for tree debarking depend on tree species and tree health among other factors.
Base reflectivity is measured by Doppler radar and is related to the power, or intensity, of the re-flected radiation sensed by the radar antenna. Base reflectivity is related to rainfall intensity (e.g., drop size and rainfall rate) and hail size (for large values of reflectivity).
Hook echo is a radar reflectivity pattern character-ized by a hook-shaped extension of a thunderstorm echo, usually in the right-rear part of the storm (rel-ative to its direction of motion). A hook often is associated with a mesocyclone, and indicates favor-able conditions for tornado development.(SOURCE: NWS GLOSSARY, HTTP://NWS.NOAA.GOV/GLOSSARY/)
Figure 2‑5: Base reflectivity and hook echo (white circle) for Hackleburg, AL
Hackleburg, AL

2-14 MITIGATION ASSESSMENT TEAM REPORT TORNADO OUTBREAK OF 2011
METEOROLOGICAL BACKGROUND AND TORNADO EVENTS OF SPRING 2011
Based on NWS damage assessments, the intensity of the tornado fluctuated from EF3 to EF4 as it continued northeast toward Huntsville. The community of Tanner, 28 miles northeast of Oak Grove and approximately 30 miles from the tornado’s end in Huntsville, appears to have experienced increased damage, at least in the upper-end EF4 range. With this tornado, Tanner has been struck by three tornadoes at or above EF4 intensity, twice in a 1974 outbreak and again in the 2011 outbreak. Phil Campbell was also struck in the 1974 outbreak.9 This represents the most at-or-above EF4 intensity tornado occurrences for a single community.
2.5.1.7 April 27, 2011, 3:30 p.m.: Smithville, MS, Tornado #43
Only 25 minutes after the formation of the Hackleburg-to-Huntsville tornado, another storm was developing 20 miles to the southwest over Mississippi, with a track paralleling the Hackleburg storm (shown as Tornado #43 on Figure 2-2). The tornado first appeared north of Amory, MS, and at 3:42 p.m. the EF5 tornado struck Smithville, MS. The base reflectivity and the relative velocity images for the tornado in Smithville, MS, are shown in Figure 2-7. This tornado was on the ground simultaneously with the EF5 to its east that was over Oak Grove, AL. The total length of the Smithville tornado track was 49 miles and it caused 16 fatalities in Mississippi and 7 in Alabama.10
The Smithville, MS, tornado crossed into Alabama and struck the community of Shottsville, AL, where it was rated at EF3. The tornado dissipated 6 miles west of Hackleburg, close to the track of the Hackleburg-to-Huntsville tornado.
9 Historical storm event information is available through the NOAA National Climatic Data Center, http://www.ncdc.noaa.gov/oa/climate/severeweather/extremes.html
10 NOAA NWS SPC, Annual U.S. Killer Tornado Statistics, http://www.spc.noaa.gov/climo/torn/fataltorn.html
The SPC successfully predicted the high risk areas. The area of northeast Mississippi and northwest Alabama was at the center of the SPC’s high risk zone.
Figure 2‑6: Base reflectivity and hook echo (white circle, left) and storm relative velocity (right) for Phil Campbell, AL
Phil Campbell, AL
Phil Campbell, AL

TORNADO OUTBREAK OF 2011 MITIGATION ASSESSMENT TEAM REPORT 2-15
METEOROLOGICAL BACKGROUND AND TORNADO EVENTS OF SPRING 2011
2.5.1.8 April 27, 2011, 3:38 p.m.: Cordova, AL, Tornado #41/#49
At approximately the same time the Smithville, MS, tornado formed, another tornadic supercell began its 123-mile-long path at 3:38 p.m., eventually striking Cordova, AL, 45 miles to the south-southeast in Walker County (this tornado is shown as two tornadoes, #41 and #49, on Figure 2-2). This tornado was ranked EF1 to EF2 for most of its duration, but it briefly escalated into the EF3 to EF4 range after crossing the future I-22 corridor and passing over Cordova, AL, resulting in 13 fatalities.11 The base reflectivity and the relative velocity images for the tornado in Cordova, AL, are shown in Figure 2-8.
The downtown buildings of Cordova had already been directly impacted by a smaller, but still significant tornado during the early morning hours of April 27, when the squall line (described in Section 2.5.1.3) passed through. Power was still off from that event, leaving the warning siren inoperable during the afternoon. The afternoon Cordova tornado was ranked as an EF3 based on the damage in downtown Cordova. The afternoon track crossed the morning track just 50 yards south of the historic downtown.
11 Ibid.
Figure 2‑7: Base reflectivity and hook echo (white circle, left) and storm relative velocity on right for Smithville, MS
Smithville, MS
Smithville, MS
Figure 2‑8: Base reflectivity and hook echo (white circle, left) and storm relative velocity on right for Cordova, AL
Cordova, ALCordova, AL

2-16 MITIGATION ASSESSMENT TEAM REPORT TORNADO OUTBREAK OF 2011
METEOROLOGICAL BACKGROUND AND TORNADO EVENTS OF SPRING 2011
The tornado achieved its maximum intensity of EF4 as it moved northeast of Cordova. It then continued northeast over hilly and rural terrain and, based on reported damage, possibly intensified after dropping off a bluff.
2.5.1.9 April 27, 2011: Macon County Supercell Thunderstorm, Tornado #46
The last major tornado of the day causing damage assessed by the MAT was spawned from the Macon County, MS, supercell thunderstorm. A small, discrete supercell developed over Newton County, MS, and looked ordinary for the first 20 minutes of its lifespan. However, there were no storms to the south of this cell to rob it of its inflow, suggesting potential strengthening. Though almost 100 minutes after forming, it was evident that this supercell had a high probability of directly impacting the city center of Tuscaloosa, a city of 83,000 and metropolitan area of almost 150,000 people. TV meteorologists broadcasted a long-range polygon to show what would likely happen over the next hour, and the Birmingham Forecast Office of the NWS provided a 65-minute warning lead time for Tuscaloosa.12 Incredibly, this supercell thunderstorm would not dissipate until reaching Macon County, NC, almost 7 hours and 30 minutes later, after dropping several tornadoes along its path. Along its 80-mile path through Tuscaloosa and the Birmingham suburbs, it produced 64 fatalities and injured over 1,000 people.13
At 4:43 p.m. the supercell thunderstorm became tornadic just to the southwest of Tuscaloosa, AL (shown as Tornado #46 on Figure 2-2). The base reflectivity and the relative velocity images for the tornado in Tuscaloosa, AL, are shown in Figure 2-9. The storm crossed I-20 near exit 68 at Joe Mallisham Parkway. It entered an industrial area where it damaged and destroyed many buildings, including the large building that housed Tuscaloosa County EMA. The tornado then crossed I-359 and entered the residential areas of Tuscaloosa. A hardened room in a neighborhood was the only structure remaining after debris was cleared (structure is discussed in more detail in Section 9.1.1). The tornado then passed over the busy commercial intersection of 15th Street and McFarland Boulevard. At this point, its intensity was rated at EF4 status and it continued to intensify and grow larger as it tracked into the Alberta section of Tuscaloosa.
12 NWS storm-based warnings and storm reports issued by a Weather Forecast Office can be viewed online at the Iowa Environmental Mesonet, Iowa State University Department of Agronomy, Web site, http://mesonet.agron.iastate.edu/cow/
13 NOAA NWS Weather Forecast Office, Birmingham, AL, Tuscaloosa-Birmingham EF-4 Tornado, April 27, 2011, http://www.srh.noaa.gov/bmx/?n=event_04272011tuscbirm
Figure 2‑9: Base reflectivity and hook echo (white circle, left) and storm relative velocity on right for Tuscaloosa, AL
Tuscaloosa, ALTuscaloosa, AL

TORNADO OUTBREAK OF 2011 MITIGATION ASSESSMENT TEAM REPORT 2-17
METEOROLOGICAL BACKGROUND AND TORNADO EVENTS OF SPRING 2011
Alberta Elementary School was severely damaged (see Chapter 6). Most of the older homes in Alberta, as many as 200 or more, were destroyed except for a few interior rooms. Tree debarking was more common here than in other areas struck by this tornado. The tornado then continued into the community of Holt. Most of the older homes in Holt, as many as 200, were completely destroyed while others were left with small interior walls intact. Damage observed in Holt further validated the EF4 rating for the tornado.
The tornado then exited the Tuscaloosa metropolitan area and tracked east-northeast across rural areas before heavily damaging the town of Concord in Jefferson County. After Concord, the tornado passed over the outer sections of Pleasant Grove. The base reflectivity and the relative velocity images for the tornado in Pleasant Grove, AL, are shown in Figure 2-10.
The tornado next passed over the industrial area of Pratt City on the northern side of Birmingham, AL. The tornado weakened here, though it still produced extensive damage in Pratt City. The tornado continued to lose intensity, although briefly getting much wider, as it crossed I-65 near exit 266 north of Birmingham. It finally dissipated in Fultondale, AL, where it briefly displayed multiple vortices before lifting.
Although the Tuscaloosa metropolitan area is frequently impacted by tornadoes, the city center had not been directly in the path of a major tornado since 1932. An F4 tornado affected the southern part of the city of Tuscaloosa on December 16, 2000. The April 8, 1998 F5 Oak Grove tornado track was less than 5 miles away from the April 27, 2011 track that devastated Pleasant Grove.14
2.5.2 May 22, 2011 Storms in Missouri
The May 22 Joplin, MO, tornado resulted in the highest number of fatalities for a single tornado since modern record keeping began in 1950. The official fatality count is 161 including both direct and indirect fatalities (City of Joplin 2011).
14 Historical storm event information is available through the NOAA National Climatic Data Center, http://www.ncdc.noaa.gov/oa/climate/severeweather/extremes.html
Figure 2‑10: Base reflectivity and hook echo (white circle, left) and storm relative velocity on right for Pleasant Grove, AL
Pleasant Grove, ALPleasant Grove, AL
2-18 MITIGATION ASSESSMENT TEAM REPORT TORNADO OUTBREAK OF 2011
METEOROLOGICAL BACKGROUND AND TORNADO EVENTS OF SPRING 2011
Unlike the April 25–28 tornado events in the mid-south, the May 22 Joplin, MO, tornado was an isolated occurrence on a day forecasted by the SPC as having only a moderate risk for tornado activity. Although the threat for severe weather and tornadoes existed, the forecasted conditions were not ideal to produce LTVT. Although there were 51 confirmed tornadoes across an eight-State area that included Missouri, no other tornadoes developed on that day above EF3 intensity. The atmospheric conditions and thunderstorm cell dynamics rapidly evolved during the afternoon hours to produce a complex interaction of circumstances leading to the Joplin, MO, tornado.15
2.5.2.1 Summary of Synoptic Setting and Mesoscale Environment
In the days before May 22, 2011, meteorologists at the SPC identified conditions favorable for severe weather across a large area of the Great Plains and upper Midwest. A trough in the upper atmosphere was accompanied by a strong 996 mb surface low in eastern South Dakota. A cold front stretched from South Dakota to the Texas Panhandle with advection of warm, moist and unstable air ahead of the front. Several weaker tornadoes touched down in Minnesota and Wisconsin as forecasters had anticipated. An area of diffluence occupied much of the southern Plains in the vicinity of southwest Missouri. By the afternoon of May 22, high CAPE values were in place, and SRH values were increasing ahead of a dry line in Oklahoma.
A mesoscale discussion was issued at 3:48 p.m. from the SPC indicating the evolving tornado potential over southwestern Missouri with parameters more than sufficient to produce tornadic supercells. A broken line of severe thunderstorms initiated over Kansas and travelled generally southeast toward the Missouri border. Despite the evolving tornadic potential, as indicated by rapidly increasing EHI values immediately before the Joplin tornado, none of the Kansas storms materialized into tornadic cells. The supercell that would ultimately produce the Joplin tornado lacked classic structure as it approached the Missouri border.
Around 4:45 p.m., meteorologists observed a smaller storm coming out of Oklahoma and moving toward the northeast. This storm was on a collision course with the unstructured supercell in southeastern Kansas. At 5:05 p.m., the two storms collided and merged, as has happened before in numerous severe weather events. When cells merge, often the newly created supercell weakens or dissipates due to disruption of the circulation. However, in other instances in the region, such as the Pierce City, MO, 2003 tornado and the Picher, OK, 2000 tornado, merging cells produce a stronger supercell.
In the May 22, 2011 case, the rapidly rotating smaller cell was ingested by the dying larger cell. The newly created supercell began a transformation and started to acquire a more menacing classic shape. Based on the storm’s right-moving tendency and the presence of warm, moist, and unstable air, staff at NWS in Springfield, MO, issued a tornado warning 12 minutes later at 5:17 p.m., despite the storm’s marginal appearance. A short time later at 5:24 p.m., another small cell moving northeast was ingested, and at this point the Joplin supercell began to rapidly intensify and acquire tornadic characteristics.
15 A brief description of the synoptic setting and mesoscale environment for the Joplin tornado, as well as a summary of the NWS damage survey assessment, is located at: NOAA NWS Weather Forecast Office, Springfield, MO, Joplin Tornado Event Summary, May 22, 2011, http://www.crh.noaa.gov/sgf/?n=event_2011may22_summary

TORNADO OUTBREAK OF 2011 MITIGATION ASSESSMENT TEAM REPORT 2-19
METEOROLOGICAL BACKGROUND AND TORNADO EVENTS OF SPRING 2011
At 5:29 p.m., the supercell displayed a hook echo with a velocity couplet (tightly clustered incoming and outgoing winds on radar). The initial touchdown of the multiple-vortex tornado took place at 5:34 p.m. on the southwestern side of Joplin. A storm relative velocity image was captured at 5:38 p.m. and a base reflectivity image at 5:43 p.m. (Figure 2-11).
2.5.2.2 Damage and Path of the Joplin Tornado
Along its 22-mile path, and especially a 6-mile stretch in Joplin, the 0.75-mile-wide EF5 tornado destroyed and damaged thousands of homes. Numerous commercial buildings, schools, churches, and critical facilities were also destroyed or severely damaged. Joplin had the unfortunate circumstance of being located downwind of the merger collisions that perturbed the ordinary supercell and transformed it into a violent tornadic storm. An NWS assessment team observed damage consistent with previous EF5 tornadoes, including those from the April 27, 2011 outbreak. A full report on their findings can be found at the NOAA NWS, Weather Forecast Office, Springfield, MO, Web site.16
The tornado intensified rapidly after touching down near JJ Highway. By the time it entered a new residential area near Sunset Drive, the tornado was evolving from a multiple-vortex structure into a wedge. The sporadic damage on Sunset Drive suggests the possibility of multiple-vortex interaction. The tornado rapidly intensified as it crossed Schifferdecker Avenue and moved east-northeast toward St. John’s Regional Medical Center.
Based on damage observed at the St. John’s Medical Center, the MAT determined that the center of the tornado most likely passed over the northern parking lot of the hospital, producing a slightly weaker but still significant impact on the hospital. The damage in the parking lot and to buildings just west of the parking lot was extensive. Wind speeds in the parking lot and over adjacent buildings
16 NOAA NWS, Weather Forecast Office, Springfield, MO, Joplin Tornado Event Summary, May 22, 2011, http://www.crh.noaa.gov/sgf/?n=event_2011may22_summary
Figure 2‑11: Joplin, MO, base reflectivity with hook echo (white circle, left) at 5:43 p.m. and storm relative velocity at 5:38 p.m. (right)
Joplin, MOJoplin, MO

2-20 MITIGATION ASSESSMENT TEAM REPORT TORNADO OUTBREAK OF 2011
METEOROLOGICAL BACKGROUND AND TORNADO EVENTS OF SPRING 2011
to the west of the parking lot are estimated to have been higher than those that directly impacted the hospital (for additional information on the St. John’s Medical Center, refer to Section 7.1.4).
St. Mary’s Elementary School and Joplin High School were next in the path. Only the large steel cross and a portion of the façade were left of the St. Mary’s Elementary School building. Damage at Joplin High School suggested it took a direct hit as indicated by steel fence posts on the softball field facing opposite directions (refer also to Section 6.1.5). NWS rated the damage along this section of the tornado path to be EF4 mixed with some EF5.
The tornado then veered almost due east and crossed the busy commercial intersection of 20th Street and Range Line Road. The commercial buildings of Home Depot, Walmart, and Academy Sports were heavily damaged here (refer to Chapter 5 for additional information). Slightly east of this intersection, the tornado veered southeast and began to weaken rapidly before crossing I-44. The storm immediately weakened once it resumed the same east-southeast vector it displayed in Kansas.