metastable–solid phase diagrams derived from polymorphic
TRANSCRIPT

APP
LIED
PHYS
ICA
LSC
IEN
CES
Metastable–solid phase diagrams derived frompolymorphic solidification kineticsBabak Sadigha,1 , Luis Zepeda-Ruiza, and Jonathan L. Belofa,1
aLawrence Livermore National Laboratory, Physical and Life Sciences Directorate, Livermore, CA 94550
Edited by Pablo G. Debenedetti, Princeton University, Princeton, NJ, and approved January 16, 2021 (received for review August 24, 2020)
Nonequilibrium processes during solidification can lead to kineticstabilization of metastable crystal phases. A general frame-work for predicting the solidification conditions that lead tometastable-phase growth is developed and applied to a modelface-centered cubic (fcc) metal that undergoes phase transitionsto the body-centered cubic (bcc) as well as the hexagonal close-packed phases at high temperatures and pressures. Large-scalemolecular dynamics simulations of ultrarapid freezing show thatbcc nucleates and grows well outside of the region of its thermo-dynamic stability. An extensive study of crystal–liquid equilibriaconfirms that at any given pressure, there is a multitude ofmetastable solid phases that can coexist with the liquid phase.We define for every crystal phase, a solid cluster in liquid (SCL)basin, which contains all solid clusters of that phase coexist-ing with the liquid. A rigorous methodology is developed thatallows for practical calculations of nucleation rates into arbi-trary SCL basins from the undercooled melt. It is demonstratedthat at large undercoolings, phase selections made during thenucleation stage can be undone by kinetic instabilities amidthe growth stage. On these bases, a solidification–kinetic phasediagram is drawn for the model fcc system that delimits the con-ditions for macroscopic grains of metastable bcc phase to growfrom the melt. We conclude with a study of unconventionalinterfacial kinetics at special interfaces, which can bring aboutheterogeneous multiphase crystal growth. A first-order interfacialphase transformation accompanied by a growth-mode transitionis examined.
phase transitions | kinetic stabilization | metastability | solidification |phase diagram
The idea of polymorphism of solid nuclei during crystalliza-tion dates back to Ostwald (1). It results from a lack of
explicit correlation between the bulk free energies of differentcrystal phases and their respective interfacial free energies withthe liquid. It is thus expected that the early stages of nucle-ation are likely to be dominated by the crystal phase with thesmallest solid–melt interfacial free energy and the later stagesby the equilibrium bulk phase (2). It has been recognized thatclassical nucleation theory (CNT) and density-functional theory(3), as well as phase-field models (4), need to be generalizedto account for structural phase transformations of the grow-ing nuclei as the ratio of the interface to the bulk regionschanges. This so-called two-step nucleation has been observedexperimentally in rapidly quenched metals (5), as well as blockcopolymer solutions (6, 7) and charged colloidal particles (8,9), where metastable body-centered cubic (bcc) phase clustersare reported to occur before final crystallization into the face-centered cubic (fcc) phase takes place. A more dramatic outcomeat large undercooling is that of nucleation of metastable solidphases that can under suitable circumstances, grow to macro-scopic sizes. A large body of literature has grown over the pastseveral decades in which rapid solidification of mainly metalsand alloys, at cooling rates on the order of 104 to 105 K, hasbeen studied in containerless experiments through electromag-netic/electrostatic levitation techniques (10–14), where strongundercooling is achieved by avoiding heterogenous nucleation.
Through X-ray diffraction of the freely suspended droplets, thedynamics of crystal nucleation during solidification have beeninvestigated. As a result, solidification of diverse crystallinephases such as fcc, bcc, icosahedral, and quasicrystalline hasbeen observed, and emergence of metastable phases, often inthe bcc structure, in sufficiently undercooled liquids has beendemonstrated. Through application of CNT, the undercoolingnecessary for metastable-phase growth has been rationalized.It is conjectured that phase selection takes place in the nucle-ation stage; the phase emerging is one with the smallest criticalnucleation barrier. Consequently, models for solid–liquid inter-facial free energies of different crystal phases have been derivedfrom these experiments. Nevertheless, controversies remainwhen nucleation of metastable phases cannot be explainedbased on their interfacial free energies. Instead, the likely cul-prit is suspected to be preferential nucleation at the dropletsurfaces (13).
Recent powerful advances in dynamic shock/ramp compres-sion techniques (15–23) have been able to achieve melting andsolidification at rates that can exceed rapid cooling techniquesdescribed above. Hence, extreme undercoolings can be achievedin these experiments, and therefore, the limits of the currenttheories of phase transformation kinetics can be tested. Theselaboratory experiments are currently at the forefront of unrav-eling fundamental insights into the kinetics of solidification atextreme conditions. Freezing under such conditions is believed
Significance
Kinetic stabilization of metastable phases in rapidly cooledmetals and alloys has been established in experiments fordecades. However, atomistic theories that can quantitativelypredict the solidification conditions that produce nonequi-librium phases are still in their infancy. Recent advances inpulsed power/laser technologies, as well as in situ character-ization, have brought to bear unprecedented understandingof matter at extreme temperatures and pressures. However,accurate predictions of kinetic stabilization of metastablephases that are necessary for physical interpretation of theseexperiments are lacking. This work provides a blueprint fordevelopment of kinetic phase maps of materials undergo-ing rapid solidification from first principles. Through atomisticsimulations, the phases dominating nucleation are identi-fied, and their kinetic stabilities during the growth stage arecharacterized.
Author contributions: B.S., L.Z.-R., and J.L.B. designed research; B.S. and L.Z.-R. performedresearch; B.S. and L.Z.-R. analyzed data; and B.S. and J.L.B. wrote the paper.y
The authors declare no competing interest.y
This article is a PNAS Direct Submission.y
This open access article is distributed under Creative Commons Attribution-NonCommercial-NoDerivatives License 4.0 (CC BY-NC-ND).y1 To whom correspondence may be addressed. Email: [email protected] or [email protected]
This article contains supporting information online at https://www.pnas.org/lookup/suppl/doi:10.1073/pnas.2017809118/-/DCSupplemental.y
Published February 22, 2021.
PNAS 2021 Vol. 118 No. 9 e2017809118 https://doi.org/10.1073/pnas.2017809118 | 1 of 12
Dow
nloa
ded
by g
uest
on
Janu
ary
28, 2
022

to play a major role in determining the structure of the planetarycores, which in turn, is responsible for many important properties(e.g., whether a planet can support a magnetic dynamo). It is thusessential to develop capabilities for predicting metastable-phaseformation under these nonequilibrium conditions.
From a theoretical standpoint, the preference for nucleationof the bcc and the icosahedral phases from the undercooled liq-uid was first predicted decades ago through Landau expansion indensity fluctuations near the liquid phase (24). The observationof two-step nucleation in molecular dynamics (MD) simulationswas initially inconclusive (25–28). The majority of attempts failedto demonstrate any convincing signature of intermediate phasesduring nucleation. The breakthrough came through the workof ten Wolde et al. (29, 30), where they performed umbrellasampling (31) simulations using the bond-orientational orderparameter Q6 (32, 33) to induce crystallization at moderateundercoolings. They thus observed nucleation of predominantlybcc crystallites that would transform to fcc in their cores whilethe interface regions remained bcc. This finding was later repro-duced by classical density-functional theory (34). Subsequently,it was observed that when varying both pressure and undercool-ing, one could make the bcc precritical crystallites grow to largesizes (35, 36).
In the following, we derive from atomistic first principles thekinetic maps of the crystal phases that are stabilized by nonequi-librium processes during solidification. For this purpose, we gen-eralize the CNT and challenge the assumption that the precriticalnucleation stage is solely responsible for crystal phase selectionduring freezing. Hence, rather than studying the intricacies ofmultistage nucleation and its effects on the rate of solidifica-tion (37–40), we focus on the product phases that result fromliquid–solid transformation kinetics and derive kinetic phaseboundaries. The latter specifies the undercooling conditions, inthe neighborhood of which multiple crystal phases are likelyto grow from the melt. Near these boundaries, the postcriticalstage can play a big role in promoting or impeding the growthof competing crystal phases. Hence, in contrast to thermody-namic phase boundaries that are straightforward consequencesof thermodynamic rules that can never be violated given enoughtime, kinetic phase maps are mere guidelines for high-probabilityevents and depend on the particular experimental context beingconsidered. Nevertheless, metastable-phase maps are crucial forunderstanding solidification near the triple points of the thermo-dynamic phase diagram, where the liquid phase coexists with twosolid phases.
CNT describes solidification in the language of canonicaltransition-state theory. It uses as the reaction coordinate thesize of the solid cluster that nucleates inside the melt. It relieson separation of timescales involving two distinct processes:activation of critical nuclei and growth of postcritical solid clus-ters. The critical nucleus is the transition state that separatesthe liquid and the solid basins of attraction. The rate of solid-phase nucleation is dictated by the flux of trajectories throughthe critical nucleus. It is assumed that the solid-phase nucleigrow slowly enough that they can be considered near equilib-rium at all times. A consequence of this is that the sizes ofthe critical nuclei can be put in one to one correspondencewith the undercooling temperature. Furthermore, solid clusterscan be stabilized within the melt by constraining volume andenergy fluctuations through change of statistical ensemble, fromopen (e.g., isothermal–isobaric) to closed (e.g., microcanoni-cal). This has been successfully utilized in computer simulationsand has allowed the study of equilibrium shapes and sizes ofsolid clusters in liquid, as well as their coexistence tempera-tures (41). Through the Gibbs–Thomson (GT) condition, thisinformation has been used to extract solid–liquid interfacial freeenergies under the assumption of negligible anisotropy (41–43).Later in this paper, we will formulate a rigorous foundation for
this approach and as a result, present a general algorithm forconveniently calculating accurate interfacial free energies thatincorporate interfacial anisotropy as well as finite cluster-sizecurvature effects.
Let us now examine the phase space of the undercooled liq-uid by carving it into distinct subspaces, each containing allof the configurations of solid clusters of a particular phase φ,coexisting with the liquid phase. We refer to each such regionas the φ-SCL (solid cluster in liquid) basin. The relative ratesof nucleation of solids belonging to two different basins φ1
and φ2 are proportional to exp(−∆G/kBT ), where ∆G is theGibbs free energy difference between the critical nuclei of thetwo phases at the undercooling temperature T . ∆G has con-tributions from free energies of both the bulk solids as wellas the solid–liquid interfaces. Hence, it is easy to see that atlarge-enough undercooling, when the critical nuclei are rela-tively small, the interfacial free energy may favor nucleation ofthe phase that is not the thermodynamically stable bulk phase.However, during the growth stage, the thermodynamic driv-ing force for transformation to the thermodynamic equilibriumphase increases. It is thus imperative to identify under what con-ditions the thus nucleated metastable-phase clusters can grow toform micrometer-sized grains without transforming to the ther-modynamically stable phase. For this purpose, we define themetastable solid cluster in liquid (MSCL) subspace, which is thecollection of microstates that are weakly connected to other SCLbasins. More precisely, nuclei that belong to the MSCL subspacedo not undergo solid–solid transformations during their growthstage, which for a micrometer-sized grain and a typical interfacevelocity of 10 m/s, is on the submicrosecond timescale.
It is important to note that while the definition of the SCLbasin as a collection of microstates is quite straightforward, thesame is not true for the MSCL subspace. Metastability is the sta-tistical property of the dynamic trajectories associated with themicrostates. This problem can be tackled by noting that largemetastable-phase solid clusters transform to equilibrium throughactivated nucleation processes in their interiors similar to themechanism in the bulk. Hence, while the thermodynamic driv-ing force as well as the number of nucleation sites for solid–solidtransformation increases with the size of the growing clusters,the rate of nucleation of the equilibrium solid phase may in factdecrease due to rising activation barrier. The latter comes aboutbecause of increasing misfit strain energy of equilibrium-phaseinclusions inside growing metastable-phase clusters. The exis-tence and extent of the region of long-lived metastable-phasesolid clusters in liquid that constitute the core of the MSCL sub-space can be determined effectively through the closed ensembletechnique mentioned above, by which critical nuclei of differentsizes are stabilized.
With its core region identified, the boundary of an MSCLsubspace can be delineated through direct canonical MD sim-ulations of small solid–cluster seeds. This procedure relies onsubdivision of each SCL basin into a contiguous MSCL domainand a transient region that connects it to other basins. Tra-jectories that are initiated by nucleation of critical solid clus-ters inside the MSCL subspace overwhelmingly grow to largesizes without structural transformation. Those initiated in thetransient regions have a finite chance of crossing over intoother SCL basins. This is analogous to transition path sam-pling, where trajectories initiated near the saddle points ofthe potential energy landscape are equally likely to decay intoone or the other of the basins of attraction connected to it.We find that phase transformations of the critical nuclei initi-ated in the transient regions proceed through far from equi-librium processes involving cross-nucleation of the new phaseat the crystal–liquid interfaces. It is important to note thatthe identification of the transient region boundaries does notrely upon CNT (or any of its assumptions therein) and thus,
2 of 12 | PNAShttps://doi.org/10.1073/pnas.2017809118
Sadigh et al.Metastable–solid phase diagrams derived from polymorphic solidification kinetics
Dow
nloa
ded
by g
uest
on
Janu
ary
28, 2
022

APP
LIED
PHYS
ICA
LSC
IEN
CES
provides a general procedure for the construction of kineticphase maps.
As a consequence of the above topology of the phase spaceof the undercooled liquid, as well as the one to one correspon-dence between the sizes of the critical nuclei and undercoolingtemperature, we can construct solidification–kinetic phase mapsof the principal solid phases that grow out of the melt underdifferent temperature and pressure conditions. In what follows,we outline a practical framework based on a combination ofnonequilibrium MD simulations (44), free energy integrations,and multiphase equilibrium simulations, through which thermo-dynamic as well as kinetic phase diagrams can be constructed.This methodology is applied to a model Cu system describedby a short-range semiempirical interatomic potential (45). Itexhibits a rather complex phase diagram, shown in Fig. 1, withseveral solid phases present along the melt line. In the follow-ing, we develop the methodology to construct the kinetic phasemap shown in Fig. 5, where the conditions under which freez-ing is dominated by the metastable–bcc phase are delineated.It is quite noteworthy how large the region of metastable-phasegrowth can be. We conclude this paper with an in-depth studyof hexagonal close-packed (hcp) clusters in coexistence with themelt, demonstrating their unusual interface structures and phasetransformations accompanied by growth-mode transitions. Onthis basis, a mechanism for interface-driven metastable-phasegrowth is presented.
Thermodynamic Phase DiagramFig. 1 shows the temperature–pressure phase diagram of theembedded atom method (EAM) model–Cu system. The meltline Tm(P) has been obtained from two-phase (solid–liquid)coexistence simulations in the isobaric–isoenthalpic (NPH)ensemble (46–49). Details are described in SI Appendix. It isfound that the equilibrium solid phase at Tm is fcc for pressuresP < 71.6 GPa, hcp in the interval 71.6<P < 85 GPa, and bccfor P > 85 GPa. The phase diagram contains two triple points:one at 71.6 GPa and 3,320 K, where fcc, hcp, and liquid coex-ist, and one at 85 GPa and 3,598 K, where hcp, bcc, and liquidcoexist. A third three-phase coexistence point exists at 79.5 GPaand 3,478 K, but it does not appear in the phase diagram shown
Fig. 1. Thermodynamic and ultrafast kinetic phase diagram. The black linesdelineate the solid–liquid and solid–solid (bcc–hcp and fcc–hcp, respectively)coexistence curves. The colored filled circles show the temperature at whichnucleation of solid from the melt was observed in direct MD simulations.The color indicates the dominant solid phase, with blue equal to bcc andgreen equal to close packed (fcc and/or hcp). In the pressure range 40 to 70GPa, both phases are observed. The relative green to blue content of eachsymbol qualitatively depicts the prevalence of the bcc to the close-packedphases.
in Fig. 1 because it falls inside the stability range of the hcpphase. At this pressure, the hcp phase melts at the slightly highertemperature of 3,487 K.
The solid–solid coexistence lines shown in Fig. 1 are drawnvia integration of their slopes, given by the Clausius–Clapeyronrelation, starting from the respective triple points. A detaileddiscussion of these calculations, as well as the latent heats andvolumes of melting, is in SI Appendix.
Phase Map of Ultrarapid SolidificationIn contrast to the thermodynamic melt line, which delineatesthe boundary between the liquid and solid phases in the limit ofinfinitely slow change of thermodynamic variables, we explore inthis section the maximal effect of kinetics, by determining the starttemperature THS for freezing with vanishing nucleation barrier.We have measured THS(P) through nonequilibrium molecular-dynamics (NEMD) simulations of ultrarapid cooling at a rateof 100 K/ns (Fig. 1). We have tracked the solid-phase evolutionduring these NEMD simulations using the adaptive cutoff com-mon neighbor analysis (a-CNA) (50–52) method, which allows foridentification of the hcp, as well as the fcc and the bcc phases.Fig. 1 depicts by color the solid phases observed at each pressure,with blue depicting the bcc phase and green depicting the close-packed fcc/hcp phases. At 80 GPa and above, pure bcc nucleationis observed, and the bcc nuclei grow and dominate the simula-tion box. Similarly, at pressures below 40 GPa, pure fcc nucleationis observed, and the close-packed nuclei grow and dominate thesimulation box. In the pressure region between 40 and 70 GPa,polymorphic solidification takes place in the simulations. Thedifference in the observed polymorphic evolution kinetics as pres-sure is increased from 40 to 70 GPa is quite noteworthy. At 40GPa, small bcc as well as close-packed (fcc/hcp) nuclei are formed,but the bcc nuclei quickly transform to close-packed phases andvanish. At 60 GPa, pure bcc nuclei do form and grow. How-ever, transformation to close-packed phases during growth is alsoobserved (Fig. 2). In this scenario, at first, small bcc nuclei form.During their growth stage, at or near the bcc solid–liquid inter-face, transformation to close-packed phases occurs, which startscompeting with the original bcc phase as the nucleus grows.
It should be noted that THS at all pressures is clearly outsidethe region of thermodynamic stability of the bcc phase. Nev-ertheless, at pressures 80 GPa and above, not only nucleationoccurs in the bcc phase, but the bcc nuclei grow to fill the simula-tion box. Hence, the solidification process kinetically stabilizesthe metastable bcc phase. At pressures below 80 GPa, mixedclose-packed and bcc nucleation as well as bcc to close-packedtransformation of the growing nuclei can be observed. Hence, theNEMD simulations provide proof for polymorphic solidificationkinetics near the triple point of the phase diagram. In the follow-ing, we analyze the physical origin of this phenomenon and dis-cuss the conditions for growth of macroscopic-sized metastablebcc crystals, observable in laboratory experiments.
SCL Basins and Thermodynamics of Multiphase MetastableEquilibriaIn this section, we discuss the prevalence of solid–liquidmetastable equilibria. Multiphase simulations in the NPHensemble constitute an effective tool for exploring the cores ofthe MSCL subspaces. Fig. 3 show examples of compact solid-phase nuclei that coexist with the liquid in the pressure range 20to 100 GPa. They range from single-phase bcc, fcc, or hcp clus-ters to multiphase mixed fcc/hcp nuclei. These basins are distinctand weakly coupled to each other. It should be noted that thebulk bcc phase becomes thermodynamically stable above 85 GPa.Nevertheless, bcc clusters containing at least several thousandparticles can be found stable in MD simulations with durationsin the range of 5 to 10 ns, down to 20 GPa. This indicates thatphase transformation of these clusters is clearly an activated
Sadigh et al.Metastable–solid phase diagrams derived from polymorphic solidification kinetics
PNAS | 3 of 12https://doi.org/10.1073/pnas.2017809118
Dow
nloa
ded
by g
uest
on
Janu
ary
28, 2
022
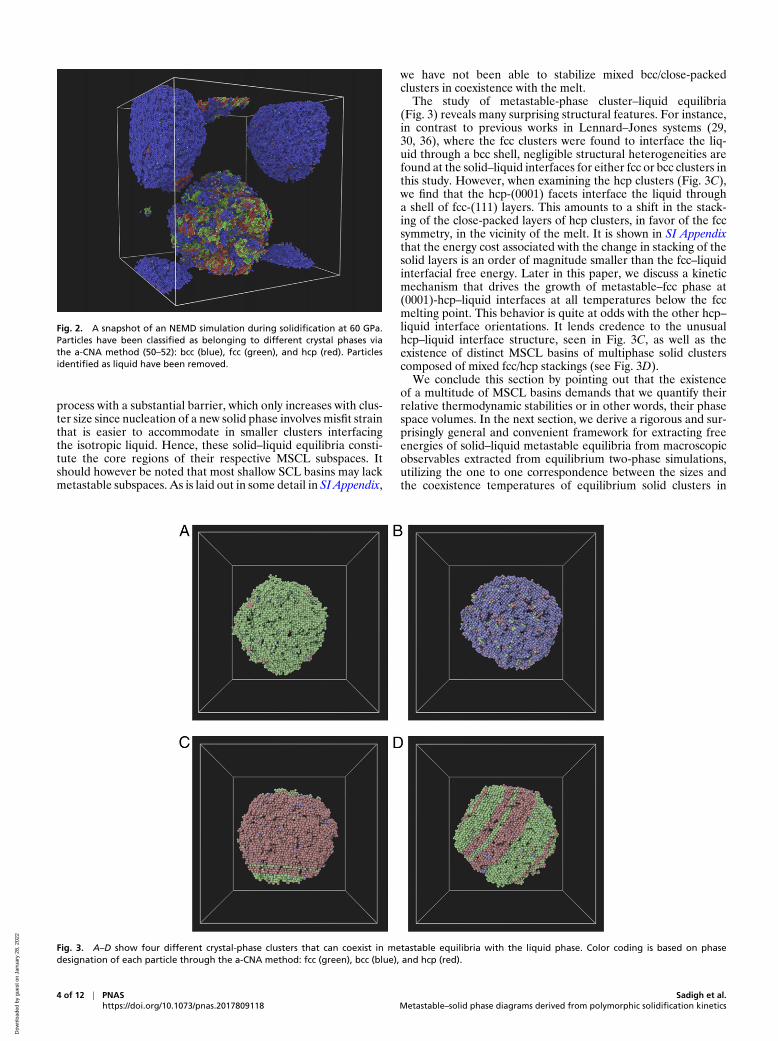
Fig. 2. A snapshot of an NEMD simulation during solidification at 60 GPa.Particles have been classified as belonging to different crystal phases viathe a-CNA method (50–52): bcc (blue), fcc (green), and hcp (red). Particlesidentified as liquid have been removed.
process with a substantial barrier, which only increases with clus-ter size since nucleation of a new solid phase involves misfit strainthat is easier to accommodate in smaller clusters interfacingthe isotropic liquid. Hence, these solid–liquid equilibria consti-tute the core regions of their respective MSCL subspaces. Itshould however be noted that most shallow SCL basins may lackmetastable subspaces. As is laid out in some detail in SI Appendix,
we have not been able to stabilize mixed bcc/close-packedclusters in coexistence with the melt.
The study of metastable-phase cluster–liquid equilibria(Fig. 3) reveals many surprising structural features. For instance,in contrast to previous works in Lennard–Jones systems (29,30, 36), where the fcc clusters were found to interface the liq-uid through a bcc shell, negligible structural heterogeneities arefound at the solid–liquid interfaces for either fcc or bcc clusters inthis study. However, when examining the hcp clusters (Fig. 3C),we find that the hcp-(0001) facets interface the liquid througha shell of fcc-(111) layers. This amounts to a shift in the stack-ing of the close-packed layers of hcp clusters, in favor of the fccsymmetry, in the vicinity of the melt. It is shown in SI Appendixthat the energy cost associated with the change in stacking of thesolid layers is an order of magnitude smaller than the fcc–liquidinterfacial free energy. Later in this paper, we discuss a kineticmechanism that drives the growth of metastable–fcc phase at(0001)-hcp–liquid interfaces at all temperatures below the fccmelting point. This behavior is quite at odds with the other hcp–liquid interface orientations. It lends credence to the unusualhcp–liquid interface structure, seen in Fig. 3C, as well as theexistence of distinct MSCL basins of multiphase solid clusterscomposed of mixed fcc/hcp stackings (see Fig. 3D).
We conclude this section by pointing out that the existenceof a multitude of MSCL basins demands that we quantify theirrelative thermodynamic stabilities or in other words, their phasespace volumes. In the next section, we derive a rigorous and sur-prisingly general and convenient framework for extracting freeenergies of solid–liquid metastable equilibria from macroscopicobservables extracted from equilibrium two-phase simulations,utilizing the one to one correspondence between the sizes andthe coexistence temperatures of equilibrium solid clusters in
Fig. 3. A–D show four different crystal-phase clusters that can coexist in metastable equilibria with the liquid phase. Color coding is based on phasedesignation of each particle through the a-CNA method: fcc (green), bcc (blue), and hcp (red).
4 of 12 | PNAShttps://doi.org/10.1073/pnas.2017809118
Sadigh et al.Metastable–solid phase diagrams derived from polymorphic solidification kinetics
Dow
nloa
ded
by g
uest
on
Janu
ary
28, 2
022

APP
LIED
PHYS
ICA
LSC
IEN
CES
the melt. It makes no assumption regarding the equilibriumshapes of the crystalline nuclei or the complexity of their crys-tal structures. Later in this paper, the power of this methodologyis demonstrated by applying it to computer simulations of thefcc and the bcc-phase MSCLs of the EAM–Cu model. Con-sequently, the relative prevalence of these phases during thedifferent stages of the nucleation and the growth processes isquantified. Furthermore, the validity of several standard phe-nomenological rules that are commonly used to analyze kineticsof solidification in experiments is discussed.
Solid–Liquid Systems Thermodynamics. In the following, wedescribe a general and convenient methodology for directlyextracting interfacial thermodynamic parameters from expecta-tion values of macroscopic observables in computer or real-worldexperiments. We start by constructing the thermodynamic poten-tial of a two-phase solid–liquid system at equilibrium in a closedensemble (e.g., NPH) containing Nsys particles at overall pres-sure P and enthalpy Hsys. We propose a subdivision of this systeminto a region of bulk solid surrounded by bulk liquid and sep-arated by an interfacial region. This system is equilibrated ata uniform temperature T , which is controlled by the ensem-ble enthalpy Hsys. The thermodynamic potential can thus bewritten as
GSL(T ,P) = minNS
[NSG
bS (T ,P) +NLG
bL(T ,P) + γI (NS,T ,P)
],
[1]
where NS and NL are the numbers of the solid and the liquidparticles, respectively; Gb
S and GbL are the bulk single-phase solid
and liquid free energies, respectively; and γI is the interfacialfree energy integrated over the interface area. While GSL(T ,P)is the property of a real physical system, its subdivision into partsis not unique. It is convenient to choose the interface to be aninfinitely thin boundary with no associated volume and contain-ing no particles. In this way, NS and NL can be determined fromthe conditions
NS +NL =Nsys, [2]NSvS(T ,P) +NLvL(T ,P) =Vsys, [3]
where vS and vL are the bulk liquid- and solid-specific volumes,respectively, and Vsys is the system’s volume. The above equa-tions are particularly useful for extracting the average cluster sizein MD simulations of solid–liquid equilibria, as will be describedlater in this paper.
It is profitable to express the interfacial free energy γI as
γI (NS,P ,T ) = (NS)23 γGT(T ,P)κ(NS,T ,P), [4]
where γGT is the interfacial free energy of a fictitious unit cluster(i.e., one containing only one solid particle) in the so-called GTlimit and κ(NS,T ,P) is introduced to incorporate finite cluster-size curvature effects beyond the GT approximation. In this limit,the interfacial free energy integrated over the cluster surfacearea can be expressed in spherical coordinates as
γGT(T ,P) =
∫γ∞ (n(Ω);T ,P)R2(Ω;T ,P)dΩ. [5]
Above, n(Ω) is the crystal surface normal of the interface ele-ment at Ω, and γ∞(n;T ,P) is its interfacial free energy densityif it were extended in all directions. The equilibrium shape of thiscluster Req(Ω) is obtained by minimization of Eq. 5 with respectto R(Ω) under the constraint that the cluster volume is vS. Thisis an accurate physical description of large clusters. The equilib-rium shape in the GT limit can be solved for analytically (53),with the Wulff construction as solution. For our purposes, the
most important feature of Eq. 5 is that its equilibrium shape isindependent of cluster size, and hence, γGT has the desirableproperty that it does not explicitly depend on NS. It is importantto note that this does not require Req(Ω) to be conserved whensystem is undercooled. The GT equilibrium shape can changewhen γ∞ changes with temperature. Nevertheless, from varia-tional point of view, γGT is only a function of temperature andpressure.
In contrast, for smaller clusters, the interfacial free energydensity becomes a nonlocal functional of the crystal plane ori-entations n in the neighborhood of each surface element. Inthe simplest cases, there will be functional dependence on∇n to account for cluster surface curvature. This is the ori-gin of the curvature coefficient κ, introduced in Eq. 4, andits explicit dependence on cluster size NS. For large clusters,κ(NS→∞,T ,P) = 1.
The equilibrium/critical cluster size N cS can now be obtained
by minimizing the thermodynamic potential G with respectto NS:
N cS (T ,P) =−2
3
Tm
∆Hm
γI∆T
(1 +
3
2N c
S∂ log κ
∂NS
), [6]
where ∆Hm is the latent heat and ∆T =T −Tm is the degreeof undercooling from the melting temperature Tm , and we haveused the relation
GbS (T ,P)−Gb
L(T ,P) =∆Hm
Tm∆T , [7]
which is correct to first order in expansion about Tm . Note thatEq. 6 establishes a direct relationship between the observablesNS and ∆T through the total interfacial free energy γI and thecurvature coefficient κ. The latter can be neglected for largeclusters, as the following Taylor expansion can be made:
κ(NS 1) = 1 +κ(1)
(NS)13
+ . . . . [8]
The above implies that ∂ log κ∂NS
in Eq. 6 can be neglected for largeclusters. Furthermore, the combination of Eqs. 6 and 8 consti-tutes a rigorous formalism for determination of the interfacialfree energy beyond the GT limit, incorporating the effect oftemperature and pressure as well as finite cluster sizes.
In this section, we have thus devised a general framework fordirect extraction of interfacial free energy per atom from exper-imental measurements of a system’s volume, temperature, andpressure by using Eqs. 2, 3, and 6. No severe assumptions oruncontrolled approximations are made, and the framework canbe generalized to multicomponent as well as multiphase solidnuclei. Furthermore, finite-sized curvature effects beyond theGT limit can also be accounted for. Finally, it is worth notingthat for systems where the specific volumes of solid and liq-uid phases are nearly indistinguishable, the condition of zerointerface volume (Eq. 3) can be replaced by a more appropri-ate order parameter, such as energy or bond-orientational order.Nonetheless, for most systems, the simplest order parameters fordistinguishing the solid from the liquid phase will be adequate.
Phenomenological Models. When studying rapid solidificationexperiments for the purpose of identifying the conditions thatlead to kinetics-driven phase selections, in contrast to predictionsbased on equilibrium thermodynamics, it is essential to haveaccurate models of multiphase thermodynamics. One of the mostimportant developments in this regard is Turnbull’s phenomeno-logical rule (54) for solid–liquid interfacial free energies, whichhe showed to hold for a diverse collection of materials (mainly
Sadigh et al.Metastable–solid phase diagrams derived from polymorphic solidification kinetics
PNAS | 5 of 12https://doi.org/10.1073/pnas.2017809118
Dow
nloa
ded
by g
uest
on
Janu
ary
28, 2
022

metals). This rule can be generalized to an exact ansatz, at leastin the GT limit, as follows:
γI = (αε−Tασ)∆Hm
v2/3S
AsphereI . [9]
Above, AsphereI denotes the interfacial area of an equisized spher-
ical cluster, ∆Hm is the latent heat of solidification, vS is thespecific volume of the solid at temperature T , and αε and ασare dimensionless quantities that incorporate all temperaturedependence as well as shape effects beyond that of a sphere. Theconventional Turnbull coefficient is α(Tm) =αε−Tmασ .
Turnbull’s remarkable rule conjectures that the solid–liquidinterfacial tension scales as the difference in heat content of thesolid and the liquid phases at the melting point. As a result,the dimensionless Turnbull coefficient α(Tm) is expected to benearly independent of material chemistry. However, Turnbullfound from experimentally inferred nucleation rates that for mostmetals, α(Tm)≈ 0.45, while for nonmetals, α(Tm)≈ 0.32 (54).Furthermore, variation of about 20% was predicted theoreticallybetween the Turnbull coefficients of the fcc and the bcc crystalphases based on a polytetrahedral structural model of a liquid incontact with a rigid solid (55–57). It should be noted that extract-ing homogeneous nucleation rates from experiments is a dauntingtask, as solidification in most cases is driven by heterogeneous pro-cesses, and error bars are usually very large. It is thus desirable touse computer experiments to quantitatively study this conjecture.
The temperature dependence of the Turnbull coefficient, tofirst order in deviation from the melting point, is determinedby the entropic contribution ασ . Nelson and Spaepen (58) haveargued that the origin of the solid–liquid interfacial tension ismainly entropic, whereupon they proposed the so-called negen-tropic model according to which the interfacial tension is allentropic (i.e., αε = 0). Since γI must necessarily be positive,this entails a negative interfacial entropy, thereof the namenegentropic. The negentropic model in combination with Turn-bull’s rule has been widely used to analyze rapid solidificationexperiments (10).
Validation by Computer Experiments. We now show that whileTurnbull coefficients α(Tm ,P) have distinct values for different
phases, such as bcc and fcc, they are nearly constant over a widerange of pressures in a typical metal. Furthermore, by explicit cal-culations of the interfacial energy αε, we calculate the entropiccontribution to the interfacial free energy and demonstrate theaccuracy of the negentropic model.
In order to calculate the Turnbull coefficients of the fcc andthe bcc phases, we have conducted careful calculations of fcc–liquid and bcc–liquid equilibria in the pressure range from 60 to100 GPa. For these studies, cubic simulation boxes, containing inexcess of 13 million atoms, have been utilized. At each pressure,three two-phase systems at different Hsys are equilibrated for 8 nseach using NPH MD simulations with a time step of 2 fs, andthe coexistence temperatures Tc and the systems’ volumes Vsysare recorded. The coexistence temperatures Tc range from 30 to60 K undercooling below Tm . The measured values of Tc andVsys are inserted into Eqs. 2 and 3 to obtain NS, which in turn,is used in Eq. 6 to obtain the interfacial free energy γI (Tc ,P).The latter is further used in Eq. 9 for evaluation of α(Tc ,P),with A
sphereI = (36π)1/3 (NSvS)2/3. At each pressure, the calcu-
lated α(Tc ,P) are fitted to a linear temperature dependence,which is used to estimate α(Tm ,P).
Fig. 4A shows α(Tm) in the pressure range from 60 to 100GPa for both the bcc and the fcc phases. To within the statisti-cal accuracy of our calculations, α(Tm ,P) for both phases canbe considered nearly pressure independent, with αfcc(Tm ,P)≈0.54 and αfcc(Tm ,P)≈ 0.465. While this result confirms that theTurnbull coefficient of the fcc phase exceeds that of the bccphase, their ratio of about 1.16 is significantly smaller than wasfound in ref. 59; Sun et al. (59) calculated the Turnbull coef-ficients of fcc and bcc iron using different empirical potentialmodels and found αfcc to be in the range from 0.5 to 0.55 inagreement with this work, but they found αbcc to be in the rangefrom 0.29 to 0.36, which is significantly smaller, leading to aratio in excess of 1.5. Our result, however, is in closer agree-ment with the calculated relative Turnbull coefficients of the fccand the bcc phases according to the polytetrahedral structuralmodel of the liquid (55–57), as well as particle systems interact-ing via inverse power law potentials (60, 61). We thus concludethat the value of the Turnbull coefficient for a crystal phasecan be quite sensitive to particle interactions. Nevertheless,
60 70 80 90 100Pressure (GPa)
0.4
0.5
Turn
bull
coef
ficie
nts
bccfcc
60 70 80 90 100Pressure (GPa)
-0.04
-0.03
-0.02
-0.01
0
ratio
of i
nter
faci
al e
nerg
y to
free
ene
rgy
bccfcc
20 40 60 80 100Pressure (GPa)
1.1
1.15
1.2
1.25
1.3
1.35
Rat
io o
f the
late
nt h
eats
of f
cc a
nd b
cc
A B
DCFig. 4. (A) Calculated Turnbull coefficients for thefcc and the bcc phases as a function of pressure.(B) Ratio of the interfacial energy αε to the inter-facial free energy α(Tm) of the fcc and the bccphases as a function of pressure. (C) Ratio of thelatent heats of the fcc and the bcc phases as afunction of pressure. (D) Comparison of two differ-ent algorithms (gauges) for extracting cluster radiifrom MD simulations. The filled circles are bcc-clusterradii extracted from two-phase simulations at dif-ferent temperatures and pressures ranging from60 to 100 GPa. The open squares are fcc-clusterradii extracted from two-phase simulations at dif-ferent temperatures and pressures ranging from 60to 100 GPa.
6 of 12 | PNAShttps://doi.org/10.1073/pnas.2017809118
Sadigh et al.Metastable–solid phase diagrams derived from polymorphic solidification kinetics
Dow
nloa
ded
by g
uest
on
Janu
ary
28, 2
022

APP
LIED
PHYS
ICA
LSC
IEN
CES
we find the pressure dependence of the Turnbull coefficient tobe weak, in agreement with a recent study of flat fcc–liquidinterfaces (62).
It should be noted that the preferential nucleation of the bccphase at large undercoolings is driven by the interfacial freeenergy, which depends both on the relative Turnbull coeffi-cients as well as the relative latent heats of the bcc and the fccphases. The latter are shown in Fig. 4C, where it is observedthat ∆H fcc
m >∆H bccm . Their ratio is, however, strongly pressure
dependent. It is reduced from 1.37 at ambient pressure to 1.12at 100 GPa. Nevertheless, at all pressures the larger latent heatand the larger Turnbull coefficient of the fcc phase contribute toγfcc >γbcc.
In order to discuss the temperature dependence of the Turn-bull coefficient, we calculate the energetic contribution αε asfollows:
αε∆Hm
v2/3S
AsphereI =Hsys−N c
S HbS − (N −N c
S )H bL , [10]
where H bS and H b
L are the bulk enthalpies of the solid and the liq-uid phases. Fig. 4B shows the ratio αε
α(Tm )for both the fcc and the
bcc phases in the pressure range from 60 to 100 GPa. Clearly, theenergetic part of α is very small, which validates the negentropicmodel for a typical metal. Also note that the bcc–liquid inter-facial energy is negative and smaller than the fcc–liquid energy.The negative interfacial energy poses no conceptual problems, asit is much smaller in magnitude than the interfacial entropy. Asa result, the interfacial free energy stays positive. It should fur-ther be noted that a prior study of flat solid–liquid interfaces ofthe Lennard–Jones system found that the entropic content of theinterfacial free energy can vary significantly between interfaceorientations as well as densities (63). Hence, the validity of thenegentropic model may be system dependent and hence, shouldbe considered on a case by case basis.
We conclude this section by exploring different gauges fordetermining the cluster size NS. We have until now only usedthe zero-volume gauge, which assumes the interface is infinitelythin. This gauge is convenient to use and applicable to any mul-tiphase system with the coexisting phases having distinct specificvolumes. In order to reduce the statistical error, elaborate orderparameters have been devised in the literature that allow foraccurate characterization the solid region within the liquid intwo-phase systems. We have used one such method, describedpreviously in ref. 41, as an alternative to the zero-volume gaugefor determining NS. In this method, the phase character of eachparticle is first determined by the a-CNA (50–52). Next, a coor-dination filter based on a radial distribution function is appliedto remove atoms not belonging to the solid cluster. Finally, aneffective radius for the cluster is determined by identifying itssurface through Voronoi analysis. Fig. 4D shows the comparisonbetween the radii RS calculated in this way and those calculatedusing the zero-volume gauge and the relation RS =
(34π
NSvS)1/3.
The figure shows effective cluster radii extracted from a numberof two-phase simulations of bcc- and fcc-phase clusters coexist-ing with liquid at different pressures and temperatures. Overallagreement is quite impressive. It is, however, interesting to notethat the agreement between the two methods for the bcc clus-ter radii is clearly better than for the fcc ones. Furthermore,the common neighbor analysis seems to slightly underestimatethe effective radii of the fcc-phase clusters compared with thezero-volume gauge. It is important to reiterate that the abso-lute value of the interfacial free energy is subject to the chosengauge. The only gauge-invariant physical observables are thetotal system’s free energy, enthalpy, temperature, pressure, andvolume. Therefore, it is important to use a consistent gaugewhen, for example, comparing the free energies of fcc- and bcc-
phase nuclei coexisting with the liquid phase at a particulartemperature and pressure.
Metastable–Solid Phase DiagramsWe are now ready to develop a general strategy for predictingkinetic stabilization of metastable crystal phases during solidi-fication. For this purpose, we need to 1) quantify the relativephase stabilities of critical nuclei as a function of undercoolingand 2) determine for each phase the extent of the MSCL basinor in other words, the range of solid-phase cluster sizes that canbe considered metastable. In this way, we can predict the rate oftransition from homogeneous undercooled liquid into any partic-ular MSCL basin as a function of undercooling. As a result, wecan identify the conditions that lead to metastable-phase growthby recognizing that whenever solidification occurs on a timescaleshorter than the rate of transition out of an MSCL basin, thecritical nuclei that belong to this basin are likely to grow to largesizes. To demonstrate the efficacy of this procedure, we apply itin the following two sections to the problem of metastable bcc-phase growth from the melt at pressures below 85 GPa, whereone of the close-packed phases (fcc or hcp) is thermodynamicallystable below the melting temperature (Fig. 1). It should be notedthat in the vicinity of the hcp–fcc thermodynamic phase bound-ary (Fig. 1), stacking-fault free energies become so small thatsolidification into pure fcc or hcp phase becomes improbable. Weconclude this paper with a discussion of intricacies arising fromunusual structural features of hcp–liquid interfaces that promotemixed hcp/fcc-phase growth.
Solid–Nucleation-Phase Boundaries. In this section, we describethe procedure for determining the undercooling temperatureT ∗(P), below which the nucleation rate of the metastable bccphase exceeds those of the fcc and the hcp phases of EAM–Cu.Above this temperature, nucleation is dominated by the close-packed phases (fcc, hcp, or a combination thereof) and belowit, by the bcc phase. Within the CNT, the rate of nucleation ofcritical solid clusters at temperature Tc is
JS(Tc) =
√∆G
′′S (Tc)
2πkBTc(N c
S (Tc))2/3τ
vLexp
(−∆GS(Tc)
kBTc
).
[11]
Above, ∆GS is the excess free energy of a critical solid nucleuscoexisting with the melt at temperature Tc , and ∆G
′′S is its curva-
ture with respect to cluster size fluctuations. ∆GS can be definedin terms of the quantities in Eq. 1: ∆GS =GSL−NsysG
bL, which
were numerically determined in previous sections. τ denotes therate of attachment from the liquid to a unit area of the solidcluster, and vL is the specific volume of the liquid.
Eq. 11 allows the nucleation-phase boundary T ∗(P) to bedetermined by solving two equations: J bcc
S (T ∗fcc) = J fccS (T ∗fcc) and
J bccS (T ∗hcp) = J
hcpS (T ∗hcp). Hence, the phase boundary T ∗(P) at
any given pressure is the smaller of the two solutions T ∗fcc andT ∗hcp of the equations
GcpSL(T ∗cp)−Gbcc
SL (T ∗cp) =kBT
∗cp
2log
[∆H
cpm α
cp
∆H bccm αbcc
(τ cp
τ bcc
)2],
[12]
where T ∗cp represents either of the two temperatures T ∗fcc or T ∗hcp.We have solved the above equations by making two assump-tions: 1) τ cp≈ τ bcc and 2) αhcp≈αfcc. These are both reasonableassumptions. Assumption 1 is good since the rate of attachmentis mainly a property of the liquid. If desired, it can be calcu-lated from size fluctuations of the critical clusters as described inrefs. 64 and 65. We have found this unnecessary in the present
Sadigh et al.Metastable–solid phase diagrams derived from polymorphic solidification kinetics
PNAS | 7 of 12https://doi.org/10.1073/pnas.2017809118
Dow
nloa
ded
by g
uest
on
Janu
ary
28, 2
022

context because we have found that neglecting the right-handside of Eq. 12 altogether only leads to a slight rise in T ∗(P).This increase is largest at low pressures. At 20 GPa, it amountsto 0.7 K, while at 40 GPa, it is reduced to only 0.25 K. Assump-tion 2 is reasonable due to the similarity of the two close-packedphases both structurally and energetically. In the pressure rangeof interest (around 70 GPa), we find that the latent heats of melt-ing of the hcp and the fcc phases differ by only 2%, while that ofthe bcc phase is 20% smaller. Furthermore, their respective equi-librium shapes shown in Fig. 3 A and C suggest that αhcp >αfcc.This assertion is based on two observations: 1) the equilibriumshapes of fcc clusters in the melt are nearly spherical, from whichit can be concluded that the fcc–liquid interfacial free energyonly depends weakly on fcc crystal plane orientations, and 2) theequilibrium shapes of hcp clusters in the melt exhibit hcp-(0001)facets that interface the liquid through a shell of fcc-(111) layers.This implies that the liquid–fcc interfaces are favored relative toliquid–hcp ones and thus, have lower free energies.
Eq. 12 and its solutions are discussed in detail in SIAppendix. The resulting phase boundary T ∗(P), separating thetemperature–pressure regions where bcc nucleation dominates[T <T ∗(P)] from those where fcc or hcp nucleation prevails[T >T ∗(P)], is shown in Fig. 5. At pressures P < 71.9 GPa,T ∗(P) (green line) is the nucleation phase boundary betweenthe bcc and the fcc phases, and at P > 71.9 GPa (red line), it con-stitutes the boundary between the bcc- and the hcp-phase criticalnuclei. Whenever a critical nucleus belongs to an MSCL basin, itis expected to be long lived. It can thus grow to large sizes andbe observed during solidification and likely even after the phasetransformation has completed. In the next section, we determinethe extent of the bcc–MSCL basin upon very strong undercoolingby studying the kinetic stability of postcritical bcc nuclei.
Before ending this section, we remark on the fcc–hcp–bcc crit-ical nucleation triple point at P = 71.9 GPa and T ∗= 3,263 K.
Fig. 5. A solidification–kinetic phase map. The top and bottom solid linesbound the region where solidification can take place. The four lines in orderfrom top to bottom are 1) the thermodynamic melt line Tm, with the greenpart depicting liquid/fcc-phase boundary and the red part depicting liq-uid/hcp; 2) the boundary T∗, where the CNT rate of bcc nucleation equalsthe fcc rate (green part) or the hcp rate (red part) with a critical nucleationbcc–hcp–fcc triple point at P = 71.9 GPa and T = 3,263 K; 3) the boundaryTu, below which the postcritical bcc nuclei become unstable and transformto fcc (green part) and mixed fcc/hcp (brown part); and 4) the boundary THS,below which the liquid phase becomes unstable and crystallization occurswith vanishing nucleation barrier and thus, can be observed in MD sim-ulations. The colors depict the observed crystal phase in the simulations:fcc: green; mixed fcc/hcp: brown; and bcc: blue. The solid parts of the T∗
and Tu lines bound the region, where the bcc phase is nucleated inside thebcc–MSCL subspace.
The line connecting this point in Fig. 5 to the bulk thermody-namic fcc–hcp–liquid triple point at P = 71.6 GPa and Tm =3,320 K is the boundary that separates the temperature–pressureregions where nucleation (according to the CNT) is dominatedby the fcc phase from those where the hcp phase is most favored.However, we expect kinetic factors beyond those consideredin this section to promote mixed fcc/hcp solidification at T >T ∗(P) within at least a 10-GPa-wide pressure window about thethermodynamic triple point at P = 71.6 GPa, due to diminish-ing energy cost of stacking faults. At first sight, this may seemonly marginally relevant to solidification kinetics and have lit-tle effect on the liquid–solid interfacial kinetics. However, wewill show in a later section that in regions where the CNT pre-dicts hcp-dominated nucleation and growth, the liquid interfacewith special hcp plane orientations can in fact promote fcc-phasegrowth by a kinetic mechanism.
Kinetic Phase Stabilities of Postcritical Nuclei. In the previous sec-tion, we computed the phase line T ∗(P), below which criticalnucleation is dominated by the bcc phase. In this section, wedetermine the conditions for the bcc postcritical nuclei to grow tolarge sizes without transforming to other solid phases. Hence, wequantify the temperature–pressure region within which criticalnucleation occurs inside the bcc–MSCL subspace. The weak cou-pling of the MSCL subspace to other basins guarantees growthof postcritical nuclei without solid–solid transformation. In con-trast, the transient regions of the SCL basins contain postcriticalclusters that may undergo structural instabilities. The extentof the transient subspace can be studied straightforwardly viaNEMD simulations in the isobaric–isothermal (NPT) ensembleby 1) preparing atomistic configurations of critical solid-phaseclusters embedded in the melt at different undercooling tem-peratures, 2) initiating dynamic trajectories from these config-urations, and 3) characterizing the evolution of their solid-phasecontent as the solid clusters grow. The approach we have cho-sen to pursue for accomplishing the above tasks is detailed in SIAppendix. We have carefully applied this procedure to examiningthe kinetic stability of postcritical bcc nuclei at pressures 20, 30,40, and 60 GPa. Our aim has been to identify the undercoolingtemperatures Tu(P), below which the growing bcc nuclei trans-form to fcc/hcp phases. In other words, the critical nuclei smallerthan Nu do not belong to the bcc–MSCL basin, as they readilytransform to fcc/hcp when growing. The result is shown in Fig. 5,where the Tu(P) line is green below 40 GPa and brown below80 GPa. This coloring is intended to convey the fact that at tem-peratures below Tu , in the green pressure region the unstable bccnuclei are observed to transform to close-packed structures dom-inated by the fcc phase (SI Appendix, Fig. S9), while in the brownregion, multiphase fcc/hcp clusters are observed (SI Appendix,Fig. S7). Of course, there is no sharp boundary between the tworegions, and the hcp content of the multiphase region rises withincreasing pressure. At 80 GPa, Tu and THS coincide, and solid-ification at all undercoolings is found to be dominated by the bccphase. This has been proven by direct NEMD simulations, whichconsistently show bcc nucleation and stable growth at P ≥ 80GPa under ultrarapid cooling conditions.
It is beneficial here to discuss in some detail the physicalmeaning of the temperatures Tu(P). They designate the low-est undercooling at which all of the computationally preparedbcc nuclei that could grow under this condition grow withouttransforming to other solid phases. This does not exclude thatat lower temperatures, there may exist bcc clusters that can growwithout transformation to close-packed phases. This rather con-servative measure of metastability is justified if we seek to predictthe conditions for experimental observations of macroscopic-sized solid phases. For this purpose, it should be recognizedthat our computer experiments are quite limited in theirrepresentation of the perturbations that can occur in realistic
8 of 12 | PNAShttps://doi.org/10.1073/pnas.2017809118
Sadigh et al.Metastable–solid phase diagrams derived from polymorphic solidification kinetics
Dow
nloa
ded
by g
uest
on
Janu
ary
28, 2
022
APP
LIED
PHYS
ICA
LSC
IEN
CES
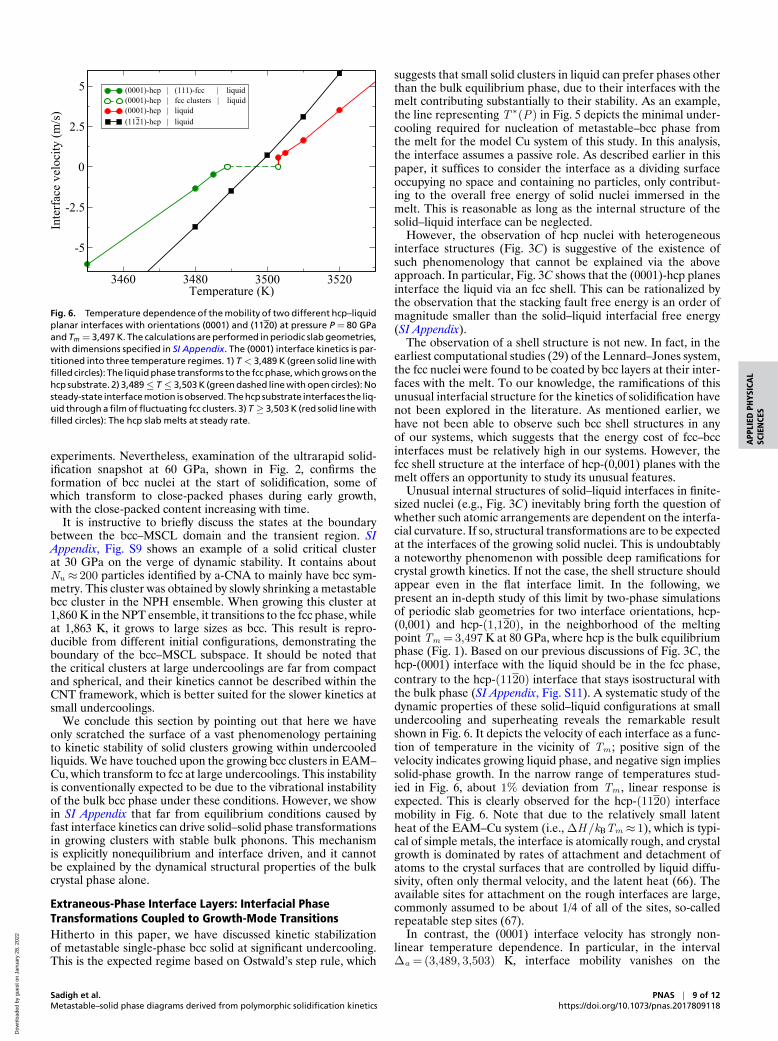
Fig. 6. Temperature dependence of the mobility of two different hcp–liquidplanar interfaces with orientations (0001) and (1120) at pressure P = 80 GPaand Tm = 3,497 K. The calculations are performed in periodic slab geometries,with dimensions specified in SI Appendix. The (0001) interface kinetics is par-titioned into three temperature regimes. 1) T < 3,489 K (green solid line withfilled circles): The liquid phase transforms to the fcc phase, which grows on thehcp substrate. 2) 3,489≤ T ≤ 3,503 K (green dashed line with open circles): Nosteady-state interface motion is observed. The hcp substrate interfaces the liq-uid through a film of fluctuating fcc clusters. 3) T ≥ 3,503 K (red solid line withfilled circles): The hcp slab melts at steady rate.
experiments. Nevertheless, examination of the ultrarapid solid-ification snapshot at 60 GPa, shown in Fig. 2, confirms theformation of bcc nuclei at the start of solidification, some ofwhich transform to close-packed phases during early growth,with the close-packed content increasing with time.
It is instructive to briefly discuss the states at the boundarybetween the bcc–MSCL domain and the transient region. SIAppendix, Fig. S9 shows an example of a solid critical clusterat 30 GPa on the verge of dynamic stability. It contains aboutNu ≈ 200 particles identified by a-CNA to mainly have bcc sym-metry. This cluster was obtained by slowly shrinking a metastablebcc cluster in the NPH ensemble. When growing this cluster at1,860 K in the NPT ensemble, it transitions to the fcc phase, whileat 1,863 K, it grows to large sizes as bcc. This result is repro-ducible from different initial configurations, demonstrating theboundary of the bcc–MSCL subspace. It should be noted thatthe critical clusters at large undercoolings are far from compactand spherical, and their kinetics cannot be described within theCNT framework, which is better suited for the slower kinetics atsmall undercoolings.
We conclude this section by pointing out that here we haveonly scratched the surface of a vast phenomenology pertainingto kinetic stability of solid clusters growing within undercooledliquids. We have touched upon the growing bcc clusters in EAM–Cu, which transform to fcc at large undercoolings. This instabilityis conventionally expected to be due to the vibrational instabilityof the bulk bcc phase under these conditions. However, we showin SI Appendix that far from equilibrium conditions caused byfast interface kinetics can drive solid–solid phase transformationsin growing clusters with stable bulk phonons. This mechanismis explicitly nonequilibrium and interface driven, and it cannotbe explained by the dynamical structural properties of the bulkcrystal phase alone.
Extraneous-Phase Interface Layers: Interfacial PhaseTransformations Coupled to Growth-Mode TransitionsHitherto in this paper, we have discussed kinetic stabilizationof metastable single-phase bcc solid at significant undercooling.This is the expected regime based on Ostwald’s step rule, which
suggests that small solid clusters in liquid can prefer phases otherthan the bulk equilibrium phase, due to their interfaces with themelt contributing substantially to their stability. As an example,the line representing T ∗(P) in Fig. 5 depicts the minimal under-cooling required for nucleation of metastable–bcc phase fromthe melt for the model Cu system of this study. In this analysis,the interface assumes a passive role. As described earlier in thispaper, it suffices to consider the interface as a dividing surfaceoccupying no space and containing no particles, only contribut-ing to the overall free energy of solid nuclei immersed in themelt. This is reasonable as long as the internal structure of thesolid–liquid interface can be neglected.
However, the observation of hcp nuclei with heterogeneousinterface structures (Fig. 3C) is suggestive of the existence ofsuch phenomenology that cannot be explained via the aboveapproach. In particular, Fig. 3C shows that the (0001)-hcp planesinterface the liquid via an fcc shell. This can be rationalized bythe observation that the stacking fault free energy is an order ofmagnitude smaller than the solid–liquid interfacial free energy(SI Appendix).
The observation of a shell structure is not new. In fact, in theearliest computational studies (29) of the Lennard–Jones system,the fcc nuclei were found to be coated by bcc layers at their inter-faces with the melt. To our knowledge, the ramifications of thisunusual interfacial structure for the kinetics of solidification havenot been explored in the literature. As mentioned earlier, wehave not been able to observe such bcc shell structures in anyof our systems, which suggests that the energy cost of fcc–bccinterfaces must be relatively high in our systems. However, thefcc shell structure at the interface of hcp-(0,001) planes with themelt offers an opportunity to study its unusual features.
Unusual internal structures of solid–liquid interfaces in finite-sized nuclei (e.g., Fig. 3C) inevitably bring forth the question ofwhether such atomic arrangements are dependent on the interfa-cial curvature. If so, structural transformations are to be expectedat the interfaces of the growing solid nuclei. This is undoubtablya noteworthy phenomenon with possible deep ramifications forcrystal growth kinetics. If not the case, the shell structure shouldappear even in the flat interface limit. In the following, wepresent an in-depth study of this limit by two-phase simulationsof periodic slab geometries for two interface orientations, hcp-(0,001) and hcp-(1,120), in the neighborhood of the meltingpoint Tm = 3,497 K at 80 GPa, where hcp is the bulk equilibriumphase (Fig. 1). Based on our previous discussions of Fig. 3C, thehcp-(0001) interface with the liquid should be in the fcc phase,contrary to the hcp-(1120) interface that stays isostructural withthe bulk phase (SI Appendix, Fig. S11). A systematic study of thedynamic properties of these solid–liquid configurations at smallundercooling and superheating reveals the remarkable resultshown in Fig. 6. It depicts the velocity of each interface as a func-tion of temperature in the vicinity of Tm ; positive sign of thevelocity indicates growing liquid phase, and negative sign impliessolid-phase growth. In the narrow range of temperatures stud-ied in Fig. 6, about 1% deviation from Tm , linear response isexpected. This is clearly observed for the hcp-(1120) interfacemobility in Fig. 6. Note that due to the relatively small latentheat of the EAM–Cu system (i.e., ∆H /kBTm ≈ 1), which is typi-cal of simple metals, the interface is atomically rough, and crystalgrowth is dominated by rates of attachment and detachment ofatoms to the crystal surfaces that are controlled by liquid diffu-sivity, often only thermal velocity, and the latent heat (66). Theavailable sites for attachment on the rough interfaces are large,commonly assumed to be about 1/4 of all of the sites, so-calledrepeatable step sites (67).
In contrast, the (0001) interface velocity has strongly non-linear temperature dependence. In particular, in the interval∆a = (3,489, 3,503) K, interface mobility vanishes on the
Sadigh et al.Metastable–solid phase diagrams derived from polymorphic solidification kinetics
PNAS | 9 of 12https://doi.org/10.1073/pnas.2017809118
Dow
nloa
ded
by g
uest
on
Janu
ary
28, 2
022
3492 3498 3504 3510Temperature (K)
0
5
10
15
20N
umbe
r of f
cc p
artic
les (
x 1
000
) interfacial fcc content
2
4
6
Win
t = In
terf
ace
wid
th (n
o. o
f lay
ers)
hcp-liquid interface thickness
Phase IPhase II
0 2000 4000 6000 8000 10000time (ps)
0
1000
2000
3000
4000
5000
Num
ber o
f fcc
par
ticle
s
0
10
20
30
Inte
rfac
ial d
ispl
acem
ent (
Å)Interfacial fcc population
Inter
face
disp
lacem
ent
T = 3505 K
Phase I
Phase II
0.3 0.6 0.9Normalized OPF gradient
0
0.5
1
Dis
tribu
tion
dens
ity fu
nctio
n (D
) T = 3505 K (Initial state)T = 3505 K (final state)T = 3510 KT = 3500 K
A
B
C
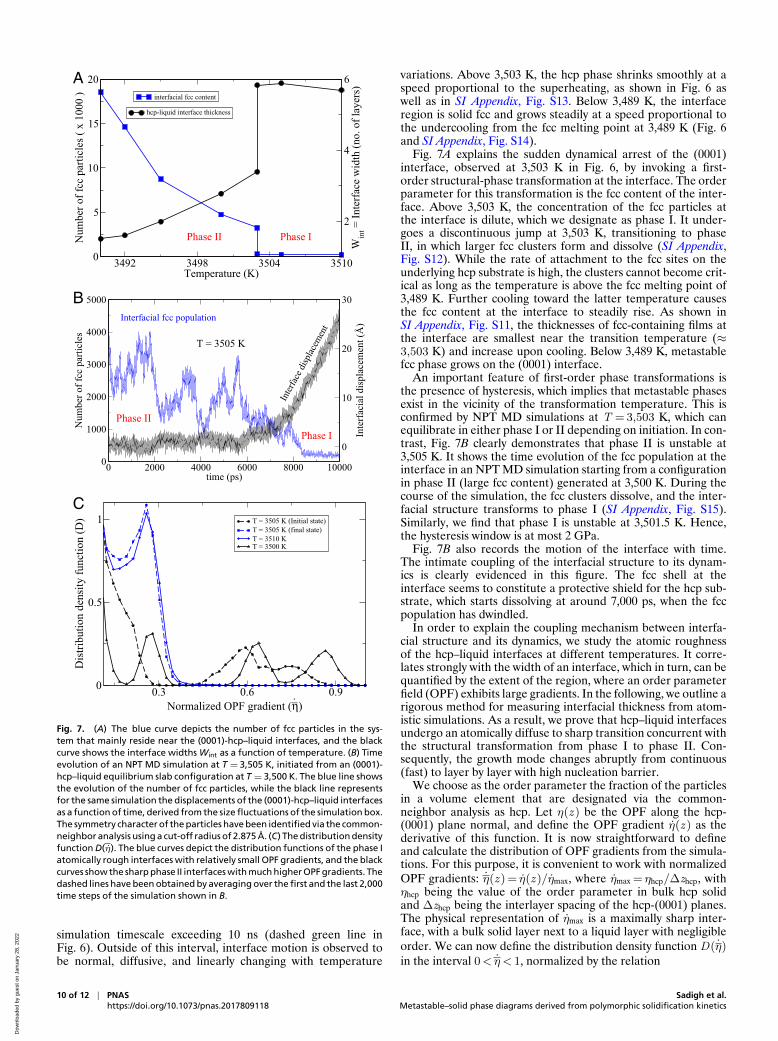
Fig. 7. (A) The blue curve depicts the number of fcc particles in the sys-tem that mainly reside near the (0001)-hcp–liquid interfaces, and the blackcurve shows the interface widths Wint as a function of temperature. (B) Timeevolution of an NPT MD simulation at T = 3,505 K, initiated from an (0001)-hcp–liquid equilibrium slab configuration at T = 3,500 K. The blue line showsthe evolution of the number of fcc particles, while the black line representsfor the same simulation the displacements of the (0001)-hcp–liquid interfacesas a function of time, derived from the size fluctuations of the simulation box.The symmetry character of the particles have been identified via the common-neighbor analysis using a cut-off radius of 2.875 A. (C) The distribution densityfunction D(η). The blue curves depict the distribution functions of the phase Iatomically rough interfaces with relatively small OPF gradients, and the blackcurves show the sharp phase II interfaces with much higher OPF gradients. Thedashed lines have been obtained by averaging over the first and the last 2,000time steps of the simulation shown in B.
simulation timescale exceeding 10 ns (dashed green line inFig. 6). Outside of this interval, interface motion is observed tobe normal, diffusive, and linearly changing with temperature
variations. Above 3,503 K, the hcp phase shrinks smoothly at aspeed proportional to the superheating, as shown in Fig. 6 aswell as in SI Appendix, Fig. S13. Below 3,489 K, the interfaceregion is solid fcc and grows steadily at a speed proportional tothe undercooling from the fcc melting point at 3,489 K (Fig. 6and SI Appendix, Fig. S14).
Fig. 7A explains the sudden dynamical arrest of the (0001)interface, observed at 3,503 K in Fig. 6, by invoking a first-order structural-phase transformation at the interface. The orderparameter for this transformation is the fcc content of the inter-face. Above 3,503 K, the concentration of the fcc particles atthe interface is dilute, which we designate as phase I. It under-goes a discontinuous jump at 3,503 K, transitioning to phaseII, in which larger fcc clusters form and dissolve (SI Appendix,Fig. S12). While the rate of attachment to the fcc sites on theunderlying hcp substrate is high, the clusters cannot become crit-ical as long as the temperature is above the fcc melting point of3,489 K. Further cooling toward the latter temperature causesthe fcc content at the interface to steadily rise. As shown inSI Appendix, Fig. S11, the thicknesses of fcc-containing films atthe interface are smallest near the transition temperature (≈3,503 K) and increase upon cooling. Below 3,489 K, metastablefcc phase grows on the (0001) interface.
An important feature of first-order phase transformations isthe presence of hysteresis, which implies that metastable phasesexist in the vicinity of the transformation temperature. This isconfirmed by NPT MD simulations at T = 3,503 K, which canequilibrate in either phase I or II depending on initiation. In con-trast, Fig. 7B clearly demonstrates that phase II is unstable at3,505 K. It shows the time evolution of the fcc population at theinterface in an NPT MD simulation starting from a configurationin phase II (large fcc content) generated at 3,500 K. During thecourse of the simulation, the fcc clusters dissolve, and the inter-facial structure transforms to phase I (SI Appendix, Fig. S15).Similarly, we find that phase I is unstable at 3,501.5 K. Hence,the hysteresis window is at most 2 GPa.
Fig. 7B also records the motion of the interface with time.The intimate coupling of the interfacial structure to its dynam-ics is clearly evidenced in this figure. The fcc shell at theinterface seems to constitute a protective shield for the hcp sub-strate, which starts dissolving at around 7,000 ps, when the fccpopulation has dwindled.
In order to explain the coupling mechanism between interfa-cial structure and its dynamics, we study the atomic roughnessof the hcp–liquid interfaces at different temperatures. It corre-lates strongly with the width of an interface, which in turn, can bequantified by the extent of the region, where an order parameterfield (OPF) exhibits large gradients. In the following, we outline arigorous method for measuring interfacial thickness from atom-istic simulations. As a result, we prove that hcp–liquid interfacesundergo an atomically diffuse to sharp transition concurrent withthe structural transformation from phase I to phase II. Con-sequently, the growth mode changes abruptly from continuous(fast) to layer by layer with high nucleation barrier.
We choose as the order parameter the fraction of the particlesin a volume element that are designated via the common-neighbor analysis as hcp. Let η(z ) be the OPF along the hcp-(0001) plane normal, and define the OPF gradient η(z ) as thederivative of this function. It is now straightforward to defineand calculate the distribution of OPF gradients from the simula-tions. For this purpose, it is convenient to work with normalizedOPF gradients: η(z ) = η(z )/ηmax, where ηmax = ηhcp/∆zhcp, withηhcp being the value of the order parameter in bulk hcp solidand ∆zhcp being the interlayer spacing of the hcp-(0001) planes.The physical representation of ηmax is a maximally sharp inter-face, with a bulk solid layer next to a liquid layer with negligibleorder. We can now define the distribution density function D(η)in the interval 0< η < 1, normalized by the relation
10 of 12 | PNAShttps://doi.org/10.1073/pnas.2017809118
Sadigh et al.Metastable–solid phase diagrams derived from polymorphic solidification kinetics
Dow
nloa
ded
by g
uest
on
Janu
ary
28, 2
022

APP
LIED
PHYS
ICA
LSC
IEN
CES
∫ 1
0
D(η) d η=Lslab
∆zhcp, [13]
where Lslab is the length of the simulation box along the (0001)plane normal. D(η) d η is the number of layers with OPF gra-dients in a d η window around η. The hcp–liquid interface layerthickness can now be calculated as
Wint =1
2
∫ 1
ηmin
D(η) d η. [14]
The factor 1/2 above stems from the necessary presence of twointerfaces in any periodic supercell, and ηmin is obtained from theequation
1
2
∫ 1
ηmin
D(η) η d η= 1−ηliq
ηhcp. [15]
The left-hand side of the above equation integrates over all ofthe intermediate layers (i.e., interfacial region) that are requiredto transition from the highest order parameter value ηhcp in thebulk solid to the lowest one in the liquid. It derives from twoconsiderations: 1) the interfacial region is confined to the spec-tral domain with the highest OPF gradients, and 2) the interfaceis sandwiched between the solid region with the order parameterηhcp and the liquid region with the order parameter ηliq. In oursystems, ηliq/ηhcp≈ 0.0004 and thus, is negligible.
The result of the above analysis is shown in Fig. 7A, wherea discontinuous drop in hcp–liquid interface thickness Wint isobserved upon phase transformation. Fig. 7C shows the densityfunctions D(η) for a few interfaces belonging to the two differ-ent phases. It is clear that upon transformation from phase I tophase II, the interface becomes smooth and planar and growslayer by layer through two-dimensional nucleation with largeactivation barrier so that the interfacial motion halts within thecomputational time scale of this study.
We conclude this section by noting that the structuralanisotropy of the hcp phase gives rise to heterogenous growthpatterns. In particular, in the system studied here, a growinghcp cluster always contains smooth (0001) facets, on which onlymetastable fcc phase can grow (Fig. 3C). At the same time, otherhcp–liquid interface orientations behave normally and promotethe growth of the hcp phase. Hence, interfacial kinetics can drivethe growth of multiphase nuclei. This explains the prevalence ofmixed fcc–hcp clusters in the pressure range from 60 to 80 GPa(Fig. 3D).
DiscussionIn this paper, we have conducted an in-depth study of the kineticprocesses during solidification that stabilize crystal phases thatare not thermodynamically stable in the bulk. At the nucleationstage, these phases are stabilized by their relatively low interfa-cial free energies. Additionally, at the growth stage, the kineticbarrier to structural transformation is high and therefore, makesany transition to the thermodynamic ground state improbable.This happens most prominently near the triple points of thephase diagram. By constructing a polymorphic nucleation the-ory from atomistic first principles and by conducting a rigorousstudy of the kinetic stability of postcritical nuclei during theirgrowth stage, we have successfully managed to devise a rationalframework for characterizing and quantifying the conditions fornucleation and growth of metastable crystal phases during solid-ification. As a result, in addition to the regular thermodynamicphase diagram, we also construct a kinetic phase diagram thatdelineates the temperature–pressure regions where metastablephases are favored to grow from the melt.
As a proof of concept, we have applied the above method-ology to an atomistic system described by a model EAM–Cu
interatomic potential. We thus construct a metastable phasemap complementing the thermodynamic phase diagram of thissystem (Fig. 5). It is quite sobering to observe the significantextent of the metastable region. It is bounded from above bythe solid-nucleation phase boundary T ∗(P) and from belowby Tu(P), under which the growing bcc nuclei become kinet-ically unstable. The procedure adopted in this paper assumesnear-equilibrium critical nuclei, whose thermodynamic as wellas kinetic stabilities are investigated. However, no simplifyingassumptions regarding their shapes or structures are made. Nodoubt, more sophisticated studies of the nonequilibrium kinet-ics during nucleation are necessary to determine the domain ofvalidity of the assumption of near-equilibrium nuclei (68).
It should be noted that kinetic phase maps are not uni-versal. They depend on the kinetic mechanism that is beingconsidered. Conventionally, kinetic stabilization of metastablephases has been discussed as a result of phase selection duringthe nucleation stage described within the CNT. In this picture,thermodynamic driving forces govern the phase of a criticalnucleus, which according to the CNT, grows to large sizes no fail.In this way, kinetic phase diagrams can be drawn and be inter-preted just like thermodynamic phase diagrams. In this paper,we have generalized this idea by including kinetics in a restric-tive way as to preserve the notion of a phase diagram. For thispurpose, we have introduced the concept of SCL basins andtheir MSCL subspaces, defined as subdomains of the former thatare weakly connected to other SCL basins. Hence, nucleationfrom the undercooled liquid into a particular MSCL subspacewith near certainty is guaranteed to evolve without further phasetransformations. The real power of this idea lies in the real-ization that MSCL subspaces contain all of the large clusterssince the barrier to nucleation of solid–solid transformations onlyincreases with cluster size. Hence, if critical nucleation occursin the transient region of the SCL basin, unless kinetic instabili-ties occur within a short time after, the nucleus inevitably growslarge enough to transition to the MSCL subspace. Hence, ther-modynamic conditions that lead to nucleation into the MSCLsubspace can be easily identified by exclusion of all those thatlead to a finite number of clusters undergoing kinetic instabilitiesamid their early growths.
While the above is quite a reasonable guiding principle forconstruction of solidification–kinetic phase diagrams, it is toorestrictive and sweeps all real complexities aside by excludingthem from the MSCL subspaces. This shortcoming becomesapparent after the growth of metastable fcc in competition withan anisotropic crystal phase such as hcp is considered. In thiscase, the solid–liquid interface cannot be treated as uniform.Rather, there are special interfaces, whose behaviors are radi-cally different from others. These interfaces can have complexstructures distinct from the bulk of the solid clusters and canundergo phase transformations, which in turn, induce sharp tran-sitions in the growth kinetics of competing crystal phases in theirneighborhoods. Due to this explicit role of interfacial structureand dynamics, different crystal orientations may promote growthof disparate crystal phases. As a result, the fundamental notionof the kinetic phase boundary as an infinitely thin dividing sur-face in analogy with the thermodynamic phase boundary must beabandoned and generalized.
Materials and MethodsIn this paper, we have presented results of a series of large-scale MD sim-ulations using the LAMMPS code (44) and the EAM interatomic potentialfor Cu metal, as constructed by Mishin et al. (45). This model represents thebulk physical properties of Cu quite well at ambient condition. While it is notfitted to high-pressure ab initio data, it constitutes a reasonable model foratomic interactions in a generic close-packed metal under pressure. When nototherwise specified, simulations were performed with a 1-fs time step. Visual-ization and analysis of simulation snapshots were carried out using the OVITO
Sadigh et al.Metastable–solid phase diagrams derived from polymorphic solidification kinetics
PNAS | 11 of 12https://doi.org/10.1073/pnas.2017809118
Dow
nloa
ded
by g
uest
on
Janu
ary
28, 2
022

program package (69). Solid-phase designation of each particle has beendone via a-CNA (50–52). Particles are colored according to their phasedesignation: fcc phase (green), bcc phase (blue), and the hcp phase (red).
Data Availability. All study data are included in the article and/or SIAppendix.
ACKNOWLEDGMENTS. B.S. and J.L.B. are grateful for the guidance, insights,and support from Prof. Russell Hemley. We acknowledge Alex Chernov, LorinBenedict, Sebastien Hamel, and Amit Samanta for helpful discussions. Wealso thank A. Arsenlis, D. P. McNabb, B. K. Wallin, and R. S. Maxwell forproject support. This work was performed under the auspices of the USDepartment of Energy by Lawrence Livermore National Laboratory ContractDE-AC52-07NA27344.
1. W. Ostwald, Studien Uber die Bildung und Umwandlung Fester Korper. Z. Phys. Chem.22, 289–330 (1897).
2. I. N. Stranski, D. Totomanow, Keimbildungsgeschwindigkeit und Ostwaldsche Stufen-regel. Z. Phys. Chem. 163, 399–408 (1933).
3. C. Guo, J. Wang, J. Li, Z. Wang, S. Tang, Kinetic pathways and mechanisms of two-stepnucleation in crystallization. J. Phys. Chem. Lett. 7, 5008–5014 (2016).
4. G. I. Toth, J. R. Morris, L. Granasy, Ginzburg-Landau-type multiphase field model forcompeting fcc and bcc nucleation. Phys. Rev. Lett. 106, 045701 (2011).
5. R. E. Cech, Undercooling of Fe-Ni droplets. Trans. AIME 206, 585–589 (1956).6. Y. Liu, H. Nie, R. Bansil, M. Steinhart, J. Bang, T. P. Lodge, Kinetics of disorder-to-fcc
phase transition via an intermediate bcc state. Phys. Rev. E 73, 061803 (2006).7. J. Bang, T. P. Lodge, Long-lived metastable bcc phase during ordering of micelles.
Phys. Rev. Lett. 93, 245701 (2004).8. S. Xu, H. Zhou, Z. Sun, J. Xie, Formation of an fcc phase through a bcc metastable state
in crystallization of charged colloidal particles. Phys. Rev. E 82, 010401(R) (2010).9. P. Tan, N. Xu, L. Xu, Visualizing kinetic pathways of homogeneous nucleation in
colloidal crystallization. Nat. Phys. 10, 73–79 (2014).10. D. M. Herlach, Non-equilibrium solidification of undercooled metallic melts. Metals
4, 196–24 (2014).11. D. M. Herlach, Containerless undercooling and solidification of pure metals. Annu.
Rev. Mater. Sci. 21, 23–44 (1991).12. C. Notthoff, B. Feuerbacher, H. Frans, D. M. Herlach, D. Holland-Moritz, Direct deter-
mination of metastable phase diagram by synchrotron radiation experiments onundercooled metallic melts. Phys. Rev. Lett. 86, 1038–1041 (2001).
13. O. Shuleshova, W. Loser, D. Holland-Moritz, D. M. Herlach, J. Eckert, Solidification andmelting of high-temperature materials: In situ observations by synchrotron radiation.J. Mater. Sci. 47, 4497–4513 (2012).
14. S. Klein, D. Holland-Moritz, D. M. Herlach, Crystal nucleation in undercooled liquidzirconium. Phys. Rev. B 80, 212202 (2009).
15. P. C. Myint, J. Belof, Rapid freezing of water under dynamic compression. J. Phys.Condens. Matter 30, 233002 (2018).
16. D. Charbonneau et al., A super-earth transiting a nearby low-mass star. Nature 462,891–894 (2009).
17. D. H. Dolan, Y. M. Gupta, Time-dependent freezing of water under dynamiccompression. Chem. Phys. Lett. 374, 608–612 (2003).
18. D. H. Dolan, Y. M. Gupta, Nanosecond freezing of water under multiple shock wavecompression: Optical transmission and imaging measurements. J. Chem. Phys. 121,9050–9057 (2004).
19. D. H. Dolan, M. D. Knudson, C. A. Hall, C. Deeney, A metastable limit for compressedliquid water. Nat. Phys. 3, 339–342 (2007).
20. M. Bastea, S. Bastea, J. E. Reaugh, D. B. Reisman, Freezing kinetics in overcompressedwater. Phys. Rev. B 75, 172104 (2007).
21. S. J. P. Stafford, D. J. Chapman, S. N. Bland, D. E. Eakins, Observations on thenucleation of ice VII in compressed water. AIP Conf. Proc. 1793, 13005 (2017).
22. A. E. Gleason et al., Compression freezing kinetics of water to ice VII. Phys. Rev. Lett.119, 025701 (2017).
23. P. C. Myint et al., Nanosecond freezing of water at high pressures: Nucleation andgrowth near the metastability limit. Phys. Rev. Lett. 121, 155701 (2018).
24. S. Alexander, J. P. McTague, Should all crystals Be bcc? Landau theory of solidificationand crystal nucleation. Phys. Rev. Lett. 41, 702 (1978).
25. M. J. Mandell, J. P. McTague, A. Rahman, Crystal nucleation in a three-dimensionalLennard-Jones system. II. Nucleation kinetics for 256 and 500 particles. J. Chem. Phys.66, 3070–3075 (1977).
26. S. Nose, F. Yonezawa, Isothermal-isobaric computer simulations of melting andcrystallization of a Lennard-Jones system. J. Chem. Phys. 84, 1803–1814 (1986).
27. J. Yang, H. Gould, W. Klein, Molecular-dynamics investigation of deeply quenchedliquids. Phys. Rev. Lett. 60, 2665 (1988).
28. W. C. Swope, H. C. Andersen, 106-Particle molecular-dynamics study of homogeneousnucleation of crystals in a supercooled atomic liquid. Phys. Rev. B 41, 7042–7054 (1990).
29. P. R. ten Wolde, M. J. Ruiz-Montero, D. Frenkel, Numerical evidence for bcc orderingat the surface of a critical fcc nucleus. Phys. Rev. Lett. 75, 2714–2717 (1995).
30. P. R. ten Wolde, M. J. Ruiz-Montero, D. Frenkel, Numerical calculation of the rateof crystal nucleation in a Lennard-Jones system at moderate undercooling. J. Chem.Phys. 104, 9932–9947 (1996).
31. G. M. Torrie, J. P. Valleau, Monte Carlo free energy estimates using non-Boltzmannsampling: Application to the sub-critical Lennard-Jones fluid. Chem. Phys. Lett. 28,578–581 (1974).
32. P. J. Steinhardt, D. R. Nelson, M. Ronchetti, Bond-orientational order in liquids andglasses. Phys. Rev. B 28, 784–805 (1983).
33. J. S. van Duijneveldt, D. Frenkel, Computer simulation study of free energy barriers incrystal nucleation. J. Chem. Phys. 96, 4655–4688 (1992).
34. Y. C. Shen, D. W. Oxtoby, Bcc symmetry in the crystal-melt interface of Lennard-Jonesfluids examined through density functional theory. Phys. Rev. Lett. 77, 3585–3588(1996).
35. D. Moroni, P. R. ten Wolde, P. G. Bolhuis, Interplay between structure and size in acritical crystal nucleus. Phys. Rev. Lett. 94, 235703 (2005).
36. C. Desgranges, J. Delhommelle, Controlling polymorphism during the crystallizationof an atomic fluid. Phys. Rev. Lett. 98, 235502 (2007).
37. Y. Huang, J. Wang, Z. Wang, J. Li, C. Guo, Y. Guo, Y. Yang, Existence and formingmechanism of metastable phase in crystallization. Comput. Mater. Sci. 122, 167–176(2016).
38. B. Groh, B. Mulder, Why all crystals need not be bcc: Symmetry breaking at the liquid-solid transition revisited. Phys. Rev. E 59, 5613–5620 (1999).
39. S. Pan, S. Feng, J. Qiao, W. Wang, J. Qin, Crystallization pathways of liquid-bcctransition for a model iron by fast quenching. Sci. Rep. 5, 16956 (2015).
40. M. Santra, R. S. Singh, B. Bagchi, Nucleation of a stable solid from melt in the pres-ence of multiple metastable intermediate phases: Wetting, Ostwald’s step rule, andvanishing polymorphs. J. Phys. Chem. B 117, 13154–13163 (2013).
41. L. A. Zepeda-Ruiz, B. Sadigh, A. A. Chernov, T. Haxhimali, A. Samanta, T. Oppelstrup,S. Hamel, L. X. Benedict, J. L. Belof, Extraction of effective solid-liquid interfacial freeenergies for full 3D solid crystallites from equilibrium MD simulations. J. Chem. Phys.147, 194704 (2017).
42. X.-M. Bai, M. Li, Calculation of solid-liquid interfacial free energy: A classicalnucleation theory based approach. J. Chem. Phys. 124, 124707 (2006).
43. J. R. Espinosa, C. Vega, C. Valeriani, E. Sanz, Seeding approach to crystal nucleation.J. Chem. Phys. 144, 034501 (2016).
44. S. Plimpton, Fast parallel algorithms for short-range molecular dynamics. J. Comput.Phys. 117, 1–19 (1995).
45. Y. Mishin, M. J. Mehl, D. A. Papaconstantapoulos, A. F. Voter, J. Kress, Structural sta-bility and lattice defects in copper: Ab initio, tight-binding, and embedded-atomcalculations. Phys. Rev. B 63, 224106 (2001).
46. G. J. Martyna, D. J. Tobias, M. L. Klein, Constant pressure molecular dynamicsalgorithms. J. Chem. Phys. 101, 4177–4189 (1994).
47. M. Parrinello, A. Rahman, Polymorphic transitions in single crystals: A new moleculardynamics method. J. Appl. Phys. 52, 7182–7190 (1981).
48. M. E. Tuckerman, J. Alejandre, R. Lopez-Rendon, A. L. Jochim, G. J. Martyna, A Liouville-operator derived measure-preserving integrator for molecular dynamics simulations inthe isothermal-isobaric ensemble. J. Phys. Math. Gen. 39, 5629–5651 (2006).
49. W. Shinoda, M. Shiga, M. Mikami, Rapid estimation of elastic constants by moleculardynamics simulation under constant stress. Phys. Rev. B 69, 134103 (2004).
50. D. Faken, H. Jonsson, Systematic analysis of local atomic structure combined with 3Dcomputer graphics. Comput. Mater. Sci. 2, 279–286 (1994).
51. J. D. Honeycutt, H. C. Andersen, Molecular dynamics study of melting and freezing ofsmall Lennard-Jones clusters. J. Phys. Chem. 91, 4950–4963 (1987).
52. A. Stukowski, Visualization and analysis of atomistic simulation data with OVITO-theopen visualization tool. Model. Simulat. Mater. Sci. Eng. 18, 015012 (2010).
53. L. D. Landau, E. M. Lifshitz, Statistical Physics (Butterworth-Heinemann, ed. 3, 1980),vol. 5.
54. D. Turnbull, Formation of crystal nuclei in liquid metals. J. Appl. Phys. 21, 1022–1028(1950).
55. F. Spaepen, A structural model for the solid-liquid interface in monatomic systems.Acta Metall. 23, 729 (1975).
56. F. Spaepen, R. B. Meyer, The surface tension in a structural model for the solid-liquidinterface scripta. Met. Mater. 10, 257–263 (1976).
57. C. V. Thompson, “Crystal formation in easy glass-forming metallic alloys,” PhD thesis,Harvard University, Cambridge, MA (1979).
58. D. R. Nelson, F. Spaepen, “Polytetrahedral order in condensed matter” in Solid StatePhysics, H. Ehrenreich, D. Turnbull, Eds. (Academic Press, New York, NY, 1989), vol. 42,1–90.
59. D. Y. Sun, M. Asta, J. J. Hoyt, M. I. Mendelev, D. J. Srolovitz, Crystal-melt interfacialfree energies in metals: Fcc versus bcc. Phys. Rev. B 69, 020102(R) (2004).
60. B. Laird, R. L. Davidchack, Direct calculation of the crystal-melt interfacial free energyvia molecular dynamics computer simulation. J. Phys. Chem. B 109, 17802–17812 (2005).
61. R. L. Davidchack, B. B. Laird, Crystal structure and interaction dependence of thecrystal-melt interfacial free energy. Phys. Rev. Lett. 94, 086102 (2005).
62. A. Samanta, J. Belof, The thermodynamics of a liquid-solid interface at extremeconditions: A model close-packed system up to 100 GPa. J. Chem. Phys. 149, 124703 (2018).
63. B. Laird, R. L. Davidchack, Y. Yang, M. Asta, Determination of the solid-liquid inter-facial free energy along a coexistence line by Gibbs-Cahn integration. J. Chem. Phys.131, 114110 (2009).
64. S. Auer, D. Frenkel, Numerical prediction of absolute crystallization rates in hard-sphere colloids. J. Chem. Phys. 120, 3015–3029 (2001).
65. E. Sanz et al., Homogeneous ice nucleation at moderate supercooling from molecularsimulation. J. Am. Chem. Soc. 135, 15008–15017 (2013).
66. K. A. Jackson, Current concepts in crystal growth from the melt. Prog. Solid StateChem. 4, 53–80 (1967).
67. K. A. Jackson, The interface kinetics of crystal growth processes. Interface Sci. 10,159–169 (2002).
68. T. Kawasaki, H. Tanaka, Formation of a crystal nucleus from liquid. Proc. Natl. Acad.Sci. U.S.A. 107, 14036–14041 (2010).
69. A. Stukowski, Structure identification methods for atomistic simulations of crystallinematerials. Model. Simulat. Mater. Sci. Eng. 20, 045021 (2012).
12 of 12 | PNAShttps://doi.org/10.1073/pnas.2017809118
Sadigh et al.Metastable–solid phase diagrams derived from polymorphic solidification kinetics
Dow
nloa
ded
by g
uest
on
Janu
ary
28, 2
022