metalscan - qualification of an on-line bearing and gear health
TRANSCRIPT
Qualification of an On-Line Bearing and Gear Health Monitoring Technique for
In-Service Monitoring of Aircraft Engines and Helicopter Transmissions
Karen Cassidy, PhD
Outline• Introduction
- Aircraft availability depends on engine & transmission health- Why bearings and gears fail- Oil Debris Monitor sensor
• Qualification Process- How to set debris limits, assess damage severity- Early research results, characteristic debris accumulation,
initial condition indicators- Validate the limits using empirical test data
• Sources of Aircraft Engine & Transmission ODM Test Data- Bearing and gear rigs; engine and helicopter test stands- Pre-flight aircraft data
• In-Service Condition Indicator Qualification- Eurofighter Typhoon / EJ200- Pilatus PC-12 / PWC PT6A
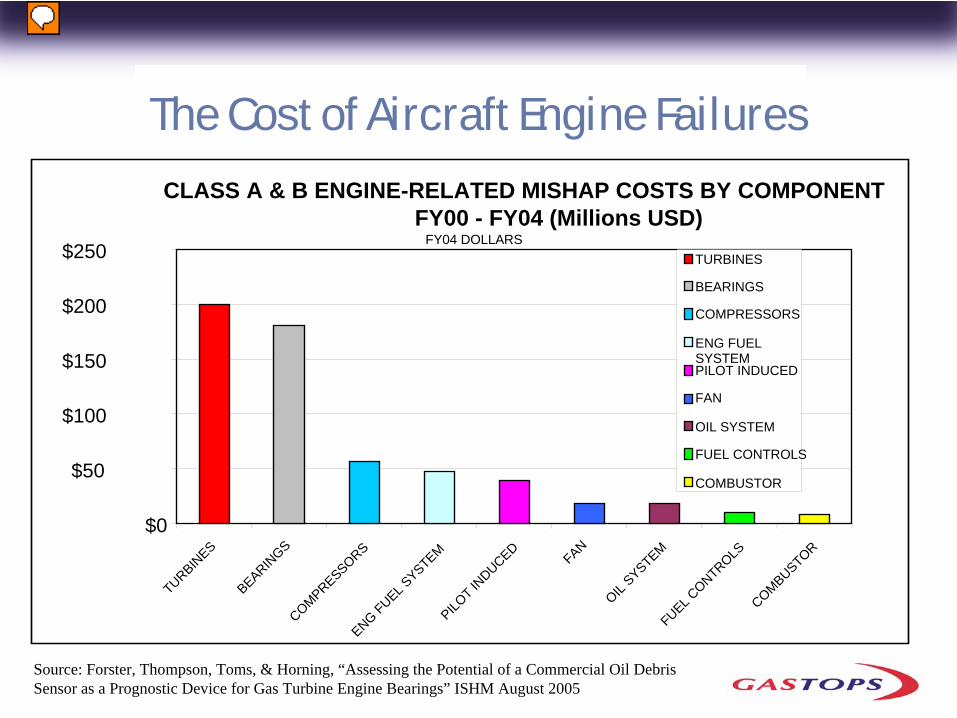
CLASS A & B ENGINE-RELATED MISHAP COSTS BY COMPONENT FY00 - FY04 (Millions USD)
FY04 DOLLARS
$0
$50
$100
$150
$200
$250
TURBINES
BEARINGS
COMPRESSORSENG FUEL S
YSTEMPILO
T INDUCED
FAN
OIL SYSTEM
FUEL CONTROLS
COMBUSTOR
TURBINES
BEARINGS
COMPRESSORS
ENG FUELSYSTEMPILOT INDUCED
FAN
OIL SYSTEM
FUEL CONTROLS
COMBUSTOR
The Cost of Aircraft Engine Failures
Source: Forster, Thompson, Toms, & Horning, “Assessing the Potential of a Commercial Oil Debris Sensor as a Prognostic Device for Gas Turbine Engine Bearings” ISHM August 2005
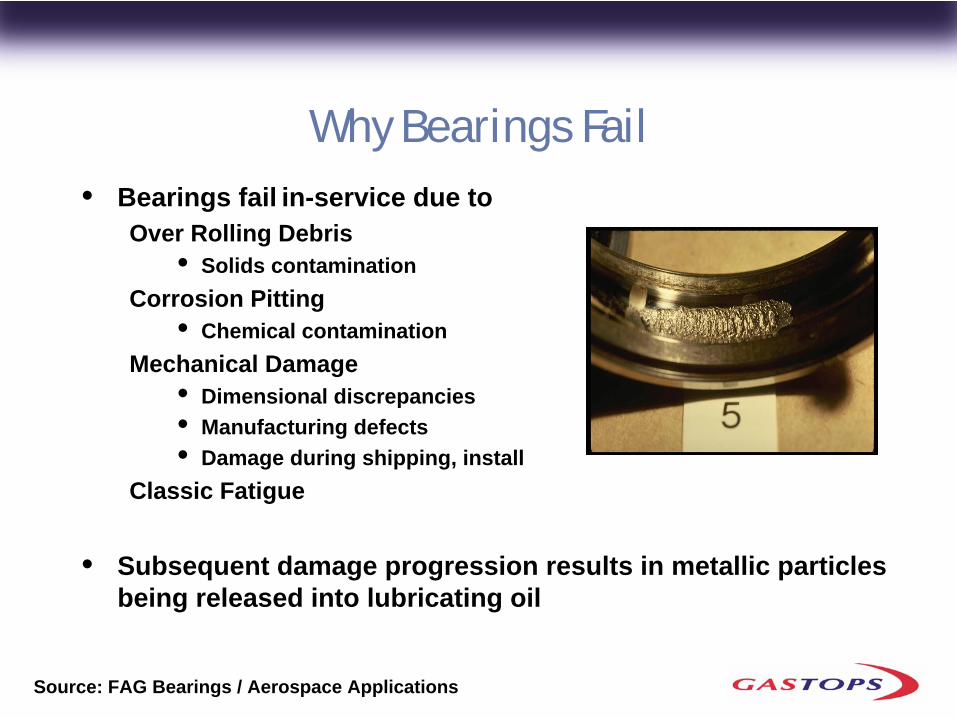
• Bearings fail in-service due to Over Rolling Debris
• Solids contaminationCorrosion Pitting
• Chemical contaminationMechanical Damage
• Dimensional discrepancies • Manufacturing defects• Damage during shipping, install
Classic Fatigue
• Subsequent damage progression results in metallic particles being released into lubricating oil
Why Bearings Fail
Source: FAG Bearings / Aerospace Applications
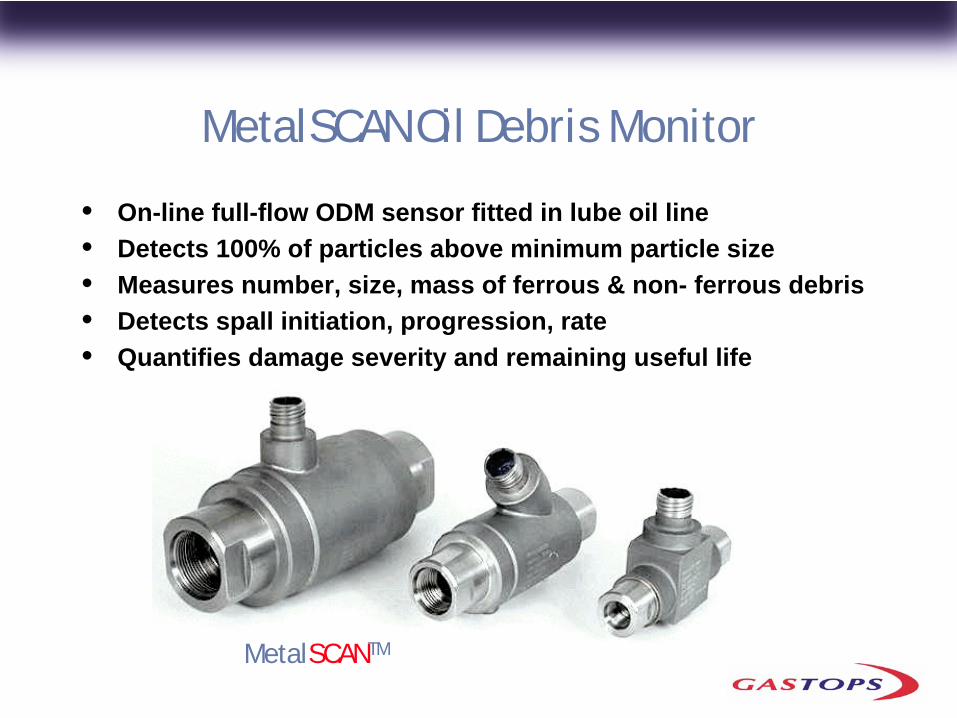
MetalSCAN Oil Debris Monitor
• On-line full-flow ODM sensor fitted in lube oil line• Detects 100% of particles above minimum particle size• Measures number, size, mass of ferrous & non- ferrous debris• Detects spall initiation, progression, rate• Quantifies damage severity and remaining useful life
MetalSCANTM
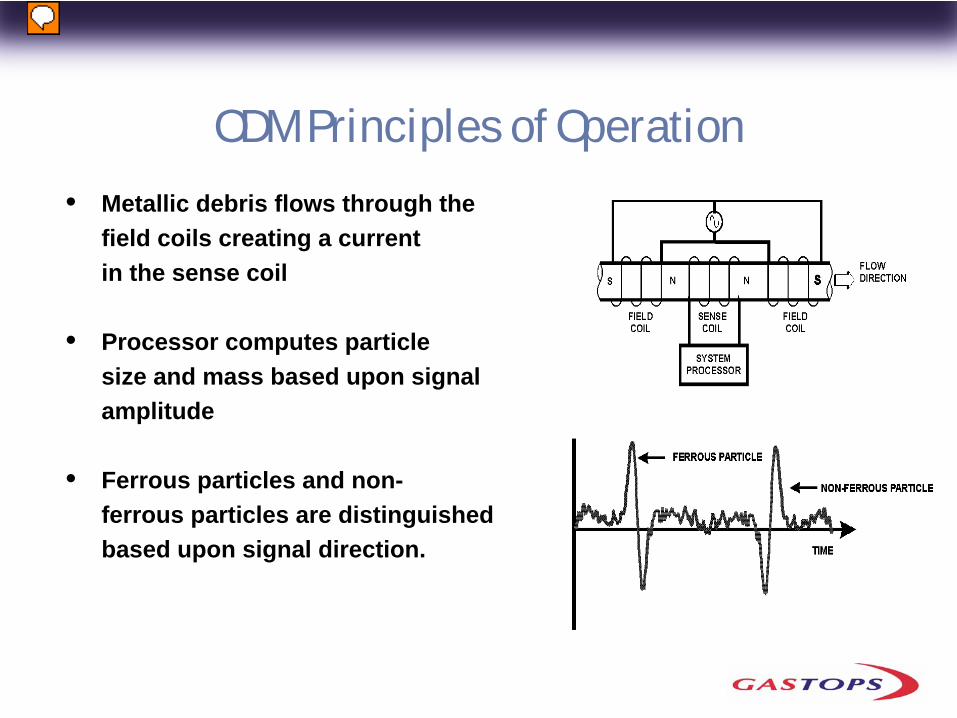
• Metallic debris flows through the field coils creating a current in the sense coil
• Processor computes particle size and mass based upon signal amplitude
• Ferrous particles and non-ferrous particles are distinguished based upon signal direction.
ODM Principles of Operation
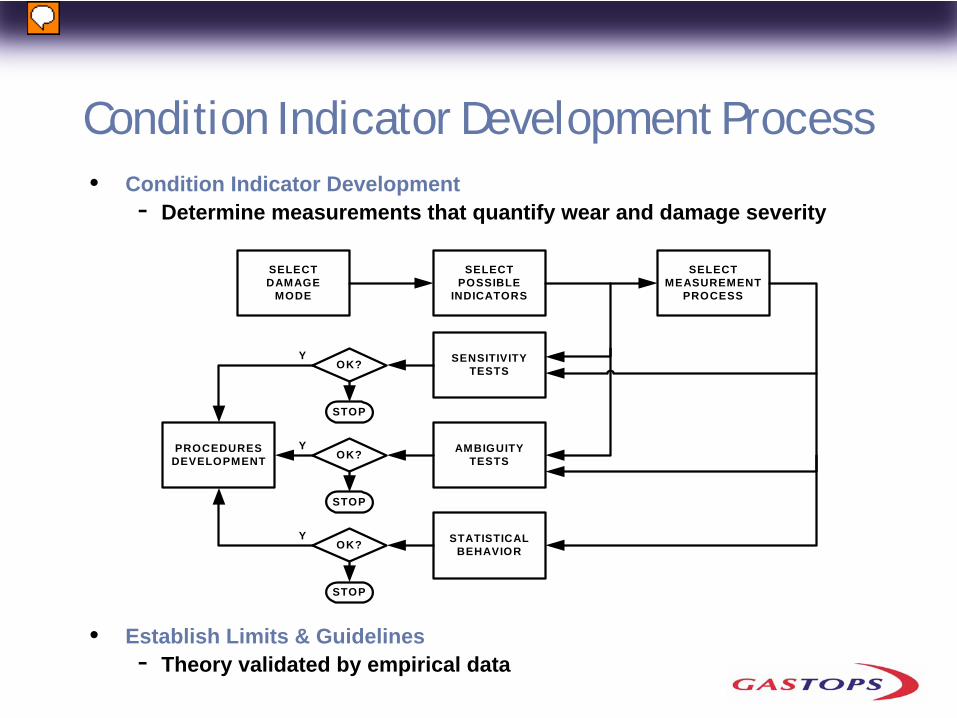
Condition Indicator Development Process• Condition Indicator Development
- Determine measurements that quantify wear and damage severity
• Establish Limits & Guidelines- Theory validated by empirical data
SELECTDAMAGE
MODE
SELECTPOSSIBLE
INDICATORS
SELECTMEASUREMENT
PROCESS
SENSITIVITYTESTS
AMBIGUITYTESTS
STATISTICALBEHAVIOR
OK?
STOP
PROCEDURESDEVELOPMENT OK?
STOP
OK?
STOP
Y
Y
Y
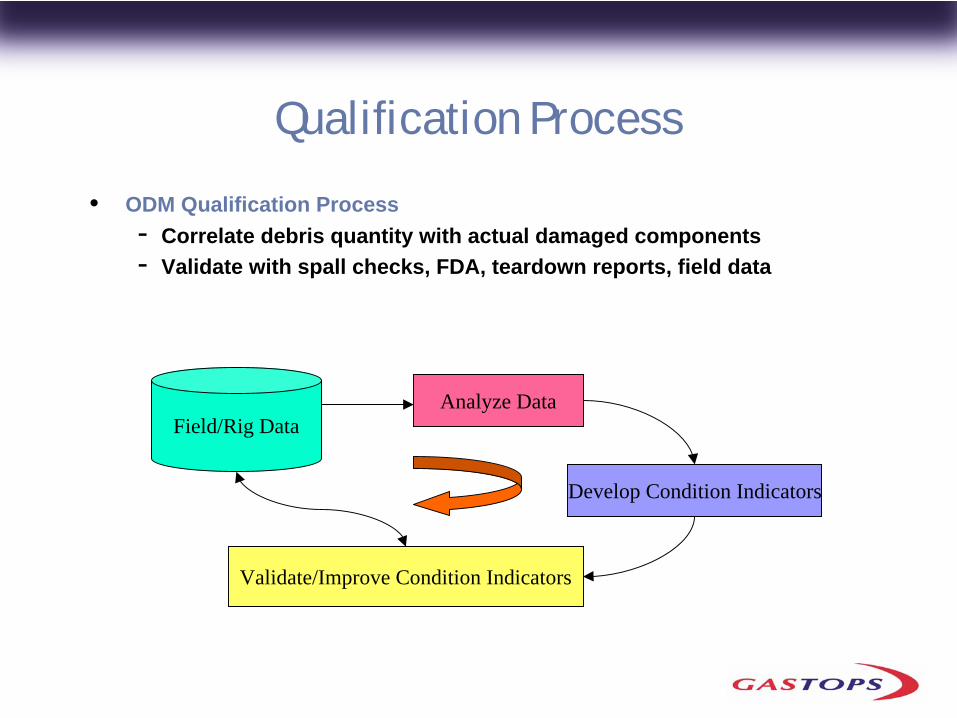
Qualification Process
• ODM Qualification Process- Correlate debris quantity with actual damaged components- Validate with spall checks, FDA, teardown reports, field data
Analyze Data
Develop Condition Indicators
Validate/Improve Condition Indicators
Field/Rig Data

Early Research Results
• Joint program between GasTOPS, National Research Council Canada, and Pratt & Whitney in the early 1990s
• Aircraft bearing test rigs: bearings were run to failure• Data from over 40 bearings (2” to 18” in diameter; ball and roller)• Initial spall generates a few particles ranging small to large in size• Early damage progression is a series a spall growth events, which
are seen as bursts of particles• Later stage failure: damage is more progressive / accelerated
- Rate is dependent on load and speed- Quantity is dependent on size of bearing- Particle size distribution is independent of bearing size
• Reliable alarm limits can be based upon accumulated quantity• Can correlate spall size to quantity of debris
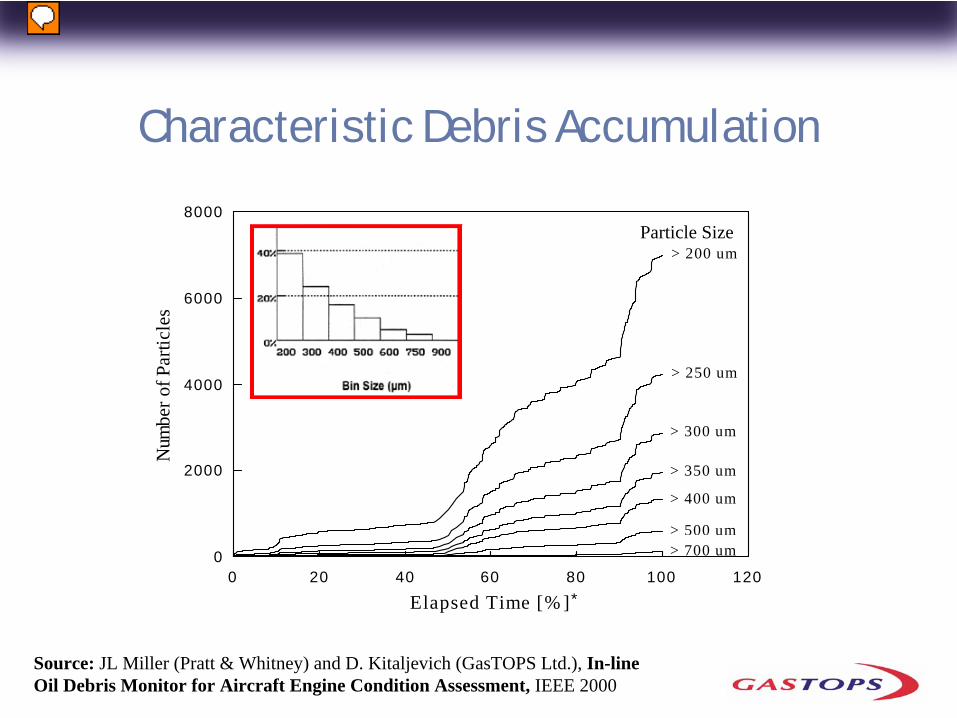
Characteristic Debris Accumulation
0 20 40 60 80 100 1200
2000
4000
6000
8000
Elapsed Time [% ]
Num
ber o
f Par
ticle
s
> 500 um
> 400 um
> 350 um
> 300 um
> 250 um
> 200 um
> 700 um
*
Particle Size
Source: JL Miller (Pratt & Whitney) and D. Kitaljevich (GasTOPS Ltd.), In-line Oil Debris Monitor for Aircraft Engine Condition Assessment, IEEE 2000
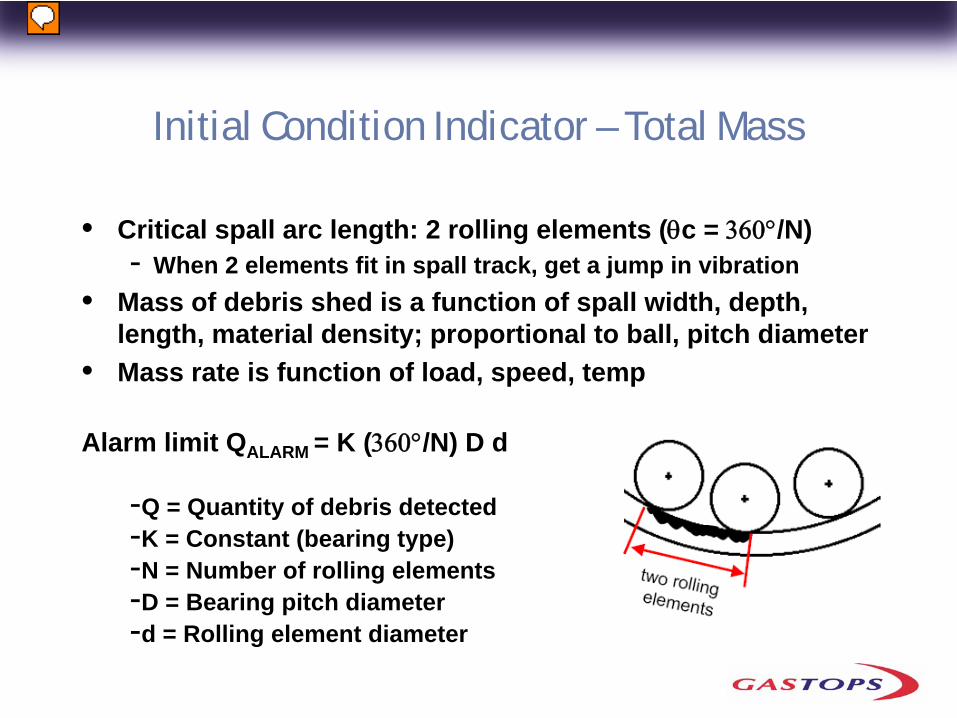
Initial Condition Indicator – Total Mass
• Critical spall arc length: 2 rolling elements (θc = 360°/N)- When 2 elements fit in spall track, get a jump in vibration
• Mass of debris shed is a function of spall width, depth, length, material density; proportional to ball, pitch diameter
• Mass rate is function of load, speed, temp
Alarm limit QALARM = K (360°/N) D d
-Q = Quantity of debris detected-K = Constant (bearing type)-N = Number of rolling elements-D = Bearing pitch diameter-d = Rolling element diameter
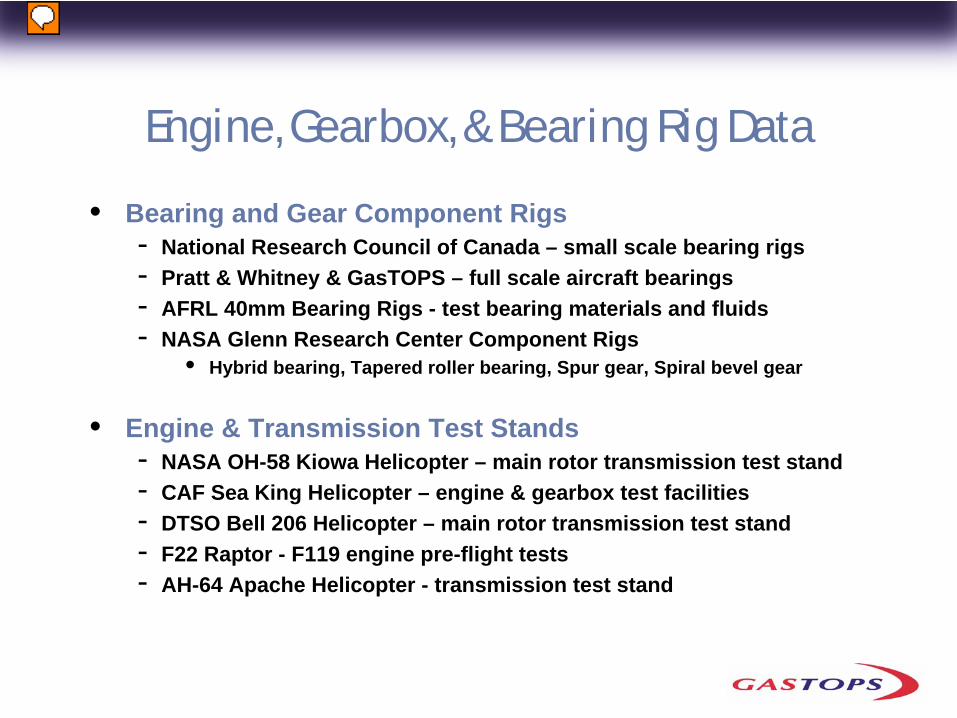
Engine, Gearbox, & Bearing Rig Data
• Bearing and Gear Component Rigs- National Research Council of Canada – small scale bearing rigs- Pratt & Whitney & GasTOPS – full scale aircraft bearings- AFRL 40mm Bearing Rigs - test bearing materials and fluids- NASA Glenn Research Center Component Rigs
• Hybrid bearing, Tapered roller bearing, Spur gear, Spiral bevel gear
• Engine & Transmission Test Stands - NASA OH-58 Kiowa Helicopter – main rotor transmission test stand - CAF Sea King Helicopter – engine & gearbox test facilities- DTSO Bell 206 Helicopter – main rotor transmission test stand- F22 Raptor - F119 engine pre-flight tests - AH-64 Apache Helicopter - transmission test stand
0
20
40
60
80
100
120
140
160
180
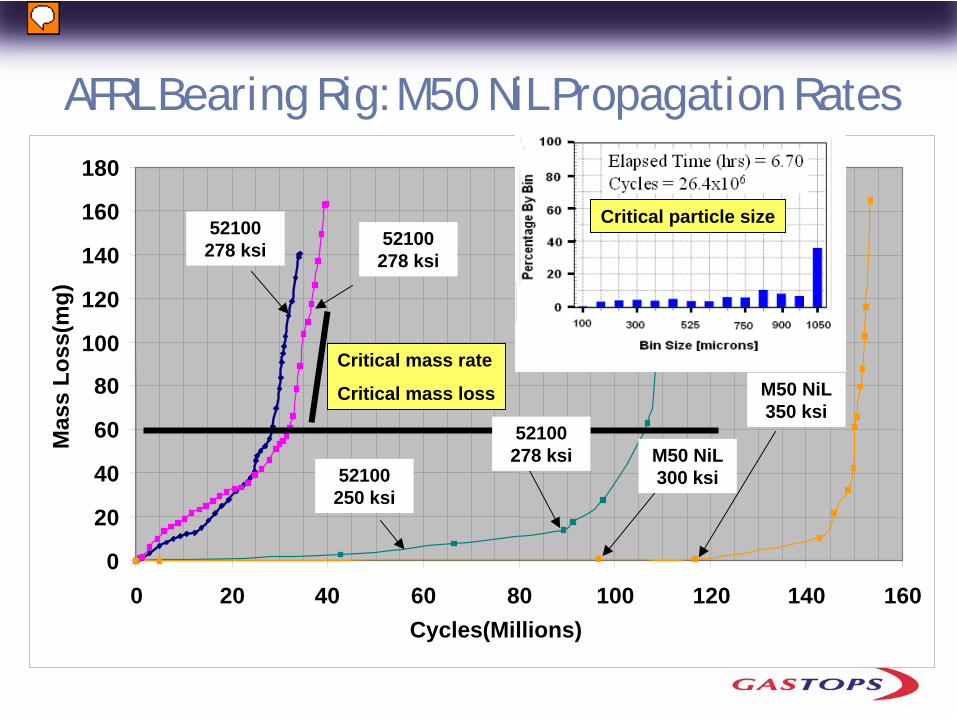
0 20 40 60 80 100 120 140 160Cycles(Millions)
Mas
s Lo
ss(m
g)
52100 278 ksi
52100 278 ksi
52100 250 ksi
M50 NiL 350 ksi
M50 NiL 300 ksi
Critical mass rate
Critical mass loss
52100 278 ksi
AFRL Bearing Rig: M50 NiL Propagation Rates
Critical particle size
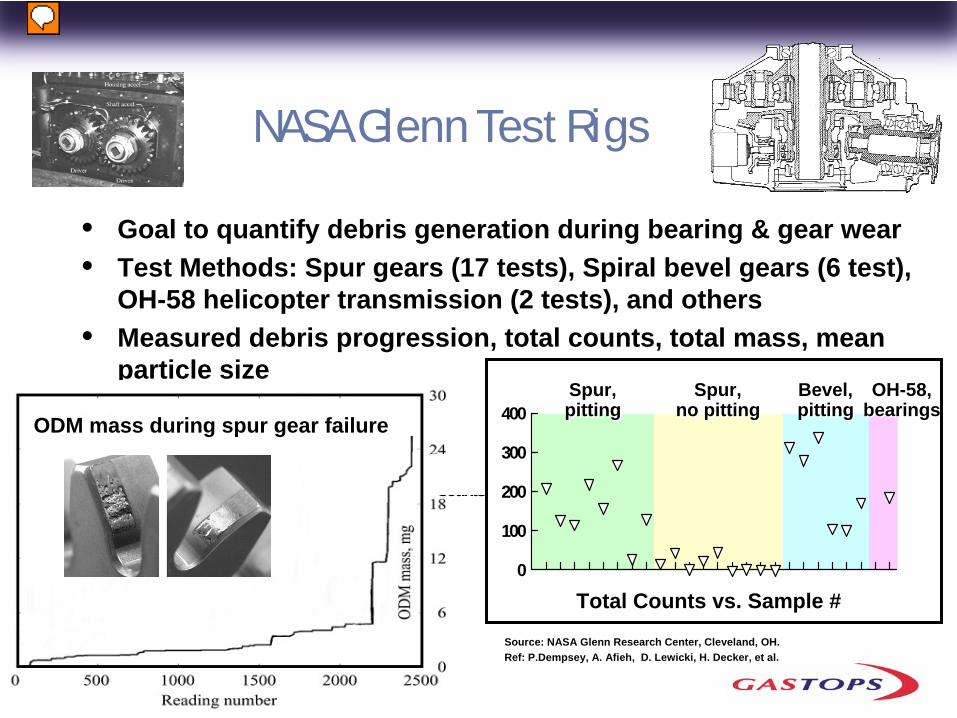
NASA Glenn Test Rigs
• Goal to quantify debris generation during bearing & gear wear• Test Methods: Spur gears (17 tests), Spiral bevel gears (6 test),
OH-58 helicopter transmission (2 tests), and others• Measured debris progression, total counts, total mass, mean
particle size
ODM mass during spur gear failure
Total Counts vs. Sample #
Source: NASA Glenn Research Center, Cleveland, OH.Ref: P.Dempsey, A. Afieh, D. Lewicki, H. Decker, et al.
Counts
0
100
200
300
400Spur,pittingSpur,pitting
Spur,no pitting
Spur,no pitting
Bevel,pittingBevel,pitting
OH-58,bearingsOH-58,
bearings
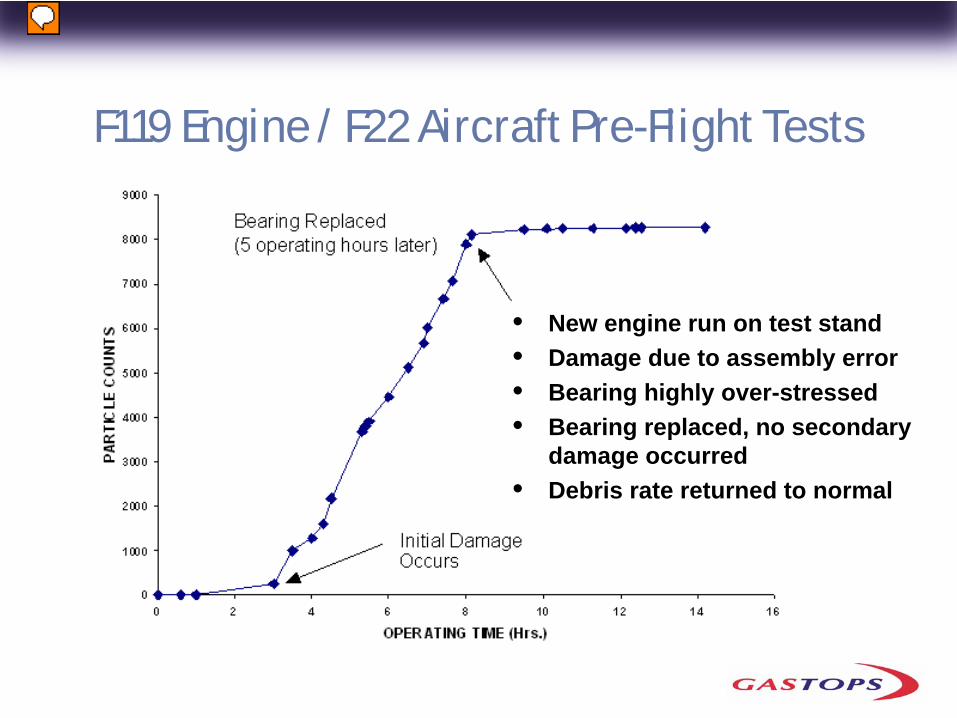
F119 Engine / F22 Aircraft Pre-Flight Tests
• New engine run on test stand• Damage due to assembly error• Bearing highly over-stressed• Bearing replaced, no secondary
damage occurred• Debris rate returned to normal
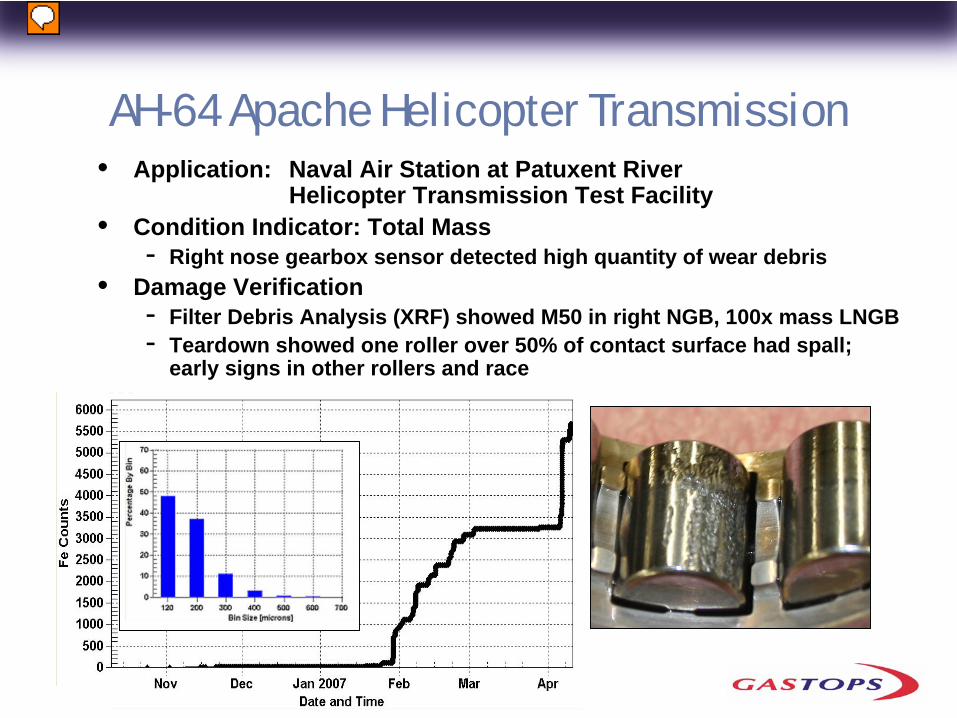
AH-64 Apache Helicopter Transmission• Application: Naval Air Station at Patuxent River
Helicopter Transmission Test Facility• Condition Indicator: Total Mass
- Right nose gearbox sensor detected high quantity of wear debris• Damage Verification
- Filter Debris Analysis (XRF) showed M50 in right NGB, 100x mass LNGB- Teardown showed one roller over 50% of contact surface had spall;
early signs in other rollers and race
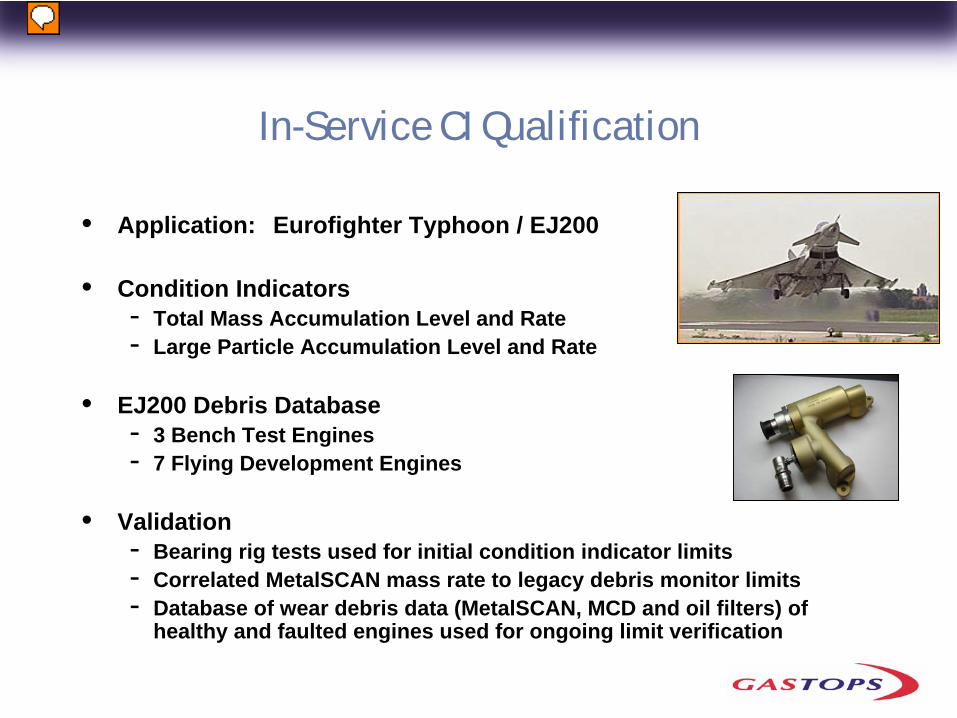
In-Service CI Qualification
• Application: Eurofighter Typhoon / EJ200
• Condition Indicators- Total Mass Accumulation Level and Rate- Large Particle Accumulation Level and Rate
• EJ200 Debris Database- 3 Bench Test Engines- 7 Flying Development Engines
• Validation- Bearing rig tests used for initial condition indicator limits- Correlated MetalSCAN mass rate to legacy debris monitor limits- Database of wear debris data (MetalSCAN, MCD and oil filters) of
healthy and faulted engines used for ongoing limit verification
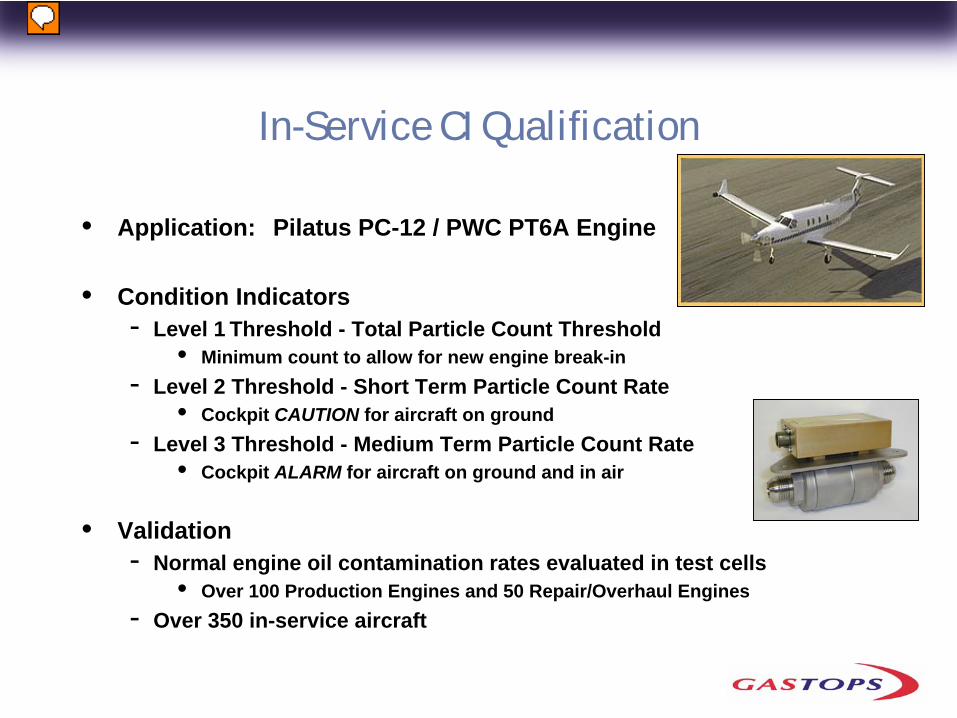
In-Service CI Qualification
• Application: Pilatus PC-12 / PWC PT6A Engine
• Condition Indicators- Level 1 Threshold - Total Particle Count Threshold
• Minimum count to allow for new engine break-in- Level 2 Threshold - Short Term Particle Count Rate
• Cockpit CAUTION for aircraft on ground- Level 3 Threshold - Medium Term Particle Count Rate
• Cockpit ALARM for aircraft on ground and in air
• Validation- Normal engine oil contamination rates evaluated in test cells
• Over 100 Production Engines and 50 Repair/Overhaul Engines- Over 350 in-service aircraft
Summary
• A mature, commercially-available in-line ODM sensor provides quantitative diagnostic and prognostic information about bearing and gear damage
• Over the past 15 years, ODM diagnostic condition indicator formulas have been verified by military and government organizations (DND, AFRL, NASA) and by the OEMs
• Verification process uses parameters including:- Critical mass loss - Critical mass rate- Critical particle size
• GasTOPS is working with AFRL to enhance prognostic capabilities of the ODM sensor algorithms for aircraft engine bearing applications