metal injection moulding of inconel 718 using a water ...etheses.whiterose.ac.uk/12495/1/andrew...
TRANSCRIPT

1
Metal Injection Moulding of Inconel 718 using a
Water Soluble Binder System
Andrew Ben Hales
A thesis submitted in fulfilment of the requirements for the degree of
Master of Philosophy in the Department of Material Science and
Engineering
The University of Sheffield
(July 2015)
2
Abstract
Inconel 718 components are typically cast or machined from solid in various industries. The
properties of Inconel 718 make the processing of small complex parts very difficult.1–4 There
is an emerging interest in metal injection moulding (MIM) of Inconel 718.5–11
MIM is a manufacturing process best used for the batch production of small complex
components. The process involves mixing fine metal powders with a series of binder
components to produce a pelletised feedstock. This feedstock can then be processed using
an injection moulding machine to produce moulded parts. The parts then need to be solvent
debinded and then sintered close to the melting temperature to fully densify the metal
powder.
Polyethylene glycol (PEG) is a common component of water soluble feedstock for metal
injection moulding. The processability of Inconel 718 MIM feedstocks using PEG with varying
molecular weight was investigated in this work.
Inconel 718 powder was formulated with different molecular weight PEG, poly (methyl
methacrylate) (PMMA) and stearic acid (SA) to produce a homogenous pelletized feedstock.
The powder loading for each feedstock as well as the concentration of PMMA and SA were
unchanged for the entirety of this work, the only variable being the molecular weight of PEG
used.
The rheological behaviour of each of these feedstocks was analysed to determine injection
moulding parameters and stability. Investigations into the mouldability of tensile bar
components, differential scanning calorimetry (DSC) characteristics as well as debinding
behaviour were all carried out.
Parts were sintered and heat treated with density and dimensional measurements taken
throughout, in order to identify the effect of PEG molecular weight on the different
processing steps.
Metallography and mechanical testing was carried out to compare the properties of each
feedstock with industrial standards.
One of the key findings from this work was that the molecular weight of PEG used had an
effect on the debinding time of the moulded parts. Parts moulded from a higher molecular

3
weight PEG require a longer period of time in a water bath in order to achieve 100% weight
loss.
It was found that a debinding temperature of 40°C produces sintered parts with a higher
density, compares with debinding at 50°C or 60°C.
There was no trend in sintered density across the different molecular weights of PEG, when
the same debinding temperature was used. This was the same for the mechanical testing
results, which showed no clear trend across the range of parts.
The mechanical properties of the injection moulded tensile bars exceed the properties of
AMS 5383 (for cast specimens) and are inferior to AMS 5662 (wrought specimens).
The mechanical properties are also currently inferior to that of MIM standard AMS 5917,
however HIP’ing of the components could improve the mechanical strength and this could
result in the standards being met.

4
Table of Contents
Abstract .................................................................................................................................... 2
List of Figures ........................................................................................................................... 7
List of Tables .......................................................................................................................... 10
1. Introduction and Aims ....................................................................................................... 11
2. Literature Review ........................................................................................................... 12
2.1. Inconel 718 ............................................................................................................. 12
2.1.1. Chemical and Physical Properties .................................................................. 12
2.1.2. Heat Treatment of Inconel 718 ...................................................................... 13
2.1.3. MIM of Inconel 718 ........................................................................................ 13
2.2. MIM Powders ......................................................................................................... 14
2.2.1. Atomising Techniques .................................................................................... 14
2.2.1.1. Gas Atomisation ..................................................................................... 14
2.2.1.2. Water Atomisation ................................................................................. 15
2.2.2 Powder Characteristics .................................................................................. 16
2.2.2.1 Effect of Powder Size ................................................................................. 16
2.2.2.2. Effect of Powder Morphology ................................................................ 17
2.3. The Metal Injection Moulding Process .................................................................. 17
2.3.1. Introduction ................................................................................................... 17
2.3.2. Binder Systems ............................................................................................... 18
2.3.3. Mixing ............................................................................................................. 21
2.3.4. Injection Moulding ......................................................................................... 22
2.3.5. Debinding ....................................................................................................... 24
2.3.6. Sintering ......................................................................................................... 25
3. Experimental Procedure ................................................................................................ 29
3.1. Introduction ........................................................................................................... 29
3.2. Materials ................................................................................................................ 29
5
3.2.1. Inconel 718 ..................................................................................................... 29
3.2.2. Binder components ........................................................................................ 29
3.3. Production of Feedstock ........................................................................................ 30
3.3.1. Feedstock Recipe ........................................................................................... 30
3.3.2. Mixing ............................................................................................................. 31
3.3.3. Pelletisation.................................................................................................... 32
3.4. Rheology ................................................................................................................ 34
3.5. Injection Moulding of Tensile Bars ........................................................................ 34
3.6. Dimensional and Density Measurements of Moulded Samples ............................ 36
3.7. Recycling of Feedstock ........................................................................................... 36
3.8. Water Debinding .................................................................................................... 37
3.9. Sintering ................................................................................................................. 37
3.10. Dimensional and Density Measurements of Sintered Samples ......................... 39
3.11. Heat Treatment .................................................................................................. 39
3.12. Dimensional and Density Measurements of Heat Treated Samples ................. 41
3.13. Metallography of All Samples ............................................................................ 41
3.14. Tensile Testing.................................................................................................... 44
4. Experimental Results and Discussion ............................................................................. 46
4.1. Materials ................................................................................................................ 46
4.1.1. Inconel 718 ..................................................................................................... 46
4.1.2. Binder components ........................................................................................ 47
4.2. Rheology ................................................................................................................ 49
4.3. Injection Moulding of Tensile Bars ........................................................................ 54
4.4. Water Debinding .................................................................................................... 58
4.5. Sintering ................................................................................................................. 68
4.6. Dimensional and Density Measurements of Sintered Samples ............................. 68
4.7. Heat Treatment ...................................................................................................... 71

6
4.8. Dimensional and Density Measurements of Heat Treated Samples ..................... 72
4.9. Microstructure Investigation ................................................................................. 73
4.10. Tensile Testing.................................................................................................... 75
5. Conclusions .................................................................................................................... 78
6. References ..................................................................................................................... 79
7
List of Figures
Figure 2.1 Turbocharger component manufactured by GKN Sinter Metals 20...................................... 14
Figure 2.2 Secondary electron microscopy image showing the morphology of gas atomised 316L
stainless steel 27 .................................................................................................................................... 15
Figure 2.3 Z-blade mixer (left) and a twin screw extruder (right) 48,49 .................................................. 21
Figure 2.4 Arburg ALLROUNDER 270C injection moulding machine 50 ................................................. 22
Figure 2.5 The injection moulding cycle 51 ............................................................................................ 23
Figure 2.6 Schematic of powder sintering evolution of MIM components 25 ....................................... 26
Figure 2.7 Part progression: moulded part (left), debinded part (middle) and sintered part (right) 55
(sintered part height = 25mm) ............................................................................................................. 26
Figure 2.8 Batch sintering furnace (TAV H5) 56 ..................................................................................... 28
Figure 3.1 Malvern Mastersizer 3000 ................................................................................................... 29
Figure 3.2 Perkin Elmer Pyris 6 DSC ...................................................................................................... 30
Figure 3.3 Pelletised Inconel 718 feedstock after being extruded twice by the Arburg Injection
Moulding Machine, using the Sheffield binder system recipe .............................................................. 33
Figure 3.4 Rosand RH2000 Malvern capillary rheometer .................................................................... 34
Figure 3.5 Die cavity for MIM tensile test piece 57 ................................................................................ 35
Figure 3.6 Thermal debinding and sintering profile for Inconel 718 .................................................... 38
Figure 3.7 Mettler Toledo New Classic Archimedes scale .................................................................... 39
Figure 3.8 Solution treatment and ageing profile for Inconel 718 in accordance with AMS 5917 -11 . 40
Figure 3.9 Cut position for mounted tensile bars ................................................................................. 41
Figure 3.10 Struers Tegramin-20 grinding and polishing machine ...................................................... 41
Figure 3.11 Nikon Eclipse LV150 microscope ....................................................................................... 43
Figure 3.12 Zwick/Roell Z050 tensile testing machine ......................................................................... 44
Figure 3.13 Extensometer camera image showing how the specimens were clamped ....................... 45
Figure 4.1 Particle size distribution of the Inconel 718 powder. .......................................................... 46
Figure 4.2 Secondary electron image of the Inconel 718 powder used in this work 6 .......................... 47
Figure 4.3 DSC trace for PEG 1500, showing the onset and endset of the peak .................................. 49
Figure 4.4 Rheology of PEG 1500 Inconel 718 feedstock ...................................................................... 50
8
Figure 4.5 Rheology of PEG 4000 Inconel 718 feedstock ...................................................................... 50
Figure 4.6 Rheology of PEG 6000 Inconel 718 feedstock ...................................................................... 51
Figure 4.7 Rheology of PEG 8000 Inconel 718 feedstock ...................................................................... 51
Figure 4.8 Rheology of PEG 10000 Inconel 718 feedstock.................................................................... 52
Figure 4.9 Rheology of PEG 12000 Inconel 718 feedstock.................................................................... 52
Figure 4.10 Rheology of PEG 20000 Inconel 718 feedstock.................................................................. 53
Figure 4.11 Line gradient for each PEG for rheology measured at 120°C ............................................ 53
Figure 4.12 Inconel 718 sample moulded using PEG 1500 flat part showing powder separation
(injection point on left hand side of image) ......................................................................................... 54
Figure 4.13 Injection moulded tensile bar using PEG 20000 ................................................................ 58
Figure 4.14 The effect of water temperature on the debinding rate PEG 1500 feedstock ................... 58
Figure 4.15 The effect of water temperature on the debinding rate PEG 4000 feedstock ................... 59
Figure 4.16 The effect of water temperature on the debinding rate PEG 6000 feedstock ................... 59
Figure 4.17 The effect of water temperature on the debinding rate PEG 8000 feedstock ................... 60
Figure 4.18 The effect of water temperature on the debinding rate PEG 10000 feedstock ................. 60
Figure 4.19 The effect of water temperature on the debinding rate PEG 12000 feedstock ................. 61
Figure 4.20 The effect of water temperature on the debinding rate PEG 20000 feedstock ................. 61
Figure 4.21 Defects caused to PEG 1500 parts during debinding at 60°C ............................................ 62
Figure 4.22 The effect of PEG molecular weight on the debinding time at 40°C.................................. 63
Figure 4.23 The effect of PEG molecular weight on the debinding time at 50°C.................................. 63
Figure 4.24 The effect of PEG molecular weight on the debinding time at 60°C.................................. 64
Figure 4.25 ln(1/F) plot to show two stage debinding mechanism for PEG 1500 at 40°C .................... 64
Figure 4.26 ln(1/F) plot to show two stage debinding mechanism for PEG 1500 increasing water
temperatures ........................................................................................................................................ 65
Figure 4.27 ln(1/F) plot to show dissolution mechanism for PEG 1500 at increasing water
temperatures ........................................................................................................................................ 66
Figure 4.28 ln(1/F) plot to show dissolution mechanism for PEG 6000, PEG 12000 and PEG 20000 at
40°C ...................................................................................................................................................... 67
Figure 4.29 Part density after sintering for each debinding temperature ............................................ 70

9
Figure 4.30 Inconel 718 tensile bars for PEG 20000, as moulded (left), debinded (middle) and sintered
(right) ................................................................................................................................................... 71
Figure 4.31 Optical micrograph of Inconel 718 PEG 2000 sample; (a) and (b) as sintered, (c) and (d)
after solution treatment and ageing as per AMS 5917 -2011. ............................................................. 74
Figure 4.32 0.2% proof stress and ultimate tensile strength of tested samples................................... 76
Figure 4.33 MIM of Inconel 718 0.2% P.S and UTS in comparison with industrial standards .............. 77
10
List of Tables
Table 2.1 Chemical Composition specification of Inconel 718 in accordance with AMS 5917-2011 19 12
Table 2.2 Required Attributes for a MIM binder system 25 ................................................................... 18
Table 2.3 The University of Sheffield Binder System for MIM .............................................................. 20
Table 2.4 Debinding classification and techniques 25 ........................................................................... 24
Table 2.5 Sintering process effects (adapted from German25) ............................................................. 27
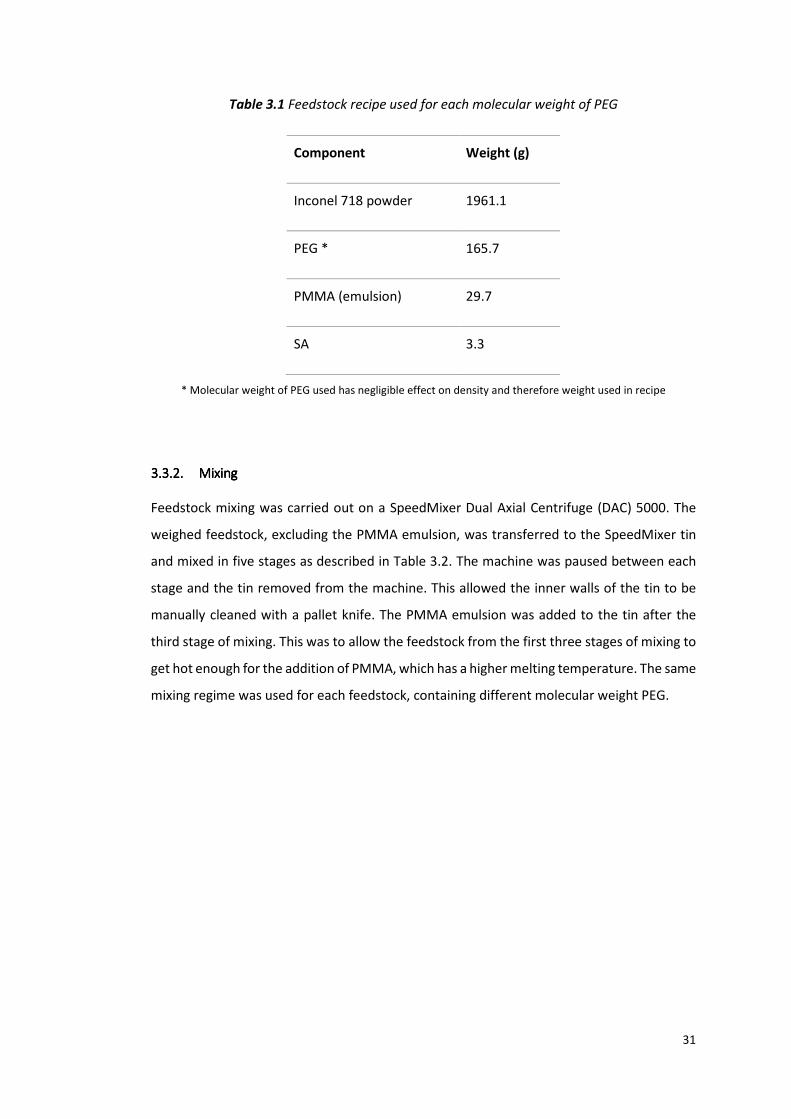
Table 3.1 Feedstock recipe used for each molecular weight of PEG .................................................... 31
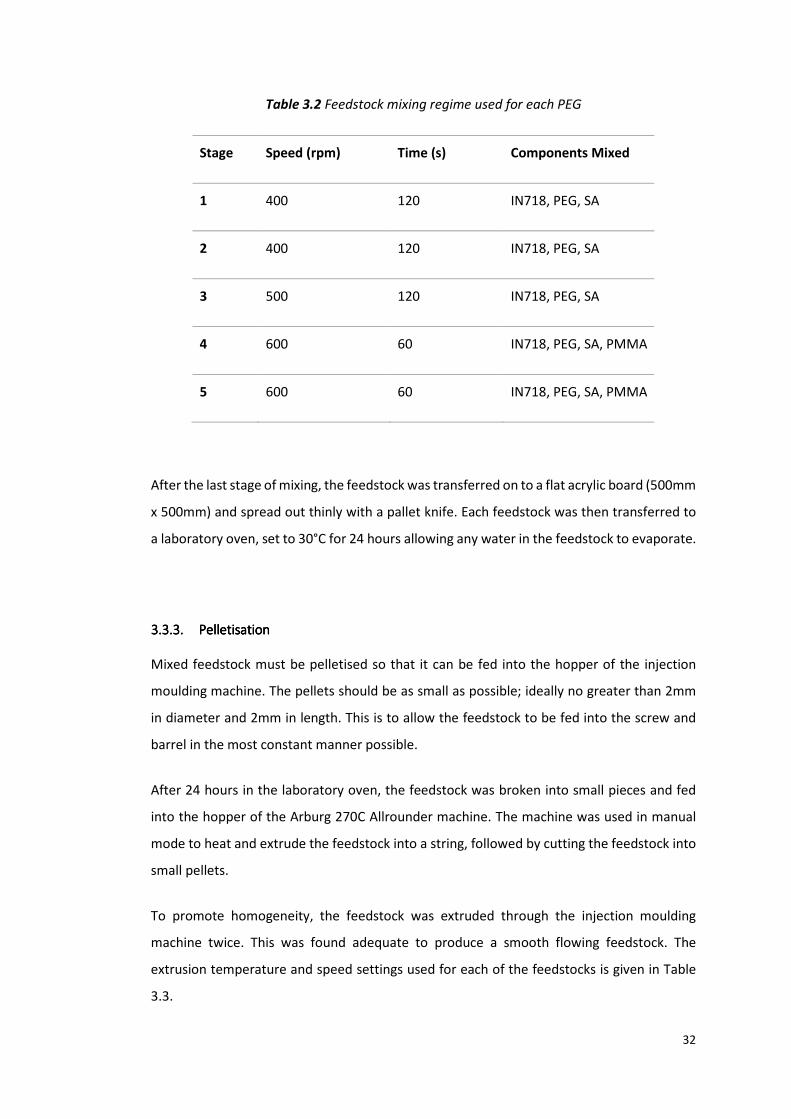
Table 3.2 Feedstock mixing regime used for each PEG ........................................................................ 32
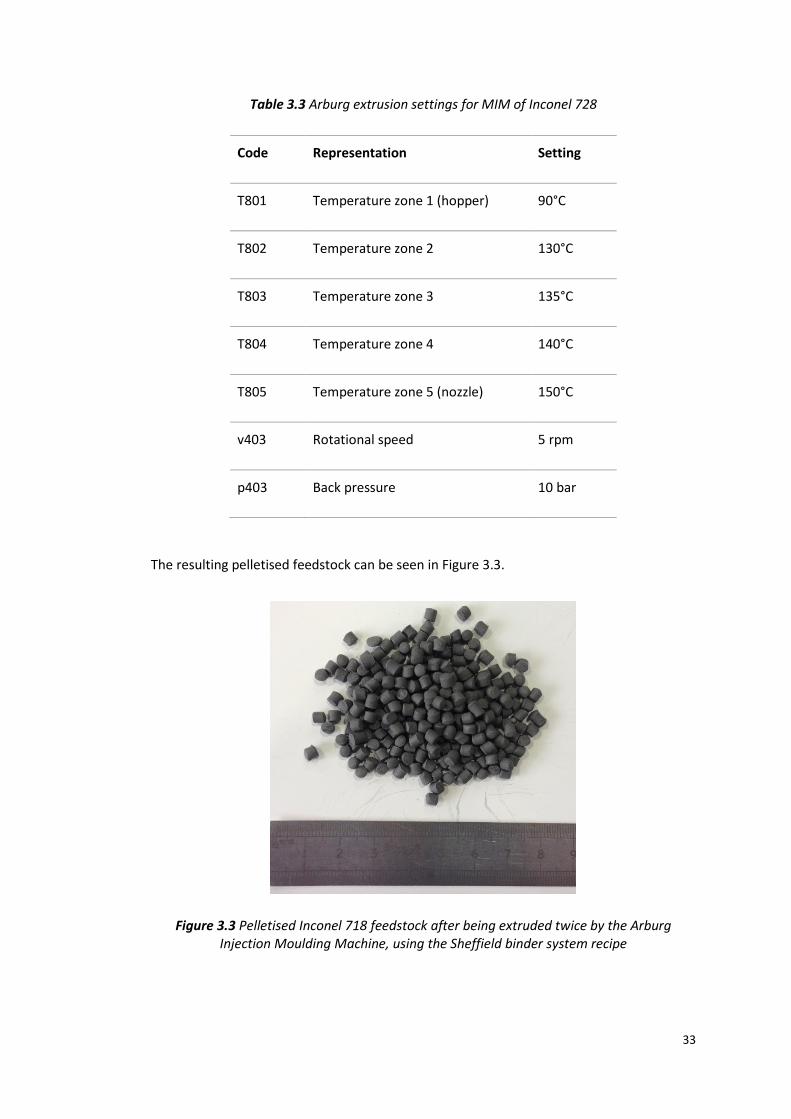
Table 3.3 Arburg extrusion settings for MIM of Inconel 728 ................................................................ 33
Table 3.4 Injection moulding parameters for MPIF ISO 2740 tensile bars ........................................... 36
Table 3.5 Thermal debinding and sintering cycle for Inconel 718 ........................................................ 38
Table 3.6 Solution treatment profile for Inconel 718 ........................................................................... 40
Table 3.7 Ageing profile for Inconel 718 .............................................................................................. 40
Table 3.8 Grinding and Polishing method for Inconel 718 samples ..................................................... 42
Table 3.9 Glycerigia composition and application ............................................................................... 43
Table 4.1 Particle size distribution parameters of Inconel 718 gas atomised powder ......................... 47
Table 4.2 Melting point range for PEG determined by DSC .................................................................. 48
Table 4.3 Injection moulding settings of Inconel 718 feedstock used for moulding of tensile bars ..... 55
Table 4.4 Injection moulded dimensions and weight for all feedstocks ............................................... 57
Table 4.5 Trend line gradient for PEG 6000, PEG 12000 and PEG 20000 for dissolution and diffusion
stage of water debinding ..................................................................................................................... 67
Table 4.6 Average dimensions, shrinkage and density changes after sintering ................................... 69
Table 4.7 Inconel 718 density comparison of sintered and heat treated tensile bars using different
molecular weight PEG .......................................................................................................................... 72
Table 4.8 Inconel 718 solution treated and aged mechanical properties of tensile bars ..................... 75
11
1. Introduction and Aims
The University of Sheffield has been using a well-established binder system for MIM
feedstocks for a number of years.2,7,12–15 This system has three parts, comprising of; PEG (83
wt %), PMMA (15 wt %) and SA (2 wt %). The molecular weight of PEG typically used is PEG
1500.
The injection moulding process can be challenging when using feedstocks formulated from
PEG 1500. The high fluidity of PEG 1500 at higher temperatures can cause separation of the
metal particles and the binder, resulting in parts that contain voids or a poor surface finish.
PEG 1500 feedstock also has a higher cooling time in the mould after injection. The injection
moulded parts also have a weak structure and can easily be broken during ejection from the
mould tool, or transportation.
The molecular weight of PEG will have an overall effect on the processing properties of the
feedstock, in terms of; mouldability, cooling time after injection, part strength after
moulding, debinding time and temperature required as well as, part stability and strength
during debinding. The aim of this work is to measure and evaluate these factors by mixing
different feedstocks.
12
2. Literature Review
2.1. Inconel 718
Inconel 718 is a nickel-based superalloy mainly used for demanding, high temperature
applications in the aerospace, petrochemical, automotive and nuclear industry. 2,16
Inconel 718 is typically produced by forging as well as ingot casting, followed by investment
casting. However, production via these methods often produce undesirable side-effects,
such as; elemental segregation, formation of laves, white-spots and freckles, rough surface
finish and low dimensional accuracy. 6,9,17,18
2.1.1.2.1.1.2.1.1.2.1.1. Chemical and Physical PropertiesChemical and Physical PropertiesChemical and Physical PropertiesChemical and Physical Properties
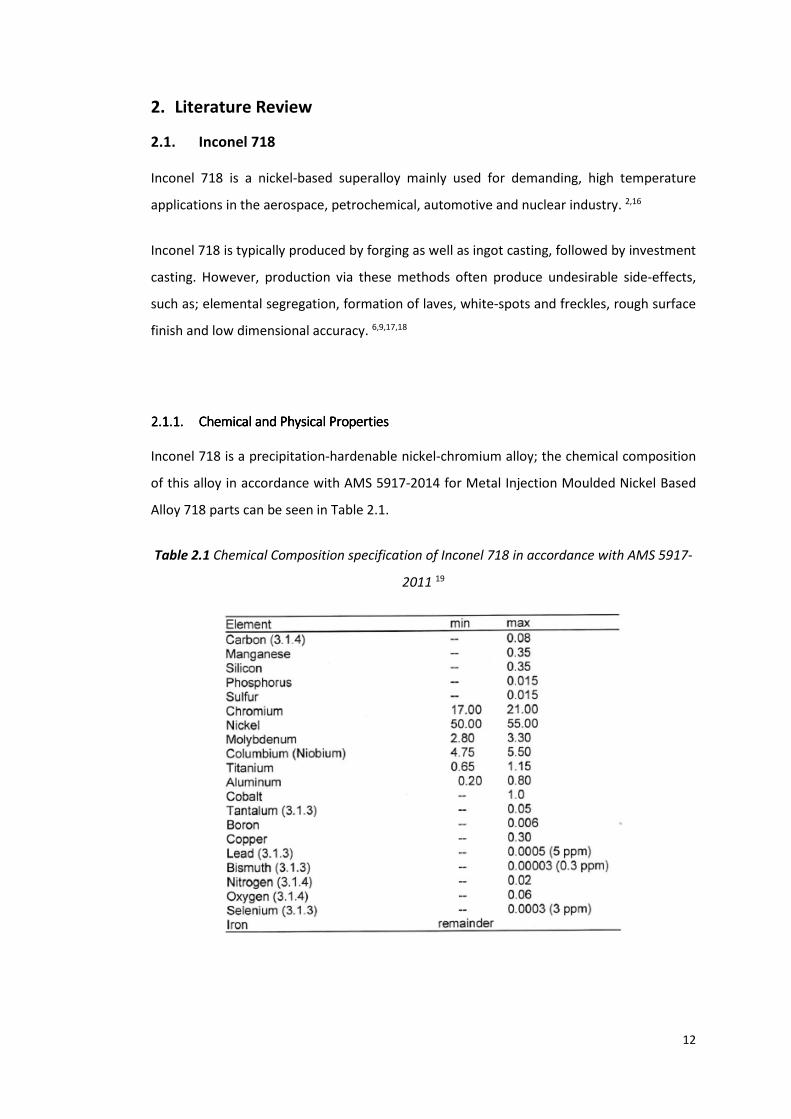
Inconel 718 is a precipitation-hardenable nickel-chromium alloy; the chemical composition
of this alloy in accordance with AMS 5917-2014 for Metal Injection Moulded Nickel Based
Alloy 718 parts can be seen in Table 2.1.
Table 2.1 Chemical Composition specification of Inconel 718 in accordance with AMS 5917-
2011 19
13
Components produced from Inconel 718 are typically cast or machined from solid. Inconel
718 is in general very difficult to machine because of the following aspects 2;
• Elevated temperature strength
• High hardness (30 – 40 Rockwell C)
• High work hardening rates
• Low thermal diffusivity leading to high temperatures during machining
• Presence of highly abrasive carbide particles due to tool wear
2.1.2.2.1.2.2.1.2.2.1.2. Heat TreatmentHeat TreatmentHeat TreatmentHeat Treatment of Inconel 718of Inconel 718of Inconel 718of Inconel 718
For the majority of applications and industries, Inconel 718 is specified as a solution treated
and aged alloy. 3
Solution treating is a heat treatment process that produces uniformly dispersed particles
(precipitates) within the microstructure of the alloy. The precipitates improve the
microstructure by hindering the movement of dislocations and therefore improving strength.
3,4
Inconel 718 is hardened by the formation of aluminium, titanium and niobium and is induced
by heat treating in a temperature range of 600°C – 815°C. In order for these precipitates to
form correctly, the ageing constituents must be solution annealed at 930°C - 1010°C,
followed by a rapid cooling, plus precipitation hardening at 1720°C for 8 hours, furnace cool
to 620°C and hold for 18 hours, followed by air cooling to room temperature. 3,6
2.1.3.2.1.3.2.1.3.2.1.3. MIM of Inconel 718MIM of Inconel 718MIM of Inconel 718MIM of Inconel 718
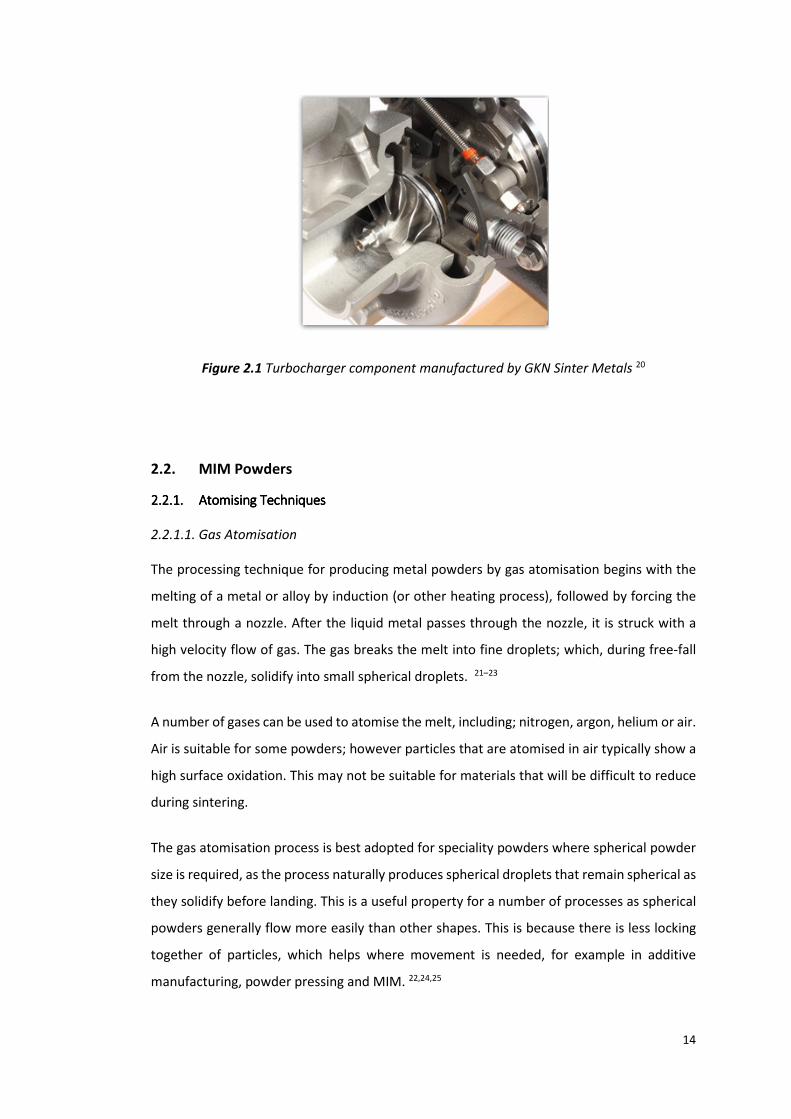
There is an emerging commercial interest in the MIM of nickel based superalloys such as
Inconel 718. This interest has largely been driven by the automotive and aerospace
industries, for the production of complex components capable of working at high
temperature.9 Figure 2.1 shows an Inconel 718 turbocharger component currently
manufactured using MIM by GKN Sinter Metals (www.gkn.com/sintermetals). The MIM
feedstock and conditions for processing these parts has not been revealed.
14
Figure 2.1 Turbocharger component manufactured by GKN Sinter Metals 20
2.2. MIM Powders
2.2.12.2.12.2.12.2.1.... Atomising Atomising Atomising Atomising TechniquesTechniquesTechniquesTechniques
2.2.1.1. Gas Atomisation
The processing technique for producing metal powders by gas atomisation begins with the
melting of a metal or alloy by induction (or other heating process), followed by forcing the
melt through a nozzle. After the liquid metal passes through the nozzle, it is struck with a
high velocity flow of gas. The gas breaks the melt into fine droplets; which, during free-fall
from the nozzle, solidify into small spherical droplets. 21–23
A number of gases can be used to atomise the melt, including; nitrogen, argon, helium or air.
Air is suitable for some powders; however particles that are atomised in air typically show a
high surface oxidation. This may not be suitable for materials that will be difficult to reduce
during sintering.
The gas atomisation process is best adopted for speciality powders where spherical powder
size is required, as the process naturally produces spherical droplets that remain spherical as
they solidify before landing. This is a useful property for a number of processes as spherical
powders generally flow more easily than other shapes. This is because there is less locking
together of particles, which helps where movement is needed, for example in additive
manufacturing, powder pressing and MIM. 22,24,25

15
The use of inert gas during the gas atomisation makes the process as a whole quite costly,
compared with other methods. The process requires a more complex system, resulting in a
higher capital and running costs. 26
Figure 2.2 shows a typical Scanning Electron Microscope (SEM) image of a gas atomised
powder. Particles produced from this process can be seen to have a high spherical uniformity
and also have a high surface purity and a high packing density.
Figure 2.2 Secondary electron microscopy image showing the morphology of gas atomised
316L stainless steel 27
2.2.1.2. Water Atomisation
An alternative method is water atomisation where a stream of molten metal is struck with a
high velocity spray of water. The water pressure can be increased/decreased to respectively
change the size of the particles produced from the process. The water atomisation process
yields irregular shaped particles with a rough surface. The solidification of the metal powders
occurs quickly after impact with the jet of water resulting in the metal particles having a
turbulent and irregular shape, as they are not allowed to cool naturally and form rounded
shapes. 7,22,24,28
When used in MIM feedstocks, the irregular shaped particles produced from water atomised
powders can inhibit feedstock flow during injection moulding. 25 However Kipphut and
German (1991) reported that injection moulded parts produced from water atomised
powder have better shape retention because of increased interlocking between irregular
shaped particles, as compared to spherical particles produced from gas atomisation. 29

16
Figure 2.3 shows a typical Scanning Electron Microscope (SEM) image of a water atomised
powder.
Figure 2.3 Secondary electron image showing the morphology of water atomised 316L
stainless steel 30
2.2.2.2.2.2.2.2.2222 Powder Powder Powder Powder CharacteristicsCharacteristicsCharacteristicsCharacteristics
2.2.2.1 Effect of Powder Size
Metal powders for conventional powder metallurgy applications can be commercially
obtained with typical sizes in the range of 20µm – 200µm. 15,25
For the purpose of MIM, finer powders are required to ensure suitable flow behaviour and
rapid sintering. However there are conflicting opinions amongst professionals with regards
to the optimum particle size and distribution.
Martyn suggests that particle sizes up to 45µm could be used for the MIM process.31 The
same opinion is shared by Hartwig who states that if powders were used with a size greater
than 45µm, there would be an inherent lack of sintering activity. 22
An alternative view is that the mean particle size should remain below 8µm when moulding
parts with a sintered weight of 75g or less. Powders with a greater particle size should be
used when moulding heavier parts, this would allow the green part to perform better during
the debinding stage. 32
17
German also agrees that the best mean particle size for the MIM process should be between
2µm - 8µm. 25 Using fine powders within this range generally allows sintering to occur more
readily due to a greater surface area between particles. Using finer powders would also yield
a greater finished part density. 25 The disadvantage of using fine powders would be the
difficulty in handling. For example additional safety precautions would need to be taken to
prevent inhilation of powders during mixing.
2.2.2.2. Effect of Powder Morphology
The shape of metal powders can have a significant effect on the final properties of the
sintered MIM part. Powder shape can also affect flow characteristics during moulding.28,33–36
German explains that spherical powders are widely preferred in MIM because of the high
packing densities that can be achieved in the injection moulding process. 25 There is also
reduced inter-particle friction giving the feedstock better flow characteristics, as compared
to irregular shaped particles. 29
2.3. The Metal Injection Moulding Process
2.3.1.2.3.1.2.3.1.2.3.1. IntroductionIntroductionIntroductionIntroduction
Metal injection moulding (MIM) is becoming a widely exploited and cost effective
manufacturing technology for the production of complex components in a variety of metallic
materials.
MIM is a manufacturing process that involves the manipulation of fine metal powders, so
that they flow and can be processed using technology developed for polymers. This is
achieved through mixing metal powders with a series of polymer/wax binders, to form a
feedstock. 15 The feedstock produced can be processed by an injection moulding machine,
which would conventionally be used for plastics. Parts produced from the injection moulding
process are subjected to further process steps to remove the polymer from the part,
followed by a sintering operation to fully densify the metal particles. Standard heat
treatment processes, machining, plating or anodising can be applied to the part where
necessary after sintering.

18
2.3.2.2.3.2.2.3.2.2.3.2. Binder SystemsBinder SystemsBinder SystemsBinder Systems
The role of the binder system within MIM feedstock is to transport the fine metal particles
into the mould cavity, to form the required part shape. The binder must then solidify to allow
the part to be ejected from the mould without fracture and be able to withstand handling
and transportation for further process steps.
Most binder systems are comprised of multiple components, in order to deal with the
conflicting requirements within the MIM process. For example, one component of the binder
system makes the mixture fluid at elevated temperatures to allow injection. Other
components in the binder act as a “backbone” to ensure the part is transportable after
debinding and stable during sintering. Small additions of surfactants or wetting agents are
added to coat the metal particles ensuring a more homogenous feedstock.
Some of the required binder attributes can be found in Table 2.2.
Table 2.2 Required Attributes for a MIM binder system 25
Powder Interaction
• Low contact angle with powder
• Good adhesion with powder
• Chemically passive (non-reactive with powder)
Flow Characteristics
• Low viscosity (< 10 Pa/s) at mould tool temperature
• Fast cooling after injection
• Rigid after cooling
Debinding
• Multiple components with different characteristics
• Non-corrosive and non-toxic during decomposition
• Decomposition above moulding and mixing temperatures
Commercial
• Inexpensive and commercially available
• Long shelf life
• Non-degradable

19
Binder systems for MIM can be categorised into two groups; wax based binders and polymer
based binders. 24
Work was carried out by Mobellegh et al into the use of a paraffin wax based binder system
for the injection moulding of copper. 37 The binder system also included polyethylene and
stearic acid as a backbone binder and surfactant respectively. The work found that the main
advantages of a wax based binder system is the ease of processing the feedstock, combined
with a short solvent debinding time. However, there are issues when using wax based
binders during mould ejection and part handling. Parts are considered far more delicate and
as a consequence, proper location and sizing of ejector pins for part ejection and a good
surface finish of mould tool are required. 38
According to work carried out by Adames, polymer based binder systems have several
advantages over wax based systems. 24 This includes better flow characteristics and part
strength after moulding, the possibility of sequential debinding and better shape retention
during debinding.
Polymer binder systems based on a water soluble polymer provide an economical advantage
over polymers requiring liquid or gaseous nitric acid as the debinding solvent. 39 The use of
common debinding solvents such as nitric acid can be flammable, carcinogenic and not
environmentally acceptable. Water soluble feedstock for MIM is now commercially available
from a number of suppliers in a range of materials. These companies include PolyMIM 40 and
Ryer Incorporated. 41
The binder system developed by The University of Sheffield also contains a water soluble
polymer. This binder system is comprised of three parts; Polyethylene Glycol (PEG), poly
(methyl methacrylate) (PMMA) and stearic acid (SA). Further details of this binder system
can be seen in Table 2.3.

20
Table 2.3 The University of Sheffield Binder System for MIM
Polymer Purpose Removal
Process
Binder
Weight
%
Chemical Structure
PEG
(Polyethylene
Glycol)
Provides fluidity
during injection.
Water
debinding
83%
42
PMMA
(emulsion)
(poly (methyl
methacrylate))
Backbone binder
to retain part
shape and
strength
during/after
water debinding.
Thermal
debinding
15%
43
SA
(stearic acid)
Surfactant in the
binder system to
wet the metallic
powder and
prevent
agglomeration.
Thermal
debinding
2%
44
The PEG used in this binder system has a molecular weight of 1500 g/mol (grams per mole).
The molecular mass is determined by the sum of the total mass in grams of all the atoms that
make up a molecule per mole. The molecular weight of PEG is determined by the number of
ethylene glycol units included in each polymerised molecule of PEG, and which varies from
300 g/mol to 10,000,000 g/mol. The molecular weight in turn determines the characteristics
of each type of PEG. In general, the average molecular weight of PEG used for MIM
feedstocks is between 400 and 2000 g/mol. 45
The fairly open, short chained helical structure of PEG 1500 has been preferred by The
University of Sheffield, because of the polymer’s low melting temperature (38-54°C)15 and
its high solubility in water. However, lower molecular weight PEGs have a very low viscosity
21
at low temperatures, resulting in a significant drawback during the injection moulding
process. The use of PEG 1500 for the moulding of large or very complicated components can
be very challenging due to this low viscosity. It is important to fill the mould as quickly as
possible to prevent the feedstock from cooling, however when using a high injection
pressure, powder-binder separation can occur.
2.3.3.2.3.3.2.3.3.2.3.3. MixingMixingMixingMixing
The mixing process for MIM feedstock is an important factor. Inconsistencies that are
present in the feedstock cannot be rectified in the latter processing steps. The feedstock
produced must be homogenous, with all the metal powder being uniformly dispersed
throughout the chosen binder.
Work carried out by Supati et al has shown that feedstocks processed under different mixing
conditions will result in the subsequent feedstock having different rheological properties.
Work has also shown that the results of an inconsistent feedstock can include moulding
defects such as cracks, voids and part distortion. 46
The mixing of feedstocks should take place above the melting temperature of the binder
constituents to ensure the metal particles within the feedstock are sufficiently coated.46,47
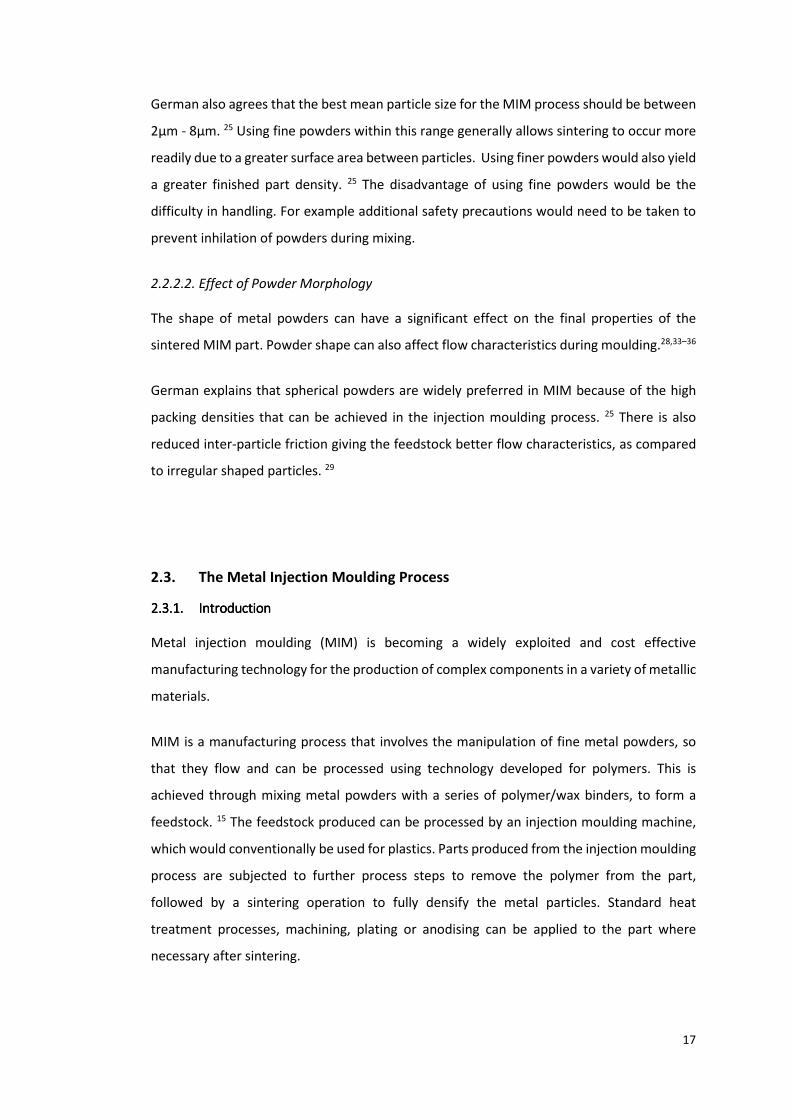
There are various mixing methods employed by the MIM industry. As previously mentioned,
the main aim of the mixing process is to ensure a homogenous feedstock. Examples of these
mixing methods include the z-blade mixer and twin screw extruders. Figure 2.3 shows a
schematic of both of these methods.
Figure 2.3 Z-blade mixer (left) and a twin screw extruder (right) 48,49
22
Non-contact mixing machines are often used on a smaller, laboratory scale for the
production of MIM feedstock. These machines work by the spinning of a high speed arm in
one direction. A container located at the end of this arm rotates in the counter direction.
This dual asymmetric centrifuge mechanism relies on the friction created between particles,
to heat and melt the feedstock into a homogenous mixture.
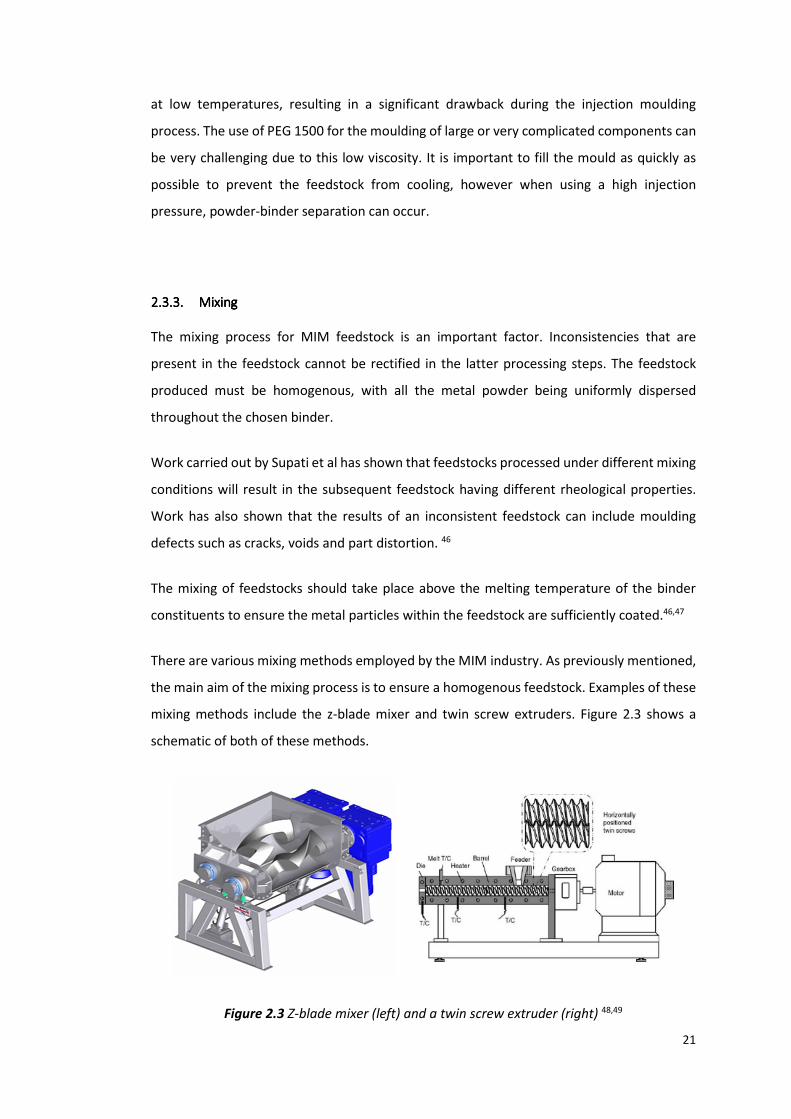
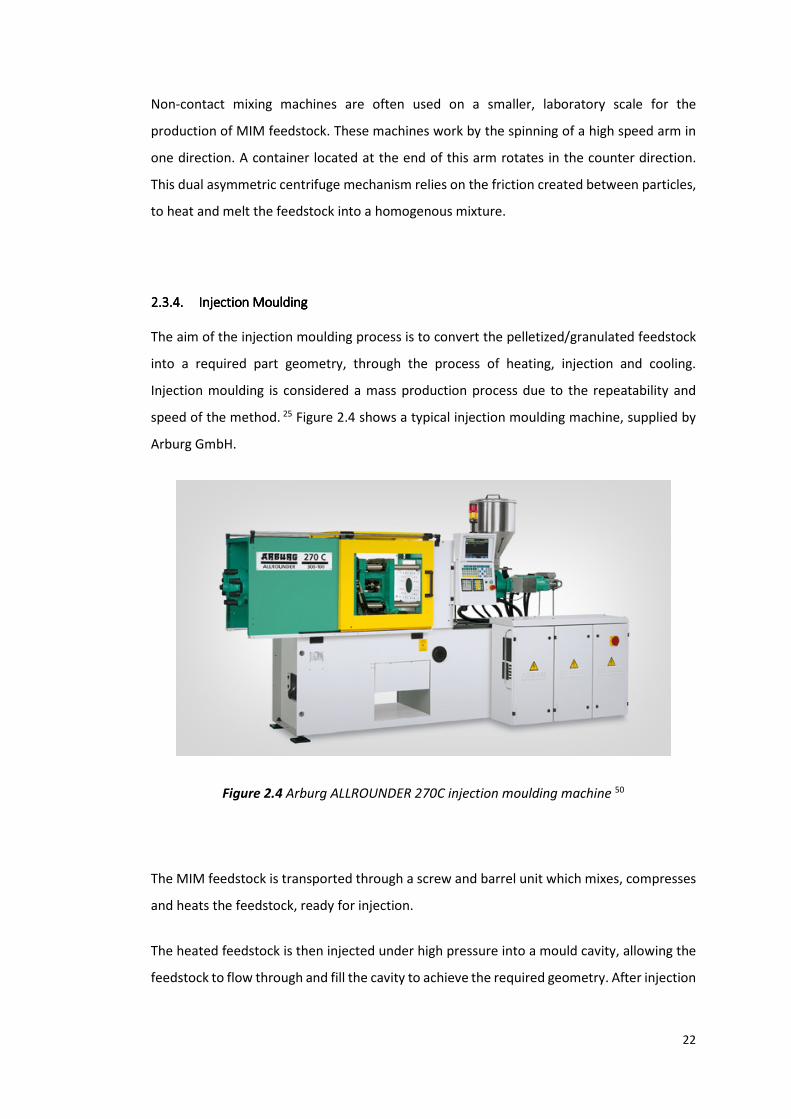
2.3.4.2.3.4.2.3.4.2.3.4. Injection MouldingInjection MouldingInjection MouldingInjection Moulding
The aim of the injection moulding process is to convert the pelletized/granulated feedstock
into a required part geometry, through the process of heating, injection and cooling.
Injection moulding is considered a mass production process due to the repeatability and
speed of the method. 25 Figure 2.4 shows a typical injection moulding machine, supplied by
Arburg GmbH.
Figure 2.4 Arburg ALLROUNDER 270C injection moulding machine 50
The MIM feedstock is transported through a screw and barrel unit which mixes, compresses
and heats the feedstock, ready for injection.
The heated feedstock is then injected under high pressure into a mould cavity, allowing the
feedstock to flow through and fill the cavity to achieve the required geometry. After injection
23
the part is allowed to cool and solidify in the mould cavity. The mould cavity then opens and
the part is ejected. The mould tool closes and the injection process can then begin again.
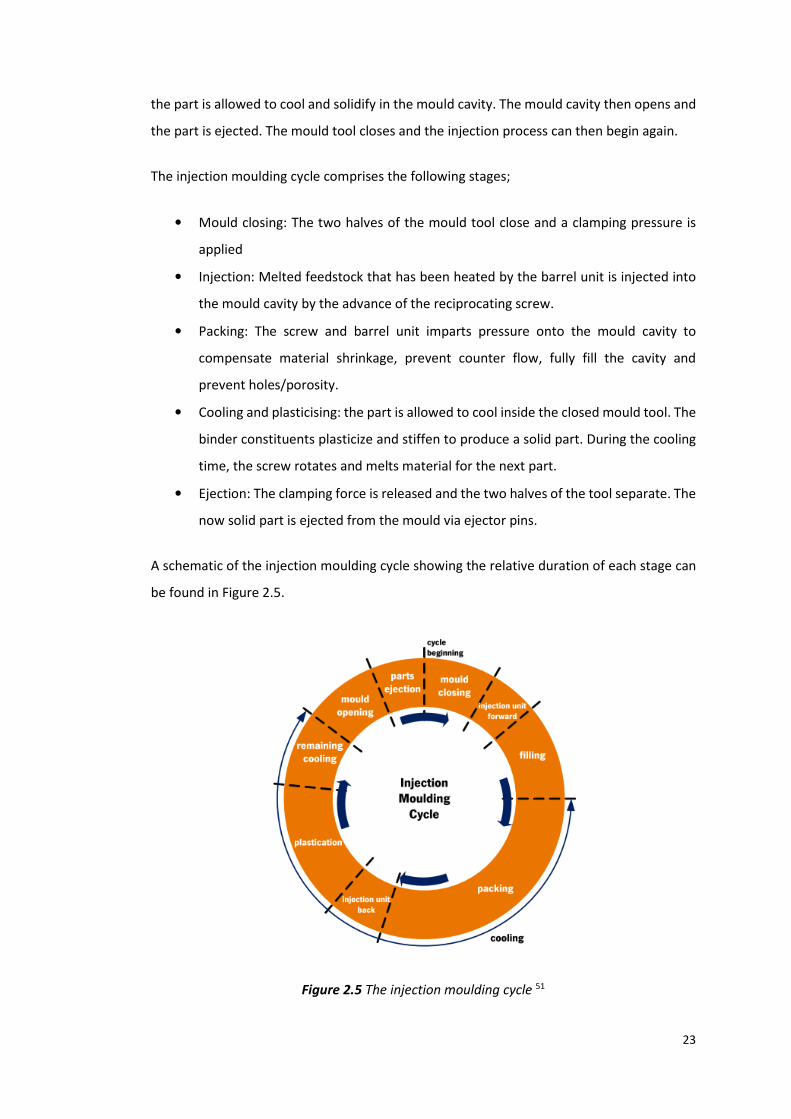
The injection moulding cycle comprises the following stages;
• Mould closing: The two halves of the mould tool close and a clamping pressure is
applied
• Injection: Melted feedstock that has been heated by the barrel unit is injected into
the mould cavity by the advance of the reciprocating screw.
• Packing: The screw and barrel unit imparts pressure onto the mould cavity to
compensate material shrinkage, prevent counter flow, fully fill the cavity and
prevent holes/porosity.
• Cooling and plasticising: the part is allowed to cool inside the closed mould tool. The
binder constituents plasticize and stiffen to produce a solid part. During the cooling
time, the screw rotates and melts material for the next part.
• Ejection: The clamping force is released and the two halves of the tool separate. The
now solid part is ejected from the mould via ejector pins.
A schematic of the injection moulding cycle showing the relative duration of each stage can
be found in Figure 2.5.
Figure 2.5 The injection moulding cycle 51
24
Compared to the injection moulding of polymers, flow rates for MIM feedstocks need to be
quite high to allow the feedstock to completely fill the mould tool, this is because the
presence of fine metal particles in the feedstock inhibit the flow of the polymers during
injection. The presence of metal powders dramatically increases the thermal diffusivity of
the feedstock, meaning that a longer cooling time is required compared to plastic injection
moulding.
The ejected part is an oversized component comprising the metal powder plus polymer/wax
binder; this is known as the “green” part.
2.3.5.2.3.5.2.3.5.2.3.5. DebindingDebindingDebindingDebinding
As previously mentioned the main role of the binder system is to facilitate the injection
moulding of the part. After the “green” part is formed, the majority of the binder must be
removed in order to proceed with the sintering operation. Failure to remove the binder
before sintering will result in part distortion, cracking and possible contamination. 51
Following the debinding process, the part is referred to as the “brown” part.
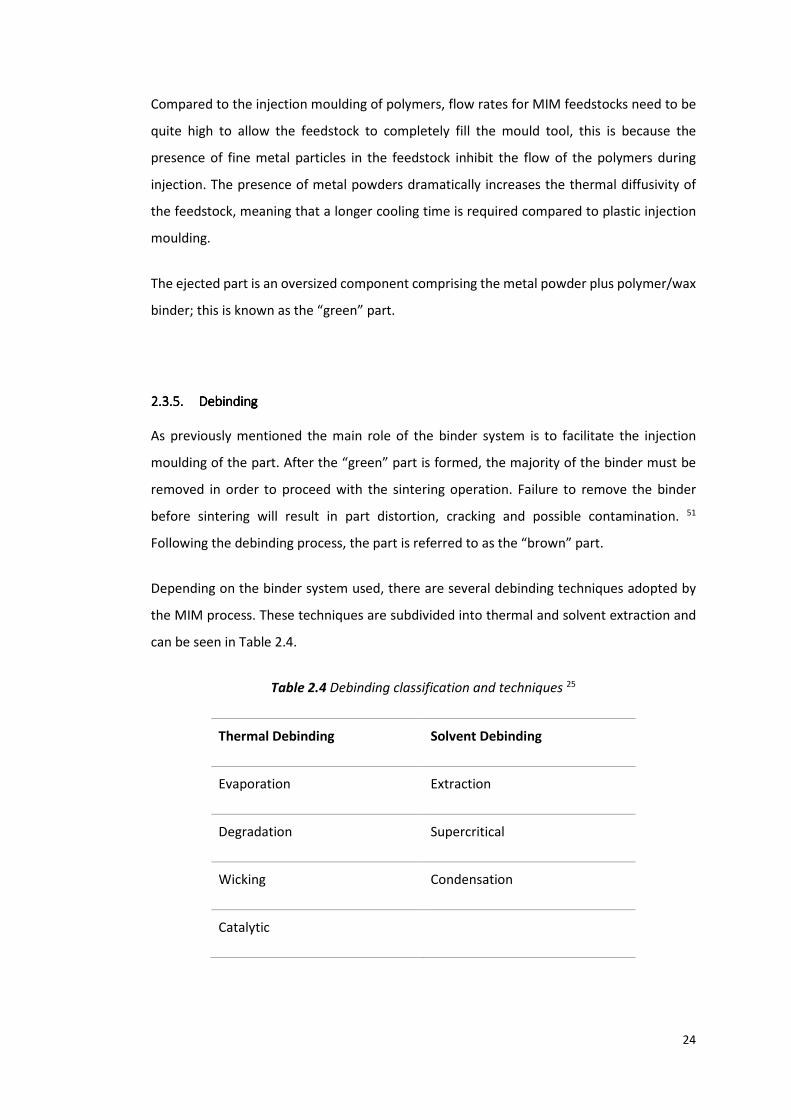
Depending on the binder system used, there are several debinding techniques adopted by
the MIM process. These techniques are subdivided into thermal and solvent extraction and
can be seen in Table 2.4.
Table 2.4 Debinding classification and techniques 25
Thermal Debinding Solvent Debinding
Evaporation Extraction
Degradation Supercritical
Wicking Condensation
Catalytic
25
Thermal debinding techniques involve the slow heating of part in a reducing or inert
atmosphere, inside an oven/furnace to provide a progressive degradation of the binder.
Flowing gas during the process helps remove the binder in its now gaseous form, as well as
keeping the oven/furnace surfaces clean. 52 53
The thermal debinding technique is often adopted because of its simplicity, as a low
investment is required and there is no processing and recycling of any liquid waste. The
downside of the process is the longer processing times and tendency of the debinded parts
to distort. 51
The solvent debinding method involves the use of a solvent, either as a liquid or a vapour to
remove binder from the part. This process is comprised two stages. The first stage of the
process dissolves the binder from the surface of the part. This initial step leaves a porous
structure at the surface only. The solvent can then access the surface pores and further
binder is diffused by capillary action from the body of the part. 54 The disadvantage of using
the solvent debinding process is the difficulty in handling and disposing of the hazardous
liquids/gases.
Water and organic solvents such as hexane, toluene, pentane, heptane, meythylchloride and
acetone can be used to absorb the binder, leaving behind an open porous structure of metal
particles and backbone binder. The network of pores left by the solvent debinding process
allows the backbone binder to be more readily removed during a later thermal debinding
process. Parts are typically submersed in these liquids for a period of time (12 - 24 hours
typical) and at a certain temperature (20°C - 60°C typical) in order for this removal to occur.
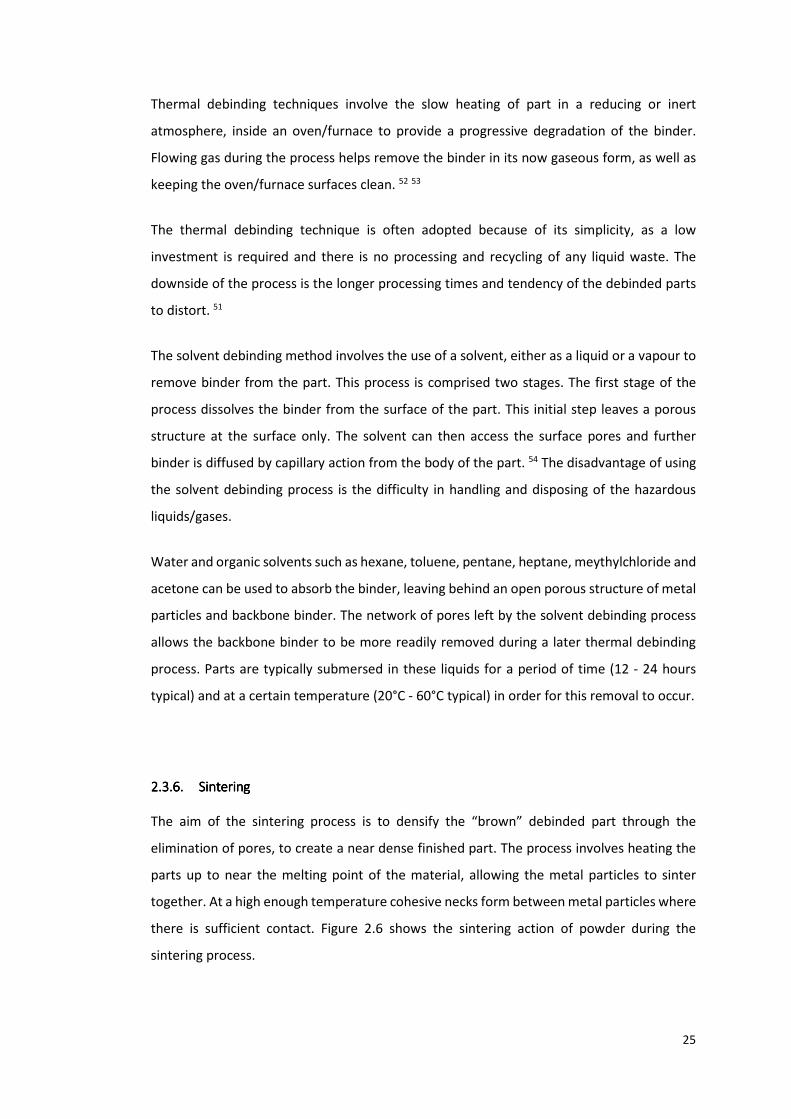
2.3.6.2.3.6.2.3.6.2.3.6. SinteringSinteringSinteringSintering
The aim of the sintering process is to densify the “brown” debinded part through the
elimination of pores, to create a near dense finished part. The process involves heating the
parts up to near the melting point of the material, allowing the metal particles to sinter
together. At a high enough temperature cohesive necks form between metal particles where
there is sufficient contact. Figure 2.6 shows the sintering action of powder during the
sintering process.
26
Figure 2.6 Schematic of powder sintering evolution of MIM components 25
Different sintering rates and shrinkages can be seen between different particle sizes and
shapes. For example, parts with a smaller particle size will sinter together faster as the
surface area per unit volume would be greater, and therefore the energy to drive the
process. Particles with irregular shape will sinter differently depending on the contact
between particles, and in this case, maintaining a highly uniform shrinkage will also be
difficult. 25
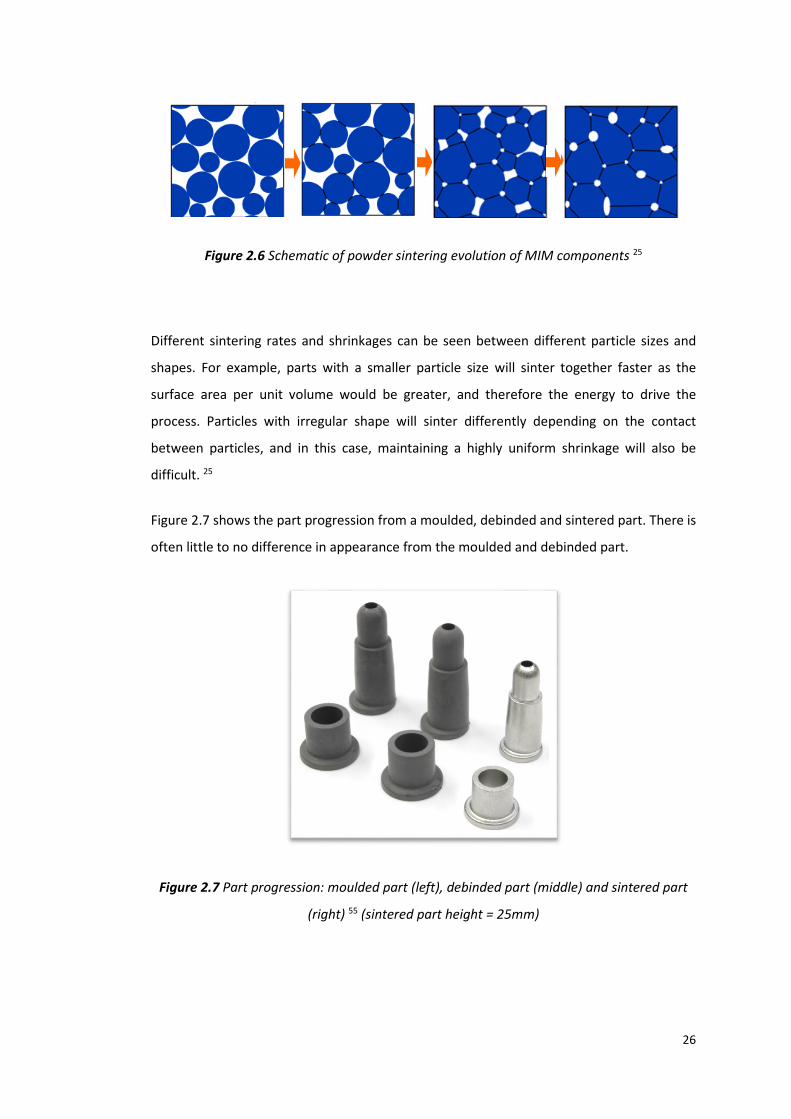
Figure 2.7 shows the part progression from a moulded, debinded and sintered part. There is
often little to no difference in appearance from the moulded and debinded part.
Figure 2.7 Part progression: moulded part (left), debinded part (middle) and sintered part
(right) 55 (sintered part height = 25mm)
27
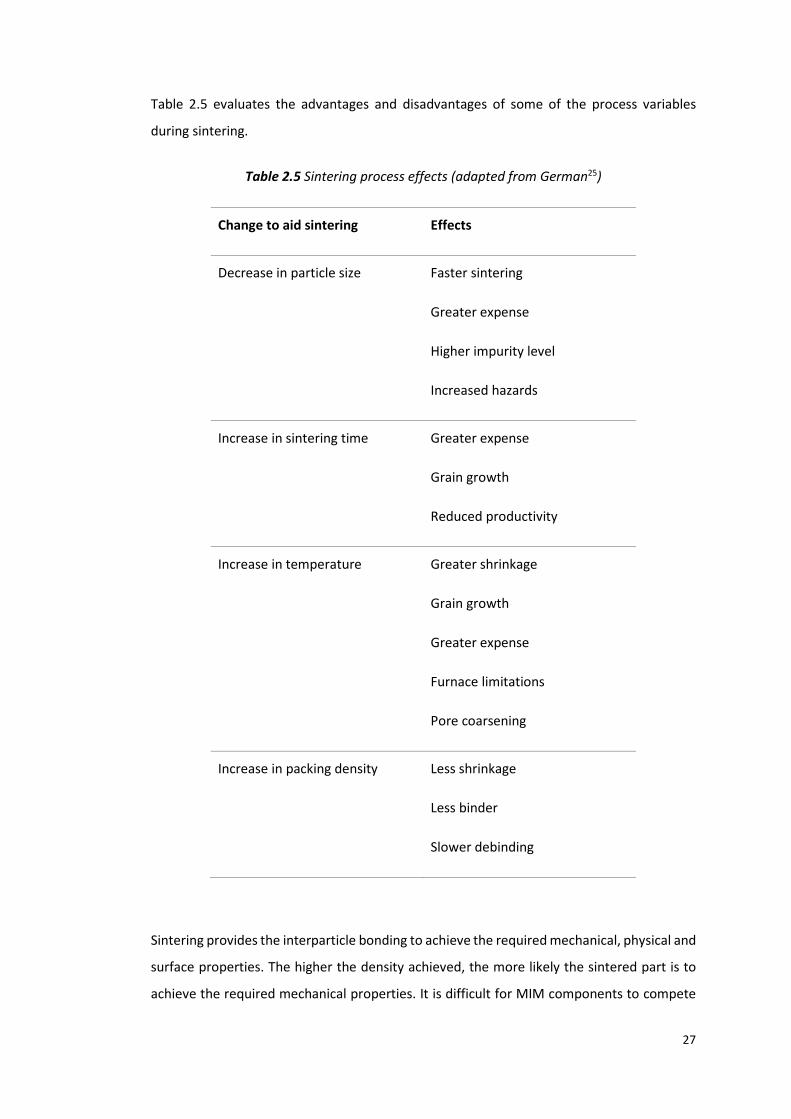
Table 2.5 evaluates the advantages and disadvantages of some of the process variables
during sintering.
Table 2.5 Sintering process effects (adapted from German25)
Change to aid sintering Effects
Decrease in particle size Faster sintering
Greater expense
Higher impurity level
Increased hazards
Increase in sintering time Greater expense
Grain growth
Reduced productivity
Increase in temperature Greater shrinkage
Grain growth
Greater expense
Furnace limitations
Pore coarsening
Increase in packing density Less shrinkage
Less binder
Slower debinding
Sintering provides the interparticle bonding to achieve the required mechanical, physical and
surface properties. The higher the density achieved, the more likely the sintered part is to
achieve the required mechanical properties. It is difficult for MIM components to compete
28
on a like for like basis with wrought and machined material properties, because 100% density
is not achieved. However, in general the properties achieved by MIM are enough to satisfy
most applications and can be further improved through Hot Isostatic Pressing (HIP).
Atmosphere is an important aspect in the sintering of MIM components, several factors must
be considered. After debinding the MIM component still contains a residual backbone binder
that must be extracted by the sintering atmosphere prior to densification of the part. Failure
to do this can result in carbon sooting of the furnace as well as carbon contamination of the
sintered component. 25
During sintering most metals require protection from atmospheric oxidation. Surface oxides
hinder the bonding of particles and can result in lower mechanical and physical properties.
Sintering in a vacuum furnace is a popular method, as most metallic materials can be
processed in vacuum. The process is clean, reproducible and avoids a low partial pressure of
oxygen which results in oxide reduction. Depending on the alloy, it can be beneficial to run a
slight pressure of inert gas such as argon or helium to prevent element depletion during
sintering.
Pure hydrogen is a preferred atmosphere for stainless steels because it inhibits oxidation
better than an inert or vacuum only cycle. Hydrogen also improves the surface finish and
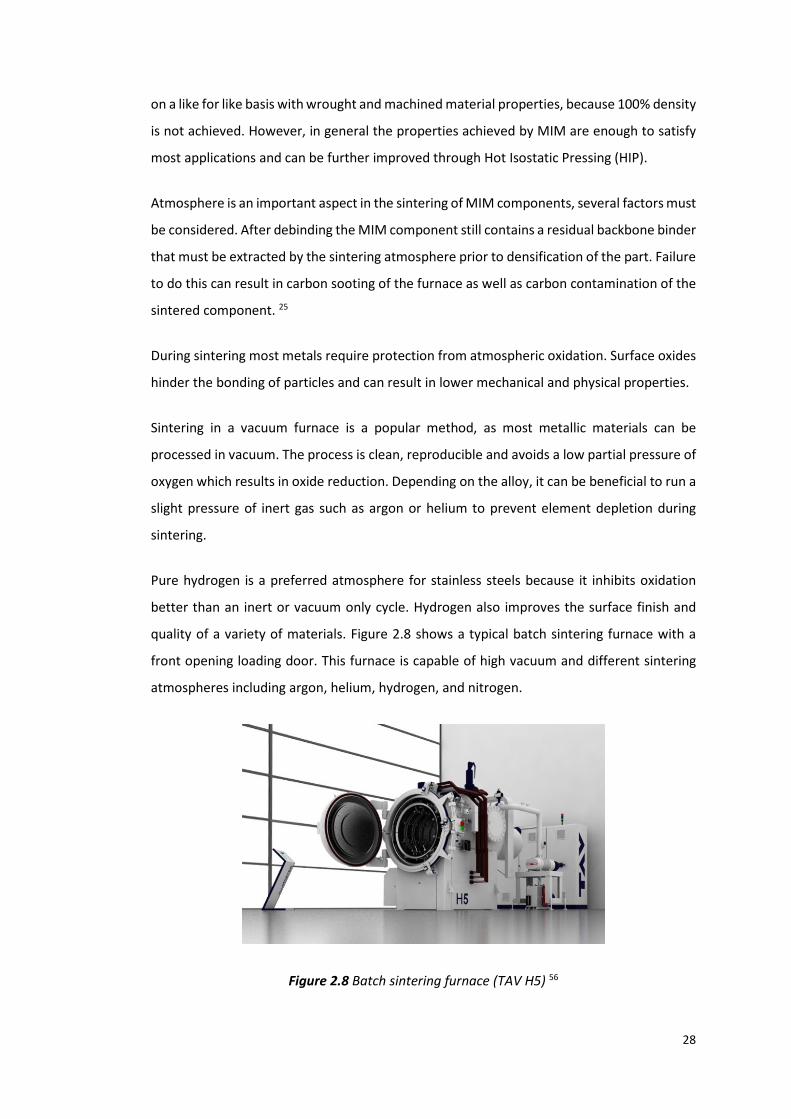
quality of a variety of materials. Figure 2.8 shows a typical batch sintering furnace with a
front opening loading door. This furnace is capable of high vacuum and different sintering
atmospheres including argon, helium, hydrogen, and nitrogen.
Figure 2.8 Batch sintering furnace (TAV H5) 56
29
3. Experimental Procedure
3.1. Introduction
This chapter outlines the experimental methods used for the comparative study of the effect
of using different molecular weight PEG in MIM feedstocks. The adopted strategy was to
produce a range of feedstocks from the PEG available, where possible and appropriate
keeping processing parameters the same, to reduce variability in results.
3.2. Materials
3.2.1.3.2.1.3.2.1.3.2.1. Inconel 718Inconel 718Inconel 718Inconel 718
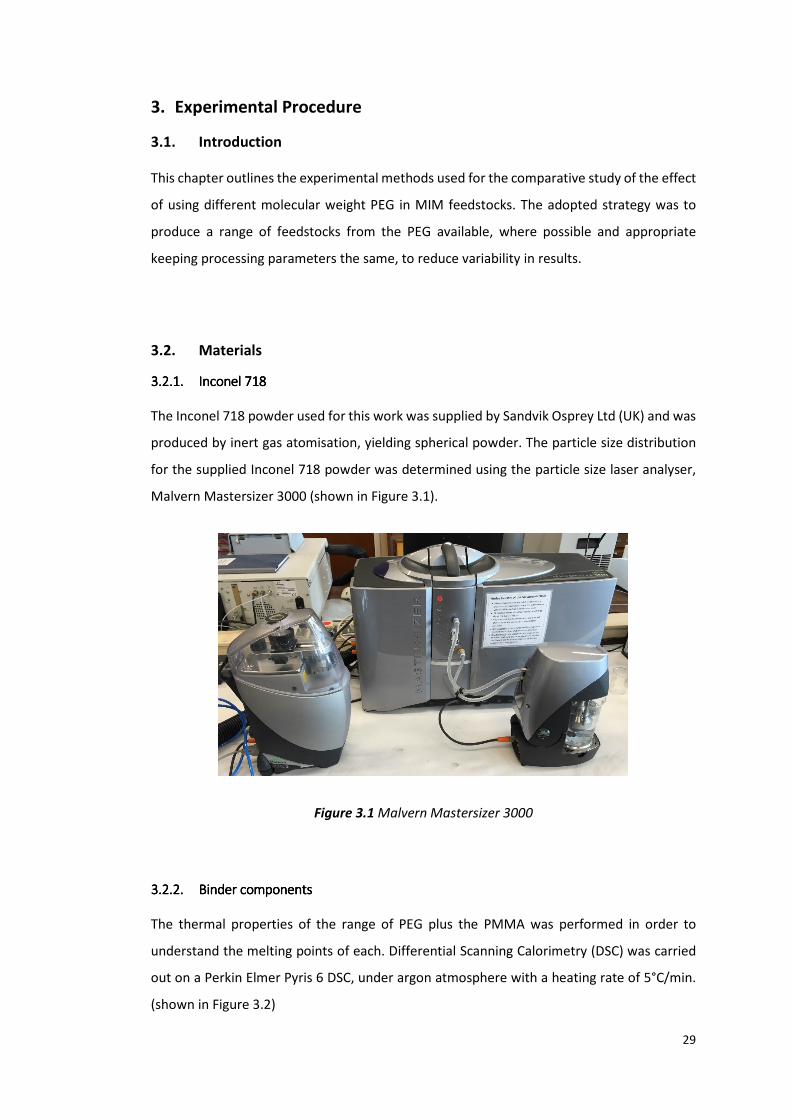
The Inconel 718 powder used for this work was supplied by Sandvik Osprey Ltd (UK) and was
produced by inert gas atomisation, yielding spherical powder. The particle size distribution
for the supplied Inconel 718 powder was determined using the particle size laser analyser,
Malvern Mastersizer 3000 (shown in Figure 3.1).
Figure 3.1 Malvern Mastersizer 3000
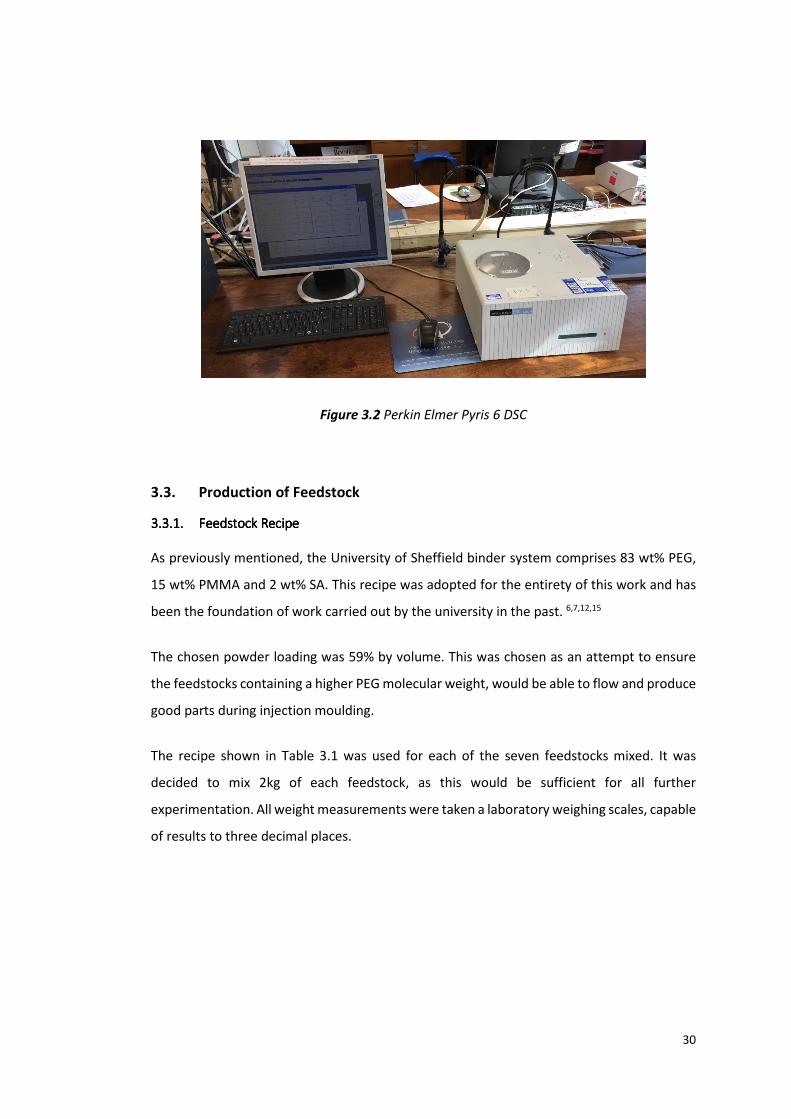
3.2.2.3.2.2.3.2.2.3.2.2. Binder componentsBinder componentsBinder componentsBinder components
The thermal properties of the range of PEG plus the PMMA was performed in order to
understand the melting points of each. Differential Scanning Calorimetry (DSC) was carried
out on a Perkin Elmer Pyris 6 DSC, under argon atmosphere with a heating rate of 5°C/min.
(shown in Figure 3.2)
30
Figure 3.2 Perkin Elmer Pyris 6 DSC
3.3. Production of Feedstock
3.3.1.3.3.1.3.3.1.3.3.1. Feedstock RecipeFeedstock RecipeFeedstock RecipeFeedstock Recipe
As previously mentioned, the University of Sheffield binder system comprises 83 wt% PEG,
15 wt% PMMA and 2 wt% SA. This recipe was adopted for the entirety of this work and has
been the foundation of work carried out by the university in the past. 6,7,12,15
The chosen powder loading was 59% by volume. This was chosen as an attempt to ensure
the feedstocks containing a higher PEG molecular weight, would be able to flow and produce
good parts during injection moulding.
The recipe shown in Table 3.1 was used for each of the seven feedstocks mixed. It was
decided to mix 2kg of each feedstock, as this would be sufficient for all further
experimentation. All weight measurements were taken a laboratory weighing scales, capable
of results to three decimal places.
31
Table 3.1 Feedstock recipe used for each molecular weight of PEG
Component Weight (g)
Inconel 718 powder 1961.1
PEG * 165.7
PMMA (emulsion) 29.7
SA 3.3
* Molecular weight of PEG used has negligible effect on density and therefore weight used in recipe
3.3.2.3.3.2.3.3.2.3.3.2. MixingMixingMixingMixing
Feedstock mixing was carried out on a SpeedMixer Dual Axial Centrifuge (DAC) 5000. The
weighed feedstock, excluding the PMMA emulsion, was transferred to the SpeedMixer tin
and mixed in five stages as described in Table 3.2. The machine was paused between each
stage and the tin removed from the machine. This allowed the inner walls of the tin to be
manually cleaned with a pallet knife. The PMMA emulsion was added to the tin after the
third stage of mixing. This was to allow the feedstock from the first three stages of mixing to
get hot enough for the addition of PMMA, which has a higher melting temperature. The same
mixing regime was used for each feedstock, containing different molecular weight PEG.
32
Table 3.2 Feedstock mixing regime used for each PEG
Stage Speed (rpm) Time (s) Components Mixed
1 400 120 IN718, PEG, SA
2 400 120 IN718, PEG, SA
3 500 120 IN718, PEG, SA
4 600 60 IN718, PEG, SA, PMMA
5 600 60 IN718, PEG, SA, PMMA
After the last stage of mixing, the feedstock was transferred on to a flat acrylic board (500mm
x 500mm) and spread out thinly with a pallet knife. Each feedstock was then transferred to
a laboratory oven, set to 30°C for 24 hours allowing any water in the feedstock to evaporate.
3.3.3.3.3.3.3.3.3.3.3.3. PelletisationPelletisationPelletisationPelletisation
Mixed feedstock must be pelletised so that it can be fed into the hopper of the injection
moulding machine. The pellets should be as small as possible; ideally no greater than 2mm
in diameter and 2mm in length. This is to allow the feedstock to be fed into the screw and
barrel in the most constant manner possible.
After 24 hours in the laboratory oven, the feedstock was broken into small pieces and fed
into the hopper of the Arburg 270C Allrounder machine. The machine was used in manual
mode to heat and extrude the feedstock into a string, followed by cutting the feedstock into
small pellets.
To promote homogeneity, the feedstock was extruded through the injection moulding
machine twice. This was found adequate to produce a smooth flowing feedstock. The
extrusion temperature and speed settings used for each of the feedstocks is given in Table
3.3.
33
Table 3.3 Arburg extrusion settings for MIM of Inconel 728
Code Representation Setting
T801 Temperature zone 1 (hopper) 90°C
T802 Temperature zone 2 130°C
T803 Temperature zone 3 135°C
T804 Temperature zone 4 140°C
T805 Temperature zone 5 (nozzle) 150°C
v403 Rotational speed 5 rpm
p403 Back pressure 10 bar
The resulting pelletised feedstock can be seen in Figure 3.3.
Figure 3.3 Pelletised Inconel 718 feedstock after being extruded twice by the Arburg
Injection Moulding Machine, using the Sheffield binder system recipe
34
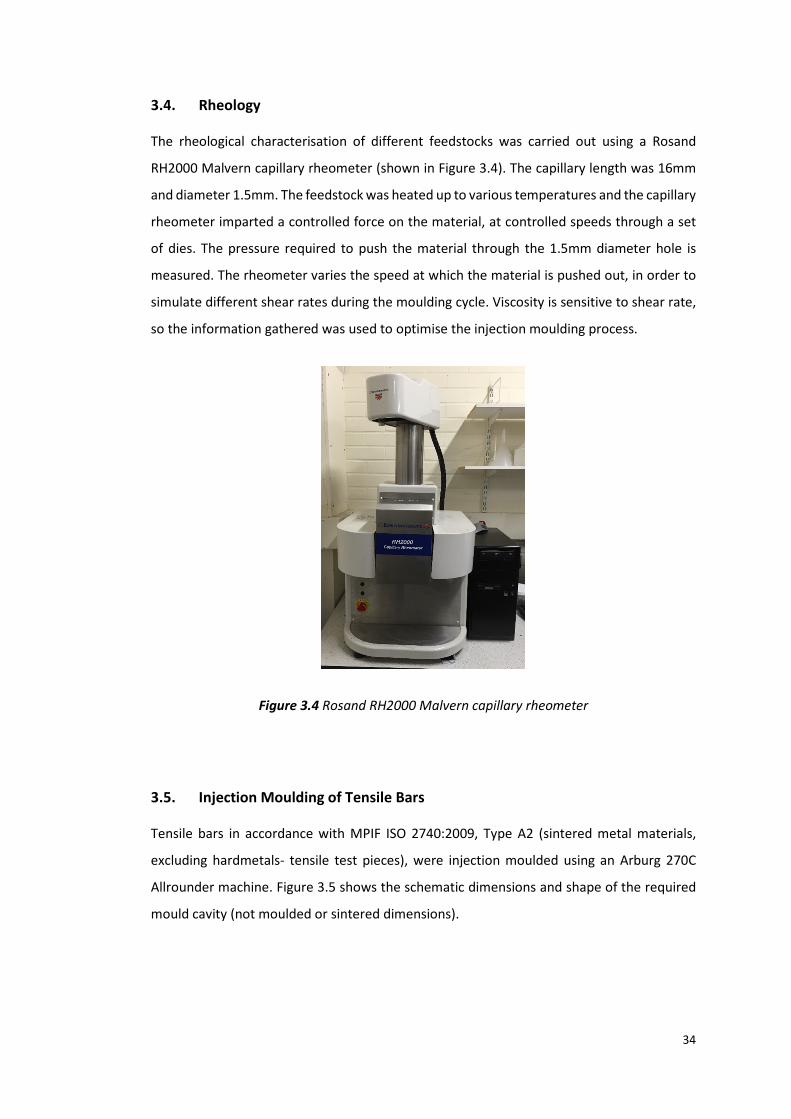
3.4. Rheology
The rheological characterisation of different feedstocks was carried out using a Rosand
RH2000 Malvern capillary rheometer (shown in Figure 3.4). The capillary length was 16mm
and diameter 1.5mm. The feedstock was heated up to various temperatures and the capillary
rheometer imparted a controlled force on the material, at controlled speeds through a set
of dies. The pressure required to push the material through the 1.5mm diameter hole is
measured. The rheometer varies the speed at which the material is pushed out, in order to
simulate different shear rates during the moulding cycle. Viscosity is sensitive to shear rate,
so the information gathered was used to optimise the injection moulding process.
Figure 3.4 Rosand RH2000 Malvern capillary rheometer
3.5. Injection Moulding of Tensile Bars
Tensile bars in accordance with MPIF ISO 2740:2009, Type A2 (sintered metal materials,
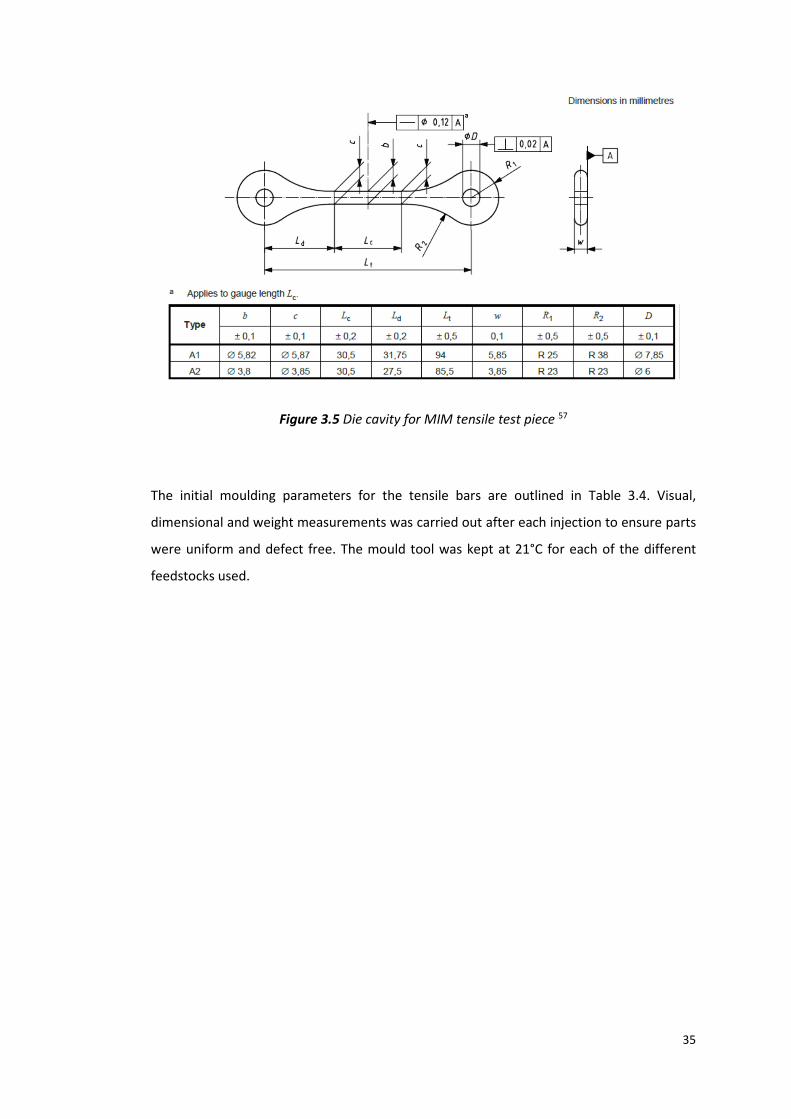
excluding hardmetals- tensile test pieces), were injection moulded using an Arburg 270C
Allrounder machine. Figure 3.5 shows the schematic dimensions and shape of the required
mould cavity (not moulded or sintered dimensions).
35
Figure 3.5 Die cavity for MIM tensile test piece 57
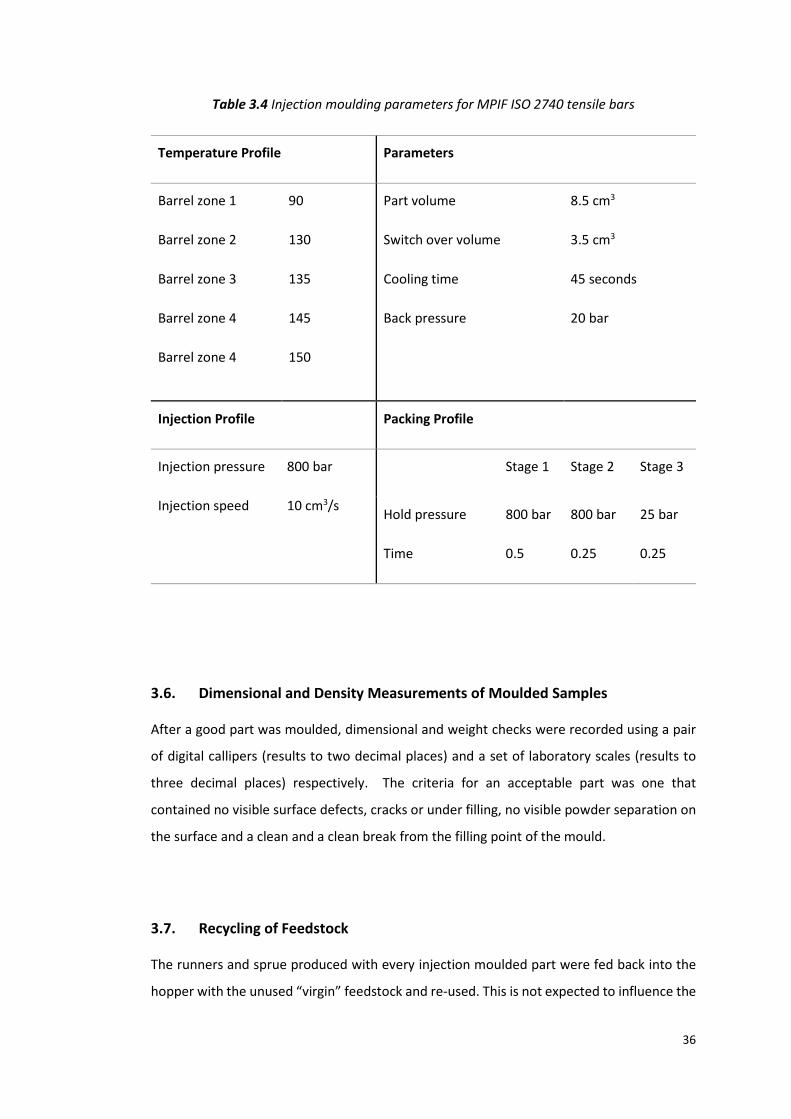
The initial moulding parameters for the tensile bars are outlined in Table 3.4. Visual,
dimensional and weight measurements was carried out after each injection to ensure parts
were uniform and defect free. The mould tool was kept at 21°C for each of the different
feedstocks used.
36
Table 3.4 Injection moulding parameters for MPIF ISO 2740 tensile bars
Temperature Profile Parameters
Barrel zone 1
Barrel zone 2
Barrel zone 3
Barrel zone 4
Barrel zone 4
90
130
135
145
150
Part volume
Switch over volume
Cooling time
Back pressure
8.5 cm3
3.5 cm3
45 seconds
20 bar
Injection Profile Packing Profile
Injection pressure
Injection speed
800 bar
10 cm3/s
Stage 1 Stage 2 Stage 3
Hold pressure
Time
800 bar
0.5
800 bar
0.25
25 bar
0.25
3.6. Dimensional and Density Measurements of Moulded Samples
After a good part was moulded, dimensional and weight checks were recorded using a pair
of digital callipers (results to two decimal places) and a set of laboratory scales (results to
three decimal places) respectively. The criteria for an acceptable part was one that
contained no visible surface defects, cracks or under filling, no visible powder separation on
the surface and a clean and a clean break from the filling point of the mould.
3.7. Recycling of Feedstock
The runners and sprue produced with every injection moulded part were fed back into the
hopper with the unused “virgin” feedstock and re-used. This is not expected to influence the
37
experimentation, as the temperatures used for injection did not exceed the melting
temperatures for any of the binder constituents.
3.8. Water Debinding
Components were solvent debound in a water bath at a set temperature and time. The
optimal temperature and time for the water debinding was determined by a series of
experiments, measuring the weight of PEG lost at a set time over a range of temperatures.
Three samples from each feedstock were used in the experimentation for each of the three
temperatures used for water debinding.
The experiments were carried out at water temperatures of 40°C, 50°C and 60°C. Parts were
removed from the water bath, allowed to dry for 24 hours and then weighed. This process
continued hourly and a graph was plotted to determine the debinding rate and time for each
temperature. The experiment was carried out for a total debinding time of 15 hours, with
hourly increments of submersion to begin with. As the percentage of PEG remaining was
minimal, large time increments of submersion were used.
The parts were placed on a perforated aluminium tray to ensure good contact with the
surrounding water.
3.9. Sintering
Parts were sintered in a Centorr VI MIM vacuum furnace (shown in figure 3.3), capable of
sintering in high vacuum and in an inert argon atmosphere.
The debound parts were placed on aluminium oxide trays and stacked in the vacuum
furnace. The sintering cycle included a thermal debinding process step at 350°C and 440°C in
order to remove the backbone PMMA from the parts. The sintering took place at 1270°C,
both thermal debinding and sintering took place under a purified argon gas flow to prevent
oxidation (0.2 ppm Oxygen). The combined thermal debinding and sintering cycle detail is
displayed in Table 3.5. The combined thermal debinding and sintering temperature profile
can be seen in the graph in Figure 3.6.

38
Table 3.5 Thermal debinding and sintering cycle for Inconel 718
Figure 3.6 Thermal debinding and sintering profile for Inconel 718
0
200
400
600
800
1000
1200
1400
0 200 400 600 800 1000
Te
mp
era
ture
(°C
)
Time (minutes)
Inconel 718 thermal debinding and sintering
profile
From (°C) To (°C) Rate (°C /minute) Hold (minutes)
0 350 3 60
350 440 2 60
440 800 5 60
800 1270 5 120
1270 0 5 0

39
3.10. Dimensional and Density Measurements of Sintered Samples
After the cooled parts were removed from the furnace, dimensional and weight checks were
recorded using a pair of digital callipers (results to two decimal places) and a set of laboratory
scales (results to three decimal places) respectively.
The density of the sintered parts was measured using a Mettler Toledo New Classic
Archimedes scale, as shown in Figure 3.7 (results to three decimal places)
Figure 3.7 Mettler Toledo New Classic Archimedes scale
3.11. Heat Treatment
Heat treatment of the samples was carried out according to the solution treatment and
ageing profile in AMS 5917 -2011 (Metal Injection Moulded Nickel Based Alloy 718 Parts Hot
Isostatically Pressed, Solution and Aged).
The solution treatment and ageing temperature profiles are shown in Tables 3.6 and 3.7, and
Figure 3.8.

40
Table 3.6 Solution treatment profile for Inconel 718
From (°C) To (°C) Rate (°C
/minute)
Hold
(minutes)
0 968 10 180
968 21 10 0
Table 3.7 Ageing profile for Inconel 718
From (°C) To (°C) Rate (°C
/minute)
Hold
(minutes)
21 730 10 480
730 630 1 480
630 0 10 0
Figure 3.8 Solution treatment and ageing profile for Inconel 718 in accordance with AMS
5917 -11
0
200
400
600
800
1000
1200
0 5 10 15 20 25 30
Te
mp
era
ture
(°C
)
Time (hours)
Inconel 718 Solution Treatment and Age Profile

41
3.12. Dimensional and Density Measurements of Heat Treated Samples
Dimensional, weight and density measurements for each sample were carried out using the
equipment described previously.
3.13. Metallography of All Samples
Two tensile bar samples from each feedstock were taken forward for metallography, in order
to discover if the molecular weight of PEG has any effect on the microstructure of the
sintered and heat treated part.
Sintered and heat treated samples were sectioned using a carbide blade and mounted in
Bakelite. Each sample was cut at the same position so that the metallography and porosity
can be compared for each sample, as shown in Figure 3.9.
Figure 3.9 Cut position for mounted tensile bars
After mounting and identifying each sample by scribing, the parts went through a grinding
and polishing procedure. A Struers Tegramin-20 machine was used as shown in Figure 3.10.
Figure 3.10 Struers Tegramin-20 grinding and polishing machine
Cut position
Injection
point
42
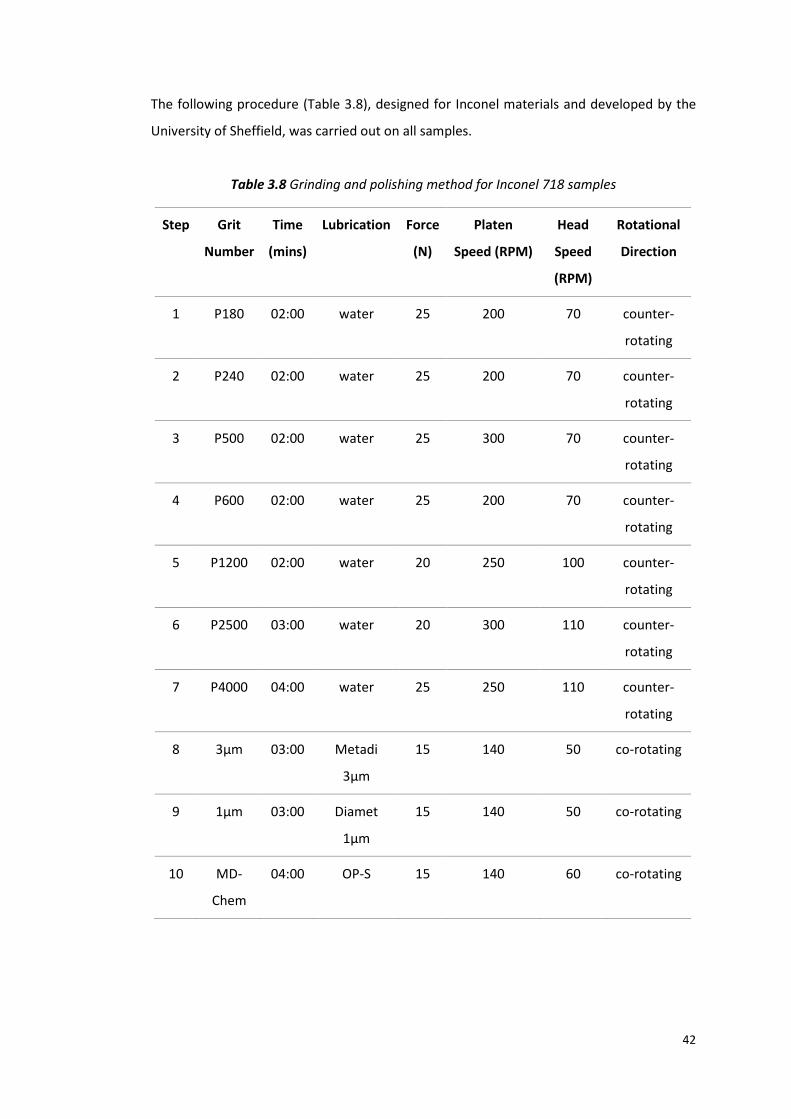
The following procedure (Table 3.8), designed for Inconel materials and developed by the
University of Sheffield, was carried out on all samples.
Table 3.8 Grinding and polishing method for Inconel 718 samples
Step Grit
Number
Time
(mins)
Lubrication Force
(N)
Platen
Speed (RPM)
Head
Speed
(RPM)
Rotational
Direction
1 P180 02:00 water 25 200 70 counter-
rotating
2 P240 02:00 water 25 200 70 counter-
rotating
3 P500 02:00 water 25 300 70 counter-
rotating
4 P600 02:00 water 25 200 70 counter-
rotating
5 P1200 02:00 water 20 250 100 counter-
rotating
6 P2500 03:00 water 20 300 110 counter-
rotating
7 P4000 04:00 water 25 250 110 counter-
rotating
8 3µm 03:00 Metadi
3µm
15 140 50 co-rotating
9 1µm 03:00 Diamet
1µm
15 140 50 co-rotating
10 MD-
Chem
04:00 OP-S 15 140 60 co-rotating

43
All polished samples were etched in order to reveal the surface microstructure using the
etchant Glycerigia. The composition of this etchant and method of application is outlined in
Table 3.9.
Table 3.9 Glycerigia composition and application
Component Volume (ml) Ratio (%)
HCl 15 50
Glycerol 10 33
HNO3 5 17
* Mix fresh and use within 20 minutes, Swab sample with cotton wool for 2-3 minutes
A Nikon Eclipse LV150 optical microscope shown in Figure 3.11, was used to examine the
revealed microstructure of each heat treated sample.
Figure 3.11 Nikon Eclipse LV150 microscope

44
3.14. Tensile Testing
Three heat treated tensile bars from each feedstock were tensile tested in order to evaluate
if PEG molecular weight has any effect on mechanical properties.
A Zwick/Roell Z050 machine was used for all tensile testing, as shown in Figure 3.12.
Figure 3.12 Zwick/Roell Z050 tensile testing machine
Figure 3.13 shows the configuration of tensile bars after they are loaded in between two sets
of jaws. Metal rods were attached to the central portion of the tensile bar so that the
extensometer camera could measure the change in gauge length during the test, removing
the influence of elastic deformation of the test frame and grips. The thicker sections of the
tensile bar were clamped evenly on each end, so that the tensile bars would fracture at the
weakest point in the middle of the specimen.

45
Figure 3.13 Extensometer camera image showing how the specimens were clamped
An initial load of 10N was applied before the strain was increased until the point of breaking.
The strain rate was set at 0.5N/s.
The Zwick/Roell machine plotted a standard stress/strain graph until the sample fractured.
This graph was then used and reinterpreted to calculate the 0.2% proof stress (0.2% PS),
Young’s modulus (YM) and ultimate tensile strength (UTS).
46
4. Experimental Results and Discussion
4.1. Materials
4.1.1.4.1.1.4.1.1.4.1.1. Inconel 718Inconel 718Inconel 718Inconel 718
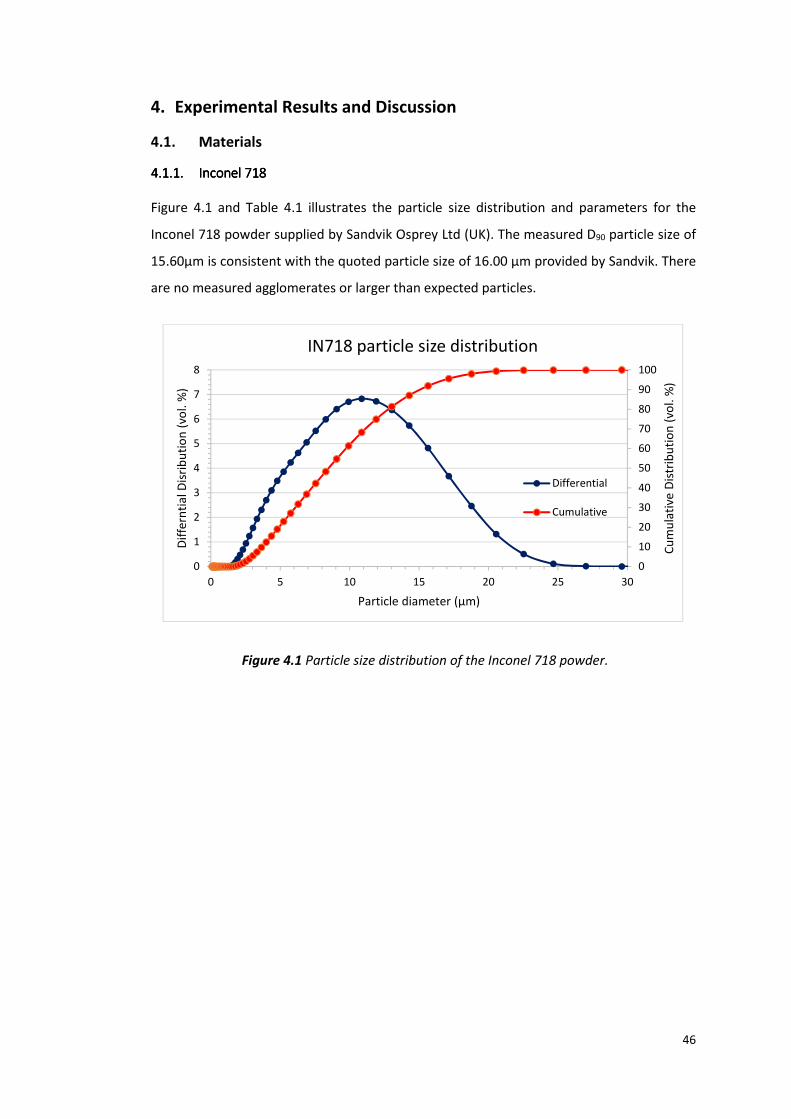
Figure 4.1 and Table 4.1 illustrates the particle size distribution and parameters for the
Inconel 718 powder supplied by Sandvik Osprey Ltd (UK). The measured D90 particle size of
15.60µm is consistent with the quoted particle size of 16.00 µm provided by Sandvik. There
are no measured agglomerates or larger than expected particles.
Figure 4.1 Particle size distribution of the Inconel 718 powder.
0
10
20
30
40
50
60
70
80
90
100
0
1
2
3
4
5
6
7
8
0 5 10 15 20 25 30
Cu
mu
lati
ve D
istr
ibu
tio
n (
vol.
%)
Dif
fern
tia
l D
isri
bu
tio
n (
vol.
%)
Particle diameter (µm)
IN718 particle size distribution
Differential
Cumulative

47
Table 4.1 Particle size distribution parameters of Inconel 718 gas atomised powder
Parameter Value (µm)
Mean 7.87
D10 3.74
D50 8.42
D90 15.60
The morphology of Inconel 718 powder used in this work can be seen in Figure 4.2. The same
batch of powder was used in previous work carried out by the university. 6
Figure 4.2 Secondary electron image of the Inconel 718 powder used in this work 6
4.1.2.4.1.2.4.1.2.4.1.2. Binder Binder Binder Binder componentscomponentscomponentscomponents
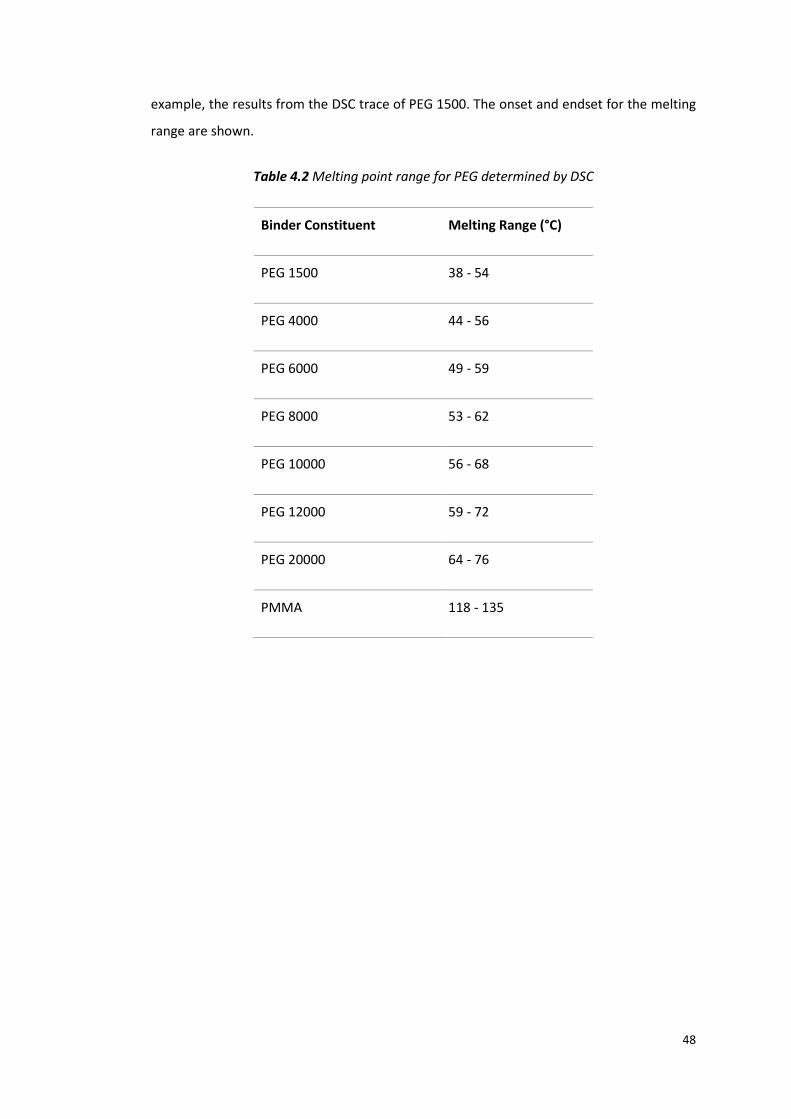
Table 4.2 shows the DSC results for different grades of PEG used in the experimentation, as
well as the PMMA. The melting range given shows the onset and endset of the peaks from
the DSC graphs. PMMA was tested using DSC to determine the temperature at which it
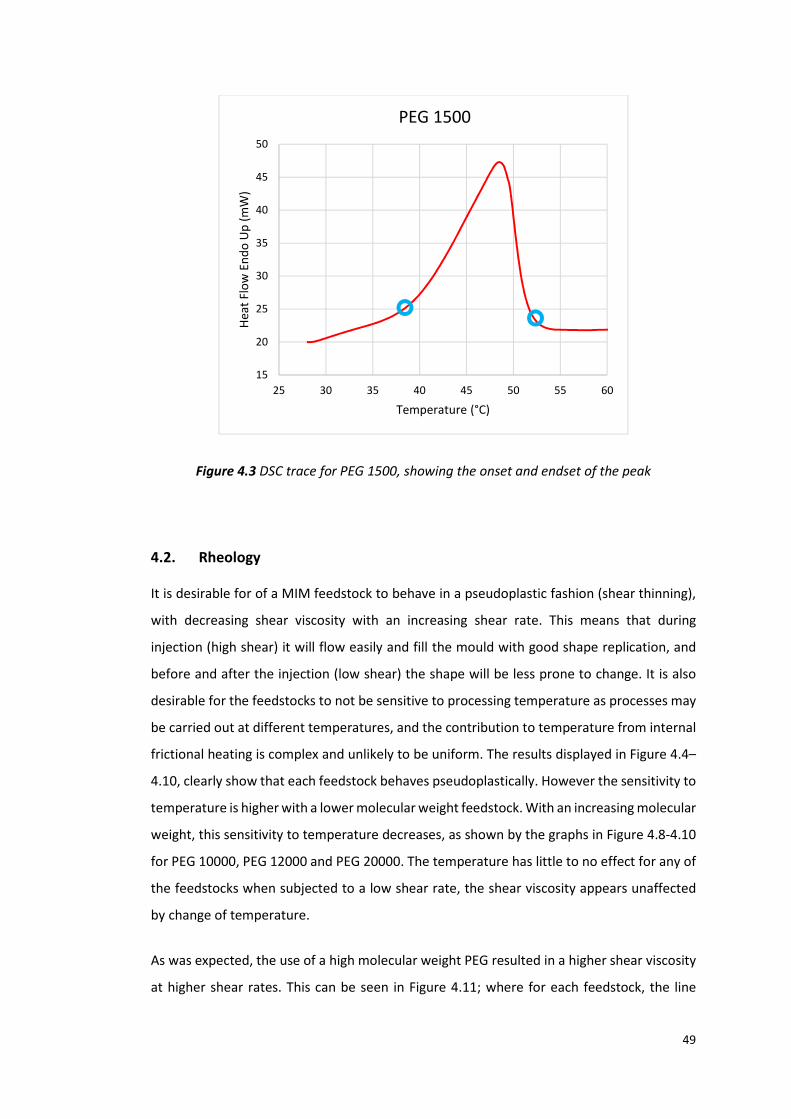
softened. It was important for further feedstock mixing and injection moulding to be above
this temperature, in order to produce homogenous feedstock/parts. Figure 4.3 shows as an
48
example, the results from the DSC trace of PEG 1500. The onset and endset for the melting
range are shown.
Table 4.2 Melting point range for PEG determined by DSC
Binder Constituent Melting Range (°C)
PEG 1500 38 - 54
PEG 4000 44 - 56
PEG 6000 49 - 59
PEG 8000 53 - 62
PEG 10000 56 - 68
PEG 12000 59 - 72
PEG 20000 64 - 76
PMMA 118 - 135
49
Figure 4.3 DSC trace for PEG 1500, showing the onset and endset of the peak
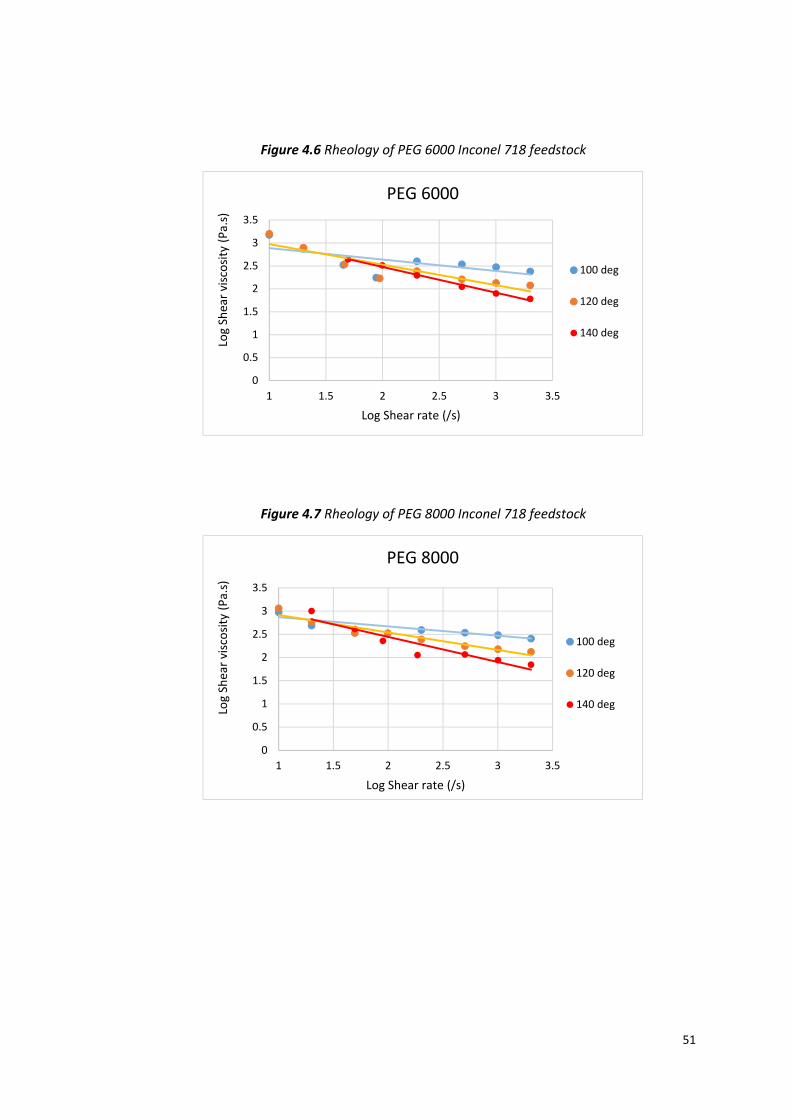
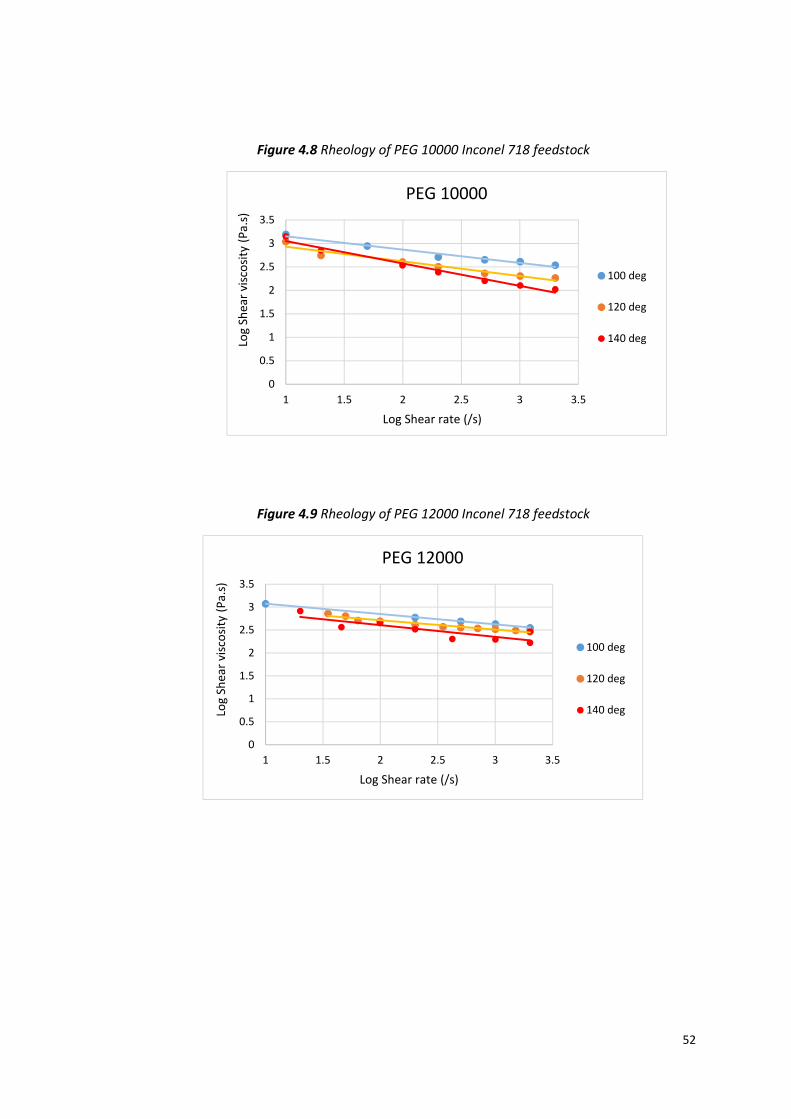
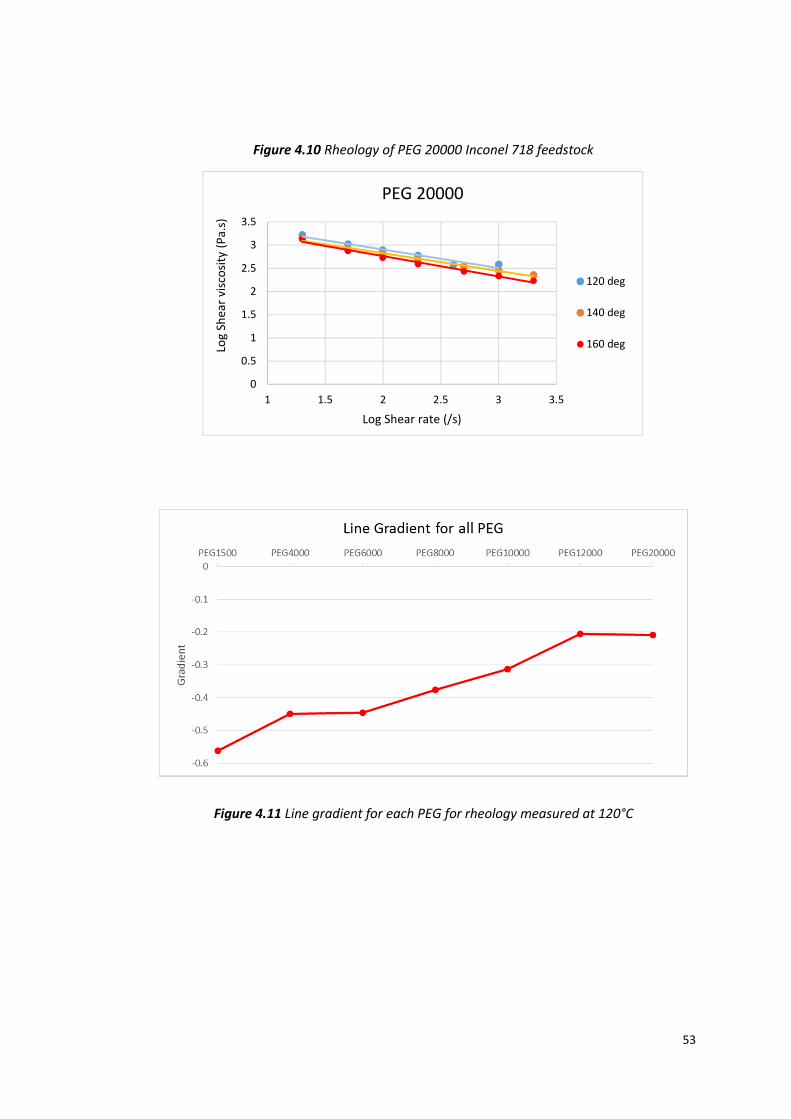
4.2. Rheology
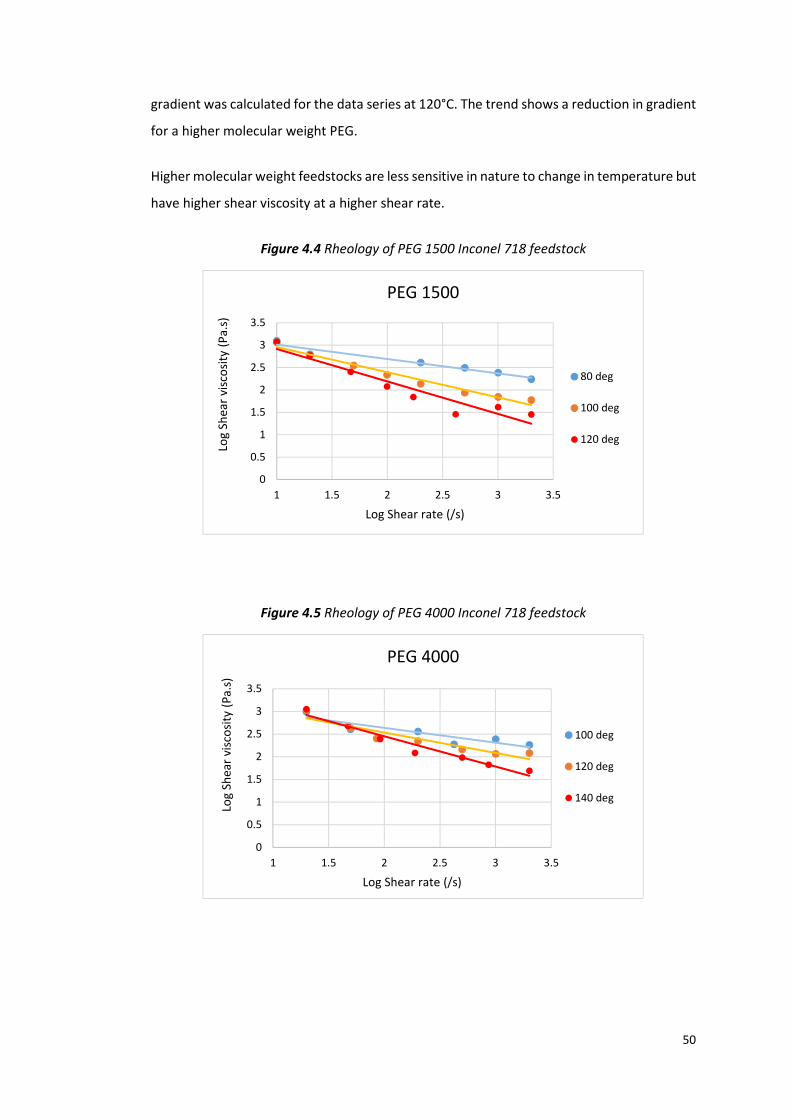
It is desirable for of a MIM feedstock to behave in a pseudoplastic fashion (shear thinning),
with decreasing shear viscosity with an increasing shear rate. This means that during
injection (high shear) it will flow easily and fill the mould with good shape replication, and
before and after the injection (low shear) the shape will be less prone to change. It is also
desirable for the feedstocks to not be sensitive to processing temperature as processes may
be carried out at different temperatures, and the contribution to temperature from internal
frictional heating is complex and unlikely to be uniform. The results displayed in Figure 4.4–
4.10, clearly show that each feedstock behaves pseudoplastically. However the sensitivity to
temperature is higher with a lower molecular weight feedstock. With an increasing molecular
weight, this sensitivity to temperature decreases, as shown by the graphs in Figure 4.8-4.10
for PEG 10000, PEG 12000 and PEG 20000. The temperature has little to no effect for any of
the feedstocks when subjected to a low shear rate, the shear viscosity appears unaffected
by change of temperature.
As was expected, the use of a high molecular weight PEG resulted in a higher shear viscosity
at higher shear rates. This can be seen in Figure 4.11; where for each feedstock, the line
15
20
25
30
35
40
45
50
25 30 35 40 45 50 55 60
He
at
Flo
w E
nd
o U
p (
mW
)
Temperature (°C)
PEG 1500
50
gradient was calculated for the data series at 120°C. The trend shows a reduction in gradient
for a higher molecular weight PEG.
Higher molecular weight feedstocks are less sensitive in nature to change in temperature but
have higher shear viscosity at a higher shear rate.
Figure 4.4 Rheology of PEG 1500 Inconel 718 feedstock
Figure 4.5 Rheology of PEG 4000 Inconel 718 feedstock
0
0.5
1
1.5
2
2.5
3
3.5
1 1.5 2 2.5 3 3.5
Log
Sh
ea
r vi
sco
sity
(P
a.s
)
Log Shear rate (/s)
PEG 1500
80 deg
100 deg
120 deg
0
0.5
1
1.5
2
2.5
3
3.5
1 1.5 2 2.5 3 3.5
Log
Sh
ea
r vi
sco
sity
(P
a.s
)
Log Shear rate (/s)
PEG 4000
100 deg
120 deg
140 deg
51
Figure 4.6 Rheology of PEG 6000 Inconel 718 feedstock
Figure 4.7 Rheology of PEG 8000 Inconel 718 feedstock
0
0.5
1
1.5
2
2.5
3
3.5
1 1.5 2 2.5 3 3.5
Log
Sh
ea
r vi
sco
sity
(P
a.s
)
Log Shear rate (/s)
PEG 6000
100 deg
120 deg
140 deg
0
0.5
1
1.5
2
2.5
3
3.5
1 1.5 2 2.5 3 3.5
Log
Sh
ea
r vi
sco
sity
(P
a.s
)
Log Shear rate (/s)
PEG 8000
100 deg
120 deg
140 deg
52
Figure 4.8 Rheology of PEG 10000 Inconel 718 feedstock
Figure 4.9 Rheology of PEG 12000 Inconel 718 feedstock
0
0.5
1
1.5
2
2.5
3
3.5
1 1.5 2 2.5 3 3.5
Log
Sh
ea
r vi
sco
sity
(P
a.s
)
Log Shear rate (/s)
PEG 10000
100 deg
120 deg
140 deg
0
0.5
1
1.5
2
2.5
3
3.5
1 1.5 2 2.5 3 3.5
Log
Sh
ea
r vi
sco
sity
(P
a.s
)
Log Shear rate (/s)
PEG 12000
100 deg
120 deg
140 deg
53
Figure 4.10 Rheology of PEG 20000 Inconel 718 feedstock
Figure 4.11 Line gradient for each PEG for rheology measured at 120°C
0
0.5
1
1.5
2
2.5
3
3.5
1 1.5 2 2.5 3 3.5
Log
Sh
ea
r vi
sco
sity
(P
a.s
)
Log Shear rate (/s)
PEG 20000
120 deg
140 deg
160 deg
54
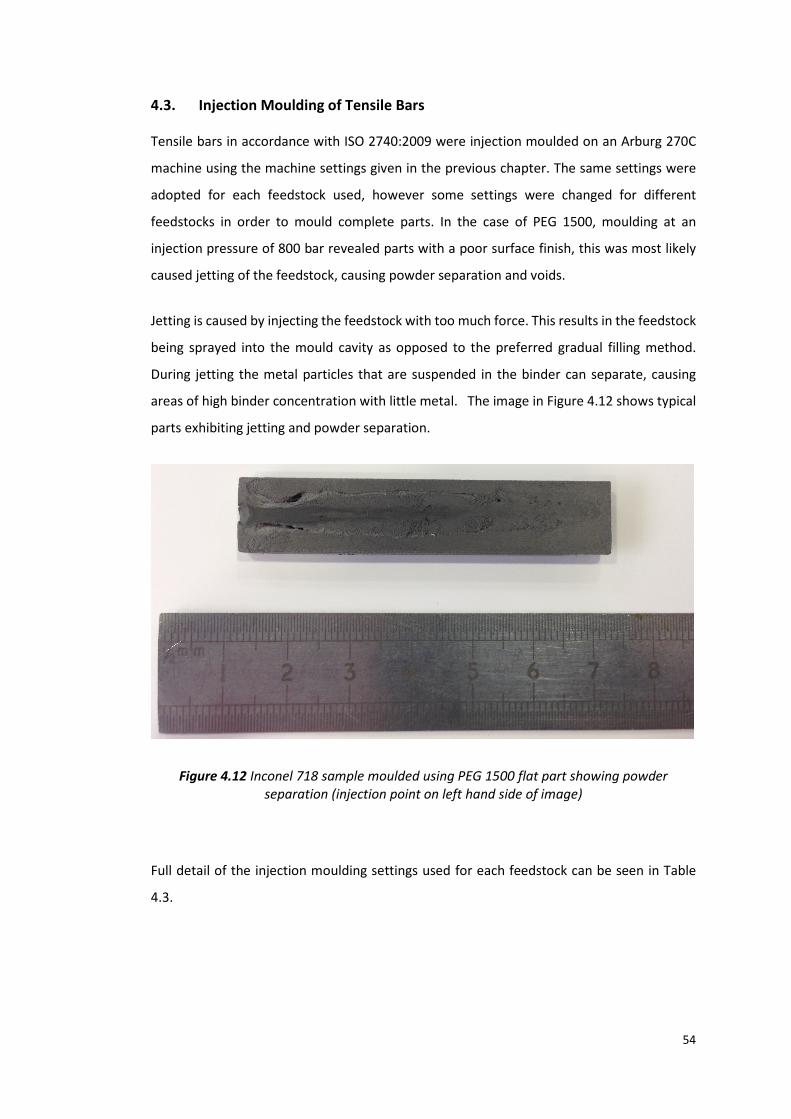
4.3. Injection Moulding of Tensile Bars
Tensile bars in accordance with ISO 2740:2009 were injection moulded on an Arburg 270C
machine using the machine settings given in the previous chapter. The same settings were
adopted for each feedstock used, however some settings were changed for different
feedstocks in order to mould complete parts. In the case of PEG 1500, moulding at an
injection pressure of 800 bar revealed parts with a poor surface finish, this was most likely
caused jetting of the feedstock, causing powder separation and voids.
Jetting is caused by injecting the feedstock with too much force. This results in the feedstock
being sprayed into the mould cavity as opposed to the preferred gradual filling method.
During jetting the metal particles that are suspended in the binder can separate, causing
areas of high binder concentration with little metal. The image in Figure 4.12 shows typical
parts exhibiting jetting and powder separation.
Figure 4.12 Inconel 718 sample moulded using PEG 1500 flat part showing powder
separation (injection point on left hand side of image)
Full detail of the injection moulding settings used for each feedstock can be seen in Table
4.3.

55
Table 4.3 Injection moulding settings of Inconel 718 feedstock used for moulding of tensile
bars
Parameter PEG
1500
PEG
4000
PEG
6000
PEG
8000
PEG
10000
PEG
12000
PEG
20000
Barrel zone 1
temperature (°C)
90 90 90 90 90 90 100
Barrel zone 2
temperature (°C)
130 130 130 130 135 130 135
Barrel zone 3
temperature (°C)
135 135 135 135 140 135 145
Barrel zone 4
temperature (°C)
145 145 145 145 146 147 155
Barrel zone 4
temperature (°C)
150 150 150 150 152 155 160
Part volume (cm³) 8.7 8.7 8.7 8.7 8.7 8.7 8.7
Switch over volume
(cm³)
3.3 3.3 3.3 3.3 3.4 3.4 3.4
Cooling time (seconds) 45 45 45 45 45 45 45
Back pressure (bar) 20 20 20 20 20 20 20
Injection pressure (bar) 625 700 700 700 750 800 850
Injection speed 10 10 10 10 10 10 10
Hold pressure stage one
(bar)
625 700 700 700 750 800 850
Hold pressure stage two
(bar)
625 700 700 700 750 800 850
Hold pressure stage
three (bar)
25 25 25 25 25 25 25

56
As can be clearly seen from the injection moulding settings, the temperature of the feedstock
in the barrel was increased for the higher molecular weight of PEG (PEG 10000, 12000,
20000). This increase was justified, as flowability was poor at the original temperature,
resulting in incomplete and defected parts. Injection pressure and holding pressure was also
increased for higher molecular weight PEG for the improvement of flowability.
As few settings as possible were changed during injection moulding between feedstocks, to
reduce variability in part weight and dimensions.
After the parts were ejected from the mould tool and allowed to cool naturally, dimensional
measurements and part weights were taken for each. The overall length, as well as the neck
diameter of the tensile bar was taken for each part.
Table 4.4 summarises the weight and dimensional results taken from a sample range of ten
parts moulded from each feedstock.
57
Table 4.4 Injection moulded dimensions and weight for all feedstocks
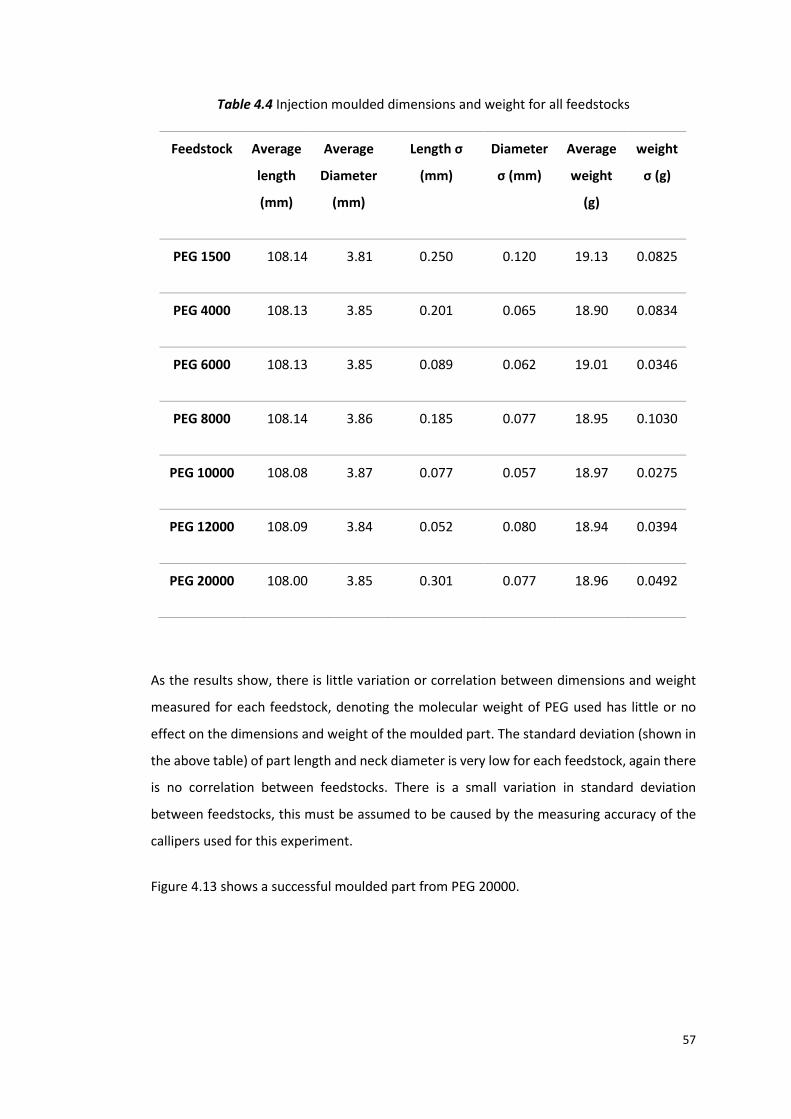
As the results show, there is little variation or correlation between dimensions and weight
measured for each feedstock, denoting the molecular weight of PEG used has little or no
effect on the dimensions and weight of the moulded part. The standard deviation (shown in
the above table) of part length and neck diameter is very low for each feedstock, again there
is no correlation between feedstocks. There is a small variation in standard deviation
between feedstocks, this must be assumed to be caused by the measuring accuracy of the
callipers used for this experiment.
Figure 4.13 shows a successful moulded part from PEG 20000.
Feedstock Average
length
(mm)
Average
Diameter
(mm)
Length σ
(mm)
Diameter
σ (mm)
Average
weight
(g)
weight
σ (g)
PEG 1500 108.14 3.81 0.250 0.120 19.13 0.0825
PEG 4000 108.13 3.85 0.201 0.065 18.90 0.0834
PEG 6000 108.13 3.85 0.089 0.062 19.01 0.0346
PEG 8000 108.14 3.86 0.185 0.077 18.95 0.1030
PEG 10000 108.08 3.87 0.077 0.057 18.97 0.0275
PEG 12000 108.09 3.84 0.052 0.080 18.94 0.0394
PEG 20000 108.00 3.85 0.301 0.077 18.96 0.0492
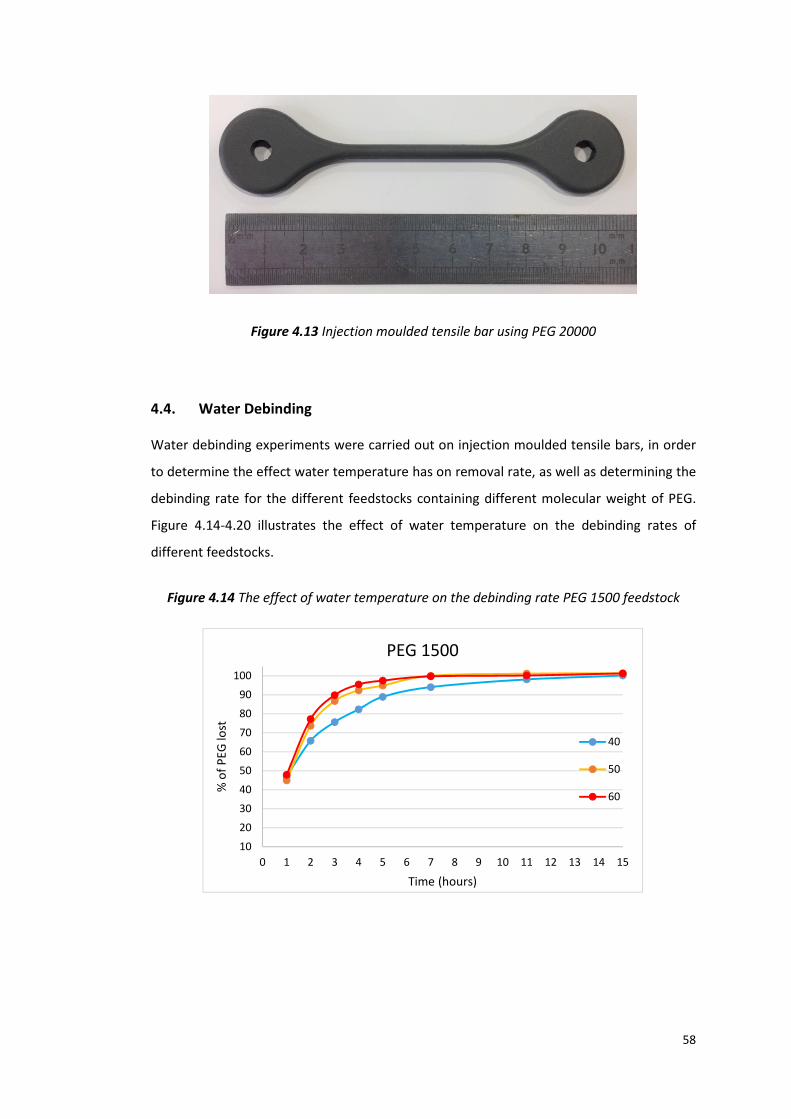
58
Figure 4.13 Injection moulded tensile bar using PEG 20000
4.4. Water Debinding
Water debinding experiments were carried out on injection moulded tensile bars, in order
to determine the effect water temperature has on removal rate, as well as determining the
debinding rate for the different feedstocks containing different molecular weight of PEG.
Figure 4.14-4.20 illustrates the effect of water temperature on the debinding rates of
different feedstocks.
Figure 4.14 The effect of water temperature on the debinding rate PEG 1500 feedstock
10
20
30
40
50
60
70
80
90
100
0 1 2 3 4 5 6 7 8 9 10 11 12 13 14 15
% o
f P
EG
lost
Time (hours)
PEG 1500
40
50
60
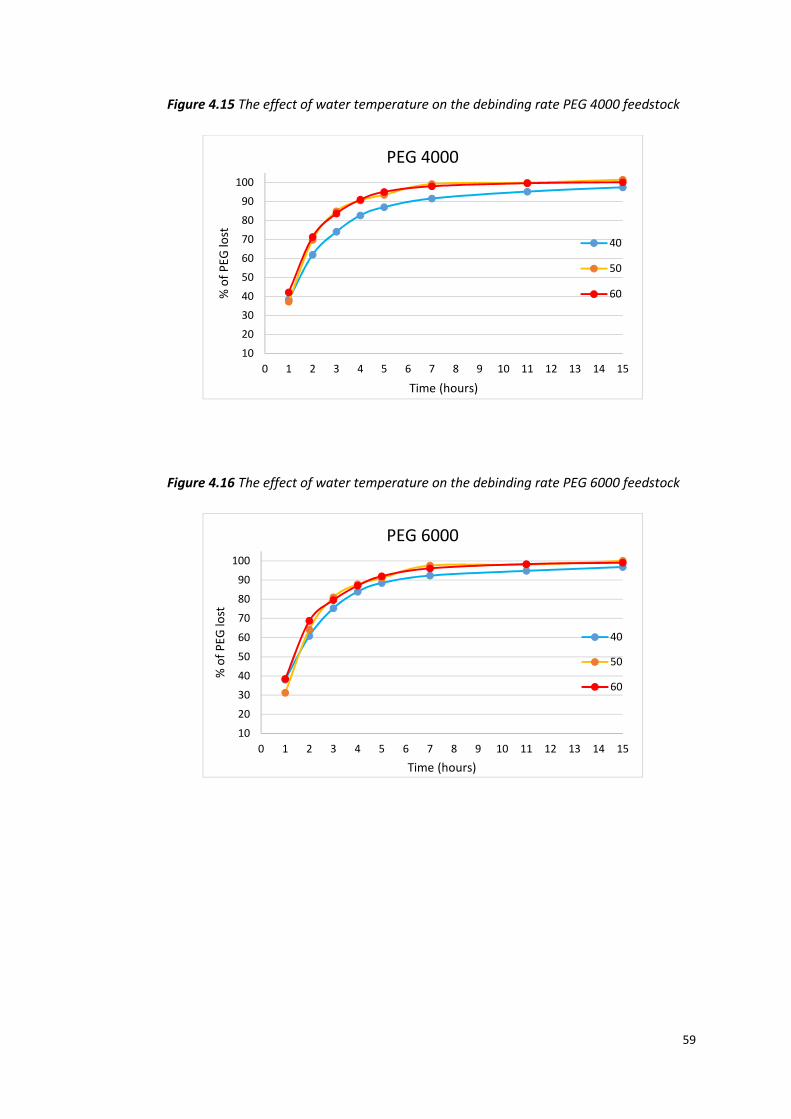
59
Figure 4.15 The effect of water temperature on the debinding rate PEG 4000 feedstock
Figure 4.16 The effect of water temperature on the debinding rate PEG 6000 feedstock
10
20
30
40
50
60
70
80
90
100
0 1 2 3 4 5 6 7 8 9 10 11 12 13 14 15
% o
f P
EG
lost
Time (hours)
PEG 4000
40
50
60
10
20
30
40
50
60
70
80
90
100
0 1 2 3 4 5 6 7 8 9 10 11 12 13 14 15
% o
f P
EG
lost
Time (hours)
PEG 6000
40
50
60
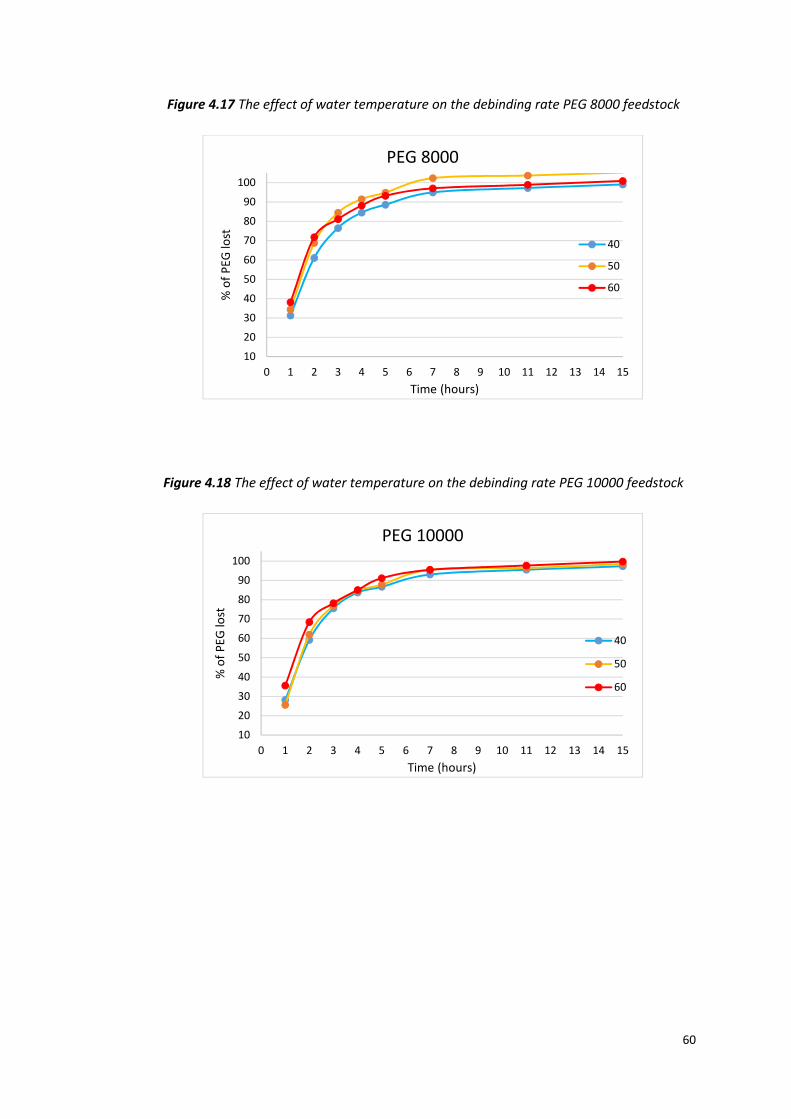
60
Figure 4.17 The effect of water temperature on the debinding rate PEG 8000 feedstock
Figure 4.18 The effect of water temperature on the debinding rate PEG 10000 feedstock
10
20
30
40
50
60
70
80
90
100
0 1 2 3 4 5 6 7 8 9 10 11 12 13 14 15
% o
f P
EG
lost
Time (hours)
PEG 8000
40
50
60
10
20
30
40
50
60
70
80
90
100
0 1 2 3 4 5 6 7 8 9 10 11 12 13 14 15
% o
f P
EG
lost
Time (hours)
PEG 10000
40
50
60
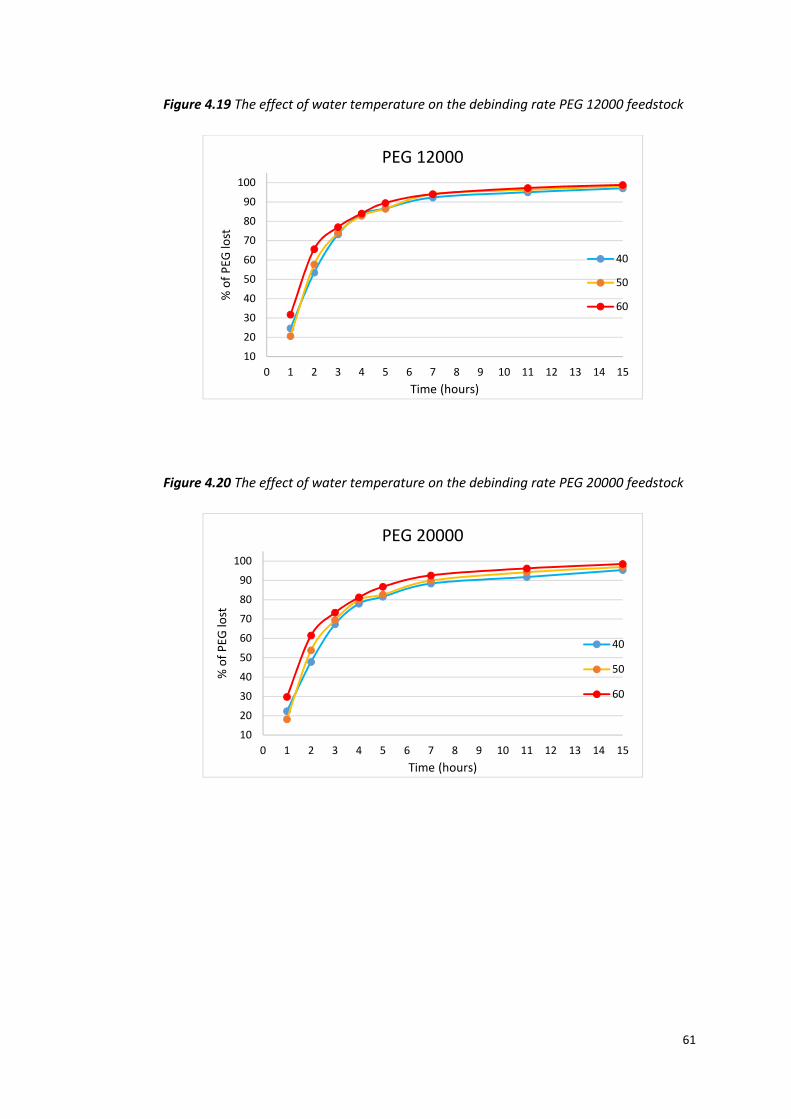
61
Figure 4.19 The effect of water temperature on the debinding rate PEG 12000 feedstock
Figure 4.20 The effect of water temperature on the debinding rate PEG 20000 feedstock
10
20
30
40
50
60
70
80
90
100
0 1 2 3 4 5 6 7 8 9 10 11 12 13 14 15
% o
f P
EG
lost
Time (hours)
PEG 12000
40
50
60
10
20
30
40
50
60
70
80
90
100
0 1 2 3 4 5 6 7 8 9 10 11 12 13 14 15
% o
f P
EG
lost
Time (hours)
PEG 20000
40
50
60

62
The results from graphs shown in Figure 4.14-4.20 clearly indicate that, as would be
expected, a higher water temperature results in an increase of the removal rate of the PEG,
no matter the molecular weight. The results show that debinding at 60°C is the quickest
method of those used for removing 100% of PEG from the parts.
It would be expected that higher temperatures would allow further decreases in removal
time, however debinding at 60°C has resulted in a few part defects; in particular, parts with
molecular weight PEG 1500. A higher debinding temperature increases the molecular
mobility and rate of diffusivity, however debinding at 60°C has proven to be too high as parts
have exhibited strength loss, cracking and swelling.53 The higher polymer chain length
reduces the PEG’s mobility in water, resulting in a disproportion between the penetration of
water compared to the diffusion of PEG, ultimately leading to the swelling and cracking
exhibited. 58 Figure 4.21 shows the defects caused to PEG 1500 during water debinding at
60°C.
Figure 4.21 Defects caused to PEG 1500 parts during debinding at 60°C
The effect of the molecular weight PEG on debinding time has also been interpreted into a
graph, shown in Figure 4.22-4.24. Debinding was carried out on all samples in order to
determine the overall weight loss and rate of loss between 0 and 15 hours.
Feedstocks with a higher molecular weight of PEG require a longer debinding time in order
to achieve a weight loss of 100%. This is because the polymer chain length is longer and takes
longer to break down.
10mm
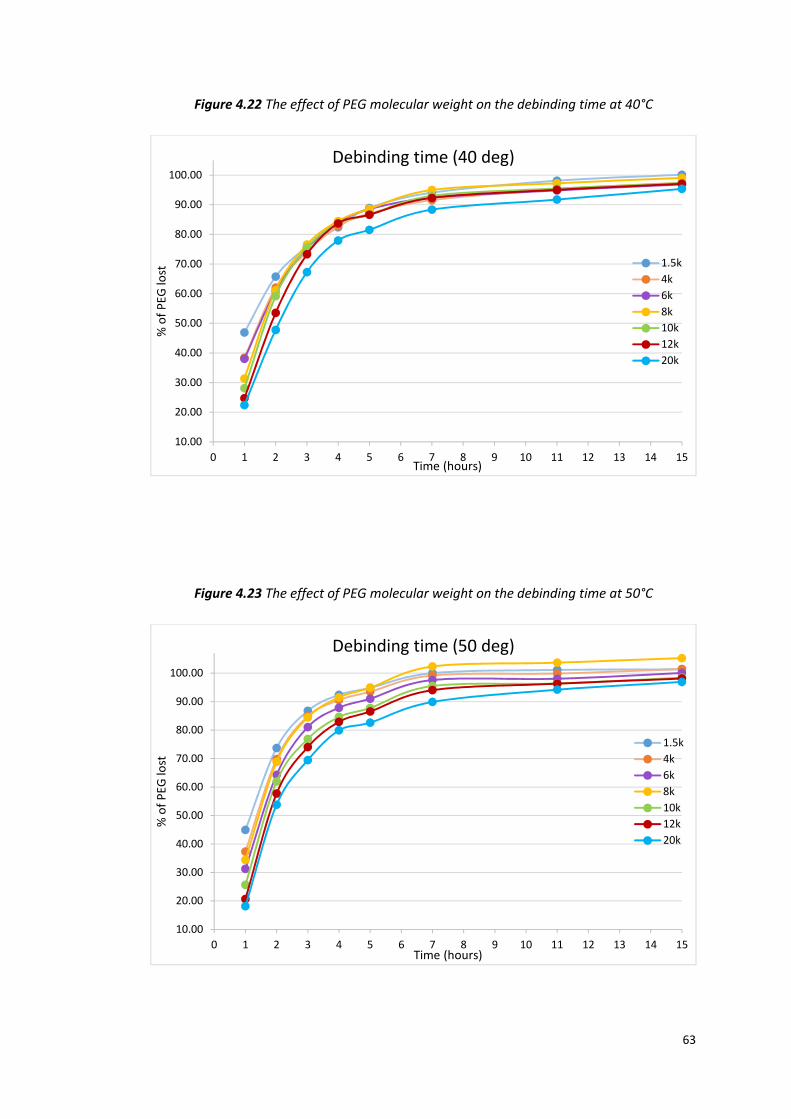
63
Figure 4.22 The effect of PEG molecular weight on the debinding time at 40°C
Figure 4.23 The effect of PEG molecular weight on the debinding time at 50°C
10.00
20.00
30.00
40.00
50.00
60.00
70.00
80.00
90.00
100.00
0 1 2 3 4 5 6 7 8 9 10 11 12 13 14 15
% o
f P
EG
lost
Time (hours)
Debinding time (40 deg)
1.5k
4k
6k
8k
10k
12k
20k
10.00
20.00
30.00
40.00
50.00
60.00
70.00
80.00
90.00
100.00
0 1 2 3 4 5 6 7 8 9 10 11 12 13 14 15
% o
f P
EG
lost
Time (hours)
Debinding time (50 deg)
1.5k
4k
6k
8k
10k
12k
20k
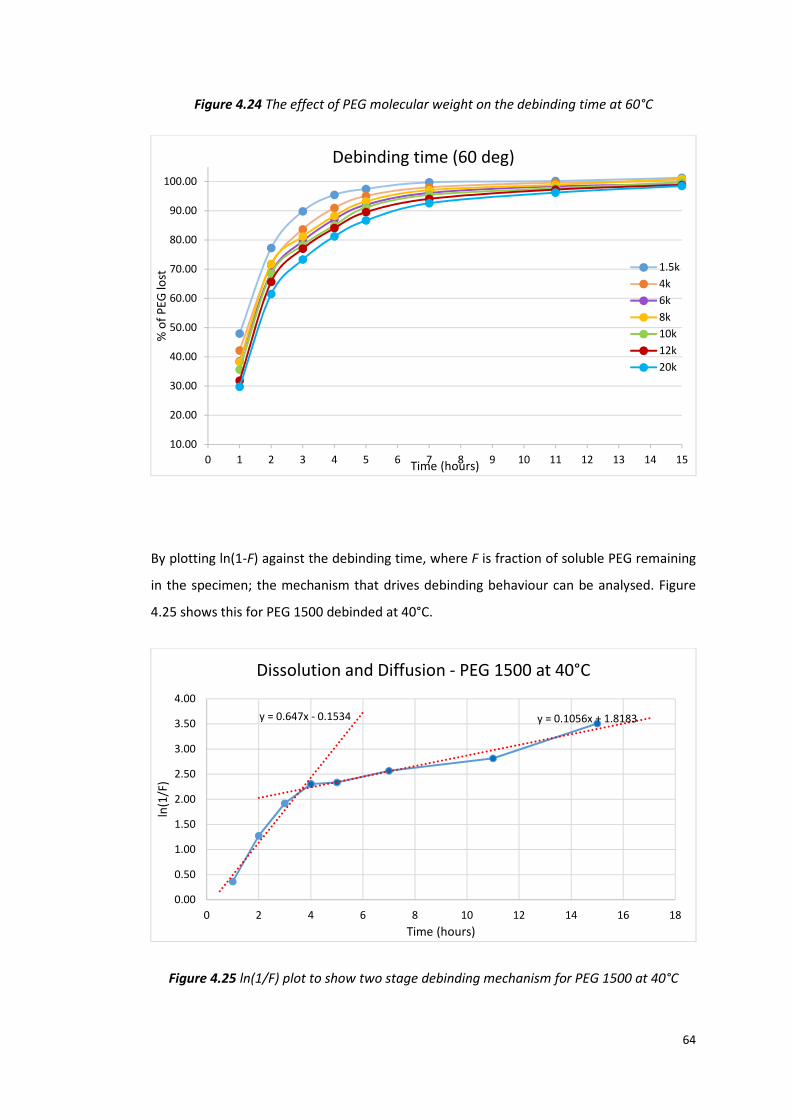
64
Figure 4.24 The effect of PEG molecular weight on the debinding time at 60°C
By plotting ln(1-F) against the debinding time, where F is fraction of soluble PEG remaining
in the specimen; the mechanism that drives debinding behaviour can be analysed. Figure
4.25 shows this for PEG 1500 debinded at 40°C.
Figure 4.25 ln(1/F) plot to show two stage debinding mechanism for PEG 1500 at 40°C
10.00
20.00
30.00
40.00
50.00
60.00
70.00
80.00
90.00
100.00
0 1 2 3 4 5 6 7 8 9 10 11 12 13 14 15
% o
f P
EG
lost
Time (hours)
Debinding time (60 deg)
1.5k
4k
6k
8k
10k
12k
20k
y = 0.647x - 0.1534 y = 0.1056x + 1.8183
0.00
0.50
1.00
1.50
2.00
2.50
3.00
3.50
4.00
0 2 4 6 8 10 12 14 16 18
ln(1
/F)
Time (hours)
Dissolution and Diffusion - PEG 1500 at 40°C

65
As can be seen from Figure 4.25, water debinding is a two stage process, with an initial
dissolution phase where the water molecules interact with the PEG at the components
surface, before creating a network of pores to then extract PEG by capillary action via
diffusion. It can be seen that the dissolution phase lasts for approximately 4 hours for this
specific example and the rate of PEG removal is faster than the latter diffusion stage. This is
shown by plotting a linear trend line for each stage and evaluating the line gradients. The
line gradients for the dissolution and diffusion stages are 0.647 and 0.151 respectively.
Therefore the dissolution rate is 4.3 times quicker than the diffusion rate for this specific
example.
Both the PEG molecular weight and debinding temperature will have an impact on these two
mechanisms.
Figure 4.26 shows the ln(1/F) plot for PEG 1500 components debinded at different
temperatures.
Figure 4.26 ln(1/F) plot to show two stage debinding mechanism for PEG 1500 increasing
water temperatures
It can be clearly seen that the diffusion rate of PEG is increased with a higher water debinding
temperature for PEG 1500 at water bath temperatures of 40°C, 50°C and 60°C. The same
trend has been found for all PEG molecular weights used in this work.
0.00
1.00
2.00
3.00
4.00
5.00
6.00
7.00
8.00
1 3 5 7 9 11 13 15
ln(1
/F)
Time (hours)
Dissolution and Diffusion- PEG 1500
40
50
60
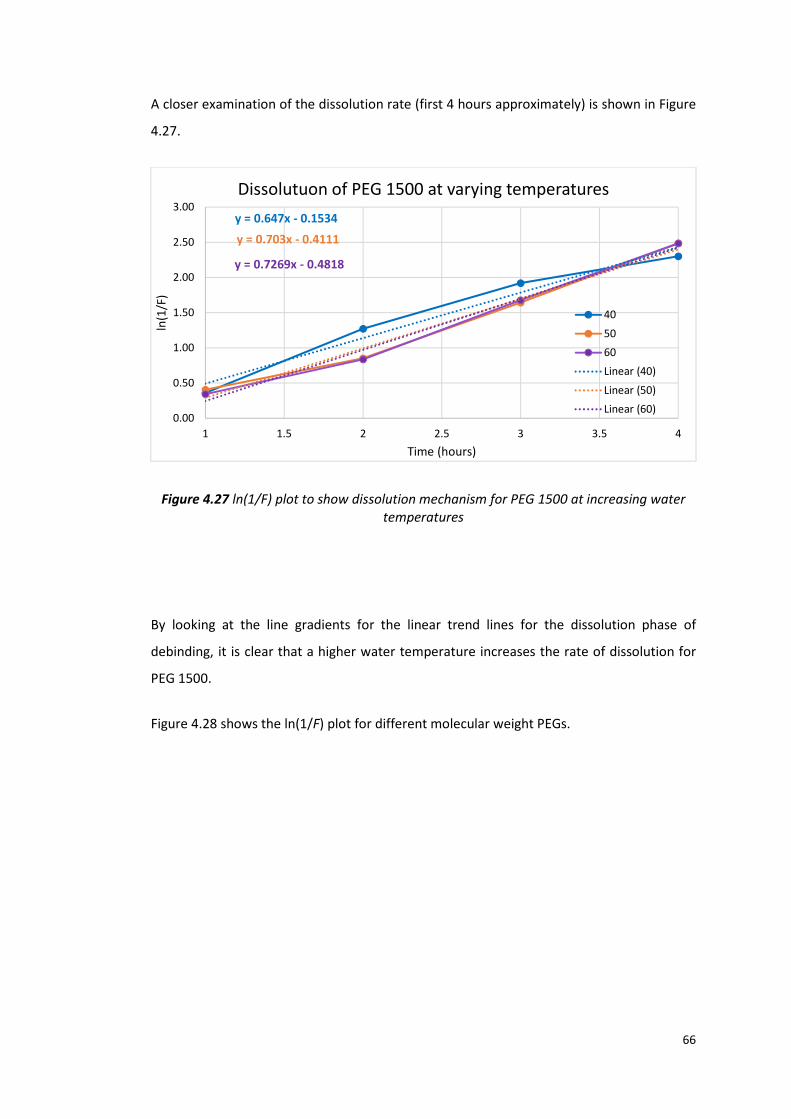
66
A closer examination of the dissolution rate (first 4 hours approximately) is shown in Figure
4.27.
Figure 4.27 ln(1/F) plot to show dissolution mechanism for PEG 1500 at increasing water
temperatures
By looking at the line gradients for the linear trend lines for the dissolution phase of
debinding, it is clear that a higher water temperature increases the rate of dissolution for
PEG 1500.
Figure 4.28 shows the ln(1/F) plot for different molecular weight PEGs.
y = 0.647x - 0.1534
y = 0.703x - 0.4111
y = 0.7269x - 0.4818
0.00
0.50
1.00
1.50
2.00
2.50
3.00
1 1.5 2 2.5 3 3.5 4
ln(1
/F)
Time (hours)
Dissolutuon of PEG 1500 at varying temperatures
40
50
60
Linear (40)
Linear (50)
Linear (60)
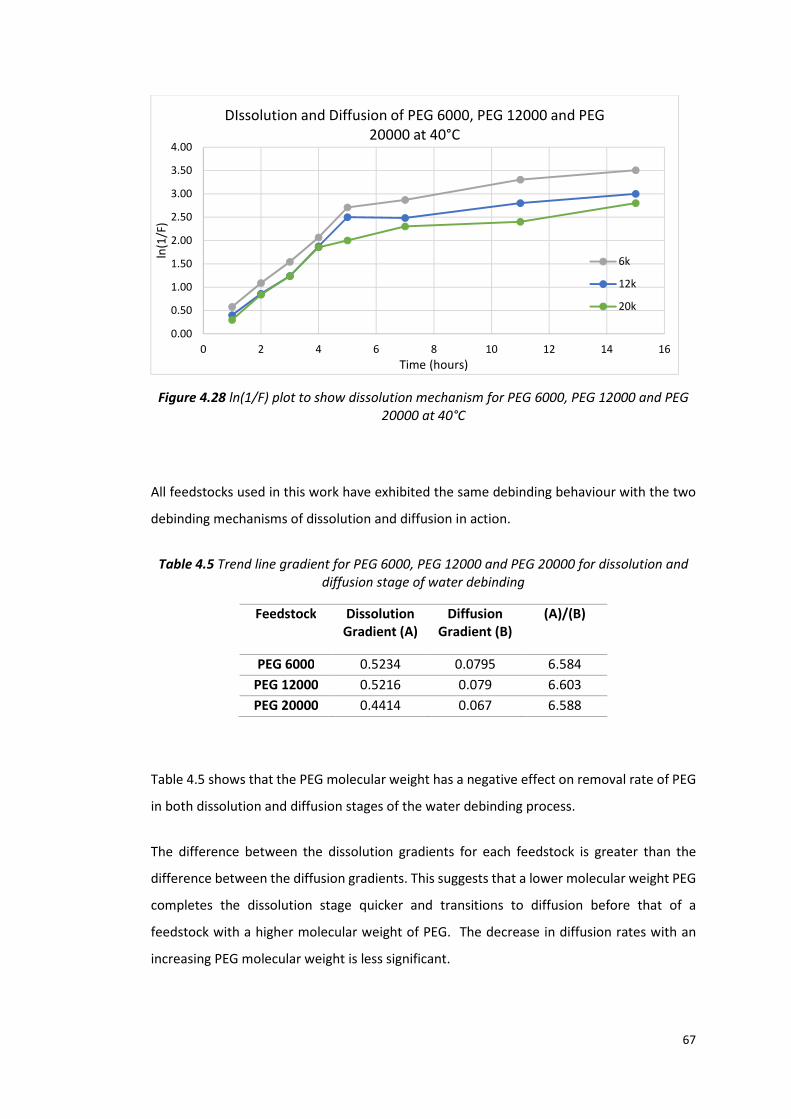
67
Figure 4.28 ln(1/F) plot to show dissolution mechanism for PEG 6000, PEG 12000 and PEG
20000 at 40°C
All feedstocks used in this work have exhibited the same debinding behaviour with the two
debinding mechanisms of dissolution and diffusion in action.
Table 4.5 Trend line gradient for PEG 6000, PEG 12000 and PEG 20000 for dissolution and
diffusion stage of water debinding
Feedstock Dissolution
Gradient (A)
Diffusion
Gradient (B)
(A)/(B)
PEG 6000 0.5234 0.0795 6.584
PEG 12000 0.5216 0.079 6.603
PEG 20000 0.4414 0.067 6.588
Table 4.5 shows that the PEG molecular weight has a negative effect on removal rate of PEG
in both dissolution and diffusion stages of the water debinding process.
The difference between the dissolution gradients for each feedstock is greater than the
difference between the diffusion gradients. This suggests that a lower molecular weight PEG
completes the dissolution stage quicker and transitions to diffusion before that of a
feedstock with a higher molecular weight of PEG. The decrease in diffusion rates with an
increasing PEG molecular weight is less significant.
0.00
0.50
1.00
1.50
2.00
2.50
3.00
3.50
4.00
0 2 4 6 8 10 12 14 16
ln(1
/F)
Time (hours)
DIssolution and Diffusion of PEG 6000, PEG 12000 and PEG
20000 at 40°C
6k
12k
20k

68
4.5. Sintering
Following debinding at 40°C, 50°C and 60°C, the tensile bars were dried in an oven for 24
hours at a temperature of 30°C. The parts were then sintered following the process
previously outlined in the experimental procedure chapter. The sintering cycle yielded
consistent parts, in terms of physical appearance. However the parts that swelled and
cracked during debinding at 60°C have cracked further after sintering.
4.6. Dimensional and Density Measurements of Sintered Samples
Table 4.6 outlines the change in dimensions as well as part density for each sintered
component. Measurements were taken from three samples and averages of dimensions and
density were calculated.
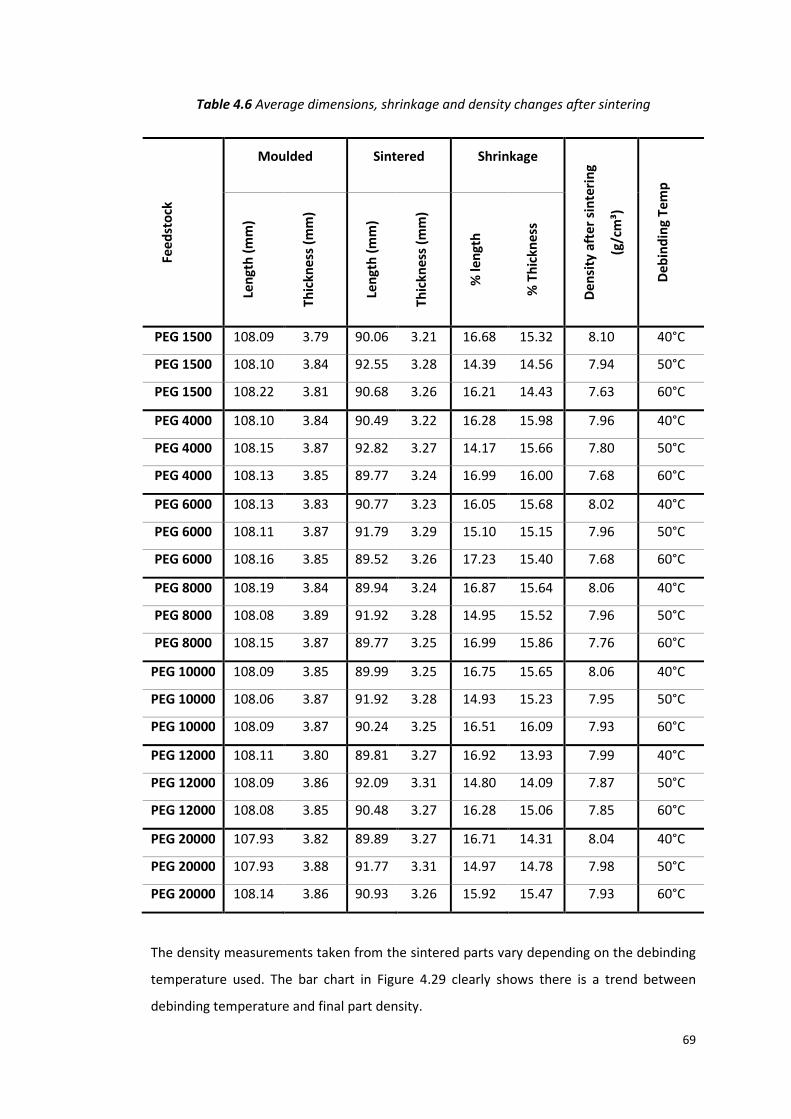
69
Table 4.6 Average dimensions, shrinkage and density changes after sintering
The density measurements taken from the sintered parts vary depending on the debinding
temperature used. The bar chart in Figure 4.29 clearly shows there is a trend between
debinding temperature and final part density.
Fee
dst
ock
Moulded Sintered Shrinkage
De
nsi
ty a
fte
r si
nte
rin
g
(g/c
m³)
De
bin
din
g T
em
p
Len
gth
(m
m)
Th
ick
ne
ss (
mm
)
Len
gth
(m
m)
Th
ick
ne
ss (
mm
)
% l
en
gth
% T
hic
kn
ess
PEG 1500 108.09 3.79 90.06 3.21 16.68 15.32 8.10 40°C
PEG 1500 108.10 3.84 92.55 3.28 14.39 14.56 7.94 50°C
PEG 1500 108.22 3.81 90.68 3.26 16.21 14.43 7.63 60°C
PEG 4000 108.10 3.84 90.49 3.22 16.28 15.98 7.96 40°C
PEG 4000 108.15 3.87 92.82 3.27 14.17 15.66 7.80 50°C
PEG 4000 108.13 3.85 89.77 3.24 16.99 16.00 7.68 60°C
PEG 6000 108.13 3.83 90.77 3.23 16.05 15.68 8.02 40°C
PEG 6000 108.11 3.87 91.79 3.29 15.10 15.15 7.96 50°C
PEG 6000 108.16 3.85 89.52 3.26 17.23 15.40 7.68 60°C
PEG 8000 108.19 3.84 89.94 3.24 16.87 15.64 8.06 40°C
PEG 8000 108.08 3.89 91.92 3.28 14.95 15.52 7.96 50°C
PEG 8000 108.15 3.87 89.77 3.25 16.99 15.86 7.76 60°C
PEG 10000 108.09 3.85 89.99 3.25 16.75 15.65 8.06 40°C
PEG 10000 108.06 3.87 91.92 3.28 14.93 15.23 7.95 50°C
PEG 10000 108.09 3.87 90.24 3.25 16.51 16.09 7.93 60°C
PEG 12000 108.11 3.80 89.81 3.27 16.92 13.93 7.99 40°C
PEG 12000 108.09 3.86 92.09 3.31 14.80 14.09 7.87 50°C
PEG 12000 108.08 3.85 90.48 3.27 16.28 15.06 7.85 60°C
PEG 20000 107.93 3.82 89.89 3.27 16.71 14.31 8.04 40°C
PEG 20000 107.93 3.88 91.77 3.31 14.97 14.78 7.98 50°C
PEG 20000 108.14 3.86 90.93 3.26 15.92 15.47 7.93 60°C

70
Figure 4.29 Part density after sintering for each debinding temperature
An increased debinding temperature has a significant impact on the part density after
sintering, particularly in the feedstocks with a lower molecular weight (PEG 1500 – PEG
8000). The density of the sintered part is lower if the water temperature during debinding is
above 40°C. At a higher water temperature, the PEG inside the parts swells during extraction
in the water bath as was seen by the part defects in the previous chapter, this results in an
increased pore size between metal particles in the part. This has lower impact on the high
molecular weight PEG, because of the higher polymer chain length, which reduces the uptake
of water by the material and therefore swelling. The polymer requires a greater amount of
energy in order to separate the PEG molecules, resulting in less part swelling and a steadier
debinding rate.
The theoretical density of Inconel 718 is 8.19 g/cm³. As expected from the MIM process, this
density is not achieved. 25 Theoretical density could be achieved through hot isostatic
pressing (HIP) of the sintered parts after completion of the MIM process.
There is no clear relationship in dimensional shrinkage after sintering for each feedstock and
debinding temperature. Hand held digital callipers were used to measure the dimensions of
the parts before and after sintering. Using a more sensitive and accurate piece of equipment
could have shown a trend between the different feedstocks or debinding temperatures. The
difference in measured sintered density between parts water debinded at different water
temperatures would suggest there should also be a dimensional difference between sintered
parts.
7.30
7.40
7.50
7.60
7.70
7.80
7.90
8.00
8.10
8.20
PEG 1500 PEG 4000 PEG 6000 PEG 8000 PEG 10000 PEG 12000 PEG 20000
De
nsi
ty (
g/c
m³)
Feedstock
Sintered Densities 40°C
50°C
60°C
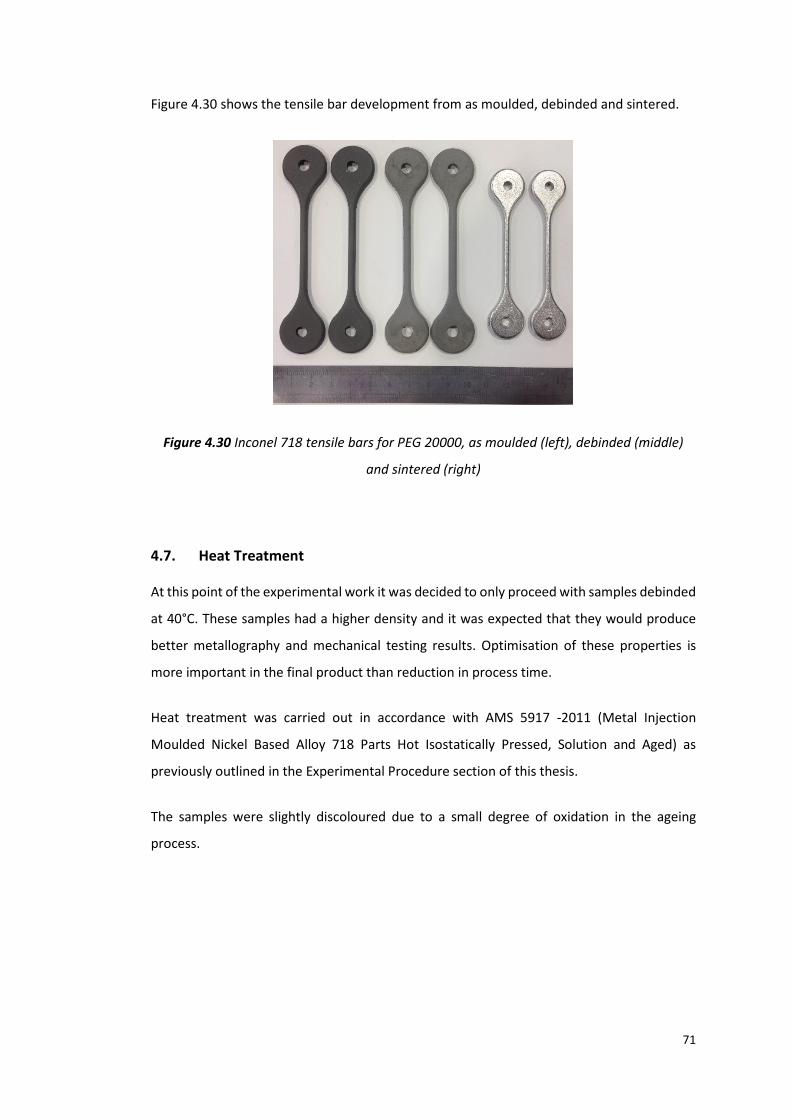
71
Figure 4.30 shows the tensile bar development from as moulded, debinded and sintered.
Figure 4.30 Inconel 718 tensile bars for PEG 20000, as moulded (left), debinded (middle)
and sintered (right)
4.7. Heat Treatment
At this point of the experimental work it was decided to only proceed with samples debinded
at 40°C. These samples had a higher density and it was expected that they would produce
better metallography and mechanical testing results. Optimisation of these properties is
more important in the final product than reduction in process time.
Heat treatment was carried out in accordance with AMS 5917 -2011 (Metal Injection
Moulded Nickel Based Alloy 718 Parts Hot Isostatically Pressed, Solution and Aged) as
previously outlined in the Experimental Procedure section of this thesis.
The samples were slightly discoloured due to a small degree of oxidation in the ageing
process.
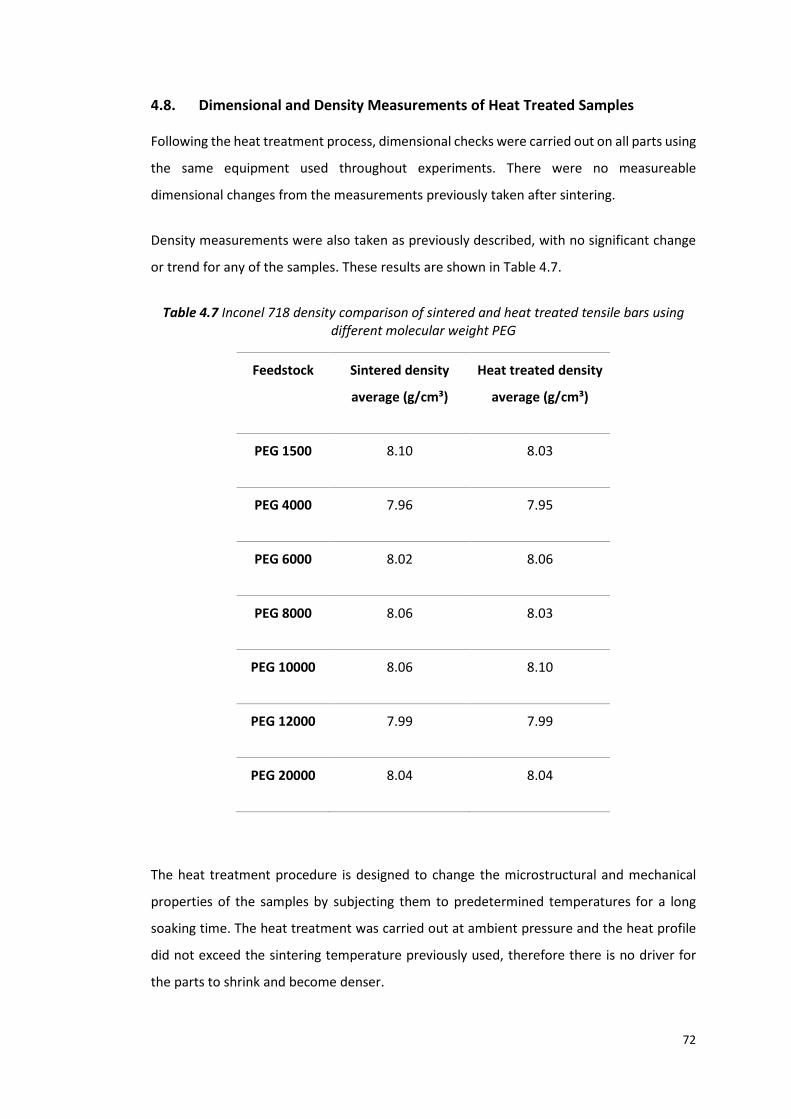
72
4.8. Dimensional and Density Measurements of Heat Treated Samples
Following the heat treatment process, dimensional checks were carried out on all parts using
the same equipment used throughout experiments. There were no measureable
dimensional changes from the measurements previously taken after sintering.
Density measurements were also taken as previously described, with no significant change
or trend for any of the samples. These results are shown in Table 4.7.
Table 4.7 Inconel 718 density comparison of sintered and heat treated tensile bars using
different molecular weight PEG
Feedstock Sintered density
average (g/cm³)
Heat treated density
average (g/cm³)
PEG 1500 8.10 8.03
PEG 4000 7.96 7.95
PEG 6000 8.02 8.06
PEG 8000 8.06 8.03
PEG 10000 8.06 8.10
PEG 12000 7.99 7.99
PEG 20000 8.04 8.04
The heat treatment procedure is designed to change the microstructural and mechanical
properties of the samples by subjecting them to predetermined temperatures for a long
soaking time. The heat treatment was carried out at ambient pressure and the heat profile
did not exceed the sintering temperature previously used, therefore there is no driver for
the parts to shrink and become denser.

73
4.9. Microstructure Investigation
The mounted, polished and etched samples in both the as sintered and solution treated
condition from each PEG containing tensile bar, were examined using optical microscopy to
examine if the PEG molecular weight could have any effect on the microstructure and
porosity of the parts.
The pores in each sample appeared fairly round and evenly distributed, with no large
irregular voids; this indicates the moulding process has been consistent throughout and the
feedstock has been evenly and smoothly injected into the mould. Large voids present under
the microscope would indicate the parts have not been fully moulded.
There is little difference or correlation in the appearance of the microstructure across the
different samples, indicating the molecular weight of PEG used in the feedstock has no effect
on the sintered and heat treated microstructure, if all sintering and heat treatment
parameters are kept the same. . The measured average grain size also shows little difference
or correlation between samples.
Figure 4.31 shows the microstructure and pore distribution for a sample produced from the
PEG 20000 feedstock, in both the as sintered and solution treated and aged condition, at
different magnifications.
The average grain size, taken from the solution treated and aged micrograph, is very fine,
measuring 7.73 µm (average grain size intercept method used).
The microstructure of the solution treated and aged sample consists of particle boundaries
that are similar in size and shape of the initial spherical powder used. The dark particles that
can be seen at grain boundary triple points are assumed to be precipitates of Inconel 718.
The solution treatment and ageing process has improved the homogeneity of the
microstructure; the pores seem to be more evenly distributed, the presence of precipitates
at the grain boundaries are more apparent and the grain size is reduced, as compared to the
sintered sample.
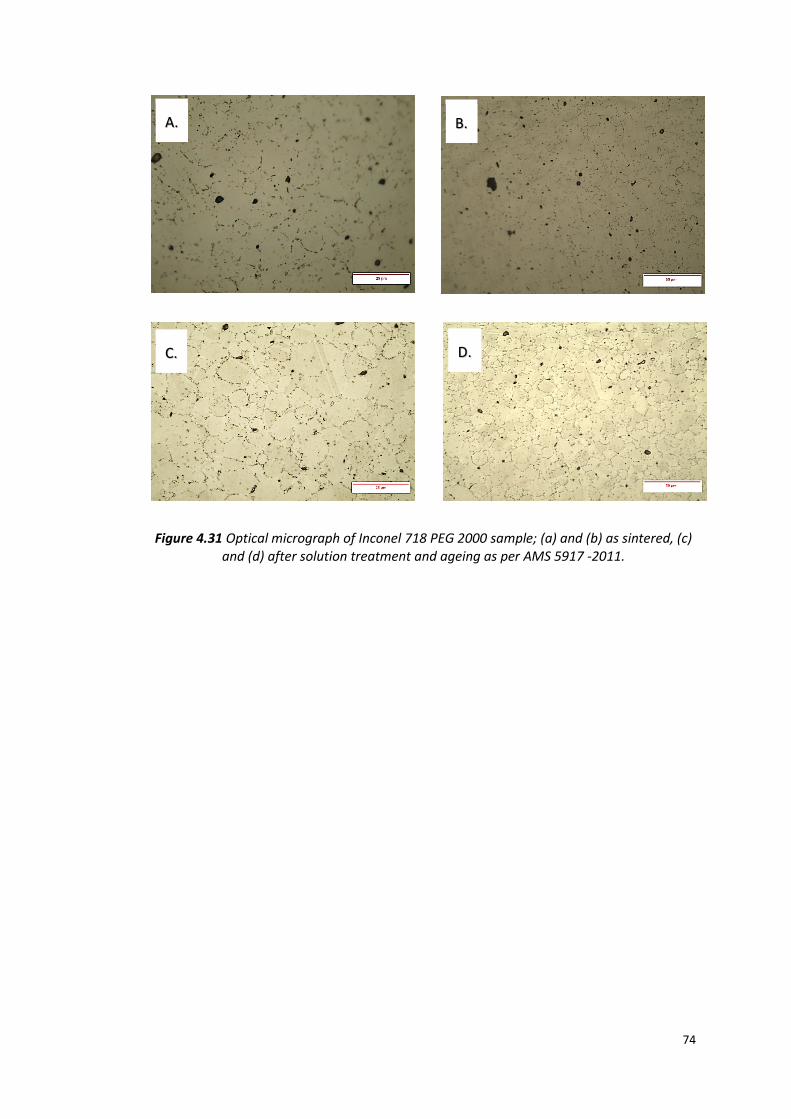
74
Figure 4.31 Optical micrograph of Inconel 718 PEG 2000 sample; (a) and (b) as sintered, (c)
and (d) after solution treatment and ageing as per AMS 5917 -2011.
A. B.
D. C.

75
4.10. Tensile Testing
The tensile testing was carried out as outlined in the previous section of this thesis. Three
samples from each feedstock were tested. Each of the parts fractured towards the centre of
the gauge length, which indicates there were no significant defects or holes along this length.
The fracture surface of each of the parts is clean and flat, with no visible holes or defects at
the point of breaking.
The results from the tensile testing of all sintered and heat treated tensile bars debinded at
40°C are shown in Table 4.8 and Figure 4.32. Average values were taken from the three
samples tested for each PEG.
Table 4.8 Inconel 718 solution treated and aged mechanical properties of tensile bars
Feedstock Young’s Modulus
(GPa)
0.2% P.S. (MPa) UTS (MPa) Density
PEG 1500 272.4 947.5 1133.2 8.03
PEG 4000 273.0 968.1 1232.0 7.95
PEG 6000 259.2 954.5 1155.3 8.06
PEG 8000 271.5 952.1 1085.0 8.03
PEG 10000 234.0 938.4 1110.7 8.10
PEG 12000 256.4 944.7 1157.9 7.99
PEG 20000 252.13 969.53 1128.43 8.04
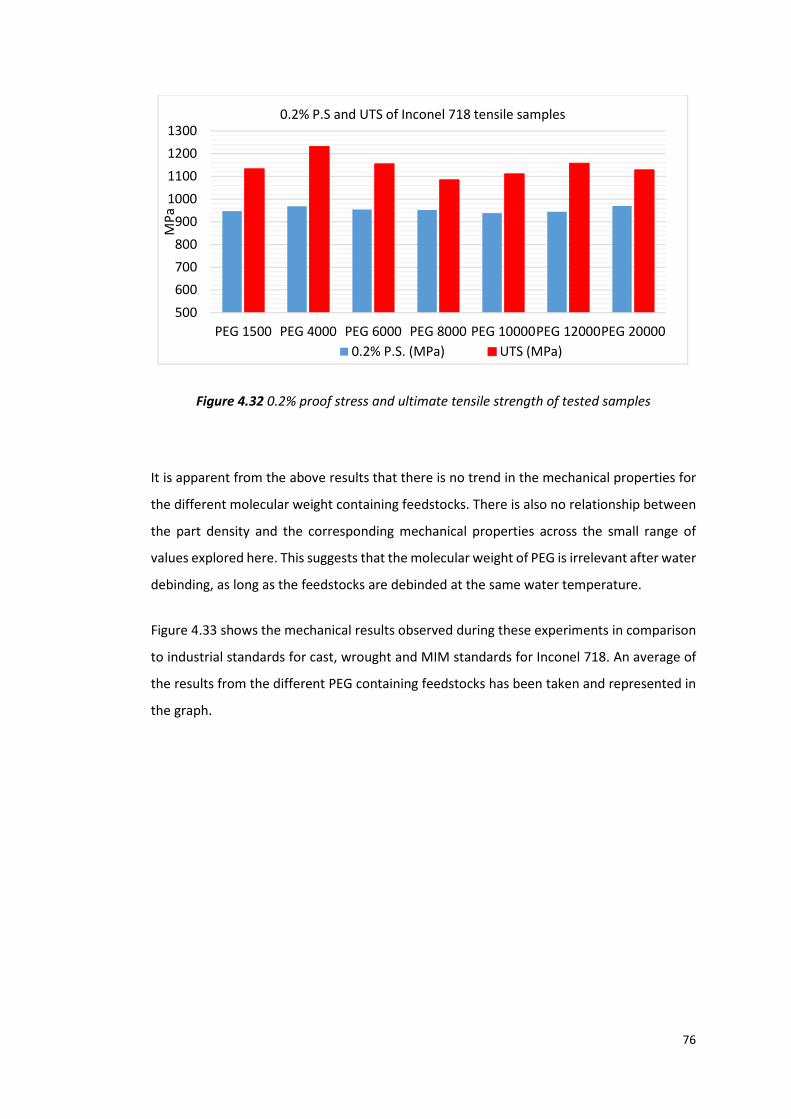
76
Figure 4.32 0.2% proof stress and ultimate tensile strength of tested samples
It is apparent from the above results that there is no trend in the mechanical properties for
the different molecular weight containing feedstocks. There is also no relationship between
the part density and the corresponding mechanical properties across the small range of
values explored here. This suggests that the molecular weight of PEG is irrelevant after water
debinding, as long as the feedstocks are debinded at the same water temperature.
Figure 4.33 shows the mechanical results observed during these experiments in comparison
to industrial standards for cast, wrought and MIM standards for Inconel 718. An average of
the results from the different PEG containing feedstocks has been taken and represented in
the graph.
500
600
700
800
900
1000
1100
1200
1300
PEG 1500 PEG 4000 PEG 6000 PEG 8000 PEG 10000PEG 12000PEG 20000
MP
a
0.2% P.S and UTS of Inconel 718 tensile samples
0.2% P.S. (MPa) UTS (MPa)

77
Figure 4.33 MIM of Inconel 718 0.2% P.S and UTS in comparison with industrial standards
The results obtained are superior to the properties for AMS 5383 for cast Inconel 718. This
is to be expected as cast parts include a greater size and number of pores and defects,
resulting in a lower density. Also the scale of the microstructure in the MIM material
compared to cast is finer, originating for the fine powder used. The results are inferior to
AMS 5662 for wrought Inconel 718.
The MIM standard AMS 5917 is for sintered, heat treated and HIP’ed test pieces. The results
from these experiments are currently inferior to this standard, however a HIP process has
not been carried out on the MIM samples, which could significantly increase the mechanical
properties.
500
700
900
1100
1300
1500
Cast (AMS 5383) Wrought (AMS 5662) MIM (AMS 5917) PEG 1000 - 20000
(average)
MP
a
MIM of Inconel 718 mechanical property comparison with industry
standards
0.2% P.S. (MPa) UTS (MPa)
78
5. Conclusions
This work has examined the use of MIM of Inconel 718 with different molecular weight PEG
components in the binder, assessing the effects on mouldabilty, debinding rates and
temperature and sinterability and resulting mechanical and physical properties.
• The use of a high molecular weight PEG resulted in a higher shear viscosity at higher
shear rates during rheology.
• With an increasing molecular weight, flow sensitivity at increasing temperatures
decreases.
• During rheology the temperature has little to no effect for any of the feedstocks at a
low shear rate, the shear viscosity appears unaffected by change of temperature.
• After injection moulding of tensile bars, there is little variation or correlation
between the dimensions and weight measured for each feedstock, denoting the
molecular weight of PEG has little or no effect on the dimensions and weight of the
moulded part
• An increase in water temperature during debinding has an overall increase on the
removal rate of the PEG.
• The higher molecular weight of PEG requires a longer soaking time during debinding,
in order to achieve a weight loss of 100%.
• A higher water debinding temperature results in a lower part density after sintering
• There is no clear relationship in dimensional shrinkage after sintering for each
feedstock debinded at the same temperature.
• The molecular weight of PEG used in a feedstock has no effect on the microstructure
or pore size and distribution when observed under optical microscopy.
• There is no trend observed in the mechanical properties of parts moulded using
different molecular weight PEG.
• It can be deduced that the molecular weight of PEG is irrelevant after water
debinding, as long at the feedstocks are debinded at the same water temperature.
• The mechanical properties are superior to that of AMS 5383 (cast) and inferior in
comparison with AMS 5662 (wrought)
• The mechanical properties are also currently inferior to that of the MIM standard
AMS 5917, however further HIP’ing of the components could improve mechanical
strength.
79
6. References
1. Nalbant M, Altın A, Gökkaya H. The effect of cutting speed and cutting tool geometry
on machinability properties of nickel-base Inconel 718 super alloys. Mater. Des.
2007;28(4):1334-1338. doi:10.1016/j.matdes.2005.12.008.
2. Choudhury I a, El-Baradie M a. Machining nickel base superalloys: Inconel 718. Proc.
Inst. Mech. Eng. Part B J. Eng. Manuf. 1998;212(3):195-206.
doi:10.1243/0954405981515617.
3. Range M, Temperature C. INCONEL alloy 718.
4. Donachie MJ, Donachie SJ. SUPERALLOYS Second Edition.; 2002.
5. Contreras JM, Jiménez-Morales A, Torralba JM. Improvement of rheological
properties of Inconel 718 MIM feedstock using tailored particle size distributions.
Powder Metall. 2008;51(2):103-106. doi:10.1179/174329008X313342.
6. Sidambe AT, Derguti F, Russell AD, Todd I. Influence of processing on the properties
of IN718 parts produced via Metal Injection Moulding. 2013;7(4):81-85.
7. Latham D. The Sinter Joining of Metal Injection Moulded Components Table of
Contents. 2011;(100144990).
8. Davies P. Metal Injection Moulding of Heat Treated Alloy 718 Master Alloy.
9. Davies P, Dunstan G, Hayward A, Howells R. Special feature Aerospace adds lustre to
appeal of master alloy MIM feedstocks. 2004;(November):14-18.
10. El-bagoury N, Ramadan M. Heat Treatment Effect on Microstructure and Mechanical
Properties of Re-Containing Inconel 718 Alloy. 2012;2012(September):924-930.
11. Sago JA, Newkirk JW, Ct J. Author Index THE EFFECTS OF MIM PROCESSING
PARAMETERS ON VARIATIONS IN PART WEIGHTS AND DIMENSIONS.
12. Newell M a., Davies H a., Messer PF, Greensmith DJ. Metal injection moulding of
scissors using hardenable stainless steel powders. Powder Metall. 2005;48(3):227-
230. doi:10.1179/174329005X71920.
80
13. Chuankrerkkul N, Messer PF, Davies H a. Flow and void formation in powder injection
moulding feedstocks made with PEG/PMMA binders Part 1 – Experimental
observations. Powder Metall. 2008;51(1):66-71. doi:10.1179/174329008X271600.
14. Chuankrerkkul N, Messer PF, Davies H a. Flow and void formation in powder injection
moulding feedstocks made with PEG/PMMA binders Part 2 – Slip band model. Powder
Metall. 2008;51(1):72-77. doi:10.1179/174329008X271628.
15. Sidambe a. T, Figueroa I a., Hamilton HGC, Todd I. Metal injection moulding of CP-Ti
components for biomedical applications. J. Mater. Process. Technol.
2012;212(7):1591-1597. doi:10.1016/j.jmatprotec.2012.03.001.
16. Rao GA, Kumar M, Srinivas M, Sarma DS. Effect of standard heat treatment on the
microstructure and mechanical properties of hot isostatically pressed superalloy
inconel 718. Mater. Sci. Eng. A 2003;355(1-2):114-125. doi:10.1016/S0921-
5093(03)00079-0.
17. Yoon TS, Lee YH, Ahn SH, Lee JH, Lee CS. Effects of Sintering Conditions on the
Mechanical Properties of Metal Injection Molded 316L Stainless Steel. ISIJ Int.
2003;43(1):119-126. doi:10.2355/isijinternational.43.119.
18. Omar MA, Davies HA, Messer PF, Ellis B. The in ¯ uence of PMMA content on the
properties of 316L stainless steel MIM compact. 2001;113:477-481.
19. SAE Aerospace. AMS 5917-2011-08.; 2011.
20. GKN. Turbo / Supercharger Components. Available at:
http://www.gkn.com/sintermetals/products/engine/turbo-supercharger-
components/Pages/default.aspx. Accessed March 24, 2014.
21. Standard G. Technical trends Gas atomisation and the economics of blowing hot and
cold. 2004;(June):38-41.
22. Hartwig T, Veltl G, Petzoldt F, Kunze H, Schollb R, Kiebackb B. Powders for Metal
Injection Molding. 1998;18:1211-1216.
23. García-Escorial a., Lieblich M. Microstructural characterisation of Ni75Al25 and
Ni31.5Al68.5 powder particles produced by gas atomisation. J. Alloys Compd.
81
2014;586:S489-S493. doi:10.1016/j.jallcom.2012.10.138.
24. Adames JM. Characterization of polymeric binders for metal injection moulding
(MIM). 2007;(Mim).
25. German RM. Powder Injection Moulding. New Jersey: Metal Powder Industries
Foundation; 1990.
26. Beddow JK. The Production of Metal Powders by Atomization. Heydon, London:
Technology and Engineering; 1978.
27. Simchi a., Petzoldt F. Cosintering of Powder Injection Molding Parts Made from
Ultrafine WC-Co and 316L Stainless Steel Powders for Fabrication of Novel Composite
Structures. Metall. Mater. Trans. A 2009;41(1):233-241. doi:10.1007/s11661-009-
0045-5.
28. Pahat B, Process P. RHEOLOGICAL INVESTIGATION OF WATER ATOMISED STAINLESS
STEEL. 2009;4(1):1-8.
29. German RM. Powder Injection Molding Using Water Atomized 316L Stainless Steel.
Int. J. Powder Metall. 1995;31(3).
30. Persson F. A Study of Factors Affecting the Particle Size for Water Atomised Metal
Powders.; 2012.
31. Martyn MT, James PJ. The processing of hardmetal components by powder injection
moulding. Int. J. Refract. Met. Hard Mater. 1993;12:61-69. doi:10.1016/0263-
4368(93)90017-A.
32. Asai K. Nippon Seisen Learns from its MIM Experience. Met. Prog. Report, PM Spec.
Featur. 1993.
33. Park S-J, Wu Y, Heaney DF, Zou X, Gai G, German RM. Rheological and Thermal
Debinding Behaviors in Titanium Powder Injection Molding. Metall. Mater. Trans. A
2008;40(1):215-222. doi:10.1007/s11661-008-9690-3.
34. Stevenson JF, Roser R, Ilinca F, Derdouri A, Kozlov AS, International H. Table of
Contents Author Index Subject Index METAL INJECTION MOLDING : MOLD FILLING

82
AND PACKING DYNAMICS 2 . National Research Council of Canada Boucherville ,
Quebec J4B 6Y4 Table of Contents Author Index.
35. Song HX, Wu YX, Yuan S, Gong QM, Park S-J, German RM. Mechanical alloying of FeAl
intermetallic powder for metal injection moulding process. Powder Metall.
2010;53(3):208-212. doi:10.1179/174329009X434275.
36. Ji S, Fan Z, Bevis M. Semi-solid processing of engineering alloys by a twin-screw
rheomoulding process. Mater. Sci. Eng. A 2001;299(1-2):210-217.
doi:10.1016/S0921-5093(00)01373-3.
37. Moballegh L, Morshedian J, Esfandeh M. Copper injection molding using a
thermoplastic binder based on paraffin wax. Mater. Lett. 2005;59(22):2832-2837.
doi:10.1016/j.matlet.2005.04.027.
38. Vervoort PJ, Vetter R, Duszczyk J. Overview of powder injection molding. Adv.
Perform. Mater. 1996;3(2):121-151. doi:10.1007/BF00136742.
39. Yang W-W, Yang K-Y, Wang M-C, Hon M-H. Solvent debinding mechanism for alumina
injection molded compacts with water-soluble binders. Ceram. Int. 2003;29(7):745-
756. doi:10.1016/S0272-8842(02)00226-2.
40. PolyMIM. Available at: www.polymim.de.
41. Ryer Inc. Available at: www.ryerinc.com.
42. Sigma Aldrich. Poly(ethylene glycol). Available at:
http://www.sigmaaldrich.com/catalog/product/sigma/86101?lang=en®ion=GB.
43. Sigma Aldrich. Poly(methyl methacrylate). Available at:
http://www.sigmaaldrich.com/catalog/search?interface=All&term=pmma&N=0&m
ode=match partialmax&focus=product&lang=en®ion=GB.
44. Sigma Aldrich. Stearic Acid. Available at:
http://www.sigmaaldrich.com/catalog/search?interface=All&term=stearic
acid&N=0&mode=match
partialmax&focus=product&lang=en®ion=GB&cm_re=Did You Mean-_-stearic
acid-_-staric acid.
83
45. Wen G, Cao P, Gabbitas B, Zhang D, Edmonds N. Development and Design of Binder
Systems for Titanium Metal Injection Molding: An Overview. Metall. Mater. Trans. A
2012;44(3):1530-1547. doi:10.1007/s11661-012-1485-x.
46. Supati R, Loh NH, Khor KA, Tor SB. Mixing and characterization of feedstock for
powder injection molding. 2000;(November):0-5.
47. Omar MA. Dry mixing of feedstock for injection moulding of 316l stainless steel
powder. 2004;40:111-120.
48. Winkworth. Z blade sigma mixer. Available at:
http://www.mixer.co.uk/winkworth_mixers/z-blade-sigma-mixer.aspx.
49. Ji S. Solidification Behavior and Microstructural Evolution of Near-Eutectic Zn-Al
Alloys under Intensive Shear. Miner. Met. Mater. Soc. ASM Int. 2008 2008. Available
at: http://link.springer.com/article/10.1007/s11661-008-9713-0/fulltext.html.
50. ALLROUNDER 270 C GOLDEN EDITION. :1-6.
51. Engenharia E De. Universidade do Minho Escola de Engenharia Hélio Rui Caldeira da
Silva Jorge Compounding and Processing of a Water Soluble Binder for Powder
Injection Moulding. 2008.
52. Trunec M, Cihlg J. Thermal Debinding of Injection Moulded Ceramics. 1996;2219(96).
53. Chen G., Cao P., Wen G., Edmonds N. Debinding behaviour of a water soluble
PEG/PMMA binder for Ti metal injection moulding. Mater. Chem. Phys. 2013;139(2-
3):557-565. doi:10.1016/j.matchemphys.2013.01.057.
54. Eroglu S, Bakan HI. Solvent debinding kinetics and sintered properties of injection
moulded 316L stainless steel powder. Powder Metall. 2005;48(4):329-332.
doi:10.1179/174329005X66782.
55. MIM B. Beckett MIM - pin and bush. Available at: www.beckettmim.com.
56. TAV. TAV Vacuum Furnaces. Available at: http://www.tav-alto-
vuoto.it/products.php. Accessed March 24, 2014.

84
57. British Standards. Sintered metal materials , excluding hardmetals — Tensile test
pieces ( ISO. 2009.
58. Hayat MD, Wen G, Zulkifli MF, Cao P. Effect of PEG molecular weight on rheological
properties of Ti-MIM feedstocks and water debinding behaviour. Powder Technol.
2015;270:296-301. doi:10.1016/j.powtec.2014.10.035.