metal-enhanced dechlorination of volatile organic...
TRANSCRIPT

EPA/540/R-98/501September 1998
EnviroMetal Technologies, Inc.
Metal-Enhanced Dechlorination ofVolatile Organic Compounds
Using an In-Situ Reactive Iron Wall
Innovative Technology Evaluation Report
National Risk Management Research LaboratoryOffice of Research and DevelopmentU.S. Environmental Protection Agency
Cincinnati, Ohio 45268
@ Printed on Recycled Paper

Notice
The information in this document has been funded by the U. S. Environmental Protection Agency (EPA) under Contract No. 68-C5-0037 to Tetra Tech EM Inc. (formerly PRC Environmental Management, Inc.). It has been subjected to the Agency’s peerand administrative reviews and has been approved for publication as an EPA document. Mention of trade names or commercialproducts does not constitute an endorsement or recommendation for use.
ii

Foreword
The U. S. Environmental Protection Agency (EPA) is charged by Congress with protecting the Nation’s land, air, and waterresources. Under a mandate of national environmental laws, the Agency strives to formulate and implement actions leading toa compatible balance between human activities and the ability of natural systems to nurture life. To meet this mandate, EPA’sresearch program is providing data and technical support for solving environmental problems today and building a scienceknowledge base necessary to manage our ecological resources wisely, understand how pollutants affect our health, and preventor reduce environmental risks in the future.
The National Risk Management Research Laboratory is the Agency’s center for investigation of technological and manage-ment approaches for reducing risks from threats to human health and the environment. The focus of the Laboratory’s researchprogram is on methods for the prevention and control of pollution to air, land, water and subsurface resources; protection ofwater quality in public water systems; remediation of contaminated sites and groundwater; and prevention and control ofindoor air pollution. The goal of this research effort is to catalyze development and implementation of innovative, cost-effective environmental technologies; develop scientific and engineering information needed by EPA to support regulatory andpolicy decisions; and provide technical support and information transfer to ensure effective implementation of environmentalregulations and strategies.
This publication has been produced as part of the Laboratory’s strategic long-term research plan. It is published and madeavailable by EPA’s Office of Research and development to assist the user community and to link researchers with their clients.
E. Timothy Oppelt, DirectorNational Risk Management Research Laboratory
iii

Abstract
EnviroMetal Technologies, Inc. (ETI), of Guelph, Ontario, Canada has commercialized a metal-enhanced dechlorinationtechnology that the University of Waterloo, Canada developed to treat aqueous media contaminated with chlorinated volatileorganic compounds (VOCs). The technology employs an electrochemical process that involves the oxidation of a reactive,granular iron medium to induce reductive dechlorination of chlorinated VOCs.
The Superfund Innovative Technology Evaluation (SITE) Program evaluated an in-situ application of the technology during a6-month demonstration at a confidential site in central New York in 1995. For the demonstration of the in-situ system, thetechnology was constructed as a subsurface, reactive iron wall that fully penetrated a shallow sand and gravel aquifer. The topof the wall was above the highest average seasonal groundwater level, about 3 feet below grade, and was covered with a layerof native topsoil. The wall extended downward from the top of the saturated zone and was situated on top of an underlying,confining clay layer. The reactive iron wall, referred to as the “gate,” was oriented perpendicular to the groundwater flowdirection and was flanked by impermeable sheet piling wings which also fully penetrated the aquifer. The sheet piling formeda “funnel,” creating a hydraulic barrier that diverted groundwater flow from a 24-foot-wide upgradient area through the gate,and prevented untreated groundwater from flowing around the gate and mixing with treated groundwater on the downgradientside.
During the demonstration, SITE Program personnel collected independent data to evaluate the technology’s performance withrespect to primary and secondary objectives. Groundwater samples were collected at locations on the upgradient (influent)and downgradient (effluent) sides of the iron, and also from locations within the iron. The groundwater samples were analyzedfor VOCs to evaluate the technology’s ability to reduce chlorinated VOC concentrations to applicable regulatory levels. Theefficiency with which the system removed certain chlorinated VOCs was evaluated. Other data were collected to provideinformation about the dechlorination process, as well as costs and operating and maintenance requirements for the system.
The results of the sample analyses indicated that the technology significantly reduced the concentrations of chlorinated VOCsin groundwater passing through the gate. These chlorinated VOCs included trichloroethene (TCE), cis-1,Zdichloroethene(cDCE), and vinyl chloride (VC). All average critical parameter effluent concentrations, and 86 out of 90 individual criticalparameter measurements, achieved the applicable U.S. Environmental Protection Agency (EPA) maximum contaminant levelsor New York State Department of Environmental Conservation target standards. Removal efficiencies for TCE, cDCE, andVC were consistently greater than 90 percent. The results indicated no decrease in removal efficiency or other significantchanges in system performance over the 6-month demonstration period.
EPA SITE Program personnel prepared this Innovative Technology Evaluation Report (ITER) to present the results of theSITE Program demonstration. The ITER evaluates the ability of the in-situ application of the metal-enhanced dechlorinationtechnology to treat chlorinated VOCs in contaminated groundwater based on the demonstration results. Specifically, thisreport discusses performance and economic data collected by SITE Program personnel, and also presents case studies andadditional information about the technology provided by ETI.
iv
Contents
...List of Figures .............................................................................................................................................. Vlll
List of Tables .................................................................................................................................................. X
Acronyms, Abbreviations, and Symbols ....................................................................................................... xi
Conversion Factors ...................................................................................................................................... xiv
Acknowledgments ......................................................................................................................................... xv
Executive Summary ........................................................................................................................................ 1
1 Introduction .............................................................................................................................................. 6
1.1 Description of the SITE Program and Reports ................................................................................ 6
1.1.1 Purpose, History, and Goals of the SITE Program ............................................................ 6
1.1.2 Documentation of SITE Demonstration Results ............................................................... 7
1.2 Background of the Metal-Enhanced Dechlorination Technology in the SITE Program ................ 8
1.3 Technology Description ................................................................................................................... 8
1.3.1 Process Chemistry .............................................................................................................. 8
1.3.2 General Application and Design of Metal-Enhanced Process Systems ............................ 9
1.3.3 Advantages and Innovative Features of the Metal-Enhanced Dechloronation Process.. 10
1.4 Applicable Wastes .......................................................................................................................... 10
1.5 Overview of In-Situ, Metal-Enhanced Dechlorination Technology SITE Demonstration ........... 12
2
15.1 Site Background ............................................................................................................... 12
15.2 Technology Design .......................................................................................................... 12
1.5.3 Technology and Monitoring System Construction .......................................................... 12
1.5.4 Treatment System Operation ........................................................................................... 16
1.5.5 SITE Demonstration Objectives ...................................................................................... 16
1.5.6 Demonstration Procedures ............................................................................................... 17
1.6 Postdemonstration Activities .......................................................................................................... 18
1.7 Key Contacts ................................................................................................................................... 18
Technology Effectiveness Analysis.. ..................................................................................................... 20
2.1 SITE Demonstration Results .......................................................................................................... 20
2.1.1 Objective P- 1: Compliance with Applicable Effluent Target Levels .............................. 23
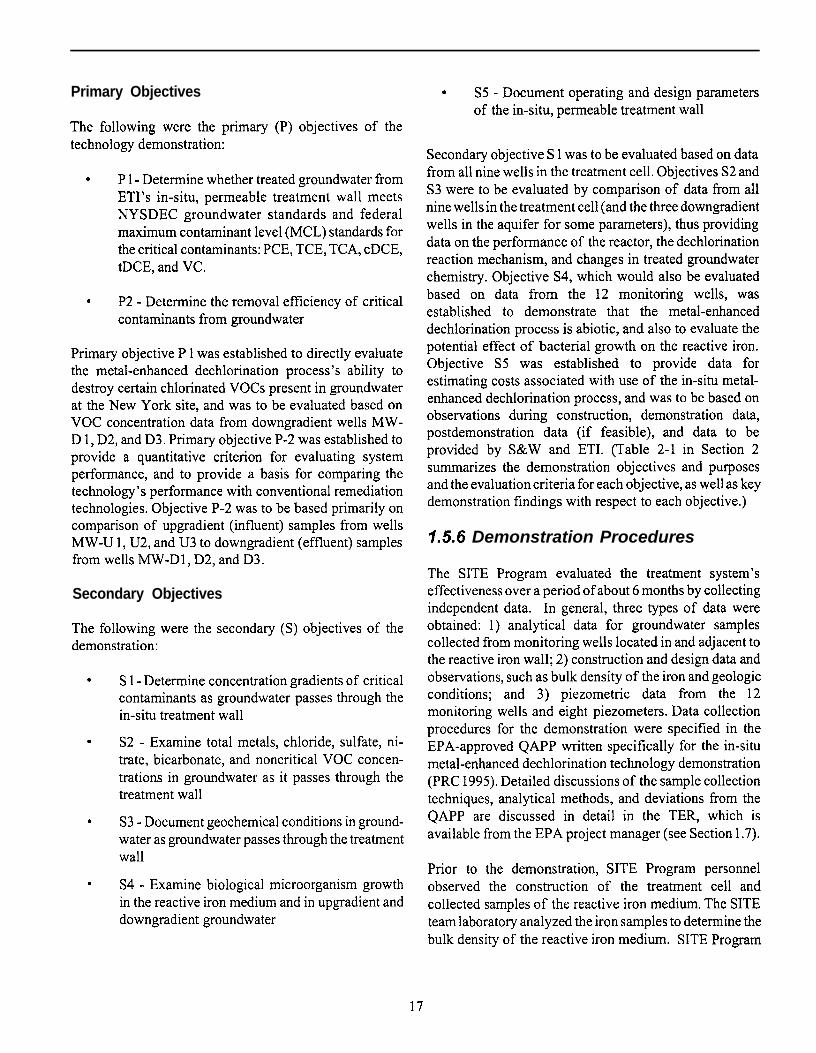
2.1.2 Objective P-2: Critical Parameter Removal Efficiency ................................................... 23
2.1.3 Objective S-l: Critical Parameter Concentrations as a Function of
Sampling Location (Distance) ......................................................................................... 25
V

Contents (continued)
2.1.4 Objective S-2: Noncritical VOCs, Metals, and Other Inorganic Parameters .................. 29
2.1.5 Objective S-3: Eh, DO, pH, Specific Conductivity, and Temperature ........................... 36
2.1.6 Objective S-4: Biological Microorganism Growth .......................................................... 40
2.1.7 Objective S-5: Operating and Design Parameters ........................................................... 40
2.2 Additional Performance Data ......................................................................................................... 43
2.2.1 Borden Site ....................................................................................................................... 46
2.2.2 California Semiconductor Facility ................................................................................... 46
2.2.3 Belfast, Northern Ireland Facility .................................................................................... 46
3 Technology Applications Analysis.. ...................................................................................................... 47
3.1 Factors Affecting Performance ........................................................................................................ 47
3.1.1 Feed Waste Characteristics .............................................................................................. 47
3.1.2 Hydrogeologic Characteristics ......................................................................................... 48
3.1.3 Operating Parameters ....................................................................................................... 49
3.1.4 Maintenance Requirements .............................................................................................. 50
3.2 Site Characterstics and Support Requirements .............................................................................. 51
3.2.1 Site Access, Area, and Preparation Requirements ........................................................... 51
3.2.2 Climate Requirements ...................................................................................................... 51
3.2.3 Utility and Supply Requirements.. ................................................................................... 52
3.2.4 Required Support Systems ............................................................................................... 52
3.2.5 Personnel Requirements ................................................................................................... 52
3.3 Material Handling Requirements ................................................................................................... 52
3.4 Technology Limitations .................................................................................................................. 53
3.5 Potential Regulatory Requirements ................................................................................................ 54
3.5.1 Comprehensive Environmental Response, Compensation, and Liability Act ................ 54
3.5.2 Resource Conservation and Recovery Act ...................................................................... 56
3.5.3 Clean Water Act ............................................................................................................... 57
3.5.4 Safe Drinking Water Act ................................................................................................. 57
3.5.5 Clean Air Act ................................................................................................................... 57
3.5.6 Mixed Waste Regulations ................................................................................................ 58
3.5.7 Occupational Safety and Health Administration ............................................................. 58
3.6 State and Community Acceptance ................................................................................................. 58
4 Economic Analysis ................................................................................................................................ 59
4.1 Factors Affecting Costs .................................................................................................................. 62
4.2 Assumptions Used in Performing the Economic Analysis ............................................................ 62
4.3 Cost Categories ............................................................................................................................... 64
4.3.1 Site Preparation Costs ...................................................................................................... 64
vi

4.3.2 Permitting and Regulatory Costs ..................................................................................... 66
4.3.3 Mobilization and Startup Costs ........................................................................................ 66
4.3.4 Capital Equipment Costs .................................................................................................. 66
4.3.5 Labor Costs ...................................................................................................................... 67
4.3.6 Supply costs ..................................................................................................................... 67
4.3.7 Utility Costs ...................................................................................................................... 67
4.3.8 Effluent Treatment and Disposal Costs ........................................................................... 68
4.3.9 Residual Waste Shipping and Handling Costs ................................................................ 68
4.3.10 Analyutical Services Costs ............................................................................................... 68
4.3.11 Equipment Maintenance Costs.. ....................................................................................... 68
4.3.12 Site Demobilization Costs ................................................................................................ 69
Contents (continued)
4.4 Economic Analysis Summary . . . . . . . . . . . . . . . . . . . . . . . . . . . . . . . . . . . . . . . . . . . . . . . . . . . . . . . . . . . . . . . . . . . . . . . . . . . . . . . . . . . . . . . . . . . . . . . . . . . . . . . . 69
5 Technology Status and Implementation . . . . . . . . . . . . . . . . . . . . . . . . . . . . . . . . . . . . . . . . . . . . . . . . . . . . . . . . . . . . . . . . . . . . . . . . . . . . . . . . . . . . . . . . . . . . . . . . 73
6 References . . . . . . . . . . . . . . . . . . . . . . . . . . . . . . . . . . . . . . . . . . . . . . . . . . . . . . . . . . . . . . . . . . . . . . . . . . . . . . . . . . . . . . . . . . . . . . . . . . . . . . . . . . . . . . . . . . . . . . . . . . . . . . . . . . . . . . . . . . . . . . 76
Appendix
A Vendor’s Claims for the Technology
B Case Studies
C Summary of Analytical Data from the Demonstration of the In-Situ Metal-Enhanced DechlorinationProcess: June 1995-December 1995
vii

Figures
l - l
l-2
2- l
2-2
2-3
2-4
2-5
2-6
2-7
2-8
2-9
2-10
2-11
2-12
2-13
2-14
2-15
2-16
2-17
2-18
2-19
2-20
2-21
2-22
2-23
2-24
2-25
2-26
Site Demonstration Area Layout ..................................................................................... 14
Plan and Profile Views of Funnel and Gate .................................................................... 15
Critical VOC Removal Efficiency Over Time ................................................................ 25
Critical VOCs vs. Distance-June ..................................................................................... 26
Critical VOCs vs. Distance-July ...................................................................................... 26
Critical VOCs vs. Distance-August ................................................................................. 27
Critical VOCs vs. Distance-October.. .............................................................................. 27
Critical VOCs vs. Distance-November ............................................................................ 28
Critical VOCs vs. Distance-December ............................................................................ 28
Summary of Calcium Data Over Time ............................................................................ 31
Summary of Magnesium Data Over Time ...................................................................... 31
Average Calcium and Magnesium Values vs. Distance .................................................. 3 1
Summary of Iron Data Over Time ................................................................................... 32
Summary of Manganese Data Over ‘Time ....................................................................... 32
Average Iron and Manganese Values vs. Distance ......................................................... 32
Summary of Barium Data Over Time ............................................................................. 34
Summary of Bicarbonate Alkalinity Data Over Time.. ................................................... 34
Average Bicarbonate Alkalinity and pH vs. Distance.. ................................................... 34
Summary of Sulfate Data Over Time .............................................................................. 35
Summary of Total Nitrate/Nitrite Data Over Time ......................................................... 35
Average Sulfate and Total Nitrate/Nitrite Values vs. Distance ....................................... 35
Summary of pH Data Over Time.. ................................................................................... 37
Average pH Values vs. Distance ..................................................................................... 37
Summary of SpecificConductivity Data Over Time ....................................................... 38
Average Specific Conductivity Values vs. Distance ....................................................... 38
Average Groundwater Temperature in Jron Wells vs. Time ........................................... 39
Summary of Eh Data Over Time ..................................................................................... 39
Average Eh Values vs. Distance ...................................................................................... 39
.VIII

Figures (continued)
2-27
2-28
4-l
4-2
4-3
4-4
Total Phospholipid Fatty Acids vs. Distance ................................................................... 41
Piezometric Elevations-December 1995 .......................................................................... 45
Distribution of Fixed Costs for Continuous Wall ............................................................ 7 1
Distribution of Annual Variable Costs for Continuous Wall .......................................... 71
Distribution of Fixed Costs for Funnel and Gate System ............................................... 72
Distribution of Annual Variable Costs for Funnel and Gate System .............................. 72
ix

Tables
Es-1
l - l
l-2
l-3
2-l
2-2
2-3
2-4
2-5
3-l
4-l
4-2
Super-fund Feasibility Study Evaluation Criteria for the
Metal-Enhanced Dechloronation Technology ................................................................................. 4
Correlation Between Super-fund Feasibility Evaluation Criteria and TIER Sections ...................... 7
Comparison of Technologies for Treating Chlorinated VOCs in Water ....................................... 11
System Design Criteria and Applicable Effluent Standards .......................................................... 13
Demonstration Results with Respect to Objectives ....................................................................... 21
Summary of Critical VOC Concentrations at Effluent Sampling Locations ................................. 22
Summary of Critical Parameter Removal Efficiency: July-December 1995 ................................. 24
Summary of Operating and Design Parameters ............................................................................. 42
Piezometric Data.. ........................................................................................................................... 44
Summary of Environmental Regulations ....................................................................................... 55
Estimated Costs Associated with the Metal-Enhanced Dechloronation Technology:
Continuous Wall System ................................................................................................................ 60
Estimated Costa Associated with the Metal-Enhanced Dechloronation Technology:
Funnel and Gate System ................................................................................................................. 61
X

Acronyms, Abbreviations, and Symbols
AEA
ARAR
BGS
CAA
CaCO,
CERCLA
CFR
Cl-
co,2-
DCA
cDCE
CWA
1 ,ZDCE
DO
DOE
Eh
EPA
ETI
Fe
Fez’
Fe3+
FdOW,
FeWU,
FeCO,
ft
gpd
H’
H,(g)
HCO,
in
ITER
Atomic Energy Act
Applicable or Relevant and Appropriate Requirement
Below ground surface
Clean Air Act
Calcium carbonate
Comprehensive Environmental Response, Compensation, and Liability Act
Code of Federal Regulations
Chloride ion
Carbonate ion
1 ,I-Dichloroethane
cis-1,ZDichloroethene
Clean Water Act
1 ,ZDichloroethene (general; undifferentiated for cis- and trans- isomers)
Dissolved oxygen
Department of Energy
Oxidation-reduction potential
U.S. Environmental Protection Agency
EnviroMetal Technology, Inc.
Zero-valent iron
Ferrous iron
Ferric iron
Ferrous hydroxide
Ferric hydroxide
Ferrous carbonate or siderite
Feet
Gallons per day
Hydrogen ion
Hydrogen gas
Bicarbonate ion
Inch
Innovative Technology Evaluation Report
xi

Acronyms, Abbreviations, and Symbols (continued)
LCL
LDR
m
MCL
MDL
m@-
MnO,W
msl
NAPL
NESHAP
NOEL
NPDES
NRC
NRMRL
NSPS
NYSDEC
O&M
O H
ORD
OSHA
OSWER
PCB
PCE
Pcf
PLFA
POTW
ppbv
PPe
QMPQAWRCRA
RE
SARA
SDWA
S&W
SITE
TCA
TCE
TCL
Lower confidence limit
Land disposal restrictions
Meter
Maximum contaminant level
Method detection limit
milligram per liter
Manganese dioxide (solid)
mean sea level
Nonaqueous-phase liquid
National Emission Standards for Hazardous Air Pollutants
Nonobservable Effect Level
National Pollutant Discharge Elimination System
Nuclear Regulatory Commission
National Risk Management Research Laboratory
New Source Performance Standard
New York State Department of Environmental Conservation
Operating and maintenance
Hydroxyl ion
U.S. EPA Office of Research and Development
Occupational Safety and Health Act
Office of Solid Waste and Emergency Response
Polychlorinated biphenyl
Tetrachloroethene
Pounds per cubic foot
Phospholipid fatty acid
Publicly Owned Treatment Works
Parts per billion by volume
Personnel protective equipment
Quality assurance project plan
Quality assurance/quality control
Resource Conservation and Recovery Act
Removal efficiency
Super-fund Amendments and Reauthorization Act
Safe Drinking Water Act
Stearns & Wheler, L.L.C.
Super-fund Innovative Technology Evaluation
1 , I,1 -Trichloroethane
Trichloroethene
Target compound list
xii

TCLP
tDCE
TEIR
TIC
TSCA
Pa
v c
VOC
WQS
Acronyms, Abbreviations, and Symbols (continued)
Toxicity characteristic leaching procedure
Trans- 1 ,ZDichloroethene
Technology evaluation report
Tentatively identified compound
Toxic Substances Control Act
Micrograms per liter
Vinyl chloride
Volatile organic compound
Water quality standards
. . .XIII

Length
Area:
Volume:
Mass:
Energy:
Power:
Temperature:
Conversion Factors
To Convert From
inch
foot
mile
square foot
acre
gallon
cubic foot
pound
kilowatt-hour
kilowatt
(“Fahrenheit - 32)
To
centimeter 2.54
meter 0.305
kilometer 1.61
square meter 0.0929
square meter 4,047
liter 3.78
cubic meter 0.0283
kilogram
megajoule
horsepower
“Celsius
Mdtipry By
0.454
3.60
1.34
0.556
xiv

Acknowledgments
This report was prepared for EPA’s SITE Program by PRC Environmental Management, Inc. (PRC), a wholly ownedsubsidiary of Tetra Tech, Inc., under the direction and coordination of Dr. Chien T. Chen, U.S. Environmental ProtectionAgency (EPA) Superfund Innovative Technology Evaluation (SITE) Program project manager in the National Risk Manage-ment Research Laboratory (NRMRL), Edison, New Jersey. Contributors and reviewers for this report included Ms. Ann Kern,Mr. Vince Gallardo and Mr. Thomas Holdsworth of EPA NRMRL, Cincinnati, Ohio.
Special acknowledgment is given to Mr. Robert Focht and Mr. John L. Vogan of EnviroMetal Technologies, Inc., Guelph,Ontario, Canada; Ms. Diane Clark of Stearns & Wheler, L.L.C.; the site owners; and the New York Department ofEnvironmental Conservation for their cooperation and support during the SITE Program demonstration and during thedevelopment of this report.
xv
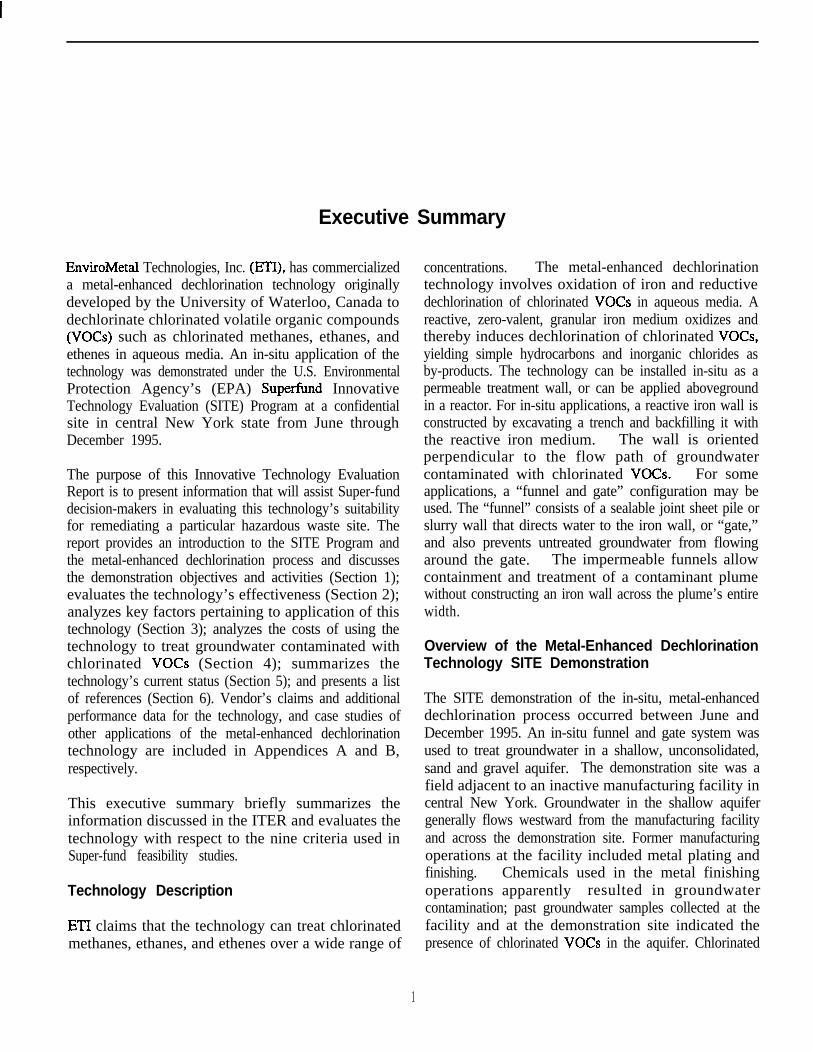
EnviroMetal Technologies, Inc. (ETJ), has commercializeda metal-enhanced dechlorination technology originallydeveloped by the University of Waterloo, Canada todechlorinate chlorinated volatile organic compounds(VOCs) such as chlorinated methanes, ethanes, andethenes in aqueous media. An in-situ application of thetechnology was demonstrated under the U.S. EnvironmentalProtection Agency’s (EPA) Super-fund InnovativeTechnology Evaluation (SITE) Program at a confidentialsite in central New York state from June throughDecember 1995.
The purpose of this Innovative Technology EvaluationReport is to present information that will assist Super-funddecision-makers in evaluating this technology’s suitabilityfor remediating a particular hazardous waste site. Thereport provides an introduction to the SITE Program andthe metal-enhanced dechlorination process and discussesthe demonstration objectives and activities (Section 1);evaluates the technology’s effectiveness (Section 2);analyzes key factors pertaining to application of thistechnology (Section 3); analyzes the costs of using thetechnology to treat groundwater contaminated withchlorinated VOCs (Section 4); summarizes thetechnology’s current status (Section 5); and presents a listof references (Section 6). Vendor’s claims and additionalperformance data for the technology, and case studies ofother applications of the metal-enhanced dechlorinationtechnology are included in Appendices A and B,respectively.
This executive summary briefly summarizes theinformation discussed in the ITER and evaluates thetechnology with respect to the nine criteria used inSuper-fund feasibility studies.
Technology Description
ETI claims that the technology can treat chlorinatedmethanes, ethanes, and ethenes over a wide range of
Executive Summary
concentrations. The metal-enhanced dechlorinationtechnology involves oxidation of iron and reductivedechlorination of chlorinated VOCs in aqueous media. Areactive, zero-valent, granular iron medium oxidizes andthereby induces dechlorination of chlorinated VOCs,yielding simple hydrocarbons and inorganic chlorides asby-products. The technology can be installed in-situ as apermeable treatment wall, or can be applied abovegroundin a reactor. For in-situ applications, a reactive iron wall isconstructed by excavating a trench and backfilling it withthe reactive iron medium. The wall is orientedperpendicular to the flow path of groundwatercontaminated with chlorinated VOCs. For someapplications, a “funnel and gate” configuration may beused. The “funnel” consists of a sealable joint sheet pile orslurry wall that directs water to the iron wall, or “gate,”and also prevents untreated groundwater from flowingaround the gate. The impermeable funnels allowcontainment and treatment of a contaminant plumewithout constructing an iron wall across the plume’s entirewidth.
Overview of the Metal-Enhanced DechlorinationTechnology SITE Demonstration
The SITE demonstration of the in-situ, metal-enhanceddechlorination process occurred between June andDecember 1995. An in-situ funnel and gate system wasused to treat groundwater in a shallow, unconsolidated,sand and gravel aquifer. The demonstration site was afield adjacent to an inactive manufacturing facility incentral New York. Groundwater in the shallow aquifergenerally flows westward from the manufacturing facilityand across the demonstration site. Former manufacturingoperations at the facility included metal plating andfinishing. Chemicals used in the metal finishingoperations apparently resulted in groundwatercontamination; past groundwater samples collected at thefacility and at the demonstration site indicated thepresence of chlorinated VOCs in the aquifer. Chlorinated
1

groundwater include trichloroethene (TCE), cis-1,2-dichloroethene (cDCE), and vinyl chloride (VC).
For the SITE Program demonstration, a pilot-scale metal-enhanced dechlorination system was constructed in thefield bordering the downgradient side of the facility to treatgroundwater as it moved off site. The system consisted ofa 12-foot-wide in-situ reactive iron wall (the gate) orientedperpendicular to the groundwater flow direction. The ironwall was about 3-feet thick, and fully penetrated the sandand gravel aquifer. The top of the wall was above theaverage seasonal high groundwater level, about 3 feetbelow ground surface, and was covered with a layer ofnative topsoil. The wall extended down into an underlying,confining clay layer. The wall was flanked by 15foot-long sections of impermeable sheet piling. These flankingsections created the funnel that directed flow toward thegate and prevented untreated groundwater from bypassingthe reactive iron wall and mixing with treated water in thedemonstration study area. According to ETI, the systemcaptured about a 24-foot-wide portion of the contaminantplume.
The primary objectives of the SITE demonstration were asfollows:
. Determine whether treated groundwater from thein-situ, permeable treatment wall meets NYSDECgroundwater standards and federal MCL effluentstandards for the critical contaminants:tetrachloroethene (PCE), TCE, l,l, l-trichloroethane (TCA), cDCE, trans- 1,2-dichloroethene (tDCE), and VC
. Determine the removal efficiency (RE) of criticalcontaminants from groundwater
The secondary objectives of the demonstration were:
. Determine concentration gradients of critical con-taminants as groundwater passes through the in-situ treatment wall
. Examine total metals, chloride, sulfate, nitrate,bicarbonate, and non-critical VOC concentrationsin groundwater as it passes through the treatmentwall
. Document geochemical conditions (specific con-ductance, oxidation/reduction potential (Eh), pH,
dissolved oxygen (DO), and temperature) ingroundwater passing through the treatment wall
. Examine biological microorganism growth in thereactive iron medium and in upgradient anddowngradient groundwater
. Document operating and design parameters (ini-tial weight, volume, and density of the reactiveiron medium, groundwater flow velocity) of thein-situ, permeable treatment wall
During the demonstration, groundwater samples werecollected from monitoring wells upgradient from, in, anddowngradient from the reactive iron wall. Groundwatersamples were collected and analyzed for the six criticalVOCs during June, July, August, October, November, andDecember 1995. Samples were also collected andanalyzed for noncritical parameters to support secondaryobjectives. Field measurements of groundwaterelevations, dissolved oxygen (DO), temperature, specificconductance, pH, and oxidation-reduction potential (Eh)were also performed.
Samples indicated that influent groundwater containedTCE at concentrations ranging from about 32 to 330micrograms per liter @g/L); cDCE at concentrationsranging from about 98 to 550 pg/L; and VC atconcentrations ranging from about 5 to 79 pg/L. Lowerconcentrations (less than 15 cLg/L of TCA and 1,1-dichloroethane (DCA) were also typically present.
Based on SITE Program data and postdemonstration dataobtained by ETI, the average groundwater flow velocitythrough the iron was probably in the range of about 0.4 to1 foot per day. Assuming the high (conservative) velocity,the treatment system design allowed for a minimumcontact time between groundwater and the reactive ironmedium of about 3 days. Based on the range of possiblegroundwater flow velocities, between 29,000 and 73,000gallons of groundwater was treated between the time thesystem was construct6 (May 1995) and the SITEdemonstration was completed (December 1995).
SITE Demonstration Results
The following items summarize the significant results ofthe SITE demonstration:
. Average critical contaminant concentrations for thedowngradient wells were all below the target.
2

. Average critical contaminant concentrations for thedowngradient wells were all below the targetMCLs and NYSDEC standards. Individualdowngradient concentrations of critical VOCswere predominantly nondetect. Individual resultsfor cDCE sporadically exceeded the NYSDECcriterion of 5 pg/L; however, concentrations weresignificantly reduced from influent concentrations.
. Minimum overall average REs were high for allcritical parameters present at significant concen-trations in the influent groundwater. RE wasgreater than 99.0 percent for TCE, 98.6 percentfor cDCE, and greater than 96.0 percent for VC.Actual removal efficiencies may have been higher,but are unknown, because the REs were calculatedusing the detection limit of 1 pg/L to representeffluent values that were below detectable limits.
. Although significant concentrations of multi-chlo-rinated ethenes (such as TCE) were reduced bythe technology, there was no detectable increasein dechlorination byproducts such as cDCE, tDCE,or VC. Concentrations of all of these compoundsin the downgradient wells were lower than inupgradient wells, and were nondetectable in mostcases. These observations indicate that the reac-tive iron wall dechlorinated the original com-pounds and the byproducts.
. The concentrations of metals such as calcium andmagnesium generally decreased as groundwatermoved through the iron wall, coinciding with anincrease in pH, suggesting precipitation of metalcompounds.
. Bicarbonate alkalinity decreased as groundwaterflowed through the wall. This observation, com-bined with the metals behavior and the changes ingeochemical parameters, also suggests that inor-ganic compounds were precipitating in the reac-tive iron.
. Total PLFA analyses indicated that total microbialactivity in water in the reactive iron wall was notsignificantly higher than in water in the naturalaquifer materials upgradient or downgradient fromthe wall. This observation indicates that the pro-cess is abiotic.
. No significant operating problems were noted dur-ing the SITE demonstration. According to ETI,the most significant potential long-term problemwith respect to operation appears to be the loss ofporosity or iron reactivity due to precipitates.However, although inorganic compounds appearedto be precipitating during the SITE demonstration,there was no noticeable decrease in system per-formance over the 6-month demonstration.
. Interpretation of piezometric data collected dur-ing the demonstration was complicated by the ex-tremely low horizontal gradient and close spacingof the monitoring wells. For this reason, the ac-tual flow velocity through the iron is unknown,but appears to have been in the range of about 0.4to 1 foot per day.
Economics
Using information obtained from the SITE demonstration,ETI, and other sources, an economic analysis examined 12cost categories for a scenario in which the metal-enhanceddechlorination technology was applied at full scale to treatcontaminated groundwater at a Superfiurd site for a 20-year period. The cost estimate assumed that the sitehydrogeology and the general types and concentrations ofchlorinated VOCs were the same as those encounteredduring the New York demonstration. Based on theseassumptions, the total costs were estimated to be about$18 per 1,000 gallons of groundwater treated for acontinuous wall, and $20 per 1,000 gallons treated for afull-scale funnel and gate system. However, total cost andcost per gallon for using this technology are highly site-specific. Also, because this passive technologysimultaneously controls off-site contaminant migrationand removes contaminants, it combines beneficial featuresof containment systems and treatment systems.
Supetfund Feasibility Study Evaluation Criteriafor the Metal-Enhanced DechlorinationTechnology
Table ES-1 briefly discusses an evaluation of the in-situ’metal-enhanced dechlorination technology with respect tothe nine evaluation criteria used for Superfund feasibilitystudies’ when considering remedial alternatives atSuperfund sites (EPA 1988c).
3

Table ES-l. Superfund Feasibility Study Evaluation Criteria for the Metal-Enhanced Dechlorination Technology
Criterion
Overall Protection of HumanHealth and the Environment
Compliance with Applicableor Relevant and AppropriateRequirements (ARAR)
Long-Term Effectivenessand Permanence
Reduction of Toxicity,Mobility, or Volume ThroughTreatment
Discussion
l The technology is expected to protect human health andthe environment by treating water to significantly lowerconcentrations of chlorinated VOCs.
l Protection of the environment at and beyond the point ofdischarge should be evaluated based on uses of thereceiving water body, concentrations of residualcontaminants and treatment by-products, and dilutionfactors.
l The technology’s ability to comply with existing federal,state, or local ARARs (for example, MCLs) should bedetermined on a site-specific basis.
l The technology was able to meet target effluentconcentrations based on federal maximum contaminantlevels (MCL) and New York State Department ofEnvironmental Conservation (NYSDEC) groundwaterdischarge standards for average downgradientconcentrations of all critical parameters. After systemperformance stabilized, only four cDCE results out of 90individual critical parameter analyses slightly exceededNYSDEC levels.
l Human health risk can be reduced to acceptable levelsby treating groundwater to site-specific cleanup levels;the time needed to achieve cleanup goals dependsprimarily on contaminant characteristics and groundwaterfiow velocity.
l The long-term effectiveness of the technology maydepend on periodically replacing or treating the ironmedium.
l The treatment is permanent because the technologydechlorinates chlorinated VOCs to less chlorinatedcompounds.
l Periodic review of treatment system performance isneeded because application of this technology tocontaminated groundwater at hazardous waste sites isrelatively recent.
l Target compounds are dechlorinated to less toxicsubstances by the technology; also, the concentrations ofindividual target compounds and the total concentrationsof chlorinated VOCs are reduced.
4
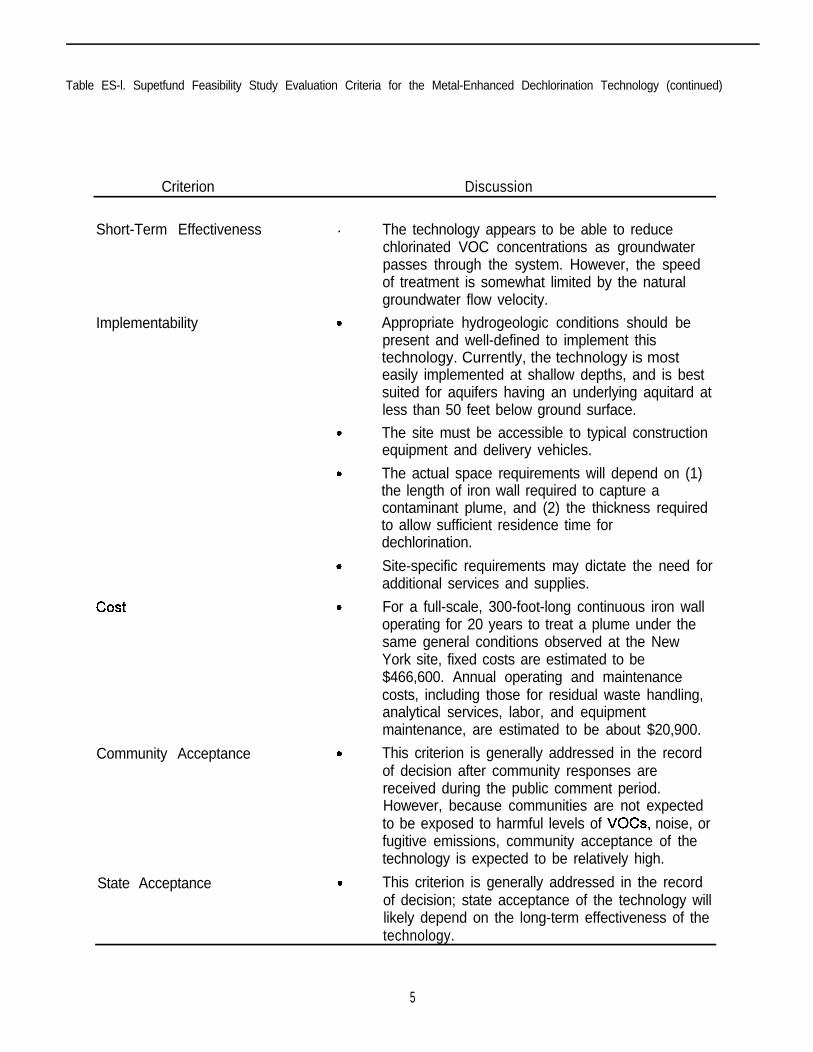
Table ES-l. Supetfund Feasibility Study Evaluation Criteria for the Metal-Enhanced Dechlorination Technology (continued)
Criterion Discussion
Short-Term Effectiveness .
Implementability
cost
Community Acceptance
State Acceptance
.
.
.
The technology appears to be able to reducechlorinated VOC concentrations as groundwaterpasses through the system. However, the speedof treatment is somewhat limited by the naturalgroundwater flow velocity.
Appropriate hydrogeologic conditions should bepresent and well-defined to implement thistechnology. Currently, the technology is mosteasily implemented at shallow depths, and is bestsuited for aquifers having an underlying aquitard atless than 50 feet below ground surface.
The site must be accessible to typical constructionequipment and delivery vehicles.
The actual space requirements will depend on (1)the length of iron wall required to capture acontaminant plume, and (2) the thickness requiredto allow sufficient residence time fordechlorination.
Site-specific requirements may dictate the need foradditional services and supplies.
For a full-scale, 300-foot-long continuous iron walloperating for 20 years to treat a plume under thesame general conditions observed at the NewYork site, fixed costs are estimated to be$466,600. Annual operating and maintenancecosts, including those for residual waste handling,analytical services, labor, and equipmentmaintenance, are estimated to be about $20,900.
This criterion is generally addressed in the recordof decision after community responses arereceived during the public comment period.However, because communities are not expectedto be exposed to harmful levels of VOCs, noise, orfugitive emissions, community acceptance of thetechnology is expected to be relatively high.
This criterion is generally addressed in the recordof decision; state acceptance of the technology willlikely depend on the long-term effectiveness of thetechnology.
5

Section 1Introduction
This section describes the Super-fund InnovativeTechnology Evaluation (SITE) Program and theInnovative Technology Evaluation Report (ITER);provides background information on the EnviroMetalTechnologies, Inc. (ETI), metal-enhanced dechlorinationtechnology; identifies wastes to which this technologymay be applied; and provides a list of key contacts. Thissection also provides an overview of the SITE Programdemonstration of the in-situ metal-enhanced dechlorinationprocess.
1.1 Description of SITE Program andReports
This section provides information about (1) the purpose,history, and goals of the SITE Program, and (2) the reportsused to document SITE demonstration results.
1.1. I Purpose, History, and Goals of theSITE Program
The primary purpose of the SITE Program is to advancethe development and demonstration, and thereby establishthe commercial availability, of innovative treatmenttechnologies applicable to Super-fund and other hazardouswaste sites. The SITE Program was established by theU.S. Environmental Protection Agency (EPA) Office ofSolid Waste and Emergency Response (OSWER) andOffice of Research and Development (ORD) in responseto the Super-fund Amendments and Reauthorization Act of1986 (SARA), which recognized the need for analternative or innovative treatment technology researchand demonstration program. The SITE Program isadministered by ORD’s National Risk ManagementResearch Laboratory. The overall goal of the SITEProgram is to carry out a program of research, evaluation,testing, development, and demonstration of alternative orinnovative treatment technologies that may be used in
response actions to achieve more permanent protection ofhuman health and welfare and the environment.
The SITE Program consists of four component programs:(1) the Demonstration Program, (2) the EmergingTechnology Program, (3) the Monitoring and MeasurementTechnologies Program, and (4) the Technology TransferProgram. This ITER was prepared under the SITEDemonstration Program. The objective of theDemonstration Program is to provide reliable performanceand cost data on innovative technologies so that potentialusers can assess a given technology’s suitability forspecific site cleanups. To produce useful and reliable data,demonstrations are conducted at hazardous waste sites orunder conditions that closely simulate actual waste siteconditions.
Information collected during a demonstration is used toassess the performance of the technology, the potentialneed for pretreatment and posttreatment processing of thewaste, the types of wastes and media that may be treated bythe technology, potential operating problems, andapproximate capital and operating costs. Demonstrationinformation can also provide insight into a technology’slong-term operating and maintenance (O&M) costs andlong-term application risks.
Each SITE demonstration evaluates a technology’sperformance in treating waste at a particular site.Successful demonstration of a technology at one site or ona particular waste does not ensure its success at other sitesor for other wastes. Data obtained from the demonstrationmay require extrapolation to estimate a range of operatingconditions over which the technology performssatisfactorily. Also, any extrapolation of demonstrationdata should be based on other information about thetechnology, such as information available from casestudies.
6

Implementation of the SITE Program is a significant, development and commercialization of a treatmentongoing effort involving ORD, OSWER, various EPA technology. The report discusses the effectiveness andregions, and private business concerns, including applicability of the technology and analyzes coststechnology developers and parties responsible for site associated with its application. The technology’sremediation. The technology selection process and the effectiveness is evaluated based on data collected duringDemonstration Program together provide objective and the SITE demonstration and from other case studies. Thecarefully controlled testing of field-ready technologies. applicability of the technology is discussed in terms ofInnovative technologies chosen for a SITE demonstration waste and site characteristics which could affectmust be pilot- or full-scale applications and must offer technology performance, material handling requirements,some advantage over existing technologies; mobile technology limitations, and other factors for anytechnologies are of particular interest. application of the technology.
7.1.2 Documentation of SITEDemonstration Results
The results of each SITE demonstration are reported in anITER and a Technology Evaluation Report (TER).Information presented in the ITER is intended to assistSuperfund decision makers evaluating specific technologiesfor a particular cleanup situation. The in-situ metal-enhanced dechlorination technology has been evaluatedagainst the nine criteria used for feasibility studiessupporting the Superfund remedial process. The ninecriteria are listed in Table l-l along with the sections of theITER where information related to each criterion isdiscussed. The ITER represents a critical step in the
The purpose of the TER is to consolidate all informationand records acquired during the demonstration. It containsboth a narrative portion and tables and graphssummarizing data. The narrative portion includesdiscussions of predemonstration, demonstration, andpostdemonstration activities as well as any deviationsfrom the demonstration quality assurance project plan(QAPP) during these activities and their impact. The datatables and graphs summarize demonstration resultsrelative to project objectives. The tables also summarizequality assurance and quality control (QNQC) data anddata quality objectives. The TER is not formally publishedby EPA. Instead, a copy is retained as a reference by theEPA project manager for responding to public inquiriesand for recordkeeping purposes.
Table l-1. Correlation Between Supetfund Feasibility Evaluation Criteria and ITER Sections
Evaluation Criterion”
Overall protection of human health and theenvironment
Compliance with ARARs
Long-term effectiveness and permanence
ITER Section
2.1.1, 2.2.2, 3.5, 3.6
2.1.1; 3.5; 3.6
2.1.1; 2.1.2; 2.1.4; 2.2; 3.1
Reduction of toxicity, mobility, or volume throughtreatment
Short-term effectiveness
Implementability
cost
State acceptance
Community acceptance
2.2.1; 2.2.2; 2.2.3
2.2.1; 2.2.2; 2.2
1.6; 3.0; 5.0
4.0
2.1.1; 3.5; 3.6
2.1.1; 3.5; 3.6
Note: a Source: EPA 1988c
7

1.2 Background of the Metal-Enhanced DechlorinationTechnology in the SITE Program
In 1993, the owner of the New York demonstration site andits consultant, Stearns & Wheler, L.L.C. (S&W),responded to a solicitation from the SITE Program bysubmitting a proposal for the SITE Program to evaluate themetal-enhanced dechlorination process at the New Yorksite. Through negotiations with the New York StateDepartment of Environmental Conservation (NYSDEC)and ETI, the site owners and S&W proposed constructinga pilot-scale, in-situ treatment system employing themetal-enhanced dechlorination process. The pilot-scalesystem would be used to evaluate the technology’ssuitability to remediate a chlorinated VOC plume ingroundwater at the site. SITE Program personnelparticipated in the evaluation of the technology bycollecting independent data to evaluate systemperformance.
1.3 Technology Description
This section describes the principles of metal-enhanceddechlorination, the treatment system used for thetechnology, and advantages and innovative features of thetechnology.
1.3.1 Process Chemistry
The metal-enhanced dechlorination technology employsan electrochemical process involving oxidation of iron andreductive dechlorination of VOCs in aqueous media.Although aluminum, copper, brass, standard steel, andzinc have also been shown to promote reductivedechlorination of VOCs, zero-valent iron has been chosenfor use in large-scale applications of the technology. Ironis readily available, relatively inexpensive, and inducesrapid dechlorination of organic compounds (O’Hannesinand Gillham 1992).
The technology induces conditions that cause substitutionof chlorine atoms by hydrogen.Because chlorinated aliphatic VOCs are in a relativelyoxidized state, their reduction in the presence of reducedmetals is thermodynamically favorable. The corrosion ofzero-valent iron (Fe”) in contact with groundwater createsa highly reducing environment in solution, evidenced by adecline in oxidation/reduction potential (Eh). During the
process the solution pH increases, the concentration ofOH- increases, and electrons are transferred from the metalto the chlorinated organic compound. Overall, thereactions cause hydrogen ions to replace the chlorineatom(s) of the chlorinated organic compound (Gillham1996; Focht, Vogan and O’Hannesin 1996).
The reaction mechanism is not completely understood;several mechanisms have been proposed. According toGillham and 0’ Hannesin (1994) the following equationsmay describe the reactions that take place in the presenceof water, zero-valent iron (Fe”), and a chlorinatedhydrocarbon (RCl):
2Fe” -+ 2Fe2+ + 4e- (l-la)3H,O + 3H’ + 30H (l-lb)2H+ +2e- + H,(g) (I-lc)RCl+H++2e-- RH+Cl- (I-ld)
In this series of equations, the conversion of Fe” toferrous iron (Fez+), commonly known as corrosion, isdescribed by Equation l-la. Equation l-lb describes theionization of water. The electrons released by thecorrosion of iron (Equation l-la) react with hydrogen ions(H+) and R-Cl according to Equations 1-1~ and 1-ld,resulting in the formation of Fez+, hydroxyl ions (OH-),hydrogen gas [I-I.&g)], nonchlorinated hydrocarbons (RI-I),and chloride ions (Cl-). While the ionization of water(equation 1- 1 b) accompanies the dechlorination process, itis unknown if this reaction is required for the overalldechlorination reaction to occur (Gillham and 0’Hannesi.n1994; Gilham 1996).
For multi-chlorinated VOCs such as tetrachloroethene(PCE), trichloroethene (TCE), or 1 ,Zdichloroethene (1,2-DCE), the progression of the dechlorination reaction is notcompletely understood. Chen (1995) proposed that thedechlorination of a multi-chlorinated VOC (in this casePCE) may follow a sequential mechanism, evidenced bythe appearance of intermediate by-products such as TCE,1,2-DCE, and vinyl chloride (VC), as shown in thefollowing equations:
Fe” -+ Fe*+ + 2e- (l-2a)H,O --) H’ + OH- (l-2b)Cl,C=CCl, + H+ + 2e- + ClCH=CCl, + Cl- (1-2~)ClCH=CCl, + H+ + 2e- + ClCH=CHCl + Cl- (l-2d)ClCH=CHCl + H+ + 2e- -+ Cl-J=CHCl + Cl- (l-2e)CH,=CHCl + H+ + 2e- + CH,=CH, + Cl- (1-W
8
Others have proposed alternate reaction mechanisms.According to ETI, recent research has indicated that thedechlorination of PCE and TCE may involve multiplemechanisms. Focht, Vogan, and O’Hannesin (1996)report that for bench-scale studies involving dechlorinationof TCE, only about 10 to 20 percent of the original mass ofTCE typically appears as 1 ,ZDCE, and less than 1 percentappears as vinyl chloride (VC). Based on similar massbalance estimates, some researchers have suggested thatthe predominant dechlorination reaction mechanism maynot be sequential, and may be due to a precipitous transferof electrons from the iron to the organic contaminantmolecule through direct contact (Gillham and O’Hannesin1994; Gillham 1996). However, 1,2-DCE and VC are alsodechlorinated by reactive iron, and it is possible that thesecompounds are generated and destroyed too rapidly toallow detection of the full amounts generated.
For long-term remediation projects using this technology,decision makers and technology designers should beaware of the possibility of formation of by-products, suchas 1,ZDCE and VC if multi-chlorinated compounds suchas TCE or PCE are incompletely dechlorinated. However,this effect was not observed during the New Yorkdemonstration. The results of the New Yorkdemonstration indicated that significant decreases in TCE,cDCE, and VC occurred as groundwater movedthroughout the reactive iron. No measurable increase inthe amounts of expected dechlorination by-products(cDCE and VC) was observed; effluent concentrations ofcDCE and VC were significantly less than influent levelsduring all months of testing (see Section 2.1.1).
Past research by ETI and others has also suggested thatwhen the process is used to dechlorinate VOCs ingroundwater that also contains soluble metal species, thedechlorination reaction is accompanied by precipitation ofmetal compounds from the groundwater. If no oxygen ispresent and pH becomes sufficiently high, ferroushydroxide [Fe(OH),] may precipitate:
Fe*+ + 20I-I -, Fe(OH),(s) (l-3)
Carbonate (CO,*-) may react with Fe*+ to form ferrouscarbonate (FeCO,), known as siderite:
Fe* + + CO,Z- + FeCO,(s) (l-4)
Because iron-hydroxide and iron-carbonate precipitatesare formed during treatment, the concentrations of
9
dissolved iron in the effluent are expected to be relativelylow. Depending on concentrations of soluble metalcompounds in iufluent groundwater, other carbonatessuch as calcium carbonate, may precipitate (Gillham1996; Reardon 1995).
1.3.2 General Application and Design ofMetal-Enhanced DechlorinationProcess Systems
The metal-enhanced dechlorination process uses areactive, zero-valent, granular iron medium to perform in-situ remediation of groundwater contaminated withchlorinated VOCs. Chlorinated VOCs are among the mostpervasive groundwater contaminants at Super-fund andother hazardous waste sites.
The technology is typically installed as a permeablesubsurface wall; the dechlorination reaction described inSection 1.3.1 occurs as groundwater flows through theWall. For this reason, optimal site conditions forapplication of this technology include shallow depth togroundwater and the presence of a confining layer beneaththe contaminated aquifer. Also, installation of in-situsystems may require excavation to the underlyingconfining layer, and therefore the thickness and depth tothe bottom of the saturated zone are determining factorsfor application of this technology.
The technology may be installed as a continuous, reactivesubsurface wall, or as a configuration of alternating“funnels” and “gates”. For funnel and gate configurations,impermeable sections of sealable joint sheet piling orslurry walls contain the contaminant plume and funnelgroundwater flow through the iron wall or gate. Thenumber and dimensions of the gates required depends onthe size of the contaminant plume and hydrogeologicfactors such as gradient, flow velocity, and saturatedthickness.
The metal-enhanced dechlorination process may also beinstalled in an aboveground reactor, supportingconventional pump-and-treat operations. Abovegroundreactors may be particularly suited to short-term, small-scale remediation projects requiring treatment ofrelatively small amounts of groundwater, or for siteswhere excavation and construction activities in theimmediate vicinity of a contaminant plume areimpractical. For aboveground applications, groundwateris extracted from the aquifer and pumped to the reactor for

treatment. The SITE Program evaluated a pilot-scaleaboveground reactor at a site in New Jersey in 1994 and1995. (The results of the aboveground reactordemonstration were reported in a previous ITER (EPA1997).
The in-situ system design used during the SITEdemonstration was a subsurface treatment cell consistingof one reactive iron wall flanked by two impermeablesheet piling sections, as shown in Figure l-l. The funneland gate system used was not designed to capture and treatthe entire chlorinated VOC plume present in groundwaterat the site, but rather to evaluate the technology’seffectiveness at pilot scale. Pilot scale systems allow formeasurement, control, modification, and optimization ofdesign and operating parameters before construction of thefull scale system. The system may eventually be expandedor replaced by a full scale system consisting of severalalternating funnel and gate sections or a continuous ironwall to capture and treat the entire plume (ETI 1996d).
1.3.3 Advantages and InnovativeFeatures of the Metal-EnhancedDechlorination Process
Table 1-2 compares the in-situ metal-enhanceddechlorination technology to several other treatmentoptions for water contaminated with chlorinated VOCs.Common ex-situ methods for treating groundwatercontaminated with solvents and other organic compoundsinclude air stripping, steam stripping, carbon adsorption,biological treatment, chemical oxidation, and photolysis.The metal-enhanced dechlorination technology offers amajor advantage over some of these more conventionaltreatment technologies because the process destroyshazardous substances rather than transferring them toanother medium, such as activated carbon or air.
The technology can treat groundwater with relatively highconcentrations of chlorinated VOCs. For example, asindicated by the case studies in Appendix B, thetechnology has been used to treat groundwater containingchlorinated VOCs at concentrations up to about 300,000rig/L.. The contaminant loading mass and rate, relative tothe available iron surface area in the system, affectssystem performance (see Section 3.1); higher contaminantconcentrations may increase the amount of iron required tocompletely dechlorinate a substance and all associateddechlorination by-products. However, the reactive iron is
a by-product of metal machining and finishing operations,and is therefore readily-available and relatively inexpensive(Gillham 1995; ETI 1996d).
A significant advantage of the metal-enhanceddechlorination process over conventional pump- and-treattechnologies is that it can treat groundwater in-situ,eliminating the need to extract contaminated groundwaterbefore treatment. In-situ systems also eliminate the needto manage treated effluent that can lead to relatively highcosts for conventional, ex-situ technologies. Also, in-situsystems eliminate the need for intrusive surface structures,allowing less restricted long-term use of the area where thesystem is installed.
Once installed, operating requirements are minimal.Because the technology is a passive treatment processthere are no moving parts and no utilities are required. Thesystem is installed below ground, and therefore is notsubject to the effects of adverse weather conditions.
Long-term (greater than 5 years) data for field applicationsof in-situ systems are unavailable at the time of this report;therefore, the useful life of the reactive iron under fieldconditions is unknown. Precipitates may reduce theporosity of the iron or block the available reactive surfacearea. The results of a previous SITE Programdemonstration of the aboveground reactor indicated that aportion of the iron would periodically require mechanicalmixing, treatment, or replacement to maintain targetremoval efficiency levels (EPA 1997). However, nodecrease in the in-situ system’s performance wasdetectable over the 6-month New York demonstration.
1.4 Applicable Wastes
According to ETI, existing performance data indicates thatthe metal-enhanced dechlorination process is applicable toa wide range of chlorinated methanes, ethanes, andethenes in water (Focht, Vogan, and O’Hannesin 1996).Research is currently underway at other sites to determinethe technology’s ability to reduce concentrations of othertypes of substances such as hexavalent chromium (Puls,Powell, and Paul 1995; ETI 1996c). At the New York site,the SITE Program demonstration primarily examined thetechnology’s ability to treat six critical contaminants:PCE, TCE, cis- 1 ,Zdichloroethene (cDCE), tram+ 1,2-dichloroethene (tDCE), 1 ,1, I-trichloroethane (TCA); andvc .
10

Table 1-2. Comparison of Technologies for Treating Chlorinated VOCs in Water
Technology Advantages Disadvantages
Air stripping Effective for highconcentrations; can treat awide range of VOCs;mechanically simple;relatively inexpensive
Inefficient for lowconcentrations; VOCsdischarged to air or requiresecondary “polishing”
Steam stripping
Air stripping with carbonadsorption of vapors
Carbon adsorption
Effective for allconcentrations and manytypes of VOCs
VOCs discharged to air orrequire secondary “polishing”;high energy consumption
Effective for highconcentrations and manytypes of VOCs
Sometimes inefficient for lowconcentrations; requiresdisposal or regeneration ofspent carbon; relativelyexpensive
Low air emissions; effectivefor high concentrations
Sometimes inefficient for lowconcentrations; requiresdisposal or regeneration ofspent carbon; relativelyexpensive
Biological treatment (ex-situ) Low air emissions; relativelyinexpensive
Biological treatment (in-situ) Relatively inexpensive; maynot require utilities; can beconstructed without obtrusivesurface structures
Chemical oxidation (in-situ) No air emissions: nosecondary waste; VOCsdestroyed; can be appliedwithout obtrusive surfacestructures
Metal-enhanceddechlorination technology (in-situ)
Dechlorinates chlorinatedVOCs to less hazardoussubstances; generates no airemissions and no secondarywaste; no chemicals (such asO3 or H,O,) required; minimalmaintenance required;operates passively; noutilities required; in-situsystems can be constructedwithout obtrusive surfacestructures
Inefficient for highconcentrations; slow rates ofremoval; sludge treatmentand disposal required
Slow rate of treatment
May not be cost effective forhigh contaminantconcentrations; requireschemicals such as 0, orHP,.
Inability to treat some VOCs;potential for gradual loss ofhydraulic conductivity andreactivity of iron; potential forformation of by-products;construction requiresdisplacement andmanagement of potentiallycontaminated subsurfacesoils; geologic conditions maypreclude its use at some sites
11

1.5 Overview of the In-Situ, Metal-Enhanced DechlorinationTechnology SITE Demonstration
This section provides an overview of the site,predemonstration and postdemonstration activities, andSITE Program demonstration objectives and procedures.
1.5.1 Site Background
The SITE Program demonstration of the in-situ metal-enhanced dechlorination process was conducted over a 6-month period from June through December 1995. Thedemonstration took place at an inactive manufacturingfacility in central New York state. Former operations atthe facility included electroplating and metal finishing(Stearns and Wheler [S&w] 1993).
The site is located in a river valley and overliesunconsolidated materials consisting of a clayey sand andgravel water-bearing zone overlying a dense clayconfining layer. The top of the clay layer is about 13 to 16feet below ground surface. The depth to groundwatervaries seasonally, but typically ranges from about 3 to 7feet below ground surface. The predominant groundwaterflow direction on site is west (S&W 1993).
Past site operations appear to have resulted in groundwatercontamination in the sand and gravel aquifer. Groundwatersamples indicated the presence of a chlorinated VOCplume, apparently related to the electroplating and metalfinishing operations, in the west-central part of the site,that was migrating off site to the west. Groundwatercontaminants at the site reportedly include the chlorinatedVOCs TCE, cDCE, VC, TCA, and 1,1-dichloroethane(DCA); and other compounds (S&W 1993).
Based on the types and concentrations of contaminants ingroundwater, the hydrogeologic conditions, and the needto construct a remediation system that would not restrictproperty use, the metal-enhanced dechlorination processappeared suited for groundwater remediation at the NewYork site. The system would be used to passively treatgroundwater flowing off site to the west, inhibiting off-sitemigration of chlorinated VOCs (S&W 1994).
1.5.2 Technology Design
In 1994, ETI conducted bench-scale column tests usingcontaminated groundwater from the New York site.
During these studies, ETI determined the apparent half-lives for chlorinated VOCs present in the site groundwatersamples, and for the by-products that could potentially begenerated by dechlorinating these VOCs. The half-lifedata were evaluated to determine the required residencetime in the reactive iron for complete dechlorination tooccur. The residence time estimates, along with sitehydrogeologic characteristics such as hydraulic gradientand flow velocity, determined the required thickness forthe reactive iron wall (ETI 1994).
ETI and S&W used the results of the bench-scale studies tocustom-design a pilot-scale funnel and gate system. Thedesign contaminant concentrations and applicableregulatory target levels are shown in Table l-3. Thedesign was based on the estimated residence time requiredto dechlorinate TCE, cDCE, VC, PCE, and TCA from theinfluent design concentrations to below the applicableregulatory standards shown on Table l-3. This time wasestimated by ETI as about 56 hours. The system designallowed a minimum residence time of approximately 72hours for water in the reactive iron based on a predictedmaximum groundwater flow velocity of about 1 foot perday through the iron. ET1 estimated the groundwater flowvelocity based on an assumed horizontal gradient of 0.002,and hydraulic conductivity and porosity values of 142 feet/day and 0.4, respectively, for the iron (ETI 1994).
1.5.3 Technology and MonitoringSystem Construction
The pilot-scale funnel and gate system was constructed inMay 1995. The system was constructed in an agriculturalfield adjacent to the west side of the site. Figure l-l showsthe treatment system area layout; Figure l-2 shows thesystem configuration in plan view and cross-section.
The system was constructed by driving sealable-jointsheet piling downward from the ground surface, throughthe sand and gravel, and about 1 foot into the underlyingclay layer located about 15 feet below ground surface. Thesheet piling formed a rectangular box-like areaapproximately 12 feet by 6.5 feet in plan. The longdimension of this “box” was perpendicular to thegroundwater flow direction. Fifteen-foot-wide sections ofsheet piling were also driven on each end of the box. Theseflanking sections of piling extended about 1 foot down intothe clay layer, creating an impermeable barrier togroundwater flow (the funnel) on either end of the box.
12

Table 1-3. System Design Criteria and Applicable Effluent Standards
Design lnfluent NYSDEC Federal MaximumConcentration’ Groundwater Contaminant Level
Contaminant (w/L) Standard WL)(w/L)
TCA 96 5 200
PCEb 90 5 5
TCE 529 5 5
cDCE 5,650 5 70
tDCE -C 5 100
v c 220 2 2
Source: PRC 1995Notes:
a Determined by NYSDEC.b Included as a design parameter and critical parameter for the demonstration;
however, PCE was not detected during the SITE demonstration.c NYSDEC did not require specification of a design influent concentration for tDCE
as tDCE was not anticipated to be present at significant concentrations in theinfluent groundwater.
13

E+b-
II
14

~o~m~o~o~o~o*o~o~ \pj •~O~O~O~O~O~O~ \POI:
L::::::::::“’0.N2rororarororermro~
15

Soil in the area enclosed by the box was then excavated tothe top of the clay layer. Soil from the saturated zone wasplaced in lined roll-off boxes and stored pending analysisand off-site disposal. The box was then dewatered, andsheet piling was used to divide the box into three parallelcompartments. The middle compartment, which was 3feet wide, was backfilled with reactive iron. Thecompartments on the east (upgradient) and west(downgradient) sides of the iron (each about 1.75 feetwide) were backfilled with pea gravel to minimize theeffects of inconsistent flow caused by heterogeneity andanisotropy in the aquifer materials, and to facilitatemonitoring well construction. The pea gravel zones andthe iron zone are collectively referred to as the “treatmentsystem” or “cell” in subsequent discussions. Todifferentiate, when referred to specifically, the reactiveiron zone is referred to as the “iron wall” throughoutsubsequent sections. The iron and pea gravel zones werefilled to about 3 feet below grade, to allow for a seasonalhigh groundwater table.
Three groundwater monitoring wells, consisting of PVCwell screens with riser pipes attached, were constructed ineach compartment. The three monitoring wells in theupgradient pea gravel section were identified as MW-Ul,MW-U2, and MW-U3. The wells in the iron wereidentified MW-Fel, MW-Fe2, and MW-Fe3; the wells inthe downgradient pea gravel section were identified asMW-Dl, MW-D2, and MW-D3.
After the monitoring wells were in place and as thecompartments were backfilled, the sheet piling dividersbetween the compartments, as well as the sheet pilingforming the long, outer walls of the box (the two sectionsperpendicular to the groundwater flow direction) wereremoved. This allowed groundwater to enter the treatmentcell, passing in turn through the upgradient pea gravel,reactive iron, and downgradient pea gravel, and then exitthe cell and return to the natural aquifer materials. Afterthe sheet piling dividers were removed, the upper 3-footportion of the trench was backfilled to grade with nativetopsoil.
In order to provide additional information regardinginorganic analyte concentrations downgradient from thetreatment system, three monitoring wells (MW-D4, D5,and D6) were installed about 5 feet downgradient from thetreatment system, as shown on Figure l-l. Eightpiezometers (P-l through P-8) were installed upgradientfrom the treatment cell to evaluate the hydraulic gradient
and groundwater flow velocity in the vicinity of thesystem.
1.5.4 Treatment System Operation
Flow through the cell commenced on May 18,1995. Thein-situ system passively treated contaminated groundwateras it flowed through the reactive iron. No additionalconstruction or O&M activities directly related to themetal-enhanced dechlorination process were required.Based on data from upgradient monitoring wells MW-Ul ,U2 and U3, the influent groundwater consistentlycontained TCE at concentrations ranging from 32 to 330micrograms per liter @g/L); cDCE at concentrationsranging from 98 to 550 pg/L; VC at concentrationsranging from about 5 to 79 pg/L; and low levels (2 to 12pg/L) of TCA. Trace levels (less than 5 clg/L) of l,l-dichloroethane (DCA) and tDCE were also sporadicallydetected in the influent groundwater (see Tables Clthrough C6 in Appendix C).
Piezometric data gathered during the SITE demonstrationwere inconclusive due to the low horizontal flow gradient,but suggested that the groundwater flow velocity throughthe iron wall was in the range of about 0.4 to 1 foot per day(see Section 2.1.7). Based on these estimates, and anassumed average saturated thickness of 10 feet, thecumulative volume of groundwater treated between thetime of construction (May 1995) and the time thedemonstration was completed (December 1995) was in therange of about 29,000 to 73,000 gallons.
1.5.5 SITE Demonstration Objectives
EPA and PRC established primary and secondaryobjectives for the SITE demonstration of the metal-enhanced dechlorination process. The objectives werebased on EPA’s and PRC’s understanding of the metal-enhanced dechlorination process, SITE demonstrationprogram goals, and input from ETI. Primary objectiveswere considered to be critical for the technologyevaluation, while secondary objectives involved collectingadditional data considered useful, but not critical, to theprocess evaluation. The demonstration objectives weredefined in the EPA-approved QAPP dated May 1995(PRC 1995). (A copy of the QAPP accompanies the TER.)
16
Primary Objectives
The following were the primary (P) objectives of thetechnology demonstration:
. P 1 - Determine whether treated groundwater fromETI’s in-situ, permeable treatment wall meetsNYSDEC groundwater standards and federalmaximum contaminant level (MCL) standards forthe critical contaminants: PCE, TCE, TCA, cDCE,tDCE, and VC.
. P2 - Determine the removal efficiency of criticalcontaminants from groundwater
Primary objective P 1 was established to directly evaluatethe metal-enhanced dechlorination process’s ability todestroy certain chlorinated VOCs present in groundwaterat the New York site, and was to be evaluated based onVOC concentration data from downgradient wells MW-D 1, D2, and D3. Primary objective P-2 was established toprovide a quantitative criterion for evaluating systemperformance, and to provide a basis for comparing thetechnology’s performance with conventional remediationtechnologies. Objective P-2 was to be based primarily oncomparison of upgradient (influent) samples from wellsMW-U 1, U2, and U3 to downgradient (effluent) samplesfrom wells MW-Dl, D2, and D3.
Secondary Objectives
The following were the secondary (S) objectives of thedemonstration:
. S 1 - Determine concentration gradients of criticalcontaminants as groundwater passes through thein-situ treatment wall
. S2 - Examine total metals, chloride, sulfate, ni-trate, bicarbonate, and noncritical VOC concen-trations in groundwater as it passes through thetreatment wall
. S3 - Document geochemical conditions in ground-water as groundwater passes through the treatmentwall
. S4 - Examine biological microorganism growthin the reactive iron medium and in upgradient anddowngradient groundwater
. S5 - Document operating and design parametersof the in-situ, permeable treatment wall
Secondary objective S 1 was to be evaluated based on datafrom all nine wells in the treatment cell. Objectives S2 andS3 were to be evaluated by comparison of data from allnine wells in the treatment cell (and the three downgradientwells in the aquifer for some parameters), thus providingdata on the performance of the reactor, the dechlorinationreaction mechanism, and changes in treated groundwaterchemistry. Objective S4, which would also be evaluatedbased on data from the 12 monitoring wells, wasestablished to demonstrate that the metal-enhanceddechlorination process is abiotic, and also to evaluate thepotential effect of bacterial growth on the reactive iron.Objective S5 was established to provide data forestimating costs associated with use of the in-situ metal-enhanced dechlorination process, and was to be based onobservations during construction, demonstration data,postdemonstration data (if feasible), and data to beprovided by S&W and ETI. (Table 2-1 in Section 2summarizes the demonstration objectives and purposesand the evaluation criteria for each objective, as well as keydemonstration findings with respect to each objective.)
7.56 Demonstration Procedures
The SITE Program evaluated the treatment system’seffectiveness over a period ofabout 6 months by collectingindependent data. In general, three types of data wereobtained: 1) analytical data for groundwater samplescollected from monitoring wells located in and adjacent tothe reactive iron wall; 2) construction and design data andobservations, such as bulk density of the iron and geologicconditions; and 3) piezometric data from the 12monitoring wells and eight piezometers. Data collectionprocedures for the demonstration were specified in theEPA-approved QAPP written specifically for the in-situmetal-enhanced dechlorination technology demonstration(PRC 1995). Detailed discussions of the sample collectiontechniques, analytical methods, and deviations from theQAPP are discussed in detail in the TER, which isavailable from the EPA project manager (see Section 1.7).
Prior to the demonstration, SITE Program personnelobserved the construction of the treatment cell andcollected samples of the reactive iron medium. The SITEteam laboratory analyzed the iron samples to determine thebulk density of the reactive iron medium. SITE Program
17

personnel also oversaw the installation of eightpiezometers (P-l, P-2, P-3, P-4, P-5, P-6, P-7, and P-8)upgradient of the reactive cell and three groundwatermonitoring wells downgradient from the cell (see Figurel-l).
During the demonstration, SITE Program personnelcollected groundwater samples from the monitoring wellsin and downgradient from the treatment cell, as specifiedby the QAPP. The first round of sampling was conductedin June, about 2 weeks after installation of the treatmentcell and completion of monitoring well development.Subsequent sampling events occurred in July, August,October, November, and December 1995.
During each sampling event, sample fractions for VOC,bicarbonate alkalinity, chloride, sulfate, nitrite nitrogen,and total nitrate/nitrite nitrogen analysis were collectedfrom the nine wells in the treatment cell. SITE Programpersonnel also collected groundwater sample fractions formetals analysis from the nine wells in the cell and the threedowngradient wells located outside of the cell. Samplefractions were collected from all 12 wells for phospholipidfatty acid (PLFA) analysis during June, October, andDecember. SITE Program personnel also preparedand submitted QA/QC samples as specified in the EPA-approved QAPP (PRC 1995). Samples were shipped tooff-site laboratories for analysis.
In addition to the water samples collected for !aboratoryanalyses, SITE Program personnel collected samples forfield measurements ofdissolved oxygen (DO), temperature,specific conductance, pH, and Eh. Also, field personnelmeasured the depth to water in the monitoring wells andpiezometers to determine the elevation of the piezometricsurface and evaluate the hydraulic gradient in the vicinityof the treatment system.
The first sampling event (June 6 through 8) was performedafter at least two pore volumes of groundwater had passedthrough the reactive iron, assuming a minimum flowvelocity of about 0.4 foot per day (see Section 2.1.7). Onepore volume equals the volume of saturated pore space ofthe reactive iron medium and is estimated by the developeras about 40 to 45 percent ofthe total volume of the reactiveiron medium, or about 1,200 gallons in this case.However, based on subsequent inspection ofthe June data,a sufficient amount of water had not yet passed through thesystem before the June sampling event to allow thedowngradient wells (MW-Dl through D-6) to accurately
represent treated groundwater conditions. For this reason,the usefulness of the June data is limited (see Section 2.1).
I.6 Postdemonstration Activities
Interpretation of data gathered from the piezometersduring the SITE demonstration regarding groundwaterflow velocity was complicated by several factors (seeSection 2.1.7). For this reason, approximately 6 monthsafter the SITE demonstration was completed, personnelfrom ET1 and S&W performed a bromide tracer study toprovide a more accurate determination of the groundwaterflow velocity and the residence time in the reactive iron.ET1 subsequently performed another study in November1996 using a downhole flow meter to attempt to confirmthe groundwater flow velocity. These studies were notperformed under the supervision of the SITE Program; forthis reason, the test procedures are not discussed in detail inthis ITER. However, ETI’s results are discussed in Section2.1.7.
1.7 Key Contacts
Additional information on the metal-enhanceddechlorination process, ETI, the SITE Program, and theNew York demonstration site is available from thefollowing sources:
Metal-Enhanced Dechlorination ProcessJohn L. VoganProject ManagerEnviroMetal Technologies, Inc.42 Arrow RoadGuelph, Ontario, Canada Nl K 1 S6(5 19) 824-0432
SITE ProgramDr. Chien T. ChenProject ManagerU.S. Environmental Protection AgencyNational Risk Management Research Laboratory2890 Woodbridge Avenue, Bldg. 10Edison, NJ 08837-3679(908) 906-6985
Annette M. GatchettAssociate Director of TechnologyU.S. Environmental Protection AgencyLand Pollution and Remediation Control Division
18

National Risk Management Research Laboratory26 West Martin Luther King Jr. Drive (MD 215)Cincinnati, OH 45268(513) 569-7697
New York Demonstration SiteDiane ClarkSenior EngineerStearns & Wheler, L.L.C.One Remington Park Dr.Cazenovia, NY 13035(315) 655-8161
19

Section 2Technology Effectiveness Analysis
This section addresses the effectiveness of the metal-enhanced dechlorination technology for treatinggroundwater contaminated with chlorinated VOCs. Thisevaluation of the technology’s effectiveness is basedmainly on the demonstration results supplemented byadditional performance data from other applications ofthis technology and postdemonstration data obtained byETI.
Vendor claims regarding the effectiveness of the metal-enhanced dechlorination technology are presented inAppendix A. Case studies that describe other applicationsof the metal-enhanced dechlorination technology arepresented in Appendix B. Tables summarizing thelaboratory analytical data for groundwater samplescollected during the demonstration are included inAppendix C.
2.1 SITE Demonstration Results
This section summarizes the results from the SITEdemonstration of the metal-enhanced dechlorinationtechnology for both critical and noncritical parameters,and is organized according to the project objectives statedin Section 1.5.5. Sections 2.1.1 and 2.1.2 address theprimary objectives, and Sections 2.1.3 through 2.1.7address secondary objectives. Table 2-l summarizes thekey demonstration results with respect to the projectobjectives and summarizes the evaluation criteria for eachobjective.
The analytical data for samples collected fromdowngradient wells MW-Dl, D2, and D3 in June (about 2weeks after the treatment wall was constructed) wereinconsistent with data collected from the same wells insubsequent months, and do not appear to be representativeof actual treated effluent concentrations. For example, asshown in Table C-l in Appendix C, the average cDCE
concentration in wells MW-Dl, D2, and D3 in June was30.7 pg/L; however, as shown in Tables C-2 through C-6,the cDCE concentration in these wells in subsequentmonths ranged from about 1.6 to 7.5 ug/L. The treatmentcell was dewatered during construction; when the sheetpiling was first removed from the upgradient anddowngradient sides of the cell groundwater flowed backinto the cell from both the upgradient and downgradientsides. The June analytical data appear to indicate that asufficient quantity of water had not yet passed through thewall to completely flush residual, untreated water from thedowngradient pea gravel zone. For this reason, the Junedata were not used to determine average concentrationsand are not discussed in detail for most parameters.
Critical VOCs consistently detected in the influentgroundwater during the demonstration were TCE, cDCE,VC, and TCA. TCE was consistently detected in all of theupgradient wells at concentrations ranging from 32 to 330ug/L; concentrations of cDCE ranged from 98 to 550 pg/L, and concentrations of VC ranged from 4.7 to 79 pg/L.TCA was detected in one or more upgradient wells duringall months of testing at relatively low concentrations (3.3to 13 pg/L). Trace concentrations of tDCE (1.2 to 2.2 pg/L) were detected in one or more upgradient wells during allmonths except December. PCE was not detected in any ofthe groundwater samples.
The average concentrations of all critical parameter VOCs(with the exception of PCE) were determined for theinfluent (upgradient) and effluent (downgradient)groundwater samples. The average values, as well as theindividual, monthly data for each parameter, werecompared to target levels to support objective Pl, and wereused to calculate the system removal efficiency (RE)values to support objective P2. More detailed informationregarding data interpretation methods is presented in theQAPP and in the TER.
20

Table 2-1. Demonstration Results with Respect to Objectives
Objective Description/Purpose Evaluation Criteria Results
Pl
P2
Sl
2
s2
s3
s4
S5
Determine if the technology achievestarget levels for critical VOCs (PCE,TCE, cDCE, tDCE, TCA, and VC)
Determine removal efficiency forcriticel vocs
Determine concentration gradients ofcritical vocs
Evaluate changes in inorganic andnoncritical VOC concentrations asgroundwater moves through treatmentcell
Document geochemical conditions asgroundwater moves through treatmentcell
Comparison of field parameter results fromsame wells as S2
Examine biological microorganism Comparison of phospholipid fatty acid datagrowth in the wall from same wells as S3
Document operating and designparameters
Groundwater flow velocity (piezometric datafrom all monitoring wells plus piezometers P-1 through P-8); construction observations;bulk density analysis of iron
VOC concentration data from downgradient(effluent) wells MW-Dl, D2, and D3 for theperiod afler system performance becamerelatively stable (July through December1995)
Comparison of VOC data (July throughDecember 1995) from upgradient wells MW-Ul, U2, and U3 to data from downgradient(effluent) wells MW-Dl, D2, and D3
Comparison of VOC data from upgradient(MW-Ul, U2, U3), iron (MW-Fel, Fe2, Fe3),and downgradient (MW-Dl, D2. D3)monitoring wells
Comparison of inorganic and noncritical VOCdata from same wells as objective Sl , plusthree wells outside (downgradient) oftreatment cell (MW-D4, D5, DS) (metals only)
Average effluent concentrations were all below target levels; fourcDCE results out of 15 measurements slightly exceeded targetlevels; in all cases effluent concentrations were significantly lowerthan influent concentrations
High removal efficiency for critical VOCs present at significantconcentrations in the influent (TCE, cDCE, and VC); no apparentdecrease in removal efficiency over demonstration period
Most critical VOCs were nondetectable in the iron wells, indicatingthat the iron wall was thick enough to allow sufficient residencetime for dechlorination; also, no measurable increase in typicaldechlorination by-products as groundwater passed through thesystem
Bicarbonate alkalinity, calcium, and several other inorganicparameters decreased as water moved through the system,indicating precipitation of metal compounds; one noncritical VOC(DCA) was detected at low concentrations in the influent, and wasnot detected in the iron wells or downgradient wells
Increases in pH and decreases in Eh and conductivity wereobserved during all months, suggesting conditions wereconducive to metal precipitation
Data do not indicate significant biological activity in iron
About 430 cubic feet of iron used; uncompacted bulk densitymeasured at 140 pounds per cubic foot; low horizontal gradientindicated possible slower groundwater flow velocity and longerresidence time in iron than anticipated
Notes: P - Primary Objective S- Secondary Objective

Table 2-2. Summary of Critical VOC Concentrations at Effluent Sampling Locations
June2
Concentration Detected Durina
July August
OverallMean
Effluent
Target EffluentLevels
v o c MW-Dl MIA-D2 MW-D3 MW-Dl MW-D2 MW-D3 MW-Dl MW-D2 MW-D3 Value3 MCL’ NYSDEC’
TCA 4 . 0 cl.0 cl .o 4.0 4 . 0 4 . 0PCE 4 . 0 4 . 0 4 . 0 4 . 0 <I .o 4 . 0TCE 5&z 23 !%a 4 . 0 4 . 0 4 . 0cDCE +lu 24 a!2 2.2 3.7 3.9tDCE 4 . 0 cl .o 4 . 0 4 .o 4 . 0 4 . 0v c 1.3 21. 1.6 4 . 0 4 . 0 cl.0
Concentration Detected Durina Month
v o c
TCAPCETCEcDCEtDCEVC
MW-Dl
October
MW-DP MW-D3
November
MW-Dl MW-DP MW-D3
December
Overall Target EffluentRange of Mean Levels:Effluent Effluent
MW-Dl MW-D2 MW-D3 Values= Value3 MCL’ NYSDEC*
4 . 0 4 . 0 cl.0 4 . 0 4 . 0 cl.0 4 . 0 cl.0 -4.0 All <l.O 4 . 0 200 54 . 0 4 .o cl.0 4 . 0 4 . 0 <I.0 4 . 0 4 . 0 4 . 0 All cl.0 4 . 0 5 51.2 1.5 cl.0 1.6 xl.0 4 . 0 0.9lJ cl.0 4 . 0 0.91 J - 3.3 <1.3 5 55 7.5 2 4.6 4.2 2.8 2.5 2.6 u 1.6-7.5 3.9 70 5
4 . 0 4 .o cl.0 cl.0 4 . 0 4 . 0 4 . 0 4 .o 4 . 0 All cl.0 cl.0 100 54 . 0 1.2 <I .o 4 .o cl.0 Cl.0 4 . 0 cl.0 cl .o 4.0 - 1.2 Cl.0 2 2
4 . 0 4 . 0cl.0 Cl.03.3 4 . 0AL 1.6
4 . 0 4 . 0el.0 q1.0
4.0 cl.0 200 54 . 0 cl.0 5 54 . 0 c l .3 5 51.9 3.9 70 5
4 . 0 cl.0 100 54 . 0 <l.O 2 2
Notes: All values are presented in micrograms per liter.For monthly samples, “c’ (less than) symbol indicates that a compound was not detected; corresponding value is detection limit and is value used tocalculate overall mean.Overall mean values based on one or more ‘nondetects” are also reported as k” (less than) corresponding value.Values exceeding at least one applicable target effluent standard are shown underlined.J = Value estimated; concentration detected is below minimum quantitation limit.1 1 ,l ,I-trichloroethane (TCA); tetrachloroethene (PCE); trichloroethene (TCE); cis-1,2dichloroethene (cDCE); trans-1,2dichloroethene (tDCE);
and vinyl chloride o/C).2
3June data were collected before representative effluent (downgradient) conditions were attained, and are not used to determine average values.Value based on data collected from wells MW-Dl, D2, and D3 from July through December.
4 MCL = federal maximum contaminant level.5 NYSDEC = New York State Department of Environmental Conservation groundwater discharge standard.
.- - .-..-

27.7 Objective PI; Compliance withApplicable Effluent Target Levels
Compliance with the target levels was evaluated bycomparing the critical parameter concentrations detectedin downgradient wells MW-Dl, D2 and D3 during July,August, October, November, and December, and theaverage value for each contaminant detected in thesewells, to federal MCLs and NYSDEC groundwaterdischarge standards.
The detection limit for all critical parameters in theeffluent samples was 1 pg/L, and most of the samplescollected from the downgradient wells during thedemonstration did not contain detectable concentrationsof critical contaminants, with the exception of cDCE, and,less frequently, TCE and VC. Ten out of 15 TCE resultsfor the period from July to December were belowdetectable limits, as were 13 out of 15 VC results for thesame period. Low concentrations of cDCE were detectedin wells MW-Dl, D2, and D3 during each sampling event.All critical VOC concentrations measured in individualwells from July through December were below MCLs.Critical VOC concentrations were also below NYSDECtarget levels in most instances (86 out of 90measurements). Only one contaminant, cDCE, slightlyand sporadically exceeded the NYSDEC target effluentlevel of 5 pg/L during this period (well MW-Dl duringAugust, well MW-D2 in October, and wells MW-D2 andD3 in December). However, the maximum cDCEconcentration detected in any of the downgradient samplescollected from July to December was relatively low (7.5pg/L) and in all cases was significantly less than theinfluent cDCE concentration detected during the samemonth.
Overall, concentrations of all critical contaminants,including VOCs such as cDCE, tDCE and VC, which arepotential by-products of the dechlorination of TCE, weresignificantly lower in downgradient wells than inupgradient wells. For this reason, the VOC data appear toindicate that residence time was suffkient to allow thetechnology to dechlorinate any by-products generatedthrough the dechlorination of TCE.
2.1.2 Objective P2: Critical ParameterRemoval Efficiency
The efficiency with which the in-situ metal-enhanceddechlorination process removed contaminants from
groundwater was evaluated by comparing the averageupgradient and average downgradient concentrations ofthe six critical parameter VOCs: TCA, TCE, PCE, cDCE,tDCE, and VC. Removal efficiency for each compoundwas evaluated for each of the five data sets collected aftersystem performance appeared to stabilize (July, August,October, November, and December). Overall systemremoval efficiency for each compound, based on valuesaveraged for each parameter for the period from Julythrough December, was also calculated. The averageupgradient and downgradient critical parameterconcentrations for each month, the overall average valuesand the removal efficiency data are presented in Table 2-3.
In cases where effluent concentrations of a compoundwere nondetectable, the detection limit value (1.0 pg/L),rather than an assumed concentration of 0.0 pg/L, wasused to calculate the minimum removal efficiency. Thisconservative practice, which was specified by the QAPP,was adopted to ensure that the removal efficiency wouldnot be overestimated, and assumes that a compound notdetected in the effluent at a detection limit of 1 .O pg/L mayhave been present at a concentration between 0.0 pg/L and1 .O pg/L. For this reason, the removal efficiency values inTable 2-3 are the minimum possible values and may belower than the actual removal efficiencies achieved by thesystem. For example, as shown in Table 2-3, although VCwas not detected in any downgradient wells in August theminimum removal efficiency was not reported as “100percent.” Instead, the removal efficiency for VC wasbased on an assumed average downgradient concentrationof 1.0 clg/L and was reported as “greater than 91 .lpercent”, indicating that the actual value lies in the rangebetween 91.1 percent and 100.0 percent.
The removal efficiency calculations are also influenced bythe magnitude of the influent concentrations relative to thedetection limit value (1 .O pg/L) assigned as the effluentconcentration for nondetect situations. If lowconcentrations of a VOC (for example tDCE or TCA),were present in the influent, the assigned effluent value of1.0 pg/L was greater in proportion to the influentconcentration than in cases where higher influentconcentrations were present (as for cDCE or TCE). Forthis reason, situations involving low influent concentrationstypically resulted in lower calculated removal efficiencyvalues, even though the contaminant was reduced tonondetectable levels in the effluent.
The results presented in Table 2-3 indicate that removalefficiency was high for all contaminants present at
23
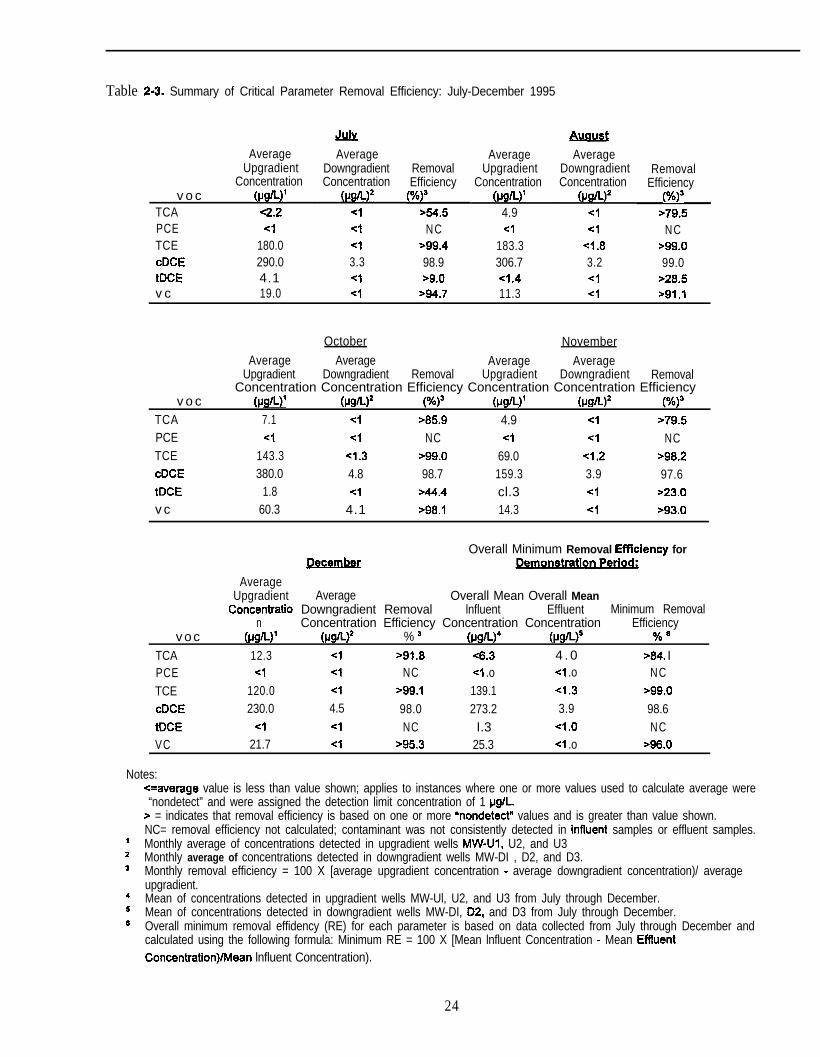
Table 2-3. Summary of Critical Parameter Removal Efficiency: July-December 1995
v o cTCAPCETCEcDCEtDCEv c
AverageUpgradient
Concentration(pg/L)’4.24
180.0290.04.119.0
AtlYAverage
DowngradientConcentration
wu*ClCl43.3-4<I
RemovalEfficiency
(%)3>54.5
NCB99.498.9s9.0
s94.7
Average AverageUpgradient Downgradient
Concentration Concentration@g/L)’ (us/L)2
4.9 44 <I
183.3 cl.8306.7 3.2<I.4 411.3 <l
RemovalEfficiency
(%)3B79.5
NC>99.099.0
~28.5>91 .I
v o cTCAPCETCEcDCEtDCEv c
October NovemberAverage Average Average Average
Upgradient Downgradient Removal Upgradient Downgradient RemovalConcentration Concentration Efficiency Concentration Concentration Efficiency
wu’ (lJ9W (%)J (lJ9U’ (lJ9W (%)J7.1 4 >a59 4.9 <l .79.5cl Cl NC 4 4 NC
143.3 Cl.3 B99.0 69.0 cl.2 >98.2380.0 4.8 98.7 159.3 3.9 97.6
1.8 <I B44.4 cl.3 4 ~23.060.3 4.1 B98.1 14.3 <I s93.0
v o cTCAPCETCEcDCEtDCEVC
Overall Minimum Removal Efflclency forDecember
AverageUpgradient Average Overall Mean Overall Mean
Concentratio Downgradient Removal lnfluent Effluent Minimum Removaln Concentration Efficiency Concentration Concentration Efficiency
(pg/L)’ 0Jsn)* % 3 (ugll)’ hJ9w5 % a
12.3 4 r91.8 e6.3 4 . 0 >84. I<I 4 NC 4 .o Cl .o NC
120.0 4 s99.1 139.1 cl.3 s99.0230.0 4.5 98.0 273.2 3.9 98.6cl <I NC I.3 4 .o NC
21.7 <I >95.3 25.3 4 .o s96.0
Notes:<=average value is less than value shown; applies to instances where one or more values used to calculate average were“nondetect” and were assigned the detection limit concentration of 1 pg/L.
> = indicates that removal efficiency is based on one or more ‘nondetect” values and is greater than value shown.NC= removal efficiency not calculated; contaminant was not consistently detected in influent samples or effluent samples.
’ Monthly average of concentrations detected in upgradient wells MW-Ul, U2, and U3z Monthly average of concentrations detected in downgradient wells MW-DI , D2, and D3.3 Monthly removal efficiency = 100 X [average upgradient concentration - average downgradient concentration)/ average
upgradient.4 Mean of concentrations detected in upgradient wells MW-Ul, U2, and U3 from July through December.’ Mean of concentrations detected in downgradient wells MW-DI, 02, and D3 from July through December.* Overall minimum removal effidency (RE) for each parameter is based on data collected from July through December and
calculated using the following formula: Minimum RE = 100 X [Mean lnfluent Concentration - Mean EffluentConcentration)/Mean lnfluent Concentration).
24

significant concentrations in the influent (TCE, cDCE, andVC). The minimum monthly removal efficiencies forTCE ranged from greater than 98.2 percent to greater than99.4 percent, and the overall minimum removal efficiencywas greater than 99.0 percent. For cDCE, monthly valuesranged from 97.6 percent to 99.0 percent, and the overallminimum removal efficiency was 98.6 percent. Monthlyremoval efficiency values for vinyl chloride ranged fromgreater than 91 .l percent to greater than 98.1 percent, withoverall minimum removal efficiency greater than 96.0percent. Monthly and overall removal efficiency valueswere not calculated for PCE because no PCE was detectedin the influent or effluent samples during any month oftesting.
Figure 2-1 shows the calculated minimum monthlyremoval effkiency values for the critical contaminantspresent at significant concentrations in the influent (TCE,cDCE, and VC). As indicated on Figure 2- 1, there did notappear to be any significant trends in the monthly systemremoval efficiency for any of these contaminants fromJuly to December. Figure 2-1 reflects a slight decrease incalculated removal efficiency for these three parameters inNovember; however, the apparent decrease merely
reflects a decrease in influent concentrations. Thisobservation is significant because the results of theinorganic analyses (see Section 2.1.4) suggest that metalcompounds were precipitating in the iron as groundwaterpassed through the system. Precipitates did not noticeablyaffect system performance with respect to removalefficiency during the period of the SITE demonstration.
2.1.3 Objective S-l: Critical ParameterConcentrations as a Function ofSampling Location (Distance)
Figures 2-2 through 2-7 plot concentrations of criticalcontaminants relative to distance as groundwater movedthrough the system. Data from each group of wells(upgradient, iron, and downgradient) were averaged foreach month to facilitate presentation of data in Figures 2-2 through 2-7. The three data points on each graphrepresent the upgradient pea gravel (distance x=0 feet; iron(x=2.4 feet); and downgradient pea gravel (x=4.8 feet).Only those critical contaminants consistently detected inthe influent samples are plotted in Figures 2-2 through 2-7.
98 -.’ *.
,,*’ ,’ ,’ ‘.*.-.96 -
.’ *.,’ -.,’ ,’ -.
,’ -.-.,’ ,’ ,’ -.*. ,d,’,/LI -.
94 ‘l,* ,’,’ ,’ -.,’ *. ,,.*
‘. ,d,/‘a ,* ,’ .’ -.*. ,,**
*. ‘. ,’ **.%. I’ ,’ .’ B,....“’
‘a ‘. ,’92 - ‘. ,’
*. ,’ ,’‘. ‘\ ,’
‘..&.”
901 I I I I
1 2 3 4Month (July = 1)
5 6
n TCE Q cDCE nVC
RE calculated for months after performance stabilized (July - December); no data collected in month 3 (September);RE based on average values for upgradient (MW-Ul, 2 and 3) and downgradient (MW-Dl, 2, and 3) wells.
Figure 2-1. Critical VOC removal efficiency over time.
25
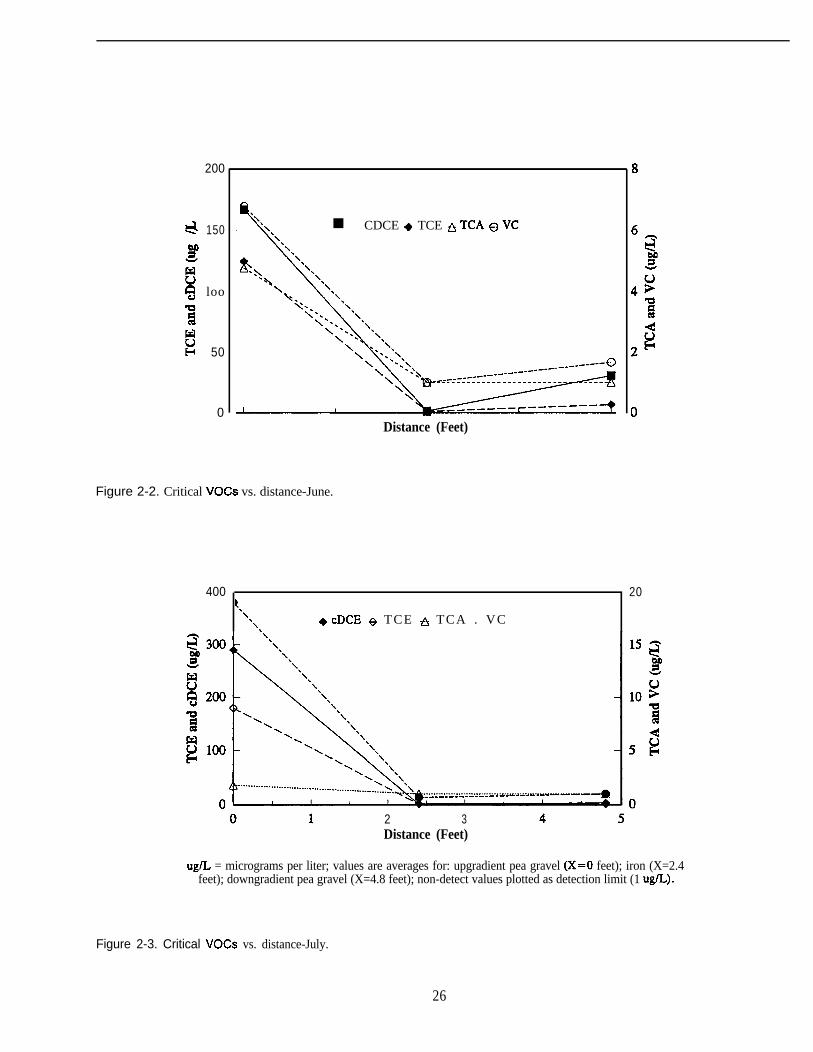
200
-ti 150
ke9 loo5B
8c-c 50
0
n CDCE + TCE nTCA QVC\
Distance (Feet)
Figure 2-2. Critical VOCs vs. distance-June.
400t‘\
‘\. +cDCE 8 TCE fi TCA . VC
20
2 3Distance (Feet)
ug/L = micrograms per liter; values are averages for: upgradient pea gravel (X=0 feet); iron (X=2.4feet); downgradient pea gravel (X=4.8 feet); non-detect values plotted as detection limit (1 ugk.).
Figure 2-3. Critical VOCs vs. distance-July.
26

400 - 12Q
‘\‘\‘\ n cDCE +TCE *TCA @VC - 10
- 6 51
-4 4I+
- 2-------------------a
Distance (Feet)
Figure 2-4. Critical VOCs vs. distance-August.
400
-ti 300
5
88 200
Ii
gtr 100
0
\ +cDCE gTCE ATCA .VC
c
80
Distance (Feet)
ug/L=micrograms per liter; values are averages for: upgradient pea gravel (X =0 ft); iron (X=2.4 feet)and downgradient pea gravel (x=4.8 feet); non-detect values plotted as detection limit (1 ug/L).
Figure 2-5. Critical VOCs vs. distance-October.
27
Dish& (Feet)
Figure 2-6. Critical VOCs vs. distance-November.
250 r , 25
w cDCE + TCE nTCA @VCQ 200 20
kw 150 15
x
;B 100 10
8E-c 50 5
0 00 1 2 3 4 5
Distance (Feet)
ug/L=micrograms per liiter; values are averaged for: upgradient pea gravel (x=0 feet); iron (X=2.4feet); and downgradient pea gravel (x=4.8 feet). Nondetect values plotted as detection limit (1 ug/L).
Figure 2-7. Critical VOCs vs. distance-December.
28

Concentrations of critical parameters present at significantconcentrations in the influent (TCE, cDCE, and VC) weresignificantly reduced as groundwater moved through thewall. As shown in Figures 2-2 through 2-7, in most cases,contaminants were reduced to nondetectable levels by thetime groundwater had traveled about halfway through theiron wall. Some low concentrations of cDCE appeared topersist; however, during all months cDCE wassignificantly reduced relative to influent concentrations.In several instances (for example, TCE in October), allconcentrations in the iron wells were at nondetectablelevels; however, trace concentrations appeared in thedowngradient wells. The presence of low concentrationsof TCE, cDCE, and other compounds in the downgradientwells may have been caused by residual VOCs in thenatural aquifer materials on the downgradient side of thecell continuing to leach minor amounts of chlorinatedVOCs into groundwater, and some of this water mixingwith treated water in the downgradient pea gravel zone.
The results of a previous demonstration of an abovegroundapplication of the metal-enhanced dechlorination processindicated that chlorinated VOCs were persisting for longerperiods (greater distances) in the iron as the demonstrationprogressed, possibly due in part to precipitate formation(EPA 1997). However, for the in-situ system, the VOCdata do not appear to exhibit significant trends indicativeof changes in the iron’s ability to dechlorinate the criticalcontaminants. Critical VOC concentrations in monitoringwells MW-Fel, MW-Fe2, and MW-Fe3, which werelocated approximately halfway through the reactive ironwall (in the direction of groundwater flow) did notincrease significantly during the demonstration period.Although the results of the inorganic analyses suggest thatmetal compounds were precipitating as groundwatermoved through the iron, these precipitates did not cause anoticeable reduction in the iron’s performance during thedemonstration period. Differences between theperformance of the aboveground reactor and that of the in-situ system may have been due to differences between theresidence times for groundwater in the two systems;differences in contaminant loading for the two systems;variations between groundwater chemistry at the twodemonstration sites, or other factors.
Precipitate formation may have been less significant of afactor in the demonstration of the in-situ system than in thedemonstration of the aboveground reactor because thevolume of water treated, flow rate, mass of iron used,groundwater chemistry, length of demonstration period,
and other factors differed between the two demonstrations.Also, based on the apparent groundwater flow velocities,the reactive iron wall was probably thicker than necessaryto dechlorinate the concentrations of VOCs detected in theupgradient wells, and therefore had excess treatmentcapacity. This factor, and the availability of only one rowof measuring points in the reactive iron may have allowedchanges in the first few inches of iron on the upgradientside of the wall to go undetected during the demonstrationperiod.
In summary, the data indicate two key findings with regardto objective S-l: 1) because most contaminants werereduced to nondetectable levels by the time groundwaterhad traveled halfway through the reactive iron, thethickness of the reactive iron wall appeared to be morethan adequate to allow sufficient residence time fordechlorination to occur; and 2) the dechlorination of TCEand cDCE was not causing increased concentrations ofpotential by-products (cDCE and VC) in the downgradientwells, indicating that the iron was dechlorinating all ofthese compounds.
2.1.4 Objective S-2: Noncritical VOCs,Metals, And Other InorganicParameters
Tables C 1 through C6 in Appendix C summarize all of thelaboratory analytical data collected during thedemonstration, including the results of the noncriticalVOC, metals, and other inorganic parameter analyses.Specifically, these parameters were analyzed to evaluateeffects of the reactive iron on noncritical parameters, andto provide additional data about the dechlorination ofVOCs, metal precipitation, and the potential for biologicalgrowth. Due to the extensive number of analyticalparameters and sampling points pertaining to thisobjective, only results for significant parameters arepresented in graphical format.
Noncritical VOCs
The samples were analyzed for a total of 64 VOCs onEPA’s Target Compound List (TCL); tentativelyidentified compounds (TICS) were also reported. The onlysignificant noncritical VOC consistently detected in theupgradient, influent groundwater was DCA, which wasdetected at low concentrations (less than 6 pg/L) during allmonths of testing. DCA was below detectable levels in the
29

iron wells in all but two cases (MW-Fe3 in November andDecember), and was below detectable levels in all of thedowngradient wells during these months. In all instances,DCA concentrations in the iron wells and downgradientwells were below the applicable NYSDEC and MCLstandards, both of which are equal to 5.0 pg/L. Thisobservation is consistent with ETI’s past research data,which indicated that the reactive iron is capable ofdechlorinating DCA (Focht, Vogan, and O’Hannesin1996).
As indicated in Table C-2, during July TCE and cDCEwere detected in a sample from well MW-D4, and TCE,cDCE, and VC were detected in a sample from well MW-DS. VOC sample fractions were collected from thesewells solely to provide information to support thedemonstration health and safety program. The QAPP didnot specify collection of VOC sample fractions from thesewells to support primary or secondary objectives; for thisreason, the results are not critical parameters and are notdiscussed in detail in this report. However, it should benoted that both wells MW-D4 and MW-DS are locatedoutside of the treatment cell, and the VOC samplefractions were collected relatively early in thedemonstration (July). As previously discussed, possiblemixing of treated groundwater and residual, untreatedwater may have resulted in the presence of VOCs insamples from these wells.
Metals
The groundwater samples were analyzed for a total of 16metals using inductively-coupled plasma (ICP) andatomic absorption (AA) techniques. Data for several ofthe metals detected appear to indicate trends indicative ofprecipitate formation. These metals include calcium,magnesium, barium, iron, and manganese.
Figures 2-8 and 2-9 summarize the average calcium andmagnesium concentrations in each row of wells (includingthe downgradient wells screened in the natural aquifermaterials) from June through December. Figure 2-10summarizes the average calcium and magnesium datacollected from each row after system performancestabilized (July through December). As shown by thefigures, influent concentrations of each of these metalsexhibited relative consistency among months. During allmonths, concentrations of calcium generally decreasedbetween the upgradient wells and the iron wells, and thenappeared to gradually increase in the downgradient pea
gravel and aquifer wells. The decrease in calciumconcentrations coincided with a decrease in bicarbonatealkalinity and an increase in measured pH values,suggesting that geochemical conditions in the iron wereconducive to decreased solubility and increasedprecipitation of calcium carbonate and other metalcompounds onto the iron.
Magnesium concentrations also generally decreasedbetween the upgradient pea gravel and reactive iron;however, unlike calcium, magnesium concentrationscontinued to decrease as groundwater moved through thedowngradient pea gravel, and then increased slightly in thedowngradient aquifer. This observation suggests thatmagnesium compounds continued to precipitate asgroundwater moved downgradient from the reactive ironzone. The slight increase observed in magnesiumconcentrations downgradient from the cell may be due tomixing of treated and untreated water downgradient of thecell. Also, samples collected from wells MW-D4, D5 andD6, which were screened in the natural aquifer materials,generally appeared to contain a higher concentration ofsuspended sediments than samples from wells screened inthe pea gravel or iron. These suspended fines may haveaffected the analyses as the samples were not filteredbefore analysis.
Iron and manganese concentrations are plotted in Figures2-11 through 2-13. As evidenced by the figures, thesamples from wells in the reactive iron typically containedthe highest iron concentrations of the four rows monitored.This is consistent with the nature of the proposed reactionmechanism (see Section 1.3) which suggests that theoxidation of iron and the hydrolysis of water will causeiron compounds such as Fe(OI-I), and FeCO, to form, andthen subsequently precipitate out due to the elevated pHlevels, In August, November, and December ironconcentrations in the downgradient aquifer wells werehigher than background concentrations but were stillrelatively low (less than 1 mg/L). However, during June,July, and October, iron concentrations in the downgradientaquifer wells were below background levels. For thisreason, the iron data to not strongly indicate trendsregarding the persistence of dissolved iron as groundwatermoved downgradient in the aquifer.
Unlike iron, manganese concentrations appeared todecrease between the upgradient pea gravel and reactiveiron zones, and then gradually increase in thedowngradient wells. The cause for the apparent behavior
30

$80Lo.ij 40
z 20
0
mg/L = milligrams per liter; UG = upgradient; DG = downgradient
Figure 2-8. Summary of cakium data over time.
mg/L = milligrams per liter; UG=upgradient; DG=downgradicnt
Figure 2-9. Summary of magnesium data over time.
0 1 2 3 4 5 6 7 8Distance (feet)
mg/L = milligrams per liter; values based on July-December. averaged for: upgradient (x-0 ft).iron (x=2.4 ft); downgradient (x=4.8 ft), and downgradient aquifer (x= 10.7 ft) wells.
Figure 2-10. Average calcium and magnesium values vs. distance.
31

mgiL = milligrams per liter; UG = upgradient; DG - downgradient;all noudetczt values plotted as detection limit (0.10 mgL)
Figure 2-11. Summary of iron data over time.
ti3
0.8
o” 0.6zB 0.43E 0.2
0
mg/L = milligrams per liter; UG = upgradient; DG = downgradient;
Figure 2-12. Summary of manganese data over time.
0 . 0 0 1 I 1 I I I I , 1 I I I I
0 1 2 3 4 5 6 7 8 9 10 11 12Distance (feet)
mg/L = milligrams per liter; values based on July-December, averaged for: upgradient (X=0 ft);iron (X=2.4 ft); downgradient (X=4.8 ft); and downgradient aquifer (X=10.7 ft) wells.
Figure 2-13. Average iron and manganese values vs. distance.
32

is unknown. According to ETI, this may have been causedby naturally occurring manganese in site groundwaterbeing absorbed into carbonate precipitates forming asgroundwater moved through the reactive iron, or otherfactors (Vogan 1996). Manganese concentrationsdowngradient of the wall generally appeared to be similarto upgradient concentrations. Overall, it does not appearthat the iron wall was introducing more manganese togroundwater than was present at naturally occurringbackground levels.
HCO; + OH -+ I-JO + co,”Ca 2+ + CO,*- -+ CaCO,(s)
(2-la)(2-lb)
The slight increase in bicarbonate in the downgradient peagravel wells is consistent with the slight drop in pH andincrease in calcium concentrations observed. Theseobservations indicate that the tendency for metalcarbonates to precipitate was decreasing as groundwaterpassed out of the treatment cell.
As shown in Figure 2- 14, barium concentrations generally As shown in Figure 2-17, influent sulfate concentrationsincreased between the upgradient pea gravel wells and the were generally consistent over the demonstration period,iron wells, and then declined. However, the magnitude of ranging from about 14 to 20 milligrams per liter (mg/L),the increase in barium lessened with each month. The and generally appeared to decrease as groundwater movedpossible cause of this observation is unknown, but may be through the treatment cell during all months. Thea residual effect of the cell construction activities that reduction in sulfate concentrations appeared to be morelessened with time as groundwater continued to “flush” complete and was occurring more rapidly as thethe reactive iron. According to ETI, after initial demonstration progressed. For example, in July theemplacement the iron may have temporarily leached small average sulfate concentrations in the upgradient, iron, andamounts of barium into groundwater passing through the downgradient wells were 16.8, 15.5, and 10.6 mg/L,wall (ET1 1997). However, barium did not appear to be respectively. In December the average upgradientpersisting into the downgradient aquifer; barium levels concentration was consistent with July (16.6 mg&);generally decreased between the reactive iron wells and however sulfate was nondetectable in the iron wells and inthe downgradient wells. the downgradient wells.
Other Inorganic Parameters
Other inorganic parameters (bicarbonate alkalinity,sulfate, chloride, nitrate, and nitrite were measured in theupgradient pea gravel, iron, and downgradient pea gravelwells.
Figures 2- 15 and 2- 16 plot the average bicarbonatealkalinity concentrations in the various rows of wells. Theresults indicate that bicarbonate alkalinity decreased asgroundwater moved through the reactive iron wall,coinciding with an increase in pH, and then increasedslightly as groundwater moved downgradient. Thisbehavior is consistent with the results of the calcium,magnesium, and pH analyses, which suggested that metal-carbonate compounds were precipitating out. Figure 2- 16graphically exhibits the relationship between bicarbonateconcentrations and pH. According to Reardon (1995), aspH increases, hydroxide (OH-) ions react with bicarbonateions (HCO,) to form carbonate ions (C03)2-, which thenmay combine with iron, calcium, magnesium, and othermetals to form metal-carbonate precipitates. Equation 2-1 shows the formation of calcium carbonate through thismechanism:
Sulfate concentrations were measured to evaluate, in part,the potential for sulfate-reducing bacterial growth andprecipitation of metal sulfates. According to ETI, sulfatereduction may indicate biological activity in the reactiveiron. However, the PLFA analyses did not indicatesignificant microbial activity in the reactive iron (seeSection 2.1.6); therefore, it is unknown if the decrease insulfate concentrations was due to biological activity orother causes, such as precipitation of metal-sulfatecompounds.
Figures 2- 18 and 2-19 exhibit the total nitrate/nitritenitrogen results. Total nitrate/nitrite and nitrite analyseswere performed on the samples from the nine wells in thetreatment cell; the total nitrate content was thendetermined by calculating the difference between the totalnitrate/nitrite values and the nitrite values. Total nitrate/nitrite concentrations detected in samples from theupgradient pea gravel wells ranged from about 0.16 to 0.47mg/L, and gradually decreased during the demonstration.As shown in Tables C-l through C-6, the analysesindicated that both nitrate and nitrite were present in theinfluent groundwater. The relative proportion of each ofthese compounds to the total nitrate/nitrite nitrogen
33

Figure 2-14. Summary of barium data over time.
mg/L= milligrams per liter; UG = upgradient; DG = downgradient
Figure 2-15. Summary of bicarbonate alkalinity data over time.
8 Bicarbonate + PH
.Ya 0 0
0 1 2 3 4 5Distance (feet)
mg/L = milligrams per liter; values based on data from July-December, averaged for:upgradient (x=0 ft): iron (x=2.4 ft), and downgradient (x=4.8 feet) wells.
8 a2
733
5
Figure 2-16. Average bicarbonate alkalinity and pH vs. distance.
34

mg/L = milligrams per liter; UG = upgradient; DG = downgradient;all nondetect values plotted as detection limit (5.0 mg/L)
Figure 2-17. Summary of sulfate data over time.
0.6 , 1
mg/L = milligrams per liter; UG = upgradient; DG = downgradient;all nondetcct values plotted as detection limit (0.050 me/L)
Figure 2-18. Summary of total nitrate/nitrite data over time.
+ Nitrate/Nitrite
0 1 2 3Distance (feet)
Average values based OII data from July - December, averaged for: upgradient (X-O ft); iron (x = 2.4 I?);sod downgradient (X=4.8 fi) wells. Detection hit used to represent Mndetect values for averaging data.
Figure 2-19. Average sulfate and total nitrate/nitrite values vs. distance.
35

content varied considerably, but indicated that nitrate wasthe predominant species. More significantly, the dataindicated that total nitrate/nitrite nitrogen was generallynot detectable in the samples from the wells screened inthe iron or the downgradient pea gravel. According to ETI,nitrate consumption may be due to either abiotic or bioticreduction of nitrate to nitrogen gas or ammonium (ETI1997; PRC 1996). The PLFA analyses did not indicatesignificant biological activity in the reactive iron; thisobservation suggests that the decrease in nitrate andsulfate concentrations was primarily due to abioticprocesses.
Chloride concentrations were determined because theymay correlate with dechlorination of VOCs. However,because the background chloride concentrations wererelatively high compared to the influent VOCconcentrations, no significant trends in chlorideconcentrations were noted during treatment as a result ofVOC dechlorination (see Tables Cl - C6).
2.1.5 Objective S-3: Eh, DO, pH,Specific Conductivity, andTemperature
Figures 2-20 and 2-2 1 summarize the average pH valuesmeasured in the upgradient pea gravel, iron, downgradientpea gravel, and downgradient aquifer sampling locationsduring all months of testing. As shown on Figure Z-20,groundwater in the wells screened in the reactive irontypically exhibited the highest pH levels during all monthsoftesting. Generally, pH increased as groundwater movedfrom the upgradient pea gravel and through the iron, andthen decreased as groundwater moved downgradient.Equations l-la through I-ld, and l-2a through l-2gpresented in Section 1.3.1 may explain the increase in pH.In these reactions, H+ is consumed so the pH rises.
The specific conductivity of groundwater decreased asgroundwater moved through the reactive iron, as shown inFigures 2-22 and 2-23. The decrease in the specificconductivity of groundwater is probably caused by theremoval of ions from groundwater during treatment.Removal of ions may occur through the formation ofmetal-hydroxide or metal-carbonate precipitates. Theformation of these precipitates may remove metal cations,hydroxyl ions, and carbonate ions from the groundwater.
Generally, the groundwater temperature data did notindicate any significant differences among groundwater
temperatures in the various zones of the cell or in theaquifer. However, the average temperature data indicateda general decrease in site groundwater temperaturebetween October and December. This effect isdemonstrated by the average temperature data from thewells screened in the iron zone; these values aresummarized in Figure 2-24. The temperature ofgroundwater in these wells declined about 4” C betweenOctober and December. Because the November andDecember sampling events were performed during coldweather, it is possible that the temperature measurementswere affected by ambient air cooling the measuringdevice. However, due to the shallow depth to groundwateron site, a slight decrease in groundwater temperature inwinter months is expected. As discussed in Section 3,according to ETI, past studies involving TCE have shownthat temperature can influence the time required fordechlorination to occur (ET1 1996a). However, in thiscase the slight decrease in temperature did not appear tonoticeably affect system performance, and thereforeprovided no additional data regarding the effects oftemperature on the dechlorination process. In general, in-situ systems are less susceptible to potentially adverseambine temperature effects than aboveground systems.
The dechlorination reactions described by Equations 1- 1and l-2 indicate a loss of electrons from the oxidizing iron.The groundwater Eh data, summarized in Figures 2-25 and2-26, indicate that Eh decreased as groundwater movedinto the reactive iron, and then increased slightly asgroundwater moved downgradient, generally following anopposite trend to the pH data. The trends exhibited by theEh data are consistent with the known electrochemicalmechanism of the dechlorination reaction; indicating thatelectrons derived from the oxidizing iron cause reducingconditions in the groundwater.
The observed reduction of chlorinated hydrocarbons andthe decreases in metals concentrations correlate with theobservation that reducing conditions were present. Aspreviously discussed, concentrations of calcium,magnesium, and manganese were observed to decreasecoincident with the decrease observed in Eh and theincrease in pH, and then generally increase as groundwatermoved downgradient from the iron wall. However, whiletrends observed in the Eh data may be indicative of metalsprecipitating from groundwater moving through the iron,changes in the iron’s capacity to dechlorinate the criticalcontaminants were not observed during the demonstrationperiod.
36

s DG Aquifer I.51 j 8.09 ) 8.22 1 8.1/ 1 /.I1 /.08 I
UG = upgradient; DG = downgradient
Figure 2-20. Summary of pH values vs. distance.
10.00
9.50
gj 9 . 0 0
% 8.50
1 8.00WIte” 7.50a
7.00
0 1 2 3 4 5 6 7 8 9 10 11 12Distance (feet)
Values based on data collected from July - December, averaged for: upgradieut (X=0 ft),iron = (X=2.4 ft), downgradient (X=4.8 ft), and downgradient aquifer (X110.7 ft) wells.
Figure 2-21. Average pH values vs. distance.
37

Month Im UG (Gravel)
June 1 July 1 August I Bctdxr !NOV~501 I 672 I 673 724 j
mber December640 724
II Reactive Iron 280 343 314 3116 276 311I DG (Gravel) 269 305 297 304 237 296II DG Aquifer 400 343 318 415 314 343
UG = upgradient; DG = downgradient
Figure 2-22. Summary of specific conductivity data over time.
z 800
.B 700i;.9.5 (joo
i3:z 500
sy 400
6$ 300 ------A~-‘--
__----- - - -
3“aWI 200
0 1 2 3 4 5 6 7 8 9 10 11 12ICPistance (feet)
Values based on data from July - December, averaged for: upgradient (X=0 ft);iron (X=2.4 fi); downgradient (X=4.8 ft); and downgradient aquifer (X=10.7 ft) wells).
Figure 2-23. Average spectfic conductivity values vs. distance.
38

F 0 1 2Month (ke = 0) 4
5 6
Values based on data collected from June through Deuxkr (no data colkcted in September);values averaged for monitoring wells in reactive iron (MW-Fel, MW-Fe2, and MW-Fe3).
Figure 2-24. Average groundwater temperature in iron wells vs. time.
4001
mV = millivolts; UG = upgradient; DG = downgradient
Figure 2-25. Summary of Eh data over time.
-200 I I I I0 1 2 3 4 5 6 7 aa 99 10 11 12
Distance (feet)Values based on data collected from July - December, averaged for: upgradient (X=0 ft);
iron (X=2.4 ft); downgradient (X-4.8 ft); and downgradient aquifer (x=10.7 ft) wells.
Figure 2-26. Average Eh values vs. distance.
39

DO data are not presented in this ITER. The field meterused for DO measurements performed erratically, andlacked the capability of field calibration. For thesereasons, the quality ofthe DO data is unknown, and the DOdata are considered unusable.
2. I. 6 Objective S-4: BiologicalMicroorganism Growth
According to ETI and others, past studies of the metal-enhanced dechlorination process suggest that the processis abiotic, and biological activity does not account for asignificant amount of the chlorinated VOC reduction thatoccurs. During the New York demonstration, the SITEteam collected groundwater samples for total PLFAanalysis to confirm that the process was predominantlyabiotic, and to evaluate the potential for excessivemicroorganism growth that could interfere with hydraulicflow through the iron. PLFA sample fractions werecollected in June, October, and December. During eachsampling event, the SITE team prepared replicate samplefractions for each well to minimize the potential effects ofvariability. Tbe PLFA results for the replicate samplesfrom each well were averaged. These average results arepresented in Tables C-l through C-6. Figure 2-27compares the average total PLFA concentrations for thewells in each row (upgradient pea gravel, reactive iron,downgradient pea gravel, and downgradient aquifer) fromeach month of testing.
As in the case of the other parameters, the June PLFA dataare probably not representative of steady state conditionsin the treatment cell. Figure 2-27 shows that for June, theaverage total PLFA concentration in wells in the treatmentcell was on the order of lo4 to lo5 picomoles/liter (pm/L).In June there did not appear to be a significant differencebetween the total PLFA in the upgradient wells, iron wells,and downgradient pea gravel wells. The total PLFA in thedowngradient aquifer wells was lower, on the order of 1 O3to 1 O4 pm/L. The higher PLFA in the treatment cell and thelack of variance among the PLFA results in the variouszones of the cell may be related to residual effects of thecell construction activities, and not indicative ofsignificant long-term microorganism growth in the iron.
The October and December PLFA data appear to indicatethat the total microorganism population in each of thethree zones of the treatment cell was significantly lowerthan in June. PLFA concentrations in the upgradient peagravel wells were on the order of lo2 to lo3 pm/L in
October, and lower yet (10’ to 1 O2 pm/L) in December.This observation may be partially due to the effects ofdecreasing temperature discussed in Section 2.15. Mostsignificantly, PLFA concentrations in the iron wells inOctober and December were not significantly higher thanin the upgradient pea gravel wells, and were lower than thePLFA concentrations in the downgradient pea gravel andaquifer wells. Total PLFA concentrations in thedowngradient aquifer wells in October and Decemberwere in the same general range observed in June, before asignificant amount of water had passed through the celland migrated downgradient. These observations suggestthat once a sufficient number of pore volumes of water hadpassed through the system to minimize residual effects ofconstruction activities, the total microorganism populationin the pea gravel and the reactive iron was lower than in thenatural aquifer materials. For this reason, the results ofthePLFA analyses correlate with past research by othersindicating that the dechlorination process is abiotic(Gillham and O’Hannesin 1994).
As discussed in Section 2.1.7, the groundwater flowvelocity estimates were complicated by the low hydraulicgradient. However, there was no measurable decrease inflow velocity over the course of the demonstration. Also,system performance appeared to remain generallyconsistent throughout the demonstration. For thesereasons, biological growth did not appear to be interferingwith the flow of groundwater through the reactive iron,further indicating that biological activity in the iron wasnot significantly greater than in the natural aquifermaterials.
2.1.7 Objective S-5: Operating andDesign Parameters
Table 2-4 summarizes information collected during theSITE demonstration regarding operating and designparameters. The bulk density analysis ofthe iron indicatedan average (uncompacted) bulk density of approximately2.25 grams per cubic centimeter, or 140 pounds per cubicfoot. About 35 to 40 tons of iron was used to construct thecell; ETI estimates that the bulk density of the iron in thecell was probably greater than the laboratory-measuredvalue due to settling. According to ETI, typical density foriron obtained from the supplier used for the New YorkDemonstration (Master Builders, Inc.) is about 160 to 180pounds per cubic foot after settling (ETI 1996a; 1996d;1997).
40

1ClCtOOO
0 October f December
10 L I I I I I I I I I I I
0 1 2 3 4 5 6 7Distance (feet)
8 9 10 11 12
Notes: PLFA concentrations are averages for wells in following areas: upgradient pea gravel (X =O ft);reactive iron (X=2.4 ft); downgradht pea gravel (X=4.8 ft); downgradient aquifer (X=10.7 ft)
Figure 2-27. Total phospholipid fatty acids vs. distance.
41

Table 24. Summary of Operating and Design Parameters
Reactive Iron Medium:
Initial Weight (ETI)
Volume
Density (uncompacted)
Density, after settling, estimated (ETI)
Hydraulic Conductivity (ETI)
Porosity, after settling, estimated (ETI)
Treatment Zone Dimensions:
Width (thickness) of Iron Wall
Length of Iron Wall
Height of Iron Wall
Depth of Cell
Width (thickness) of Pea Gravel Zones
Length of Sheet Piling Wings
Aquifer Saturated Thickness (average)2
Hydraulic Gradient Across Iron Wall
Width of Capture Zone (ETl)3
Groundwater Flow Velocity through Iron (range)
Volumetric Groundwater Flow Rate (range)
Cumulative Volume of Water Treated DuringSITE Demonstration (range)’
About 35 to 40 tons
400 ft3
140 lb/ft3 (2.25 g/cm3)
180 Ib/ft3
‘I 42 Wday
0.4
3 feet
12 feet
11 to 12 feet’
14 to 15 feet’
About I .75 feet
15 feet each
10 feet
Less than 0.001 to 0.002
24 feet
0.4 to 1 ft/day (ETI)
About 15.4 to 57.8 cubic feet(115 to 431 gallons) per day
About 29,000-73,000 gallons
Notes:(ETI) - designates value provided by ETI(range) - range of values provided due to uncertainty in piezometric measurementsl Top of reactive iron wall was about 3 feet below ground surface.2 Saturated thickness varied from about 8 to 12 feet, depending on seasonal water
table fluctuations.3 Estimated width of portion of groundwater contaminant plume captured by the funnel
and gate system.4 Assumes an average saturated thickness of 10 feet.
42

Groundwater depth measurements collected during eachof the six sampling events were converted to piezometricelevations relative to mean sea level (MSL) to evaluate thehorizontal gradient and groundwater flow velocity. Thepiezometric elevation data are summarized in Table 2-5.Interpretation of the piezometric data was complicated byseveral factors. As evidenced by the data in Table 2-5, thehorizontal gradient measured across the study area wasextremely low, generally less than 0.001. This wassignificantly less than the conservative (maximum) designgradient value (0.002) used by ET1 for the system design.In most cases, due to the close spacing of the monitoringwells in the treatment cell and the accuracy limitations ofthe measuring equipment (0.0 1 foot), differences betweenwater levels in wells in the treatment cell were notaccurately measurable. Also, after tbe in-situ system wasinstalled and the demonstration commenced, S&Wdetected the presence of a liquid hydrocarbon layer,related to a past release from a IJST at the manufacturingfacility, on the water table upgradient from the treatmenrsystem. This layer prevented piezometric measurementsin at least three piezometers (P-2, P-4, and P-7) in thesouthern part of the demonstration area and may haveaffected some measurements in other piezometers.’
Allowing for the limitations ofthe data, the measurementsindicated a generally westward flow direction across thedemonstration area, consistent with past data reported byS&W (see Figure 2-28). Based on S&W’s reported valuesfor hydraulic conductivity and porosity of the naturalaquifer materials, the observed horizontal gradients of0.0005 to 0.001 indicate groundwater flow velocities ofabout 0.2 to 0.4 foot per day on site in the aquifer.According to ETI, the funnel and gate configurationtypically accelerates flow velocities in the capture zone(PRC 1997a). Assuming that thegradient in the treatmentcell was at least as high as the natural gradient on site, theminimum estimated flow velocity tbrough the wall wasabout 0.4 foot per day. Based on the maximum measuredgradients between the wells in the cell (December), themaximum estimated flow velocity was about 1 foot perday. These estimates are based on ETI’s reported designvalues for the iron’s hydraulic conductivity and porosity(ETI 1994).
Due to the uncertainty regarding the groundwater flowvelocity, ET1 performed a postdemonstration tracer studyand a flow-meter study to evaluate the flow velocity.These studies were not part of the planned SITEdemonstration activities, and were not performed under
the direction of EPA. According to ETI, the bromidetracer study was inconclusive; however, the flow meterstudy indicated a flow velocity of about 1 foot per day inthe iron zone (ETI 1996b; 1996d).
In summary, the groundwater flow velocity through thetreatment zone appears to have been between 0.4 and 1foot per day; however, there is uncertainty regarding theflow velocity estimates, and it is possible that the flowvelocities were below or above this range. For this reasonthe exact cumulative volume of groundwater treatedduring the demonstration is unknown. Assuming thepreviously-described range of flow velocities and anaverage saturated thickness of about 10 feet, the volume ofgroundwater treated was in the range of about 29,000 to73,000 gallons, and residence time in the 3-foot-thickreactive iron wall appeared to be in the range of about 3 to7 days. Based on the predominantly nondetectable criticalparameter concentrations in the monitoring wells screenedin the iron, VOCs appear to have been reduced belowregulatory levels within the first 1.5 feet of the reactiveiron. For this reason, the high-end (conservative) velocityestimate of 1 foot per day indicates that contaminantdechlorination occurred within 36 hours; the low endestimate (0.4 feet per day) indicates that dechlorinationoccurred within about 90 hours. In either case, the use ofa 3-foot-thick iron wall apparently provided adequateresidence time for this particular application during theSITE demonstration period.
2.2 Additional Performance Data
In addition to the SITE demonstration results, severalother field applications of the in-situ metal-enhanceddechlorination technology were reviewed to provideadditional information about the process. However, theanalytical results from these field applications have notbeen subjected to EPA QA review and therefore are notused to draw conclusions in this report. These applicationsconsisted of (1) the field test conducted at the CanadianForces Base in Borden, Ontario, Canada (Borden site); (2)a field test and full-scale installation at a Californiasemiconductor facility; and (3) a full-scale installation inBelfast, Northern Ireland. The application of the in-situmetal-enhanced dechlorination process in each of thesesites is discussed below. Additional informationregarding case studies is presented in Appendix B.
I S&W implemented hydrocarbon recovery operations upon discoverivg thelayer. Significant amounts of petroleum-related dissolved-phase contarnmantssubsequently were not detected and did not affect interpretation of theanalytical data.
43

Table 2-5. Piezometric Data
LocationTOC TOC EL 6/6/95 y10/95 1 O/l 0195 11/7/95 1214/9Fi
EL (feet(feet) msl) DTW GW E L DTW G W E L D T W GW EL DTW GW E L D T W GW EL DTW GW EL
PI 99.61P2 100.97P3 99.60P4 99.76P5 99.66P6 99.41P7 101.06P6 100.63
MW-Ul 96.76MN-u2 96.61MW-us 96.51
MW-FE1 98.20MW-FE2 96.05MW-FE3 96.15tvlW-Dl 96.81MW-D2 96.66h4W-D3 98.83k&V-D4 99.20h&V-D5 99.25Mw-D6 96.96
1,050.61 7.15 1,043.66
1,052.17 6.51 1,043.661,050.80 7.16 1943.64
1,050.96 7.31 1,043.65
1,050.66 7.23 1,043.651,050.61 6.97 1,043.641,052.26 9.07 1,04x19I,05163 6.14 1,043.69
1,049.98 6.36 1,043.601,050.Ol 6.41 1,043.601,049.71 6.11 1,043.601,049.40 6.79 1,042.611,049.25 5.64 1,043.611,049.35 5.74 1,043.611,050.Ol 6.40 1,043.611,050.oa 6.47 1,043.611,050.03 6.42 1,043.611,050.40 6.81 1,043.59
I,05045 6.63 1.043.621,050.16 6.55 1,043.61
7.96 1,042.85 8.189.30 1,042.67 9.517.97 1,042.63 8.178.11 1,042.85 8.336.03 1,042.65 0.247.75 I,04266 7.989.95 1,042.31 X8.93 1,042.90 9.157.15 I,04263 7.377.18 1,042.83 7.396.88 1.04263 7.116.57 1,042.83 6.796.42 1,042.83 6.646.53 1,042.82 6.747.18 1,042.03 7.407.25 1,042.63 7.477.21 1,042.82 7.427.59 1,042.81 7.617.62 I,04263 7.347.34 1,042.62 7.55
1,042.63 8.33 1.042.401,042.66 9.86 1,042311,042.63 6.32 1,042.431,042.63 X X1,042.64 8.39 1,042.491,042.63 8.11 1,042.50
X X X1,042.60 9.31 1,042.521.042.61 7.51 1,042.471,042.62 7.53 1,042.461,042.60 7.24 1,042.471,042.61 6.92 I,042461,042.61 6.60 1,042.451,042.61 6.67 i,o42.481,042.61 7.54 1,042.471,042.61 7.61 1,042.471,042.61 7.57 1,042.461,042.59 7.94 1,042.461,042.61 7.97 1,042.401,042.61 7.69 1,042.47
7.62 1,043.19 5.98 1,044.63X X X X
7.61 1,043.19 5.99 1,044.61X X X X
7.66 1,043.20 6.05 1,044.637.41 1,043.20 5.76 1,044.65
X X X X8.61 1,043.22 6.97 1,044.666.61 1.043.17 5.17 1,044.616.62 1,043.19 5.20 1,044.616.56 1,043.15 4.89 1,044.626.22 1,043.16 4.56 1,044.626.06 1,043.17 4.43 1,044.826.19 1,043.16 4.54 1,044.816.85 1,043.16 5.22 1,044.796.91 1,043.17 5.26 1,044.806.87 1,043.16 5.24 1,044.797.24 1,043.16 5.62 1,044.767.28 1,043.17 5.66 1.044.796.99 1,043.17 5.37 1,044.79
Notes:Ail elevation data are based on top-of-casing elevations determined by leveling on 12/4/95; all elevations relative to mean sea level (ms)) datum based on dataprovided by S&W.TOC ELrelevation of top of (inner) monitoring well casing.DTW = depth to groundwater in monitoring well, measured from top of casing.GW EL = elevation of piezometric surface.X - Groundwater elevation not measured due to presence of a hydrocarbon layer.Values in bold type indicate measurements known to be affected by the presence of a hydrocarbon layer.

+(,z66]
QMW-D3
(1044.79)
LEGEND
+SITE ProgramMonitoring Well
+I-
SITE ProgramPiezometer
(1044.81)JiezometricElevation on
fmj Imn Wall (Gate)
Pea Gravel
I APPROXIMATE SCALE: 1” = 10
NIW-Fe(1044.8
,M-Fe3 (1044.81)P&
Fe1 (1044.82)
-43(lo~s3,
GeneralGroundwaterFlow Direction +-
P2NM
SOURCE: Modified from PRC 1995
Notes:AlI elevations are relative to mean sea level (MSL) datumand are +/- 0.01 foot accuracy.
(NM) - Piezometric elevation not measured due to presenceof hydrocarbon layer.
Figure 2-28. Piezometric elevations-December 1995.

2.2.1 Borden Site
At the Borden site, an in-situ reactive wall was installed inJune 1991 to treat groundwater contaminated with PCEand TCE. The source of the plume was located about 13.1feet below ground surface (bgs) and 3.3 feet below thewater table. Maximum contaminant concentrations wereabout 250,000 and 43,000 ug/L for TCE and PCE,respectively. The permeable wall was constructed about16 feet downgradient from the source. The aquifermaterial was a medium to fine sand, and the averagegroundwater flow velocity was about 0.3 foot per day(Gillham 1995; 1996).
Samples were collected and analyzed over a five-yearmonitoring period. The results indicate that PCE and TCEconcentrations decreased consistently while theconcentrations of chloride increased. The averagemaximum concentrations of PCE and TCE downstream ofthe wall were about 10 percent of the influentconcentration, indicating a substantial reduction withinthe wall. However, the concentrations of PCE and TCE inthe treated water were about three orders of magnitudeabove site drinking water standards. The results alsoindicated that cis- and trans- 1,2-DCE were produced as aresult of PCE and TCE degradation in the wall. DCEisomers were degraded as they passed through the wall,although effluent concentrations remained above sitedrinking water standards. No VC was detected in thesamples, and no bacterial growth was observed. pHmeasurements were also taken, the results of whichshowed little change in pH as a result of treatment(Gillham 1995; 1996). It is suspected that the pH changesnormally seen as a result of treatment were not observedbecause of the buffering capacity of the carbonate sandused during the treatment process. ETI collected coresamples ofthe reactive iron after two years, and again after3.8 years, to evaluate precipitate formation. According toETI, examination of samples of the reactive iron using x-ray diffraction and scanning electron microscopytechniques showed no metal precipitates on the iron. (Formore information, see O’Hannesin 1993 .)
2.2.2 California Semiconductor Facility
Groundwater from the California semiconductor facilitycontained TCE at concentrations ranging from 50 to 200pg/L, cDCE ranging from 450 to 1,000 ug/L, VC rangingfrom 100 to 500 ug/L, and Freon 113 ranging from 20 to 60ug/L. An above-ground pilot-scale demonstration reactorcontaining 50 percent iron and 50 percent sand by weight
was installed at the facility and operated for a period of 9months. Although groundwater at the site is highlymineralized, and precipitate formation was evident, it didnot appear to interfere with treatment of the VOCs ofconcern (Yamane and others 1995; Szerdy and others1995; Focht, Vogan, and O’Hannesin 1996).
Based on the results obtained from treatment in thereactor, a full-scale in-situ treatment wall was installed inDecember 1994. The wall consisted of 100 percentgranular iron, was 3.9 feet thick, 39.4 feet long, and wassituated vertically between depths of about 13 feet and39.4 feet bgs. A layer ofpea gravel, about l-foot thick, wasinstalled on both the upgradient and downgradient sides ofthe iron wall (Yamane and others 1995; Szerdy and others1995; Focht, Vogan, and O’Hannesin 1996).
Since the system was installed, no VOC concentrationsexceeding MCLs have been detected in groundwaterdowngradient from the in-situ system (Yamane and ethers1995; Szerdy and others 1995; Focht, Vogan, andO’Hannesin 1996).
2.2.3 Belfast, Northern Ireland Facility
In 1995, a steel, cylindrical, in-situ reactive vessel wasinstalled at a depth of about 40 feet bgs at an industrialfacility in Belfast, Ireland. Groundwater at the facilityreportedly contains TCE at concentrations as high as 300mg/L, along with lower concentrations of cDCE and vinylchloride (ET1 1996c).
The in-situ reactive vessel measures 4 feet in diameterwith a vertical thickness of iron measuring 16 feet. TwolOO-foot-long slurry walls were installed at the facility todivert groundwater to the reactive vessel. Groundwaterflows by gravity through the iron-laden reactive vessel andis discharged from a piped outlet on the downgradient sideof vessel. The system was designed to allow about 5 daysof residence time. The reactive vessel is equipped with amanhole to access the top of the iron zone in order toscarify the iron surface if a buildup of precipitate shouldoccur. Total cost of the system, including the requireddesign efforts, the slurry walls, the reactive vessel, and theiron was reportedly about $375,000 (ET1 1996c).
Since installing the reactive vessel, TCE concentrations ineffluent groundwater have been reduced to less than 100ug/L, and cDCE concentrations have been reduced to lessthan 10 pg/L (ETI 1996c).
46
Section 3Technology Applications Analysis
This section discusses the following topics regarding theapplicability of the metal-enhanced dechlorinationtechnology: factors affecting technology performance,site characteristics and support requirements, materialhandling requirements, technology limitations, potentialregulatory requirements, and state and communityacceptance. This section is based on the results of the NewYork site demonstration and additional informationprovided by ETI and other sources.
3.1 Factors Affecting Performance
Factors potentially affecting the performance of the metal-enhanced dechlorination process include feed wastecharacteristics, site hydrogeology and maintenancerequirements.
3.7. I Feed Waste Characteristics
Feed waste characteristics that may affect the performanceof the metal-enhanced dechlorination technology includethe types and concentrations of organic and inorganicsubstances present in the groundwater to be treated, andgeochemical parameters such as pH and possiblytemperature.
Organic Compounds
According to ETI, the metal-enhanced dechlorinationtechnology has successfully degraded many halogenatedVOCs. These compounds are PCE; TCE; cDCE; tDCE,1,l -dichloroethene; VC; TCA; trichloromethane; 1,2-dibromoethane; 1,2,3-trichloropropane; 1,2-dichloropropane; 1,1-dichloroethane and Freon 113.Although the degradation of compounds such aschloromethane, dichloromethane, 1 ,Zdichloroethane,and 1,6dichlorobenzene is thermodynamically favorable,these compounds have either not been observed to degrade
in the presence of iron or have not been studied in detail(Gillham 1996; Focht, Vogan and O’Hannesin 1996).
The performance of the metal-enhanced dechlorinationtechnology is typically evaluated based on the half-lives ofthe compounds that it dechlorinates. The half-life isdefined as the time required to degrade a compound to one-half of its original concentration in the medium beingtreated. The half-lives of the different VOCs varydepending on concentration and other site-specific factors.Half-lives using treatment by the metal-enhanceddechlorination process generally appear to be less thanthose reported for biological and other natural subsurfaceabiological processes (Gillham 1996).
Although the reported half-lives for a particular compoundwill vary, half-lives generally tend to increase withdecreasing degrees of chlorination. This is particularlyevident when considering a single group of compounds,such as chlorinated ethenes. PCE and TCE degrade atreasonably similar rates; the rate is lower for DCE, andlower yet for VC. This trend is consistent with reductivedechlorination, since the most highly chlorinatedcompounds are the most oxidized and would be expectedto be the least stable under reducing conditions (Gillhamand O’Hannesin 1994; Gillham 1996).
Although many chlorinated VOCs can be degraded in thepresence of iron, further studies are required for many ofthe VOCs to evaluate the occurrence of toxic andpersistent degradation products. In addition, thedegradation products generally degrade at much lowerrates than the parent compound (ETI 1994; Focht, Voganand O’Hannesin 1996). Therefore, even though they occurat much lower concentrations, degradation products maybe more critical than parent compounds with regard todetermining the required residence time in the design ofmetal-enhanced dechlorination technology systems.
47

Inorganic Compounds
Recent research has indicated that hexavalent chromiummay be reduced by reactive iron. At a recent installationinvolving a chlorinated VOC plume that also containedhexavalent chromium, ET1 observed that total chromiumwas nondetectable downgradient from the system. Paststudies by others have also indicated the iron’s potential toreduce hexavalent chromium (Puls, Powell and Paul1995). However, this potential application of thetechnology has not been tested extensively.
The effect of inorganic compounds on the VOCdegradation process may represent the greatest uncertaintywith respect to the long-term, low-maintenance operationof the in-situ metal-enhanced dechlorination technology.At the elevated pH levels induced by the dechlorinationreaction, the Fe2+ produced by the oxidation of the zerovalent iron may precipitate as Fe(OH),, depending on theDO concentration and provided that Eh is sufficiently low.Iron may also precipitate as FeCO,, depending on thecarbonate concentration of the influent groundwater.Carbonate precipitates of calcium, magnesium, barium,and other metals may also form, particularly in the portionof the iron along the upgradient face of the wall.
Excessive buildup of metal precipitates may limit the flowof groundwater through the treatment system. It is alsopossible that precipitates may block the iron surfacesavailable for reaction causing a reduction in the iron’sreactive capacity over time, or decrease the dechlorinationreaction rate. Based on the results of the New Yorkdemonstration, ETI estimates that formation anddeposition of metal precipitates during treatment couldcause about 4 to 7.5 percent of the original porosity in theiron to be lost annually @II 1996a). However, the amountof porosity loss is site specific; ET1 reports projectedporosity losses ranging from 2 to 15 percent per year instudies involving water from other sites. Theextrapolation of these estimates to field-scale systemsdepend on the kinetics of precipitation under fieldconditions (Fochf Vogan, and O’Hannesin 1996).
Site- and waste-specific treatability studies are required toidentify potential precipitates and the rates at which theymay form; possible effects on the reductive dechlorinationrate and system hydraulics; and factors that may controlprecipitate formation. O&M procedures may need tocompensate for the formation of precipitates duringtreatment of highly mineralized water. Before proceeding
48
with a full-scale remediation, it may be necessary todevelop operating methods to prevent precipitateformation or maintenance techniques to periodicallyremove precipitates once they form.
3.1.2 Hydrogeologic Characteristics
Site hydrogeology significantly affects the performance ofthe in-situ metal-enhanced dechlorination technology bycontrolling 1) the implementability of the technology; 2)selection of the type of system (continuous wall or funneland gate); and 3) design parameters for the reactive ironwall.
The technology’s implementability is affected by thedepth to and saturated thickness of the aquifer. Manychlorinated VOCs tend to sink when released in free phaseto an aquifer, often causing dissolved-phase contaminantsto be more concentrated in deeper portions of the aquifer.For this reason, the technology is most effective when itcan be installed to completely intercept flow over theentire saturated thickness of the aquifer. If possible, thebase of the iron wall should be keyed into an underlyingaquiclude to prevent untreated water from flowing beneaththe wall. As in any technology that requires trenchingactivities, the technology is more easily implemented atshallower depths (less than 50 feet). Also, if possible, thetop of the wall should be high enough to prevent seasonalfluctuations in the water table from causing untreatedwater to flow over the wall. However, extension of theiron above the seasonal high water table may not bepractical for extremely shallow aquifers, as it is preferableto keep the top of the iron within the saturated zone toprevent exposure to air and excessive oxidation. ETIcurrently designs systems to cover as much of the verticalextent of the saturated zone as possible while still allowingabout 3 feet above the iron for a dense soil cover to preventexcessive “rusting.”
For these reasons, shallow unconsolidated aquifersoverlying dense clay or tight bedrock at depths less than 50feet are more ideally suited for this technology thanbedrock aquifers or deep aquifers in general. However,methods to facilitate deeper applications of thistechnology are currently being studied and at least onedeep installation (greater than 100 feet deep) was plannedfor design at the time of this report (Appleton 1996).

3.1.3 Operating Parameters
Based on information provided by the developer, severaloperating parameters that may affect system performancewere identified. These parameters include (1) iron surfacearea-to-groundwater volume ratio, (2) PI-I, (3) residencetime, and (4) temperature ofthe reactor and influent water.
Ratio of Iron Surface Area to Groundwater(Solution) Volume
A precise quantitative correlation between the iron surfacearea-to-water volume ratio on the dechlorination reactionrate has not been established. Experimental resultsindicate that the rate of dechlorination increases as theratio of iron surface area-to-groundwater volumeincreases. For this reason increasing the iron surface areain contact with the water at any given time should increasethe dechlorination reaction rate, provided all other factorsremain constant (Gillham and O’Hannesin 1994; Gillham1996). Based on this rationale, it appears that reductions inthe amount of iron surface area, possibly caused byprecipitates forming a coating on the reactive irongranules, could increase contaminant half-lives.
PH
As previously discussed, the reactions which accompanythe dechlorination process cause pH to increase as waterdissociates to form H, gas and hydrogen ions substitute forchlorine atoms. This observation suggests that unusuallyhigh or low influent pH in the influent groundwater mayaffect the dechlorination reaction. However, the effects ofvarying pH, and other geochemcial parameters (such asDO and Eh) in the influent groundwater were notevaluated in detail during the SITE demonstration, asinfluent groundwater pH was relatively constantthroughout the demonstration period.
49
Residence Time
Residence time is the time required for a “particle” ofgroundwater to flow through a reactive iron treatment wallin an in-situ installation, or through the iron layer in anaboveground reactor. For any particular application, theresidence time of groundwater in the treatment mediummust be sufficient to reduce influent concentrations ofVOCs and potential dechlorination by-products to cleanupstandards.
To treat groundwater containing several chlorinatedVOCs having the potential to form multiple dechlorinationby-products, the total required residence time is calculatedas the sum of the estimated residence times required fordechlorination of the compounds that have the longesthalf-lives. For example, the design of the m-situ wall atthe New York site was based on maximum projected half-lives of about 0.2 hour for TCE, 3.7 hours for cDCE, and1.2 hours for VC. ET1 estimated a required residence timeof about 55 hours for the pilot-scale system, assuming thatcDCE would require the longest residence time of any ofthe compounds (37 hours), due to the greater amount ofcDCE relative to the amount of iron to be used in thesystem. ET1 conservatively assumed that no VCdechlorination would occur until cDCE dechlorinationwas complete. The bench-scale studies indicated that theother compounds suspected to be present (PCE, tDCE, andTCA) would dechlorinate simultaneously with the othercompounds, not requiring additional residence time (ET11994).
In an in-situ system, residence time is controlled by thegroundwater flow velocity and the thickness of thereactive iron wall. The appropriate thickness isdetermined by dividing the required residence time by thegroundwater flow velocity (the natural flow velocity forcontinuous walls, or an accelerated velocity projected fora proposed funnel and gate system). The wall must bethick enough to allow adequate time for chlorinated VOCsto be reduced from influent concentrations to theapplicable water quality criteria, and must also allowsufficient time for dechlorination of any by-products. Thethickness of the wall should also incorporate acontingency factor to allow for seasonal fluctuations inflow velocity. For some applications, extra width mayalso be appropriate to allow for decreases in theperformance of the upgradient portion of the iron due toprecipitate formation over time.
In an aboveground reactor, water typically flows verticallythrough a reactive iron bed by gravity. The residence time(volume of pore space in the reactive iron layer divided byvolumetric flow rate) is controlled by the hydraulic head(which can be controlled by the influent pumping rate);pore volume, hydraulic conductivity, and thickness of thereactive iron layer; and the configuration of the effluentpiping. The results of a previous SITE demonstration of anaboveground application of this technology suggested thatthe same general design criteria apply as for in-situsystems; that is, the iron layer must be sufficiently thick to

allow adequate residence time for dechlorination of parentcompounds and potential dechlorination by-products.
Temperature
According to ETI, laboratory testing has indicated thattemperature affects the reaction rate for the dechlorinationof TCE, and presumably would affect reaction rates forother compounds as well (ETI 1996a). Data gathered at aprevious SITE Program demonstration of an abovegroundsystem indicated that a gradual decline in reactortemperature and the temperature of groundwater in thereactor coincided with an apparent increase in the length oftime chlorinated VOCs persisted in the reactive iron bed.However, data were insufficient to differentiate possibletemperature effects from other factors that may haveaffected system performance (EPA 1997).
During the New York demonstration, data indicated agradual lowering of groundwater temperature in the last 2months ofthe demonstration. Unlike the demonstration ofthe aboveground reactor, there was no measurableincrease in the length of time required for TCEdechlorination coincident with the temperature decline.However, because TCE was generally below detectablelevels in the samples from the wells screened in the iron,the length of time actually required for TCEdechlorination to occur is unknown. For this reason, it ispossible that slight decreases in the TCE dechlorinationreaction rate occurred during the New York demonstration,but were not detectable.
In general, in-situ remediation systems tend to be lesssusceptible to temperature fluctuations than abovegroundsystems. However, typical groundwater temperatures areusually less than the ambient temperatures at whichlaboratory treatability studies are performed. Forextremely shallow aquifers, groundwater temperaturemay fluctuate significantly, particularly in climates thatexperience extreme ranges in seasonal temperature andprecipitation. If temperature does affect the reaction rate,colder temperatures could increase the required residencetime. For these reasons, seasonal groundwatertemperature should be considered in the system design;design allowances (extra width) may be necessary ifpreconstruction studies indicate a potential for temperaturedecrease to affect the dechlorination reaction rates.
3.1.4 Maintenance Requirements
The maintenance requirements for the in-situ metal-enhanced dechlorination system summarized in thissection are based on observations of the pilot-scale systemused during the SITE demonstration; assumptions basedon the analytical data; results of previous applications ofthe technology; and discussions with ETI personnel.
Metals precipitating from groundwater may accumulateand physically block the pore spaces on the influent side ofthe reactive iron medium, reducing flow. Also, metalprecipitates may coat the reactive iron surface, reducingthe surface area available for contact with contaminatedgroundwater. Precipitate formation will vary dependingon a number of site-specific factors. According to ETI,precipitates tend to concentrate in the first few inches onthe influent side of the reactive iron. However, becauserelatively few in-situ systems have been operating formore than 2 years (at the time of this report), knowledge oflong-term trends in and effects of precipitate formation isprimarily based on extrapolations from bench scalestudies or short-term observations from recent fieldapplications.
Maintenance procedures to counteract the effects ofprecipitate formation for in-situ systems have not beenextensively tested in the field; however, ET1 is currentlystudying methods of in-situ chemical or physicaltreatment of the iron to remove precipitates. Possiblechemical methods considered include dissolvingprecipitates by introducing mild acids upgradient from thewall; however, this technique currently does not appearfeasible for most situations as the acid would also probablyreact with the iron and cause excessive corrosion. Physicaltechniques include scarifying or agitating the upgradientside of the iron wall. ETI has suggested the use of soilaugers or mixing equipment at the interface between thenatural aquifer materials (or pea gravel, if present) and theinfluent side of the iron to accomplish this task. However,this technique has not yet been attempted at existing in-situinstallations and is untested under actual field conditionsat the time of this report. ET1 estimates that some form ofmaintenance to remove precipitates may typically berequired every 5 to 10 years (Focht, Vogan, andO’Hannesin 1996).
If maintenance techniques are not successful, periodicreplacement of the iron may be necessary for long-term(greater than 10 year) remedial programs. For some
50

applications, it also may be possible to allow a sufficientthickness contingency in the reactive iron wall tocompensate for reactivity losses caused by reductions inthe available reactive iron surface area. However, thiswould not necessarily alleviate problems associated withsignificant reduction of the iron’s hydraulic conductivity.
Biological growth in the reactive iron did not appear to bea significant problem during the New York in-situdemonstration (PRC 1997). Long term performance datafor in-situ systems under a wide range of conditions arelimited; therefore, potential operating problems caused bylong-term biological growth have not been studiedextensively.
3.2 Site Characteristics and SupportRequirements
Site-specific factors can impact the application of the in-situ metal-enhanced dechlorination process, and thesefactors should be considered before selecting thetechnology for remediation of a specific site. Site-specificfactors addressed in this section are site access, area, andpreparation requirements; climate; utility and supplyrequirements; support systems; and personnel requirements.
According to ETI, both in-situ treatment wall installationsand aboveground treatment reactors are available (seeSection 5, Technology Status, and Appendix A, Vendor’sClaims for the Technology). The support requirements ofthese systems vary. This section presents supportrequirements based on the information collected for the in-situ treatment system used at the New York demonstrationsite.
3.2.1 Site Access, Area, and PreparationRequirements
In addition to the hydrogeologic conditions that determinethe technology’s applicability and design, other sitecharacteristics affect implementation of this technology.The actual amount of space required for an in-situ systemdepends on the required thickness and length of thereactive iron wall, and whether a continuous wall or funneland gate system are used. For the New Yorkdemonstration, the gate section comprised an area about12 feet by6.5 feet (including the 3-foot-thick iron wall andthe adjacent pea gravel sections) in plan. In addition, theend sections comprising the funnel extended the length ofthe system by 15 feet on each end. According to ETI, the
51
system captured a 24-foot-wide portion of the 3OO-foot-wide plume. A full-scale funnel and gate system wouldtypically consist of several interspersed funnels and gatesor a continuous iron wall across the entire width of theplume. A system employing a continuous wall wouldprobably not be as thick as it would not employ flankingsections of pea gravel; for example, ETI estimates that a l-foot-thick wall may be adequate to treat groundwaterunder the general conditions observed at the New Yorksite. (According to ETI, the effects ofanisotropic flow areless critical for continuous walls than for funnel am-l gatesystems because the continuous walls are not expected toaccelerate groundwater flow velocity.) In either case, thelength of the system will depend on the size of thecontaminant plume. Sufficient space must also beavailable for monitoring wells upgradient and downgradientfrom the system.
The site must be accessible to and have sufficientoperating and storage space for heavy constructionequipment. Excavating equipment is necessary to preparea subsurface trench. For funnel and gate systems, a craneequipped with a pile driver is necessary to install sheetpiling and to subsequently remove the sheet piling fromthe upgradient and downgradient sides ofthe gate. Accessfor tractor trailers (for delivery of iron, constructionsupplies, and equipment) is preferable. A front-end loadermay be needed to place the iron in the trench. Access fora drill rig to install the wells for system performancemonitoring will be required, unless the wells areconstructed as integral parts of a treatment “cell.”Underground utilities crossing the path of the proposedsystem may need to be relocated if present, and overheadspace should be clear of utility lines, to allow cranes anddrill rigs to operate. The wall may need to be constructedaround existing surface structures that are on site.
Soils excavated at sites contaminated with chlorinatedVOCs may require management as a potentially hazardouswaste. For this reason, roll-off boxes to hold tbe soil, andsufficient space near, but outside oftbe construction areafor staging the boxes should be available. Hn addition, aportable tank or tanker truck should also be available forfunnel and gate installations to temporarily hold waterremoved from the trench.
3.2.2 Climate Requke
Because the in-situ metal-enhanced dechlorinationprocess is completely below grade and usually requires noaboveground piping or utilities, the system does not

appear to be significantly affected by ambient weatherconditions. For this reason, the system can be installed andoperated in virtually any climatologic zone. However,variations in groundwater temperature may need to beconsidered in the system design (see Section 3.1.3.)
3.2.3 Utility and Supply Requirements
Existing on site sources of power and water may facilitate,but are not required, for construction activities. After theinitial construction phase, the in-situ funnel and gatesystem at the New York site required no electrical poweror other utility support.
Supply requirements specific to the technology mayinclude fresh iron medium to replace iron that has lost anunacceptable amount of its reactive capacity. Thefrequency at which iron may need to be replaced is highlysite-specific (see Section 3.1.4). Other supplies indirectlyrelated to the technology include typical groundwatersampling supplies that will be used for system monitoring.
3.2.4 Required SupporC Systems
No pretreatment of groundwater is necessary for in-situsystems. As discussed in Section 1.3, potential users ofthis technology must consider the possibility that thedechlorination of some multi-chlorinated compoundssuch as PCE and TCE may generate by-products such ascDCE and VC. Properly designed systems allowsufficient residence time to dechlorinate these compounds;however, in-situ system designs may need to allow foradditional posttreatment “polishing” of system effluent inthe event that byproducts such as cDCE and VC persist. Insuch cases, contingent systems such as air sparging/soilvapor extraction (SVE) combined with carbon adsorptionof the effluent vapors may be appropriate.
S&W initially installed two PVC air sparging wells in thedowngradient pea gravel zone, as a contingency so that anair sparging/SVE system could be rapidly constructed inthe event that persistent dechlorination by-products suchas cDCE or VC were detected downgradient from the wall.However, the in-situ system appeared to consistentlyreduce concentrations of all critical parameters andpotential by-products during the demonstration period.For this reason, posttreatment was not implementedduring the demonstration.
3.2.5 Personnel Requirements
Personnel requirements for the system are minimal. Sitepersonnel must collect periodic samples to evaluatesystem performance. Also, personnel should periodicallyinspect the system for general operating condition.Personnel should check water levels in the monitoringwells and piezometers to ensure continuing flow throughthe wall, and inspect the condition of the wells andpiezometers. Personnel should also inspect the conditionof the ground surface above the system and identify anyindications of potential problems, such as severesubsidence or erosion. If possible, representative coresamples should be periodically obtained to evaluateprecipitate formation. If support systems (such as airsparging/SVE) are used, additional on-site personnel maybe required.
Personnel requirements for long-term maintenance willdepend on the type of maintenance activities. If soilmixing, drilling, iron replacement, or other activitiesrequiring specialized heavy equipment will be performed,trained equipment operators will be required.
Personnel working with the system at a hazardous wastesite should have completed the training requirementsunder the Occupational Safety and Health Act (OSHA)outlined in 29 CFR $19 10.120, which covers hazardouswaste operations and emergency response. Personnel alsoshould participate in a medical monitoring program asspecified under OSHA.
3.3 Material Handling Requirements
Material handling requirements for the in-situ metal-enhanced dechlorination technology include those for thesoil and water removed from the excavation, the reactiveiron medium, and the pea gravel or well-sand used in theconstruction of the system. Groundwater removed bytrench dewatering will probably contain chlorinatedVOCs. Also, soils excavated from below the water table inthe vicinity of a chlorinated VOC plume may have becomecontaminated by contact with contaminated groundwater.For this reason, soil and water generated by constructionactivities may require handling, storage, and managementas hazardous wastes. Precautions may include availabilityof lined, covered, roll-off boxes, drums, or otherreceptacles for the soil; solvent-resistant storage tanks forthe water; and appropriate personal protective equipment(PPE) for handling materials containing chlorinated
52

VOCs. Soils from the vadose zone should be stockpiled onsite separately from soils excavated from below the watertable, to minimize the amount of material requiringmanagement as potentially hazardous waste.
Precautions required for the handling of the iron and peagravel include those normally employed for nuisancedusts, including the use of respiratory protection.
3.4 Technology Limitations
The in-situ metal-enhanced dechlorination technology islimited by the ability of the reactive iron to treatwastestreams containing only certain chlorinated VOCs,which limits the number of sites for which the technologymay be ideally suited. Sites involving multiple types ofgroundwater contaminants may not be ideally suited forthis technology.
Although recent studies by ETI and others have indicatedthat other contaminants (for example, hexavalentchromium, uranium and some other metals; somebrominated compounds; and some pesticides) may bereduced by the technology, the reactive iron either cannotreduce, or has not yet been extensively shown to reduce,nonchlorinated organic compounds, some chlorinatedVOCs (such as chloromethane, dichloromethane, 1,2-dichloroethane, and 1,4-dichlorobenzene); some metals,and other chlorinated organic compounds such aschlorinated phenols and most pesticides (ETI 1997; Focht,Vogan, and O’Hannesin 1996). Aboveground systems orother, conventional ex-situ technologies can often bemodified by adding modular, in-line pretreatment orposttreatment components to treat multiple types ofcontaminants. However, auxiliary treatment systems thatare technically adaptable to the in-situ metal-enhanceddechlorination process appear to be limited to conventionalin-situ technologies associated with VOC removal, suchas air sparging and WE.
The second limitation concerns the reactive ironmedium’s usable life before its reactivity or hydraulicconductivity are significantly reduced by the formation ofmetal precipitates. Information regarding the useful lifeof the iron is limited because no long-term (exceeding 5years) performance data are currently available. Asdiscussed in Section 1.3, the driving force of thedechlorination reaction is the corrosion of iron, or theconversion of Fe” to Fe*+. According to ETI, the measuredcorrosion rate of iron indicates that iron will persist for
several years to decades, depending on the concentrationof VOCs in the groundwater and the flow rate through theiron (Focht, Vogan, and O’Hannesin 1996). However,deposition of metal precipitates on the reactive ironmedium may adversely affect system hydraulics or blockthe reactive surface area of the iron particles. AlthoughET1 is researching maintenance techniques to counteractthese effects, the proposed techniques are unproven underrepresentative full-scale field conditions at the time of thisreport.
During the New York demonstration, no decline in thesystem’s ability to dechlorinate the target compounds wasnoted, although the inorganic data and geochemicalparameters suggested that metal precipitates were formingin the iron. However, in a previous SITE Programdemonstration of an aboveground application of themetal-enhanced dechlorination technology, “parent”chlorinated VOCs were observed to persist longer as thedemonstration progressed. This effect was accompaniedby the appearance of low concentrations of dechlorinationby-products (cDCE and VC) in the effluent. Althoughother factors may have contributed to the decline inperformance, geochemical data indicated that metalprecipitates were forming, and subsequent studiesperformed by ETI confirmed that a hard precipitate layerhad formed in the upper (influent) portion of the reactiveiron bed (EPA 1997).
A third limitation of the technology is that passive systemsdo not necessarily remove the contaminant source.Although the system may be able to treat all of thecontaminated groundwater migrating from a site,contaminant sources upgradient from the system (such assubsurface soils) may continue to release chlorinatedVOCs to groundwater until an aggressive remediationscheme, such as removal, is enacted. For this reason, toachieve overall permanent remediation of a site, thetechnology may be most successful if implemented inconjunction with additional source reduction activities.
The fourth limitation pertains to the practicality ofimplementing the technology at some sites. As for mostfully penetrating, in-situ containment/treatment systems,the need for intrusive construction activities requiressignificant amounts of open surface space, possiblyprecluding use of this technology at some sites. Also, thelimitations of trench construction technologies tend tomake fully penetrating systems best-suited for installationsshallower than 50 feet, and often less for some soil types.
53

ETI has successfully used continuous excavation/backfilltechnology to install reactive iron walls, eliminating manyof the time requirements, construction costs, and safetyconcerns associated with conventional trenching activities,and future applications may test the use of deep boringsand hydraulic fracturing to install systems at greaterdepths (Appleton 1996). However, ETI’s deepest existingin-situ system is about 40 feet deep. Also, the technologymay be less effective in aquifers lacking a suitableunderlying aquitard (for keying the base of the iron wall).
3.5 Potential Regubtory Requirements
This section discusses regulatory requirements pertinentto using the in-situ metal-enhanced dechlorination processat Superfund, Resource Conservation and Recovery(RCRA) corrective action, and other cleanup sites. Theregulations pertaining to applications of this technologydepend on site-specific conditions; therefore, this sectionpresents a general overview of the types of federalregulations that may apply under various conditions. Stateand local requirements should also be considered.Because these requirements will vary, they are notpresented in detail in this section. Table 3- 1 summarizesthe environmental laws and associated regulationsdiscussed in this section.
During the SITE demonstration of the in-situ metal-enhanced dechlorination process no groundwater waspumped from the affected aquifer to above the groundsurface. Therefore, many state and federal regulationsapplicable to the pumping, treatment, and disposal ordischarge of contaminated groundwater were not relevantto this particular application, nor would they be relevantwhen this technology is used in similar fashion at othersites. If required, auxiliary posttreatment processes willlikely involve additional regulatory requirements thatwould need to be addressed. This section focuses onregulations applicable to the in-situ metal-enhanceddechlorination technology, and briefly discusses regulationsthat may apply if posttreatment is required.
3.5. I Comprehensive EnvironmentalResponse, Compensation, andLiability Act
The Comprehensive Environmental Response,Compensation, and Liability Act (CERCLA), as amended
by SARA, authorizes the federal government to respond toreleases of hazardous substances, pollutants, orcontaminants that may present an imminent andsubstantial danger to public health or welfare. CERCLApertains to the metal-enhanced dechlorination system bygoverning the selection and application of remedialtechnologies at Super-fund sites. Remedial alternativesthat significantly reduce the volume, toxicity, or mobilityof hazardous substances and provide long-term protectionare preferred. Selected remedies must also be cost-effective, protective of human health and the environment,and must comply with environmental regulations toprotect human health and the environment during and afterremediation.
CERCLA requires identification and consideration ofenvironmental requirements that are ARARs for siteremediation before implementation of a remedialtechnology at a Superfund site. Subject to specificconditions, EPA allows ARARs to be waived inaccordance with Section 12 1 of CERCLA. The conditionsunder which an ARAR may be waived are (1) an activitythat does not achieve compliance with an ARAR, but ispart of a total remedial action that will achieve compliance(such as a removal action), (2) an equivalent standard ofperformance can be achieved without complying with anARAR, (3) compliance with an ARAR will result in agreater risk to health and the environment than willnoncompliance, (4) compliance with an ARAR istechnically impracticable, (5) a state ARAR that has notbeen applied consistently, and (6) for fund-lead remedialactions, compliance with the ARAR will result inexpenditures that are not justifiable in terms of protectingpublic health or welfare, given the needs for funds at othersites. The justification for a waiver must be clearlydemonstrated (EPA 1988a). Off-site remediations are noteligible for ARAR waivers, and all applicable substantiveand administrative requirements must be met. Dependingon a particular application, posttreatment (secondarytreatment) such as air sparging/SVE may be used inconjunction with the in-situ metal-enhanced dechlorinationtechnology, requiring air emissions and effluent dischargeeither on or off site. CERCLA requires on-site dischargesto meet all substantive state and federal ARARs, such aseffluent standards. Off-site discharges must comply notonly with substantive ARARs, but also state and federaladministrative ARARs, such as permitting, designed tofacilitate implementation of the substantive requirements.
54

Table 3-1. Summary of Environmental Regulations
Act/Authority Applicability Application to the In-Situ Metal-Enhanced CitationDechlorination Technology
CERCLA Cleanups atSuperfund sites
RCRA
CWA
SDWA
C/-Vi
Cleanups atSuperfund andRCRA sites
Discharges tosurface waterbodies
Water discharges,water reinjection,and sole-sourceaquifer andwellhead
This program authorizes and regulates the 40 CFR part 300cleanup of releases of hazardoussubstances. It applies to all CERCLA sitecleanups and requires that otherenvironmental laws be considered asappropriate to protect human health and theenvironment.
RCRA regulates the transportation, 40 CFR parts 260 totreatment, storage, and disposal of 270hazardous wastes. RCRA also regulatescorrective actions at treatment, storage, anddisposal facilities.
NPDES requirements of CWA apply to both 40 CFR parts 122 toSuperfund and RCRA sites where treated 125, part 403water is discharged to surface water bodies.Pretreatment standards apply to dischargesto POlWs. These regulations do nottypically apply to in-situ technologies.
Maximum contaminant levels and 40 CFR parts 141 tocontaminant level goals should be 149considered when setting water cleanuplevels at RCRA corrective action andSuperfund sites. Sole sources andprotected wellhead water sources would besubject to their respective control programs.
Air emissions from If VOC emissions occur or hazardous airstationary and pollutants are of concern, these standardsmobile sources may be applicable to ensure that use of this
technology does not degrade air quality.State air program requirements also shouldbe considered.
AEA and RCRA Mixed wastes AEA and RCRA requirements apply to thetreatment, storage, and disposal of mixedwaste containing both hazardous andradioactive components. OSWER and DOEdirectives provide guidance for addressingmixed waste.
OSHA All remedialactions
OSHA regulates on-site constructionactivities and the health and safety ofworkers at hazardous waste sites.Installation and operation of the metal-enhanced dechlorination process atSuperfund or RCRA cleanup sites mustmeet OSHA requirements.
NRC All remedialactions
These regulations include radiationprotection standards for NRC-licensedactivities.
40 CFR parts 50,60,61, and 70
AEA (10 CFR part60) and RCRA (seeabove)
29 CFR parts 1900to 1926
IO CFR part 20
55

3.5.2 Resource Conservation andRecovery Act
RCR4, as amended by the Hazardous and Solid WasteAmendments of 1984, regulates management and disposalof municipal and industrial solid wastes. EPA and thestates implement and enforce RCRA and state regulations.Some of the RCRA Subtitle C (hazardous waste)requirements under 40 CFR parts 264 and 265 may applyat CERCLA sites because remedial actions generallyinvolve treatment, storage, or disposal ofhazardous waste.However, RCRA requirements may be waived forCERCLA remediation sites, provided equivalent or morestringent ARARs are followed.
Use of the in-situ metal-enhanced dechlorinationtechnology may constitute “treatment” as defined underRCRA regulations in Title 40 of the Code of FederalRegulations (40 CFR) 260.10. Because treatment of ahazardous waste usually requires a permit under RCRA,permitting requirements may apply if the technology isused to treat a listed or characteristic hazardous waste.Regulations in 40 CFR part 264, subpart X, which regulatehazardous waste storage, treatment, and disposal inmiscellaneous units, may be relevant to the metal-enhanced dechlorination process. Subpart X requires thatin order to obtain a permit for treatment in miscellaneousunits, an environmental assessment must be conducted todemonstrate that the unit is designed, operated, and closedin a manner that protects human health and theenvironment. Requirements in 40 CFR part 265, subpart Q(Chemical, Physical, and Biological Treatment), couldalso apply. Subpart Q includes requirements for wasteanalysis and trial tests. RCRA also contains specialstandards for ignitable or reactive wastes, incompatiblewastes, and special categories of waste (40 CFR parts 264and 265, subpart B). These standards may apply to the in-situ metal-enhanced dechlorination technology, dependingon the waste to be treated.
In the event the in-situ metal-enhanced dechlorinationtechnology is used to treat contaminated liquids athazardous waste treatment, storage, and disposal facilitiesas part of RCRA corrective actions, regulations in 40 CFRpart 264, subparts F and S may apply. These regulationsinclude requirements for initiating and conducting RCRAcorrective actions, remediating groundwater, and operatingcorrective action management units and temporary unitsassociated with remediation operations. In statesauthorized to implement RCRA, additional state
regulations more stringent or broader in scope than federalrequirements must also be addressed.
Most RCRA regulations affecting conventional treatmenttechnologies will not apply to the in-situ metal-enhanceddechlorination technology because once installed,properly designed and maintained systems generate noresidual waste. However, during installation activities, theexcavation of a trench and removal of soil from thesaturated zone is required. Many chlorinated solvents areRCRA “F-listed” wastes; therefore, at sites wheregroundwater is contaminated with these compounds, soilsremoved from the saturated zone may also contain F-listedcontaminants and be classified as hazardous waste. If so,these soils will require management, including storage,shipment, and disposal, following RCRA guidelines.Active industrial facilities generating hazardous waste arerequired to have designated hazardous waste storageareas, and most operate under go-day storage permits. Afacility’s storage area could be used as a temporary storagearea for contaminated soils generated during theinstallation of the in-situ metal-enhanced dechlorinationtechnology. For nonactive facilities, or those notgenerating hazardous waste (as in the case ofthe site wherethe New York demonstration occurred), a temporarystorage area should be constructed on site followingRCRA guidelines, and a temporary hazardous wastegenerator identification number should be obtained fromthe regional EPA office. Guidelines for hazardous wastestorage are listed under 40 CFR parts 264 and 265. Also,water removed from the excavation may requiremanagement as a hazardous waste. Tank storage of liquidhazardous waste must meet the requirements of 40 CFRpart 264 or 265, subpart J.
The reactive iron may require occasional physical orchemical treatment to remove entrapped solids orprecipitates from the reactive iron medium. Portions ofthe influent side of the reactive iron may be periodicallyreplaced. For in-situ systems, methods for treating orreplacing the iron are still under evaluation at the time ofthis report, and therefore the exact methods that will beused are unknown at this time. If these actions occur,removed water, soil, or reactive iron may be RCRAhazardous wastes, and RCRA requirements for hazardouswaste disposal (see 40 CFR parts 264 and 265) may apply.However, iron removed from the aboveground reactorduring a previous SITE Program demonstration in NewJersey was tested for residual contamination. The iron wasdetermined to be nonhazardous and did not require
56

management as a RCRA hazardous waste, and wassubsequently sold as scrap metal.
Although not typically required, if secondary treatment isused in conjunction with the in-situ metal-enhanceddechlorination process, additional RCRA regulations mayapply. If secondary treatment involves extraction andtreatment of groundwater, and the groundwater isclassified as hazardous waste, the treated groundwatermust meet treatment standards under land disposalrestrictions (LDR) (40 CFR part 268) before reinjection orplacement on the land (for example, in a surfaceimpoundment).
RCRA parts 264 and 265, subparts AA, BB, and CCaddress air emissions from hazardous waste treatment,storage, and disposal facilities. These regulations wouldprobably not apply directly to the in-situ metal-enhanceddechlorination technology, but may apply to the overallprocess if it incorporates secondary treatment, such as airsparging/SVE. Subpart AA regulations apply to organicemissions from process vents on certain types ofhazardous waste treatment units. Subpart BB regulationsapply to fugitive emissions (equipment leaks) fromhazardous waste treatment, storage, and disposal facilitiesthat treat waste containing organic concentrations of atleast 10 percent by weight. Many organic air emissionsfrom hazardous waste tank systems, surface impoundments,or containers will eventually be subject to the air emissionregulations in 40 CFR parts 264 and 265, subpart CC.Presently, EPA is deferring application of the Subpart CCstandards to waste management units used solely to treator store hazardous waste generated on site from remedialactivities required under RCRA corrective action orCERCLA response authorities (or similar state remediationauthorities). Therefore, Subpart CC regulations may notimmediately impact implementation of the in-situ metal-enhanced dechlorination technology or associatedsecondary treatment technologies used in remedialapplications. EPA may remove this deferral in the future.
3.5.3 CIean Water Act
The Clean Water Act (CWA) governs discharge ofpollutants to navigable surface water bodies or publicly-owned treatment works (POTW) by providing for theestablishment of federal, state, and local dischargestandards. Because the in-situ metal-enhanceddechlorination technology does not normally result inextraction and discharge of contaminated groundwater to
surface water bodies or POTWs, the CWA would nottypically apply to the normal operation and use of thistechnology.
3.5.4 Safe Drinking Water Act
The Safe Drinking Water Act (SDWA), as amended in1986, required EPA to establish regulations to protecthuman health from contaminants in drinking water. EPAhas developed the following programs to achieve thisobjective: (1) a drinking water standards program, (2) anunderground injection control program, and (3) sole-source aquifer and wellhead protection programs.
SDWA primary (health-based) and secondary (aesthetic)MCLs generally apply as cleanup standards for water thatis, or may be, used as drinking water. In some cases, suchas when multiple contaminants are present, more stringentMCL goals may be appropriate. During the SITEdemonstration, the in-situ metal-enhanced dechlorinationprocess’s performance was evaluated to determine itscompliance with SDWA MCLs and NYSDEC standardsfor several critical VOCs. The results indicated thateffluent concentrations met MCLs during all months oftesting after system performance stabilized; four out of 90critical parameter measurements slightly exceededNYSDEC limits in the same period.
Water discharge through injection wells is regulated by theunderground injection control program. The technologydoes not require extraction and reinjection of groundwater;therefore, regulations governing underground injectionprograms would not typically apply to this technology.
The sole-source aquifer and wellhead protection programsare designed to protect specific drinking water supplysources. If such a source is to be remediated using the in-situ metal-enhanced dechlorination technology, appropriateprogram officials should be notified, and any potentialregulatory requirements should be identified. Stategroundwater antidegradation requirements and waterquality standards (WQS) may also apply.
3.5.5 CIean Air Act
The Clean Air Act (CAA), as amended in 1990, regulatesstationary and mobile sources of air emissions. CAAregulations are generally implemented through combinedfederal, state, and local programs. The CAA includespollutant-specific standards for major stationary sources
57

that would not be AMRs for the in-situ metal-enhanceddechlorination process, and would apply only if auxiliarytreatment (such as air sparging/SVE) were employed.State and local air programs have been delegatedsignificant air quality regulatory responsibilities, andsome have developed programs to regulate toxic airpollutants (EPA 1989). Therefore, state air programsshould be consulted regarding secondary treatment if usedin conjunction with this technology.
3.56 Mixed Waste Regulations
Use of the in-situ metal-enhanced dechlorinationtechnology at sites with radioactive contamination mightinvolve treatment of mixed waste. As defined by theAtomic Energy Act (AEA) and RCRA, mixed wastecontains both radioactive and hazardous waste components.Such waste is subject to the requirements of both acts.However, when application of both AEA and RCRAregulations results in a situation that is inconsistent withthe AEA (for example, an increased likelihood ofradioactive exposure), AEA requirements supersedeRCRA requirements (EPA 1988a). OSWER, i nconjunction with the Nuclear Regulatory Commission(NRC), has issued several directives to assist inidentification, treatment, and disposal of low-levelradioactive mixed waste. Various OSWER directivesinclude guidance on defining, identifying, and disposingof commercial, mixed, low-level radioactive, andhazardous waste (EPA 1988b). If the in-situ metal-enhanced dechlorination process is used to treatgroundwater containing low-level mixed waste, thesedirectives should be considered, especially regardingcontaminated soils excavated during installation. If high-level mixed waste or transuranic mixed waste is treated,internal DOE orders should be considered whendeveloping a protective remedy (Department of Energy[DOE] 1988). The SDWA and CWA also containstandards for maximum allowable radioactivity levels inwater supplies.
3.57 Occupational Safety and HealthAct (OSHA)
OSHA regulations in 29 CFR parts 1900 through 1926 aredesigned to protect worker health and safety. BothSuperfimd and RCRA corrective actions must meet OSHArequirements, particularly 4 19 10.120, Hazardous WasteOperations and Emergency Response. Part 1926, Safetyand Health Regulations for Construction, applies to any
58
on-site construction activities. For example, excavation ofthe trench for placement of the reactive iron mediumduring the demonstration was required to comply withregulations in 29 CFR part 1926, subpart P. Any morestringent state or local requirements must also be met. Inaddition, health and safety plans for site remediationprojects should address chemicals of concern and includemonitoring practices to ensure that worker health andsafety are maintained.
3.6 State and Community Acceptance
State regulatory agencies will likely be involved in mostapplications ofthe metal-enhanced dechlorination processat hazardous waste sites. Local community agencies andcitizen’s groups are often also actively involved indecisions regarding remedial alternatives.
Because few applications of the metal-enhanceddechlorination technology have been completed, limitedinformation is available to assess long-term state andcommunity acceptance. However, state and communityacceptance of this technology is generally expected to behigh, for several reasons: (1) relative absence of intrusivesurface structures that restrict use of the treatment area; (2)absence of noise and air emissions; (3) the system iscapable of significantly reducing concentrations ofhazardous substances in groundwater; and (4) the systemgenerates no residual wastes requiring off-site managementand does not transfer waste to other media.
NYSDEC oversees investigation and remedial activities atthe New York site. State personnel were actively involvedin the preparation of the work plan for the demonstrationof the pilot-scale funnel and gate system and monitoredsystem construction and performance. NYSDEC will alsobe actively involved in planning for any full-scale systemsinstalled at the site. The role of states in selecting andapplying remedial technologies will likely increase in thefuture as state environmental agencies increasinglyassume many of the oversight and enforcement activitiespreviously performed at the EPA Regional level. For thesereasons, state regulatory requirements that are sometimesmore stringent than federal requirements may takeprecedence for some applications. Also, as risk-basedclosure and remediation become more commonplace, site-specific cleanup goals determined by state agencies willdrive increasing numbers of remediation projects,including applications involving the metal-enhanceddechlorination technology.

Section 4Economic Analy
This economic analysis presents cost estimates for usingan m-situ application ofthe metal-enhanced dechlorinationtechnology to treat contaminated groundwater. Costs arepresented for two full-scale options: 1) a continuous,reactive iron wall; and 2) a funnel and gate system. Thecost estimates are based on systems designed to treat thetypes and concentrations of chlorinated VOCs observed attheNew York demonstration site. The estimates are basedon data compiled during the SITE demonstration and fromadditional information obtained from ETI, S&W, currentconstruction cost estimating guidance, independentvendors, and SITE Program experience.
Past studies by ETI have indicated that costs for thistechnology are highly variable and are dependent on thetypes and concentrations of the contaminants present,dimensions of the contaminant plume, site hydrogeology,regulatory requirements, and other site-specific factors.Estimates for total cost and cost per gallon of water treatedare also heavily influenced by assumptions regarding theduration of the treatment program and the cumulativevolume treated. Furthermore, it is important to note thatthe cost data presented in this report are partially based onextrapolations from design and operating parameters forthe pilot-scale system evaluated during the SITEdemonstration. The purpose of the pilot-scale system wasto determine the optimal design and operating parametersfor a full-scale system. Differences between thecapabilities ofNew York pilot-scale system and full-scalesystems designed for optimal performance at other sitescould cause actual costs to vary significantly fromestimates presented in this report.
Cost data are presented in terms of total cost and cost pergallon of water treated to facilitate comparison of costswith other treatment technologies. However, for passivein-situ systems, the cumulative volume treated is limitedby the natural groundwater flow velocity, and cost pergallon may not always reflect the technology’s overall
value. The in-situ metal-enhanced dechlorination processcombines the ability to remediate groundwater withfeatures typically associated with containment systems;under optimal operating conditions, the technologyprevents migration of contaminated groundwater towardpotential receptors by treating water passing through it.The technology could be combined with source reductionactivities to enhance an overall remedial program at a site.
Due to the many factors that potentially affect the cost ofusing this technology, several assumptions were necessaryto prepare the economic analysis. Several of the mostsignificant of these assumptions are: (1) a continuous,reactive iron wall is assumed to be best-suited for thisparticular application; however, cost estimates for a funneland gate system are also provided for comparison; (2) thesystem will treat water contaminated with TCE, cDCE,and VC at concentrations observed during the SITEdemonstration; and (3) the system will treat groundwaterfor 20 years. (This assumption requires extrapolation ofsome SITE demonstration data to the longer operatingperiod.)
The 20-year timeframe was selected for consistency withcost evaluations of other innovative technologiesevaluated by the EPA SITE Program, and because itfacilitates comparison to typical costs associated withconventional, long-term remedial options, The timeframedoes not reflect any estimate of the actual time required toremediate groundwater at the New York site.
This section summarizes site-specific factors thatinfluence costs, presents assumptions used in this analysis,discusses estimated costs, and presents conclusions of theeconomic analysis. Tables 4-l and 4-2 present theestimated costs generated from this analysis. Costs havebeen distributed among 12 categories applicable to typicalcleanup activities at Superfund and RCRA sites (Evans1990). Costs are presented in 1996 dollars, are rounded to
59

Table 4-1. Estimated Costs Associated with the Metal-Enhance,d Dechlorination Technology: Continuous Wall System
Cost Category
Site Preparationb
Administrative
Treatability studySystem design
Excavation and backfillMonitoring wells
Soil and Water Disposal
Permitting and RegulatorybMobilization and Startupb
Capital Equipment”
Reactive IronSampling Equipment
Demobilizationb
Total Estimated Fixed Costs
Labor (Sampling and Routine O&M)
Supplies”PPECarbon Canisters
Sampling equipment
Utilities”Effluent Treatment and Disposal”
Residual Waste Handling”
Analytical Services’Equipment Maintenance’*&
Total Estimated Variable (Annual) Costs
Total Estimated Fixed and VariableCosts After 20 Years o
Costs per 1,000 gallons treated’Costs per gallon treated’
cost Total Cost
$268,600$15,700
20,00010,000
152,5006,100
64,300
4,00040,000
143,000135,000
8,000$11,000$11,000
$466,600
$5,5002,000
$300
7001,000
00
09,3004,100
$20,900
$884,600
$18.02$0.018
Notes:All costs presented in 1996 dollars.a Costs estimated based on data from SITE demonstration and other sources.b Fixed costs.c Variable costs, presented as annual total.d Annual total prorated from expense incurred at -/-year intervals.e Total costs after 20 years of operations; all annual costs multiplied by 20, plus
total fixed costs.f Total of 49.1 million gallons of groundwater treated.
60

Table 4-2. Estimated Costs Associated with the Metal-Enhanced Dechlorination Technology: Funnel and Gate System
Cost Cateaorv cost Total Cost
Site PreparationbAdministrativeTreatability studySystem designFunnel and Gate ConstructionMonitoring wellsSoil and Water Disposal
Permitting and RegulatorybMobilization and StartupbCapital Equipmentb
Reactive IronSampling Equipment
DemobilizationbTotal Estimated Fixed Costs
Labor (Sampling and Routine O&M)Supplies”
PPECarbon CanistersSampling equipment
UtilitiesCEffluent Treatment and Disposal”Residual Waste Handling’Analytical Services”Equipment MaintenanceqdTotal Estimated Variable (Annual) Costs
Total Estimated Fixed and VariableCosts After 20 Years ’
$382,100$15,70020,00010,000
266,0006,100
64,3004,000
32,500143,000
135,0008,000
$11,000$572,600
$5,5002,000
$300700
1,000000
9,3002,700
$19,500
$962,600
Costs per 1,000 gallons treated’ $19.60Costs per gallon treated’ $0.020
Notes:
All costs presented in 1996 dollars.s Costs estimated based on data from SITE demonstration and other sources.b Fixed costs.c Variable costs, presented as annual total.d Annual total prorated from expense incurred at.7-year intervals.e Total costs after 20 years of operations; all annual costs multiplied by 20, plus
total fixed costs.t Total of 49.1 million gallons of groundwater treated.
61

the nearest 100 dollars, and are considered to be order-of-magnitude estimates.
Costs for implementing this technology are significantlyaffected by site-specific factors, including site regulatorystatus, waste-related factors, and site features. Theregulatory status of the site typically depends on the typeof waste management activities that occurred on site, therelative risk to nearby populations and ecologicalreceptors, the state in which the site is located, and otherfactors. The site’s regulatory status affects costs bymandating AIXAR’s and remediation goals that may affectthe system design parameters and duration of theremediation project. Certain types of sites may have morestringent monitoring requirements than others, dependingon regulatory status.
Waste-related factors affecting costs include contaminantplume size and geometry; contaminant types andconcentrations, and regulatory agency-designated treatmentgoals. Plumes that cover extensive areas will requirelonger walls or more funnels and gates to achievehydraulic control, and may take longer to pass through thetreatment system. Larger contaminant masses (plumevolume times contaminant concentration) require greateramounts of reactive iron.
The contaminant types and concentrations in thegroundwater determine contaminant half-lives. Therequired residence time in the iron, which determines theappropriate width for the reactive iron zone and affectscapital equipment costs and construction costs, is based onthe contaminant half-lives, the remediation goals, and thegroundwater flow velocity. The types of contaminants andthe remediation goals may also determine the need forauxiliary in-situ treatment systems and will influenceperformance monitoring requirements.
Site features affecting costs include site hydrogeology(geologic features and groundwater flow rates),groundwater chemistry (for example, concentrations ofinorganic substances), and site location and physicalcharacteristics. Hydrogeologic conditions are significantfactors in determining the applicability and designparameters, and thus the costs, of in-situ applications ofthe metal-enhanced dechlorination process, and should bethoroughly defined before applying this technology. Thesaturated thickness determines the required height of the
reactive iron wall. The groundwater flow velocitydetermines the thickness of the iron wall required to allowsufficient residence time for dechlorination to occur.These factors (along with the dimensions of thecontaminant plume) determine the necessary volume ofiron and trench dimensions. The depth to water and thedepth to the uppermost underlying aquitard determine thedepth of the installation and the type of constructiontechnology that will be employed. All of these factorsaffect capital equipment costs and site preparation costs.Also, since this is a passive technology, the groundwaterflow velocity and saturated thickness will controlvolumetric flow through the system, influencing theduration of the remediation project and time-relatedvariable costs, such as analytical and maintenance costs.
Groundwater chemistry can also affect costs. Highconcentrations of dissolved inorganic substances ininfluent groundwater may result in precipitation ofcompounds such as calcium carbonate, particularly on theupperiinfluent side of the iron, requiring more frequentmaintenance.
Site location and physical features will impactmobilization, demobilization, and site preparation costs.Mobilization and demobilization costs are affected by therelative distances that system materials must travel to thesite. Sites requiring extensive surficial preparation (suchas constructing access roads, clearing large trees, workingaround or demolishing structures) or restoration activitieswill also incur higher costs.
Depending on the type of system installed, the availabilityof existing electrical power and water supplies mayfacilitate construction activities. However, unlike manyconventional technologies, system operation typicallyrequires no utilities. For these reasons, utilities aretypically not a significant factor affecting costs for thistechnology.
4.2 Assumptions Used in Performingthe Economic Analysis
This section summarizes major assumptions regardingsite-specific factors and equipment and operatingparameters used in this economic analysis. Certainassumptions were made to account for variable site andwaste parameters. Other assumptions were made tosimplify cost estimating for situations that actually wouldrequire complex engineering or financial functions. In
62

general, most system operating issues and assumptions arebased on information provided by ETI, S&W, andobservations made during the SITE demonstration. Costfigures are established from information provided by ET1(ET1 1996b; 1996d), S&W ( 1994), current environmentalrestoration cost guidance (R.S. Means [Means] 1996), andSITE Program experience.
Assumptions regarding site- and waste-related factorsinclude the following:
. The site is a Superfund site, located in the north-eastern U.S.
. Site groundwater is contaminated with TCE,cDCE, and VC at maximum concentrations ofabout 300 pg/L, 500 l.rg/L, and 100 p.g/L, respec-tively.
. The cleanup goals are federal MCL requirementsof 5 pg/L for both TCE and cDCE, and 2 cLs/L forvc.
. The site is located in a rural area, but is easily ac-cessible to standard (wheel-mounted) heavy equip-ment.
. Contaminated water is located in a shallow aqui-fer that overlies a dense, silty clay aquitard at adepth of 15 feet bgs.
. The aquifer is a moderately permeable sand andgravel aquifer, with a natural horizontal flow ve-locity of 0.75 foot per day. The seasonal saturatedthickness varies from about 10 to 12 feet.
. The groundwater contaminant plume is 300 feetwide.
. The site has no existing structures requiring demo-lition and does not require extensive clearing.There are no existing utilities on site that requirerelocation or restrict operation of heavy equipmentsuch as excavators, cranes, or drill rigs.
. Typical naturally occurring inorganic substancesare present in site groundwater, but do not resultin excessively rapid precipitate buildup.
Assumptions regarding treatment system design andoperating parameters include the following:
. A continuous iron wall will be used for this appli-cation. However, costs for an alternative three-gate funnel and gate system are presented for com-parison.
. The hydraulic conductivity of the iron is assumedto be 142 feet per day; the porosity is assumed tobe 0.4. The groundwater flow velocity throughthe continuous iron wall is assumed to be aboutthe same as for the natural aquifer materials, 0.75foot per day. Based on these parameters, the plumedimensions, and the saturated thickness, the wallwill be 300 feet long, 12.5 feet high, and 1.0 footthick, and will require about 337.5 tons of iron(ET1 1996b; 1996d).
. If a funnel and gate system is used, the systemwould consist of three gates, each about 20 feetwide. Total system length (including sheet pilefunnels) would be 440 feet. According to ETI, fun-nel and gate systems signficantly accelerate flowvelocities and would treat about the same volumeof water and the same contaminant mass flux asthe continuous wall. For this reason, ET1 estimatesthat the combined total mass of iron used for the 3gates would be the same as the minimum recom-mended for the continuous wall (about 337.5 tons),resulting in each gate having a 5-foot-thick ironwall (ET1 1996d).
. The minimum volume of groundwater that willpass through the continuous wall or through thefunnel and gate system during the remediationproject is assumed to be 49.1 million gallons, as-suming the flow velocity, porosity, and hydraulicconductivity remain constant.
. ET1 will provide a representative as an on-site con-sultant for key phases of the construction.
. The system continually treats groundwater for 20years. No downtime is required for periodic main-tenance.
. The system continues to achieve cleanup goalsover the remediation period. For this reason, andbecause the treatment system operates in-situ, there
63

are no additional effluent management require-ments, such as air sparging.
. After construction, the treatment system operateswithout the constant attention of an operator. Rou-tine labor requirements consist of monthly sam-pling, measurement of water levels, inspection ofthe monitoring wells and ground surface above thesystem, and mowing the area above the system.
. Periodic maintenance may consist of using soilmixing equipment to agitate the upgradient sideof the iron wall every 5 to 7 years. However, theeffectiveness and feasibility of this technique isundocumented at this time.
. All system components are below grade, so noantifreezing measures are required.
. All equipment and supplies are mobilized fromwithin 500 miles of the site, or less.
. Monthly samples of upgradient (influent) anddowngradient (effluent) groundwater will be re-quired for the first 6 months after installation. Afterthis period, quarterly samples will be required, for20 years.
Depreciation is not considered in order to simplifypresenting the costs of this analysis.Most groundwaterremediation projects are long-term in nature, and usually anet present worth analysis is performed for costcomparisons. However, the variable costs for thistechnology are relatively low, and no other systemconfigurations or technologies are presented in thisanalysis for comparison. For these reasons, annual costsare not adjusted for inflation, and no net present value iscalculated.
4.3 Cost Categories
Table 4-1 presents cost breakdowns for each of the 12 costcategories for the continuous wall. Data have beenpresented for the following cost categories: (1) sitepreparation, (2) permitting and regulatory, (3) mobilizationand startup, (4) capital equipment, (5) labor, (6) supplies,(7) utilities, (8) effluent treatment and disposal, (9) residualwaste shipping and handling, (10) analytical services,(11) equipment maintenance, and (12) site demobilization.
Because costs for a funnel and gate system would probablybe different than those associated with a continuous wall,Table 4-2 presents the costs for a three-gate funnel and gatesystem treating the same size and type of contaminantplume as the continuous wall. Each of the 12 costcategories are discussed below.
4.3. I Site Preparation Costs
Site preparation costs include administration costs, costsfor conducting a bench-scale treatability study, conductingengineering design activities, and preparing the treatmentarea. Site preparation also includes costs associated withconstructing the continuous wall or funnel and gate systemand making the system operational, with the exception ofmobilization charges for specialized heavy constructionequipment (see Section 4.3.3) and the cost of the ironmedium (see Section 4.3.4).
Administrative costs include costs for legal searches,contracting, and general project planning activities.Administrative costs are highly site-specific; for thisestimate, administrative costs are assumed to be $12,500,or about 200 hours of technical staff labor at $50 per hourand 100 hours of administrative staff labor at $25 per hour(Means 1996). Also, ET1 typically charges a site licensefee equal to 15 percent of the iron costs (see Section 4.3.4).For either the full-scale continuous wall or funnel and gatesystems, ETI’s site license fee is estimated to be about$3,200.
According to ET1 and S&W, a phased treatability studywill take between 2 to 4 months to complete (see Section 5for a discussion of the four phases used to implement thetechnology). Treatability study costs include expenses forcolumn tests and labor. According to ETI, typicalanalytical laboratory costs for column tests for a projectsimilar to the one at this site will be about $15,000. Thelabor for the treatability study will be about $5,000,inclusive of 100 hours at an average rate of $50 per hour.The total cost of a treatability study will be about $20,000(EPA 1997).
After the study and a site assessment, ET1 will assist in thedesign of an optimal system configuration for a particularsite. The total system design costs are estimated to be about$10,000. This cost includes about 130 labor hours at anaverage rate of $75 per hour (Means 1996). This estimateassumes that site hydrogeology has already been
64

thoroughly characterized, and no additional hydrogeologicdata will be required. If additional hydrogeologic studiesare required, design costs could be higher.
Treatment area preparation costs depend on the type ofsystem used. ET1 estimates that for a site having the samewaste and site features as the New York site, a continuousreactive iron wall may be the most cost effective type ofsystem (ET1 1996d). Costs for a continuous wall includeexcavating a trench, backfilling it with reactive iron,disposing of the displaced soil, and installing agroundwater monitoring system. This estimate assumesthat a continuous trenching/backfill technique will be usedto excavate the trench and emplace the iron, eliminatingthe need for shoring. Before excavating the trench, soilfrom above the saturated zone (this estimate assumes theupper 3 feet of native soil) can be excavated with aconventional backhoe, stockpiled on site, and eventuallyreplaced to form a cover over the iron, at an assumed costof about $2,000 (Means 1996).
After the top 3 feet of soil are removed, the trench will beextended down to the top of the underlying clay layer, inthis case assumed to be 15 feet below ground surface, usingcontinuous trenching/backfilling equipment. Theequipment will continuously excavate and backfill eachsection of trench with iron, up to about 2.5 feet belowgrade, continuing until the 300-foot long iron wall iscompleted. According to ETI, at this depth, it is possible toconstruct about 100 to 200 lineal feet of reactive iron wallper day using this technique. Costs for the excavation/backfill equipment and operator are estimated to be$150,500, not including mobilization (see Section 4.3.3).(This figure includes costs for transferring soil to roll-offboxes as the trench is excavated.) Total trenchconstruction costs are estimated to be $152,500, notincluding the costs of the reactive iron (see Section 4.3.4)(Means 1996; ET1 1996d).
After all of the iron is emplaced and settled, the top of thewall will be about 3 feet bgs. The stockpiled native soilfrom the upper part of the excavation, which will not havecontacted contaminated groundwater, will be used to fillthe upper part of the trench. Soil excavated from the lowerportion of the trench (below the water table) will havecontacted groundwater contaminated with RCRA F-listedsolvents and may require management as a hazardouswaste. This cost estimate assumes that the soil will beloaded into roll-off containers, stored on site pendingcharacterization, and shipped offsite and disposed of as ahazardous waste. Based on the dimensions of the trench
for the continuous wall (and the volume of soil displacedby monitoring well construction), about 140 cubic yards ofsoil will require disposal. Assuming a disposal cost of$400 per cubic yard (landfill disposal), transport costs of$3.30 per mile for each roll-off container, characterizationand manifesting fees of $5000, and disposal at a locationlOO-miles from the site, total costs for managing thismaterial are estimated to be about $62,300. Actual costsfor waste disposal are highly site specific, and may varysubstantially from this estimate, particularly if the soilrequires incineration (Means 1996).
Alternatively, if a funnel and gate configuration is used,ET1 estimates that a three-gate, 440-foot-long systemwould capture the 300-foot-wide plume. Each gate wouldbe constructed using the same general techniques used forthe pilot-scale system demonstrated at the New York site(see Section 1). Site preparation costs would include costsfor excavating and backfilling the three 20-foot-wide gateswith a reactive iron section bordered by pea gravel andinstalling the sheet-piling to form the continuous funnel.ET1 estimates construction and material costs (includingsheet piling, but not including the reactive iron) to be$264,000 for this system (ET1 1996d). For estimatingpurposes, topsoil removal and replacement, soil disposal,and all other site preparation costs are assumed to be thesame as for the continuous wall.
A groundwater monitoring system will be required tomonitor system performance. For a continuous wall, thisestimate assumes that the system will require a wellspacing of no more than 50 feet along the downgradientside of the wall, to ensure that all sections of the wall areperforming adequately. Three upgradient wells will alsobe installed to allow determination of the system’sremoval efficiency. Installation and development of nine,15-foot-deep PVC monitoring wells with locking caps andflush-mounted protective casings will be required. Theassumed cost for these wells is $45 per foot (including drillrig mobilization from within 50 miles ofthe site), for a totalcost ofabout $6,100. Auger cuttings (about 2 cubic yards)will be disposed of with the material from the trench; costsfor this were included in the waste disposal costspreviously discussed.
For a funnel and gate system, this estimate assumes thatone upgradient well and two downgradient wells would beconstructed in the pea gravel zones at each gate. It may bepossible to install these wells at the time of construction,eliminating the need for drilling. However, at a minimum,the wells will require bracing and completion methods
65

similar to those used during the SITE demonstration, so forestimating purposes, construction costs for these wells arealso assumed to be $45 per lineal foot, for a total of $6,100.
Water from monitoring well development (or from trenchdewatering activities for a funnel and gate system) willcontain site contaminants. This estimate assumes that thewater can be passed through a carbon filter and dischargedto the ground surface upgradient from the system. Costsfor this method of disposal are assumed to be about $2,000,including the cost of carbon canisters and labor.
All system components will be completed below grade.The wells will have locking inner caps. For this reason, nocosts for additional security (fences) will be incurred.
For a continuous iron wall, total site preparation costs areestimated to be $268,600; for a funnel and gate system, sitepreparation costs are assumed to be $382,100.
4.3.2 Permitting and Regulatory Costs
Permitting and regulatory costs are highly site-specific andwill depend on whether treatment is performed at aSuperfund or a RCRA corrective action site; wellheadprotection area restrictions; and other factors. Superfundsite remedial actions must be consistent with ARARs ofenvironmental laws, ordinances, regulations, and statutes,including federal, state, and local standards and criteria.Remediation at RCRA corrective action sites requiresadditional monitoring and record keeping, which canincrease the base regulatory costs.
The cost of all permits is based on the effluentcharacteristics and related receiving water requirements.For this analysis, groundwater is not extracted beforetreatment, so the costs assume that no permit for dischargeof treated effluent to the aquifer will be required. (Thisassumption is based ou ETI’s experience at several full-scale installations in the U.S.). For this reason, thisestimate assumes that total permitting and regulatory costsare minimal; about $4,000. This includes 50 hours of laborat $75 per hour, and $250 for miscellaneous expenses suchas fees and reproduction costs.
4.3.3 Mobilization and Startup Costs
Mobilization and startup costs consist of mobilizing theconstruction equipment and materials and delivering thereactive iron. However, unlike conventional aboveground
systems, no additional assembly charges are incurredbeyond the construction costs described in Section 4.3.1.The technology requires no electrical power, water supply,or other utilities. For in-situ applications of thistechnology, mobilization and startup costs are assumed toconsist solely of equipment mobilization charges,Mobilization costs will vary depending on the location ofthe site in relation to suppliers. Based on informationprovided by ETI, mobilization of the specializedconstruction equipment for a continuous wall (to a site inthe northeastern U.S.) is assumed to be $40,000. For afunnel and gate system, equipment mobilization isassumed to be $32,500.
For the site where the demonstration of the abovegroundreactor occurred, which was also in the northeastern U.S.,ET1 estimated that iron transportation costs would beabout $75 per ton, or about 14 percent of the cost of the iron(EPA 1997). ETI’s current estimates for the cost of theiron include delivery costs (see Section 4.3.4); for thisreason, iron delivery charges are not listed as a separateitem in Tables 4- 1 and 4-2. However, costs for the iron willbe influenced by the site’s location in relation to thesupplier, the distance the iron must be transported to thesite, the mode of packaging (bulk, drums, or 1 -cubic yard“totes”), and the mode of transportation. For this reason,iron costs may vary on a site-specific basis.
4.3.4 Capital Equipment Costs
Capital equipment costs for this analysis include the cost ofthe reactive iron and groundwater monitoring equipment.Costs for other materials (monitoring wells, sheet pilingfunnels, etc.) were previously discussed in Section 4.3.1and.are not considered to be capital equipment costs forthis estimate.
ET1 configures the complete treatment system based onsite-specific conditions. According to ETI, current costsfor the reactive iron, including delivery to a site in thenortheastern U.S., are about $400 per ton, assuming truckdelivery of iron in bulk form. (However, costs may vary ona site-specific basis.) ET1 estimates that the typical irondensity after settling is about 180 pounds per cubic foot(0.09 ton per cubic foot). Based on this estimate, the3,750-cubic-foot continuous wall will require about 337.5tons of reactive iron, resulting in a total capital equipmentcost of about $135,000. According to ETI, the sameamount of iron would be required for a funnel and gate
66

system, as the system would treat the same volume ofcontaminated groundwater as the continuous wall.
For either system, equipment that will be required tomonitor the technology’s performance includes a low-flow sampling pump and meters to measure pH, Eh, andother field parameters. Because this is a long-term projectpurchasing these items will probably be more costeffective than renting them. This estimate assumes thatthese items will cost about $8,000.
Total capital equipment costs are estimated to be $143,000for either the continuous wall or the funnel and gatesystem.
4.3.5 Labor Costs
Once the system is functioning, it is assumed to operateunattended and continuously except during routine O&M,monitoring, and sampling activities.
Routine O&M will generally consist of mowing the areaover and around the treatment system (to preventestablishment ofdeep-rooted plants and maintain access tothe monitoring wells), inspecting the area for excessivesubsidence or erosion, and inspecting the condition of themonitoring wells. Mowing could be contracted out at $50per job, and would be required four times per year for anannual cost of $200.
Inspection activities could be performed concurrently withsampling. This cost estimate assumes that samples will becollected monthly for the first 6 months after installation,and then quarterly for the duration of the project. Morefrequent monitoring is recommended immediately afterinstallation to ensure that the system is performingaccording to design. This cost estimate assumes that allsampling and analytical tasks will be performed byindependent contractors and labor costs for sampling are$45 per hour (Means 1996). During each sampling event,sampling personnel should also inspect the generalcondition of the treatment system area and the condition ofthe monitoring wells. Routine monitoring and samplingactivities are assumed to take about 16 hours per event,assuming measurement of water levels and collection ofgroundwater samples from nine monitoring wells,laboratory coordination, and sample shipment. Datainterpretation and reporting will take an additional 12hours per event. Based on these estimates total sampling-related labor costs are $1,260 per sampling event. For a
20-year remediation project, estimated sampling laborcosts prorate to about $5,300 per year.
Total routine O&M and sampling costs are estimated to be$5,500 per year. Laboratory analytical costs are presentedin Section 4.3.10, Analytical Services Costs. Other laborrequirements for periodic equipment maintenance (ironreplacement) and demobilization are presented in Section4.3.11, Equipment Maintenance Costs and Section 4.3.12,Site Demobilization Costs.
4.3.6 Supply Costs
Necessary supplies as part of the overall groundwaterremediation project include Level D disposable personalprotective equipment (PPE) and sampling and fieldanalytical supplies.
Disposable PPE typically consists of latex inner gloves,nitrile outer gloves, and safety glasses. This PPE is usedduring sampling activities. Disposable PPE is assumed tocost about $300 per year for the sampler.
Water purged from the upgradient monitoring wells duringsampling activities should be contained. Based on the welldimensions, purging the upgradient wells will generateabout 15 gallons of water per sampling event. This costestimate assumes that the water could be pumped througha carbon filter at the completion of each sampling eventand discharged to the ground surface upgradient from thesystem. This estimate assumes that carbon canisters willrequire replacement annually, at a cost of $700 each,including disposal/regeneration of the spent carbon(Means 1996). If this is not feasible, additional off-sitedisposal costs may be incurred. Because detectableconcentrations of contaminants are not anticipated to bepresent in water downgradient from the system, thisestimate assumes that water purged from the downgradientwells can be discharged to the ground surface.
Sampling supplies consist of sample bottles, shippingcontainers, pump hoses or tubing, buckets or drums totemporarily contain purge water, field meter calibrationsolutions, and other typical groundwater samplingsupplies. The numbers and types of necessary samplingsupplies are based on the analyses to be performed. Forthis analysis, annual sampling supply costs are assumed tobe $1,000 (Means 1996).
Total annual supply costs are estimated to be $2,000.
67

4.3.7 Utility Costs
The in-situ metal-enhanced dechlorination systemtypically requires no utilities.4.3.8 Effluent Treatment and Disposal
costs
This estimate assumes that the technology will reducegroundwater contaminants to acceptable levels by in-situtreatment. For this reason, no additional effluent treatmentand disposal costs will be incurred.
4.3.9 Residual Waste Shipping andHandling Costs
Based on existing data, it appears that the dechlorinationprocess generates no residual wastes. This estimateassumes that periodic maintenance to restore the iron’shydraulic conductivity (see Section 4.3.11) will beaccomplished using in-situ soil mixing or a similarprocess, and will not result in the generation of soil andiron that requires management as a potentially hazardouswaste.
4.3. IO Analytical Services Costs
Analytical services costs include costs for laboratoryanalyses, data reduction, and QA/QC. Required samplingfrequencies, number of samples, and associated QA/QCrequirements are highly site-specific and are based onregulatory status, treatment goals, influent contaminantconcentrations, area1 extent of the contaminant plume(which determines the length of the iron wall or number ofgates), and other factors.
This analysis assumes that the number and frequency ofsamples would be the same for either a continuous wall orfunnel and gate system; both cases assume that threebackground wells and six downgradient wells will besampled during each event. All of the samples will beanalyzed for VOCs to directly monitor systemperformance. The one background well and twodowngradient wells nearest the center of the wall will bemonitored for additional parameters to track inorganicprecipitation in the iron; bicarbonate alkalinity and metalsincluding calcium, magnesium, and iron, in addition toVOCs. Based on typical costs for these analyses incurredduring the New York demonstration, costs for the VOC,
metals, and bicarbonate analyses are assumed to be $150/sample, $lOO/sample, and $1 S/sample, respectively.Analytical costs also assume that one trip blank, onematrix spike, and one matrix spike duplicate sample willbe submitted for VOC analyses during each event.Geochemical parameters (pH, Eh, DO, conductivity, andtemperature) will be measured by sampling personnel inthe field using portable meters.
Assuming the sampling frequency discussed in Section4.3.4 (monthly for the first six months and quarterlythereafter) a total of 84 sampling events will be performedover the 20-year project. Analytical costs for these eventsprorate to about $9,000 annually.
Core samples of the reactive iron should be collectedperiodically and analyzed to evaluate precipitate buildup.This estimate assumes that one sample will be collected bi-annually from the upgradient (influent) side of reactiveiron, and analyzed using wet chemistry techniques and bymicroscopy. This estimate assumes that this sample couldbe collected during routine sampling activities, and that theanalyses would cost about $600 per sample, prorating to$300 per year.
Total annual analytical services costs are estimated to be$9,300.
4.3.7 7 Equipment Maintenance Costs
Long-term data regarding the useful life of the reactiveiron are not available. ET1 estimates that the iron may lastup to several decades, provided it does not become coatedor blocked with precipitates. Periodic maintenance may berequired to agitate the influent (upgradient) side of the ironto loosen precipitates, which tend to concentrate in the firstfew inches of reactive iron. It is also possible that the ironmay need to be periodically replaced, if maintenancetechniques can not successfully loosen precipitate buildup.The timeframe for maintenance or replacement will varydepending on flow rate, groundwater chemistry, and otherfactors (Focht, Vogan, and O’Hannesin 1996)
This cost analysis assumes that the reactive iron will notrequire replacement, but will require maintenance every 7years to maintain flow through the system, or twice duringthe 20-year project. According to ETI, this may beaccomplished using augers or in-situ soil mixingequipment to agitate the influent face of the reactive ironand loosen precipitates. However, this technique has not
68

been attempted in a field setting, and therefore itsfeasibility and effectiveness are currently undemonstrated.For this reason, actual costs to perform iron maintenanceare unknown.
Based on mobilization and operating costs typicallyassociated with highly-specialized heavy equipment, foreach maintenance event labor, equipment mobilization,decontamination, and operating costs for iron maintenanceare assumed to be equal to about 30 percent of the originaliron costs, or $40,500, for the continuous wall. Costs areassumed to be slightly less, equal to about 20 percent of theoriginal iron costs, or $27,000, for the funnel and gatesystem due to the shorter total length of the reactive irongates (Focht, Vogan, and O’Hannesin 1996; Means 1996).Assuming that iron maintenance will be required twiceduring the remediation project, estimated annual ironrestoration costs prorate to about $4,100 for the continuouswall and $2,700 for the funnel and gate system, but couldvary significantly from these estimates, particularly ifportions of the iron need to be replaced. Also, if it isnecessary to remove monitoring wells to provide clearaccess to the upgradient side of the iron, additional wellreplacement costs may be incurred.
4.3.72 Site Demobilization Costs
Site demobilization includes removal of the reactive iron;site cleanup and restoration; and off-site transportation anddisposal of the spent iron. Excavation and removal of theiron could be accomplished with a conventional backhoe.This estimate assumes that the iron is non-hazardous andwill bear a recycling credit of 3-5 percent of its originalvalue (about $4,000 to $7,000). Based on theseassumptions, no net costs for removal of the iron areincurred. Backfill of the trench would be completed usinga backhoe and clean fill, at a cost of about $10 per cubicyard. The nine monitoring wells would be removed andthe boreholes grouted to the ground surface at a cost of $20per foot, for a total cost of about $3,000. Based on theseassumptions, net total iron removal and trench backfillcosts are assumed to be about $5,000 after the ironrecycling credit.
For the three-gate funnel and gate system, the iron wouldbe removed and recycled, and the sheet piling would alsobe removed and hauled away as scrap, assuming it is non-hazardous. The monitoring wells would be removed anddisposed of as non-hazardous demolition debris. The gateareas would be brought to grade with clean fill. Net total
costs for removal of the system and backfill for the funneland gate system are assumed to be the same as for thecontinuous wall, after recycling credits for the iron andsheet piling ($5,000).
Final site restoration costs may include optional regradingand seeding of the area. These costs are highly site-specific; in this case, costs are assumed to be $6,000.
Total demobilization and site restoration costs areassumed to be $11,000 for the continuous wall or for thefunnel and gate system. If the iron or sheet piling requiremanagement as a hazardous waste, or do not bear theassumed recycling value, demobilization costs could besignificantly higher.
4.4 Economic Analysis Summary
This analysis presents cost estimates for treatinggroundwater contaminated with TCE, cDCE and VC.Two options are discussed; a continuous reactive wall, anda three-gate funnel and gate system. Operatingassumptions include treating a minimum saturatedthickness of 10 feet of groundwater flowing at a rate of0.75 foot per day through a continuous wall, or 3.75 feetper day for a funnel and gate system. Table 4- 1 shows theestimated costs associated with the 12 cost categoriespresented in this analysis for the continuous wall. Table 4-2 shows the estimated costs for the funnel and gate system.Costs were not adjusted for inflation.
For the continuous wall, total fixed costs are estimated tobe about $466,600. Site preparation costs comprise about57.6 percent of the total fixed costs; capital equipmentaccounts for about 30.6 percent of the fixed costs. Figure4-l shows the distribution of fixed costs for the continuouswall. Total annual variable costs are estimated to be about$20,900. Analytical services (excluding sampling labor)comprise about 44.5 percent of the variable costs; labor(sampling and ordinary O&M) costs account for about26.3 percent of these costs. The variable costs also includeestimated costs for iron maintenance activities assumed tobe required twice during the 20-year project; distributedover the 20-year timeframe these costs account for about19.6 percent ofthe annual variable costs. Figure 4-2 showsthe distribution of annual variable costs for the continuouswall.
After operating for 20 years, the total fixed and variablecosts for the continuous wall remediation scenario
69

presented in this analysis are estimated to $884,600. Aminimum of about 49.1 million gallons of groundwaterwould be treated over this time period, assuming flowvelocities remain constant at 0.75 foot per day, and theporosity and hydraulic conductivity of the entire wallremain unchanged. Based on these criteria, the total costper 1,000 gallons treated is about $18.02, or about 1.8 centsper gallon.
Figures 4-3 and 4-4 exhibit breakdowns of the estimatedfixed and variable costs associated with the funnel and gatesystem, respectively. As shown on Figure 4-3, the majordifferences between the costs for the continuous wall andthe funnel and gate system are in the site preparationportion of the fixed costs. Although fixed costs for thefunnel and gate system are considerably higher, highermaintenance costs are assumed to be required for thecontinuous wall due to the greater length of iron wall thatwill require maintenance. For this reason, the estimatedcost per gallon of groundwater treated for the funnel andgate system (about 2 cents) is only slightly higher than forthe continuous wall. The volume of groundwater treated isassumed to be the same in both cases. However, the actualamount of groundwater that would pass through the funneland gate system would depend on the degree to which thesystem can accelerate the natural groundwater flowvelocity, and therefore may differ from the amount thatwould pass through a continuous wall. For this reason, andother reasons previously discussed, actual costs may varysignificantly from estimates presented in this report.
70

$11,000 (2.4%) Demobilization
!§l43,000 (30.6%) Capid Equ
$4,ooo (0.9%) P$40,000 (8.6%) Mobilization and Sta
$268 ~30 (57.6%) Site Preparation
Total Fixed Costs are estimated to be $466,600.
Figure 4-1. Distribution of fixed costs for continuous wall.
$4,100 (19.6%) Equipment Maintenance
$9,300 (44.5 %) Analytical Services
$5,500 (26.3 W) Labor
$2,000 (9.6%) Supplies
Notes: 1) Total Annual Variable Costs are estimated to be $20,900.2) Routine sampling and O&M labor; does not include iron restoration.
Figure 4-2. Distribution of annual variable costs for continuous wall.
71

$11,000 (1.9%) Demobilization
,500
$143,000 (25.0%) Capital Equipmen
$4,000 (0.7%) Permitting
’ (5.7%) Mobilization and Startup
(66.7%) Site
Total Fixed Costs are estimated to be $570,600.
Figure 4-3. Distribution of fixed costs for funnel and gate system.
$2,700 (13.8%) Equipment Maintenance
$9,300 (47.7%) Analytical Services
$2,000 (10.3 96) Supplies
Notes: 1) Total Annual Variable Costs are estimated to be $19,500.2) Routine sampling and O&M labor; does not include iron restoration.
Preparation
Figure 4-4. Distribution of annual variable costs for funnel and gate system.
72
Section 5Technology Status and Implementation
ET1 has completed several bench-scale studies, five pilot-scale tests using aboveground reactors and in-situ reactivewalls, and six full-scale installations of in-situ systems.Several other field tests of in-situ installations are plannedfor the near future in Massachusetts and Hawaii. ET1 iscompleting cooperative research and development/licensing arrangements with several U.S. and multinationalindustrial firms.
The in-situ implementation of the technology involvesinstalling a permeable treatment wall of coarse-grainediron medium across the groundwater plume. The irondegrades chlorinated VOCs as they migrate through thewall under naturally occurring groundwater flowconditions. When the in-situ metal-enhanced dechlorinationtechnology is applied to treat a large plume ofcontaminated groundwater, impermeable sheet piles orslurry walls may be used to funnel contaminatedgroundwater through smaller permeable treatmentsections, known as gates. Selection of the appropriate typeof system depends on site-specific factors.
The metal-enhanced dechlorination process also may beemployed aboveground. Aboveground treatment units aredesigned to treat extracted groundwater. Abovegroundtreatment units can be available as trailer-mountedtransportable units or permanent installations. Theconfiguration of the aboveground units may include asingle unit or several units connected in series or inparallel.
The metal-enhanced dechlorination technology isimplemented through a four-phase approach. A site dataassessment is conducted during phase 1; a feasibilityevaluation involving bench-scale testing (and pilot-scaletesting if necessary) is conducted during phase 2; systemdesign, costing, and construction occurs during phase 3;and phase 4 involves long-term performance monitoring.Phases 1 and 2 may take about 2 to 4 months, and phase 3
may take about 6 months. The duration of phase 4 willdepend on site-specific conditions and regulatoryrequirements. The phases are described in subsequentsections.
Phase 1 - Site Data Assessment
The purpose of a site data assessment is to review existingdata to evaluate site conditions that may affect theperformance of the technology. On the basis of thisreview, the site may be placed into one of two categories.The first category includes sites with a physical setting andgroundwater chemistry similar to other sites at which themetal-enhanced dechlorination technology has beenshown to be effective. Therefore, implementation ofphase2 (a feasibility evaluation) is not necessary before phase 3activities begin.
The second category includes sites with unique physicaland geochemical properties that may affect the applicationof the metal-enhanced dechlorination technology. Theprobability for the successful application of the technologyat these sites is unknown, due to the presence of untestedchemicals, unusual inorganic chemistry, or unusualgeologic settings. For these sites, implementation ofphase2 activities is needed before phase 3 activities can begin.Data that are necessary to assess a site include:
. Groundwater inorganic and organic chemistry:The inorganic chemistry of groundwater is impor-tant because it indicates whether metals can pre-cipitate during treatment. The effect of metal pre-cipitation on the performance of the technology isdiscussed in Section 3.1.1. The nature of organiccontaminants present in groundwater determinesthe applicability of the technology to a particularsite, as discussed in Section 3.1.1.
73

. VOC characteristics: The technology is appro-priate for treating chlorinated methanes, someethanes, and ethenes. Each compound and its po-tential by-products have a half-life. The half-lifeof each compound and its degradation by-prod-ucts are critical parameters with regard to residencetime when designing a treatment system.
. Site geology and soils: The type of materials,depth to water, saturated thickness, and presenceof an underlying aquitard are important consider-ations for the design and implementation of in-situ installations of the metal-enhanced dechlori-nation technology.
. Hydrogeological data: Horizontal gradient, hy-draulic conductivity and groundwater flow veloc-ity will affect the performance of the metal-en-hanced dechlorination technology because theyinfluence the residence time of groundwater in thereactive wall, which affects the required wall thick-ness.
Phase 2 - Feasibility Evaluation
If the site is placed into the second category as defined inphase 1, a feasibility evaluation is typically performed.The purpose of phase 2 is to evaluate the efficiency of themetal-enhanced dechlorination technology under simulatedgroundwater flow conditions, by performing laboratorybench-scale (column) tests using representativegroundwater samples collected from the site. Groundwaterflow and geochemical models may be used to assist in thefeasibility evaluation. Feasibility testing should (1)confirm that the VOCs present are degraded by theprocess, (2) evaluate the rates of VOC degradation, and (3)evaluate associated inorganic geochemical reactions.
Following successful laboratory bench-scale tests, a pilot-scale field test may be conducted to collect additional datato support full-scale application of the process; however,according to ETI, pilot-scale testing is no longer typicallyrequired. Pilot-scale testing may not be required, or maybe very limited for sites having contaminant, geochemical,and hydrogeologic characteristics similar to other sites forwhich ET1 has extensive past performance data. However,it is important to note that because the technology isrelatively new, state regulatory authorities may stillrequire a pilot-scale study if the technology has not beenshown to be effective in that particular state. If pilot-scale
testing is required, the results ofthe bench-scale studies areused to design the pilot-scale system. The pilot-scalesystem may be in-situ or aboveground, depending on thepotential full-scale application and site conditions. Thisfield test provides data which are readily extrapolated toestimate full-scale costs, long-term performance andoperation, and maintenance requirements.
A feasibility evaluation report is prepared to documentphase 2 testing results. The report interprets the laboratorydata with respect to the site’s hydrogeologic characteristicsand provides information required for the preliminarydesign and cost estimating activities performed in phase 3.
Phase 3 - System Design, Costing, andimplementation
Phase 3 is the design, costing, and construction of a full-scale system. The results from phase 2 provide the basisfor full-scale design. The half-lives of the chlorinatedVOCs present in the groundwater and the half-lives ofpotential dechlorination by-products, determined throughbench-scale testing, and data collected during the pilot-scale testing (if required), are used to confirm the correctvolume of iron required to treat the types andconcentrations of contaminants present. The full-scalesystem dimensions are determined based on the totalresidence time necessary for dechlorination; the flowvelocity, and the contaminant plume dimensions. Thesecriteria determine the thickness of the reactive iron wall inan in-situ system. For in-situ systems, hydrogeologicfactors such as saturated thickness and plume dimensionswill also influence the full-scale system design.
Once the full-scale system design is finalized, the system isconstructed. According to ETI, steady state operatingconditions are typically achieved by the time about 20 to30 pore volumes of groundwater has passed through thesystem (ET1 1994).
Phase 4 - Long-Term Performance Monitoringand Maintenance
Routine performance monitoring and reporting areperformed according to regulatory requirements.Performance monitoring includes sampling and analysisof treated groundwater to determine the concentrations ofVOCs of concern. Decreases in dissolved metalconcentrations indicate formation of insoluble precipitatesthat may clog the reactive iron medium.
74

As discussed in Section 3, periodic maintenance may berequired to restore the hydraulic conductivity andreactivity of the iron. ETI estimates that for full-scale in-situ systems, these activities may be required every 5 to 10years.
75
Section 6References
Appleton, Elaine. 1996. “A Nickel-Iron Wall AgainstContaminated Groundwater.” Environmental Scienceand Technology News, Volume 30, Number 12.
Chen, Chien T. 1995. Excerpts from Presentation Titled“Iron Reactive Wall.” Innovative Site RemediationWorkshop, Sturbridge, Massachusetts. September 13-14.
EnviroMetal Technologies, Inc. (ETI). 1994. RevisedDraft: Rationale for Suggested Design and MonitoringProgram, Pilot Scale Field Trial of the EnviroMetal Pro-cess.
ETI. 1996a. Draft Evaluation Report; Pilot-Scale Funneland Gate, New York. Prepared for Steams and Wheler,L.L.C. (S&W). March.
ETI. 1996b. Draft Correspondence Regarding Ground-water Flow Velocity Measurements. From John Vogan,Manager, to Diane Clark, Senior Engineer, S&W. Oc-tober 24.
ETI.1996~. Case Studies of Various Applications of theMetal-Enhanced Dechlorination Process. November 5.
ETI. 1996d. Memorandum Regarding Potential Full-ScaleCosts of In-Situ Treatment. From John Vogan, Man-ager, to Diane Clark, Senior Engineer, S&W. Novem-ber 25.
ETI. 1997. Correspondence Regarding Draft InnovativeTechnology Evaluation Report (ITER) for the New YorkDemonstration of the In-Situ Application of the Metal-Enhanced Dechlorination Process. Form Robert Focht,Hydrogeologist, to Guy D. Montfort, PRC Environmen-tal Management, Inc. (PRC). April 2.
Evans, G. 1990. “Estimating Innovative Treatment Tech-nology Costs for the SITE Program.” Journal of Air
and Waste Management Association. Volume 40, Num-ber 7. July.
Focht, R., Vogan, J., and O’Hannesin, S. 1996. “FieldApplication of Reactive Iron Walls for In-Situ Degra-dation of VOCs in Groundwater.” Remediation. Vol-ume 6, Number 3. Pages 8 l-94.
Gillham, Robert W., and Stephanie F. O’Hannesin. 1994.“Enhanced Degradation of Halogenated Aliphatics byZero-Valent Iron.” Ground Water. Volume 32, Num-ber 6.
Gillham, Robert W. 1995. “Resurgence in Research Con-cerning Organic Transformations Enhanced by Zero-Valent Metals and Potential Application in Remediationof Contaminated Groundwater. Preprint extended ab-stract presented before the American Chemical Society,Anaheim, California. April 2 - 7. Pages 691-694.
Gillham, Robert W. 1996. “In-Situ Treatment of Ground-water: Metal-Enhanced Degradation of ChlorinatedOrganic Contaminants.” Recent Advances in Ground-water Pollution Control and Remediation. M.M. Aral(ed.), Kluwer Academic Publishers. Pages 249-274.
O’Hannesin, Stephanie F., and Robert W. Gillham. 1992.“A Permeable Reaction Wall for In-Situ Degradation ofHalogenated Organic Compounds.” Paper Presented atthe 1992,45th Canadian Geotechnical Society Confer-ence. Toronto, Ontario, Canada. October.
O’Hannesin, Stephanie F., 1993. “AField Demonstrationof a Permeable Reaction Wall for In-Situ Abiotic Deg-radation of Halogenated Organic Compounds.” (M.Sc.Thesis, University of Waterloo.)
Means, R.S. Company, Inc. (Means). 1996. Environmen-tal Restoration Assemblies Cost Book. R.S. Means
76

Company, Inc., Kingston, Massachusetts.
PRC Environmental Management, Inc. (PRC). 1995.EnviroMetal Technologies, Inc. “Metal EnhancedAbi-otic Degradation Technology SITE Program Demon-stration Final Quality Assurance Project Plan.” Sub-mitted to EPA ORD, Cincinnati, Ohio. May.
PRC. 1996. Record of Telephone Conversation Regard-ing Inorganic Data from New York
Demonstration. Between Guy D. Montfort, Project Man-ager, and John Vogan, ETI. December.
PRC. 1997. Record of Telephone Conversation Regard-ing Full-Scale Funnel and Gate Design. Between GuyD. Montfort, Project Manager, and Rob Focht, ETI.January.
Puls, R., Powell, R., and Paul, C. 1995. “In-SituRemediation of Ground Water Contaminated with Chro-mate and Chlorinated Solvents Using Zero-Valent Iron:a Field Study. Presented Before the Division of Envi-ronmental Chemistry. American Chemical Society.Anaheim, California. April 2-7. Pages 788-791.
,Reardon, Eric, 1995. “Anaerobic Corrosion of GranularIron: Measurement and Interpretation of Hydrogen Evo-lution Rates.” Environmental Science & Technology,Volume 29, No. 12. Pages 2936-2945.
Snoeyink, Vernon L. and David Jenkins. 1980. WaterChemistry. John Wiley & Sons. New York.
Steams and Wheler, Inc. (S&W). 1993. Final RemedialInvestigation Report (for the New York DemonstrationSite). January.
S&W. 1994. Draft Work Plan for the Field Trial of theEnviroMetal Process. October.
U.S. Department of Energy (DOE). 1988. RadioactiveWaste Management Order. DOE Order 5820.2A. Sep-tember.
EPA. 1987. Joint EPA-Nuclear Regulatory Agency Guid-ance on Mixed Low-Level Radioactive and HazardousWaste. Office of Solid Waste and Emergency Response(OSWER) Directives 9480.00-14 (June 29), 9432.00-2(January 8), and 9487.00-8. August.
EPA. 1988a. Protocol for a Chemical Treatment Demon-stration Plan. Hazardous Waste Engineering ResearchLaboratory. Cincinnati, Ohio. April.
EPA. 1988b. CERCLA Compliance with Other Environ-mental Laws: Interim Final. OSWER. EPA/540/G-89/006. August.
EPA. 1988~. Guidance for Conducting Remedial Investi-gations and Feasibility Studies UnderCERCLA. OSWER. EPA/540/G-89-004. October.
EPA. 1989. CERCLA Compliance with Other LawsManual: Part II. Clean Air Act and Other Environmen-tal Statutes and State Requirements. OSWER. EPA/540/G-89-006. August.
EPA. 1997. Metal-Enhanced Dechlorination of VOCsUsing an Aboveground Reactor. SITE Program Inno-vative Technology Evaluation Report EPA /540/R-96/503. Office of Research and Development - NationalRisk Management Research Laboratory. July.
Yamane, C.L., S. Warner, J. Gallinatti, F. Szerdy and T.Delfino. 1995. Installation of a Subsurface Ground-water Treatment Wall Composed of Granular Zero-Va-lent Iron. Preprint Extended Abstract Presented beforethe Division of Environmental Chemistry. ACS. Ana-heim, California. April 2-7. Pages 792-795.
77
Appendix AVendor’s Claims for the Technology
The metal-enhanced dechlorination technology uses ametal (usually iron) to enhance the abiotic degradation ofdissolved halogenated organic compounds. Laboratory-scale and field-scale pilot studies conducted over the past5 years at the Waterloo Centre for Groundwater Research,University of Waterloo, and at several commercial sites inthe U.S., have shown that the process can be usedeffectively to degrade halogenated methanes, someethanes, and ethenes over a wide range of concentrations.These studies have shown that:
. The degradation kinetics appear to be pseudo tirst-order (i.e., the rate of reaction is directly propor-tional to the concentration of the reactants)
. With few exceptions, no persistent products ofdegradation have been detected and degradationappears to be complete given sufficient time
. The degradation rates of chlorinated compoundsare several orders of magnitude higher than thoseobserved under natural conditions
. The reaction rate is dependent on the surface areaof iron available
A.1 Advantages and InnovativeFeatures
. Reactants are relatively inexpensive
. The treatment is passive and requires no externalenergy source
. Contaminants are degraded to harmless products,rather than being transferred to another mediumrequiring subsequent treatment, regeneration, ordisposal
.
.
.
A.2
The reactive iron is highly persistent with, depend-ing upon the application, the potential to last forseveral years to decades without having to be re-placed
The process is one of the few that appears to havepotential for passive in-situ treatment
The process degrades a wide range of chlorinatedvolatile organic compounds, includingtrichloroethene, tetrachloroethene, cis-1,2-dichloroethene, and vinyl chloride. Preliminarytests suggest that it may be applicable for a widerrange of compounds in addition to chlorinated “ali-phatic” hydrocarbons.
Technology Status
The first full-scale in-situ installation of the technologyoccurred at an industrial facility in California in December1994. Eleven installations of either pilot or full-scalesystems have been completed to date. These in-situinstallations and others planned in 1997 will assist in theassessment of the long-term field performance of thetechnology.
The results collected to date show that the ET1 technologycould be a highly effective aboveground or in-situ methodof remediating waters containing chlorinated aliphaticcompounds. An in-situ permeable treatment wall ofcoarse-grained reactive media installed across the plumewill degrade compounds as they migrate through the zoneunder naturally occurring groundwater flow conditions.By utilizing impermeable sheet piles or slurry walls, alarge plume of contaminated groundwater can be funneledthrough smaller permeable treatment sections.
78

Appendix BCase Studies
This appendix summarizes several case studies on the useof metal-enhanced dechlorination technology. These casestudies involve bench-scale units, pilot-scale units, andfull-scale units treating contaminated groundwater. Theinformation available for these case studies ranged fromdetailed analytical data to limited information on systemperformance and cost. Results from five case studies aresummarized in this appendix.
B.1 Semiconductor Facility, South SanFrancisco Bay, California
B. 7.7 Project Description
Several studies were performed by EnviroMetalTechnologies, Inc. (ETI), using groundwater from aformer semiconductor manufacturing site in South SanFrancisco Bay, California to examine the feasibility ofconstructing and operating an in-situ permeable wallcontaining a reactive iron medium to replace an existingpump-and-treat system. Groundwater at this site wascontaminated with trichloroethene (TCE), cis- 1,2-dichloroethene (cDCE), vinyl chloride (VC), and Freon113. Results of laboratory column studies performed byET1 indicated that the concentration of dissolved volatileorganic compounds (VOCs) in the groundwater wassignificantly reduced. Following the laboratory studies,pilot- and full-scale units were installed.
B. 7.2 ResultsI
Pilot-Scale System
An aboveground demonstration reactor containing 50percent iron by weight and 50 percent sand by weight wasinstalled and operated over a 9-month period. Groundwaterwas pumped through the demonstration reactor at a flowvelocity of 4 feet per day.
The groundwater at the semiconductor facility site washighly mineralized. Although precipitate formation wasevident at the influent end of the test reactor, the rate ofdegradation remained relatively constant over the 9-month test period. The following were the pilot-scale testresults:
. TCE, 210 ppb, 1.7-hour half-life
. cDCE, 1,415 ppb, 0.9-hour half-life
. VC, 540 ppb, 4.0-hour half-life
Several other aspects of the metal-enhanced dechlorinationprocess were evaluated during this pilot-scale test,including the following.
Metals precipitation - Inorganic geochemical datacollected in the field was used to predict the po-tential for precipitate formation in the reactive ironmaterial. Operation and maintenance requirementsfor the full-scale design were based on the evalu-ation of the metals precipitation data.
Hydrogen gas production - Hydrogen gas maybe produced as a consequence of the dissociationof water in the presence of granular iron. Rates ofhydrogen gas generation measured in the labora-tory (Reardon 1995) were used to evaluate the needfor any hydrogen gas collection system in the full-scale application. Based on the evaluation, no needfor a hydrogen gas collection system was indicated.
Microbial Effects - Groundwater from within thereactor was sampled for microbial analysis. Theresults indicated that the microbial population inthe reactor was similar to the population observedin untreated groundwater. There was no visualevidence of biomass generation during the test.
79

Full-Scale System
Based on the pilot-test results, a till-scale in-situ treatmentwall was installed in December 1994. The reactive wallwas 4 feet thick, 40 feet long, and situated verticallybetween depths of about 7 feet and 20 feet below groundsurface. The 4-foot-thick zone of 100 percent granulariron was installed to achieve a hydraulic residence time ofabout 4 days to treat VOCs to cleanup standards, based onthe estimated groundwater velocity of 1 foot per day. VCrequired the longest residence time to degrade to cleanupstandards. A layer of pea gravel about 1 foot thick wasinstalled on both the upstream and downstream sides of thereactive wall. The reactive wall was flanked by slurrywalls to direct groundwater flow towards the reactive ironmedium. The construction cost for the reactive wall wasabout $225,000. Together with slurry walls, capital costswere about $720,000.
At the time this report was prepared, minimal data for thefull-scale system were available. Monitoring wells wereinstalled near the upstream and downstream faces. Initialresults indicate that chlorinated VOCs are being reducedto below regulatory levels. For further details see Yamaneet al 1995 and Szerdy and others 1995.
Sources: Yamane and others 1995; Szerdy and others1995; ETI 1996; Focht, Vegan, and O’Hannesin 1996.
B.2 Canadian Forces Base, Borden,Ontario, Canada
B.2.1 Project Description
In May 199 1, a small-scale in-situ field test was initiated atthe Borden site to treat groundwater contaminated withTCE and PCE. The source of the contaminant plume at thesite was located about 4 meters (m) below ground surfaceand 1 m below the water table. The plume was about 6.6feet wide and 3.3 feet thick, with a maximumconcentration along the axis of about 250,000 and 43,000pg/L, for TCE and PCE, respectively. An in-situpermeable wall was constructed about 18 feet downgradientfrom the source. The aquifer material consisted of amedium to fine sand, and the average groundwatervelocity was about 0.3 feet per day.
The reactive wall was constructed by driving sheet pilingto form a temporary cell 5.2 feet thick and 18 feet long.The native sand was replaced by the reactive iron medium,
80
consisting of 22 percent iron grindings by weight and 78percent coarse sand by weight. After the reactive ironmedium was installed, the sheet piling was removed,allowing the contaminant plume to pass through the wall.
Rows of multilevel samplers were located 1.6 feetupgradient from the wall, at distances of 1.6 feet and 3.3feet into the wall, and 1.6 feet downgradient from the wall,providing a total of 348 sampling points.
B.2.2 Results
Samples were collected and analyzed over a five-yearmonitoring period. There was no apparent change inperformance and no maintenance required over the five-year duration of the test. The results indicated that about90 percent of the TCE and 86 percent of the PCE wasremoved as the contaminant plume passed through thewall. Amounts of dechlorination by-products (tDCE andcDCE) equivalent to about 2 percent of the original massof TCE and PCE present in the influent were detected atsampling points within the wall. However, thesebyproducts also were dechlorinated with fbrther distancethrough the wall. An observed increase in chlorideconcentrations in effluent samples indicated that thedecline in TCE and PCE concentrations was aconsequence of dechlorination processes. Although theeffluent did not achieve drinking water standards, based oncurrent knowledge it appears that use of a greaterproportion of iron relative to contaminant loading, or useof a more reactive form of iron, could have improvedperformance. No VC was detected as a result of PCE,TCE, or cDCE degradation, and no bacterial growth wasobserved. Examination of the iron medium by X-raydiffraction and scanning electron microscopy did notindicate the presence of precipitate on the reactivematerial.
Source: Gillham 1996.
B.3 Industrial Facility, Kansas
B.3. I Project Description
A groundwater investigation during the early 1990sidentified a TCE plume, with concentrations ranging from100 to 400 ppb Q.&L,), egressing from an industrial facilityin Kansas. The TCE occurs in a basal alluvial sand andgravel zone overlying the local bedrock, at a depth ofabout 30 feet below ground surface. In mid- 1995, a

treatability study was conducted on groundwater from thefacility to determine the effectiveness of granular iron indegrading chlorinated organic compounds in thegroundwater.
The treatability study consisted of pumping groundwaterfrom the site through a laboratory column containing theiron material. The column test provided site-specificinformation on (1) the dechlorination rate of TCE; (2) thepotential for the formation and degradation of chlorinatedby-products; and (3) potential inorganic chemicalchanges. The results of this study were used to determinethe required residence time necessary for the dechlorinationof TCE and its degradation products.
A groundwater model of the site was then generated,incorporating various funnel and gate configurations.This model helped to determine the size of the in-situsystem necessary to capture and treat the plume ofcontaminated groundwater, and to estimate the expectedgroundwater velocity through the gate. The velocityestimate, together with the required residence timedetermined from the treatability study, were used todetermine the necessary thickness ofthe iron section in thegate.
During December 1995 through January 1996 a 1 ,OOO-foot-long funnel and gate system was installed at thefacility property boundary. A low natural groundwatervelocity permitted the use of a high funnel-to-gate ratio;the velocity increase due to the funneling action permitteda reasonably small treatment zone to be built. The systemwas constructed with about 490 feet of impermeablefunnel on either side of a 20-foot long reactive gate.Construction of the funnel sections was accomplished byfirst constructing a single, soil-bentonite slurry wall. Afterthe wall had set, the 20-foot gate section was excavated inthe middle of the wall. The iron zone was then installed inthe gate section, measuring about 13 feet deep and about 3-feet wide (that is, the flow-through thickness was 3 feet).Weather delays and other non-technical delays extendedthe construction period; however, the constructioncontractor estimated that under optimal conditions theslurry wall could have been built in two weeks, and thereactive gate section in one week.
B.3.2 Results
Costs for the installation (sluny walls and gate) were about$400,000, including 70-tons of granular, reactive iron.
Results to date show nondetectable concentrations ofVOCs in the wells screened in the gate. For further detailssee Focht, Vogan, and O’Harmesin 1996.
Sources: ETI 1996; Focht, Vegan, and O’Hannesin 1996.
B.4 U.S. Coast Guard Facility, NorthCarolina
In June 1996, an in-situ reactive wall was installed near aformer machine shop at a U.S. Coast Guard facility inElizabeth City, North Carolina, using a continuoustrenching technique, to treat a groundwater contaminantplume with TCE concentrations of about 10 mg/‘L andhexavalent chromium also at about 10 mg/L. The reactivewall measures about 150 feet in length, 2 feet in width, andextends to about 26 feet bgs.
For excavation, continuous trenching was performed witha cutting chain excavating system, similar to a DitchWitchm. As the chain excavator moved across thedesignated trench boundary, soils were brought to thesurface and deposited onto the ground surface. The soilswere eventually analyzed for hazardous constituents andremoved from the site. A steel trench box, extending to thewidth and depth of the trench, was pulled immediatelybehind the chain excavator and served to keep the trenchopen and allow the emplacement of granular iron into thetrench. Through a hopper above the trench box, granulariron was fed into and through the trench box to theexcavated area. This process, which involved theplacement of about 450 tons of iron, was continued for theentire length of the trench and was completed in a singleday. Total cost ofthe installation was about $500,000 withthe iron costing just under $400 per ton.
Source: Blowes and others 1997; ETI 1996
B.5 Lakewood Colorado Facility
The largest in-situ funnel and multiple gate system to datewas installed from July through November 1996 at agovernment facility in Lakewood, Colorado. The facilityis underlain by unconsolidated sediment and bedrockaquifers, with the bedrock surface at about 25 feet bgs.Groundwater contamination at the facility, mainly VOCs,is present in both aquifers at varying concentrations (TCEand DCE: 700 pg/L maximum; vinyl chloride: 15 pg/Lmaximum), and over a widespread area.
81

A sheet piling wall, which serves as the funnel for thissystem, was installed over a length of 1,040 feet and to adepth of 25 feet bgs. Four 40-foot long reactive gatesections with varying thicknesses were installed atdesignated locations along the wall. Varying gate sectionthicknesses were used to compensate for variations ingroundwater flow velocities and VOC concentrations indifferent parts of the site. In accomplishing the funnelinstallations, sheet piling boxes were erected at eachlocation and native material was excavated from insideeach box. A thin layer of pea gravel was then placed at thebottom of each excavation followed by granular iron up toabout 9 to 13 feet bgs.
Groundwater flow velocities are expected to range fromless than 1 foot per day (ft/day) to about 10 ft per day; datacollection is currently underway to determine these. Initialmonitoring data indicate that effluent contaminantconcentrations are meeting the design criteria.
Source: ET1 1996.
B.6 References
Blowes, D.W., R.W. Puls, T.A. Bennett, R.W. Gillham, C.J.Hanton-Fong, and C.J. Ptacek. 1997. “In-Situ PorousReactive Wall for Treatment of Cr(V1) and Trichloroet-hylene in Groundwater.” 1997 International Contain-ment Technology Conference and Exhibition, St. Pe-tersburg, Florida. February 9- 12.
EnviroMetal Technologies, Inc. (ETI). 1996.Case Studiesfor Various Applications of the Metal-Enhanced Dechlo-rination Process. November 5.
Focht, R. J. Vogan, and S. O’Hannesin. 1996. “FieldApplication of Reactive Iron Walls for In-Situ De gr a-dation of Volatile Organic Compounds in Groundwa-ter”. Published in “Remediation;” Volume 6, No. 3.Pages 8 l-94.
Gillham, R. W. 1996. “In-Situ Treatment of Groundwa-ter: Metal-Enhanced Degradation of Chlorinated Or-ganic Contaminants.” Recent Advances in Groundwa-ter Pollution Control and Remediation. M. M. Aral(ed.), Kluwer Academic Publishers. Pages 249-274.
Degradation of Halogenated Organic Compounds.”(M.Sc. Thesis, University of Waterloo.)
Szerdy, ES., J.D. Gallinatti, S. D. Warner, C. L. Yamane,D.A. Hankins, and J. L. Vogan. 1995.“ I n - S i t uGroundwater Treatment by Granular Zero-Valent Iron -Design, Construction and 0peratio.n of an In-Situ Treat-ment Wall.” Published by Geomatrix Consultants, Inc.San Francisco, California.
Yamane, CL., et. a1.1995. “Installation of a SubsurfaceGroundwater Treatment Wall Composed of Granu-lar Zero-Valent Iron.” Preprint Extended Abstract Pre-sented before the Division of Environmental Chemis-try. ACS. Anaheim, California. April 2-7. Pages 792 -795.
O’Hannesin, Stephanie F., 1993. “AField Demonstrationof a Permeable Reaction Wall for In-Situ Abiotic
82

Appendix CAnalytical Data Tables
83
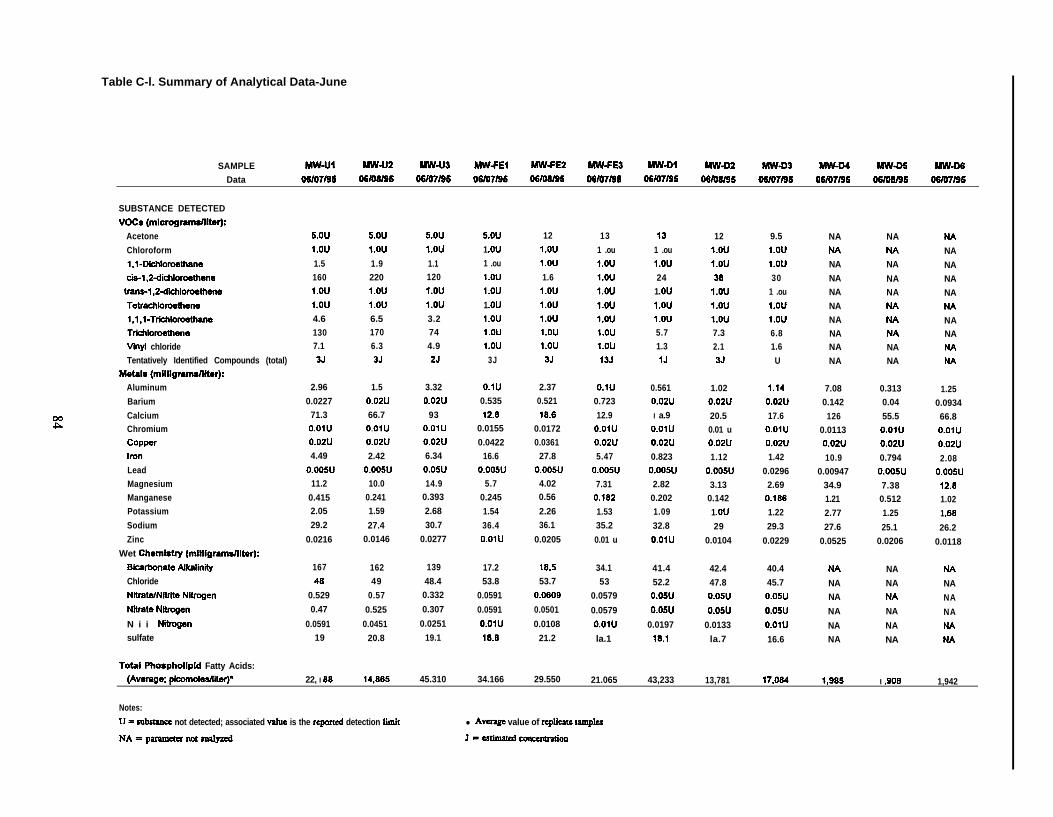
Table C-l. Summary of Analytical Data-June
SAMPLE MW-UI Mw-U2 MN-U3 MU-FE1 MWFE2 WWEJ MllV-Dl Mw-D2 Mw-m MN-M PAW-m Mw-D6Data g6/07/96 owow9c OWO7/96 06mTl96 06/06/95 66/67/96 06/67/95 owow91 06107196 06/07/96 06/W95 66/07/96
SUBSTANCE DETECTED
VOC8 (mlcrograms/tlter):Acetone
Chloroform
1.1~Dtchtoroethanecis-1.2-dichtcrocthene
trans-1.2dichlomethene
Tetrachtcroethenel.l.l-TrichloroethsneTrtchloroetheneVlnyl chlorideTentatively Identified Compounds (total)
M&Is (mitllgrmns/titer):Aluminum
Barium
CalciumChromium
CopperIronLeadMagnesiumManganesePotassium
Sodium
Zinc
Wet Chemistry (mllligramulltrr):
fkarbonate AlknlinityChloride
Nllte/Nltrlte Nitmgen
Niite Nitrcgen
N i i Nitrogensulfate
Tetal Pho8phollpld Fatty Acids:
5.ou 5.ou 5.ou
l.OU l.OU LOU
1.5 1.9 1.1160 220 120
l.OU l.OU l.OU
l.OU l.OU l.OU
4.6 6.5 3.2130 170 747.1 6.3 4.93J 35 25
5.ou1 .ou1 .ou
l.OUl.OU
1 .oul.OUl.OUl.OU
3J
12 13 13l.OU 1 .ou 1 .oul.OU l.OU l.OU1.6 l.OU 24l.OU l.OU 1 .oul.OU l.OU l.OUl.OU l.OU l.OUl.OU l.OU 5.7l.OU l.OU 1.3
35 135 IJ
2.96 1.5 3.32 O.lU 2.37
0.0227 0.02u 0.02u 0.535 0.521
71.3 66.7 93 12.8 18.6O.OlU O.OlU O.OlU 0.0155 0.01720.02u 0.02u 0.02u 0.0422 0.03614.49 2.42 6.34 16.6 27.8
0.005u 0.005u 0.05u 0.005u 0.005u11.2 10.0 14.9 5.7 4.02
0.415 0.241 0.393 0.245 0.56
2.05 1.59 2.68 1.54 2.2629.2 27.4 30.7 36.4 36.1
0.0216 0.0146 0.0277 O.OlU 0.0205
167 162 139 17.248 49 48.4 53.8
0.529 0.57 0.332 0.0591
0.47 0.525 0.307 0.0591
0.0591 0.0451 0.0251 O.OlU19 20.8 19.1 la.8
la.5 34.1 41.4 42.453.7 53 52.2 47.8
0.0609 0.0579 0.05u 0.05u0.0501 0.0579 0.05u 0.05u0.0108 O.OlU 0.0197 0.0133
21.2 la.1 la.1 la.7
12 9.5 NAl.OU l.OU NAl.OU l.OU NA38 30 NAl.OU 1 .ou NAl.OU l.OU NAl.OU l.OU NA7.3 6.8 NA2.1 1.6 NA3J U NA
NA NANA NANA NANA NANA NANA NANA NANA NANA NANA NA
O.lU 0.561 1.02 I.14 7.08 0.313 1.250.723 0.02u 0.02u 0.02u 0.142 0.04 0.093412.9 I a.9 20.5 17.6 126 55.5 66.8
O.OlU O.OlU 0.01 u O.OlU 0.0113 O.OlU O.OlU0.02u 0.02u 0.02u 0.02u 0.02u 0.02u 0.02u5.47 0.823 1.12 1.42 10.9 0.794 2.08
0.005u 0.005u 0.005u 0.0296 0.00947 0.005u 0.005u7.31 2.82 3.13 2.69 34.9 7.38 12.80.182 0.202 0.142 O.lB6 1.21 0.512 1.021.53 1.09 1 .ou 1.22 2.77 1.25 1 .sa35.2 32.8 29 29.3 27.6 25.1 26.20.01 u O.OlU 0.0104 0.0229 0.0525 0.0206 0.0118
40.4 NA NA NA45.7 NA NA NA0.05u NA NA NA0.05u NA NA NAO.OlU NA NA NA16.6 NA NA NA
1,942(Avwage: picomotesMer)* 22, I aa 14.865 45.310 34.166 29.550 21.065 43,233 13,781 17.084 1,985 I ,9oa
Notes:
U = nrbanw not detected; associated valee is the reported detection bit l Avulpc value of rcpttcate rrmplu
NA=pammeternotaealyzed I- .utlmatcd -0tl

Table C-2. Summary of Analytical Data-July
SAMPLE Mw-Ul Mw-Uz Mw-U3 Mw-FE1 hnvFE2 M w - F E 3 hlW-Dl MW-D2 M W - D 3 M-D4 MW-D5 M W - D 6Date 07/13/95 07n2/95 tnnlI95 wn3m 07lw95 67/11/95 07n3195 w/l2195 67/11/95 07/13/95 67Iu195 @7/11/95
SUBSMNCEDE’I’ECEDvocs (mlcr~ter~
Ac&meChloroform1.1 -Dichloroethanecis-1,2-Dicldoroetbene
natu-1,2-DiiorccdletlcTcaachloroethenel.l.l-TricldoroetluoeTricbloroetheneVinyl chlorideTatstively ldeotified Compomxls (TM)
MeCola (mllll~ter):AluminumBtimIicalciumchmmium
E CopperlmnLeadMagnesiumUquusePotptSiUmsodiumzinc
wet clamlhy (rllmpmatcr):
Bicarbonate AlkalinityChlorideNitrate/Nitrite NitrogenNitntc NitrogenNitrite Nitrogen
Sulfate
5.ou1 .ou
3.52301.21 .oul.OU100733J
s.oul.OU
2.8280l.OUl.OU4.5160169s
5.ou 12 5.ou 9.6 8.4 24l.OU l.OU l.OU l.OU l.OU l.OU
3.1 l.OU l.OU l.OU l.OU l.OU360 LOU l.OU l.OU 2.2 3.71.0 l.OU l.OU 1.00 1 .ou l.OUtou l.OU l.OU I .ou l.OU l.OU1 .ou l.OU l.OU l.OU l.OU l.OU280 l.OU l.OU l.OU l.OU l.OU18 l.OU l.OU 1.2 l.OU l.OU21 1U 61 1J 1u 81
30 s.ou 44 NAl.OU l.OU l.OU NAl.OU l.OU l.OU NA3.9 30 50 NAl.OU 1 .ou l.OU NAl.OU l.OU l.OU NAl.OU l.OU l.OU NA1 .ou 29 54 NAl.OU l.OU 2.2 NA1U 1u 2l NA
0. IOU0.037490.8O.OlU0.02U
0.0784o.osu12.6
0.559l.OU31.8
0.0198
O.lOU0.0268
88.8O.OlUo.ozu0.05uo.onJ12.3
0.427l.OU31
0.0253
0.155o.mJ
88O.OlUemu0.184o.osu12.5
0.281LOU31.4
0.0268
O.lOU0.24114.5
O.OlUemu0.41o.osu10.80.241.6530
O.OlU
0. IOU 0. 1u 0. IOU 0.17 0.107 0.153 O.lOU 0.110.522 0.161 0.0739 o.oaJ 0.0494 O.MU 0.0246 0.03514.3 15 22.6 13.7 17.6 21.3 36 30.2
O.OlU O.OlU O.OlU O.OlU O.OlU O.OlU O.OlU O.OlU0.02u o.lmJ o.onJ o.oxJ o.lmJ o.mJ 0.02u o.lnlJ0.252 0.615 0.0883 o.osu 0.0571 0.174 o.osu 0.104o.osu 0.05l.l o.osu o.osu o.onJ O.MU 0.05u 0.05u10.2 11.3 7.06 2.87 6.18 2.96 4.91 4.74
0.111 0.312 0.243 0.127 0.222 0.156 0.312 0.5161.45 1.66 1.42 l.OU 1.36 1 .ou l.OU l.OU30.9 30.8 30.2 27.5 28.8 27.9 26.7 28.2
0.0109 0.0113 0.0129 0.0115 0.0124 O.OlU 0.0161 0.0144
188 278 290 39.4 55.6 63 84.8 51.5 48 NA NA NA52.8 53.2 53.2 52.1 54 53.3 51.8 48.6 51.4 NA NA NA0.338 0.378 0.383 O.OSU 0.05u 0.05lJ 0.05U o.lml 0.05U NA NA NA0.338 o.osu 0.383 O.OSU o.osu 0.05U 0.05l.l o.osu O.OSU NA NA NAO.OlU 0.378 O.OlU O.OlU O.OlU O.OlU O.OlU O.OlU O.OlU NA NA NA16.7 17.1 16.7 15.6 16.1 14.9 11.8 5.1 14.2 NA NA NA
Total Phosphollpld Fatty kids:(Average: picomoles/liter)* NA NA NA NA NA NA NA NA NA NA NA NA
Notes:U = substaoce not detected; asscciated value is dctcctioo limit. l Average value of replicate samplesNA = pamnuter not analyzed. J = e.uimml wn#nuation.VOC sample kactioos were colls~ed from wells WV-D4 pld DS for the sole pmporc of soppohg the demoometion heal61 XXI safety program. ami were oat required by the project +ty a.qv project plan;
VOC data from these wella are not directly relevant to demonstration objectives.
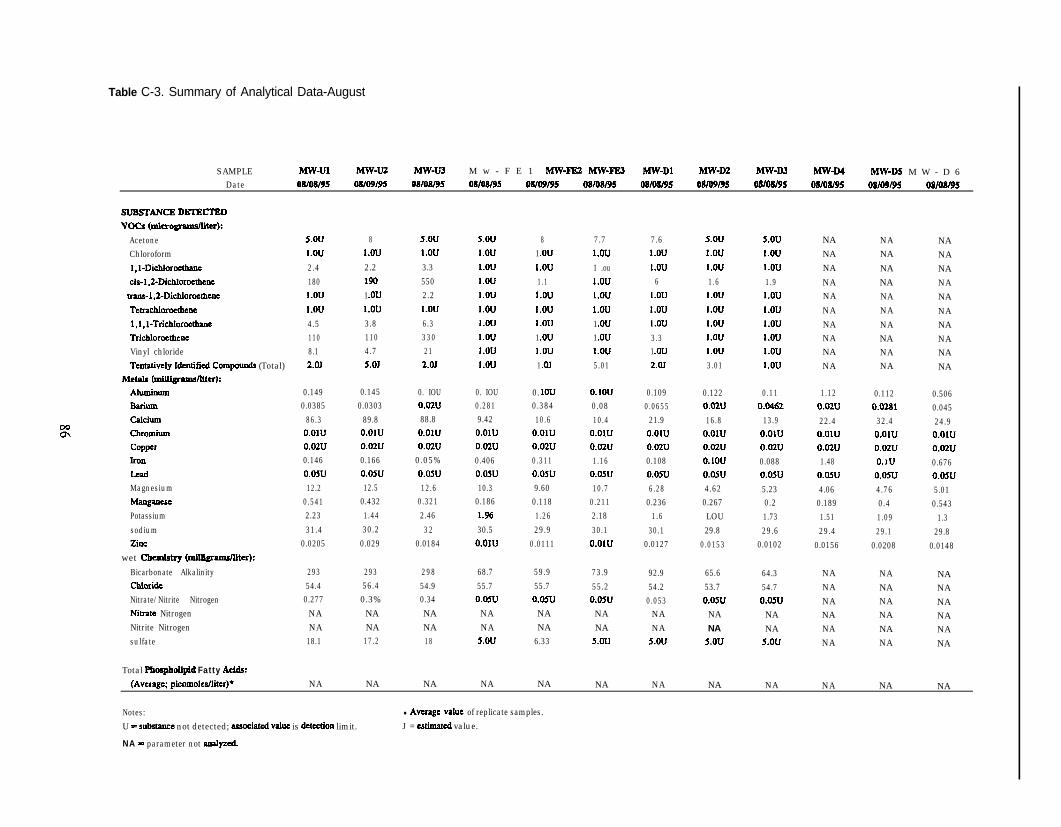
Table C-3. Summary of Analytical Data-August
SAMPLE w-u1 hlw-U2 Mw-U3 M w - F E 1 Mw-lx2 hlw-FE3 MW-Dl MW-DZ MW-D3 Mw-D4 W-D5 M W - D 6Date OWO8195 owo9l95 08lOW95 OSlOSl95 08/W/95 OS/OS/95 08m8/95 08av95 o8m8l95 08/08/95 OS/W95 08/08/95
SUBSl’ANCE DE’lXtXEDvoca (micTopuwuter~
AcetoneChloroform1.1 -Di&loroetbnccis-1.2-Dichlorcabene
tram- 1,2-Dichloroethene
Tctrachloroetbcnel,l.l-TrichloroethaneTrichloroethcneVinyl chlorideTcnutivcly Identified Compoends (Total)
Met.& (mlllipmmslltter):AbJminumBariUmcalciumCbIOmiUm
Cwpcrk0n
LadMagnesiumuangauescPotassium
sodiumzll
wet chemistry (mlul~ter):
Bicarbonate AlkalinitychlmideNitrate/Nitrite NitrogenNitrete NitrogenNitrite Nitrogensulfate
5.OU
l.OU2.4180l.OU
l.OU4.51108.12.OJ
0.149 0.1450.0385 0.0303
86.3 89.8O.OlU 0.01I.IO.MU 0.02u0.146 0.1660.05u 0.05l.I12.2 12.5
0.541 0.4322.23 1.44
31.4 30.20.0205 0.029
293 293 29854.4 56.4 54.90.277 0.3% 0.34NA NA NANA NA NA
18.1 17.2 18
8l.OU
2.21%1 .oul.OU3.81104.75.OJ
5.oul.OU
3.35502.2
l.OU6.333021
2.OJ
0. IOUemu88.8O.OlU0.02u
0.05%O.MU12.6
0.3212.46
320.0184
s.oul.OU
l.OUl.OUl.OU
l.OUl.OUl.OUl.OUl.OU
81 .ou
l.OU1.1l.OU
l.OUl.OU1 .oul.OU
1 .OJ
0. IOU 0. 1ou0.281 0.3849.42 10.6O.OlU O.OlU0.02u 0.02u0.406 0.3110.oT.u o.osu10.3 9.60
0.186 0.1181.96 1.2630.5 29.9O.OlU 0.0111
68.755.70.05uNANA
s.ou
59.955.70.05uNANA
6.33
7.7LOU1 .oul.OUl.OUl.OU1 .ou1 .oul.OU5.01
O.lOU0.0810.4
O.OlUO.MU1.16
0.05u10.7
0.2112.18
30.1O.OlU
73.9
55.2O.MUNANA
5.ou
7.6l.OU
l.OU6
l.OU
I.OUl.OU
3.31 .ou2.oJ
5.ou
l.OU
l.OU1.6l.OU
l.OUl.OUl.OUl.OU3.01
5.ouLOU1.ou
1.9l.OU
l.OUl.OUl.OUl.OUl.OU
NANANA
NANA
NANANANANA
NANA
NANANANA
NANANANA
NANANANANA
NANANANANA
0.109 0.1220.0655 o.tmJ21.9 16.80.OlI.I O.OlUemu 0.02u0.108 O.lOUo.osu 0.05u6.28 4.62
0.236 0.2671.6 LOU
30.1 29.80.0127 0.0153
0.11 1.12o.@l62 0.02u
13.9 22.4O.OlU O.OlUo.u2u 0.02u0.088 1.48o.osu 0.05u5.23 4.060.2 0.1891.73 1.5129.6 29.4
0.0102 0.0156
0.112 0.506O.MSl 0.04532.4 24.9O.OlU O.OlUemu 0.02uO.lU 0.6760.05u 0.05u4.76 5.010.4 0.5431.09 1.329.1 29.8
0.0208 0.0148
92.954.2
0.053NANA
5.ou
65.653.70.05uNANA
5.ou
64.354.70.05UNANA
s.ou
NANANANANANA
NANANANANANA
NANANANANANA
Total PhospboUpld Fatty Addx(Avetage; picomoIes/litcr)* NA NA NA NA NA NA NA NA NA NA NA NA
Notes: l Average value of replicate samples.
U = substencc not detected; essociekd value is ducctioo limit. J = estimeud value.
NA = parameter not arid+.

Table C-4. Summary of Analytical Data-October
Mw-ul Mw-u2 Mw-u3 lknwFE1 Mw-FE2 MwFF3 WV-D1 MW-D2 hlW-D3 MW-D4 M W - D 5 MW-D6Date ionm 10/u/95 ionu95 10/n/95 lOn2/95 10111/95 10111195 10/u/95 ioni/ 10/n/95 10/12/95 ionm5
SUBSTANCEDEIXCIED
voca (mkrogJamaltcr):ACttONBromodicldoromethaneChloroformCblorocthanc1. I-Dicldoroetbpnc1, I-DicblorWheaecis-1.2-Dichloroed~ctram- 1.2Dichlorocthwuuhy1eac c2dorldeTtWXhl@=1,l.LTrlchloroefhancTolumTrichlorcetheneViiyl chlorideTentatively Identified Compouds (Total)
Metals (milIlgm~~Ntcr):AluminumBtimllCalciumChromiumCopperIrOnLadUa~iumMNgNCNPotassiumsodlunlzll
wet tL%emmq (InlIu~~
Bicarbonau Alkalhlty
Chloride
Nibte/Nitrik NitrogenNitrate Nitrogm
Nitrite Nitrogensulfau
Total F’bsphdlpld Fatty Add%
(AVCNEC; homolu/litW
Notes:u - Nb‘tpnee llot d#ecled.
NA-pamuterncianalyrd.
5.ou s.ou
LOU LouLOU l.OU
l.OU l.OU3.9 5.4
1.1 1.2320 4501.7 1.9l.OU l.OUl.OU l.OU5.6 7.7l.OU l.OU120 16053 791 .ou l.OU
5.ou
1.Wl.OU
25.81.23701.9l.OUl.OU7.9l.OU15049l.OU
s.ou
1.Wl.OU1.WLOUl.OU1.21.Wl.OUl.OUl.OUl.OUl.OUl.OUZ.SJ
O.lU0.0402
92.10.0321o.cnuO.lUo.osu
120.591.9931.1emu
O.lU0.0305
95.60.03uo.ozuO.lUo.osu12.3
0.461I.71131.4o.ozu
O.lU 0. 1u0.02u 0.059988.11 7.72
O.OlU 0.03u0.02u o.ctzuO.lU 0.1840.05U O.OSU12.6 9.01
0.321 0.07162.46 2.2232 33.3
0.0184 emu
299 299 199 55.845.4 46.4 48 47.6
0.19 0.31 0.269 O.CSU0.19 0.298 0.269 0.05UO.OlU 0.0118 O.OlU O.OlU15.8 15.5 16.7 s.ou
s.ouI.OUl.OUl.OUl.OU1.W2
l.OUl.OUl.OUl.OUl.OULOUl.OU3.61
O.lU0.149.17emuo.cmJ0.203o.osu9.68
0.0792.1733.90.02u
60
49.5
0.05UO.OSUO.OlU
5.w
s.ou
1.W1 .ouI .ou2.2l.OU3.8l.OU
l.OUl.OUl.OUl.OUl.OU2.33.31
O.lU0.02u9.61o.muemu0.523O.MU10.5
0.07062.2233.1
0.02u
65.748.4
O.MUO.MUO.OlUs.ou
5.6
1.Wl.OUl.OUl.OU1.W5
l.OUl.OUl.OUl.OUl.OU1.21 .oul.O.I
O.lU0.0521.3o.mu0.02uO.lU
0.0.5u5.51
0.2311.7
32.5
o.ozu
n.748.7
O.OSIJO.WLlO.OlUxou
s.oul.OUl.OUl.OU1 .oul.OU7.51 .oul.OUl.OUl.OUl.OU1.51.2l.OU
O.lU0.02u
1 5o.muemuO.lOUo.osu4.25
0.1941.3932.8
0.02u
64.748.7
o.osuO.OSUO.OlUxou
s.ou
I .oul.OUl.OU1 .oul.OU2
1 .ou1 .oul.OUl.OUl.OUl.OUl.OU1 .ou
O.lU0.0386
150.03uo.mJO.lUO.!MJ5.010.231.7232.9
o.ozu
59.849
o.osu0.05uO.OlU5.ou
NANANANANANANANANANANANANANANA
NANANANANANANANANANANANANANANA
NA
NANANANANANANANANANANANANANA
0.17 o.iu 0.7120.132 0.0454 0.025864.8 28.6 30.2
0.038 o.mu o.mu0.a2l.l o.cmJ o.ozu1.16 0.233 0.541
O.OSU 0.05U o.osu9.08 4.4 5.161.36 0.719 0.3211.18 1.05 1.5233.5 33 34.80.02u 0.02u o.ozu
NANA
NA
NANANA
NANA
NANANANA
NANA
NANANANA
91 115 492
l Average whx of replicate sample&
1=utimrtcdVdUC.
56 36 20 438 325 as I ,774 6m 565

Table C-5. Summary of Analytical Data-November
SAMPLE hiw-Ul Mw-U2 MW-U3 M w - F E 1 M w - F E 2 Mw-FE3 MW-Dl hlW-D2 W-D3 MW-D4 MW-D5 MW-D6
Date ll/o9/95 11/08/95 11/08/95 ll/o9/95 lllOSi95 11/08/95 ll/OSM 11108195 11/08/95 ll/o9/95 lllOW95 11/08/95
SlJBSl-ANCE DETECIED
vocs (mtcrogralNnlter):
ActtomBromodichlorom&aneClllorofotmCMoroetbaneI, I-Dichloroctlrmc1.1 -Dichloroefhenccis- 1,2-Dichlorocthenetram 1.2-Dichlom&eneMcd~ylenc ChlorideTeaachloroedwe1.1.1 -TrichJoroethancTolueneTrichloroethcneVinyl chlorideTentatively Identified Compounds (Total)
Met.& (miUigtnms/Uter):
BariumCalcium
COPpcrIronLead
PotassiumsuiiluuZinc
wet cbemiseg (UltllionmJliter):Bicarbonate Alkalinity
Nitrate/Nitrite NitrogenNitrate Nitrogen
Nitrite Niuogen!hlt%e
Tohl Phospholipid Fatty AclL:
5.oul.OUl.OUl.OU1.1l.OU98
l.OUl.OUl.OU3.3l.OU32
7.98.01
0.2u0.0342
87.5O.OlUemu0.165emu11.9
0.4681.6528
o.a?u
259 272 283 41.8
40.8 42.5 43.8 43.6
0.125 0.175 0.19 o.osu
0.11 0.157 0.171 o.osu
0.153 0.018 0.0192 O.OlU
13.1 14.4 15.3 s.ou
s.ou 5.ou
l.OU l.OUl.OU l.OU
l.OU l.OU1.8 2.7l.OU LOUMO 2/u)I.OU 1.9l.OU l.OU1.ou 1 .ou4.4 6.9l.OU l.OU65 110
10 258.41 7.11
0.2u0.0284
89.9O.OlUemu
0.07280.05U11.9
0.3451.75
27.7o.o#?u
0.2uo.tx?u89.9O.OlUo.mJ
0.05060.05u
120.269
1.4928.70.lm.J
5.ou1 .oul.OUl.OUl.OUl.OU1.00l.OUl.OU1 .ouI.OUl.OUl.OU1 .ou4.31
0.2u0.0492
8.12O.OlU0.02u0.144o.osu8.38
0.05342.0127.70.02l.l
5.ou
l.OUl.OUl.OUl.OUl.OUl.OUl.OUl.OUl.OUl.OUl.OUl.OU
l.OU2.01
0.2u
0.09747.96O.OlU0.02u0.2
O.CSU8.06
0.05981.8628.20.02u
44.3
45.8
o.osuO.MUO.OlUs.ou
5.oul.OUl.OUl.OU3.9l.OU15
l.OUl.OUl.OUl.OUl.OUl.OU
1.63.81
0.2uo.ozu8.88
O.OlU0.02u0.506O.MU10.3
0.04531.9328.1o.crzu
50.3
42.6
0.05UO.MUO.OlU5.ol.l
5.oul.OUl.OUl.OUl.OU
l.OU4.6l.OUI.OUl.OU1 .ou1 .ou1.6
l.OULOU
0.2u0.0422
20.3O.OlUo.mu0.134o.osu4.76
0.1611.2323.7
o.mu
55.537.6
o.osu0.05IJO.OlUs.ou
s.oUl.OUl.OUl.OUl.OUl.OU4.2I.OUl.OUl.OUl.OUl.OUl.OU
I.OU2.03
0.2uo.mu13.4
O.OlUo.mu
0.0862O.OSU3.72
0.1611.27
23.2o.mu
63.737.9
O.OSU0.05u
O.OlULOU
8l.OUl.OUl.OUl.OUl.OU2.8l.OU1.3l.OUl.OUl.OUl.OU
l.OUl.OU
o.mu0.0341
10.3O.OlUo.mu0.134o.osu4.27
o.o7331.4
22.5emu
48.838.7
0.05Uo.osuO.OlU5.ou
W ANANANANANANANANANANANANA
NANA
0.735o.m75
33.3O.OlUo.mu
1.1o.osu5.580.341.26
21.1o.mu
NANANANA
NANA
NANA
NANANANANANANANANANANANANA
NANANANANANANANANANANANA
NANANA
0.2u 0.435om33 0.0572
30.3 39.3O.OlU O.OlUo.mu 0.0200.211 0.498o.osu o.onJ4.56 6.72
0.452 0.521l.OU 1.3822.1 24.8o.mu o.mu
NA
NANANANA
NA
NANANANANA
NA
(Average: tdcomo1cs/1iter~* NA NA NA NA NA NA NA NA NA NA NA NA
NotesU = substance not detect& associated value is detection limit.NA = parameter not analyzed.
l Average value of replicate samplu.J = utimucd value.

Table C-6. Summary of Analflical Data-December
SAMPLE Mw-Ul Mw-U2 Mw-U3 Mw-ml hiw-FEZ Mw-FE3 WV-D1 hlW-DZ MW-D3 MW-D4 MW-D5 MW-D6Date l21w95 12lW95 12lO5195 121w95 l2/86/95 l2105/95 12165/95 12/M/95 l2/05/95 l2/05/95 l2/66/95 l2/05/95
SUESTANCE DETECl’EDWCS (mIcropalldllter):
AcetoneBromodicldoromethanechloroformcblomedlanc1.1.Diiorocthane1.1 -Dichloroethmucis-1.2-Dichlorocthane
aatwl .Z-DichloroetheneMethyluv ChlorideTCUXhlorcUhUtCl.l.l-Trichlomc6mneTolusneTtiChl-DCVinyl chhidcTentatively identified Compom%is (Total)
Metals (mtllt~terbAbuuinurnBviUmCalciumcbmmium
IronLedMagnchm
M-ePoarsimnSilver
sodiumz l l
wet ChmLrtrJ (Nult~~):Bicarbonate AlkalinityCbl0rid.Z
Nitate/Niite NitrogenNitrate NitrogenNitrite Nitrogensulfate
Total Phospholipid Fatty Addr:
5.oul.OUl.OUl.OU3.4l.OU180l.OUl.OUl.OU13
l.OU11021
4.13
0.2u0.0387
92.5O.OlUo.mu0. IUO.MU12.9
0.494
1.87O.OlU
30.50.0129
311 291 293 9.95
47.2 47.4 48 48.30.23 0.269 0.19 o.osu0.2 0.238 0.169 o.osu
0.m99 0.0305 0.0209 O.OlU
16.3 17.2 16.3 s.ou
5.ou 5.oul.OU l.OUl.OU l.OUl.OU l.OU3.6 3.9l.OU l.OU240 270l.OU l.OU
l.OU l.OU1.W l.OU
11 13l.OU l.OU120 13022 223.63 4.43
0.2uo.uz52
90.6O.OlU
o.mu0. 1uO.MU12.7
0.388
1.93O.OlU
29.40.0119
0.2uo.mu90.7O.OlU
o.mu0. 1uO.MU12.9
0.2891.97
O.OlU30.3
0.0125
s.oul.OUI.OUl.OU1.W1 .oul.OUl.OU
l.OUl.OUl.OUl.OUi.oul.OU2.OJ
0.m0.0474
12.7O.OlUo.mu0.238o.osu10.4
0.09582.11
O.OlU
29.9O.OlU
s.oul.OUl.OUl.OUl.OULOUl.OUl.OUl.OUl.OUl.OU1 .oul.OUl.OU3.21
0.2u0.1029.6
O.OlUo.mu0.158O.MU7.33
0.0574
1.86O.OlU
29.6O.OlU
47.849.2o.oslJO.MUO.OlU
s.ou
5.ou1.WLOUl.OU2.1l.OU4.3l.OU
l.OULOU1.wLOUl.OU4.13.21
0.2uo.mu9.98O.OlUo.mu0.601O.MU8.29
0.128
1.5
O.OlU
28.6O.OlU
43.8
48.6O.MUO.MUO.OlU5.ou
s.ou
l.OUl.OUl.OUl.OU1 .ou2.5l.OUl.OUl.OU1 .oul.OUl.OUl.OU1.33
0.2u0.0363
21O.OlUo.mu0.148O.MU5.50.16
1.47
O.OlU
26.5O.OlU
75.7
45.3o.osuo.osuO.OlUs.ou
LOUl.OUl.OUl.OUl.OUl.OU5.6l.OU1 .oul.OUl.OUl.OU
0.913l.OU6.2J
0.2uo.mu15.4
O.OlUo.muO.lUO.MU4.230.195
1.02O.OlU23.4O.OlU
56.542.8o.onJo.onJO.OlU
s.ou
5 .wl.OUl.OU1 .oul.OUl.OU5.4l.OU
l.OUl.OUl.OUl.OUl.OUl.OUl.OU
NANANA
NANANANANA
NANANANANANANA
o.mu 0.3250.0411 0.0231
16.6 28.50.01u O.OlUo.mu o.mu0.128 0.554O.MU o.osu6.65 4.96
0.238 0.3181.78 1.16
O.OlU O.OlU27.1 20O.OlU 0.0114
61.8
45.8o.osuO.MUO.OlUs.ou
NANANANANANA
NANANANANANANANANANANANANANANA
NANANANANANANANA
NANANANANANANA
0.2u 0.9740.0338 0.0578
33.6 43.0O.OlU O.OlUo.mu o.mu0.159 1.06O.MU 0.on.l5.95 8.47
0.174 0.377l.OU 1.23
O.OlU O.OlU
15.5 23.90.0115 0.014
NA
NANANANANA
NA
NANA
NANANA
(Average; picomoles/liter)* 19 66 54 10 72 114 1.005 1.508 1.601 2.480 3.450 2.482
Notes:U = substance not detected, associated value is detccdon limit.NA = parameter not analyzed.
3 = csdmatcd concentration; reported value 13 below PQL.l Average vahtc of replicate samples.