metal contamination of agricultural soils in the copper
TRANSCRIPT
J. Earth Syst. Sci. (2017) 126:49 c© Indian Academy of SciencesDOI 10.1007/s12040-017-0833-z
Metal contamination of agricultural soils in the coppermining areas of Singhbhum shear zone in India
Soma Giri1,*, Abhay Kumar Singh1 and Mukesh Kumar Mahato2
1Natural Resources and Environmental Management Group, CSIR-Central Institute of Mining and Fuel Research,Barwa Road, Dhanbad 826 015, India.2Department of Chemistry, Vinoba Bhave University, Hazaribag 825 301, India.*Corresponding author. e-mail: [email protected]
MS received 8 November 2016; revised 13 January 2017; accepted 22 January 2017; published online 7 June 2017
The study was intended to investigate the heavy metal contamination in the agricultural soils of thecopper mining areas in Singhbhum shear zone, India. The total concentrations of the metals weredetermined by inductively coupled plasma-mass spectrometer (ICPMS). Pollution levels were assessed bycalculating enrichment factor (EF), geo-accumulation index (Igeo), contamination factors (CF), pollutionload index (PLI), Nemerow index and ecological risk index (RI). The metal concentrations in the soilsamples exceeded the average shale values for almost all the metals. Principal component analysis resultedin extraction of three factors explaining 82.6% of the data variability and indicated anthropogeniccontribution of Cu, Ni, Co, Cr, Mn and Pb. The EF and Igeo values indicated very high contaminationwith respect to Cu followed by As and Zn in the agricultural soils. The values of PLI, RI and Nemerowindex, which considered the overall effect of all the studied metals on the soils, revealed that 50% ofthe locations were highly polluted with respect to metals. The pollution levels varied with the proximityto the copper mining and processing units. Consequently, the results advocate the necessity of periodicmonitoring of the agricultural soils of the area and development of proper management strategies toreduce the metal pollution.
Keywords. Agricultural soil; heavy metals; copper mining areas; multivariate analysis; geo-accumu-lation index; Nemerow index.
1. Introduction
The contamination of agricultural soils by heavymetals has aroused considerable apprehensionworldwide due to their toxicity and persistence(Cao et al. 2010; Ma et al. 2015). The sources ofheavy metals in the soil can be of both naturaland anthropogenic origins. Of the other anthro-pogenic sources, mining has emerged as one ofthe most important sources of heavy metals inthe surrounding environment. Mining and millingoperation together with grinding, concentrating
ores and disposal of tailings, along with mine andmill waste water, provide obvious sources of con-tamination (Adriano 2001; Li et al. 2014). Heavymetal contamination of the soils in the vicinityof the mine sites are recognized as one of theserious environmental problems around the world.The heavy metal contaminated soils have a poten-tial to contaminate the other constituents of theenvironment like surface and groundwater sources,air and the agricultural crops growing on them(Borgese et al. 2013; Ji et al. 2013; Li et al.2014).
1
49 Page 2 of 13 J. Earth Syst. Sci. (2017) 126:49
Some metals like Cu, Fe, Mn, Ni and Zn areimportant as micronutrients for life processes inliving organisms for life and regulate many physio-logical function of the body. However, many othermetals like As, Cd, Cr and Pb have no known phys-iological activity and may exhibit toxicity even atlow concentrations (Bruins et al. 2000; Cohen et al.2001). Long-term exposure to heavy metals maylead to many adverse health effects including a vari-ety of cancers, mental retardation and neurological,cardiovascular, kidney and bone diseases (Adriano2001; Pruss-Ustun et al. 2011).
The study area falls in the Singhbhum shearzone (SSZ) which is known for its rich mineraldeposits and production of copper and uraniumores. Although, few studies were carried out on theheavy metal distribution in the sediments, surfaceand groundwater sources and fish samples of theSubarnarekha River basin of which the study areais a part (Upadhyay et al. 2006; Giri et al. 2013;Giri and Singh 2014a, b, 2015, 2016). The stud-ies indicated the deleterious effects of the coppermining and milling activities on the environmentalcomponents.
However, practically no serious efforts has beenmade to study the heavy metal contents of agri-cultural soils in the vicinity of copper mining areasof Singhbhum shear zone. The present study aims(1) to determine the concentration of the heavymetals (As, Cd, Co, Cr, Cu, Fe, Mn, Ni, Pb, Se,V and Zn) in the agricultural soils, (2) to ascer-tain whether there was contamination with respectto these metals using various indices, and (3) toidentify the sources of the metals in the soils bymultivariate statistical analysis.
2. Materials and methods
2.1 Site description
The study was carried out in the copper miningareas of Singhbhum Shear Zone of Jharkhandwhich is known to be rich in mineral resourceslike copper, iron, uranium, gold and kyanite. Thepresent study area extends from 86◦20′ to 86◦30′Elongitudes and 22◦30′ to 22◦42′N latitudes, cover-ing an area of about 160 km2 and falls in Mosabani,Dhalbhumgarh and Ghatsila blocks of East Singhb-hum district of Jharkhand state. The climate ofthe study area is temperate. Annual rainfall is1200–1400 mm. This area is subject to the south-west monsoon and receives heavy rain (about 80%)during June to September (monsoon season). The
major crops grown in the study area are paddy,maize, pulses and some seasonal vegetables andfruits.
The Singhbhum shear zone forms an arcuatehighly deformed linear zone in the Singhbhumcrustal province and is known as one of the mostpotential sulphide bearing stretch of India. Someof the copper mining and processing entities ofthe area are at Rakha, Kendadih, Surda, Badia,Mosabani, Ghatsila and Maubhandar. The maincopper belt extends over a distance of 130 km andharbors 18% of the total copper reserves of India.The copper mineralization along Singhbhum cop-per belt is located along the Dhanjori group ofrocks at south of shear zone and Singhbhum groupof rocks at north of shear zone. The copper sulphidemineralization is associated mainly with the meta-volcanics and meta-tuff sequences of the Dhanjoriand Singhbhum Groups. The sulphide mineralsconsist predominantly of chalcopyrite, followed bypyrite and pyrrhotite, accompanied by magnetiteand minor pentlandite, millerite, violarite, spha-lerite and molybdenite. The gangue minerals arequartz, biotite, chlorite and sericite in variable pro-portions. The major rock types of the region aresoda granite, Dhanjori lavas and Epidiorite-schist(Dunn and Dey 1942; Mukherjee 1968).
2.2 Sampling and analysis
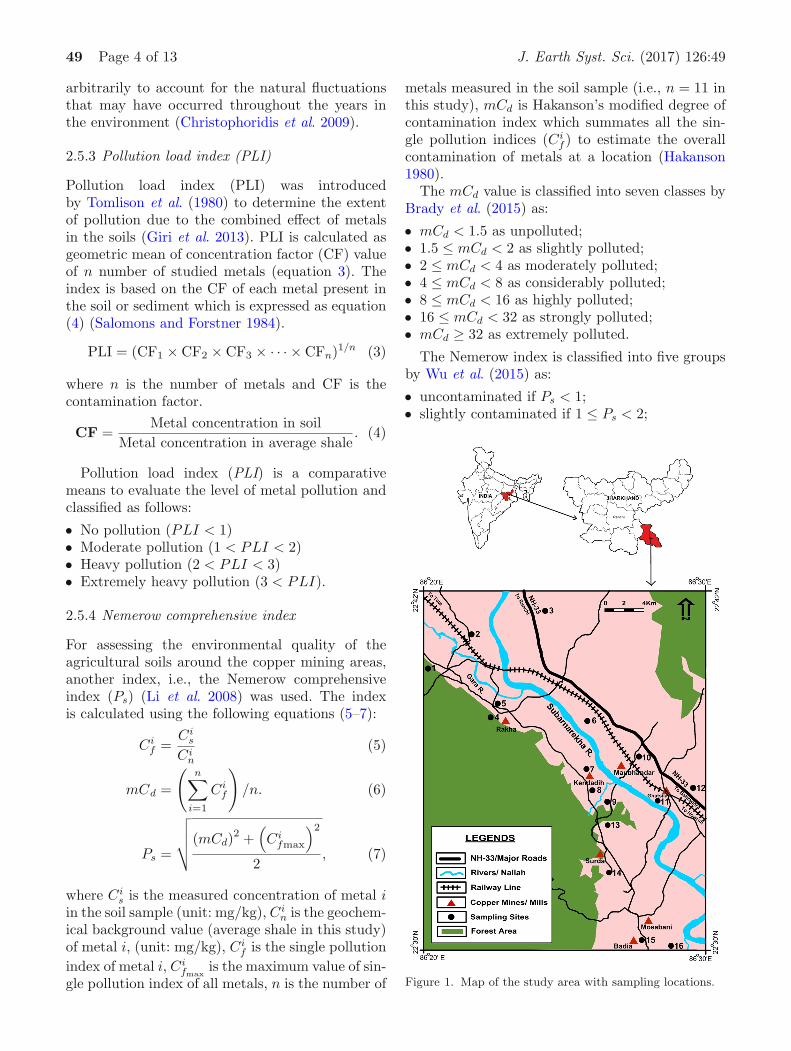
Random samples were collected from 16 locationsin the vicinity of the mining affected areas. Thesampling locations were between 0.5 and 2.5 kmfrom the mining or processing industries. Somelocations (sample nos. 2, 3 and 6) were selectedto study the effect of vehicular and other anthro-pogenic activities. The sample no. 1 served as acontrol as it was located in the forest area far fromany copper mining and processing activities. Thesamples were representative for the study area.
Each soil sample of about 1 kg was taken fromthe depths of 0–15 cm, which represented theplough layer. Then, the soil samples were packedand sealed in polyethylene bags and transportedto the laboratory for sample preparation. The sam-ples were air dried at room temperature (25–30◦C).Representative sub-sampling of the dried soils wascarried out by coning and quartering method foruniform mixing and reducing variability of the sam-ples and reducing to a desired weight (Rubio andUre 1993; Loska et al. 2004; Alloway 2013). Thenabout 100 g of the sample was taken in a porcelaindish and dried in an oven at 110◦C for 24 hr. The
J. Earth Syst. Sci. (2017) 126:49 Page 3 of 13 49
samples were powdered in a dry mortar–pestle andsieved through standard sieve of 200 mesh size (Giriet al. 2013). The samples were then subjected todigestion in microwave by the method 3052 as givenby USEPA (1996). Aliquots were preserved for theanalysis of metals. Concentrations of As, Cd, Co,Cr, Cu, Fe, Mn, Ni, Pb, V and Zn were determinedin soil samples using inductively coupled plasma-mass spectrometry (ICP-MS, Perkin Elmer ElanDRC-e).
2.3 Quality assurance and quality control
For the validation of the analytical procedure,standard reference materials (SRM) of estuarinesediment (SRM 1646a) supplied by the NationalInstitute of Standards and Technology (NIST),USA was used. The heavy metal concentrationsanalyzed in the SRMs were in good agreement withthe certificate values, which confirmed the feasibil-ity of the analytical protocols in the determinationof heavy metals in soil. The percentage of recoveryvaried from 89.4 to 109.7.
2.4 Statistical analysis
Pearson’s correlation is a bivariate correlationwhich gives some idea regarding the relationshipbetween two sets of data, and its coefficient is ameasure of the strength of the association betweenthe two variables (Ma et al. 2015). For the presentstudy, Pearson’s correlation analysis was selectedto determine the relationships among differentheavy metals. Principal component analysis (PCA)is a variation reduction technique in which a num-ber of measured parameters can be transformedinto a small number of artificial variables knownas principal components (PC). The number ofextracted PC is equal to the number of variablesincluded in the analysis; however, normally PCshaving eigen values >1 are taken into considera-tion as they explain for the maximum variance inthe observed parameter (Kolsi et al. 2013; Huanget al. 2014). Varimax rotation is applied to all theextracted principal components to reduce the con-tribution of the variables which are not significant(Closs and Nichol 1975). Each variable consideredfor PCA has a weight factor associated with it.This weight factor, also referred to as PC score,is the correlation between the original variable anda factor. A PC score close to ±1 indicates a strongcorrelation between the given variable and the fac-tor. To evaluate the validity of PCA, the Barlett’s
test of sphericity and Kaiser–Meyer–Olkin (KMO)test as a measure of sampling adequacy were takeninto consideration. Large KMO value (>0.5) andsuitable significance of Barlett’s test (p<0.05) werenecessary to ensure the validity of PCA (Chen et al.2014; Fu et al. 2014; Ma et al. 2015).
2.5 Calculation of indices to assess anthropogenicinfluence
2.5.1 Enrichment factor (EF)
In order to assess the degree of anthropogenic influ-ence with respect to metals, the enrichment factor(EF) was calculated for each metal in the soil usingthe equation (1):
EF =(CX/CFe)s(CX/CFe)c
(1)
where CX and CFe refer to the concentration ofelement X and Fe in the soil (s) and earth’s crust(c), respectively. Iron was used as reference element(Schiff and Weisberg 1999; Turner and Millward2000) and the metal concentrations were normal-ized to the textural characteristic of soils withrespect to Fe. A five-category ranking system isused in this paper to denote the degree of anthro-pogenic contamination (Sutherland 2000; Kartalet al. 2006; Giri et al. 2013). The categories are:
• EF < 2 states deficiency to minimal contamina-tion
• EF = 2–5 moderate contamination• EF = 5–20 significant contamination• EF = 20–40 very high contamination• EF > 40 extremely high contamination.
2.5.2 Geo-accumulation index (Igeo)
Pollution levels of metal in soils can also be exem-plified by the calculations of the geo-accumulationindex values put forward by Muller (1979), whichcan be evaluated by equation (2). This is a wayto assess the pollution levels in soils or sedimentswith respect to the toxic metals by comparing thepresent and past concentrations.
Igeo = log2(Cn/1.5Bn) (2)
where Cn is the measured concentration of theheavy metal n in the soil and Bn is the geochemi-cal background reference value. The reference valueused for the study was average shale and controlsoil. The constant 1.5 is introduced in the equation
49 Page 4 of 13 J. Earth Syst. Sci. (2017) 126:49
arbitrarily to account for the natural fluctuationsthat may have occurred throughout the years inthe environment (Christophoridis et al. 2009).
2.5.3 Pollution load index (PLI)
Pollution load index (PLI) was introducedby Tomlison et al. (1980) to determine the extentof pollution due to the combined effect of metalsin the soils (Giri et al. 2013). PLI is calculated asgeometric mean of concentration factor (CF) valueof n number of studied metals (equation 3). Theindex is based on the CF of each metal present inthe soil or sediment which is expressed as equation(4) (Salomons and Forstner 1984).
PLI = (CF1 × CF2 × CF3 × · · · × CFn)1/n (3)
where n is the number of metals and CF is thecontamination factor.
CF =Metal concentration in soil
Metal concentration in average shale. (4)
Pollution load index (PLI) is a comparativemeans to evaluate the level of metal pollution andclassified as follows:
• No pollution (PLI < 1)• Moderate pollution (1 < PLI < 2)• Heavy pollution (2 < PLI < 3)• Extremely heavy pollution (3 < PLI).
2.5.4 Nemerow comprehensive index
For assessing the environmental quality of theagricultural soils around the copper mining areas,another index, i.e., the Nemerow comprehensiveindex (Ps) (Li et al. 2008) was used. The indexis calculated using the following equations (5–7):
Cif =
Cis
Cin
(5)
mCd =
(n∑
i=1
Cif
)/n. (6)
Ps =
√√√√(mCd)2 +
(Ci
fmax
)2
2, (7)
where Cis is the measured concentration of metal i
in the soil sample (unit: mg/kg), Cin is the geochem-
ical background value (average shale in this study)of metal i, (unit: mg/kg), Ci
f is the single pollutionindex of metal i, Ci
fmaxis the maximum value of sin-
gle pollution index of all metals, n is the number of
metals measured in the soil sample (i.e., n = 11 inthis study), mCd is Hakanson’s modified degree ofcontamination index which summates all the sin-gle pollution indices (Ci
f ) to estimate the overallcontamination of metals at a location (Hakanson1980).
The mCd value is classified into seven classes byBrady et al. (2015) as:
• mCd < 1.5 as unpolluted;• 1.5 ≤ mCd < 2 as slightly polluted;• 2 ≤ mCd < 4 as moderately polluted;• 4 ≤ mCd < 8 as considerably polluted;• 8 ≤ mCd < 16 as highly polluted;• 16 ≤ mCd < 32 as strongly polluted;• mCd ≥ 32 as extremely polluted.
The Nemerow index is classified into five groupsby Wu et al. (2015) as:
• uncontaminated if Ps < 1;• slightly contaminated if 1 ≤ Ps < 2;
Figure 1. Map of the study area with sampling locations.
J. Earth Syst. Sci. (2017) 126:49 Page 5 of 13 49
• moderately contaminated if 2 ≤ Ps < 3;• strongly contaminated if 3 ≤ Ps < 5; and• seriously contaminated if Ps ≥ 5 (Ma et al.
2015).
3. Assessment of potential ecological risk
Potential ecological risk assessment was proposedby Hakanson (1980) to assess the degree of heavymetal pollution in soil or sediments, according tothe toxicity of heavy metals and the response ofthe environment. Risk index (RI) is introduced toevaluate the contamination degree of the soils con-sidering the effect of multiple metals. RI is definedaccording to equation (8) as summation of Ei
r ofheavy metals where Ei
r is the monomial poten-tial ecological risk factor defined by equation (9).
RI =∑
Eir (8)
Eir = Ti
Ci
C0(9)
Ti is the toxic response factor for the metals andthe values for As, Cd, Cu, Pb, Ni, Zn and Cr are
10, 30, 5, 5, 5, 1 and 2, respectively (Hilton et al.1985; Wang et al. 2011). Ci is the concentration ofmetals in the soil, and C0 is a reference value formetals. In the present study, the concentrations ofthe metals of the control site are taken as referencevalues.
The degree of Eir is classified as follows: Ei
r < 40,low risk; 40 ≤ Ei
r < 80, moderate risk; 80 ≤ Eir <
160, considerable risk; 160 ≤ Eir < 320, high risk;
and Eir ≥ 320, very high risk. The potential eco-
logical RI can be grouped into four categories withslight modification according to the recommendedvalues by Wu et al. (2015): RI < 100, low risk;100 ≤ RI < 200, moderate risk; 200 ≤ RI < 400,considerable risk; and RI ≥ 400, very high risk.
4. Results and discussion
4.1 Distribution of metals in soil
Large variations were observed in the concentra-tion of the metals collected from the 16 locationsaround the copper mining areas of SSZ (figure 1).
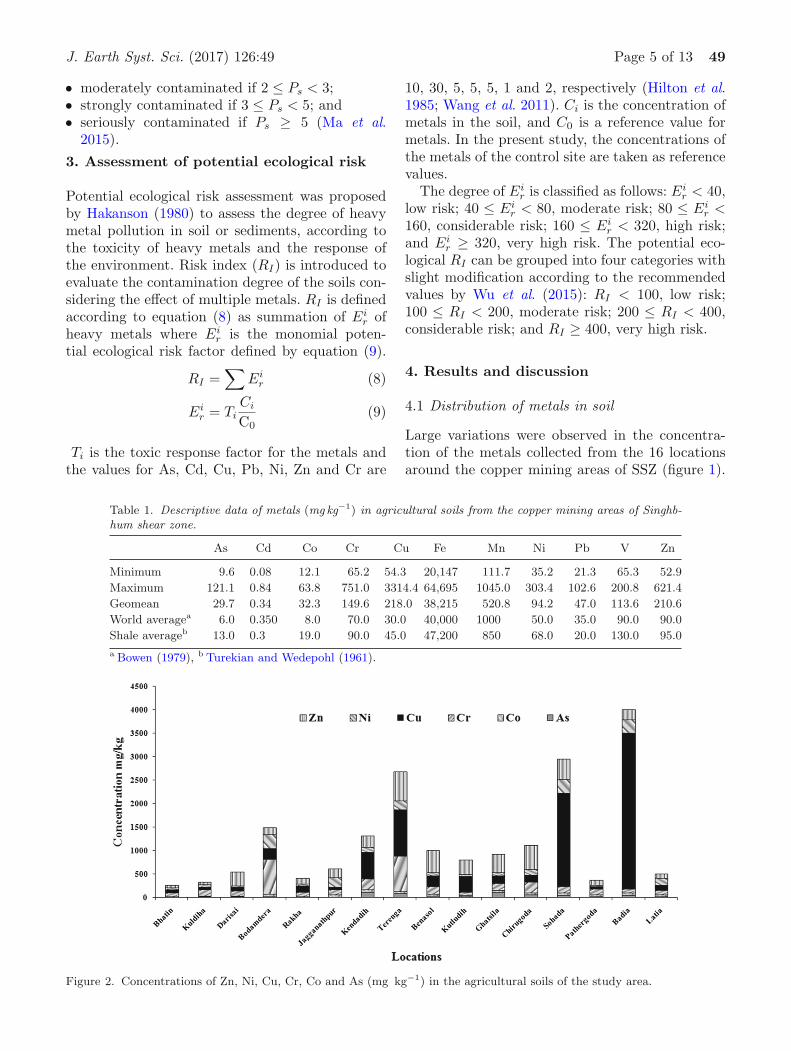
Table 1. Descriptive data of metals (mg kg−1) in agricultural soils from the copper mining areas of Singhb-hum shear zone.
As Cd Co Cr Cu Fe Mn Ni Pb V Zn
Minimum 9.6 0.08 12.1 65.2 54.3 20,147 111.7 35.2 21.3 65.3 52.9
Maximum 121.1 0.84 63.8 751.0 3314.4 64,695 1045.0 303.4 102.6 200.8 621.4
Geomean 29.7 0.34 32.3 149.6 218.0 38,215 520.8 94.2 47.0 113.6 210.6
World averagea 6.0 0.350 8.0 70.0 30.0 40,000 1000 50.0 35.0 90.0 90.0
Shale averageb 13.0 0.3 19.0 90.0 45.0 47,200 850 68.0 20.0 130.0 95.0
a Bowen (1979), b Turekian and Wedepohl (1961).
Figure 2. Concentrations of Zn, Ni, Cu, Cr, Co and As (mg kg−1) in the agricultural soils of the study area.
49 Page 6 of 13 J. Earth Syst. Sci. (2017) 126:49
Table
2.
Com
pari
son
ofm
etals
(mgkg
−1)
inagr
icultura
lso
ils
with
oth
erst
udie
s.
Loca
tion
As
Cd
Co
Cr
Cu
Fe
Mn
Ni
Pb
VZn
Ref
eren
ces
Zhangjiakou
(Chin
a)
8.5
10.1
38
56.7
30.9
24.5
20.5
68.1
Lia
ng
etal.
(2015)
Lari
ssa
(Gre
ek)
17.1
0.5
245.6
94.0
165.3
15.2
97.6
Skord
as
etal.
(2013)
Manis
a(T
urk
ey)
22.3
0.1
438.7
98.2
12.9
54.4
Cola
k(2
012)
Chen
zhou
(Chin
a)
231
2.1
470.1
36.0
45.7
204
244
Ma
etal.
(2015)
Qin
gdao
(Chin
a)
0.2
982.2
62.1
83.7
250.2
208.8
Xu
etal.
(2016)
Zhej
iang
(Chin
a)
15.5
0.7
247.7
68.6
Liu
etal.
(2013)
Zhangjiagang
(Chin
a)
8.7
40.1
764.3
33.3
27.3
Hu
etal.
(2016)
Sukin
da
(India
)11336
6.2
84.6
Kum
ar
etal.
(2014)
Kom
bat
(Nam
ibia
)5.1
20
108
13,8
73
760
9.4
119
45
Mileu
snic
etal.
(2014)
Mie
dzi
anka
(Pola
nd)
46
1.4
34.1
209
1334
19.4
46
82
Ga�lu
szka
etal.
(2015)
Shahro
ud
(Ira
n)
0.3
83.7
24.3
33.3
18.1
80.4
Mir
zaei
etal.
(2015)
Zahee
rabad
(India
)3.3
58.6
203.1
118.4
31.5
14.5
482.6
99.3
Sakra
met
al.
(2015)
Bogra
(Bangla
des
h)
36
6.3
54
57
83
97
Isla
met
al.
(2015)
East
Sin
ghbhum
(India
)29.7
0.3
432.3
149.6
218.0
38,2
15
520.8
94.2
47.0
113.6
210.6
Pre
sent
study
The minimum, maximum and geometric meanconcentrations of the metals in the study area areprovided in table 1. As frequently observed in theenvironmental samples, the concentrations of met-als in the soil were better elucidated by the lognormal distribution and thus, the central tendencywas represented by geometric mean. The geometricmean concentration of As, Cd, Co, Cr, Cu, Fe, Mn,Ni, Pb, V and Zn was 29.7, 0.34, 32.3, 149.6, 218,38215, 520.8, 94.2, 47, 113.6 and 210.6 mg kg−1,respectively. The sequence of the metal concentra-tion was generally as Fe > Mn > Cu > Zn > Cr >V > Ni > As > Pb > Co > Cd. The metal con-centrations in the soil of the study area exceededthe values of the average concentration of metals inthe shale (Turekian and Wedepohl 1961) and worldaverage (Bowen 1979) for almost all the metals. Asthe study area is characterized by the presence ofmetal bearing formations accompanied with min-ing and industrial operations, it is obvious to haveelevated levels of metals in the soils (Forstner andWiltman 1983; Preston and Chester 1996). How-ever, the amplification was more prominent for As,Co, Cr, Cu, Ni and Zn. The concentrations of thesemetals in the soils are given in figure 2. The con-centrations of metals were observed to be generallyhigher at the locations which were near to exist-ing or abandoned copper mining and processingunits, e.g., Badia, Sohada, Terenga, Kendadih andBodamdera.
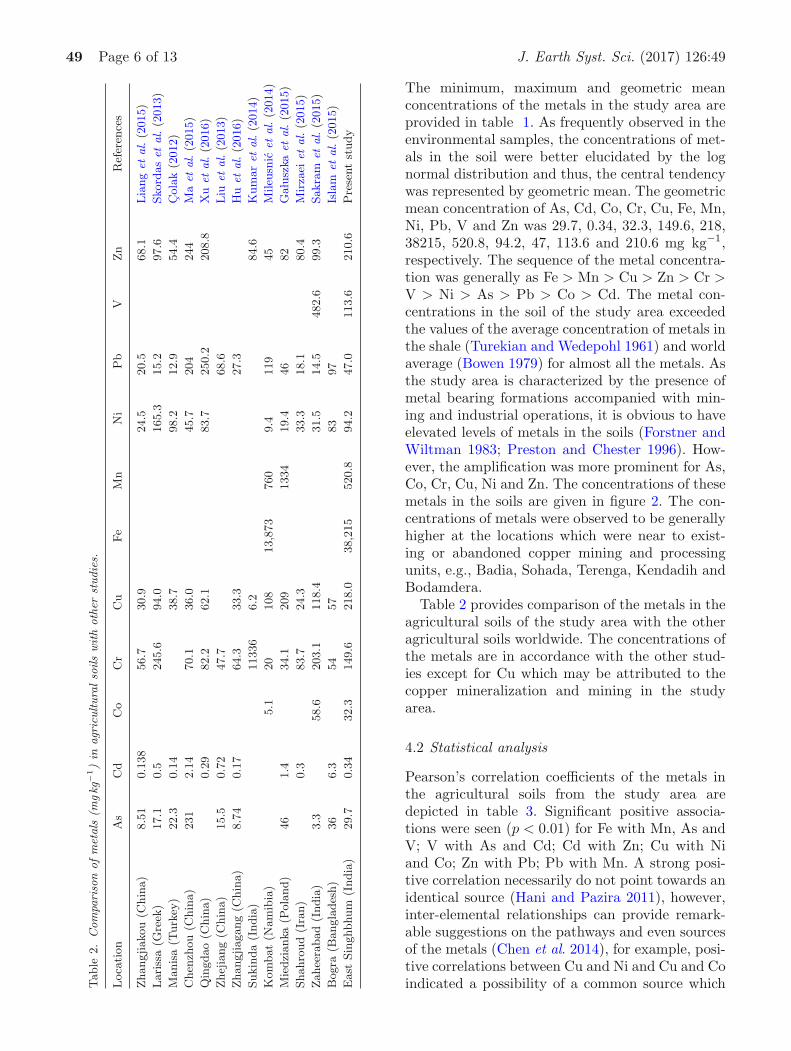
Table 2 provides comparison of the metals in theagricultural soils of the study area with the otheragricultural soils worldwide. The concentrations ofthe metals are in accordance with the other stud-ies except for Cu which may be attributed to thecopper mineralization and mining in the studyarea.
4.2 Statistical analysis
Pearson’s correlation coefficients of the metals inthe agricultural soils from the study area aredepicted in table 3. Significant positive associa-tions were seen (p < 0.01) for Fe with Mn, As andV; V with As and Cd; Cd with Zn; Cu with Niand Co; Zn with Pb; Pb with Mn. A strong posi-tive correlation necessarily do not point towards anidentical source (Hani and Pazira 2011), however,inter-elemental relationships can provide remark-able suggestions on the pathways and even sourcesof the metals (Chen et al. 2014), for example, posi-tive correlations between Cu and Ni and Cu and Coindicated a possibility of a common source which
J. Earth Syst. Sci. (2017) 126:49 Page 7 of 13 49
Table 3. Pearson correlation matrix between different metals in the soils of copper mining areas of Singhbhumshear zone (n = 16).
Mn Cu Pb Zn Ni Co As Cd Cr V Fe
Mn 1.000 0.019 0.706* 0.584* 0.244 0.332 0.591* 0.482* 0.454* 0.688* 0.754*
Cu 1.000 −0.006 0.222 0.667* 0.511* 0.234 0.387** 0.004 0.263 0.234
Pb 1.000 0.844* 0.199 0.255 0.461* 0.697* 0.665* 0.741* 0.685*
Zn 1.000 0.209 0.166 0.561* 0.856* 0.356** 0.732* 0.629*
Ni 1.000 0.832* 0.108 0.237 0.446* 0.257 0.275
Co 1.000 0.251 0.195 0.429** 0.369** 0.421**
As 1.000 0.580 0.270 0.771* 0.770*
Cd 1.000 0.200 0.808* 0.696*
Cr 1.000 0.398** 0.458*
V 1.000 0.932*
Fe 1.000
* Correlation significant at the 0.01 level (two tailed).** Correlation significant at the 0.05 level (two tailed).
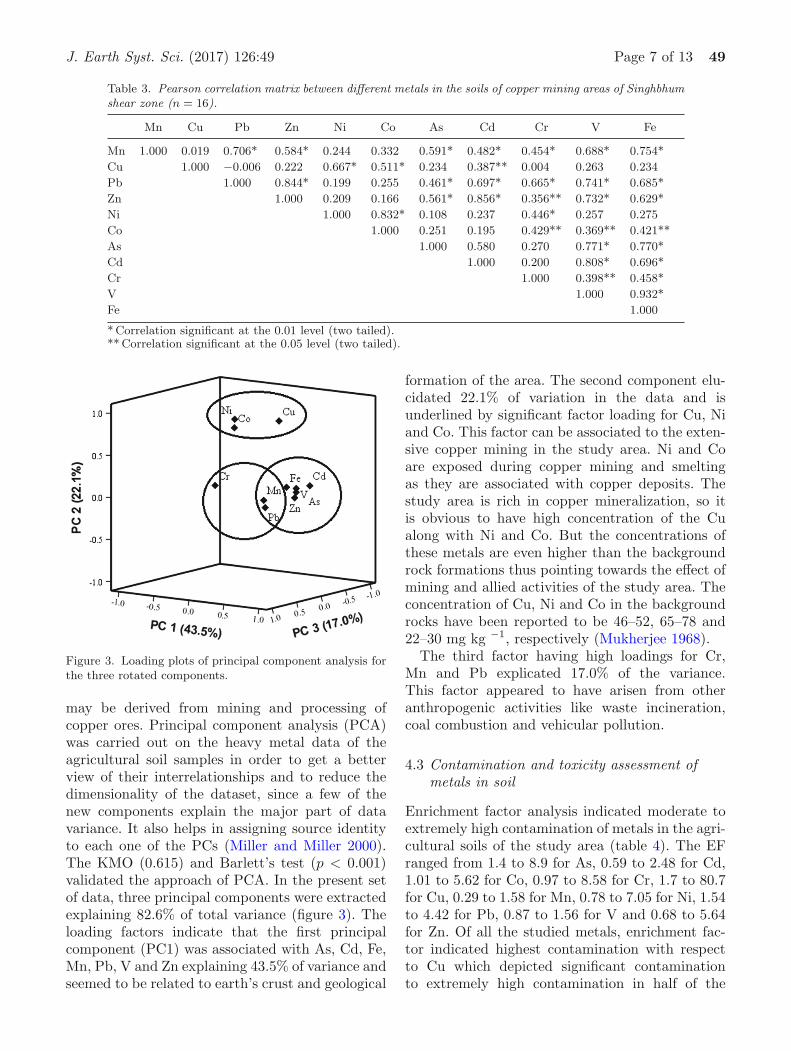
Figure 3. Loading plots of principal component analysis forthe three rotated components.
may be derived from mining and processing ofcopper ores. Principal component analysis (PCA)was carried out on the heavy metal data of theagricultural soil samples in order to get a betterview of their interrelationships and to reduce thedimensionality of the dataset, since a few of thenew components explain the major part of datavariance. It also helps in assigning source identityto each one of the PCs (Miller and Miller 2000).The KMO (0.615) and Barlett’s test (p < 0.001)validated the approach of PCA. In the present setof data, three principal components were extractedexplaining 82.6% of total variance (figure 3). Theloading factors indicate that the first principalcomponent (PC1) was associated with As, Cd, Fe,Mn, Pb, V and Zn explaining 43.5% of variance andseemed to be related to earth’s crust and geological
formation of the area. The second component elu-cidated 22.1% of variation in the data and isunderlined by significant factor loading for Cu, Niand Co. This factor can be associated to the exten-sive copper mining in the study area. Ni and Coare exposed during copper mining and smeltingas they are associated with copper deposits. Thestudy area is rich in copper mineralization, so itis obvious to have high concentration of the Cualong with Ni and Co. But the concentrations ofthese metals are even higher than the backgroundrock formations thus pointing towards the effect ofmining and allied activities of the study area. Theconcentration of Cu, Ni and Co in the backgroundrocks have been reported to be 46–52, 65–78 and22–30 mg kg −1, respectively (Mukherjee 1968).
The third factor having high loadings for Cr,Mn and Pb explicated 17.0% of the variance.This factor appeared to have arisen from otheranthropogenic activities like waste incineration,coal combustion and vehicular pollution.
4.3 Contamination and toxicity assessment ofmetals in soil
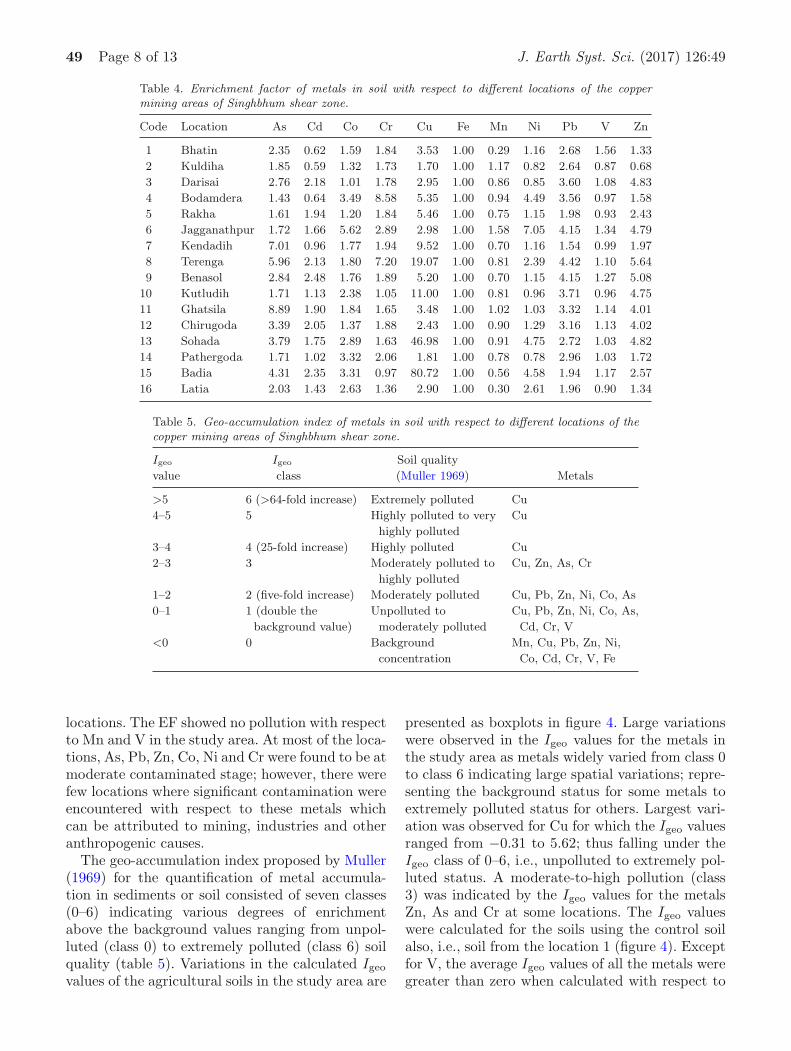
Enrichment factor analysis indicated moderate toextremely high contamination of metals in the agri-cultural soils of the study area (table 4). The EFranged from 1.4 to 8.9 for As, 0.59 to 2.48 for Cd,1.01 to 5.62 for Co, 0.97 to 8.58 for Cr, 1.7 to 80.7for Cu, 0.29 to 1.58 for Mn, 0.78 to 7.05 for Ni, 1.54to 4.42 for Pb, 0.87 to 1.56 for V and 0.68 to 5.64for Zn. Of all the studied metals, enrichment fac-tor indicated highest contamination with respectto Cu which depicted significant contaminationto extremely high contamination in half of the
49 Page 8 of 13 J. Earth Syst. Sci. (2017) 126:49
Table 4. Enrichment factor of metals in soil with respect to different locations of the coppermining areas of Singhbhum shear zone.
Code Location As Cd Co Cr Cu Fe Mn Ni Pb V Zn
1 Bhatin 2.35 0.62 1.59 1.84 3.53 1.00 0.29 1.16 2.68 1.56 1.33
2 Kuldiha 1.85 0.59 1.32 1.73 1.70 1.00 1.17 0.82 2.64 0.87 0.68
3 Darisai 2.76 2.18 1.01 1.78 2.95 1.00 0.86 0.85 3.60 1.08 4.83
4 Bodamdera 1.43 0.64 3.49 8.58 5.35 1.00 0.94 4.49 3.56 0.97 1.58
5 Rakha 1.61 1.94 1.20 1.84 5.46 1.00 0.75 1.15 1.98 0.93 2.43
6 Jagganathpur 1.72 1.66 5.62 2.89 2.98 1.00 1.58 7.05 4.15 1.34 4.79
7 Kendadih 7.01 0.96 1.77 1.94 9.52 1.00 0.70 1.16 1.54 0.99 1.97
8 Terenga 5.96 2.13 1.80 7.20 19.07 1.00 0.81 2.39 4.42 1.10 5.64
9 Benasol 2.84 2.48 1.76 1.89 5.20 1.00 0.70 1.15 4.15 1.27 5.08
10 Kutludih 1.71 1.13 2.38 1.05 11.00 1.00 0.81 0.96 3.71 0.96 4.75
11 Ghatsila 8.89 1.90 1.84 1.65 3.48 1.00 1.02 1.03 3.32 1.14 4.01
12 Chirugoda 3.39 2.05 1.37 1.88 2.43 1.00 0.90 1.29 3.16 1.13 4.02
13 Sohada 3.79 1.75 2.89 1.63 46.98 1.00 0.91 4.75 2.72 1.03 4.82
14 Pathergoda 1.71 1.02 3.32 2.06 1.81 1.00 0.78 0.78 2.96 1.03 1.72
15 Badia 4.31 2.35 3.31 0.97 80.72 1.00 0.56 4.58 1.94 1.17 2.57
16 Latia 2.03 1.43 2.63 1.36 2.90 1.00 0.30 2.61 1.96 0.90 1.34
Table 5. Geo-accumulation index of metals in soil with respect to different locations of thecopper mining areas of Singhbhum shear zone.
Igeovalue
Igeoclass
Soil quality
(Muller 1969) Metals
>5 6 (>64-fold increase) Extremely polluted Cu
4–5 5 Highly polluted to very
highly polluted
Cu
3–4 4 (25-fold increase) Highly polluted Cu
2–3 3 Moderately polluted to
highly polluted
Cu, Zn, As, Cr
1–2 2 (five-fold increase) Moderately polluted Cu, Pb, Zn, Ni, Co, As
0–1 1 (double the
background value)
Unpolluted to
moderately polluted
Cu, Pb, Zn, Ni, Co, As,
Cd, Cr, V
<0 0 Background
concentration
Mn, Cu, Pb, Zn, Ni,
Co, Cd, Cr, V, Fe
locations. The EF showed no pollution with respectto Mn and V in the study area. At most of the loca-tions, As, Pb, Zn, Co, Ni and Cr were found to be atmoderate contaminated stage; however, there werefew locations where significant contamination wereencountered with respect to these metals whichcan be attributed to mining, industries and otheranthropogenic causes.
The geo-accumulation index proposed by Muller(1969) for the quantification of metal accumula-tion in sediments or soil consisted of seven classes(0–6) indicating various degrees of enrichmentabove the background values ranging from unpol-luted (class 0) to extremely polluted (class 6) soilquality (table 5). Variations in the calculated Igeovalues of the agricultural soils in the study area are
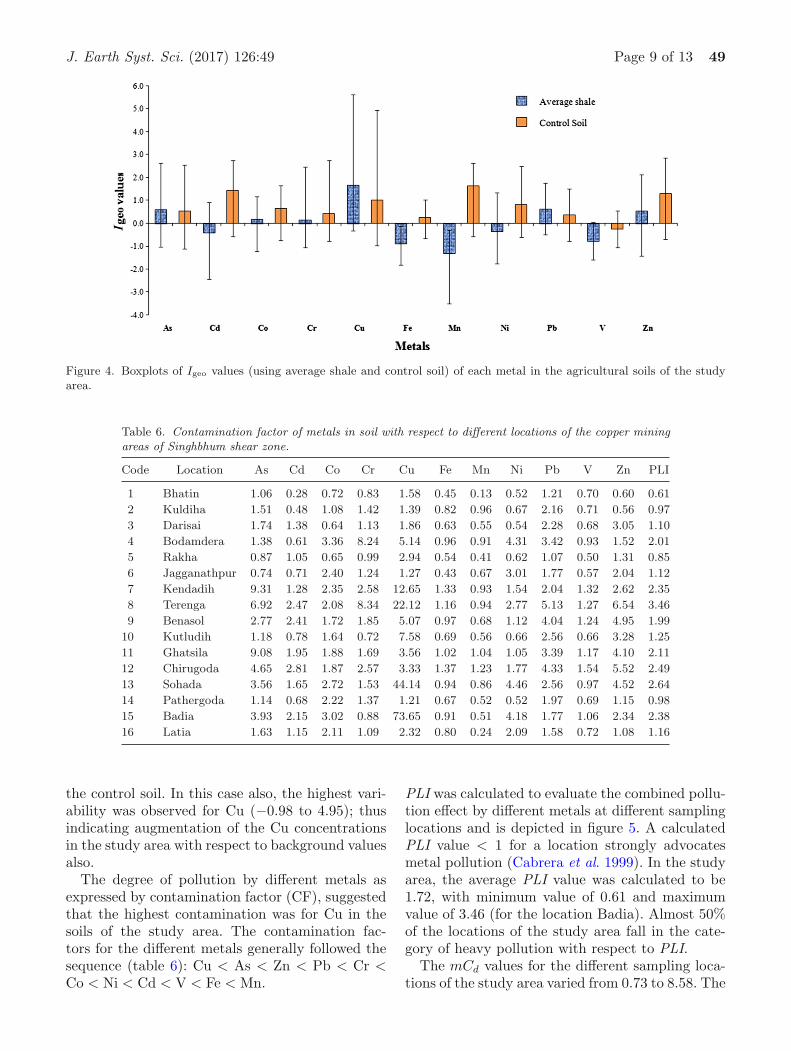
presented as boxplots in figure 4. Large variationswere observed in the Igeo values for the metals inthe study area as metals widely varied from class 0to class 6 indicating large spatial variations; repre-senting the background status for some metals toextremely polluted status for others. Largest vari-ation was observed for Cu for which the Igeo valuesranged from −0.31 to 5.62; thus falling under theIgeo class of 0–6, i.e., unpolluted to extremely pol-luted status. A moderate-to-high pollution (class3) was indicated by the Igeo values for the metalsZn, As and Cr at some locations. The Igeo valueswere calculated for the soils using the control soilalso, i.e., soil from the location 1 (figure 4). Exceptfor V, the average Igeo values of all the metals weregreater than zero when calculated with respect to
J. Earth Syst. Sci. (2017) 126:49 Page 9 of 13 49
Figure 4. Boxplots of Igeo values (using average shale and control soil) of each metal in the agricultural soils of the studyarea.
Table 6. Contamination factor of metals in soil with respect to different locations of the copper miningareas of Singhbhum shear zone.
Code Location As Cd Co Cr Cu Fe Mn Ni Pb V Zn PLI
1 Bhatin 1.06 0.28 0.72 0.83 1.58 0.45 0.13 0.52 1.21 0.70 0.60 0.61
2 Kuldiha 1.51 0.48 1.08 1.42 1.39 0.82 0.96 0.67 2.16 0.71 0.56 0.97
3 Darisai 1.74 1.38 0.64 1.13 1.86 0.63 0.55 0.54 2.28 0.68 3.05 1.10
4 Bodamdera 1.38 0.61 3.36 8.24 5.14 0.96 0.91 4.31 3.42 0.93 1.52 2.01
5 Rakha 0.87 1.05 0.65 0.99 2.94 0.54 0.41 0.62 1.07 0.50 1.31 0.85
6 Jagganathpur 0.74 0.71 2.40 1.24 1.27 0.43 0.67 3.01 1.77 0.57 2.04 1.12
7 Kendadih 9.31 1.28 2.35 2.58 12.65 1.33 0.93 1.54 2.04 1.32 2.62 2.35
8 Terenga 6.92 2.47 2.08 8.34 22.12 1.16 0.94 2.77 5.13 1.27 6.54 3.46
9 Benasol 2.77 2.41 1.72 1.85 5.07 0.97 0.68 1.12 4.04 1.24 4.95 1.99
10 Kutludih 1.18 0.78 1.64 0.72 7.58 0.69 0.56 0.66 2.56 0.66 3.28 1.25
11 Ghatsila 9.08 1.95 1.88 1.69 3.56 1.02 1.04 1.05 3.39 1.17 4.10 2.11
12 Chirugoda 4.65 2.81 1.87 2.57 3.33 1.37 1.23 1.77 4.33 1.54 5.52 2.49
13 Sohada 3.56 1.65 2.72 1.53 44.14 0.94 0.86 4.46 2.56 0.97 4.52 2.64
14 Pathergoda 1.14 0.68 2.22 1.37 1.21 0.67 0.52 0.52 1.97 0.69 1.15 0.98
15 Badia 3.93 2.15 3.02 0.88 73.65 0.91 0.51 4.18 1.77 1.06 2.34 2.38
16 Latia 1.63 1.15 2.11 1.09 2.32 0.80 0.24 2.09 1.58 0.72 1.08 1.16
the control soil. In this case also, the highest vari-ability was observed for Cu (−0.98 to 4.95); thusindicating augmentation of the Cu concentrationsin the study area with respect to background valuesalso.
The degree of pollution by different metals asexpressed by contamination factor (CF), suggestedthat the highest contamination was for Cu in thesoils of the study area. The contamination fac-tors for the different metals generally followed thesequence (table 6): Cu < As < Zn < Pb < Cr <Co < Ni < Cd < V < Fe < Mn.
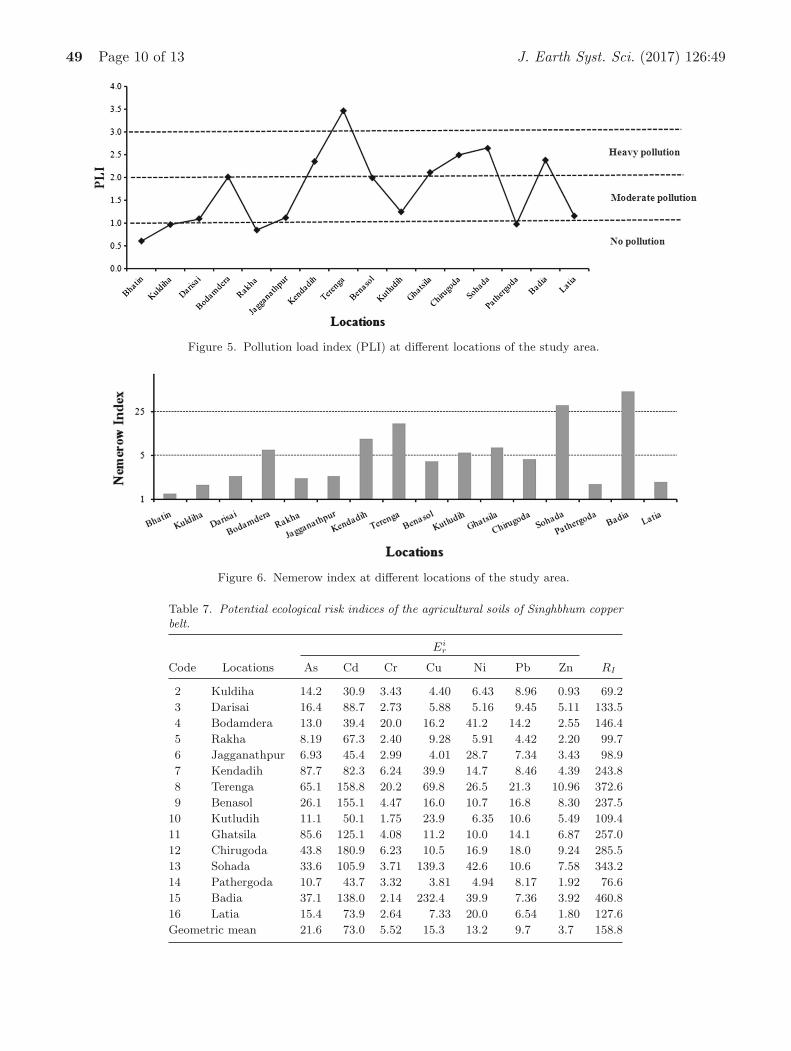
PLI was calculated to evaluate the combined pollu-tion effect by different metals at different samplinglocations and is depicted in figure 5. A calculatedPLI value < 1 for a location strongly advocatesmetal pollution (Cabrera et al. 1999). In the studyarea, the average PLI value was calculated to be1.72, with minimum value of 0.61 and maximumvalue of 3.46 (for the location Badia). Almost 50%of the locations of the study area fall in the cate-gory of heavy pollution with respect to PLI.
The mCd values for the different sampling loca-tions of the study area varied from 0.73 to 8.58. The
49 Page 10 of 13 J. Earth Syst. Sci. (2017) 126:49
Figure 5. Pollution load index (PLI) at different locations of the study area.
Figure 6. Nemerow index at different locations of the study area.
Table 7. Potential ecological risk indices of the agricultural soils of Singhbhum copperbelt.
Eir
Code Locations As Cd Cr Cu Ni Pb Zn RI
2 Kuldiha 14.2 30.9 3.43 4.40 6.43 8.96 0.93 69.2
3 Darisai 16.4 88.7 2.73 5.88 5.16 9.45 5.11 133.5
4 Bodamdera 13.0 39.4 20.0 16.2 41.2 14.2 2.55 146.4
5 Rakha 8.19 67.3 2.40 9.28 5.91 4.42 2.20 99.7
6 Jagganathpur 6.93 45.4 2.99 4.01 28.7 7.34 3.43 98.9
7 Kendadih 87.7 82.3 6.24 39.9 14.7 8.46 4.39 243.8
8 Terenga 65.1 158.8 20.2 69.8 26.5 21.3 10.96 372.6
9 Benasol 26.1 155.1 4.47 16.0 10.7 16.8 8.30 237.5
10 Kutludih 11.1 50.1 1.75 23.9 6.35 10.6 5.49 109.4
11 Ghatsila 85.6 125.1 4.08 11.2 10.0 14.1 6.87 257.0
12 Chirugoda 43.8 180.9 6.23 10.5 16.9 18.0 9.24 285.5
13 Sohada 33.6 105.9 3.71 139.3 42.6 10.6 7.58 343.2
14 Pathergoda 10.7 43.7 3.32 3.81 4.94 8.17 1.92 76.6
15 Badia 37.1 138.0 2.14 232.4 39.9 7.36 3.92 460.8
16 Latia 15.4 73.9 2.64 7.33 20.0 6.54 1.80 127.6
Geometric mean 21.6 73.0 5.52 15.3 13.2 9.7 3.7 158.8
J. Earth Syst. Sci. (2017) 126:49 Page 11 of 13 49
locations were placed in the classes of ‘unpolluted’(mCd < 1.5) to ‘highly polluted’ (8 ≤ mCd ≤16) as per the classification of mCd. The averageimpact of all the measured metals is considered inthe calculation of mCd and thus the contributionof one metal is diminished. As a consequence, theskewness will be meager for the mCd values evenif the soils are highly contaminated with one ofthe metals. The same is depicted in the presentstudy where the soils are highly contaminated withCu. But in Nemerow index, the impact of one sin-gle metal is quantified in a much more considerateway as it considers both the average and maximumcontamination factors as per equation (7) (Bradyet al. 2015). The Nemerow index values for the var-ious locations of the study area ranged from 1.23to 52.4 (figure 6) indicating seriously contaminatedstatus (Ps ≥ 5) at nearly 50% of the locations.Thus, the findings, taking into account of EF,Igeo, CF, PLI and Nemerow index, confirm thatmetal pollution in the study area is moderatelyto extremely serious varying between the loca-tions and Cu being the most concerned metal. Thehighest degree of contamination was encounteredat the locations near Cu mining and processingunits.
The geometric mean Eir values for As, Cd, Cr,
Cu, Ni, Pb and Zn were 22.7, 80.1, 4.2, 16.5, 14.1,10.2 and 4.1, respectively, suggesting considerablerisk for Cd. All the other metals were in the lowrisk category (table 7). The RI ranged from 69.2to 460.8 (geomean 172.5) representing moderaterisk in the study area. Referring to the RI categorymentioned before, one sampling site was classifiedinto very high risk and six sampling sites wereclassified into considerable risk. The potential eco-logical risks of other sites were low to moderate.
5. Conclusions
The levels of the metals in the agricultural soils ofthe copper mining areas of the Singhbhum shearzone were higher than the average shale and worldaverage values for most of the cases. The high con-centration of metals in the soils can be attributedto both natural and anthropogenic factors whichare three clearly illustrated by the multivariateanalysis. PCA resulted in extraction of three fac-tors explaining 82.6% of the data variability outof which two indicated human activities and onefactor indicated geogenic sources. The enrichment
factor and Igeo values indicated very high contam-ination with respect to Cu followed by As and Znin the agricultural soils of the study area. The EFdepicted least pollution with respect to Mn and V.The combined pollution effect of different metalswas evaluated using PLI, RI and Nemerow index,which revealed that 50% of the locations were inextremely polluted status with respect to metals.Only 25% of the locations could qualify to beplaced in the uncontaminated category. The loca-tions which were in close proximity to the existingor abandoned copper mining and processing unitsshowed higher levels of metal pollution as com-pared to other locations and out of all the studiedmetals, Cu was the main metal of concern.
From the estimation of metal concentration inthe agricultural soil samples collected from thisstudy, we obtained a better knowledge regardingthe impact of the copper mining and process-ing operations on the environment. Consequently,heavy metal concentrations in the soils should beperiodically monitored and improved soil manage-ment practices are required to minimize possibleimpacts.
Acknowledgements
The authors are grateful to the Department ofScience and Technology, Government of India, forproviding the necessary funding for the studyunder the DST-Young Scientist Scheme (GrantNo. YSS/2015/001211). Also authors are thank-ful to the Director and Environment Assessmentand Remediation Section (NREM), CSIR–CentralInstitute of Mining and Fuel Research, Dhanbadfor providing the necessary laboratory facilities andother logistic support for the study.
References
Adriano D C 2001 Trace elements in terrestrial environ-ments; 2nd edn, Springer, Berlin.
Alloway B J 2013 Heavy metals in soils; Springer, Berlin.Borgese L, Federici S, Zacco A, Gianoncelli A, Rizzo L,
Smith D R, Donna F, Lucchini R, Depero L E and Bon-tempi E 2013 Metal fractionation in soils and assessmentof environmental contamination in Vallecamonica, Italy;Environ. Sci. Pollut. Res. 20 5067–5075.
Bowen H J M 1979 Environmental chemistry of elements;Academic Press, New York.
Brady J, Ayoko G, Martens W and Goonetilleke A 2015Development of a hybrid pollution index for heavy met-als in marine and estuarine sediments; Environ. Monit.Assess. 187(5) 1–14.
49 Page 12 of 13 J. Earth Syst. Sci. (2017) 126:49
Bruins M R, Kapil S and Oehme F W 2000 Microbial resis-tance to metals in the environment; Ecotoxicol. Environ.Saf. 45(3) 198–207.
Cabrera F, Clemente L, Diaz Barrientos E, Lopez R andMurillo J M 1999 Heavy metal pollution of soils affectedby the Guadiamar toxic flood; Sci. Total Environ. 242117–129.
Cao H B, Chen J J, Zhang J, Zhang H, Qiao L and MenY 2010 Heavy metals in rice and garden vegetables andtheir potential health risks to inhabitants in the vicinity ofan industrial zone in Jiangsu, China; J. Environ. Sci. 221792–1799.
Chen H, Lu X, Li L Y, Gao T and Chang Y 2014 Metalcontamination in campus dust of Xi’an, China: A studybased on multivariate statistics and spatial distribution;Sci. Total Environ. 484 27–35.
Christophoridis C, Dedepsidis D and Fytianos K 2009 Occur-rence and distribution of selected toxic metals in thesurface sediments of Thermaikos Gulf, N. Greece. Assess-ment using pollution indicators; J. Hazard. Mater. 1681082–1091.
Closs L G and Nichol I 1975 The role of factor and regressionanalysis in the interpretation of geochemical Reconnais-sance data; Can. J. Earth Sci. 12(8) 1316–1330.
Cohen T, Hee S and Ambrose R 2001 Trace metals in fish andinvertebrates of three California coastal wetlands; Mar.Pollut. Bull. 42 232–242.
Colak M 2012 Heavy metal concentrations in sultana cul-tivation soils and sultana raisins from Manisa (Turkey);Environ. Earth Sci. 67 695–712.
Dunn J A and Dey A K 1942 The geology and petrologyof eastern Singhbhum and surrounding areas; 69 Govern-ment of India Press.
Forstner U and Wiltman G T W 1983 Metal pollution inaquatic environment ; Springer, Berlin.
Fu J, Zhao C P, Luo Y P, Liu C S, Kyzas G Z, Luo Y, ZhaoD Y, An S Q and Zhu H L 2014 Heavy metals in surfacesediments of the Jialu River, China: Their relations toenvironmental factors; J. Hazard. Mater. 270 102–109.
Ga�luszka A, Migaszewski Z M, Do�legowska S, Michalik Aand Duczmal-Czernikiewicz A 2015 Geochemical back-ground of potentially toxic trace elements in soils of thehistoric copper mining area: A case study from MiedziankaMt., Holy Cross Mountains, south-central Poland; Envi-ron. Earth Sci. 74(6) 4589–4605.
Giri S, Singh A K and Tewary B K 2013 Source and distri-bution of metals in bed sediments of Subarnarekha River,India; Environ. Earth Sci. 70(7) 3381–3392.
Giri S and Singh A K 2014a Assessment of human health riskfor heavy metals in fish and shrimp collected from Sub-arnarekha River, India; Int. J. Environ. Health Res. 24(5)429–449.
Giri S and Singh A K 2014b Risk assessment, statisticalsource identification and seasonal fluctuation of dissolvedmetals in the Subarnarekha River, India; J. Hazard.Mater. 265 305–314.
Giri S and Singh A K 2015 Human health risk assessmentvia drinking water pathway due to metal contaminationin the groundwater of Subarnarekha River Basin, India;Environ. Monit. Assess. 187(3) 1–14.
Giri S and Singh A K 2016 Spatial distribution ofmetal(loid)s in groundwater of a mining dominated area:
Recognising metal(loid)s sources and assessing carcino-genic and non-carcinogenic human health risk; Int. J.Environ. Anal. Chem. 96(14) 1313–1330.
Hakanson L 1980 An ecological risk index for aquaticpollution control. A sedimentological approach; WaterRes. 14(8) 975–1001.
Hani A and Pazira E 2011 Heavy metals assessment andidentification of their sources in agricultural soils ofsouthern Tehran, Iran; Environ. Monit. Assess. 176(1–4)677–691.
Hilton J, Davison W and Ochsenbein U 1985 A mathematicalmodel for analysis of sediment coke data; Chem. Geol. 48281–291.
Hu W, Huang B, He Y and Kalkhajeh Y K 2016 Assess-ment of potential health risk of heavy metals in soils froma rapidly developing region of China; Human Ecol. RiskAssess.: Int. J. 22(1) 211–225.
Huang G, Chen Z and Sun J 2014 Water quality assessmentand hydrochemical characteristics of groundwater on theaspect of metals in an old town, Foshan, South China;J.Earth Syst. Sci. 123(1) 91–100.
Islam M S, Ahmed M K, Habibullah-Al-Mamun M andRaknuzzaman M 2015 Trace elements in different land usesoils of Bangladesh and potential ecological risk; Environ.Monit. Assess. 187(9) 1–11.
Ji K, Kim J, Lee M, Park S, Kwon H J, Cheong H K, Jang JY, Kim D S, Yu S, Kim Y W, Lee K Y, Yang S O, JhungI J, YangW H, Paek D H, Hong Y C and Choi K 2013Assessment of exposure to heavy metals and health risksamong residents near abandoned metal mines in Goseong,Korea; Environ. Pollut. 178 322–328.
Kartal S, Aydin Z and Tokalioglu S 2006 Fractionation ofmetals in street sediment samples by using the BCRsequential extraction procedure and multivariate statis-tical elucidation of the data; J. Hazard. Mater. 13280–89.
Kolsi S H, Bouri S, Hachicha W and Dhia H B 2013Implementation and evaluation of multivariate analysisfor groundwater hydrochemistry assessment in arid envi-ronments: A case study of Hajeb Elyoun-Jelma, CentralTunisia; Environ. Earth Sci. 70 2215–2224.
Kumar B, Verma V K, Naskar A K, Sharma C S and Mukher-jee D P 2014 Bioavailability of metals in soil and healthrisk assessment for populations near an Indian chromitemine area; Human Ecol. Risk Assess.: Int. J. 20(4)917–928.
Li W X, Zhang X X, Wu B, Sun S L, Chen Y S, Pan W Y,Zhao D Y and Cheng S P 2008 A comparative analysisof environmental quality assessment methods for heavymetal-contaminated soils; Pedosphere 18(3) 344–352.
Li Z, Ma Z, van der Kuijp T J, Yuan Z and Huang L 2014A review of soil heavy metal pollution from mines inChina: Pollution and health risk assessment; Sci. TotalEnviron. 468 843–853.
Liang Q, Xue Z J, Wang F, Sun Z M, Yang Z X and Liu S Q2015 Contamination and health risks from heavy metalsin cultivated soil in Zhangjiakou City of Hebei Province,China; Environ. Monit. Assess. 187(12) 1–11.
Liu X, Song Q, Tang Y, Li W, Xu J, Wu J, Wang F andBrookes P C 2013 Human health risk assessment of heavymetals in soil–vegetable system: A multi-medium analysis;Sci. Total Environ. 463 530–540.
J. Earth Syst. Sci. (2017) 126:49 Page 13 of 13 49
Loska K, Wiechula D and Korus I 2004 Metal contamina-tion of farming soils affected by industry; Environ. Int. 30159–165.
Ma L, Sun J, Yang Z and Wang L 2015 Heavy metal contam-ination of agricultural soils affected by mining activitiesaround the Ganxi River in Chenzhou, southern China;Environ. Monit. Assess. 187 731.
Mileusnic M, Mapani B S, Kamona A F, Ruzicic S, MapaureI and Chimwamurombe P M 2014 Assessment of agri-cultural soil contamination by potentially toxic metalsdispersed from improperly disposed tailings, Kombatmine, Namibia; J. Geochem. Explor. 144 409–420.
Miller N J and Miller J C 2000 Statistics and chemometricsfor analytical chemistry ; 4th edn, NJ7, Pearson Educa-tion, Englewood Cliffs.
Mirzaei R, Teymourzade S, Sakizadeh M and Ghorbani H2015 Comparative study of heavy metals concentration intopsoil of urban green space and agricultural land uses;Environ. Monit. Assess. 187(12) 1–12.
Mukherjee B 1968 Genetic significance of trace elements incertain rocks of Singhbhum, India; Min. Mag. 36(281)661–670.
Muller G 1969 Index of geoaccumulation in sediments of theRhine River; J. Geog. 2 108–118.
Muller G 1979 Schwermetalle in den Sedimenten des Rheins-Veranderungen seit 1971; Umschau 79 778–783.
Preston M R and Chester R 1996 Chemistry and pollutionof the marine environment; In: Pollution: causes, effectsand control (ed.) Harison R M, 3rd edn, Royal Soc. Chem.UK, pp. 26–51.
Pruss-Ustun A, Vickers C, Haefliger P and Bertollini R 2011Knowns and unknowns on burden of disease due to chem-icals: A systematic review; Environ. Health. 10(1) 1.
Rubio R and Ure A M 1993 Approaches to samplingand sample pretreatments for metal speciation in soilsand sediments; Int. J. Environ. Anal. Chem. 51 205–217.
Sakram G, Machender G, Dhakate R, Saxena P Rand Prasad M D 2015 Assessment of trace elementsin soils around Zaheerabad Town, Medak District,Andhra Pradesh, India; Environ. Earth Sci. 73(8) 4511–4524.
Salomons W and Forstner U 1984 Metals in the hydrocycle;Springer, Berlin, pp. 63–98.
Schiff K C and Weisberg S B 1999 Iron as a reference ele-ment for determining trace metal enrichment in southernCalifornia coastal shelf sediments; Mar. Environ. Res. 48161–176.
Skordas K, Papastergios G and Filippidis A 2013 Major andtrace element contents in apples from a cultivated area ofCentral Greece; Environ. Monit. Assess. 185 8465–8471.
Sutherland R A 2000 Bed sediment-associated trace met-als in an urban stream, Oahu, Hawaii; Environ. Geol. 39611–627.
Tomlison L, Wilson L G, Harris R and Jeffrey D W 1980Problems in the assessments of heavy metal levels inestuaries and formation of pollution index; HelgolanderMeeresuntersuchungen 33 566–575.
Turekian K K and Wedepohl K H 1961 Distribution of theelements in some major units of the earth’s crust; Am.Geol. Soc. Bull. 72 175–182.
Turner A and Millward G E 2000 Particle dynamics andtrace metal reactivity in estuarine plumes; Estuar. Coast.Shelf Sci. 50 761–774.
Upadhyay A K, Gupta K K, Sircar J K, Deb M K andMundhara G L 2006 Heavy metals in freshly depositedsediments of the river Subarnarekha, India: An exam-ple of lithogenic and anthropogenic effects; Environ. Geol.50(3) 397–403.
USEPA (United States Environmental Protection Agency)1996 EPA method 3052: Microwave assisted acid diges-tion of siliceous and organically based matrices; USEnvironmental Protection Agency, Office of Solid Wasteand Emergency Response, Government Printing Office,Washington.
Wang Y, Yang Z, Shen Z, Tang Z, Niu J and Gao F 2011Assessment of heavy metals in sediments from a typicalcatchment of the Yangtze River, China; Environ. Monit.Assess. 172 407–417.
Wu Q, Leung J Y S, Geng X, Chen S, Huang X, Li H, HuangZ, Zhu L, Chen J and Lu Y 2015 Heavy metal contami-nation of soil and water in the vicinity of an abandonede-waste recycling site: Implications for dissemination ofheavy metals; Sci. Total Environ. 506–507 217–225.
Xu Z, Li J, Pan Y and Chai X 2016 Human health riskassessment of heavy metals in a replaced urban industrialarea of Qingdao, China; Environ. Monit. Assess. 188(4)1–12.
Corresponding editor: N V Chalapathi Rao