metagenomic strategies to assess … reproduction in oomycetes occurs between two dissimilar...
TRANSCRIPT
CICLO XXV
Dottorato di Ricerca in Scienze Agrarie – Indirizzo “Gestione Fitosanitaria Ecocompatibile inAmbienti Agro-Forestali e Urbani”
Dipartimento di Agraria – Università Mediterranea di Reggio Calabria (sede consorziata)Agr/12 – Patologia Vegetale
METAGENOMIC STRATEGIES TO ASSESS GENETIC DIVERSITYIN PHYTOPHTHORA SPECIES
IL DOTTORE IL COORDINATOREMARIA ISABELLA PRIGIGALLO Prof. STEFANO COLAZZA
IL TUTOR CO TUTORSProf. LEONARDO SCHENA Dott. ROBERTO FAEDDA
Dott. DAVID EL COOKE

1
What we know is a drop, what we don't know is an ocean.
Isaac Newton

2
CONTENTSChapter 1 ..................................................................................................................................................4
General Introduction ...........................................................................................................................5
Chapter 2 ................................................................................................................................................22
Molecular analysis of Phytophthora diversity in nursery-grown ornamental and fruit plants...23
ABSTRACT .....................................................................................................................................23
INTRODUCTION............................................................................................................................24
MATERIALS & METHODS...........................................................................................................26
RESULTS.........................................................................................................................................34
DISCUSSION...................................................................................................................................40
ACKNOWLEDGEMENTS..............................................................................................................47
REFERENCES .................................................................................................................................47
TABLE 2 ..........................................................................................................................................55
TABLE 3 ..........................................................................................................................................59
Chapter 3 ................................................................................................................................................60
Development and validation of 454 pyrosequencing approach to detect Phytophthora diversityin ornamental nurseries .....................................................................................................................61
ABSTRACT .....................................................................................................................................61
INTRODUCTION............................................................................................................................61
MATERIALS & METHODS...........................................................................................................64
RESULTS.........................................................................................................................................74
DISCUSSION...................................................................................................................................76
ACKNOWLEDGEMENTS..............................................................................................................81
REFERENCES .................................................................................................................................81
Chapter 4 ................................................................................................................................................88
Development and validation of a metagenomic approach based on MiSeq Illumina sequencingfor the study of Phytophthora diversity in water samples...............................................................89
ABSTRACT .....................................................................................................................................89
INTRODUCTION............................................................................................................................90
MATERIALS & METHODS...........................................................................................................92

3
RESULTS.........................................................................................................................................98
DISCUSSION.................................................................................................................................104
ACKNOWLEDGEMENTS............................................................................................................108
REFERENCES ...............................................................................................................................108
Chapter 5 ..............................................................................................................................................113
Conclusion .........................................................................................................................................114

4
CHAPTER 1

5
GENERAL INTRODUCTION
BACKGROUND
Introduction to Oomycetes
The Oomycetes, also known as water molds, form a distinct group of fungus-like eukaryotic
microorganisms, which are saprophytes or parasites of diverse hosts in marine, freshwater and
terrestrial environments (Margulis & Schwartz, 2000). Although they resemble fungi in mycelial
growth and mode of nutrition,
distinct morphological
characteristics place them in
the kingdom of Chromista or
Stramenopila with brown and
golden algae and diatoms
(Harper et al., 2005; Richards
et al., 2006). Moreover,
phylogenetic analyses have
confirmed the assertions of
earlier systematists that the
Oomycetes are different from fungi (Rossman & Palm, 2006; Fry & Grünwald, 2010). Indeed, fungi
appear more closely related to animals and Oomycetes are more closely related to algae and to green
plants (Fig. 1).
Several features distinguish Oomycetes from fungi; i.e., septa in the hyphae are rare, resulting
in coenocytic hyphae; the cell wall contains cellulose and β-glucans but do not contain chitin, which
occurs in the true fungi; the vegetative state of Oomycetes is diploid, whereas true fungi are haploid or
Figure 1. Phylogenetic tree illustating the approximate relationship betweenoomycetes and fungi. [Reproduced from Rossman & Palm (2006)].

6
dikaryotic; the mitochondria are characterized by tubular cristae and protoplasmic and nuclear-
associated microtubules, while the true fungi have flattened mitochondrial cristae (Aronson et al.,
1967; Alexopoulos et al., 1997; Kortekamp, 2005).
One of the most distinguishing characteristics of Oomycetes is the production of zoospores by
the formation of a structure called “sporangium” that arises on a specialized hypha named
“sporangiophore”. Sporangia differ among various Oomycetes with respect to the shape, its mode of
germination, and the structure of the sporangiophores. They may be terminal or intercalary (within a
hyphal filament), bulbous or not, and if terminal, caducous (sporangia detach readily) or not. The
mechanism for germination of sporangia is often species-specific and the type of germination is
influenced most strongly by environmental conditions (Erwin & Ribeiro, 1996; Belli, 2011).
Zoospores have a tinsel-type anterior flagellum and a whiplash-type posterior flagellum, both
typically attached in a ventral groove, which make them able to swim. In some species, the ability to
produce zoospores has been lost, and sporangia are thought to have evolved into structures that
germinate directly to produce germ tubes. In this case, the sporangia are sometimes termed “conidia” or
"sporangioconidia". In yet other species, sporangia can germinate to produce either conidia or
zoospores, according to environmental conditions (Erwin & Ribeiro, 1996; Belli, 2011).
Sexual reproduction in Oomycetes occurs between two dissimilar gametangia, a large oogonium
containing one to several eggs and a smaller antheridium that fertilized the oogonium. Depending on
the location of the antheridium, it is possible to distinguish between the paragynous and the
amphigynous arrangement. Species can be distinguished into homothallic and heterothallic forms,
where fertilization occur in a single strain or between two strains of opposite mating types, respectively.
In both cases, the fertilized oogonium develops into a thick-walled oospore. These are resting structures
and after a period of dormancy (often of apparently diverse and undefined durations), can germinate to
produce hyphae, which may immediately produce a sporangium (Erwin & Ribeiro, 1996; Belli, 2011).

7
Some taxa also produce thick-walled survival structures called chlamydospores, which
represent asexual resting spores with a surprising degree of intraspecific variation in structure, wall
thickness and tolerance of extreme environments (Erwin & Ribeiro, 1996; Belli, 2011). General
understanding of the relationships among Oomycetes is evolving rapidly as researchers gather
additional information, particularly from molecular analyses. The rapid evolution of these techniques
and analysis of DNA sequence are providing new criteria for assessing relationships (Cooke et al.,
2000; Lamour & Kamoun, 2009). The analysis of probable relationships among the major genera of
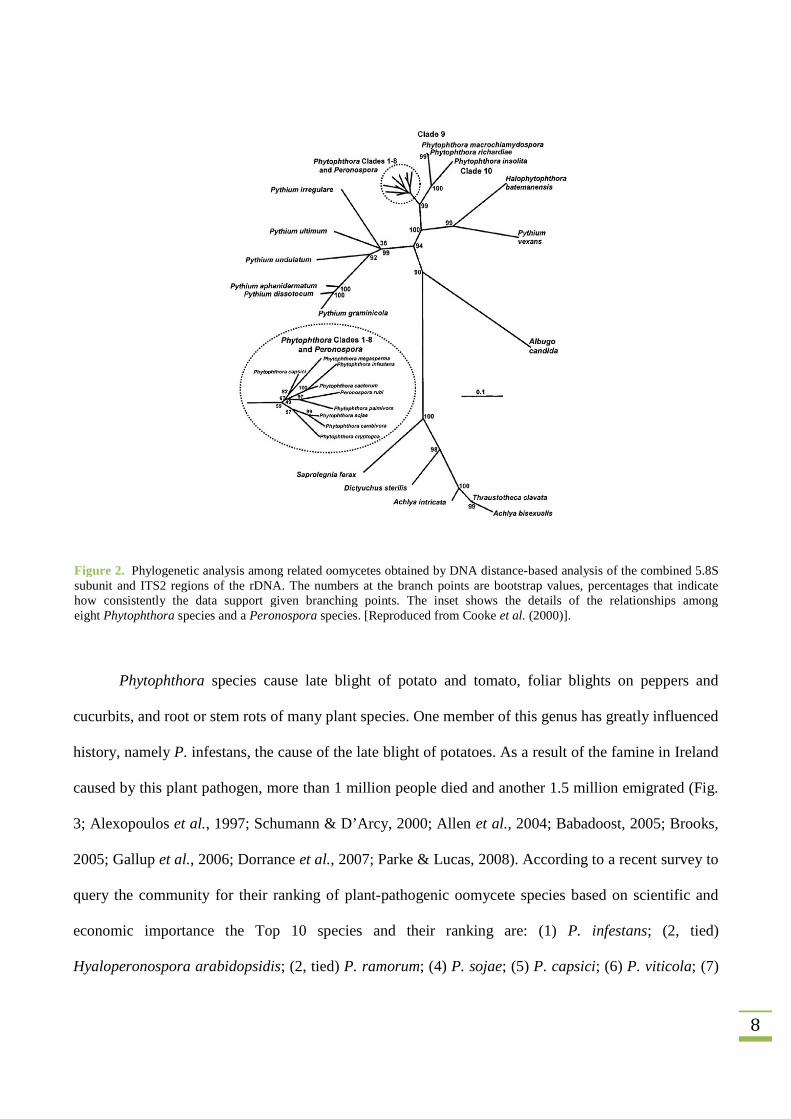
Oomycetes is reported in Fig. 2. While Pythium, Phytophthora and Peronospora appear related, the
relationship of these organisms with the other taxa remains problematic (Cooke et al., 2000).
Oomycetes counts hundred organisms that have colonized many ecological niches with a worldwide
distribution. They can be found in terrestrial and marine environments. They have not only colonised
the deserts of Iran (Abbasi & Mohammadi, 2009), but also the arctic regions of the world, including
Antarctica (Hughes et al., 2003; Bridge et al., 2008). Nonetheless, the Oomycetes remain relatively
poorly known compared to the true fungi.
More than 60% of the known species are plant pathogens, which threaten natural and managed
ecosystems (Thines & Kamoun, 2010; Kamoun et al., 2014). In particular, the order Peronosporales
contains three families of plant pathogens. In the family Peronosporaceae, Plasmopara, Peronospora,
Pseudoperonospora, Sclerospora, and Bremia are obligate parasites that cause serious foliar diseases
known as downy mildews on many host plants such as grape, broccoli, onion, cucurbits, sorghum, and
lettuce (Ash, 2000; Colucci & Holmes, 2010). The family Pythiaceae contains obligate and nonobligate
parasites, and includes the important pathogen genera Pythium and Phytophthora. Pythium species
cause a variety of diseases including root rots of numerous plant species, Pythium blight of turf, and
damping-off, which involves seed rot and pre- and post-emergence seedling death.
8
Phytophthora species cause late blight of potato and tomato, foliar blights on peppers and
cucurbits, and root or stem rots of many plant species. One member of this genus has greatly influenced
history, namely P. infestans, the cause of the late blight of potatoes. As a result of the famine in Ireland
caused by this plant pathogen, more than 1 million people died and another 1.5 million emigrated (Fig.
3; Alexopoulos et al., 1997; Schumann & D’Arcy, 2000; Allen et al., 2004; Babadoost, 2005; Brooks,
2005; Gallup et al., 2006; Dorrance et al., 2007; Parke & Lucas, 2008). According to a recent survey to
query the community for their ranking of plant-pathogenic oomycete species based on scientific and
economic importance the Top 10 species and their ranking are: (1) P. infestans; (2, tied)
Hyaloperonospora arabidopsidis; (2, tied) P. ramorum; (4) P. sojae; (5) P. capsici; (6) P. viticola; (7)
Figure 2. Phylogenetic analysis among related oomycetes obtained by DNA distance-based analysis of the combined 5.8Ssubunit and ITS2 regions of the rDNA. The numbers at the branch points are bootstrap values, percentages that indicatehow consistently the data support given branching points. The inset shows the details of the relationships amongeight Phytophthora species and a Peronospora species. [Reproduced from Cooke et al. (2000)].

9
P. cinnamomi; (8, tied) P. nicotianae; (8, tied) P. ultimum; and (10) Albugo candida (Kamoun et al.,
2014).
The genus Phytophthora
Phytophthora (the plant destroyer in Greek) is one of the best-studied genus that is mainly, if
not entirely, parasitic on various plant hosts in both natural and agricultural settings (Judelson &
Blanco, 2005; Blair et al., 2008). Virtually every dicot plant is affected by one or more species of
Phytophthora, and several monocot species are infected as well.
Since de Bary first established the genus Phytophthora, over 140 species have been described,
although for sure, this is an underrepresentation of the number of species existing in nature (Kroon et
al., 2012). This number of species is increasing yearly due to the availability of more sophisticated
tools for species delimitation and for the discovery of novel Phytophthora species in natural and
agricultural settings.
For a long time identification and classification of species within the genus Phytophthora were
based on the key developed by Waterhouse (1963). The mycologists in the pre-molecular era used host
range, spore morphology, presence or absence of chlamydospores, optimal growth temperature, colony
Figure 3. Coloured illustrations of the Late blight Phytophthora infestans (a), the Downy mildew of grapes Plasmoparaviticola (b) and the Downy mildew Bremia lactucae (c). [Reproduced from the Division of Science of the NSW Departmentof Agriculture (1964)].
a b c

10
morphology, surface structure of oospores and other “Waterhouse” criteria to define species boundaries
and to position a new species in one of the six Waterhouse groups. The allocation of an isolate to a
particular species was arduous work and required trained experts with a good eye and attention to detail.
The description of a new species was even more challenging, requiring the researcher to be a skilled
mycologist able to distinguish the potential new species from all other species, an artist to draw spore
structures by hand and a classicist to phrase the findings in Latin.
Due to their significant environmental and economic importance, several approaches based on
molecular analysis have been developed. Technological advances, increased automation and reduced
costs of sequencing have contributed to the success of new approaches to the study of microbial
diversity via molecular methods (Cooke et al., 2007; Kroon et al., 2012).
Traditional detection techniques of Phytophthora
Since Phytophthora species are often more difficult to isolate than those of the closely related
genus Pythium and other unrelated types of fungi, much research has been devoted to the development
of supplemental strategies to increase the frequency of selective isolation of Phytophthora (Tsao 1970,
1983). However over the last decades, progress has been made in the development of techniques
utilizing selective antibiotics and chemicals in the culture media to facilitate the isolation of
Phytophthora from environmental samples.
Conventional detection methods applicable to Phytophthora species generally include: i) direct
microscopic examination of diseased material, ii) baiting with plant materials, and iii) isolation of the
pathogens from infected plant tissues, water and soil using general or selective agar media. Although
widespread, traditional techniques are based on morphological and cultural criteria and require skilled
and specialized microbiological expertise, which often takes many years to be acquired. These methods
are also very time consuming requiring days or weeks to complete and results are not always
11
conclusive, e.g. when closely related organisms need to be discriminated (Cooke et al., 2007).
Furthermore, traditional methods may not be sensitive enough to assess the occurrence and distribution
of the overall diversity in a sample since many species can be excluded during the detection process.
It’s generally accepted that the absence of Phytophthora in a natural ecosystem must be interpreted
with caution (Erwin & Ribeiro, 1996). Although, one rather obvious advantage of these methods is that
successful isolation of the pathogen yields objective proof of its presence, the limitations of such
approaches have led to the development of novel methods for detecting and identify Phytophthora
species as well as other plant pathogens.
Molecular detection techniques of Phytophthora
Despite the large number of studies conducted in the past using traditional detection methods
(selective media and baiting techniques), the presence and activity of Phytophthora in natural
ecosystems was still underestimated. The method of species identification and classification began to
change when molecular assays became more readily available. First diagnostic reports of the molecular
era were based on the use of hybridization probes. However, in recent years this technique has been
replaced by PCR-based approaches because of their greater sensitivity, simplicity and speed. Like
phenotypic traits, PCR products started being used as diagnostic tools for the identification of plant
pathogens in several ecosystems (Drenth et al., 1993; 1994).
There are several significant advantages of PCR-based detection methods over the traditional
methods of diagnosis; i.e., microrganisms do not need to be cultured; the potential to detect a single
target molecule in a complex mixture (Lee & Taylor, 1990); their speed and versatility; the possibility
to use such automated diagnostic systems for large-scale applications also in field (Tomlinson et al.,
2005; Cooke et al., 2007). Despite this, major assays has been developed for the detection of one or
few known target plant pathogens. As such, they are inappropriate for broader surveys of microbial
12
diversity and distribution in natural ecosystems in which a system capable of detecting multiple species
or even undescribed species is required.
Recently an innovative molecular approach for the study of Phytophthora species in forests and
other natural ecosystems has been developed (Scibetta et al., 2012). This method is based on DNA
extraction and purification from environmental samples, amplification by nested PCR with a new set of
Phytophthora genus-specific primers enabling the amplification of the internal transcribed spacer 1
(ITS1) region of the ribosomal DNA (rDNA) and the cloning of the second round PCR product.
Database comparisons of the DNA sequence derived from the cloned fragments are used for species
identification.
The ITS regions provide attractive targets because they are highly stable, can be easily
amplified and sequenced with universal primers, occur in multiple copies, and possess conserved as
well as variable sequences (White et al., 1990). However, in recent years, the discovery and ITS
sequencing of many new Phytophthora species have raised concerns about the specificity of the ITS-
based molecular detection methods. This is due to cases where the ITS sequences are not sufficiently
variable, making the design of primers to identify and detect closely related taxa very difficult or
impossible. Important Phytophthoras such as P. nemorosa, P. ilicis, P. psychrophila, and P.
pseudosyringae have very similar ITS regions sequences and the design of effective and robust specific
primer sets is very challenging (Martin & Tooley, 2003; Schena & Cooke, 2006). Similarly P. alni, P.
cambivora, P. fragariae, and P. europaea are phylogenetically closely related and challenging to
distinguish via ITS sequences (Brasier et al., 2004). The PCR assay used widely for P. ramorum
detection was recently found to cross-react with P. foliorum a newly discovered and closely related
species pathogenic on both wounded and intact azalea leaves (Donahoo et al., 2006).
It’s safe to say that a large number of well-known diseases caused by various species of
Phytophthora are not being properly diagnosed in many area of the world. Also many diseases caused
13
by Phytophthora are not reported in some countries. This often leads to an incorrect concept on the
distribution of these diseases. These gaps are mainly the result of the lack of an appropriate method to
detect Phytophthora from several environmental samples. Molecular methods for detection,
identification and monitoring of Phytophthora species have proved important tools to predict the
threats posed by native pathogens and minimize the risk of further invasive Phytophthora diseases in
order to circumvent some of the weaknesses inherent in the current plant health systems as described
by Brasier (2004). Molecular approaches also have great potential in providing Phytophthora diversity
in a range of terrestrial and water environments.
Defining Phytophthora, or perhaps wider Oomycetes, diversity at such scales has not yet been
attempted but clearly provides an opportunity to increase general understanding of this group of
pathogens and their impact on natural and managed vegetation systems. Of course, molecular methods
alone cannot provide all the answers and where novel ‘molecular species’ are discovered it will serve to
focus on new isolation attempts and standard approaches to recover and define the key attributes of the
taxonomy, ecology and pathology of these species.
Metabarcoding analysis
Metagenomics has revolutionized microbiology by paving the way for a cultivation-
independent assessment and exploitation of microbial communities present in complex ecosystems and
it is now considered one of the fastest-developing research areas (Simon & Daniel 2011).
Since 1998, when the term “metagenomics” was coined by Handelsman and coworkers, great
progress has been made. Initially, metagenomics was used mainly to recover novel biomolecules from
environmental microbial assemblages. The development of new high-throughput sequencing
techniques, various bioinformatics tools for the analysis and comparison of these data sets and other
affordable methods allowing large-scale analysis of microbial communities, resulted in novel

14
applications, such as comparative community metagenomics, metatranscriptomics, and metaproteomics
(Sjöling & Cowan, 2008; Chistoserdova, 2010). These approaches offered significant promise to
advance the measurement and prediction of the in situ microbial responses, activities, and productivity.
In addition, analyses of the thereby-generated comprehensive data sets had an unprecedented potential
to shed light on ecosystem functions of microbial communities and evolutionary processes (Simon &
Daniel, 2011).
High-throughput sequencing systems have boosted genetics in the last few years. The reduction
of costs, wet-lab workflow complexity and the gain of read length has led to an enormous increase in
sequencing projects and sequencing data (Voelkerding et al., 2009). For the past 30 years, the Sanger
method has been the dominant approach and gold standard for DNA sequencing. Large scale
sequencing projects, including whole genome sequencing, have usually required the cloning of DNA
fragments into bacterial vectors, amplification and purification of individual templates, followed by
Sanger sequencing using fluorescent chain-terminating nucleotide analogues and either slab gel or
capillary electrophoresis. Alternative sequencing methods have been described, although no technology
has displaced the use of bacterial vectors and Sanger sequencing as the main generators of sequence
information (Prober et al., 1987; Brains et al., 1988; Jett et al., 1989; Jacobson et al., 1991; Nyren et al.,
1993; Ronaghi et al., 1996; Sanger et al., 1997).
The commercial launch of the first massively parallel pyrosequencing platform in 2005 ushered
in the new era of high-throughput genomic analysis. The transition from Sanger sequencing to 454
sequencing opened new horizons in microbial community analysis by making it possible to collect
hundreds of thousands of sequences spanning hundreds of samples (Huse et al., 2007). In the relatively
short period since 2005, new sequencing approaches have been developed by giving the opportunity to
analyze each samples in unprecedented depth in few hours.

15
Improvements in DNA sequencing technology offered unprecedented cost-effective
opportunities to explore microbial diversity by providing for a significantly greater depth of analysis
within an individual sample and through the ability to analyze a large number of samples within a
single sequencing run, but also present challenges in data analysis due to the large number of sequences
generated. Many bioinformatics tools have been generated to automate such species determination
from raw sequence data (Caporaso et al., 2010, 2011; Bik et al., 2012).
SCOPE OF THE THESIS
The central themes in this thesis were all related to the development and application of
amplicon-metagenomic approaches to evaluate the diversity of soil- and water- borne Phytophthora
species. These molecular approaches enabled the direct sequencing of the ITS1 barcode-region with
genus-specific primers (Scibetta et al., 2012) from several samples, with particular emphasis on
ornamental species from nurseries and water samples from waterways. In particular, three sequencing
approaches based on Sanger sequencing, 454 Pyrosequencing and MiSeq Illumina have been tested to
evaluate their efficacy in terms of specificity and sensitivity with detection in a number of different
samples including water, soil and plant roots.

16
REFERENCES
Abbasi MA, Mohammadi M, 2009. Albugo candida causing white rust on Erysimum crassicaule in
Iran. Australasian Plant Disease Notes 4, 124–125.
Alexopoulos CJ, Mims CW, Blackwell M, 1997. Introductory Mycology. New York, NY, USA: John
Wiley & Sons, Inc.
Allen TW, Martinez A, Burpee LL, 2004. Pythium blight of turfgrass. The Plant Health Instructor.
DOI:10.1094/PHI-I-2004-0929-01.
Aronson JM, Cooper BA, Fuller MS, 1967. Glucans of Oomycetes Cell Walls. Science 155, 332-335.
Ash G, 2000. Downy mildew of grape. 2000. The Plant Health Instructor. DOI: 10.1094/PHI-I-2000-
1112-01.
Babadoost M, 2005. Phytophthora blight of cucurbits. The Plant Health Instructor. DOI:10.1094/PHI-
I-2005-0429-01.
Bains W, Smith GC, 1988. A novel method for nucleic acid sequence determination. Journal of
Theoretical Biology 135, 303-307.
Belli, eds. 2011. Elementi di patologia vegetale. Italy: Piccin Editore.
Bik HM, Porazinska DL, Creer S, Caporaso JG, Knight R, Thomas WK, 2012. Sequencing our way
towards understanding global eukaryotic biodiversity. Trends in ecology and evolution 27, 233-
243.
Blair JE, Coffey MD, Park S-Y, Geiser DM, Kang S, 2008. A multi-locus phylogeny for Phytophthora
utilizing markers derived from complete genome sequences. Fungal Genetics and Biology 45,
266-277.
Brasier CM, Kirk SA, Delcan J, Cooke DEL, Jung T, Man in’t Veld WA, 2004. Phytophthora alni sp.
nov. and its variants: designation of emerging heteroploid hybrid pathogens spreading on Alnus
trees. Mycological Research 108, 1172–1184.

17
Bridge PD, Newsham KK, Denton GJ, 2008. Snow mould caused by a Pythium sp.: a potential vascular
plant pathogen in the maritime Antarctic. Plant Pathology 57 1066–1072.
Brooks FE, 2005. Taro leaf blight. The Plant Health Instructor. DOI:10.1094/PHI-I-2005-0531-01
Caporaso JG, Kuczynski J, Stombaugh J, Bittinger K, Bushman FD, Costello EK, Fierer N, Pena AG,
Goodrich JK, Gordon JI, 2010. QIIME allows analysis of high-throughput community
sequencing data. Nature Methods 7, 335-336.
Caporaso JG, Lauber CL, Walters WA, Berg-Lyons D, Lozupone CA, Turnbaugh PJ, Fiererb N,
Knight R, 2011. Global patterns of 16S rRNA diversity at a depth of millions of sequences per
sample. Proceedings of the Natural Academy of Science of the United States of America 108,
4516–4522.
Chistoserdova L, 2010. Recent progress and new challenges in metagenomics for biotechnology.
Biotechnology Letters 32, 1351–1359.
Cooke DEL, Drenth A, Duncan JM, Wagels G, Brasier CM, 2000. A molecular phylogeny of
Phytophthora and related Oomycetes. Fungal Genetics and Biology 30, 17-32.
Cooke DEL, Schena L, Cacciola SO, 2007. Tools to detect, identify and monitor Phytophthora species
in natural ecosystems. Journal of Plant Pathology 89, 13-28.
Colucci SJ, Holmes GJ, 2010. Downy Mildew of Cucurbits. The Plant Health Instructor. DOI:
10.1094/PHI-I-2010-0825-01.
Donahoo R, Blomquist CL, Thomas SL, Moulton JK, Cooke DEL, Lamour KH, 2006. Phytophthora
foliorum sp. nov., a new species causing leaf blight of azalea. Mycological Research 110, 1309-
1322.

18
Dorrance AE, Mills D, Robertson AE, Draper MA, Giesler L, Tenuta A, 2007. Phytophthora root and
stem rot of soybean. The Plant Health Instructor. DOI: 10.1094/PHI-I-2007-0830-07 Reviewed
2012.
Drenth A, Goodwin SB, Fry WE, Davidse LC, 1993. Genotypic diversity of Phytophthora infestans in
the Netherlands revealed by DNA polymorphisms. Phytopathology 83, 1087-1092.
Drenth A, Tas ICQ, Govers F, 1994. DNA-fingerprinting uncovers a new sexually reproducing
population of Phytophthora infestans in the Netherlands. European Journal of Plant Pathology
100, 97-107.
Erwin DC, Ribeiro OK, eds. 1996. Phytophthora Diseases Worldwide. St. Paul, MN, US: American
Phytopathological Society.
Fry WE, Grünwald NJ, 2010. Introduction to Oomycetes. The Plant Health Instructor.
DOI:10.1094/PHI-I-2010-1207-01.
Gallup CA, Sullivan MJ, Shew HD, 2006. Black Shank of Tobacco. The Plant Health Instructor. DOI:
10.1094/PHI-I-2006-0717-01.
Handelsman J, Rondon MR, Brady SF, Clardy J, Goodman RM, 1998. Molecular biological access to
the chemistry of unknown soil microbes: a new frontier for natural products. Chemistry &
Biology 5, R245–R249.
Harper JT, Waanders E, Keeling PJ, 2005. On the monophyly of chromalveolates using a six-protein
phylogeny of eukaryotes. International Journal of Systematic and Evolutionary Microbiology 55,
487–496.
Hughes KA, Lawley B, Newsham KK, 2003. Solar UV-B radiation inhibits the growth of Antarctic
terrestrial fungi. Applied Environmental Microbiology 69, 1488–1491.
Huse SM, Huber JA, Morrison HG, Sogin ML, Welch DM, 2007. Accuracy and quality of massively
parallel DNA pyrosequencing. Genome Biology 8, R143.

19
Jacobson KB, Arlinghaus HF, Buchanan MV, Chen CH, Glish GL, Hettich RL, McLuckey SA, 1991.
Applications of mass spectrometry to DNA sequencing. GATA 8, 223-229.
Jett JH, Keller RA, Martin JC, Marrone BL, Moyzis RK, Ratliff RL, Seitzinger NK, Shera EB, Stewart
CC, 1989 High-speed DNA sequencing: an approach based upon fluorescence detection of single
molecules. Journal of Biomolecular Structure and Dynamics 7, 301-309.
Judelson HS, Blanco FA, 2005. The spores of Phytophthora: Weapons of the plant destroyer. Nature
Reviews Microbiology 3, 47-58.
Kamoun S, Furzer O, Jones JD, Judelson HS, Ali GS, Dalio RJ, Roy SG, Schena L, Zambounis A,
Panabieres F, Cahill D, Ruocco M, Figueiredo A, Chen XR, Hulvey J, Stam R, Lamour K, Gijzen
M, Tyler BM, Grunwald NJ, Mukhtar MS, Tome D, Tor M, Van den Ackerveken G, McDowell J,
Daayf F, Fry WE, Lindqvist-Kreuze H, Meijer HJ, Petre B, Ristaino J, Yoshida K, Birch PR,
Gover F, 2014. The Top 10 oomycete pathogens in molecular plant pathology. Molecular Plant
Pathology. DOI: 10.1111/mpp.12190
Kortekamp A, 2005. Growth, occurrence and development of septa in Plasmopara viticola and other
members of the Peronosporaceae using light- and epifluorescence-microscopy. Mycological
Research 109, 640-648.
Kroon LPNM, Brouwer H, de Cock AWAM, Govers F, 2012. The genus Phytophthora anno 2012.
Phytopathology 102, 348-364.
Lamour K, Kamoun S, eds. 2009. Oomycete Genetics and Genomics: Diversity, Interactions and
Research Tools. Hoboken, NJ: Wiley-Blackwell.
Lee SB, Taylor JW, 1990. Isolation of DNA from fungal mycelia and single spores. In: Innis M.A.,
Gelfand DH, Sninsky J, White TJ eds. PCR protocols: a guide to methods and applications. San
Diego, California: Academic Press Inc.

20
Margulis L, Schwartz KV, eds. 2000. Five Kingdoms: An Illustrated Guide to the Phyla of Life on
Earth. New York, USA: W.H. Freeman & Co.
Martin FN, Tooley PW, 2003. Phylogenetic relationships of Phytophthora ramorum, P. nemorosa, and
P. pseudosyringae, three species recovered from areas in California with sudden oak death.
Mycological Research 107, 1379-1391.
Nyren P, Pettersson B, Uhlen M, 1993. Solid phase DNA minisequencing by an enzymatic
luminometric inorganic pyrophosphate detection assay. Analytical Biochemestry 208, 171-175.
Parke JL, Lucas S, 2008. Sudden oak death and ramorum blight. The Plant Health Instructor. DOI:
10.1094/PHI-I-2008-0227-01.
Prober JM, Trainor GL, Dam RJ, Hobbs FW, Robertson CW, Zagursky RJ, Cocuzza AJ, Jensen MA,
Baumeister K, 1987 A system for rapid DNA sequencing with fluorescent chain-terminating
dideoxynucleotides. Science 238, 336-341.
Richards TA, Dacks JB, Jenkinson JM, Thornton CRM, Talbot NJ, 2006. Evolution of filamentous
pathogens: gene exchange across eukaryote kingdoms. Current biology 16, 1857-1864.
Ronaghi M, Karamohamed S, Petterson B, Uhlén M, Nyrén P, 1996. Real-time DNA sequencing using
detection of pyrophosphate release. Analitical Biochemestry 242, 84-89.
Rossman AY, Palm ME, 2006. Why are Phytophthora and other Oomycota not true Fungi? Outlooks
on Pest Management, 17, 217-219.
Sanger F, Nicklen S, Coulson AR., 1997. DNA sequencing with chain-terminating inhibitors.
Procedings of the Natural Academy of Science USA 74, 5463.
Schena L, Cooke DEL, 2006. Assessing the potential of regions of the nuclear and mitochondrial
genome to develop a “molecular tool box” for the detection and characterization of Phytophthora
species. Journal of Microbiological Methods 67, 70-85.

21
Schumann GL, D’Arcy CJ, 2000. Late blight of potato and tomato. The Plant Health Instructor. DOI:
10.1094/PHI-I-2000-0724-01.
Scibetta S, Schena L, Chimento A, Cacciola SO, Cooke DEL, 2012. A molecular method to assess
Phytophthora diversity in environmental samples. Journal of Microbiological Methods 88, 356-
368.
Simon C, Daniel R, 2011. Metagenomic Analysis: Past and Future Trends. Applied and Environmental
Microbiology 77, 1153-1161.
Sjöling S, Cowan DA, 2008. Metagenomics: microbial community genomes revealed. In Margesin R,
Schinner F, Marx J-C, Gerday C eds. Berlin, Germany: Springer-Verlag.
Thines M, Kamoun S, 2010. Oomycete-plant coevolution: recent advances and future prospects.
Current Opinion in Plant Biology 13, 427-433.
Tomlinson JA, Boonham N, Hughes KJD, Griffin RL, Barker I, 2005. On-site DNA extraction and
real-time PCR for detection of Phytophthora ramorum in the field. Applied and Environmental
Microbiology 71, 6702-6710.
Tsao PH, 1970. Selective media for isolation of pathogenic fungi. Annual Review of Phytopathology 8,
157-186.
Tsao PH, 1983. Factors affecting isolation and quantitation of Phytophthora from soil. Erwin DC,
Bartnicki-Garcia S, Tsao PH, eds. In: Phytophthora: Its Biology, Taxonomy, Ecology, and
Pathology. St Paul, Minnesota: American Phytopathological Society.
Voelkerding KV, Dames SA, Durtschi JD, 2009. Next-Generation Sequencing: From Basic Research to
Diagnostics. Clinical Chemistry 55, 641–658.
White TJ, Bruns T, Lee S, Taylor J, 1990. Amplification and direct sequencing of fungal ribosomal
RNA genes for phylogenetics. In: Innis MA, Gelfand DH, Sninsky JJ, White TJ eds. PCR
protocols: a guide to methods and applications. San Diego, California: Academic Press, Inc.

22
CHAPTER 2

23
Molecular analysis of Phytophthora diversity in nursery-grown ornamental and
fruit plants
ABSTRACT
The genetic diversity of Phytophthora spp. was investigated in potted ornamental and fruit tree species
using a metagenomic approach based on a semi-nested PCR with Phytophthora genus-specific primers
targeting the ITS1 region of the rDNA. More than 50 ITS1 sequence types (STs) representing at least
15 distinct Phytophthora taxa were detected. Nine had ITS sequences that grouped them in defined
taxonomic groups (P. nicotianae, P. citrophthora, P. meadii, P. taxon Pgchlamydo, P. cinnamomi, P.
parvispora, P. cambivora, P. niederhauserii, and P. lateralis) whereas three phylotypes were
associated to two or more taxa (P. citricola taxon E or III; P. pseudosyringae, P. ilicis or P. nemorosa;
and P. cryptogea, P. erythroseptica, P. himalayensis or P. sp. “kelmania”) that can be challenging to
resolve with ITS1 sequences alone. Three additional phylotypes were considered as representatives of
novel Phytophthora taxa and defined as P. meadii-like, P. cinnamomi-like and P. niederhauserii-like.
Furthermore, the analyses highlighted a very complex assemblage of Phytophthora taxa in ornamental
nurseries within a limited geographic area and provided insights into the population structure of P.
nicotianae (the most prevalent taxon) and other taxa. Data revealed new host-pathogen combinations,
evidence of new species previously unreported in Italy (P. lateralis) or Europe (P. meadii) and
phylotypes representative of species that remain to be taxonomically defined. Furthermore, the results
reinforced the primary role of plant nurseries in favoring the introduction, the dissemination and
evolution of Phytophthora species by favoring intra- and inter-specific sexual recombination.
24
INTRODUCTION
The outbreak of new plant disease can have negative economic and environmental
consequences and in the worst cases even societal repercussions. Among plant pathogens, the genus
Phytophthora is one of the most damaging with more than 100 species responsible for devastating
diseases in agricultural and natural ecosystems (Brasier, 2009). They cause root rot, stem rot, twig
and/or leaf blights in a huge number of plant species and losses in nurseries can be up to 100% within
one year (Themann et al., 2002). Many recently described invasive Phytophthora species were
previously unknown and have been identified only when they have caused severe disease in non-native
environments. It has been hypothesized that between 100 and 500 species are still unknown to the
scientific community (Brasier, 2009; Kroon et al., 2012). Having adapted and co-evolved with their
hosts, many of these pathogens may do little noticeable damage in their native ecosystems and so are
less likely to be detected.
New plant diseases can be the result of many factors including adaptation of pathogens to new
hosts, incursions of pathogens from other geographic regions and factors such as climate change that
trigger an endemic pathogen to cause disease. However, the plant trade is considered the primary cause
of new disease outbreaks due to its role in the introduction of invasive alien pathogens (Brasier, 2008).
The unprecedented growth of international travel and trade results in huge disturbance to ecosystems
with severe socio-economic impact. A specific program for monitoring emerging diseases (ProMED;
http://www.promedmail.org) has revealed a 13-fold increase of disease alerts for plant-infecting fungi
from 1995 to 2010. In this context the nursery trade, with particular emphasis on the potted
ornamentals sector is particularly exposed as a consequence of its globalization, intensive cultivation
techniques and the frequent turnover of new varieties and/or species. Ornamental plants have proved to
be especially susceptible, probably because they represent artificial ecosystems grown under harsh
conditions which expose them to pathogen attack.
25
The role of the nursery trade in the spreading of Phytophthora inoculum has been investigated
for P. ramorum and P. nicotianae but there are many more Phytophthora species involved (Goss et al.,
2011; Mammella et al., 2011, 2013; Parke et al., 2014). In Italy more than 20 Phytophthora species
were reported in nurseries of ornamentals and the majority of these were identified on new hosts for the
first time (Cacciola et al., 2008). In Germany, Minnesota, California, Virginia and Spain between 10
and 17 different species of Phytophthora were detected during surveys carried out in nurseries and
garden centres (Themann et al., 2002; Schwingle et al., 2007; Moralejo et al., 2009; Yakabe et al.,
2009; Bienapfl & Balci, 2014). It has been suggested that the movement of plant material allows the
introduction of pathogens and that conditions typical of nurseries (e.g. warm temperature, high
humidity due to frequent irrigation, close and repeated cultivation of many variety/species, growth of
plants in pots) provides an environment favorable for growth and sporulation of Phytophthora species.
In particular, contaminated recycled irrigation water is an important pathway for the dissemination of
motile zoospores of Phytophthora spp. (Themann et al., 2002).
Nurseries may also play a major role in favouring hybridization due to the presence of multiple
plant species with their own pathogens. The contact between related but previously geographically
isolated pathogens can accelerate the evolutionary process and generate better adapted or entirely new
pathogen species. Relevant examples are represented by P. alni, a hybrid between P. cambivora and P.
fragariae-like species (Brasier et al., 2004), and Phytophthora × pelgrandis, a hybrid between P.
nicotianae and P. cactorum (Faedda et al., 2013b).
To limit the introduction of new invasive pathogens, plants moving in trade are covered by
phyto-sanitary certificates. However, certification is commonly based on a simple visual inspection and
many Phytophthora infections are not detected due to latency and the suppression of symptoms by
intensive chemical applications that increase the risk of cryptic pathogen dissemination.

26
Data on pathogen dissemination are quite limited, frequently contrasting and probably
underestimated due to the limited power of commonly utilized detection methods that are often based
on culturing and baiting (Cooke et al., 2007). Several PCR-based methods have been also developed
for Phytophthora species but the majority of diagnostic assays have been specifically designed to detect
only a single species and as a consequence they are inappropriate for broader surveys of Phytophthora
diversity and distribution in ecosystems in which a system capable of detecting multiple species or
even undescribed species is required (Cooke et al., 2007; Martin et al., 2012; Sanzani et al., 2013).
The aim of the present study was to evaluate the application of a metagenomics approach based
on the use of genus-specific primers to examine the presence and spread of Phytophthora species in
potted plant nursery roots and soils with particular emphasis on ornamental species (Scibetta et al.,
2012). This molecular approach enables the direct sequencing of the ITS1 region and its use as barcode
marker for the detection of the overall Phytophthora diversity in environmental samples (Scibetta et al.,
2012). This culture-free molecular method has the potential to significantly improve the depth of
coverage in Phytophthora diversity detection (Cooke et al., 2007).
MATERIALS & METHODS
Sampling
A total of 115 soil and root samples were collected from many ornamental and a single fruit tree
species during 2012 and 2013 in 9 different nurseries across Apulia and Calabria, Southern Italy (Table
1). The samples were all from potted plants transplanted or sown between 3 months and 3 years before
the survey. Plants showing general symptoms of decline on the canopy and/or roots rots were targeted
for sampling. All analysed samples were represented by root and soil from five plants and were
maintained in plastic bags at 4°C for no more than two days before processing. Roots samples were

27
washed with running tap water, dried on blotting paper and cut to obtain small pieces (about 5 cm).
Both roots and soils were freeze-dried and stored at -20°C pending molecular analysis.
Table 1. Results of surveys conducted on soil and root samples collected from potted plantlets in 8 different nurserieslocated in Apulia and Calabria (Southern Italy) and on a soil sample collected in a citrus grove in Calabria. DetectedPhytophthora phylotypes were identified according to their phylogenetic analysis along with reference sequences (Fig. 3).
Sampling locality Collected species Detected Phytophthora species*Roots Soils
Nursery TP -Apulia
Grevillea lanigera P. nicotianae, P.cinnamomi-like
P. nicotianae, P.cinnamomi, P.cinnamomi-like
Lavandula sp ND P. nicotianaeChamelaucium uncinatum NA NDConvolvolus cneorum P. cryptogea P. niederhauserii, P. cryptogeaArmeria maritima NA P. nicotianae
Nursery CP -Apulia
Rosmarinus officinalis var.erectus
ND P. cryptogea, P. citrophthora
Salvia sp. P. cryptogea P. niederhauseriiOlea europaea P. nicotianae, P.
niederhauseriiP. nicotianae
Convolvolus mauritanicus P. nicotianae P. nicotianaeRosmarinus officinalis var.prostratus
ND ND
Pistacia lentiscus ND NDCotoneaster salicifolius ND NDTeucrium brevifolium ND NDConvolvulus cneorum ND NDOriganum pseudodictamus ND NDHebe veronica ND NDEremophila nivea ND NDArbutus unedo ND NDErica caniculata ND NDCytisus sp. ND NDRusselia equisetiformis ND ND
Nursery ST -Calabria
Diospyros kaki P. niederhauserii P. niederhauserii
Nursery PV -Apulia
Cyclamen persicum var.halios
ND ND
Cyclamen persicum var. tianis P. nicotianae, P.niederhauserii
P. nicotianae, P. lateralis
Tagetes erecta ND P. nicotianae, P. lateralisTagetes patula ND NDPetunia parviflora P. nicotianae, P. lateralis NDPetunia sp. P. nicotianae ND
Nursery ZZ -Apulia
Cercis siliquastrum ND P. taxon Pgchlamydo, P. cinnamomi-like, P. pseudosyringae
Punica granatum ND P. lateralisArbutus unedo ND ND

28
Rosa sp. ND NDGrevillea juniperina ND NDBouganvillaea glabra ND P. cinnamomi-like
Nursery DM -Apulia
Polygala myrtifolia ND ND
Lantana sellowiana ND NDNerium oleander ND NDPolygala myrtifolia ND NDGrevillea lanigera ND NDLithodora sp. ND NDEugenia myrtifolia ND NDEuriopsis pectinatum ND NDColeonema pulchrum ND ND
Nursery BL -Apulia
Thymus sp ND ND
Mentha sp P. nicotianae P. nicotianae, P. meadiiAllium schoenoprasum ND P. nicotianaeRosmarinus officinalis ND P. cambivoraArmeria maritima P. nicotianae P. nicotianaeCyclamen persicum ND P. niederhauserii-like, P.
niederhauseriiPetunia parviflora P. nicotianae, P.
cambivora, P. meadiiP. nicotianae
Fuchsia magellanica P. niederhauserii P. niederhauseriiLobelia erinus P. nicotianae, P. meadii,
P. cambivora, P. citricolaND
Dahlia campanulata P. nicotianae, P. citricola,P. cambivora, P. meadii-like,P. niederhauserii
ND
Impatiens nuova guinea P. cambivora, P. meadii ND
Nursery PG -Apulia
Quercus ilex ND ND
Prunus mariana ND NDPrunus mahaleb P. citricola, P. cambivora P. citricola, P. cambivoraCrataegus azarolus ND ND
Citrus Grove -Calabria
Citrus reticulata NA P. nicotianae, P. parvispora, P.cambivora, P. citrophthora, P. meadii
*N.A. = non-analyzed samples; N.D. = Analyzed samples in which no Phytophthora was detected.
29
DNA extraction
Triplicate DNA extractions were performed from all collected soil and root samples. To extract
DNA from soil, the method described by Schena et al. (2002) was slightly modified. Lyophilised soil
(0.5 g) was transferred in 2 ml Eppendorf tubes and suspended in 1.5 mL of extraction buffer (0.12 M
Na2HPO4, 1.5 M NaCl, 2% CTAB) in the presence of 0.1 g of acid-washed glass beads (425-600 um
diameter; Sigma Aldrich, USA) and two 5 mm stainless steel ball bearings. The extraction mixture was
blended at 300 rpm for 10 min and centrifuged at 16000 g for 10 min at 4°C. The upper phase was
extracted with an equal volume of chloroform, precipitated for 1 h at -20°C with two volumes of
isopropanol and a tenth of volume of 3M Sodium Acetate, pH 5.2, washed twice with cold 100% and
70% ethanol, dried and re-suspended in 100 µL of RNase free water.
Extraction of DNA from roots was performed using the protocol described by Schena &
Ippolito (2003) with minor modifications. Lyophilised tissues were pulverized using mortar and pestle
under liquid nitrogen. Approximately 0.5 g of the resulting powder was transferred into 2 ml Eppendorf
tubes containing 0.1 g of acid-washed glass beads (425-600 um diameter), 0.1 g of PVP (Sigma
Aldrich, USA), two 5 mm stainless steel ball bearings and 1.5 mL of extraction buffer (200 mM Tris-
HCl pH 7.7, 250 mM NaCl, 25 mM EDTA, 0.5% SDS). The mixture was blended for 5 min using a
Mixer Mill MM 400 (Verder Scientific, Italy) set to have vibrational frequency of 1800 and centrifuged
at 16000 g for 10 min at 4°C. The upper phase was extracted twice with an equal volume of
phenol/chloroform (1:1) and chloroform, respectively. Nucleic acids were precipitated, washed and
resuspended in 100 µL of RNase free water as described for soil.
Total DNA from all soil and roots samples was divided into two equal aliquots of 50 µl.
Aliquots were stored at -20°C without any additional treatment or after purification through
chromatography columns as described Ruano-Rosa et al. (2007).

30
Evaluation of DNA quantity and quality
Purified and non-purified environmental DNA samples were analyzed by electrophoresis in
1.2% agarose gels containing GelRed™ nucleic acid gel strain (Biotium, USA) in TBE buffer and
visualized on UV light using a Gel Doc™ XR (BioRad, USA). A spectrophotometer (Nanodrop,
Thermo Fisher Scientific Inc.) was used to measure absorbance at 260, 280 and 230 nm and estimate
concentration and contamination with protein and humic acid.
Furthermore, to confirm that DNA samples were of sufficient quality to be amplified by PCR, 1
μl of a representative number of DNA samples (purified and non-purified) was analysed by real-time
PCR using specific hydrolysis probes method designed to detect P. kernoviae (Schena et al., 2006).
Primers and probe for P. kernoviae were selected because this species was experimentally verified to
be absent in all the samples. Amplifications were performed in duplicate and reaction mixtures
containing 50 ng of P. kernoviae DNA were spiked with 1 µL of water (control) or either purified or
non-purified DNA. Reaction mixtures without P. kernoviae DNA were utilised to confirm the absence
of this species in all analysed samples. PCR amplification was performed as described by Schena et al.
(2006) using an StepOnePlus™ Real-Time PCR System (Applied Biosystems®, USA) and data
acquisition and analysis completed using the supplied software according to the manufacturer’s
instructions. The quantification cycle (Cq) values for each reaction were calculated automatically by
the software by determining the PCR cycle number at which the reporter fluorescence exceeded
background.
Amplification of Phytophthora spp. ITS1 region from soil and root samples
The ITS1 region of the rDNA of Phytophthora spp. was amplified in triplicate from all soil and
root samples using a semi-nested assay with the SP primers described by Scibetta et al. (2012) (Fig. 1).
Minor modifications to the method of Scibetta and co-workers concerned the use of a TaqDNA

31
polymerase with proofreading activity to reduce the risk of PCR artefacts during PCR amplifications.
First and second rounds of amplification were performed in a final volume of 25 µL containing 1 U
Pfx50™ DNA Polymerase (Invitrogen, USA), 1X Pfx50™ PCR Mix, 0.2 µM of primers and 1 µL of
purified DNA. According to Scibetta and co-workers 1 µL of the 1st round-product was used as
template for the 2nd round PCR. All amplification conditions were slightly modified for the DNA
polymerase requirements and consisted of 30 s at 94°C followed by 35 cycles of 94°C for 20 s, 61°C
for 25 s and 68°C for 30 s and by a final step of 68°C for 2 min. All PCR was conducted in an
Mastercycler Ep Gradient S. (Eppendorf, Germany).
Amplicons from the second round PCR were separated by electrophoresis as described
previously and a 100 bp DNA ladder (Invitrogen, USA) used to estimate amplicon size.
Great precautions were taken to minimise the risk of DNA contamination of PCR amplifications.
First and second round PCR reactions, DNA extractions and electrophoresis were set up in separate
areas and using specific sets of materials including gloves, pipettes, filter tips and lab coat. Working
positions were repeatedly cleaned with 10% NaClO to denature potential contaminating nucleic acids.
Furthermore, an additional Phytophthora-free soil sample and several sterile water samples were
processed exactly as collected samples and served as negative controls in all experiments.
Figure 1. Schematic representation of the internal transcribed spacer (ITS) regions of the ribosomal DNA (rDNA) withlocation of primers utilized in this study. From Scibetta et al., 2012.
5.8S 28S18S ITS1 ITS2
18Ph2F 5.8-1R
ITS6*
1° round PCR
2° round PCR

32
Cloning and sequencing of PCR fragments
Triplicate PCR products of the expected size obtained with the second round PCR from each
soil and root sample, were combined in a single sample and cloned into One Shot® TOP10 Chemically
Competent Escherichia coli (Invitrogen) using a Zero Blunt® TOPO® PCR Cloning Kit (Invitrogen,
USA), according to the manufacturer’s protocol. For each cloned amplicon, 20 clones were picked and
directly used in PCR reactions (colony PCR) with the second round PCR primers (ITS6/5.8-1R; 74) as
previously described. Amplified products were analyzed by electrophoresis and single bands of the
expected size were sequenced with both forward and reverse primers by Macrogen Europe (Amsterdam,
The Netherlands).
Analysis of sequences and identification of ITS1 sequence types
The ‘ChromasPro version 1.5’ software (http://www.technelysium.com.au/) was utilized to
evaluate the quality of sequences and to create consensus sequences. All sequences were aligned using
the software MUSCLE as implemented in MEGA5 (Hall, 2013) and analyzed and edited manually to
check indels and single nucleotide polymorphisms within homologous group of sequences. Prior to
analysis, sequences of primers were removed. ITS1 sequence types (STs), defined as the distinct and
reproducible ITS1 sequences recovered in this study, were identified in MUSCLE and confirmed using
the DnaSP ver. 5.10.01 software (Librado & Rozas, 2009). In order to reduce the risk of errors due to
artifacts during PCR and/or plasmid replication, only STs represented by at least two sequences were
considered for further analysis.
To identify the species detected, single representative sequences for each ST were subject to
phylogenetic analysis along with validated barcode sequences of the genus Phytophthora (Robideau et
al., 2011). Before analyses the complete panel of Phytophthora reference sequences (Robideau et al.,
2011) were trimmed to match the sequence lengths determined in this study and analyzed with the

33
software ElimDupes (http://hcv.lanl.gov/content/sequence/ELIMDUPES/elimdupes.html) to delete
multiple identical sequences for each species. Identical reference sequences were only included in the
panel when they represented different Phytophthora species. In cases where no matches were found in
the reference sequence from Robideau et al. (2011) more closely related sequences were examined
using BLAST searches of GenBank with priority given to sequences associated to specific publications
(Fig. 2). The complete panel of selected reference sequences and STs were grouped according to their
clade (Cooke et al., 2000; Kroon et al., 2012), aligned using ClustalX (Thompson et al., 1997) and
introduced to TOPALi for phylogenetic analysis with the MrBayes methods based on Bayesian Tree
Estimation (Milne et al., 2008). Bayesian analysis was performed with four runs conducted
simultaneously for 500,000 generations with 10% sampling frequency and burn in of 30%. By this
process all ITS1 sequences were associated with a phylotype. A phylotype may be represented by
single ST or a closely related cluster of ITS1 sequences that are considered to represent a single distinct
taxon. We use the term phylotype as a proxy for species in describing the results as species cannot be
defined formally in the absence of living isolates.
To graphically show the relatedness and relative abundance of different STs, networks were
generated for each detected Phytophthora clade with the statistical parsimony algorithm implemented
in TCS ver. 1.21 (Clement et al., 2000). Colour and circle size was used to associate STs to the
nursery/field of provenance and to the abundance of each ST, respectively. Abundance of STs was
determined in terms of number of samples (roots and/or soil) in which each ST was detected.

34
RESULTS
DNA extraction from soil and root samples
Protocols utilized to extract DNA from root and soil proved to be appropriate for PCR
amplifications after the purification step with chromatography columns. Prior to purification, extracted
solutions were dark in color (from brown to black) and caused a significant inhibition of PCR reactions.
In real-time PCR reactions with P. kernoviae DNA a delay of the quantification cycle (Cq) of at least 3
was revealed in reaction mixtures spiked with 1 µl of non-purified soil or root DNA (data not shown).
Some DNA extracts completely inhibited PCR reactions. Once purified the DNA samples were clear
and did not affect TaqDNA polymerase activity. The quality of purified DNA was also confirmed by a
260/280A ratio of 1.8-2.1 and 260/230A ratio of 1.3-2.0 for both soil and root DNA extracts. The
concentration of nucleic acids ranged between 50 and 100 ng/µl (soil samples) and 300 and 500 ng/µl
(root samples).
Amplification results
A total of 115 soil and root samples were analysed by the semi-nested assay and 40 of them (17
roots and 23 soils) produced a positive amplification in at least one of the three analysed replications
(Table 1). Among these, very few samples produced a positive amplification after the first PCR step,
confirming the need for a nested approach to yield reliable levels of sensitivity (Scibetta et al., 2012).
For each positive sample, PCR fragments obtained from replicate extractions after semi-nested PCR
were combined, cloned and sequenced in both directions. A total of 800 high quality DNA sequences
of the ITS1 region (20 clones per each sample) were obtained and representative ITS1 sequences (STs)
were deposited in GenBank with accession numbers KJ601190-KJ601244 (Table 2).
Analysis of sequences and species identification

35
After the exclusion of singletons, 55 unique STs representing known species and sub-species
variants, species complexes or representatives of unknown Phytophthora taxa were identified.
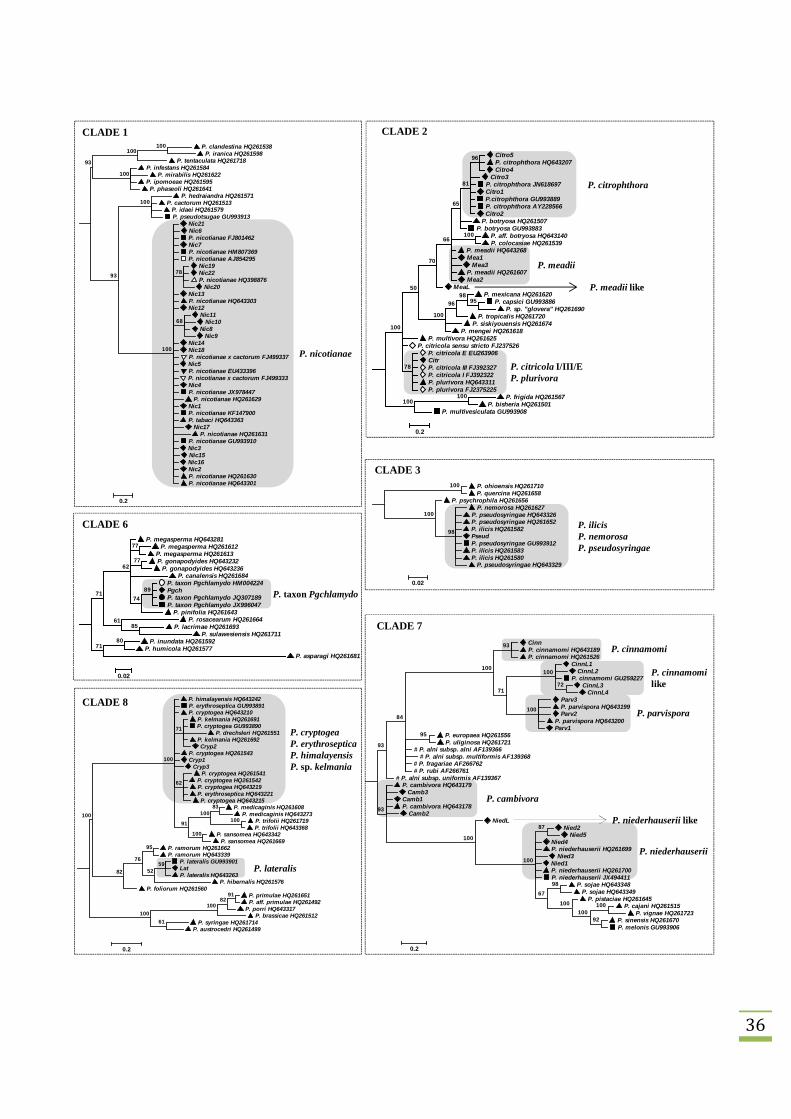
Phylogenetic analysis of these STs against reference sequences (Fig. 2) identified 15 distinct
phylotypes in six different ITS clades (Cooke et al., 2000; Kroon et al., 2012). Each phylotype was
represented by a number of STs ranging between 1 and 22, as in the case of P. nicotianae (Fig. 3). Nine
phylotypes were identified to the species level: P. nicotianae, P. citrophthora, P. meadii, P. taxon
Pgchlamydo, P. cinnamomi, P. parvispora, P. cambivora, P. niederhauserii, and P. lateralis (Table 1;
Fig. 2). Other phylotypes were associated to P. citricola taxon E or III (ST Citr; Table 3) or were
unresolved within their species complexes: i) P. pseudosyringae, P. ilicis, or P. nemorosa (ST Pseud);
and ii) P. cryptogea, P. erythroseptica, P. himalayensis or P. sp. "kelmania" (STs Cryp1, Cryp2 and
Cryp3) because the available genetic variation within the ITS1 region did not enable the reliable
differentiation of species (Jung & Burgess, 2009; Robideau et al., 2011). Finally, 3 STs that were
markedly different from all reference sequences were defined as P. meadii-like (ST MeaL), P.
cinnamomi-like (STs CinnL1, CinnL2, CinnL3, and CinnL4) and P. niederhauserii-like (ST NiedL)
phylotypes (Table 1; Fig. 2).
Sub-species variation, with indications of host association, was observed for some species (Fig.
3). In particular, several STs were identified within the heterothallic species P. nicotianae, P.
niederhauserii, P. cambivora, P. citrophthora, P. meadii, P. parvispora, and the P. cryptogea species
complex, but not for homothallic species like P. lateralis and P. citricola taxon E or III (Fig. 3). Four
different STs were also identified within the P. cinnamomi-like taxon. Single STs only were detected
for P. cinnamomi, P. taxon PgChlamydo, the P. pseudosyringae species complex, P. meadii-like and P.
niederhauserii-like but this was probably due to their low abundance since they were detected in only
single root or soil samples (Fig. 3).
36
Citro5P. citrophthora HQ643207Citro4
Citro3P. citrophthora JN618697Citro1P.citrophthora GU993889P. citrophthora AY228566Citro2
P. botryosa HQ261507P. botryosa GU993883
P. aff. botryosa HQ643140P. colocasiae HQ261539
P. meadii HQ643268Mea1
Mea3P. meadii HQ261607Mea2
MeaLP. mexicana HQ261620
P. capsici GU993886P. sp. "glovera" HQ261690
P. tropicalis HQ261720P. siskiyouensis HQ261674
P. mengei HQ261618P. multivora HQ261625
P. citricola sensu stricto FJ237526P. citricola E EU263906CitrP. citricola III FJ392327P. citricola I FJ392322P. plurivora HQ643311P. plurivora FJ2375225
P. frigida HQ261567P. bisheria HQ261501
P. multivesiculata GU993908
100100
9598
96
100
100
96
81
65
66
70
50
78
100
0.2
P. megasperma HQ643281P. megasperma HQ261612
P. megasperma HQ261613P. gonapodyides HQ643232
P. gonapodyides HQ643236P. canalensis HQ261684
P. taxon Pgchlamydo HM004224PgchP. taxon Pgchlamydo JQ307189P. taxon Pgchlamydo JX996047
P. pinifolia HQ261643P. rosacearum HQ261664
P. lacrimae HQ261693P. sulawesiensis HQ261711
P. inundata HQ261592P. humicola HQ261577
P. asparagi HQ261681
8071
8561
77
77
89
74
62
71
0.02
P. clandestina HQ261538P. iranica HQ261598
P. tentaculata HQ261718P. infestans HQ261584
P. mirabilis HQ261622P. ipomoeae HQ261595
P. phaseoli HQ261641P. hedraiandra HQ261571
P. cactorum HQ261513P. idaei HQ261579P. pseudotsugae GU993913
Nic21Nic6P. nicotianae FJ801462Nic7P. nicotianae HM807369P. nicotianae AJ854295
Nic19Nic22P. nicotianae HQ398876
Nic20Nic13P. nicotianae HQ643303Nic12
Nic11Nic10
Nic8Nic9
Nic14Nic18P. nicotianae x cactorum FJ499337Nic5P. nicotianae EU433396P. nicotianae x cactorum FJ499333Nic4P. nicotianae JX978447
P. nicotianae HQ261629Nic1P. nicotianae KF147900P. tabaci HQ643363
Nic17P. nicotianae HQ261631
P. nicotianae GU993910Nic3Nic15Nic16Nic2P. nicotianae HQ261630P. nicotianae HQ643301
100100
100
93
100
78
68
100
93
0.2
P. ohioensis HQ261710P. quercina HQ261658
P. psychrophila HQ261656P. nemorosa HQ261627
P. pseudosyringae HQ643326P. pseudosyringae HQ261652P. ilicis HQ261582PseudP. pseudosyringae GU993912P. ilicis HQ261583P. ilicis HQ261580
P. pseudosyringae HQ643329
100
98
100
0.02
CLADE 1 CLADE 2
CLADE 3
CLADE 6
CLADE 8
CLADE 7
P. nicotianae
P. meadii like
P. meadii
P. citrophthora
P. citricola I/III/EP. plurivora
P. ilicisP. nemorosaP. pseudosyringae
P. taxon Pgchlamydo
P. lateralis
P. cryptogeaP. erythrosepticaP. himalayensisP. sp. kelmania
P. parvispora
P. cinnamomi
P. cambivora
P. niederhauserii like
P. niederhauserii
P. cinnamomilike
P. himalayensis HQ643242P. erythroseptica GU993891P. cryptogea HQ643210
P. kelmania HQ261691P. cryptogea GU993890
P. drechsleri HQ261551P. kelmania HQ261692Cryp2
P. cryptogea HQ261543Cryp1
Cryp3P. cryptogea HQ261541
P. cryptogea HQ261542P. cryptogea HQ643219P. erythroseptica HQ643221P. cryptogea HQ643215
P. medicaginis HQ261608P. medicaginis HQ643273
P. trifolii HQ261719P. trifolii HQ643368
P. sansomea HQ643342P. sansomea HQ261669
P. ramorum HQ261662P. ramorum HQ643339
P. lateralis GU993901LatP. lateralis HQ643263
P. hibernalis HQ261576P. foliorum HQ261560
P. primulae HQ261651P. aff. primulae HQ261492
P. porri HQ643317P. brassicae HQ261512
P. syringae HQ261714P. austrocedri HQ261499
61
9182
100
100
95
59
52
76
82
62
71
100
83
100
100
91
100
100
0.2
CinnP. cinnamomi HQ643189P. cinnamomi HQ261526
CinnL1CinnL2
P. cinnamomi GU259227CinnL3
CinnL4Parv3P. parvispora HQ643199Parv2
P. parvispora HQ643200Parv1
P. europaea HQ261556P. uliginosa HQ261721
# P. alni subsp. alni AF139366# P. alni subsp. multiformis AF139368
# P. fragariae AF266762# P. rubi AF266761
# P. alni subsp. uniformis AF139367P. cambivora HQ643179
Camb3Camb1P. cambivora HQ643178
Camb2NiedL
Nied2Nied5
Nied4P. niederhauserii HQ261699
Nied3Nied1P. niederhauserii HQ261700P. niederhauserii JX494411
P. sojae HQ643348P. sojae HQ643349
P. pistaciae HQ261645P. cajani HQ261515
P. vignae HQ261723P. sinensis HQ261670P. melonis GU993906
95
93
72
100
100
71
100
84
93
98
100
92
100
100
67
87
100
100
93
0.2

37
Figure 2. Phylogenetic trees built using unique sequences representative of all detected sequence types ( ) along withsequences of reference isolates from Aragon-Caballero et al., 2008 , Brasier et al., 2004 #, Blomquist et al., 2012 ,Camele et al., 2005 , French et al., 2011 , Hurtado-Gonzales et al., 2009 , Jung & Burgess, 2009 , Reeser et al.,2011 , Robideau et al., 2011 and GenBank deposited sequences not associated with specific published articles ( ).Separate analyses were conducted for each Phytophthora spp. clade. Numbers on nodes represent the statistical support forthe Bayesian method.
Dissemination of Phytophthora in soil and root samples
Most positive root samples were found to be infected by 1 (8 samples) or 2 (6 samples)
Phytophthora phylotypes (Table 1). However, root samples of Petunia parviflora, Lobelia erinus, and
Dahlia campanulata from the nursery BL were infected by 3, 4 and 5 different phylotypes, respectively
(Table 1; Fig. 3). Similarly, most positive soil samples were found to be infested by 1 (13 samples) or 2
(6 samples) phylotypes, although 5 different Phytophthora phylotypes were detected in the soil sample
collected in the citrus orchard.
Sequences within the P. nicotianae phylotype were detected most abundantly, accounting for 22
out of 55 STs and associated with 15 different hosts from four different nurseries (TP, PV, CP and BL)
and the citrus orchard (Table 1; Fig. 3). Some STs of P. nicotianae were sourced from both soil and
roots (13) while others were detected in just soil (5) or root samples (4) (Fig. 2, 3). Several different P.
nicotianae STs were associated with a single host from samples collected in the nurseries but a single
ST was detected in the soil sample collected in the citrus orchard (Table 1; Fig. 3). STs differed at 12
single base pair locations with two homopolymeric runs of nucleotide bases A (0 to 3 repeats) or T (0
to 2 repeats). Most STs were identical or almost identical to sequences deposited in GenBank. However,
four STs (Ni8, Nic9, Nic10 and Nic11) mainly detected in P. parviflora, were not present in GenBank
and formed a separate bootstrap-supported clade (Fig. 2, 3).
Four phylotypes clustering in the Phytophthora clade 2 were detected (Fig. 3). They comprised
5 STs of P. citrophthora and 3 STs of P. meadii, detected in the citrus orchard and in the nurseries CP
and BL (Fig. 3). For both species there was an association between ST and host. Another phylotype

38
defined as P. meadii-like, was represented by a single ST (MeaL) and detected in the nursery BL.
Finally, a phylotype represented by a single ST (Citr) matched taxa described as P. citricola E or III
and was detected in soil samples of D. campanulata and L. erinus (nursery BL) and in soil and root
samples of Prunus mahaleb (nursery PG) (Table 1; Fig. 3).
Phytophthora phylotypes clustering in clade 7 were detected in six different nurseries and in the
citrus orchard (Fig. 3). Among the detected species, P. cambivora was represented by 3 STs and was
found in 8 different hosts from the citrus orchard and the nurseries BL and PG. P. niederhauserii was
represented by 5 STs and was found in 8 hosts from nurseries TP, PV, CP, ST and BL. A single ST of
P. cinnamomi was detected in nursery TP from Grevillea lanigera while 3 STs of P. parvispora were
found in the soil of the citrus orchard. Furthermore, 4 STs (CinnL1, CinnL2, CinnL3 and CinnL4)
defined as P. cinnamomi-like, constituted a well-supported group between P. cinnamomi and P.
parvispora and were detected in 3 hosts (G. lanigera, Bouganvillaea glabra and Cercis siliquastrum)
in nursery TP and ZZ (Table 1; Fig. 2, 3). Similarly, a ST related to P. niederhauserii (NiedL) was
detected in soil samples of Cyclamen persicum collected in nursery BL (Fig. 2, 3).
Two phylotypes clustering within the Phytophthora clade 8 were identified as P. lateralis or
associated with the species complex of P. cryptogea (Fig. 2, 3). P. lateralis was represented by a single
ST (Lat) detected in the soil of C. persicum, Tagetes erecta and Punica granatum and on the roots P.
parviflora, in two different nurseries (PV, ZZ). The phylotype associated to the species complex of P.
cryptogea was represented by 3 STs (Cry1, Cry2, Cry3) detected in 3 different hosts from nurseries TP
and CP.
Finally, two single STs detected in nursery ZZ from C. siliquastrum were associated with the
species complex of P. pseudosyringae (clade 3) and to P. taxon Pgchlamydo (clade 6).

39
O. europaea (S/R), C. cneorum (S), G. lanigera (S),Lavandula sp. (S), A. maritima (S/R), L. erinus (R),C. mauritanicus (S/R), C. persicum var. tianis (S),T. erecta (S), Petunia sp. (R), Mentha sp. (S/R)
Nic8
P. parviflora (S)
Nic9
P. parviflora (S)A. schoenoprasum (S)
Lavandula sp. (S)A. maritima (S)
Nic7
Nic22
L. erinus (R)
C. persicum var. tianis (S)
G. lanigera (S)Lavandula sp. (S)C. mauritanicus (S/R)Petunia sp. (R)
Nic2
Petunia sp. (R)
A. maritima (S)D. campanulata (R)
Nic18
Mentha sp. (R)C. reticulata (S)
A. maritima (S/R)
Nic16
A. maritima (R)
Nic17
O. europaea (R), G. lanigera (S),
Lavandula sp. (S), P. parviflora (R),C. mauritanicus (S)
Nic13
D. campanulata (R)L. erinus (R)
A. maritima (S/R)
Nic14
Lavandula sp. (S)A. maritima (S/R)
Nic11
C. persicum var. tianis (R)P. parviflora (S)
P. parviflora (S)
Nic5
Nic10
Nic6
Nic21
Nic20
O. europaea (S)
O. europaea (R)A. maritima (S)
Nic15
O. europaea (S/R), C. cneorum (S),Lavandula sp. (S), A. maritima (S/R),C. mauritanicus (S), C. persicum var. tianis (R),P. parviflora (R), Petunia sp. (R),Mentha sp. (R), L. erinus (R),D. campanulata (R), A. schoenoprasum (S)
Mentha sp. (S/R)
D. campanulata (R)P. parviflora (R)
G. lanigera (R)O. europaea (S/R), G. lanigera (S),
Lavandula sp. (S), A. maritima (S/R),C. mauritanicus (S),P. parviflora (S), Mentha sp. (R)
CLADE 1
Nic1
Nic19
Nic4
Nic12
Nic3
D. campanulata (R)
L. erinus (R)P. mahaleb (S/R)
Citr
Citro1
R. officinalis var. erectus (S)
C. reticulata (S)
Citro4 R. officinalis var. erectus (S)
R. officinalis var. erectus (S)
Citro3 C. reticulata (S)
MeaL
D. campanulata (R)
Mea2
Mentha sp. (S)
Mea1
I. nuova guinea (R)
C. reticulata (S)Mentha sp. (S)
Mea3P. parviflora (R)
L. erinus (R)
Citro5
CLADE 2
Citro2 C. reticulata (S)
PseudC. siliquastrum (S)
CLADE 3
Cryp3
C. cneorum (S/R)
Cryp1
R. officinalis var. erectus (S)C. cneorum (S)Salvia sp. (R)
R. officinalis var. erectus (S)C. cneorum (R)Salvia sp. (R)
Cryp2
C. persicum var. tianis (S)P. parviflora (R)T. erecta (S)P. granatum (S)
Lat
CLADE 8
PgchC. siliquastrum (S)
CLADE 6
NURSERY TP
NURSERY PV
NURSERY ZZ
NURSERY CP
NURSERY PG
NURSERY BL
NURSERY ST
CITRUS GROVE
CinnL2
Cinn G. lanigera (S)
CinnL1G. lanigera (S)B. glabra (S)C. siliquastrum (S)
Parv1
C. reticulata (S)
G. lanigera (R)B. glabra (S)
CinnL4
B. glabra (S)
Parv3C. reticulata (S)
Parv2
C. reticulata (S)
CinnL3
B. glabra (S)
CLADE 7
P. parviflora (R), C. persicum (S)R. officinalis (S), D. campanulata (R)I. nuova guinea (R), P. mahaleb (S/R)C. reticulata (S)
P. parviflora (R)L. erinus (R)R. officinalis (S)D. campanulata (R)
Camb3
P. parviflora (R)R. officinalis (S)
Camb1Camb2
C. cneorum (S), O. europaea (R),D. kaki (S/R), C. persicum (S),D. campanulata (R),F. magellanica (S/R)
Salvia sp. (S)Salvia sp. (S)
C. persicum var. tianis (R)F. magellanica (S/R)
Nied2
NiedL
C. persicum (S)
Nied4
D. kaki (R)
Nied3
Nied5
Nied1

40
Figure 3. Sequence type (ST) network based on Phytophthora ITS1 sequences detected in soil and root samples collectedfrom potted plantlets in 8 different nurseries and in a soil sample collected from a citrus grove. The network was constructedusing a statistical parsimony algorithm implemented in TCS 1.21 (Clement et al., 2000). Different colors are used to linkeach ST to sampling locality while the circle size represents the relative frequency of positive samples in which each STwas detected (smallest and largest circles represent 1 and 15 STs, respectively). STs were directly connected without dotswhen differing by a single change. Every additional putative change was indicated by adding a dot. The name of the hostspecies along with the letters "R" (root samples) and/or "S" soil (soil samples) is reported alongside each ST. Delimitatedgroups of STs represent different Phytophthora spp. clades (Cooke et al., 2000; Kroon et al., 2012). STs were identifiedaccording to their phylogenetic collocation (Fig. 1) and named using the first 3-5 letters of the corresponding identifiedspecies.
DISCUSSION
In the present study the genetic diversity of Phytophthora spp. was investigated in potted
ornamental and fruit tree species collected in nurseries located in Apulia and Calabria (Southern Italy)
using a molecular method based on a semi-nested PCR with Phytophthora genus specific primers
(Scibetta et al., 2012). This amplicon-based metagenomic approach provided considerable detail on the
diversity of species present in these nurseries and valuable information about the population structure
in some taxa. Within the 800 ITS1 clones sequenced in this study we identified nine phylotypes
corresponding to defined Phytophthora taxa (P. nicotianae, P. citrophthora, P. meadii, P. taxon
Pgchlamydo, P. cinnamomi, P. parvispora, P. cambivora, P. niederhauserii, and P. lateralis) and a
phylotype associated to P. citricola taxon E or III. Although the phylogenetic analysis did not provide
an adequate level of resolution for P. citricola the accurate analysis of reference sequences showed the
consistence of a few polymorphic bases available within the ITS1 region and enabled the reliable
identification of the taxa (Table 3; Fig. 1; Jung & Burgess, 2009). On the contrary the identification of
phylotypes associated to the P. cryptogea and P. pseudosyringae species complexes was more
challenging due to the remaining taxonomic uncertainties and limited diversity within the ITS1 regions
of these groups (Robideau et al., 2011). The ITS1 region is however more variable than the ITS2
region and provides the optimal barcode locus given its sequence length and the risk of PCR chimaera
formation when amplifying across the ITS1 and ITS2 regions (Cooke et al., 2000; Robideau et al.,
41
2011; Scibetta et al., 2012). In addition to the identified species or species complex, three phylotypes
were considered as representative of unknown Phytophthora taxa and defined as P. meadii-like, P.
cinnamomi-like, and P. niederhauserii-like.
Among the identified phylotypes, P. nicotianae was largely the most abundant. This result was
partially expected considering that P. nicotianae is responsible for severe foliar and fruit diseases as
well as root and crown rots on herbaceous and perennial plant species in more than 250 genera,
including horticultural and fruit trees. Different reports have revealed the wide dissemination of P.
nicotianae in nurseries of potted ornamentals and fruit tree species, however, to the best of our
knowledge the present study represents the first evidence of P. nicotianae on Armeria maritima,
Convolvolus mauritanicus, T. erecta, Allium schoenoprasum, L. erinus and D. campanulata (Moralejo
et al., 2009). According to BLAST analyses many STs detected in the present study were shared with
isolates of worldwide origin and from a wide range of hosts including ornamental species. These data
support a primary role of the nursery trade as one of the most efficient dissemination pathways of P.
nicotianae as well as other Phytophthora species (Mammella et al., 2011, 2013). Furthermore, in
agreement with the presence of both mating types in nurseries (Mammella et al., 2013), the recorded
high genetic variation within ITS1 sequences of P. nicotianae suggests the existence of multiple
introductions throughout the crop cycle, but accurate population analyses would be necessary to
confirm this hypothesis and determine the source of genotypes. New introductions could lead to the
development of new genotypes or hybrids, which could undermine management practices in areas
where these organisms appear to be under control and constitutes a growing threat to local agriculture
and natural ecosystems (Brasier, 2008). In agreement with our results, a recent survey on ornamental
nurseries in Maryland, revealed a high diversity of Phytophthora spp. from small samples of recycled
potting media, suggesting the large amount of sources of introduction and spread of variability among
Phytophthora spp. (Bienapfl & Balci, 2014). In addition, P. nicotianae will undoubtedly benefit from

42
the climatic change. Its host range generally includes those of other species of prime economic
importance such as P. capsici, P. infestans and P. citrophthora but generally requires warmer
conditions than these other species (Erwin & Ribeiro, 1996). Consequently, the increased risk of rapid
spread due to global nursery trade and potential global warming are likely to provide a strong catalyst
for the expansion of this species as already reported under Mediterranean climates (Andrés et al., 2003),
and Eastern India (Guha Roy et al., 2009).
Ten different STs clustered within the Phytophthora clade 2 and were associated with P.
citricola taxon E or III (Jung & Burgess, 2009), P. citrophthora and P. meadii. A single ST defined as
P. meadii-like was genetically distant from the others and probably represents an undescribed taxon.
Both P. citrophthora and P. citricola have been detected in nurseries and have been reported as
responsible for serious losses in United States (MacDonald et al., 1994; Donahoo et al., 2006;
Garibaldi et al., 2006; Schwingle et al., 2007; Warfield et al., 2008; Yakabe et al., 2009; Leonberger et
al., 2013). The detection of P. citrophthora on Citrus spp. and Rosmarinus officinalis is not surprising
since these species are well documented hosts of this pathogen (Erwin & Ribeiro, 1996). Similarly, P.
citricola has been already reported on several flowering plants and P. mahaleb (Gadgil, 2005). Much
more surprising was the detection of three different STs of a phylotype matching P. meadii in soil
and/or roots of 4 different ornamental species in the nursery BL and in the citrus orchard. This
pathogen is normally distributed in tropical countries and to the best of our knowledge it had not been
previously recorded in Italy. Although currently available data does not enable speculation about origin
and introduction pathways, the detection of three different STs on different hosts suggests the
occurrence of multiple introduction and/or recombination events.
A single ST of P. taxon Pgchlamydo was detected on C. siliquastrum, a tree native of the
eastern Mediterranean region and widely distributed in western Asia mainly along the banks of streams.
The presence of P. taxon Pgchlamydo on this plant species is in agreement with its abundance in

43
streams and the high temperature optima for growth and survival (Jung et al., 2011). Phytophthora
taxon Pgchlamydo has been widely detected in Minnesota and California nurseries and identified as the
causal agent of diseases on Rhododendron, Taxus spp. and evergreen nursery stock (Schwingle et al.,
2007; Yakabe et al., 2009; Blomquist et al., 2012).
A single ST was identified as P. cinnamomi and was detected on Grevillea lanigera. This
pathogen is well established in natural environments and common on economically important plants
including G. lanigera (Shivas, 1989). Apart from P. cinnamomi a closely related phylotype defined as
P. cinnamomi-like was detected in 3 hosts, including G. lanigera, in two different nurseries. BLAST
analyses revealed the existence of a sequence (GU259227) identical to the detected STs (CinnL1) for
an isolate (P16233) of the World Oomycete Genetic Resource Collection
(http://phytophthora.ucr.edu/databasemain.html). Although the sequence of this isolate was deposited
as P. cinnamomi the phylogenetic analyses conducted in the present study revealed a significant genetic
distance that support it as possible new species in line with currently available barcode sequences
(Robideau et al., 2011). Interestingly, isolate P16233 was obtained from an ornamental plant
(Rosmarinus sp.) in a nursery located in California. Another closely related species, P. parvispora, was
detected in the soil of the citrus orchard with three different STs. This species had been long considered
as a variety of P. cinnamomi but based on morphological, physiological and molecular analyses it was
recently elevated to new species (Scanu et al., 2014). Scanu and co-workers (2014) have reported that
almost all findings of P. parvispora are linked to the trade of nursery plants and escape from its
unknown native environment must have happened only recently since the first record of P. parvispora
in Europe dates back only 20 years. In this context the detection of P. parvispora in the soil of a citrus
orchard in Europe represents a new record.
Of relevant importance seem to be also the detection of P. cambivora in the soil of the citrus
orchard and on seven different ornamental hosts in 2 different nurseries. To the best of our knowledge

44
none of the hosts identified in the present survey has been reported previously. Indeed, P. cambivora is
a well known forest pathogen and in the United States is a common root pathogen of commercial stone
fruit orchards but has been rarely found in association with nursery crops (Warfield et al., 2008;
Yakabe et al., 2009).
A phylotype identified as P. niederhauserii was detected in 4 nurseries from 4 different hosts.
In recent years, this species has been increasingly reported in greenhouses in association with shrubs
and herbaceous ornamentals, but to the best of our knowledge none of the hosts identified in the present
study has been previously reported (Abad et al., 2014). In Sicily (Southern Italy) it was isolated from
roots of potted sage-leaf rock rose, banksia, mimosa and crimson bottlebrush (Cacciola et al., 2009a, b;
Faedda et al., 2013a) while in Valencia province (Spain) it was associated with a severe decline of 2-
years-old almond trees in a nursery (Perez-Sierra & Jung, 2013). The detection of P. niederhauserii
from potted plantlets of Diospyros kaki in nursery ST was of interest since it was the only species of
Phytophthora detected and plantlets showed severe symptoms of dieback. The frequent detection of P.
niederhauserii phylotypes in the present study and the presence of different STs suggests multiple
introductions and spread from nurseries to open field orchards may be a significant threat.
A phylotype clustering within the Phytophthora clade 8 was identified as P. lateralis. This
species has never before been recorded in Italy and until recently was considered to be absent in
Europe. It has been rarely detected in nurseries in France and The Netherlands but it was believed to be
eradicated (Hansen et al., 1999; Green et al., 2012). Most P. lateralis infections in the UK, France and
the Netherlands have been on Chamaecyparis lawsoniana, however its recent isolation from Thuja
occidentalis in a nursery led to recommend it for listing as an A1 quarantine organism by the European
Plant Protection Organism (EPPO) in 2006 (Schlenzig et al., 2011). The detection of a single ST in two
Italian nurseries on four different hosts suggests a recent introduction of the pathogen but also indicates
a serious threat since it suggests rapid dissemination is possible once the pathogen is introduced in a

45
new environment. Another clade 8 phylotype was detected in two nurseries and associated to the
species complex of P. cryptogea that is a well-documented pathogen in nurseries and greenhouses
(MacDonald et al., 1994; Donahoo et al., 2006; Leonberg et al., 2013).
In the present study a total of 55 Phytophthora ITS1 STs were detected and considerable
within-species variation in ITS1 sequence was observed with between 1 and 22 STs in each of the 15
identified phylotypes. Variability in heterothallic species was generally higher than in the homothallic
ones. This may be a reflection of outcrossing events that are particularly favored in the nurseries where
many different plant species are grown together, favoring the meeting of different genetically distant
isolates. Indeed several different STs of P. nicotianae were frequently associated with a single host in
samples collected from nurseries, while a single ST of this species was found in the soil of the citrus
orchard (Cfr. Fig. 1). In agreement the analysis of mitochondrial and nuclear markers within a broad
population of P. nicotianae revealed an important role of nurseries in increasing genetic recombination
within the species (Mammella et al., 2013). These authors speculated an important role of nursery
populations in increasing genetic recombination within the species while isolates from specialized
cultivation seem to be mainly the result of asexually propagated clones, adapted to a specific host. In
the present study, an exception was represented by P. cinnamomi since a single ST (Cinn) was detected
in a single host and in a single nursery. However, the high genetic uniformity detected for this
heterothallic species may be just the result of its low abundance in the assayed environments
suggesting a possible recent introduction of one or both mating types. Furthermore, recent
investigations have revealed that hyphal aggregates in plant tissue are a more significant survival
strategy for P. cinnamomi, even when oospores are present (Jung et al., 2013).
A conventional Sanger sequencing approach was utilized to determine sequences. Although this
technique is much less powerful if compared with more recent high-throughput sequencing approaches
it has the great advantage of providing very reliable sequences especially if, as done in the present

46
study, sequences are determined in both directions. This aspect is particularly important for
Phytophthora since several species are differentiated by a limited number of consistent ITS nucleotide
differences (Schena & Cooke, 2006; Robideau et al., 2011; Martin et al., 2012). Considering that
artifacts due to DNA polymerase errors could have been theoretically introduced during four different
steps (first and second semi-nested PCR, plasmid replication and colony PCR) it is theoretically
possible that some of the detected STs are the result of errors. However, several considerations support
the authenticity of the data. Firstly, the identified STs were represented by at least two sequences given
that singleton sequences were excluded as a precaution. Since the introduction of identical errors in two
independently generated sequences is improbable, it seems possible to exclude the existence of errors
introduced during the last two steps (plasmid replication and colony PCR). The risk of errors
introduced in the first two steps (semi-nested PCR) was greatly reduced by the use of a high-fidelity
polymerase (Lindahl et al., 2013). The high-fidelity enzyme also reduced the risk of recombinant
(chimeric) amplicons (Lahr & Katz, 2009). The identification of the same STs in different samples
(separate extraction and amplifications) provided further evidence for data accuracy. Based on these
considerations it is likely that the detected genetic diversity was underestimated rather than
overestimated, since some of the excluded single sequences could actually be true STs.
In conclusion results of the present study highlighted a very complex situation in potted
ornamental nurseries with large number of Phytophthora taxa detected in a limited geographic area.
Although some Phytophthora species and host pathogen combinations were already well documented,
the present study revealed new host-pathogen combinations, new species previously unreported in Italy
or Europe and new phylotypes probably representative of still undetermined species showing the high
potential value of the molecular diagnostic method used in this study. Although the lack of a culture of
these hypothetical new species prevents an accurate evaluation of their role as plant pathogens, this
type of molecular analysis offers advance warning of potential threat and enables follow-up targeted

47
sampling to isolate the organism (Brasier, 2008). Our results reinforce the primarily role of plant
nurseries in favoring the introduction and dissemination of Phytophthora species and the additional
threat of their accelerated evolution via intra- and inter-specific sexual recombination or hybridisation
(Brasier, 2008; Faedda et al., 2013b; Leonberger et al., 2013). There is an urgent need for new
management strategies based on the enforcement of proactive and preventative approaches to the
nursery plant production in order to minimize the risks posed by Phytophthora species (Parke &
Grünwald, 2012).
ACKNOWLEDGMENTS
This work was supported by grant MIUR-FIRB 2010 (RBFR10PZ4N) from the Italian Ministry of
Education, University and Research (MIUR) “Metagenomic strategies to assess genetic diversity in
soil-borne Phytophthora species”. We are grateful to Dr. Pasquale Schena for his valuable assistance
during nurseries surveys and samplings.
REFERENCES
Abad ZG, Abad JA, Cacciola SO, Pane A, Faedda R, Moralejo E, Pérez-Sierra A, Abad-Campos P,
Alvarez-Bernaola LA, Bakonyi J, Józsa A, Herrero ML, Burgess TI, Cunnington JH, Smith IW,
Balci Y, Blomquist C, Henricot B, Denton G, Spies C, Mcleod A, Belbahri L, Cooke DEL,
Kageyama K, Uematsu S, Kurbetli I, Degĭrmenci K, 2014. Phytophthora niederhauserii sp. nov.,
a polyphagous species associated with ornamentals, fruit trees and native plants in 13 countries.
Mycologia 106, 431-447.
Andrés JL, Rivera A, Fernández J, 2003. Phytophthora nicotianae pathogenic to pepper in northwest
Spain. Journal of Plant Pathology 85, 91-98.

48
Aragon-Caballero LM, Hurtado-Gonzales OP, Flores-Torres JG, Apaza-Tapia W, Lamour KH, 2008.
First report of Phytophthora nicotianae causing asparagus spear and root rot in Peru. Plant
Disease 92, 982.
Bienapfl JC, Balci Y, 2014. Movement of Phytophthora spp. in Maryland’s nursery trade. Plant
Disease 98, 134-144.
Blomquist CL, Yakabe LE, Soriano MC, Negrete MA, 2012. First report of leaf spot caused by
Phytophthora taxon pgchlamydo on evergreen nursery stock in California. Plant Disease 96,
1691.
Brasier CM, Kirk, S A, Delcan, J., Cooke, DEL, Jung, T, Man in’t Veld WA, 2004. Phytophthora alni
sp. nov. and its variants: designation of emerging heteroploid hybrid pathogens spreading on
Alnus trees. Mycological Research 108, 1172–1184.
Brasier CM, 2008. The biosecurity threat to the UK and global environment from international trade in
plants. Plant Pathology 57, 792-808.
Brasier CM, 2009. Phytophthoras in Forests and Natural Ecosystems. In: Goheen EM, Frankel SJ, tech.
coords. Proceedings of the fourth meeting of the International Union of Forest Research
Organizations (IUFRO) Working Party S07.02.09. General Technical Report PSW-GTR-221.
Albany, CA: U.S. Department of Agriculture, Forest Service, Pacific Southwest Research Station,
101–115.
Cacciola SO, Pane A, Martini P, Agosteo GE, Raudino F, Magnano di San Lio G, 2008. Recovery of
Phythophthora species from potted ornamentals in commercial nurseries in Italy. Journal of
Plant Pathology 90, S2.185.
Cacciola SO, Scibetta S, Pane A, Faedda R, Rizza C, 2009a. Callistemon citrinus and Cistus salvifolius,
two new hosts of Phytophthora taxon niederhauserii in Italy. Plant Disease 93, 1075.
49
Cacciola SO, Scibetta S, Martini P, Rizza C, Pane A, 2009b. Phytophthora taxon niederhauserii, a new
root and crown rot pathogen of Banksia spp. in Italy. Plant Disease 93, 1216.
Camele I, Marcone C, Cristinzio G, 2005. Detection and identification of Phytophthora species in
southern Italy by RFLP and sequence analysis of PCR-amplified nuclear ribosomal DNA.
European Journal of Plant Pathology 113, 1-14.
Clement M, Posada D, Crandall K, 2000. TCS: a computer program to estimate gene genealogies.
Molecular Ecology 9, 1657-1660.
Cooke DEL, Drenth A, Duncan JM, Wagels G, Brasier CM, 2000. A molecular phylogeny of
Phytophthora and related Oomycetes. Fungal Genetics and Biology 30, 17-32.
Cooke DEL, Schena L, Cacciola SO, 2007. Tools to detect, identify and monitor Phytophthora species
in natural ecosystems. Journal of Plant Pathology 89, 13-28.
Donahoo R, Blomquist CL, Thomas SL, Moulton JK, Cooke DEL, Lamour KH, 2006. Phytophthora
foliorum sp. nov., a new species causing leaf blight of azalea. Mycological Research 110, 1309-
1322.
Erwin DC, Ribeiro OK, 1996. Phytophthora Diseases Worldwide. St. Paul, MN, US: American
Phytopathological Society.
Faedda R, Cacciola SO, Pane A, Martini P, Odasso M, Magnano di San Lio G, 2013a. First report of
Phytophthora taxon niederhauserii causing root and stem rot of mimosa in Italy. Plant Disease
97, 688.
Faedda R, Cacciola SO, Pane A, Szigethy A, Bakonyi J, Man in't Veld WA, Martini P, Schena L,
Magnano di San Lio G, 2013b. Phytophthora × pelgrandis Causes Root and Collar Rot of
Lavandula stoechas in Italy. Plant Disease 97, 1091-1096.
French JM, Stamler RA, Randall J, Goldberg NP, 2011. First Report of Phytophthora nicotianae on
bulb onion in the United States. Plant Disease 95: 1028.

50
Gadgil PD, 2005. Fungi of New Zealand Volume 4: Fungi on trees and shrubs in New Zealand. Hong
Kong, China: University of Hong Kong, Centre for Research in Fungal Diversity.
Garibaldi A, Bertetti D, Minerdi D, Gullino ML, 2006. First Report of Phytophthora citrophthora on
Penstemon barbatus in Italy. Plant Disease 90, 1260.
Goss EM, Larsen M, Vercauteren A, Werres S, Heungens K, Grünwald NJ, 2011. Phytophthora
ramorum in Canada: Evidence for migration within North America and from Europe.
Phytopathology 101, 166-171.
Green S, Brasier CM, Schlenzig A, McCracken A, MacAskill GA, Wilson M, Webber JF, 2012. The
destructive invasive pathogen Phytophthora lateralis found on Chamaecyparis lawsoniana
across the UK. Forest Pathology 43, 19–28.
Guha Roy S, Bhattacharyya S, Mukherjee SK, Khatua DC, 2009. Molecular identification of
Phytophthora spp. affecting some economically important crops in eastern India through ITS-
RFLP and sequencing of the ITS region. Journal of Phytopathology 157, 666-674.
Hall BG, 2013. Building phylogenetic trees from molecular data with MEGA. Molecular Biology and
Evolution 30, 1229–1235.
Hansen EM, Streito C, Delatour C, 1999. First confirmation of Phytophthora lateralis in Europe. Plant
Disease 83, 587.
Hurtado-Gonzales OP, Aragon-Caballero LM, Flores-Torres JG, Man in 't Veld W, Lamour KH, 2009.
Molecular comparison of natural hybrids of Phytophthora nicotianae and P. cactorum infecting
loquat trees in Peru and Taiwan. Mycologia 101, 496-502.
Jung T, Burgess TI, 2009. Re-evaluation of Phytophthora citricola isolates from multiple woody hosts
in Europe and North America reveals a new species, Phytophthora plurivora sp. nov. Persoonia
22, 95–110.
51
Jung T, Stukely MJC, Hardy GEStJ, White D, Paap T, Dunstan WA, Burgess TI, 2011. Multiple new
Phytophthora species from ITS Clade 6 associated with natural ecosystems in Australia:
evolutionary and ecological implications. Persoonia 26, 13-39.
Jung T, Colquhoun IJ, Hardy GEStJ, Woodward S, 2013. New insights into the survival strategy of the
invasive soilborne pathogen Phytophthora cinnamomi in different natural ecosystems in Western
Australia. Forest Pathology 43, 266-288.
Kroon LPNM, Brouwer H, de Cock AWAM, Govers F, 2012. The genus Phytophthora anno 2012.
Phytopathology 102, 348-364.
Lahr DJG, Katz LA, 2009. Reducing the impact of PCR-mediated recombination in molecular
evolution and environmental studies using a new-generation high-fidelity DNA polymerase.
BioTechniques 47, 857-866.
Leonberger AJ, Speers C, Ruhl G, Creswell T, Beckerman JL, 2013. A survey of Phytophthora spp. in
Midwest nurseries, greenhouses, and landscapes. Plant Disease 97, 635-640.
Librado P, Rozas J, 2009. DnaSP v5: a software for comprehensive analysis of DNA polymorphism
data. Bioinformatics 25, 1451-1452.
Lindahl BD, Nilsson RH, Tedersoo L, Abarenkov K, Carlsen T, Kjøller R, Koljalg U, Pennanen T,
Rosendahl S, Stenlid J, Kauserud H, 2013. Fungal community analysis by high-throughput
sequencing of amplified markers – a user’s guide. New Phytologist 199, 288-299.
MacDonald JD, Ali-Shtayeh MS, Kabashima J, Stites J, 1994. Occurrence of Phytophthora in
recirculated nursery irrigation effluents. Plant Disease, 78, 607–611
Mammella MA, Cacciola SO, Martin F, Schena L, 2011. Genetic characterization of Phytophthora
nicotianae by the analysis of polymorphic regions of the mitochondrial DNA. Fungal Biology
115, 432-442.

52
Mammella MA, Martin FN, Cacciola SO, Coffey MD, Faedda R, Schena L, 2013. Analyses of the
population structure in a global collection of Phytophthora nicotianae isolates inferred from
mitochondrial and nuclear DNA sequences. Phytopathology 103, 610-622.
Martin FN, Abad ZG, Balci Y, Ivors K, 2012. Identification and detection of Phytophthora: reviewing
our progress, identifying our needs. Plant Disease 96, 1080-1103.
Milne I, Lindner D, Bayer M, Husmeier D, McGuire G, Marshall DF, Wright F, 2008. TOPALi v2: a
rich graphical interface for evolutionary analyses of multiple alignments on HPC clusters and
multi-core desktops. Bioinformatics 25, 126-127.
Moralejo E, Pérez-Sierra AM, Álvarez LA, Belbahri L, Lefort F, Descals E, 2009. Multiple alien
Phytophthora taxa discovered on diseased ornamental plants in Spain. Plant Pathology 58, 100-
110.
Parke JL, Grünwald NJ, 2012. A systems approach for management of pests and pathogens of nursery
crops. Plant Disease 96, 1236-1244.
Parke JL, Knaus BJ, Fieland VJ, Lewis C, Grünwald NJ, 2014. Phytophthora community structure
analyses in Oregon nurseries inform systems approaches to disease management. Phytopathology
104, 1052-1062.
Perez-Sierra A, Jung T, 2013. Phytophthora in woody ornamental nurseries. In: Phytophthora: A
Global Perspective. Wallingford, UK: CAB International.
Reeser PW, Sutton W, Hansen EM, Remigi P, Adams GC, 2011. Phytophthora species in forest
streams in Oregon and Alaska. Mycologia 103, 22-35.
Robideau GP, Decock AWAM, Coffey MD, Voglmayr H, Brouwer H, Bala K, Chitty DW, De’
Saulniers N, Eggertson QA, Gachon CMM, Hu C-H, Küpper FC, Rintoul TL, Sarhan E,
Verstappen ECP, Zhang Y, Bonants PJM, Ristaino JB, Le´ Vesque CA, 2011. DNA barcoding of

53
Oomycetes with cytochrome c oxidase subunit I and internal transcribed spacer. Molecular
Ecology Resources 11, 1002-11.
Ruano-Rosa D, Schena L, Ippolito A, Lòpez-Herrera J, 2007. Comparison of conventional and
molecular methods for the detection of Rosellinia necatrix in avocado orchards in southern Spain.
Plant Pathology, 56, 251-256.
Sanzani SM, Li Destri Nicosia MG, Faedda R, Cacciola SO, Schena L, 2013. Use of Quantitative PCR
detection methods to study biocontrol agents and phytopathogenic Fungi and Oomycetes in
environmental samples. Journal of Phytopathology 162, 1–13.
Scanu B, Hunter GC, Linaldeddu BT, Franceschini A, Maddau L, Jung T, Denman S, 2014. A
taxonomic re-evaluation reveals that Phytophthora cinnamomi and P.cinnamomi var. parvispora
are separate species. Forest Pathology 44, 1–20.
Schena L, Nigro F, Ippolito A, 2002. Identification and detection of Rosellinia necatrix by
conventional and Real Time Scorpion-PCR. European Journal of Plant Pathology 108, 355-366.
Schena L, Ippolito A, 2003. Rapid and sensitive detection of Rosellinia necatrix in roots and soils by
Real Time Scorpion-PCR. Journal of Plant Pathology 85, 15-25.
Schena L, Cooke DEL, 2006. Assessing the potential of regions of the nuclear and mitochondrial
genome to develop a “molecular tool box” for the detection and characterization of Phytophthora
species. Journal of Microbiological Methods 67, 70-85.
Schena L, Hughes KJD, Cooke DEL, 2006. Detection and quantification of Phytophthora ramorum, P.
kernoviae, P. citricola and P. quercina in symptomatic leaves by multiplex real-time PCR.
Molecular Plant Pathology 7, 365–379.
Schlenzig A, Campbell R, Mulholland V, 2011. Thuja occidentalis: a new host for Phytophthora
lateralis. New Disease Report 24, 8.
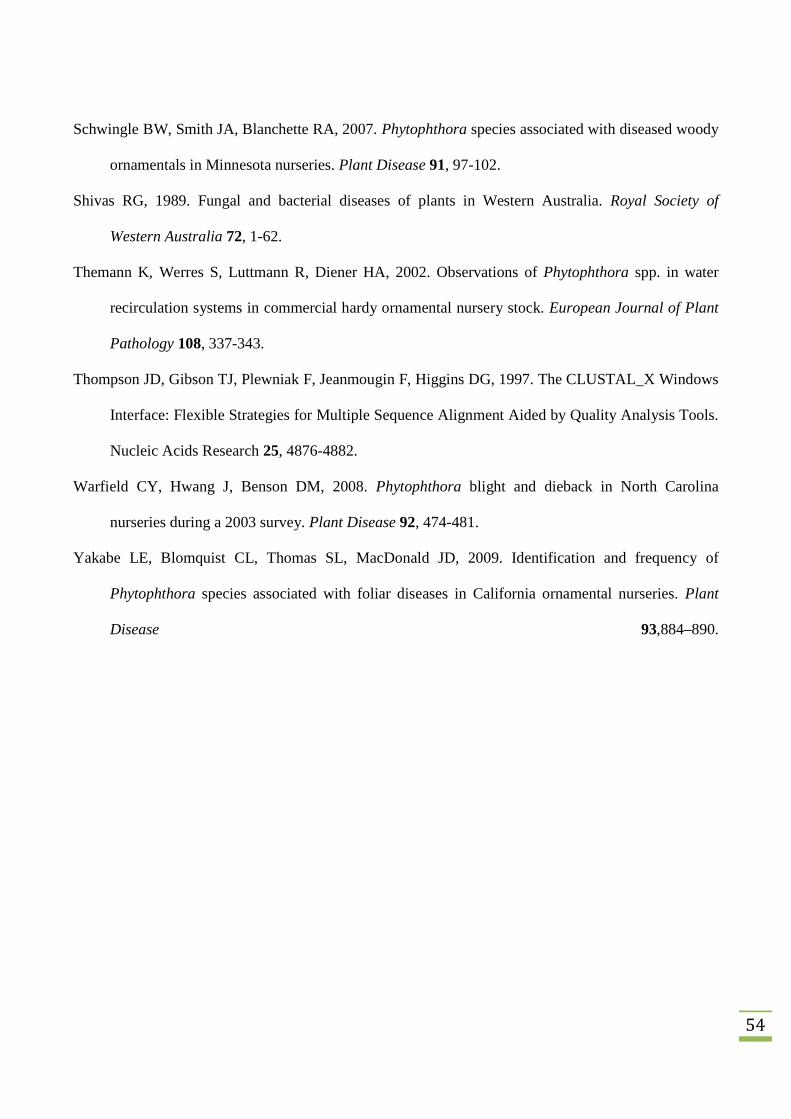
54
Schwingle BW, Smith JA, Blanchette RA, 2007. Phytophthora species associated with diseased woody
ornamentals in Minnesota nurseries. Plant Disease 91, 97-102.
Shivas RG, 1989. Fungal and bacterial diseases of plants in Western Australia. Royal Society of
Western Australia 72, 1-62.
Themann K, Werres S, Luttmann R, Diener HA, 2002. Observations of Phytophthora spp. in water
recirculation systems in commercial hardy ornamental nursery stock. European Journal of Plant
Pathology 108, 337-343.
Thompson JD, Gibson TJ, Plewniak F, Jeanmougin F, Higgins DG, 1997. The CLUSTAL_X Windows
Interface: Flexible Strategies for Multiple Sequence Alignment Aided by Quality Analysis Tools.
Nucleic Acids Research 25, 4876-4882.
Warfield CY, Hwang J, Benson DM, 2008. Phytophthora blight and dieback in North Carolina
nurseries during a 2003 survey. Plant Disease 92, 474-481.
Yakabe LE, Blomquist CL, Thomas SL, MacDonald JD, 2009. Identification and frequency of
Phytophthora species associated with foliar diseases in California ornamental nurseries. Plant
Disease 93,884–890.

55
TABLE 2. List of Phytophthora species and ITS1 sequence types (STs) identified in potted nursery roots and soils inApulia and Calabria (Southern Italy), using an amplicon metagenomics approach based on the use of Phytophthora genusspecific primers (Scibetta et al., 2012). Host species in which STs were detected and GenBank accession numbers forsequences are also reported. The name of the host species is followed by the letters "R" and/or "S" to indicate roots and soilsamples, respectively. STs were grouped according to the identified species using ITS1 sequence as a barcode gene.
Phytophthora nicotianae
GenotypeSNP sites
HostAccessionnumber7 15 22 39 52 70 75 84 120 121 122 157 164 165
Nic1 C - A C G T G T A - - C T - G. lanigera (S), Lavandula sp. (S),A. maritima (S/R), O. europaea(S/R), C. mauritanicus (S/R), C.cneorum (S), C. persicum var.tianis (S), T. erecta (S), Petunia sp.(R), Mentha sp. (S/R), L. erinus (R)
KJ601204
Nic2 . . . . . . . . . . . . - . Petunia (R), A. maritima (S), D.campanulata (R)
KJ601205
Nic3 . . . . . . . . . A . . . . G. lanigera (S), Lavandula sp. (S),A. maritima (S/R), O. europaea(S/R), C. mauritanicus (S), Menthasp. (R), P. parviflora (S)
KJ601206
Nic4 . . . . . . . . - . . . . . Lavandula sp. (S), G. lanigera (S),C. mauritanicus (S/R), C. persicumvar. tianis (S), Petunia sp. (R)
KJ601207
Nic5 . A . . . . . . . . . . . . Mentha sp. (S/R), P. parviflora (R),D. campanulata (R)
KJ601208
Nic6 . . . . . . A . . . . . . . O. europaea (R), A. maritima (S) KJ601209
Nic7 . . . . . . . C . . . . . . Lavandula sp. (S), A. maritima (S),A. schoenoprasum (S)
KJ601210
Nic8 . . . T . . . . . . . . . . P. parviflora (S) KJ601211
Nic9 . . . T . . . . . . . T . . P. parviflora (S) KJ601212
Nic10 . . . T . C . . . A . . . . P. parviflora (S) KJ601213
Nic11 . . . T . . . . . A . . . . C. persicum var. tianis (R), P.parviflora (S)
KJ601214
Nic12 . . . . . . . . . A . . . T G. lanigera (S), Lavandula sp. (S),O. europaea (R), C. mauritanicus(S), P. parviflora (R)
KJ601215
Nic13 . . . . - . . . . A . . . T D. campanulata (R), L. erinus (R) KJ601216
Nic14 . . . . . . . . . A A . . T A. maritima (S/R) KJ601217
Nic15 . . . . . . . . . A A . . . Lavandula sp. (S), A. maritima(S/R)
KJ601218
Nic16 . . . . . . . . . A A . - . A. maritima (S/R) KJ601219
Nic17 . A G . . . . . . A . . . . A. maritima (R) KJ601220
Nic18 . A . . . . . . - . . . . . Mentha sp.(R), C. reticulata (S) KJ601221

56
Nic19 . . . . . . A C . . . . . . Lavandula sp. (S), A. maritima(S/R), O. europaea (R), C.mauritanicus (S), C. cneorum (S),C. persicum var. tianis (R), Petuniasp. (R), P. parviflora (R), Menthasp. (R), L. erinus (R), D.campanulata (R), A.schoenoprasum (S)
KJ601222
Nic20 T . . . . . A C - . . . . . O. europaea (S) KJ601223
Nic21 . . . . . . A . - . . . . . G. lanigera (R) KJ601224
Nic22 . . . . G . A C . . . . . T L. erinus (R) KJ601225
Phytophthora citrophthora
GenotypeSNP sites
HostAccessionnumber15 16 71 78 160
Citro1 A - T C A R. officinalis var. erectus (S), C. reticulata (S) KJ601190
Citro2 . A . . . C. reticulata (S) KJ601191
Citro3 . . - T . C. reticulata (S) KJ601192
Citro4 - . . . T R. officinalis var. erectus (S) KJ601193
Citro5 - . - . T R. officinalis var. erectus (S) KJ601194
Phytophthora niederhauserii
GenotypeSNP sites
HostAccessionnumber78 82 149 163
Nied1 T A A C O. europaea (R), C. cneorum (S), D. kaki (S/R), F. magellanica (S/R), C.persicum (S), D. campanulata (R)
KJ601226
Nied2 . . . T Salvia sp. (S) KJ601227
Nied3 C . . . D. kaki (R) KJ601228
Nied4 . - . . C. persicum var. tianis (R), F. magellanica (S/R) KJ601229
Nied5 . . G T Salvia sp.(S) KJ601230
Phytophthora cinnamomi like
GenotypeSNP sites
Host Accession number58 164 166
CinnL1 C G T G. lanigera (S), B. glabra (S), C. siliquastrum (S) KJ601232
CinnL2 G . . B. glabra (S) KJ601233
CinnL3 . A . G. lanigera (R), B. glabra (S) KJ601234
CinnL4 . A C B. glabra (S) KJ601235
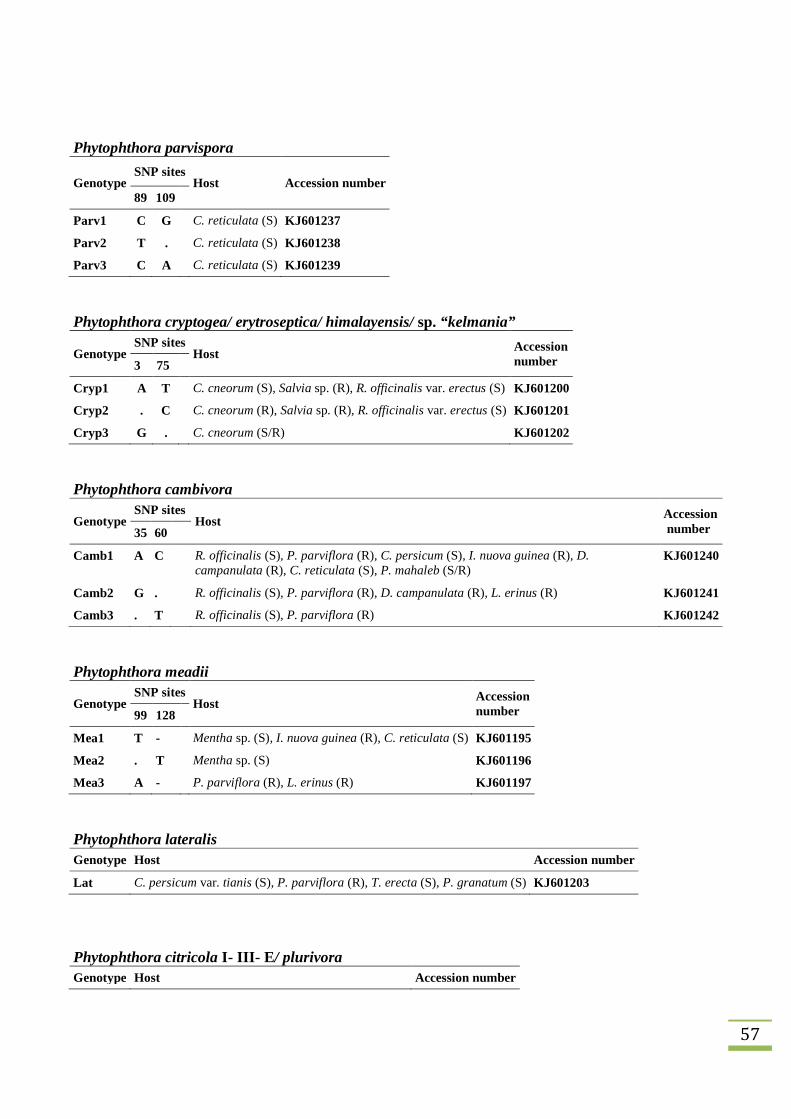
57
Phytophthora parvispora
GenotypeSNP sites
Host Accession number89 109
Parv1 C G C. reticulata (S) KJ601237
Parv2 T . C. reticulata (S) KJ601238
Parv3 C A C. reticulata (S) KJ601239
Phytophthora cryptogea/ erytroseptica/ himalayensis/ sp. “kelmania”
GenotypeSNP sites
HostAccessionnumber3 75
Cryp1 A T C. cneorum (S), Salvia sp. (R), R. officinalis var. erectus (S) KJ601200
Cryp2 . C C. cneorum (R), Salvia sp. (R), R. officinalis var. erectus (S) KJ601201
Cryp3 G . C. cneorum (S/R) KJ601202
Phytophthora cambivora
GenotypeSNP sites
HostAccessionnumber35 60
Camb1 A C R. officinalis (S), P. parviflora (R), C. persicum (S), I. nuova guinea (R), D.campanulata (R), C. reticulata (S), P. mahaleb (S/R)
KJ601240
Camb2 G . R. officinalis (S), P. parviflora (R), D. campanulata (R), L. erinus (R) KJ601241
Camb3 . T R. officinalis (S), P. parviflora (R) KJ601242
Phytophthora meadii
GenotypeSNP sites
HostAccessionnumber99 128
Mea1 T - Mentha sp. (S), I. nuova guinea (R), C. reticulata (S) KJ601195
Mea2 . T Mentha sp. (S) KJ601196
Mea3 A - P. parviflora (R), L. erinus (R) KJ601197
Phytophthora lateralis
Genotype Host Accession number
Lat C. persicum var. tianis (S), P. parviflora (R), T. erecta (S), P. granatum (S) KJ601203
Phytophthora citricola I- III- E/ plurivora
Genotype Host Accession number

58
Citr D. campanulata (R), L. erinus (R), P. mahaleb (S/R) KJ601199
Phytophthora cinnamomi
Genotype Host Accession number
Cinn G. lanigera (S) KJ601236
Phytophthora meadii like
Genotype Host Accession number
MeaL D. campanulata (R) KJ601198
Phytophthora niederhauserii like
Genotype Host Accession number
NiedL C. persicum (S) KJ601231
Phytophthora pseudosyringae/ ilicis/ nemorosa
Genotype Host Accession number
Pseud C. siliquastrum (S) KJ601243
Phytophthora taxon Pgchlamido
Genotype Host Accession number
Pgch C. siliquastrum (S) KJ601244

59
TABLE 3. Comparison of the ITS1 region of the sequence type Citr identified in the present study and reference sequencesof P. plurivora and P. citricola taxon I, III and E (Jung et al., 2011). The alignment shows the consistence of twopolymorphic bases enabling the reliable identification of the ST as P. citricola taxon III or E.
GenotypeSNP sites*
Accession numbers15 66
Citr - - KJ601199
P. citricola III . . FJ392327, EF032477, DQ648146
P. citricola E . . EU263906, AF266788, EU000081
P. citricola I A . FJ392322, FJ392321, EU000125, FJ665234, FJ665235
P. plurivora . T FJ2375223, FJ237523, FJ237524, FJ392324, FJ392325,FJ665225, FJ665226, FJ665227, FJ665228, FJ665229, FJ665230,FJ665231, FJ665232, FJ665233, AF266789, AJ007370,AY879291, DQ486661
*Deleted “-” or identical “.” bases as compare to other sequences

60
CHAPTER 3

61
Development and validation of 454 pyrosequencing approach to detect
Phytophthora diversity in ornamental nurseries
ABSTRACT
The diversity of Phytophthora communities associated to soil and root samples from potted ornamental
and fruit tree species (Cfr. Chapter 2) was investigated by combining genus specific primers and a
high-throughput 454 pyrosequencing approch. All sequences were accurately analyzed with
appropriate bioinformatic tools and used as barcode for species identification utilizing a validated ITS
database. Results were compared with those obtained with the cloning/Sanger sequencing approach
(Cfr. Chapter 2). The 454 pyrosequencing confirmed results from cloning/Sanger sequencing and
provided a higher levels of accuracy enabling the detection of four additional species (P. cactorum, P.
megasperma, P. palmivora and P. ramorum) and a general higher level of diversity (number of
detected sequence types - STs) within analyzed samples. Moreover, several putative new species
undetected with the cloning/Sagner approch were revealed confirming a very high level of sensitivity
that enable the detection of rare and/or low abundant phytlotypes. This study represents the first
application of pyrosequencing to study Phytophthora diversity in nurseries.
INTRODUCTION
Phytophthora is considered one of the most destructive plant pathogens affecting thousands of
cultivated and wild plants worldwide with more than 100 species (Brasier, 2009). It has been
hypothesized that there might be between 100 and 600 species still unknown to the scientific
community (Brasier, 2009; Kroon et al., 2012). Plant trade is considered the primary reason of new
disease outbreaks and causes a huge distribution of pathogens beyond their natural endemic ranges with
severe socio-economic impact (Brasier, 2008). The increase of international trade of rooted plants as a
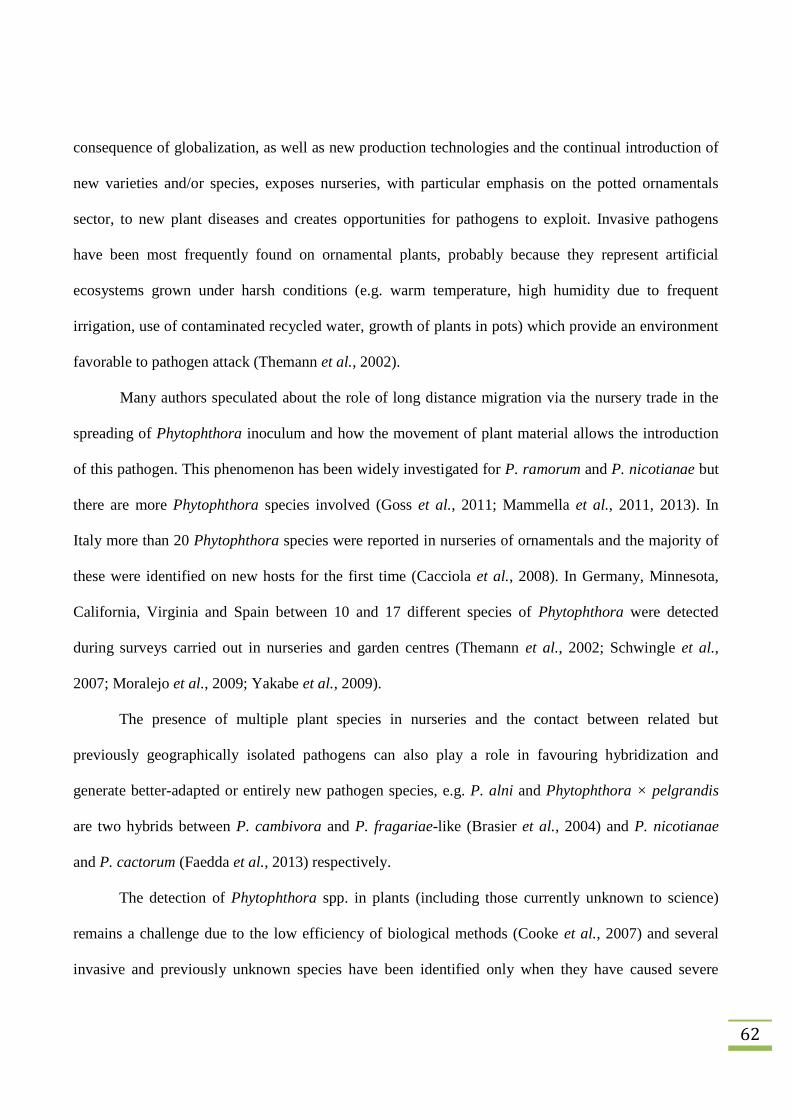
62
consequence of globalization, as well as new production technologies and the continual introduction of
new varieties and/or species, exposes nurseries, with particular emphasis on the potted ornamentals
sector, to new plant diseases and creates opportunities for pathogens to exploit. Invasive pathogens
have been most frequently found on ornamental plants, probably because they represent artificial
ecosystems grown under harsh conditions (e.g. warm temperature, high humidity due to frequent
irrigation, use of contaminated recycled water, growth of plants in pots) which provide an environment
favorable to pathogen attack (Themann et al., 2002).
Many authors speculated about the role of long distance migration via the nursery trade in the
spreading of Phytophthora inoculum and how the movement of plant material allows the introduction
of this pathogen. This phenomenon has been widely investigated for P. ramorum and P. nicotianae but
there are more Phytophthora species involved (Goss et al., 2011; Mammella et al., 2011, 2013). In
Italy more than 20 Phytophthora species were reported in nurseries of ornamentals and the majority of
these were identified on new hosts for the first time (Cacciola et al., 2008). In Germany, Minnesota,
California, Virginia and Spain between 10 and 17 different species of Phytophthora were detected
during surveys carried out in nurseries and garden centres (Themann et al., 2002; Schwingle et al.,
2007; Moralejo et al., 2009; Yakabe et al., 2009).
The presence of multiple plant species in nurseries and the contact between related but
previously geographically isolated pathogens can also play a role in favouring hybridization and
generate better-adapted or entirely new pathogen species, e.g. P. alni and Phytophthora × pelgrandis
are two hybrids between P. cambivora and P. fragariae-like (Brasier et al., 2004) and P. nicotianae
and P. cactorum (Faedda et al., 2013) respectively.
The detection of Phytophthora spp. in plants (including those currently unknown to science)
remains a challenge due to the low efficiency of biological methods (Cooke et al., 2007) and several
invasive and previously unknown species have been identified only when they have caused severe

63
disease in non-native environments. Furthermore, many of these pathogens may do little noticeable
damage in their native ecosystems and so are less likely to be detected, having adapted and co-evolved
with their hosts. Therefore, an accurate description of the Phytophthora community is of an ecological
and epidemiological relevance.
Several molecular assay based on PCR have been developed for Phytophthora species, even if
most of them are inappropriate for broader surveys of its diversity and distribution in ecosystems and
detects only one or few species (Cooke et al., 2007; Martin et al., 2012; Sanzani et al., 2013). The
development of molecular techniques based on sequencing of specific regions of microorganisms,
provides a means to assess the diversity of microbial communities without requiring their cultivation in
laboratory and offers a considerable reduction in the cost, complexity and time required to analyze
large amount of samples. High-resolution techniques can adequately assist in the task of deep
investigation of microbial distribution in environmental samples for epidemiological studies when
describing target communities of plant pathogens by providing much greater sequencing depth
(Orgiazzi et al., 2013). Furthermore, the large number of reads produced in a single sequencing run
provides unprecedented sampling depth, leading to the detection of low abundant and rare phylotypes
(Sogin et al., 2006).
Recently 454 pyrosequencing was used to detect Phytophthora communities in environmental
samples using Oomycete specific primers but the identification of putative species was not as accurate
as needed to differentiate closely related taxa (Vettraino et al., 2012; Vannini et al., 2013). The aim of
the present study was the development and validation of a high-throughput sequencing assay based 454
pyrosequencing (Acosta-Martínez et al., 2008) in combination with genus-specific primers (Scibetta et
al., 2012). In order to evaluate the reliability of the method, the same samples (roots and soils from
ornamental nurseries) analyzed in Chapter 2 with a cloning/Sanger sequencing were reanalyzed and
result were compared.
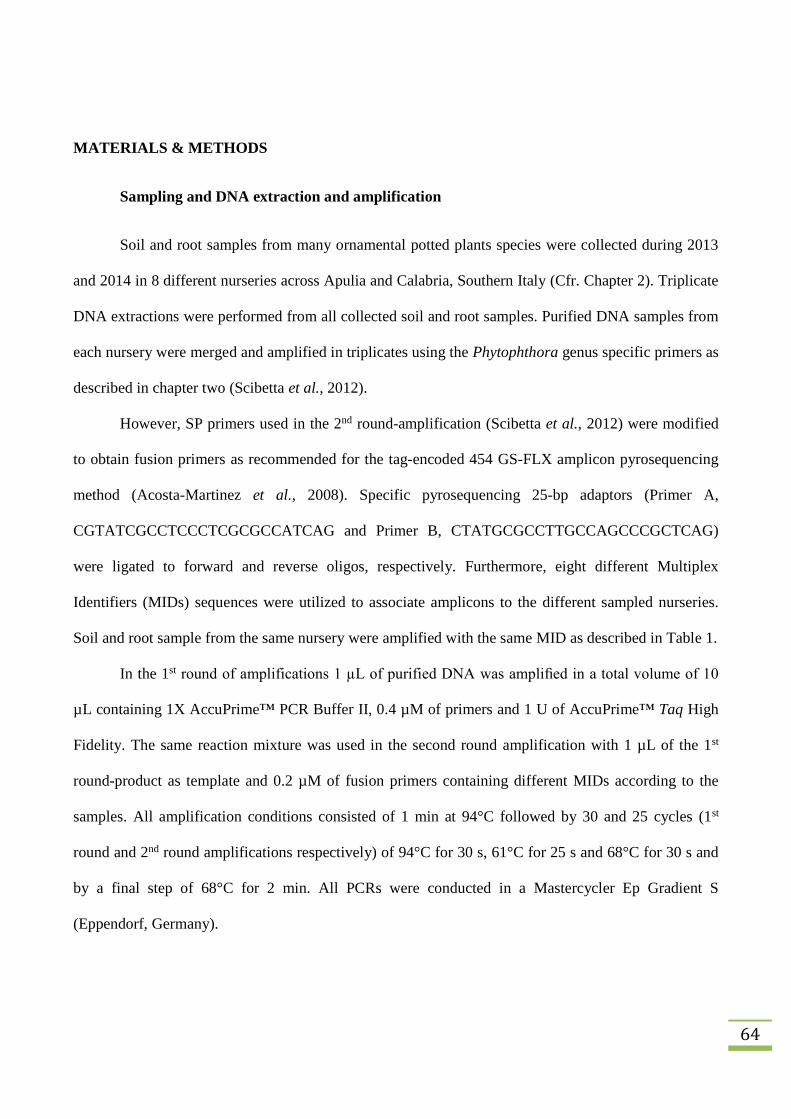
64
MATERIALS & METHODS
Sampling and DNA extraction and amplification
Soil and root samples from many ornamental potted plants species were collected during 2013
and 2014 in 8 different nurseries across Apulia and Calabria, Southern Italy (Cfr. Chapter 2). Triplicate
DNA extractions were performed from all collected soil and root samples. Purified DNA samples from
each nursery were merged and amplified in triplicates using the Phytophthora genus specific primers as
described in chapter two (Scibetta et al., 2012).
However, SP primers used in the 2nd round-amplification (Scibetta et al., 2012) were modified
to obtain fusion primers as recommended for the tag-encoded 454 GS-FLX amplicon pyrosequencing
method (Acosta-Martinez et al., 2008). Specific pyrosequencing 25-bp adaptors (Primer A,
CGTATCGCCTCCCTCGCGCCATCAG and Primer B, CTATGCGCCTTGCCAGCCCGCTCAG)
were ligated to forward and reverse oligos, respectively. Furthermore, eight different Multiplex
Identifiers (MIDs) sequences were utilized to associate amplicons to the different sampled nurseries.
Soil and root sample from the same nursery were amplified with the same MID as described in Table 1.
In the 1st round of amplifications 1 µL of purified DNA was amplified in a total volume of 10
µL containing 1X AccuPrime™ PCR Buffer II, 0.4 µM of primers and 1 U of AccuPrime™ Taq High
Fidelity. The same reaction mixture was used in the second round amplification with 1 µL of the 1st
round-product as template and 0.2 µM of fusion primers containing different MIDs according to the
samples. All amplification conditions consisted of 1 min at 94°C followed by 30 and 25 cycles (1st
round and 2nd round amplifications respectively) of 94°C for 30 s, 61°C for 25 s and 68°C for 30 s and
by a final step of 68°C for 2 min. All PCRs were conducted in a Mastercycler Ep Gradient S
(Eppendorf, Germany).

65
Amplicons from the 2nd round PCR were purified using the PCRExtract Mini Kit (5PRIME,
USA) and quantified as described in Chapter 2. All purified PCR products were pooled in equal
volume and sequenced using a 1/8 of a PicoTiter Plate with the 454 GS FLX+ System (Macrogen,
Seoul, Korea).
Analysis of data and identification of sequence types (STs)
Raw images obtained from 454 pyrosequencing were processed by Genome Sequencer FLX
software provided by 454 platform and translated into raw data. The complete dataset was processed
with the bioinformatics pipeline QIIME Version 1.8 (Caporaso et al., 2010). Sequences were subjected
to demultiplex, quality trimming and chimera detection. All cleaned sequences were pooled, trimmed
to remove sequences of primers, and analyzed with the software ElimDupes
(http://hcv.lanl.gov/content/sequence/ELIMDUPES/elimdupes.html) to delete multiple identical
sequences and identify ITS1 sequence types (STs), defined as the distinct and reproducible ITS1
sequences recovered in this study. Singletons (sequence reads occurring only once across the complete
panel of analyzed samples) were removed from the dataset.
To identify the species detected, single representative sequences for each ST were subject to
phylogenetic analysis along with validated barcode sequences of the genus Phytophthora (Robideau et
al., 2011). Before analyses the complete panel of Phytophthora reference sequences (Robideau et al.,
2011) were trimmed to match the sequence lengths determined in this study and analyzed with the
software ElimDupes (http://hcv.lanl.gov/content/sequence/ELIMDUPES/elimdupes.html) to delete
multiple identical sequences for each species. Identical reference sequences were only included in the
panel when they represented different Phytophthora species. In cases where no matches were found in
the reference sequence from Robideau et al. (2011) more closely related sequences were examined
using BLAST searches of GenBank with priority given to sequences associated to specific publications

66
(Fig. 1-5). The complete panel of selected reference sequences and STs detected using the 454 approch
were grouped according to their clade (Cooke et al., 2000; Kroon et al., 2012), aligned using ClustalX
(Thompson et al., 1997) and introduced to TOPALi for phylogenetic analysis with the PhyML method
based on maximum-likelihood principle (Guindon & Gascuel, 2003). By this process, all ITS1
sequences were associated with a phylotype. A phylotype may be represented by single ST or a closely
related cluster of ITS1 sequences that are considered to represent a single distinct taxon. We use the
term phylotype as a proxy for species in describing the results as species cannot be defined formally in
the absence of living isolates.
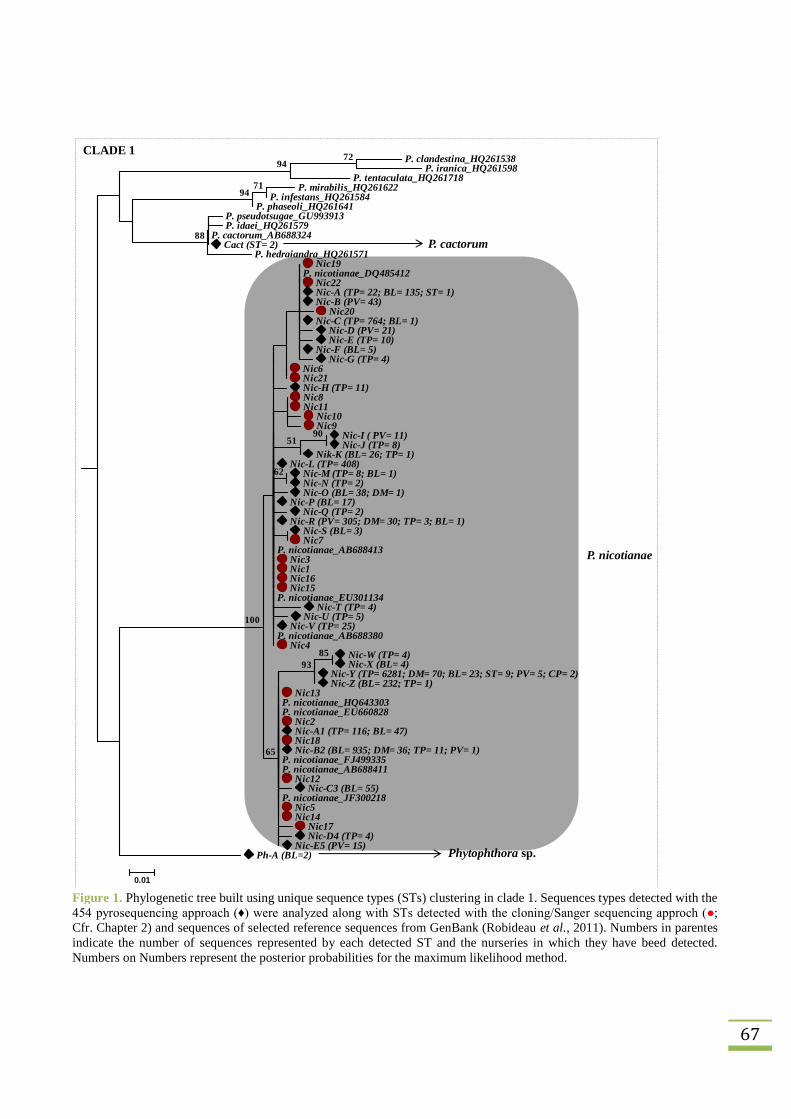
67
CLADE 1
P. nicotianae
Phytophthora sp.
P. cactorum
P. clandestina_HQ261538P. iranica_HQ261598
P. tentaculata_HQ261718P. mirabilis_HQ261622
P. infestans_HQ261584P. phaseoli_HQ261641
P. pseudotsugae_GU993913P. idaei_HQ261579
P. cactorum_AB688324Cact (ST= 2)
P. hedraiandra_HQ261571Nic19
P. nicotianae_DQ485412Nic22Nic-A (TP= 22; BL= 135; ST= 1)Nic-B (PV= 43)
Nic20Nic-C (TP= 764; BL= 1)
Nic-D (PV= 21)Nic-E (TP= 10)
Nic-F (BL= 5)Nic-G (TP= 4)
Nic6Nic21Nic-H (TP= 11)Nic8Nic11
Nic10Nic9
Nic-I ( PV= 11)Nic-J (TP= 8)
Nik-K (BL= 26; TP= 1)Nic-L (TP= 408)
Nic-M (TP= 8; BL= 1)Nic-N (TP= 2)Nic-O (BL= 38; DM= 1)
Nic-P (BL= 17)Nic-Q (TP= 2)
Nic-R (PV= 305; DM= 30; TP= 3; BL= 1)Nic-S (BL= 3)Nic7
P. nicotianae_AB688413Nic3Nic1Nic16Nic15
P. nicotianae_EU301134Nic-T (TP= 4)
Nic-U (TP= 5)Nic-V (TP= 25)
P. nicotianae_AB688380Nic4
Nic-W (TP= 4)Nic-X (BL= 4)
Nic-Y (TP= 6281; DM= 70; BL= 23; ST= 9; PV= 5; CP= 2)Nic-Z (BL= 232; TP= 1)
Nic13P. nicotianae_HQ643303P. nicotianae_EU660828
Nic2Nic-A1 (TP= 116; BL= 47)Nic18Nic-B2 (BL= 935; DM= 36; TP= 11; PV= 1)
P. nicotianae_FJ499335P. nicotianae_AB688411
Nic12Nic-C3 (BL= 55)
P. nicotianae_JF300218Nic5Nic14
Nic17Nic-D4 (TP= 4)
Nic-E5 (PV= 15)Ph-A (BL=2)
7294
7194
88
8593
65
62
9051
100
0.01
Figure 1. Phylogenetic tree built using unique sequence types (STs) clustering in clade 1. Sequences types detected with the454 pyrosequencing approach (♦) were analyzed along with STs detected with the cloning/Sanger sequencing approch (●;Cfr. Chapter 2) and sequences of selected reference sequences from GenBank (Robideau et al., 2011). Numbers in parentesindicate the number of sequences represented by each detected ST and the nurseries in which they have beed detected.Numbers on Numbers represent the posterior probabilities for the maximum likelihood method.

68
CLADE 2
P. meadii
P. citrophthora
P. citricolaP. plurivora
P. meadii like
Phytophthora spp.Ph-B(BL= 5)Ph-C (BL= 29)
P. citrophthora_HQ643207Citro5Citro4Citro A (CP= 19)
Citro-B (CP= 7)Citro-C (CP= 88)
Citro-D (CP= 5)Citro2
P. citrophthora_AY228566Citro1
P. citrophthora_JN618697Citro3
Citro-E (PG= 2)P. citrophthora_AF266785
Citro-F (CP= 3; BL= 2)Citro-G (CP= 59)
Citro-H (CP= 13)Mea-A (BL= 11; CP= 1)
Mea3P. meadii_KC875839
Mea1P. colocasiae_HQ261539Mea-B (BL= 748)Mea-C (BL= 417; CP= 1; DM= 1)
P. meadii_HQ261607Mea2
Mea-D (BL= 4)MeaLMea_Like-A (BL= 27)
Mea_Like-B (BL= 2)Mea-E (BL= 13)
P. botryosa_HQ261507P. siskiyouensis_HQ261674
P. mengei_HQ261618P. tropicalis_HQ261720P. mexicana-HQ261620
P. sp. glovera_HQ261690P. capsici_DQ464019
CitrP. citricola I_FJ392322Citr-A (BL= 39)
P. citricola E_EU263906P. citricola III_FJ392327
Citr-B (PG= 177; BL= 15)P. plurivora-FJ2375223
Citr-C (PG= 64)P. citricola SS_FJ237526
Citr-D (BL= 108)P. multivora_HQ261625
P. bisheria_HQ261501P. frigida_HQ261567
P. multivesiculata_AF266790
10099
93
6471
62
71
94
79
65
52
59
53
99
0.02
Figure 2. Phylogenetic tree built using unique sequence types (STs) clustering in clade 2. Sequences types detected with the454 pyrosequencing approach (♦) were analyzed along with STs detected with the cloning/Sanger sequencing approch (●;Cfr. Chapter 2) and sequences of selected reference sequences from GenBank (Robideau et al., 2011). Numbers in parentesindicate the number of sequences represented by each detected ST and the nurseries in which they have beed detected.Numbers on Numbers represent the posterior probabilities for the maximum likelihood method.

69
Figure 3. Phylogenetic tree built using unique sequence types (STs) clustering in clades 3 (a), 4 (b) and 6 (c). Sequencestypes detected with the 454 pyrosequencing approach (♦) were analyzed along with STs detected with the cloning/Sangersequencing approch (●; Cfr. Chapter 2) and sequences of selected reference sequences from GenBank (Robideau et al.,2011). Numbers in parentes indicate the number of sequences represented by each detected ST and the nurseries in whichthey have beed detected. Numbers on Numbers represent the posterior probabilities for the maximum likelihood method.
P. taxon Pgchlamydo
P. megasperma
Phytophthora sp.
CLADE 6 P. humicola _HQ261577P. inundata_HQ261592P. sp. personii_EU301169
P. lacustris_HQ012956P. sulawesiensis_HQ261711
P. rosacearum_HQ261664P. gonapodyides_HQ643232P. megasperma_HM004230P. megasperma_HQ643282P. megasperma_GU258797
Meg (ZZ= 16)Pgch-A (ZZ= 108)
P. taxon Pgchlamydo_HQ643352Pgch
P. taxon Pgchlamydo_JQ307189P. taxon Pgchlamydo_HM004224
Pgch-B (ZZ= 7)Pgch-C (ZZ= 21)
Pgch-D (ZZ= 17)Pgch-E (ZZ= 18)Pgch-F (ZZ= 3)
P. asparagi_HQ261681Ph-E (ZZ= 9; TP= 1)72
71
92100
55
92
61
72
0.02
P. ilicisP. nemorosaP. pseudosyringae
CLADE 3P. quercina_HQ261658P. sp. ohioensis_HQ261710
P. psycrophila_AF449494Pseud-A (ZZ= 56)
Pseud-B (ZZ= 14)Pseud-C (ZZ= 8)
P. pseudosyringae_HQ643329P. pseudosyringae_JF300194
PseudP. nemorosa_HQ643298
P. ilicis_HQ261583P. ilicis_HQ261580
Pseud-D (ZZ= 482; PV= 1)P. pseudosyringae_HQ643326
Pseud-E (ZZ= 3)
100
82
96
89
100
0.02
P. palmivora
CLADE 4
P. palmivora like
Phytophthora sp.
P. megakarya_AF266782P. quercetorum_HQ261657
Palm_Like (TP= 3)P. palmivora_AF266781
Palm-A (TP= 36)Palm-B (TP= 1456; BL= 36; CP= 6; PG= 6; ZZ= 4; PV= 2)
Ph-D (TP= 8)
81
9181
0.02
a
b
c

70
CLADE 7
P. cinnamomi like
P. parvispora
P. cambivora
P. niederhauserii
Phytophthora sp.
98
95
99
95
72
94
93
99
100
60
Ph-F (BL= 8)Cinn_Like-A (ZZ= 30; TP= 19)CinnL4
CinnL3Cinn_Like-B (ZZ= 12; TP= 2)Cinn_Like-C (TP= 15)
Cinn_Like-D (TP= 11)Cinn_Like-E (TP= 3)
CinnL2Cinn_Like-F (TP= 38; ZZ= 2)Cinn_Like-G (TP= 86; ZZ= 15)
Cinn_Like-H (TP= 5)Cinn_Like-I (TP= 1459; ZZ= 462)
P. cinnamomi_GU259227CinnL1Cinn_Like-J (TP= 2)
P. cinnamomi_AB688333Cinn
P. cinnamomi_HQ643189P. parvispora_HQ643199
Parv2Parv3
P. parvispora_HQ643200Parv1Parv (CP= 13)
P. europaea_HQ643229P. uliginosa_HQ261721P. alni subsp alni_AF139366P. alni subsp. multiformis_AF139368Camb-A (BL= 2; PG= 2)Camb3Camb-B (BL= 37)Camb-C (PG= 7)
P. alni subsp. uniformis_AF139367Camb-D (BL= 196; PG= 3)
P. cambivora_FJ801917P. cambivora_GU259067
Camb-E (BL= 876; PG= 104)P. cambivora_AF242794
Camb-F (BL= 46; PG= 1)P. cambivora_HQ643179P. cambivora_HQ643178
Camb2Camb1
NiedLNied1
P. niederhauserii_JX494411P. niederhauserii_HQ261699P. niederhauserii_GQ911578
Nied-A (TP= 960; ST= 40)Nied-B (ST= 129; TP= 14; BL= 1)Nied3Nied-C (BL= 2)
Nied4Nied-D (BL= 874; TP= 32; ST= 3)Nied-E (BL= 155)
Nied-F (TP= 470; BL= 2)Nied5
Nied-G (TP= 5)Nied2Nied-H (CP= 15; TP= 3)
P. sojae_HQ643349P. sojae_HQ643348
P. vignae_HQ261723P. cajani_HQ261515
P. melonis_GU993906P. sinensis_HQ261670
0.02
Figure 4. Phylogenetic tree built using unique sequence types (STs) clustering in clade 7. Sequences types detected with the454 pyrosequencing approach (♦) were analyzed along with STs detected with the cloning/Sanger sequencing approch (●;Cfr. Chapter 2) and sequences of selected reference sequences from GenBank (Robideau et al., 2011). Numbers in parentesindicate the number of sequences represented by each detected ST and the nurseries in which they have beed detected.Numbers on Numbers represent the posterior probabilities for the maximum likelihood method.
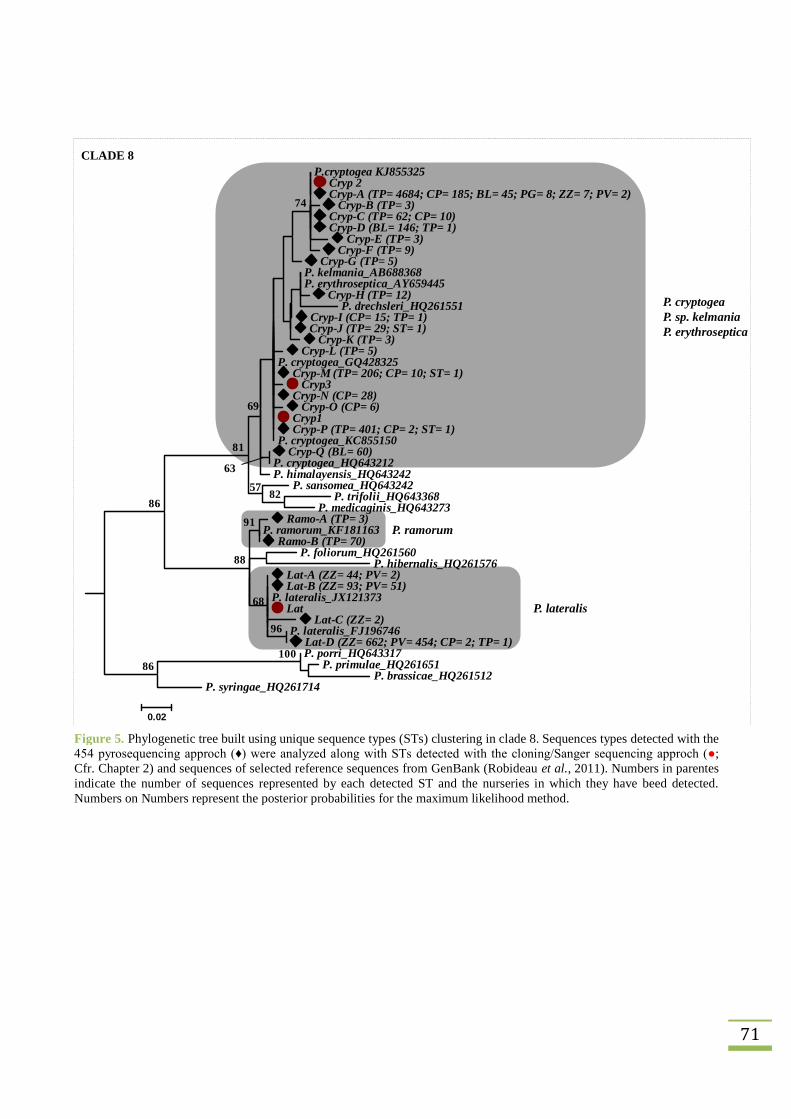
71
P. ramorum
P. lateralis
P. cryptogeaP. sp. kelmaniaP. erythroseptica
CLADE 8
57
63
69
68
P.cryptogea KJ855325Cryp 2Cryp-A (TP= 4684; CP= 185; BL= 45; PG= 8; ZZ= 7; PV= 2)
Cryp-B (TP= 3)Cryp-C (TP= 62; CP= 10)Cryp-D (BL= 146; TP= 1)
Cryp-E (TP= 3)Cryp-F (TP= 9)
Cryp-G (TP= 5)P. kelmania_AB688368P. erythroseptica_AY659445
Cryp-H (TP= 12)P. drechsleri_HQ261551
Cryp-I (CP= 15; TP= 1)Cryp-J (TP= 29; ST= 1)
Cryp-K (TP= 3)Cryp-L (TP= 5)
P. cryptogea_GQ428325Cryp-M (TP= 206; CP= 10; ST= 1)
Cryp3Cryp-N (CP= 28)
Cryp-O (CP= 6)Cryp1Cryp-P (TP= 401; CP= 2; ST= 1)
P. cryptogea_KC855150Cryp-Q (BL= 60)
P. cryptogea_HQ643212P. himalayensis_HQ643242
P. sansomea_HQ643242P. trifolii_HQ643368
P. medicaginis_HQ643273Ramo-A (TP= 3)
P. ramorum_KF181163Ramo-B (TP= 70)
P. foliorum_HQ261560P. hibernalis_HQ261576
Lat-A (ZZ= 44; PV= 2)Lat-B (ZZ= 93; PV= 51)
P. lateralis_JX121373Lat
Lat-C (ZZ= 2)P. lateralis_FJ196746
Lat-D (ZZ= 662; PV= 454; CP= 2; TP= 1)P. porri_HQ643317
P. primulae_HQ261651P. brassicae_HQ261512
P. syringae_HQ261714
10086
91
96
88
82
74
81
86
0.02
Figure 5. Phylogenetic tree built using unique sequence types (STs) clustering in clade 8. Sequences types detected with the454 pyrosequencing approch (♦) were analyzed along with STs detected with the cloning/Sanger sequencing approch (●;Cfr. Chapter 2) and sequences of selected reference sequences from GenBank (Robideau et al., 2011). Numbers in parentesindicate the number of sequences represented by each detected ST and the nurseries in which they have beed detected.Numbers on Numbers represent the posterior probabilities for the maximum likelihood method.

72
To graphically show the relative abundance of different putative Phytophthora species,
identified according to their filogenetic collocation (Figures 1-5), specific histograms were generated
for each sampled nursery according to results of 454 pyrosequencing and cloning/Sanger sequencing
(Fig. 6).

73
0%
10%
20%
30%
40%
50%
60%
70%
80%
90%
100%
454 Sanger
Rel
ativ
ea
bu
nd
ance
(%)
Nursery TP
P. cinnamomiP. palmivora L.P. lateralisPhytophthora sp.P. ramorumP. palmivoraP. niederhauseriiP. cinnamomi L.P. cryptogeaP. nicotianae
0%
10%
20%
30%
40%
50%
60%
70%
80%
90%
100%
454 Sanger
Rel
ativ
ea
bu
nd
ance
(%)
Nursery BL
P. niederhauserii L.P. palmivoraP. citrophthoraP. meadii L.P. cryptogeaP. citricolaPhytophthora sp.P. cambivoraP. niederhauseriiP. meadiiP. nicotianae
0%
10%
20%
30%
40%
50%
60%
70%
80%
90%
100%
454 Sanger
Rel
ati
vea
bu
nd
an
ce(%
)
Nursery PV
P. niederhauserii
P. pseudosyringae
P. palmivora
P. cryptogea
P. lateralis
P. nicotianae
0%
10%
20%
30%
40%
50%
60%
70%
80%
90%
100%
454 Sanger
Rel
ati
vea
bu
nd
an
ce(%
)
Nursery ZZ
Phytophthora sp.P. palmivoraP. megaspermaP. cryptogeaP. pseudosyringae LP. pseudosyringaeP. lateralisP. cinnamomi LP. taxon Pgchlamydo
0%
10%
20%
30%
40%
50%
60%
70%
80%
90%
100%
454 Sanger
Rel
ati
ve
ab
un
da
nce
(%)
Nursery DM
P. meadiiP. nicotianae
0%
10%
20%
30%
40%
50%
60%
70%
80%
90%
100%
454 Sanger
Rel
ati
ve
ab
un
da
nce
(%)
Nursery CP
P. parvispora
P. palmivora
P. meadii
P. lateralis
P. niederhauserii
P. nicotianae
P. cryptogea
P. citrophthora
0%
10%
20%
30%
40%
50%
60%
70%
80%
90%
100%
454 Sanger
Rel
ati
ve
abu
nd
ance
(%)
Nursery PG
P. palmivoraP. cryptogeaP. citrophthoraP. citricolaP. cambivora
0%
10%
20%
30%
40%
50%
60%
70%
80%
90%
100%
454 Sanger
Rel
ati
ve
abu
nd
ance
(%)
Nursery ST
P. cactorumP. nicotianaeP. cryptogeaP. niederhauserii
Figure 6. Histograms showing the relative abundance of different putative Phytophthora species in the investigatednurseries according to 454 pyrosequencing and cloning/Sanger sequencing approaches. The lettel "L" after the name ofsome detected phylotypes means "like".

74
RESULTS
Sequencing results
A total of 76.612 sequence reads were obtained after data processing with 454 Genome
Sequencer system with an average length of 270 bp. After quality trimming, denoising and chimera
removal 28.067 high quality ITS1 sequences were recorded. The number of reads per sample are
reported in Table 1 and ranged from 139 (nursery DM) to 18199 (nursery TP).
Table 1. List of Multiplex Identifier (MID) sequences utilized during 2nd round-amplification to amplify samples from 8different nurseries located in Apulia and Calabria (Southern Italy; Cfr. Chapter 2). After purification, libraries were mixedand sent for pyrosequencing. The final number of sequences after quality trimming, denoising and chimera removal is alsoreported.
Sampling Locality MID Sequences (5’-3’) Sequence Count
Nursery TP (Apulia) MID 28 (ACTACTATGT) 18.199
Nursery CP (Apulia) MID 30 (AGACTATACT) 495
Nursery PV (Apulia) MID 32 (AGTACGCTAT) 924
Nursery ZZ (Apulia) MID 33 (ATAGAGTACT) 2.100
Nursery DM (Apulia) MID 37 (TACACACACT) 139
Nursery BL (Apulia) MID 38 (TACACGTGAT) 5.632
Nursery PG (Apulia) MID 39 (TACAGATCGT) 375
Nursery ST (Calabria) MID 29 (ACTGTACAGT) 203
Identification of putative Phytophthora species
After the exclusion of singletons, 120 representative STs were identified in the complete panel
of analyzed samples (nurseries). According to phylogenetic analyses all STs clustered within the genus
Phytophthora and were assigned to 24 Phytophthora phylotypes distributed in 7 different clades (Fig.
1-5).
Twelve phylotypes were identified to the species level: P. cactorum, P. nicotianae, P.
citrophthtora, P. meadii, P. palmivora, P. megasperma, P. taxon Pgchlamydo, P. parvispora, P.
cambivora, P. niederhauserii, P. lateralis and P. ramorum (Fig. 1-5). Three phylotypes were

75
unresolved within their species complexes because the available genetic variation within the ITS1
region did not enable the reliable differentiation of species (Jung & Burgess, 2009; Robideau et al.,
2011). They comprised: i) P. citricola or P. plurivora (from Citr-A to Citr-D; Fig. 2); ii) P.
pseudosyringae, P. ilicis, or P. nemorosa (Pseud-A, B, C, D, E; Fig. 3); and iii) P. cryptogea, P.
erythroseptica, or P. sp. "kelmania" (from Cryp-A to Cryp-Q; Fig. 5). Three STs were defined as
Phytophthora sp.-like because represented well defined clusters phylogenetically related to accepted
Phytophthora species: i) P. meadii-like (STs Mea_Like-A and Mea_Like-B; Fig. 2), ii) P. palmivora-
like (ST Palm_Like; Fig. 3); and iii) P. cinnamomi-like (STs form Cinn_Like-A to Cinn_Like-J; Fig.
4). Finally, 6 STs were defined as Phytophthora spp. phylotypes because they clearly clustered within
the genus but were very distant from all currently defined species (Phytophthora sp. A to F; Fig. 1-5).
These putative new species were associate to clade 1 (1 ST), clade 2 (2 STs), clade 4 (1 ST), Clade 6
(1ST), and clade 7 (1ST).
Relative abundance of detected phylotypes
According to the phylogenetic analyses, STs and phylotypes detected with the 454
pyrosequencing approach largely confirmed those previously detected using the cloning/Sanger
sequencing approach (Cfr. Chapter 2). Exceptions were represented by a ST associated to P.
cinnamomi in nursery TP and a ST formerly defined as P. niederhauserii like in nursery BL wich were
not detected with the pyrosequencing (Fig. 6). Furthermore, P. niederhauserii was detected in nursery
PV by cloning/Sanger sequencing but not by 454 pyrosequencing.
Apart from above few exeptions, the 454 approach enabled a much more accurate investigation
of the genetic diversity with the detection of 29 additional phylotype/nursery combinations as
compared to the cloning/Sanger approach (Fig. 6). In nursery DM two species (P. nicotianae and P.
76
meadii) were detected with 454 pyrosequencing while no Phytophthoras had been detected with the
cloning/Sanger approch.
Among new phylotype/nursery combinations there were previously undetected phylotypes
which were associated to the species P. cactorum in nursery ST (Fig. 1; Fig. 6), P. palmivora in
nurseries TP, BL, CP, PG, ZZ and PV (Fig. 3; Fig. 6), P. megasperma in nursery ZZ (Fig. 3; Fig. 6),
and P. ramorum in nursery TP (Fig. 5; Fig. 6). The 454 approach enabled the detection of 6 putative
new Phytophthora species in clade 1 (ST Ph-A; Fig. 1), clade 2 (STs Ph-B and Ph-C; Fig. 2), clade 4
(ST Ph-D; Fig. 3), clade 6 (ST Ph-E; Fig. 3) and clade 7 (ST Ph-F; Fig. 4). Furthermore, a new
phylotype represented by a single ST (Palm_Like) was defined as P. palmivora like because of a
phylogenetic relatedness to this species (Fig. 3). In general, newly detected phylotypes with the 454
pyrosequencing represented a small portion of the detected populations in each nursery suggesting their
presence as rare or low abundant phylotypes (Fig. 6).
Results of 454 pyrosequencing approach confirmed P. nicotianae as the most abundant species
in ornamental nurseries in Southern Italy (Cfr. Chapter 2). This species accounted for 31 out of 120
STs and was detected in 6 out of 8 nurseries; in 4 of them (nurseires TP, BL, PV, and DM) was the
prevalent species (Fig. 6). In other nurseries, prevalent species were P. niederhauserii and P. cryptogea
(nursery ST), P. cambivora (nursery PG), P. citrophthora and P. cryptogea (nursery CP) and P. taxon
PgChlamydo, P. cinnamomi like and P. lateralis (nursery ZZ).
DISCUSSION
Pyrosequencing is one of the leading technologies supplanting Sanger sequencing for
metagenomics (Margulies et al., 2005). In the present study, a protocol based on pyrosequencing was
tested to detect the genetic diversity of Phytophthora spp. in soil and root samples of potted ornamental
and fruit tree species collected in nurseries located in Apulia and Calabria (Southern Italy). In order to

77
evaluate the reliability of the method, it was utilized to analize the same samples already investigated
with a conventional cloning and Sanger sequencing approach (Cfr. Chapter 2). Both methods were
based on Phytophthora specific primers targeting the ITS1 region of rDNA (Scibetta et al., 2012).
With two sole exceptions (a ST associated to P. cinnamomi and a ST formerly defined as P.
niederhauserii like) the 454 pyrosequencing confirmed the detection of all phylotypes revealed using
the cloning/Sanger sequencing approach. On the other hand, the 454 approach enabled a much more
accurate investigation of the genetic diversity with the detection of 29 additional nursery/phylotype
combinations wich included four previously undetetced species (P. cactorum, P. palmivora, P.
megasperma, and P. ramorum) and 6 putative new Phytophthora clustering with species of clade 1, 2,
4, 6 and 7. Furthermore, a new phylotype defined as P. palmivora like because of its phylogenetic
relatedness to this species, was detected. These data represented an indirect confirmation of the
reliability both molecular methods since identical or very similar STs were detected with the two
methods and, as expected, confirmed the higher resolution of the pyrosequencing approach. Indeed all
new detected phylotypes with the 454 pyrosequencing represented a small portion of the detected
populations in each nursery suggesting their presence as rare or low abundant phylotypes. Therefore, it
is likely that they were not detected with the cloning/Sanger sequencing approach just because of a
lower resolution of the technique related to the limited number of sequenced clones (20). As regard to
the few cases of phylotypes deteced only with the cloning/Sanger sequencing approach, it was likely
just the result of the chance in consideration of the low abundance of target sequences.
With both methods, major drawbacks were related to difficulties in discriminating
phylogenetically related species that might have sequences identical or differing only by a few
nucleotide positions (Kiss, 2012). Most currently utilized bioinformatics tools and genetic databases
enable good identification of microorganisms up to the level of the genus but they become less reliable
when used to identify species. For this reason results from pyrosequencing were demultiplexed, and

78
analysed for quality trimming and chimera detection with the bioinformatics pipeline QIIME Version
1.8 (Caporaso et al., 2010), a useful tool to handle thousands of sequences from high-throughput
sequencing techniques. After this steps all single representative STs were subjected to a traditional
phylogenetic analysis based on the use of common phylogenetic tools along with selected reference
sequences in GenBank to guarantee a more detailed identification of single phylotypes.
Among the identified phylotypes, P. nicotianae was largely the most abundant. This result
confirmed data from Sanger sequencing and supported the wide dissemination of P. nicotianae in
nurseries of potted ornamentals and fruit tree species (Mammella et al., 2011, 2013). A new ITS1
sequence was detected in soil and root samples from fruit trees collected in nursery ST and was
associated to P. cactorum. This pathogen occurs worldwide and is capable of infecting more than 200
species in 160 genera including many economically important crops such as apple, pear, rhododendron,
azalea, and strawberry (Erwin & Ribeiro, 1996).
Seventeen different STs grouped within the Phytophthora clade 2 and were associated with P.
citrophthora, P. meadii and P. citricola/plurivora complex. These data confirmed results from Sanger
sequencing (Fig. 2) even though the phylogenetic analysis did not provide an adequate level of
resolution for P. citricola/plurivora complex (Jung & Burgess, 2009). Moreover, pyrosequencing
revealed the presence of P. citrophthora and P. meadii in more sampled sites and confirmed the
presence of a P. meadii-like taxon in nursery BL.
A phylotype was associated to the P. pseudosyringae complex was mainly detected in nursery
ZZ and in a single case in nursery PV. The identification of this phylotype at the species level was not
possible due to the limited diversity within ITS1 regions of several related species including P. ilicis
and P. nemorosa.
Phytophthora palmivora was detected in 6 nurseries (TP, BL, CP, PG, ZZ, PV) confirming the
ubiquity of this pathogen responsible for many different diseases on a wide range of plants including
79
ornamental species (Erwin & Ribeiro, 1996; Hansen et al., 2012). A single ST defined as P. palmivora-
like and detected in nursery TP is likely to represent a still unknown species.
Phylogenetic analysis of pyrosequencing data confirmed the presence of P. taxon Pgchlamydo
in nursery ZZ and revealed the presence of a new ST not detected with cloning and associated to P.
megasperma. The detection of this species in nursery ZZ is not surprising since among the sampled
plants there was a species (Cercis siliquastrum) belonging to the family of Fabaceae, a well known
group of hosts of this pathogen (Erwin & Ribeiro, 1996).
A phylotype defined as P. cinnamomi-like was detected in soil and root samples collected in
nurseries TP and ZZ. This group of STs clustered with the ITS1 sequences revealed by Sanger
sequencing in the same nurseries. Another closely related species, P. parvispora, was detected in
nursery CP confirming its presence in Italy (Scanu et al., 2014).
An important result came from the analysis of two STs recorded in nursery TP and identify as P.
ramorum, a species that was not detected with cloning/Sanger sequencing approch. P ramorum is a
relatively recently described species of Phytophthora (Werres et al., 2001) causing high mortality of
oak trees in California, where the disease is known as ‘sudden oak death’ (Rizzo et al., 2002). In
Europe, it is included in the A2 list of the European Plant Protection Organism (EPPO). The pathogen
has also been found causing ‘ramorum dieback’ and ‘ramorum leaf blight’ on a range of native plants
and species of conifer in California and on a range of ornamental plants in Europe. Furthermore, it
represents a growing threat from natural ecosystem in UK (http://www.forestry.gov.uk/forestry/INFD-
8XLE56). Another critical species within clade 8 (P. lateralis) was detected in four nurseries (ZZ, PV,
TP and CP) with the 454 pyrosequencing approach while it was only detected in two nurseries (PV and
ZZ) by Sanger sequencing. Phytophthora lateralis is currently considered quarantine organism locally
present in the EPPO regions (A2 list). According to our data there is an urgent need for appropriate
management strategies to minimize the risks posed by these two Phytophthora species.

80
A rather obvious limitation of metagenomic sequencing studies is the absence of living
microrganisms cultures and the resulting impossibility of determining their actual role in the assayed
environment. In the present study 5 different phylotypes clustering within the genus Phytophthora were
found to be very distant as compared to all currently known species (Ph-A to F) and as a consequence
they were considered as representative of putative new Phytophthora species. Although, our data
indicate that they were present as low abundant or rare phylotypes and although available data does not
enable specific speculations about their importance and role, it is undoubted that their presence in
nurseries represent a potential new risk for agricultural and natural environments. The
complementation of metagenomic investigations with conventional isolation tecniques to obtain
cultures as well as others “meta-” data (metatranscriptomic, metaproteomic, and metabolomics) may be
useful to obtain a more complete view of microbial communities under given conditions (Zhang et al.,
2010; Knief et al., 2011; Segata et al., 2013).
Data of the present study indicated that the use of genus specific primers combined with 454
pyrosequencing are valuable tools to investigate Phytophthora diversity in different environments and
pathosystems. Compared to the cloning/Sanger approach it enabled much more detailed investigations
and reduced time and costs of the analyses. On the other hand, particular attention was needed in the
analisys of raw sequence data to avoid errors. In comparison to Sanger sequencing, pyrosequencing
technology is known for higher error rates which mainly come from homopolymeric miscounts
(Margulies et al., 2005; Huse et al., 2007; Kunin et al., 2010; Gilles et al., 2011; Shao et al., 2013;
Knief, 2014). The longer the homopolymeric region, the higher the probability of an indel error and the
lower the quality scores of the bases toward the end of this region (Luo et al., 2012; Skums et al., 2012;
Niklas et al., 2013). However, the use of a high-fidelity polymerase to reduce the risk of errors and of
chimeric amplicons and the analysis of raw data with a quality filter based on the removal of reads with
one or more unresolved bases or with errors in the barcode or primer sequence greatly increased the

81
reliability of selected sequences (Sogin et al., 2006). The exclusion of singletons from downstream
analyses further increased the reliability of final results. Indeed, important indirect confirmations of the
reliability of the method can be achieved from the following considerations: i) many identical STs were
identified in different nurseries i.e. as a consequence of separate extraction and amplifications, ii) most
STs detected by 454 pyrosequencing were identical to STs identified by using the cloning/Sanger
sequencing approach, iii) most STs detetced only with 454 pyrosequencing were identical to GenBank
deposited sequences, and iv) STs associated to new putative Phytophthora species were too different
from all other detected sequences to hypothesize that they were simple sequencing errors. The large
number of Phytophthora taxa detected in the present study in a limited geographic area confirms a
primarily role of nurseries in favoring the diffusion and the evolution of Phytophthora species by
favoring both intra- and inter-specific sexual recombination (Brasier, 2008; Faedda et al., 2013;
Leonberg et al., 2013).
ACKNOWLEDGMENTS
This work was supported by grant MIUR-FIRB 2010 (RBFR10PZ4N) from the Italian Ministry of
Education, University and Research (MIUR) “Metagenomic strategies to assess genetic diversity in
soil-borne Phytophthora species”.
REFERENCES
Acosta-Martinez V, Dowd S, Sun S & Allen Y, 2008. Tag-encoded pyrosequencing analysis of
bacterial diversity in a single soil type as affected by management and land use. Soil Biology
Biochemistry 40, 2762–2770.
Brasier CM, Kirk, S A, Delcan, J., Cooke, DEL, Jung, T, Man in’t Veld WA, 2004. Phytophthora alni
sp. nov. and its variants: designation of emerging heteroploid hybrid pathogens spreading on
Alnus trees. Mycological Research 108, 1172–1184.

82
Brasier CM, 2008. The biosecurity threat to the UK and global environment from international trade in
plants. Plant Pathology 57, 792-808.
Brasier CM, 2009. Phytophthoras in Forests and Natural Ecosystems. In: Goheen EM, Frankel SJ, tech.
coords. Proceedings of the fourth meeting of the International Union of Forest Research
Organizations (IUFRO) Working Party S07.02.09. General Technical Report PSW-GTR-221.
Albany, CA: U.S. Department of Agriculture, Forest Service, Pacific Southwest Research
Station, 101–115.
Cacciola SO, Pane A, Martini P, Agosteo GE, Raudino F, Magnano di San Lio G, 2008. Recovery of
Phythophthora species from potted ornamentals in commercial nurseries in Italy. Journal of
Plant Pathology 90, S2.185.
Caporaso JG, Kuczynski J, Stombaugh J, Bittinger K, Bushman FD, Costello EK, Fierer N, Pena AG,
Goodrich JK, Gordon JI, 2010. QIIME allows analysis of high-throughput community
sequencing data. Nature Methods 7,335-336.
Cooke DEL, Drenth A, Duncan JM, Wagels G, Brasier CM, 2000. A molecular phylogeny of
Phytophthora and related Oomycetes. Fungal Genetics and Biology 30, 17-32.
Cooke DEL, Schena L, Cacciola SO, 2007. Tools to detect, identify and monitor Phytophthora species
in natural ecosystems. Journal of Plant Pathology 89, 13-28.
Erwin DC, Ribeiro OK, 1996. Phytophthora Diseases Worldwide. St. Paul, MN, US: American
Phytopathological Society.
Faedda R, Cacciola SO, Pane A, Szigethy A, Bakonyi J, Man in't Veld WA, Martini P, Schena L,
Magnano di San Lio G, 2013. Phytophthora × pelgrandis Causes Root and Collar Rot of
Lavandula stoechas in Italy. Plant Disease 97, 1091-1096.
Gilles A, Meglecz E, Pech N, Ferreira S, Malausa T, Martin JF, 2011. Accuracy and quality assessment
of 454 GS-FLX Titanium pyrosequencing. BMC Genomics 12, 245.
83
Goss EM, Larsen M, Vercauteren A, Werres S, Heungens K, Grünwald NJ, 2011. Phytophthora
ramorum in Canada: Evidence for migration within North America and from Europe.
Phytopathology 101, 166-171.
Guindon S, Gascuel O, 2003. A simple, fast and accurate algorithm to estimate large phylogenies by
maximum likelihood. Systematic Biology 52, 696-704.
Hansen EM, Reeser P, Sutton W, 2012. Phytophthora beyond agriculture. Annual Review of
Phytopatology. 50, 359-378.
Huse SM, Huber JA, Morrison HG, Sogin ML, Welch DM, 2007. Accuracy and quality of massively
parallel DNA pyrosequencing. Genome Biology 8, R143.
Jung T, Burgess TI, 2009. Re-evaluation of Phytophthora citricola isolates from multiple woody hosts
in Europe and North America reveals a new species, Phytophthora plurivora sp. nov. Persoonia
22, 95–110.
Kiss L, 2012. Limits of nuclear ribosomal DNA internal transcribed spacer (ITS) sequences as species
barcodes for Fungi. Proceedings of the National Academy of Sciences of USA 109, E1811.
Knief C, Delmotte N, Vorholt JA, 2011. Bacterial adaptation to life in association with plants - A
proteomic perspective from culture to in situ conditions. Proteomics 11, 3086–3105.
Knief C, 2014. Analysis of plant microbe interactions in the era of next generation sequencing
technologies. Frontiers in Plant Science 5, 216.
Kroon LPNM, Brouwer H, de Cock AWAM, Govers F, 2012. The genus Phytophthora anno 2012.
Phytopathology 102, 348-364.
Kunin V, Engelbrektson A, Ochman H, Hugenholtz P, 2010. Wrinkles in the rare biosphere:
pyrosequencing errors can lead to artificial inflation of diversity estimates. Environmental
Microbiology 12, 118–123.
84
Leonberger AJ, Speers C, Ruhl G, Creswell T, Beckerman JL, 2013. A survey of Phytophthora spp. in
Midwest nurseries, greenhouses, and landscapes. Plant Disease 97, 635-640.
Luo CW, Tsementzi D, Kyrpides N, Read T, Konstantinidis KT, 2012. Direct comparisons of Illumina
vs. Roche 454 sequencing technologies on the same microbial community DNA sample.
Proceedings of the National Academy of Sciences of USA ONE 7, e30087.
Mammella MA, Cacciola SO, Martin F, Schena L, 2011. Genetic characterization of Phytophthora
nicotianae by the analysis of polymorphic regions of the mitochondrial DNA. Fungal Biology
115, 432-442.
Mammella MA, Martin FN, Cacciola SO, Coffey MD, Faedda R, Schena L, 2013. Analyses of the
population structure in a global collection of Phytophthora nicotianae isolates inferred from
mitochondrial and nuclear DNA sequences. Phytopathology 103, 610-622.
Margulies M, Egholm M, Altman WE, Attiya S, Bader JS, Bemben LA, et al., 2005. Genome
sequencing in microfabricated high-density picolitre reactors. Nature 437, 376–380.
Martin FN, Abad ZG, Balci Y, Ivors K, 2012. Identification and detection of Phytophthora: reviewing
our progress, identifying our needs. Plant Disease 96, 1080-1103.
Moralejo E, Pérez-Sierra AM, Álvarez LA, Belbahri L, Lefort F, Descals E, 2009. Multiple alien
Phytophthora taxa discovered on diseased ornamental plants in Spain. Plant Pathology 58, 100-
110.
Niklas N, Proll J, Danzer M, Stabentheiner S, Hofer K , Gabriel C, 2013. Routine performance and
errors of 454 HLA exon sequencing in diagnostics. BMC Bioinformatics 14, 176.
Origiazzi A, Bianciotto V, Bonfante P, Daghino S, Ghignone S, Lazzari A, Lumini E, Mello A, Napoli
C, Perotto S, Vizzini A, Bagella S, Murat C, Girlanda M, 2013. 454 pyrosequencing analysis of
fungal assemblages from geographically distant, disparate soils reveals spatial patterning and a
core mycobiome. Diversity 5, 73-98.

85
Rizzo DM, Garbelotto M, Davidson JM, Slaughter GW & Koike ST, 2002. Phytophthora ramorum as
the cause of extensive mortality of Quercus spp. & Lithocarpus densiflorus in California. Plant
Disease 86, 205–214.
Robideau GP, Decock AWAM, Coffey MD, Voglmayr H, Brouwer H, Bala K, Chitty DW, De’
Saulniers N, Eggertson QA, Gachon CMM, Hu C-H, Küpper FC, Rintoul TL, Sarhan E,
Verstappen ECP, Zhang Y, Bonants PJM, Ristaino JB, Le´ Vesque CA, 2011. DNA barcoding of
Oomycetes with cytochrome c oxidase subunit I and internal transcribed spacer. Molecular
Ecology Resources 11, 1002-11.
Sanzani SM, Li Destri Nicosia MG, Faedda R, Cacciola SO, Schena L, 2013. Use of Quantitative PCR
detection methods to study biocontrol agents and phytopathogenic Fungi and Oomycetes in
environmental samples. Journal of Phytopathology 162, 1–13.
Scanu B, Hunter GC, Linaldeddu BT, Franceschini A, Maddau L, Jung T, Denman S, 2014. A
taxonomic re-evaluation reveals that Phytophthora cinnamomi and P.cinnamomi var. parvispora
are separate species. Forest Pathology 44, 1–20.
Schwingle BW, Smith JA, Blanchette RA, 2007. Phytophthora species associated with diseased woody
ornamentals in Minnesota nurseries. Plant Disease 91, 97-102.
Scibetta S, Schena L, Chimento A, Cacciola SO, Cooke DEL, 2012. A molecular method to assess
Phytophthora diversity in environmental samples. Journal of Microbiological Methods 88, 356-
368.
Segata N, Boernigen D, Tickle TL, Morgan XC, Garrett WS, Huttenhower C, 2013. Computational
meta’omics for microbial community studies. Molecular System Biology 9, 666.
Shao W, Boltz V F, Spindler JE, Kearney MF, Maldarelli F, Mellors JW, et al., 2013. Analysis of 454
sequencing error rate, error sources, and arti-fact recombination for detection of Low-frequency
drug resistance mutations in HIV-1 DNA. Retrovirology 10, 18.
86
Skums P, Dimitrova Z, Campo DS, Vaughan G, Rossi L, Forbi JC, et al., 2012. Efficient error
correction for next-generation sequencing of viral amplicons. BMC Bioinformatics 13, S6.
Sogin ML, Morrison HG, Huber JA, Mark Welch D, Huse SM, Neal PR, Arrieta JM, Herndl GJ, 2006.
Microbial diversity in the deep sea and the underexplored ‘rare biosphere’. Proceedings of the
National Academy of Sciences of USA 103, 12115–12120.
Themann K, Werres S, Luttmann R, Diener HA, 2002. Observations of Phytophthora spp. in water
recirculation systems in commercial hardy ornamental nursery stock. European Journal of Plant
Pathology 108, 337-343.
Thompson JD, Gibson TJ, Plewniak F, Jeanmougin F, Higgins DG, 1997. The CLUSTAL_X Windows
Interface: Flexible Strategies for Multiple Sequence Alignment Aided by Quality Analysis Tools.
Nucleic Acids Research 25, 4876-4882.
Vannini A, Bruni N, Tomassini A, Franceschini S, Vettraino AM, 2013. Pyrosequencing of
environmental soil samples reveals biodiversity of the Phytophthora resident community in
chestnut forests. Federation of European Microbiological Societies 83, 433-442.
Vettraino AM, Bonats P, Tomassini A, Bruni N & Vannini A, 2012. Pyrosequencing as a tool for
detection of Phytophthora species: error rate and risk of false MOTUs. Letters in Applied
Microbiology 55, 390–396.
Werres S, Marwitz R, Man i’t Veld WA, de Cock AWAM, Bonants PJM, De Weerdt M, Themann K,
Ilieva E & Baayen RP, 2001. Phytophthora ramorum sp. nov., a new pathogen on Rhododendron
and Viburnum. Mycological Research 105, 1155–1165.
Yakabe LE, Blomquist CL, Thomas SL, MacDonald JD, 2009. Identification and frequency of
Phytophthora species associated with foliar diseases in California ornamental nurseries. Plant
Disease 93, 884–89.

87
Zhang WW, Li F, Nie L, 2010. Integrating multiple ‘omics’ analysis for microbial biology: application
and methodologies. Microbiology 156, 287–301.

88
CHAPTER 4

89
Development and validation of a metagenomic approach based on MiSeq Illumina
sequencing for the study of Phytophthora diversity in water samples
ABSTRACT
A metagenomic approach based on Phytophthora spp. specific primers and Illumina MiSeq was
utilized to investigate Phytophthora diversity in natural Scottish streams and rivers. The performance
of the method was preliminarily evaluated using mixtures of DNA or PCR amplicons from 10 selected
Phytophthora species and reveled that the concentration of the libraries utilized for sequencing has a
great impact on the performance of the method. The use of a more concentrated library (8pM)
significantly increased the number of reads and enabled the detection of all species included in the
panel. The great majority of detected sequences was identical to accepted sequence types (STs),
however a swarm of sequences characterized by a low frequency and differentiated by one or few
nucleotides as compared to STs, was also revealed. The analysis of Phytophthora communities in water
samples from 4 different localities yielded up to 896 K paired-end reads clustering in 3373 MOTUs
associated to several Phytophthora and other Oomycete species. Significant differences were revealed
in the population of the analyzed sites. New Phytophthora phylotypes for which no similarity was
found in reference databases were also detected and were likely to represent unknown organisms.
Major difficulties related to the discrimination of phylogenetically related species and the risk of
ambiguous interpretation of data need to be always taken into account. However, according to our
results the proposed method has a huge potential to evaluate Phytophthora diversity with an
unprecedented level of accuracy.
90
INTRODUCTION
The influence of plant pathogens on biodiversity is not always immediately obvious and, as a
consequence, tends to be overlooked. Among plant pathogens, Phytophthora represents an essential
component of biodiversity for its ecological, evolutionary and socio-economic significance and for its
role in devastating diseases in crop and forest systems (Brasier, 2009).
More than 20 species of Phytophthora, including P. ramorum, the sudden oak death pathogen,
have been isolated from irrigation reservoirs and natural waterways (Hong et al., 2005; 2008; Reeser et
al. 2007; Werres et al., 2007; Tjosvold et al., 2008), and a number of previously unknown taxa also
have been documented in aquatic environments (Brasier et al., 2003; Hong et al., 2008). These
pathogens pose a threat to agricultural sustainability and natural ecosystems, as agriculture increasingly
depends on recycled water for irrigation in light of rapidly spreading global water scarcity (Hong et al.,
2001; 2005). Recycling irrigation systems provide an efficient means of pathogen dissemination from a
single point of infection to an entire farm and from a single farm to other farms sharing the same water
resources (Hong et al., 2005; 2008). Nevertheless, plant health legislation has been enforced worldwide
to prevent the spread of these pathogens and avoid negative ecological impact, there is a surprising lack
of information on the aquatic ecology of Phytophthora species.
Specific tools are required for direct detection of Phytophthora in organic substrates, plant hosts
and soil or water samples in a relatively rapid assay and from samples of a meaningful size (Martin &
English, 1997). For long time, baiting and culture-based detection assays have been the only available
techniques to assess the diversity of Phytophthora in natural communities (Jung et al., 2000; Vettraino
et al., 2005; Davidson et al., 2005; Jung, 2009). Although still valuable, conventional detection
methods have been a constraint on the characterization and analysis of the whole Phytophthora
diversity (Cooke et al., 2007).

91
Extraction and identification of DNA from environmental samples has proven noteworthy in
detecting and monitoring not only common species, but also those that are endangered, invasive, or
elusive (Bohmann et al., 2014). In the last two decades, DNA sequence analysis has greatly contributed
to general understanding of the diversity and phylogenetic relationships in the Phytophthora genus. The
internal transcribed spacer (ITS) regions of the rRNA genes was proved a valuable target for the design
of many PCR detection assays that have complemented or replaced isolation and baiting techniques in
many host/pathogen combinations (Cooke et al., 2000a). Such molecular assays, however, are geared
to the detection of one, or very few, specific known target species (Schena et al., 2008), and, therefore
unsuitable in cases where multiple or, as yet undescribed, Phytophthora spp. are present. This latter
point is recognized as a major weakness of protocols used in international plant health legislation
(Brasier, 2008).
Metagenomic DNA sequencing approaches based on PCR amplification of single target regions
such as rDNA have been widely used to investigate “in situ” microbial communities in a range of
terrestrial and marine habitats (Lim et al., 2010), demonstrating the power of such methodology and
confirming that rDNA sequence diversity is a valid measure of the occurrence and distribution of
phylogenetic types in natural communities. Advances in DNA sequencing and bioinformatics now
allow massive and accurate biodiversity assessments of microscopic eukaryotes from environmental
samples and the use of high throughput sequencing techniques is dramatically increasing the power of
this approach (Lim et al., 2010). These new sequencing techniques allow in depth analysis through a
variety of sequencing methodologies that are not possible with standard Sanger sequencing. Common
features to second generation sequencing approaches are the addition of tags to amplicons to track
which amplicons come from what sample, the generation of millions of sequences at once which
increases the reliability and scope of analysis, and the ability to generate sequence data in a much more
cost-effective manner.

92
The aim of the present study was the development, validation and application of a high
throughput metabarcoding method for studying Phytophthora diversity. The method is based on the
molecular analysis of the ITS1 region of Phytophthora spp. from water samples from Scottish natural
and semi-natural habitats and their sequencing with the high-throughput MiSeq Illumina system.
MiSeq platforms use bridge amplification to produce up to 1.6 billion sequences per flow cell with a
maximum length for paired-end reads up to 300 bp. The evaluation of a suitable protocol for Illumina
sequencing was critical to enable detection of the overall diversity and avoid suboptimal sequencing
conditions.
MATERIALS & METHODS
Development of artificial systems (positive controls)
The accuracy and sensitivity of the MiSeq Illumina system was preliminarily evaluated using
artificially developed systems containing DNA from pure cultures or their PCR products. Ten
Phytophthora isolates sourced from the culture collection of The James Hutton Institute (Dundee,
Scotland) were selected to represent different Phytophthora clades (Cooke et al., 2000b) and different
sizes of ITS1 amplicons (Scibetta et al., 2012). Furthermore, prevalence was given to species
unreported in Scotland (Table 1).
DNA extracted from the 10 isolates was mixed and diluted in order to have a final concentration
of 5ng/µl of each Phytophthora species. One μl of total DNA was then subjected to semi-nested PCR
using the Phytophthora spp. specific primers (Scibetta et al., 2012) properly modified to enable
analyses with the MiSeq Illumina system (See below).
Alternatively, separate semi-nested PCR amplicons obtained from each isolate were mixed in
equal proportions, diluted 20 times and analyzed using the MiSeq Illumina system.
Natural water samplings

93
Water samples were collected from four different Scottish streams located in Invergowrie,
Dundee (IGB), Glensaugh Research Station and the Cairngorms National Park (GSB and ECN,
respectively) in Angus, and Sourhope Research Station in “Scottish Borders” (SRB). Samples were
collected every two weeks from December 2011 to March 2014. Water (10 L) was filtered directly in
the field using a clean knapsack sprayer to pressurize an in-line polypropylene filter holder
(XX4304700, Millipore, UK) into which a mixed cellulose esters filter (RW1904700, Millipore, UK)
was fitted (diameter 47 mm and porosity 1.2 μm). The cellulose filters were stored in sterile tubes and
maintained on ice after sampling. Samples were immediately returned to the laboratory in plastic
containers and stored at -20 °C until DNA extraction.
DNA extractions
To extract DNA from pure Phytophthora isolates lyophilized mycelia were ground in the
presence of silica beads (∅ 0.1) and 23 μl of NaOH in 1.5 ml Eppendorf tube. Tubes were spin at 13000
rpm for 5 min and 10 μl of the upper phase resuspended in 90 μl of sterile distilled water. After
extraction, DNA samples were analyzed by electrophoresis in 1.5% agarose gel with SYBR Safe™
DNA gel stain (Invitrogen, UK). Nanodrop (Thermo Fisher Scientific Inc.) was used to measure
absorbance at 260, 280 and 230 nm and estimate concentration and contamination with protein and
humic acid.
DNA from water samples was extracted using a slightly modified version of the method
described by Scibetta et al. (2012). Wet filters were halved and one half cut into about 5 mm squares,
placed in 2 ml Eppendorf tube and freeze-dried for at least 1 day. Each sub-sample was blended in a
Mini-BeadBeater-8 (Bio Spec Products Inc., US) for three 1 min periods at 3000 rpm with 1.5 ml of
SDS lysis buffer (200 mM Tris–HCl [pH 8], 250 mM NaCl, 25 mM EDTA, 0.5% SDS) and 0.6 g of a
mix of silica beads (∅ 0.1 and 1 mm). Tubes were centrifuged at 13,000 rpm for 15 min and the upper

94
phase was extracted twice with an equal volume of phenol/chloroform/isoamyl alcohol (25:24:1) and
100% chloroform (−20 °C), respectively. DNA was precipitated by adding an equal volume of
isopropanol and a tenth of volume of 3M Sodium Acetate (pH 5.2), washed twice with cold 100% and
70% ethanol, dried and re-suspended in 50 µL of HPLC water.
Total DNA was purified through single chromatography columns (Micro Bio-Spin columns,
Bio-Rad, Hercules, CA) filled with 500 μl of Sepharose 2B (Sigma-Aldrich, UK) (Miller, 2001).
Before use, the columns were conditioned by two sequential additions of 150 μl of HPLC water, each
followed by a 3 min centrifugation at 1500 rpm. All DNA samples (50 μl) were added to the top of the
columns and centrifuged for 3 min at 1500 rpm. Purified eluates were collected in a sterile 1.5 ml tube
and stored at −20 °C before molecular analysis.
Purified environmental DNA samples were analyzed by electrophoresis in 1.5% agarose gel
with SYBR Safe™ DNA gel stain (Invitrogen, UK). Nanodrop (Thermo Fisher Scientific Inc.) was
used to measure absorbance at 260, 280 and 230 nm in order to estimate DNA concentration and its
level of contamination with proteins and humic acids. Furthermore, to confirm that all DNA samples
were of sufficient quality to be amplified by PCR, 1 μl of each undiluted DNA sample was amplified
using the universal primers ITS6–ITS4 (White et al., 1990). Extractions were repeated using the second
half of the filters in case of poor/low quality DNA.
PCR reactions
One μl of a mixture of DNA from 10 selected Phytophthora species or from water samples was
amplified by semi-nested PCR using the SP Phytophthora spp. specific primers described by Scibetta
et al. (2012). In both cases, SP primers were modified to fit the MiSeq Illumina protocol requirements.
In particular, overhang adapter sequences were appended to the primer pair sequences for compatibility
with Illumina index and sequencing adapters. According to the manufacturer protocols the Illumina

95
overhang adapter sequences added to forward and reverse SP primers were 5’-
TCGTCGGCAGCGTCAGATGTGTATAAGAGACAG-3’ and 5’-
GTCTCGTGGGCTCGGAGATGTGTATAAGAGACAG-3’, respectively.
All PCR reactions were carried out in the same conditions using a Primus 96plus Thermalcycler
(MWG-Biotech), but first and second rounds of amplifications (nested PCR) were performed in a total
volume of 15 μl and 25 μl, respectively. PCR reactions contained 1x KAPA HiFi HotStart Ready Mix
(Kapa Biosystems, US), 0.3 μM of primers and 1 μl of DNA (1 μl of the 1st round-product was added
in the 2nd round mix). Amplification conditions for Phytophthora spp. specific primers consisted of 1
cycle of 95°C for 3 min, 30 cycles (1st round) or 25 cycles (2nd round) of 98°C for 20 s, 61°C for 25 s,
72°C for 40 s (1st round) and 25 s (2nd round) and a final cycle of 72°C for 1 min. After nested-PCR,
the Agencourt AMPure XP beads (Beckman Coulter, US) were used to purify amplicons according to
the protocol described by the manufacturer.
For the universal primers ITS6–ITS4, 1 μl of DNA was added in a PCR mix of 1X Green
GoTaq® Flexi Buffer (Promega, US) 0.4 mM PCR Nucleotide Mix, 1U GoTaq® G2 Flexi DNA
Polymerase and 0.4 μM of forward and reverse primers. Amplification conditions consisted of 1 cycle
of 95° C, 30 cycles of 95° C for 20 s, 55° C for 25 s, 72° C for 50 s and a final sycle of 72° C for 5 min.
Amplicons were separated by electrophoresis in 2% agarose gels containing SYBR Safe™ DNA gel
stain (Invitrogen, US), in TBE buffer and visualized on UV light. The size of each band was estimated
using a 100 bp DNA ladder (Promega, US).
Many precautions were taken to avoid DNA contamination of the PCR reactions (Van Pelt-
Verkuil et al., 2008). In nested PCR, first and second round PCR reactions were set up in separate
laminar flow hoods located in separate laboratories. Both laminar flow hoods were repeatedly cleaned
with 0.2 M NaOH and 70% EtOH. A special set of pipettes was maintained for DNA amplifications

96
and filter tips (Axygen Scientific, UC, USA) were used at all times. Prior to use, the HPLC water was
UV-treated to denature any contaminating nucleic acids.
Sample preparation for MiSeq Illumina sequencing
After PCR reactions a subsequent limited‐cycle amplification step was performed to add
multiplexing indices and Illumina sequencing adapters and obtain unique libraries. PCR amplifications
were performed in a final volume of 50 μl containing 1x KAPA HiFi HotStart Ready Mix (Kapa
Biosystems, US), 5 μl of Nextera Index primers A and B and 5 μl of nested-PCR product.
Amplification conditions consisted of 1 cycle of 95° C for 3 min, 8 cycles of 95°C for 30 s, 55°C for 30
s, 72°C for 30 s and a final cycle of 72°C for 5 min. After PCR, Agencourt AMPure XP beads
(Beckman Coulter, US) were used to purify the amplicons.
To verify the size of the final library, 1 μl of a 1:50 dilution of each PCR product was run using
the Agilent 2100 Bioanalyzer (Agilent Technologies, Germany). Using Phytophthora specific primers
modified for Illumina sequencing, the expected size of the final library was about 350 bp. All libraries
were quantified by the Qubit® 2.0 Fluorometer (Invitrogen, UK), diluted to 4 nM and pooled. Before
sequencing a qPCR was performed for an accurate quantification of the final library. qPCR was
performed in a final volume of 20 μl prepared with 1x KAPA SYBR FAST qPCR Master Mix
containing Primer Premix (Kapa Biosystems, US) and 4 μl of 1:1000, 1:2000, 1:4000, 1:8000-diluted
library or Illumina DNA standards (Kapa Biosystems, US).
In preparation for cluster generation and sequencing, pooled libraries were denatured with 0.2 N
NaOH, diluted with hybridization buffer, and then denatured before MiSeq sequencing. To find
optimal sequencing conditions, two different runs were performed at a final concentration of the
denatured DNA of 4 and 8 pM. Each run included 10% of PhiX (Illumina, US) as an internal control
during sequencing.

97
For sequencing, the fast-turnaround MiSeq - Illumina system was used with the MiSeq Reagent
Kit v2 in the 500-cycles (2x250) format to allow the longest read lengths. It provided up to 525 cycles
of sequencing, sufficient for up to a 251-cycle paired-end run plus two eight-cycle index reads. The
expected result was approximately 10,000 reads per sample for a total of 500 Mbp in less than 48
hours. The estimated MiSeq run output was, recognized as sufficient for this metabarcoding survey.
Analysis of sequences
Demultiplexed raw data from Miseq were aligned using Pandaseq Assembler software (Masella
et al., 2012). Results were processed with the bioinformatics pipeline QIIME Version 1.8 (Caporaso et
al., 2010). Chimeras and forward and reverse oligos were removed. The open-reference OTU picking
algorithm with a similarity threshold of 99% and the singletons removal option enabled, was utilized
for assigning sequences to molecular operational taxonomic units (MOTUs). The BLAST method was
used to assign taxonomy from a non-redundant selected and manually checked database derived from
GenBank, for a total of 2812 ITS1 sequences from all Oomycetes. For statistical analysis, a workflow
script for computing β-diversity distance matrices and generating PCoA (Principle coordinates
Analysis) plots to assess differences between microbial communities was used.
Table 1. Phytophthora species included in this study and used as control for the protocol. Isolates were sourced from theculture collection of The James Hutton Institute (Dundee, Scotland).
Species Clade ITS1 size
P. boehmeriae 10 172
P. capsici 2 140
P. cryptogea 8 174
P. idaei 1 184
P. fallax 9 172
P. katsurae 5 182

98
RESULTS
Evaluation of MiSeq Illumina sequencing runs with positive controls
Results from positive controls (DNA and PCR mix) revealed a considerable higher numbers of
sequences in the concentrated library (8 pM) as compared to standard concentration (4 pM)
recomended by Illumina guidelines. Using a mixuture of DNA amplicons, 770 and 3916 reads were
obtained with 4 and 8 pM, respectively (Fig. 1). Similarly, using a mixture of DNA, 719 and 4014
reads were obtained with 4 and 8 pM, respectively (Fig. 1). In general, all Phytophthora included in the
panel were detected using an amplicon mixture at both 4 and 8 pM. On the contrary using a DNA mix
and the lower library concentration (4 pM) two species (P. boehmeriae and P. palmivora) were not
detected and another species (P. fallax) was associated to a very low number of reads (Fig. 1). The
detection coverage greatly increased at 8 pM since all Phytophthoras were detetced although few reads
were associated to P. boehmeriae, P. palmivora and P. fallax.
The analyses of sequences revealed that the great majority was identical or highly similar (P.
fallax, P. idaei, P. megasperma and P. rubii) to sequence types (STs) of species included in the panel
(obtained in both directions by Sanger sequencing). However, for all detected species (10) a swarm of
sequences characterized by a low frequency and differentiated by one or few nucleotides as compared
to STs, was also revealed.
P. megasperma 6 193
P. palmivora 4 179
P. plurivora 2 152
P. rubi 7 199
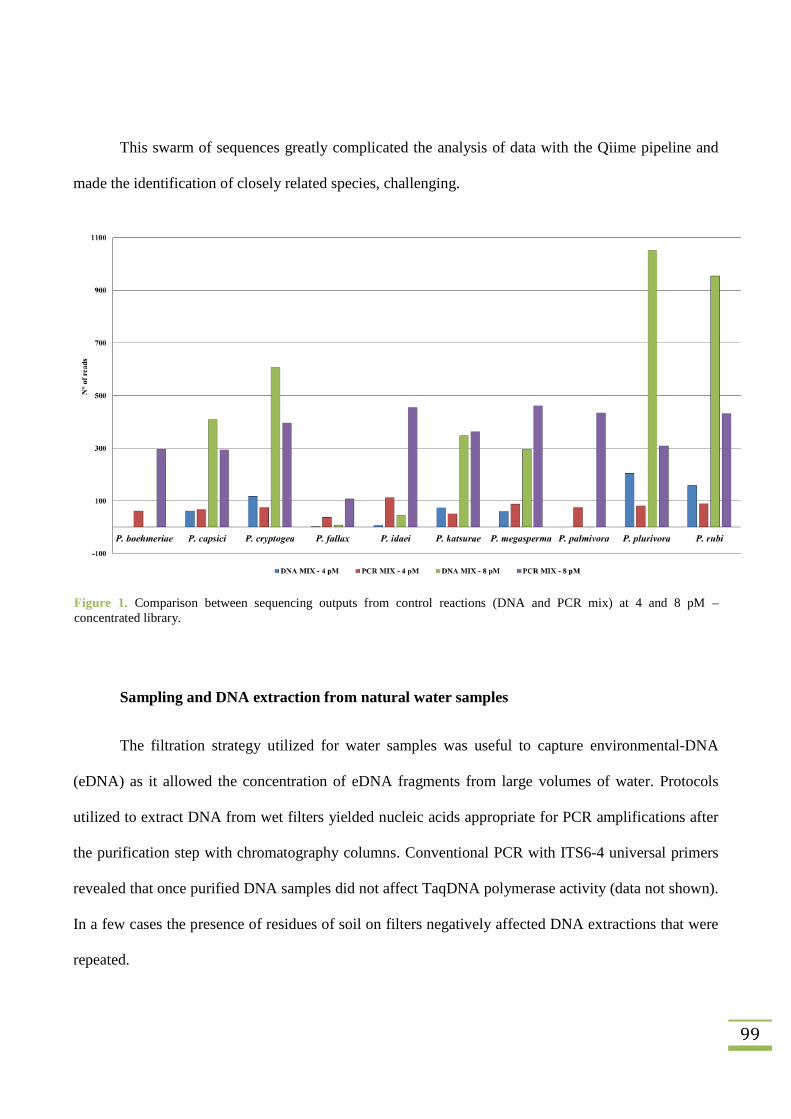
99
This swarm of sequences greatly complicated the analysis of data with the Qiime pipeline and
made the identification of closely related species, challenging.
Sampling and DNA extraction from natural water samples
The filtration strategy utilized for water samples was useful to capture environmental-DNA
(eDNA) as it allowed the concentration of eDNA fragments from large volumes of water. Protocols
utilized to extract DNA from wet filters yielded nucleic acids appropriate for PCR amplifications after
the purification step with chromatography columns. Conventional PCR with ITS6-4 universal primers
revealed that once purified DNA samples did not affect TaqDNA polymerase activity (data not shown).
In a few cases the presence of residues of soil on filters negatively affected DNA extractions that were
repeated.
Figure 1. Comparison between sequencing outputs from control reactions (DNA and PCR mix) at 4 and 8 pM –concentrated library.

100
Amplification results
A total of 149 DNA samples from wet filters collected during the two-year long survey were
analysed by the semi-nested assay. 101 of them (6 from ECN, 48 from IGB, 14 from SRB and 31 from
GSB) produced a positive amplification in at least one of the two analysed filter halves. Among these,
no samples produced a positive amplification after the first PCR step, confirming the need for a nested
approach to yield reliable levels of sensitivity (Scibetta et al., 2012). The six positive PCR fragments
from ECN samples were pooled to form a single sample before sequencing. As a consequence, a total
of 94 unique libraries from environmental samples (1, 48, 14 and 31 from ECN, IGB, SRB and GSB,
respectively) and 2 libraries from positive controls (see above) were pooled before Illumina sequencing.
Sequencing results
After sequencing of 4pM and 8 pM-concentrated libraries, 131.478 and 896.206 sequence reads
respectively, were obtained. The number of reads per sample ranged from 3 to 7017 after sequencing of
the 4 pM-concentrated library and from 59 to 46.369 after sequencing of the 8 pM-concentrated library.
Other technical variants are showed in table 2.
Table 2. Sequencing performances with 4 and 8 pM-concentrated libraries.
4 PM – SEQUENCING RUN 8 PM – SEQUENCING RUN
CLUSTERS DENSITY* (K/mm2) 163 744
CLUSTERS PASS FILTER† (%) 86 95
READS PASS FILTER§ (M) 0,217 1,08
READS > Q30 †† (%) 95 78
READS (K) 131 896
*Number of clonal clusters generated from each DNA amplicon on a flow cell before sequencing. Install specifications based onIllumina PhiX control library at supported cluster densities suggested between 467-583 k/mm2 clusters passing filter for v2 chemistryPerformance parameters may vary based on sample type, sample quality, and clusters passing filter.† § The “filter” is a quality control for those clusters, which are capable of producing good sequencing, reads. It is influenced by overallcluster density and relative positions of clusters on the flow cell.††A quality score (Q-score) is a prediction of the probability of an error in base calling. The percentage of bases > Q30 is averagedacross the entire run. The minimum Q30 score for a 2X250 bp run is >75% “passing filter”.K= thousands, M = millions.
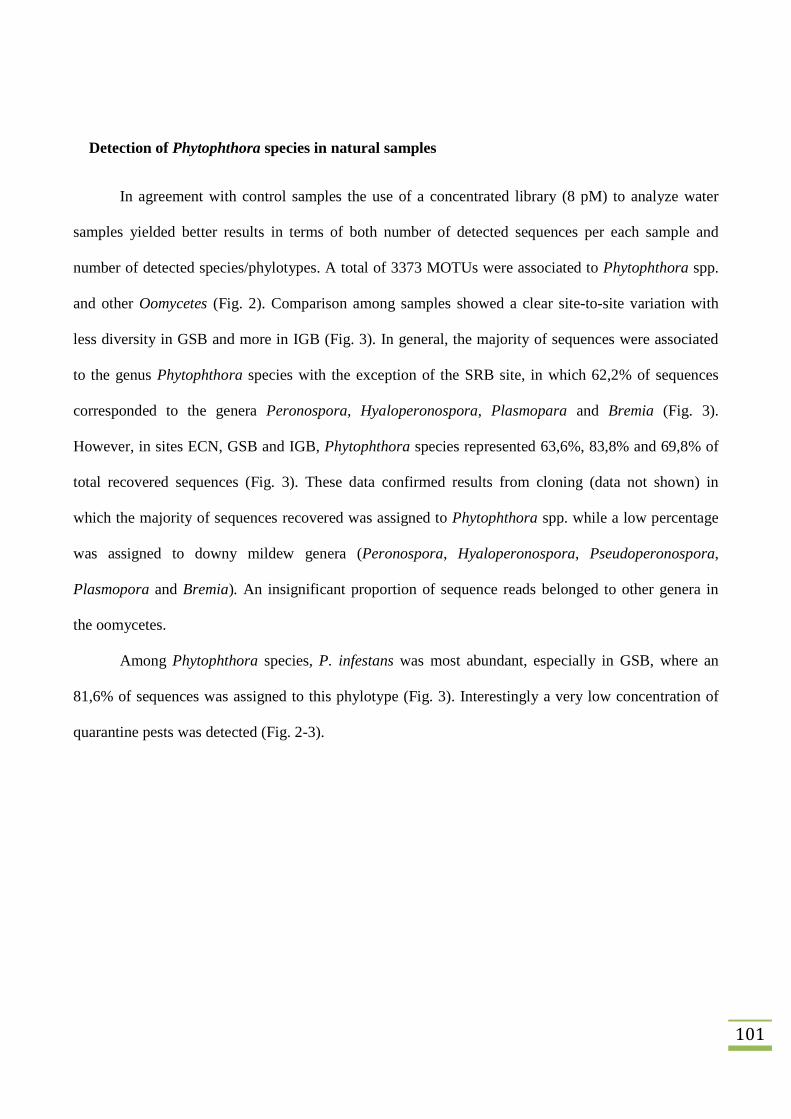
101
Detection of Phytophthora species in natural samples
In agreement with control samples the use of a concentrated library (8 pM) to analyze water
samples yielded better results in terms of both number of detected sequences per each sample and
number of detected species/phylotypes. A total of 3373 MOTUs were associated to Phytophthora spp.
and other Oomycetes (Fig. 2). Comparison among samples showed a clear site-to-site variation with
less diversity in GSB and more in IGB (Fig. 3). In general, the majority of sequences were associated
to the genus Phytophthora species with the exception of the SRB site, in which 62,2% of sequences
corresponded to the genera Peronospora, Hyaloperonospora, Plasmopara and Bremia (Fig. 3).
However, in sites ECN, GSB and IGB, Phytophthora species represented 63,6%, 83,8% and 69,8% of
total recovered sequences (Fig. 3). These data confirmed results from cloning (data not shown) in
which the majority of sequences recovered was assigned to Phytophthora spp. while a low percentage
was assigned to downy mildew genera (Peronospora, Hyaloperonospora, Pseudoperonospora,
Plasmopora and Bremia). An insignificant proportion of sequence reads belonged to other genera in
the oomycetes.
Among Phytophthora species, P. infestans was most abundant, especially in GSB, where an
81,6% of sequences was assigned to this phylotype (Fig. 3). Interestingly a very low concentration of
quarantine pests was detected (Fig. 2-3).
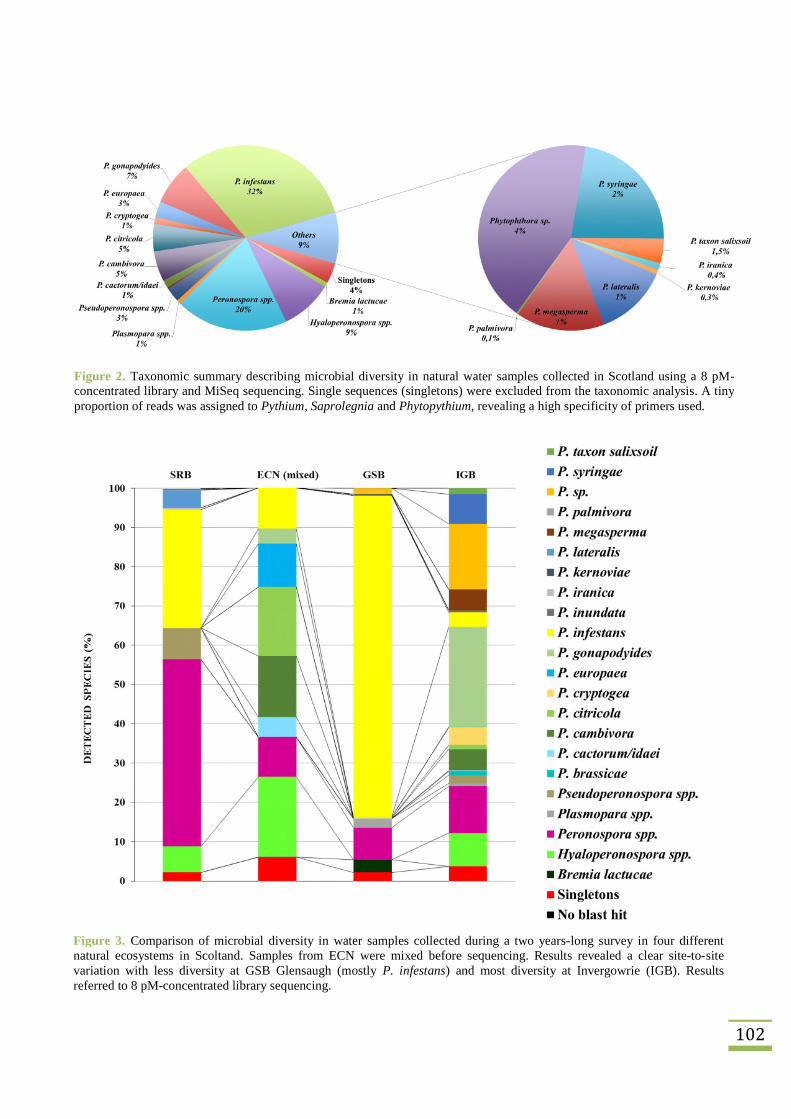
102
Figure 2. Taxonomic summary describing microbial diversity in natural water samples collected in Scotland using a 8 pM-concentrated library and MiSeq sequencing. Single sequences (singletons) were excluded from the taxonomic analysis. A tinyproportion of reads was assigned to Pythium, Saprolegnia and Phytopythium, revealing a high specificity of primers used.
Figure 3. Comparison of microbial diversity in water samples collected during a two years-long survey in four differentnatural ecosystems in Scoltand. Samples from ECN were mixed before sequencing. Results revealed a clear site-to-sitevariation with less diversity at GSB Glensaugh (mostly P. infestans) and most diversity at Invergowrie (IGB). Resultsreferred to 8 pM-concentrated library sequencing.
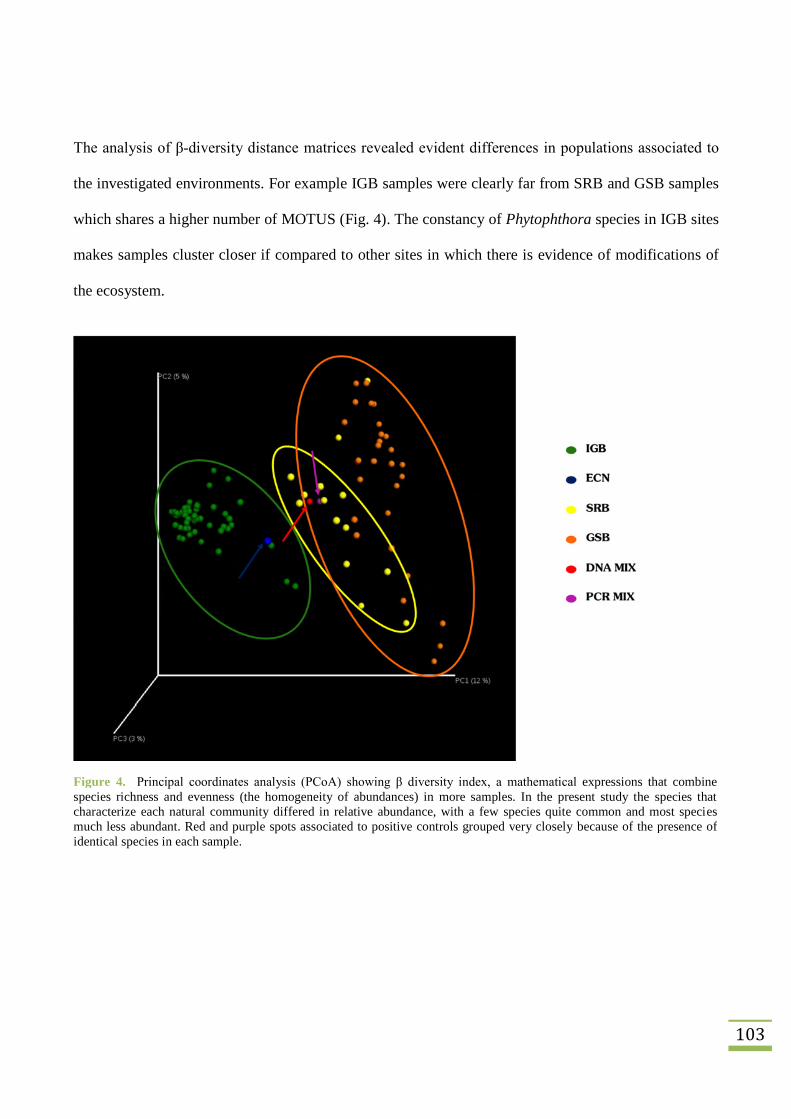
103
The analysis of β-diversity distance matrices revealed evident differences in populations associated to
the investigated environments. For example IGB samples were clearly far from SRB and GSB samples
which shares a higher number of MOTUS (Fig. 4). The constancy of Phytophthora species in IGB sites
makes samples cluster closer if compared to other sites in which there is evidence of modifications of
the ecosystem.
Figure 4. Principal coordinates analysis (PCoA) showing β diversity index, a mathematical expressions that combinespecies richness and evenness (the homogeneity of abundances) in more samples. In the present study the species thatcharacterize each natural community differed in relative abundance, with a few species quite common and most speciesmuch less abundant. Red and purple spots associated to positive controls grouped very closely because of the presence ofidentical species in each sample.

104
DISCUSSION
In the present study the application of a metagenomic approach based on Phytophthora spp.
specific primers and Illumina MiSeq provides an unprecedented sequencing depth to investigate
Phytophthora diversity in natural Scottish streams and rivers. Illumina MiSeq is one of the leading
technologies supplanting Sanger sequencing for metabarcoding analysis. The most popular
metabarcoding application is the sequencing of rDNA amplicons to profile the phylogenetic diversity
within microbial communities. However, this sequencing platform has to date been primarily used for
Bacterial metabarcoding, and little information is currently available about its application to
characterize fungal and Oomycete (including Phytophthora) populations. To our knowledge, this study
is the first report evaluating the application of Illumina sequencing of the ITS1 region of the rDNA to
evaluate Phytophthora diversity.
The analysis of the sequencing performance conducted on artificial systems based on mixtures
of DNA or PCR amplicons from 10 selected Phytophthora species revealed that the choice of an
optimal concentration of the final library (8 pM instead of 4 pM) has a great impact on the performance
of the sequencing and on the quality of final results (Table 2). In particular, this choice strongly
affected the cluster creation step, considered one of the most critical, with remarkable effects on the
clusters and the consequent number of reads. Indeed a low concentration of the final library used for
sequencing decreased the level of diversity since, in the case DNA mixtures, two species (P.
boehmeriae and P. palmivora) included in the panel, were not detetced using a 4 pM library. On the
other hand, the use of 8pM libraries enabled the detection of all species but with large differences in the
number of reads, although an equal quantity of DNA from each species was mixed. These results reveal
important challenging aspects during the amplification step, which appear to favour the amplification
of some species as compared to others. The size of the ITS1 product was hypothesized to influence the
PCR efficiency and therefore the final read number in this study no relationship between product size

105
and read number (Table 1, Fig.1) was observed. Probably, the quality of extracted DNA from the
different isolates played a major role in determining results, but other factors such as copy number
within each species cannot be excluded. In particular, since degenerate primers are used to amplify the
target region (Scibetta et al., 2012), it cannot be completely excluded that some targets may be
favoured over others in complex mixtures, containing DNA from different species. As a confirmation,
a much better performance of the methods was obtained when a mixuture of amplicons, amplified in
separate reactions, was sequenced. In general our data clearly indicate that quantitative analyses based
on the relative abundance of different reads in natural samples need to be interpreted with great caution.
Furthermore, a critical aspect remains the use of sensitive and standardized DNA extraction methods.
Another challenging aspect revealed by the analyses of controls is related to the swarm of
detected sequences showing high similarity but not identity as compared to accepted sequence types
(STs). These sequences are likely to be the results of errors introduced duing the MiSeq sequencing but
it cannot be exluded that at least some of them reflect a true variation amongst ITS tandem repeats.
Indeed two variant forms of the P. cryptogea ITS ST were observed at frequencies of 260 and 160
reads each and these corresponded to a dimorphic base in the Sanger sequence reads of the same isolate
(data not shown). Most variant sequences were however detected with a very low frequency as
compared to STs, and a threshold may be applied to exclude low abundant reads from the analysis.
However, the identification of a correct threshold to enable the deletion of artifacts and at the same
time the detection of all true genetic variation is a very complicated task (Vettraino et al., 2012).
Although many aspects need to be addressed and optimized, the analysis of Phytophthora
communities in natural Scottish water samples demonstrated the feasibility of the proposed method to
study the Phytophthora microbial diversity with an unprecedented level of detail. Up to 896 K paired-
end reads (less then 250 nucleotides in length) were obtained and clustered in 3373 MOTUs associated
to several Phytophthora species and other Oomycete species. The detection of other Oomycetes along
106
with Phytophthora spp. was partially expected because is has been alredy reported that primers used in
the present study may also amplify the target region from other downy mildew species (Scibetta et al.,
2012).
Detected reads where analized with the QIIME toolkit which enables standard analyses on a
huge sequence sets, including quality filtering of reads, efficient molecular operational taxonomic units
(MOTUs) picking, taxonomy assignment and computation of β diversity measure (Caporaso et al.,
2010). The use of this versatile bioinformatics tool enabled many computational challenges to be
overcome including the OTU picking step which was performed using the “open-reference OTU
picking” option. This workflow clustered all reads against a reference sequence collection and rather
than discard sequences that failed to match the reference, these “failures” were clustered de novo in a
serial process. As a consequence analyses were not restricted to already-known MOTUs and all
detected MOTUs (excluding singletons) were combined into a single filtered table (Rideout et al.,
2014). The main advantage of this workflow was the possibility to identify new phylotypes for which
no similarity was found in reference database and that at list partially are likely to represented unknown
organisms. Among identified MOTUs 3169 out of 3373 were assigned by BLAST to the genus
Phytophthora spp., even if the identification of the species was frequently challenging. This aspect
represents a major obstacle in the development of species-specific metabarcoding protocols and further
work on bioinformatics pipelines to identify and characterize the ‘unknown’ species is required.
Indeed most currently utilized bioinformatics tools and genetic databases enable a good
identification of microorganisms up to the level of genus but they become less reliable when used to
identify species. This is aspect is particularly important for Oomycete plant pathogens since related
species with very similar ITS sequences may have very different pathogenetic behavior. Although the
ITS1 sequence analysis has been widely used for identification of true fungi and oomycetes due to the
relatively high number of informative and discriminant bases (Cooke et al., 2000b; Blair et al., 2008),
107
many species are poorly resolved with ITS (Martin & Tooley, 2003; Jung & Burgess, 2009) and this
problem may result in some misclassifications of the Phytophthora community. The generation of false
MOTUs because of the presence of closely related species in a sample represents an important
bottleneck of all high-throughput sequences analysis (Vettraino et al., 2012). A single reliable, non-
redundant and regularly updated reference database is required to limit errors in assigning taxonomy
and the optimization of the taxonomic threshold to reliably detect OTUs against “noise” still remains a
big challenge (Vettraino et al., 2012; Bik et al., 2014).
In the present study, difficulties in discriminating phylogenetically related species with identical
sequences or differing only by a few nucleotide positions, were preliminary noticed during the analysis
of the artificial systems, based on a mixture of PCR products or DNA of 10 different Phytophthora
isolates. In particular, the in silico taxonomic analysis assigned three groups of MOTUs corresponding
to P. rubi, P. idaei and P. plurivora incorrectly to the species P. cambivora, P. cactorum and P.
citricola, respectively. This result was anticipated for P. plurivora and P. citricola that were found to
be very similar genetically (Jung & Burgess, 2009) as well for P. cactorum and P. idaei that differ by
only a few bases across the whole ITS region (Cooke et al., 1996; Cooke et al., 2000b). The correct
identification of such closely related species can be made via careful comparisons against high quality
reference sequences but the need for such manual curation should be avoided by improved
bioinformatic tools and reference databases. The variability in data quality in current databases is a
major impediment. Furthermore, as stated above, the generation of errors during sequencing or
amplification steps can certainly increase the generation of false MOTUs, although the the use of a
high-fidelity polymerase, greatly increases reliability of the analyses.
In conclusion, a protocol based on the high-throughput MiSeq Illumina sequencing was tested on
artificial control reactions of DNA or amplicons from pure cultures and used to study Phytophthora
diversity in natural water samples from four apparently healthy Scottish sites. The study was successful

108
and demonstrates that the method has a huge potential to evaluate Phytophthora diversity with an
unprecedented level of accuracy. However, many technical and bioinformatic aspects need to be
addressed and the risk of ambiguous results need to be always taken into account. In this context, the
future development and validation of alternative barcode markers characterized by a higher
interspecific variation may be required.
ACKNOWLEDGMENTS
This work was funded by the Scottish Government. I am grateful to Dr. David Cooke and Dr. Eva
Randall for their valuable assistance during each step of the analysis at the James Hutton Institute
(Dundee, Scotland). I would also like to thank Jenny Morris and Pete Hedley for help with the MiSeq,
staff who sampled the rivers and help with bioinformatic analysis from Ahmed Abdelfattah.
REFERENCES
Bik HM, Porazinska DL, Creer S, Caporaso JG, Knight R, Thomas WK, 2012. Sequencing our way
towards understanding global eukaryotic biodiversity. Trends in Ecology and Evolution 27, 233-
243.
Blair JE., Coffey MD, Park S-Y, Geiser DM, Kang S, 2008. A multi-locus phylogeny for Phytophthora
utilizing markers derived from complete genome sequences. Fungal Genetics and Biology 45,
266-277.
Bohmann K, Evans A, Gilbert MTP, Carvalho GR, Creer S, Knapp M, Yu DW, de Bruyn M, 2014.
Environmental DNA for wildlife biology and biodiversity monitoring. Trends in Ecology and
Evolution 29, 358–367.
Brasier CM, Cooke DEL, Duncan JM, Hansen EM, 2003. Multiple new phenotypic taxa from trees and
riparian ecosystems in Phytophthora gonapodyides-P. megasperma ITS clade 6, which tend to be
high-temperature tolerant and either inbreeding or sterile. Mycological Research 107, 277–290.

109
Brasier CM, 2008. The biosecurity threat to the UK and global environment from international trade in
plants. Plant Pathology 57, 792-808.
Brasier CM, 2009. Phytophthoras in Forests and Natural Ecosystems. In: Goheen EM, Frankel SJ, tech.
coords. Proceedings of the fourth meeting of the International Union of Forest Research
Organizations (IUFRO) Working Party S07.02.09. General Technical Report PSW-GTR-221.
Albany, CA: U.S. Department of Agriculture, Forest Service, Pacific Southwest Research
Station, 101–115.
Caporaso JG, Kuczynski J, Stombaugh J, Bittinger K, Bushman FD, Costello EK, Fierer N, Pena AG,
Goodrich JK, Gordon JI, 2010. QIIME allows analysis of high-throughput community
sequencing data. Nature Methods 7,335-336.
Cooke DEL, Kennedy DM, Guy DC, Russel J, Unkles SE, Duncan JM, 1996. Relatedness of group I
species of Phytophthora as assessed by randomly amplified polymorphic DNA (RAPDs) and
sequences of ribosomal DNA. Mycological Research 100, 297-303.
Cooke DEL, Drenth A, Duncan JM, Wagels G, Brasier CM, 2000a. A molecular phylogeny of
Phytophthora and related Oomycetes. Fungal Genetics and Biology 30, 17-32.
Cooke DEL, Duncan JM, Williams NA, Hagenaar-de Weerdt M, Bonants PJM, 2000b. Identification
of Phytophthora species on the basis of restriction enzyme fragment analysis of the internal
transcribed spacer regions of ribosomal RNA. EPPO Bulletin 30, 519-523.
Cooke DEL, Schena L, Cacciola SO, 2007. Tools to detect, identify and monitor Phytophthora species
in natural ecosystems. Journal of Plant Pathology 89, 13-28.
Davidson JM, Wickland AC, Patterson HA, Falk KR, Rizzo DM, 2005. Transmission of Phytophthora
ramorum in mixed-evergreen forest in California. Phytopathology 95, 587–596.
Hong CX, Bush EA, Richardson PA, Stromberg EL, 2001. The major deterrent to recycling irrigation
water in nursery and greenhouse operations despite lack of alternatives for limiting nonpoint

110
source pollution, p. 72–77. Proceedings of the Virginia Water Research Symposium 2001.
Protecting our water resources for the next generation. Where do we go from there? Virginia
Water Resources Research Center, Virgina Polytechnic Institute and State University,
Blacksburg, VA.
Hong CX, Moorman GW, 2005. Plant pathogens in irrigation water: challenges and opportunities.
Critical Reviews in Plant Sciences 24, 189–208.
Hong CX, Richardson PA, Kong P, 2008. Pathogenicity to ornamental plants of some existing species
and new taxa of Phytophthora from irrigation water. Plant Disease 92, 1201–1207.
Jung T, Blaschke H, Oßwald W, 2000. Involvement of soilborne Phytophthora species in Central
European oak decline and the effect of site factors on the disease. Plant Pathology 49, 706–718.
Jung T, 2009. Beech decline in Central Europe driven by the interaction between Phytophthora
infections and climatic extremes. Forest Pathology 39, 73–94.
Jung T, Burgess TI, 2009. Re-evaluation of Phytophthora citricola isolates from multiple woody hosts
in Europe and North America reveals a new species, Phytophthora plurivora sp. nov. Persoonia
22, 95–110.
Lim YW, Kim BK, Kim C, Jung HS, Kim BS, Lee JH, Chun J., 2010. Assessment of soil fungal
communities using pyrosequencing. Journal of Microbiology 48, 284–289.
Masella AP, Bartram AK, Truszkowski JM, Brown DG, Neufeld JD, 2012. PANDAseq: paired-end
assembler for illumina sequences. BMC Bioinformatics 13, 31.
Martin FN, English JT, 1997. Population genetics of soilborne fungal plant pathogens. Phytopathology
87, 446–447.
Martin FN, Tooley PW, 2003. Phylogenetic relationships among Phytophthora species inferred from
sequence analysis of the mitochondrially-encoded cytochrome oxidase I and II genes. Mycologia
95, 269–284.

111
Miller DN, 2001. Evaluation of gel filtration resins for the removal of PCR-inhibitory substances from
soils and sediments. Journal Microbiological Methods 44, 49–58.
Pelt-Verkuil E van, Belkum Al van, Hays JP, 2008. Principles and Technical Aspects of PCR
Amplification. Berlin, Germany: Springer.
Reeser PW, Hansen EM, Sutton W, 2007. Phytophthora siskiyouensis, a new species from soil, water,
myrtlewood (Umbellularia californica) and tanoak (Lithocarpus desifloorus) in southwestern
Oregon. Mycologia 99, 639–643.
Rideout JR, He Y, Navas-Molina JA, Walters WA, Ursell LK, Gibbons SM, Chase J, McDonald D,
Gonzalez A, Robbins-Pianka A, Clemente JC, Gilbert JA, Huse SM, Zhou H-W, Knight R,
Caporaso JG, 2014. Subsampled open-reference clustering creates consistent, comprehensive
OUT definitions and scales to billions of sequences. PeerJ 2:e545; DOI 10.7717/peerj.545
Schena L, Duncan JM, Cooke DEL, 2008. Development and application of a PCR based “molecular
tool box” for the detection of Phytophthora species damaging forests and natural ecosystems.
Plant Pathology 57, 64–75.
Scibetta S, Schena L, Chimento A, Cacciola SO, Cooke DEL, 2012. A molecular method to assess
Phytophthora diversity in environmental samples. Journal of Microbiological Methods 88, 356-
368.
Tjosvold SA, Chambers DL, Koike ST, Mori SR, 2008. Disease on nursery stock as affected by
environmental factors and seasonal inoculum levels of Phytophthora ramorum in stream water
used for irrigation. Plant Disease 92, 1566–1573.
Vettraino AM., Morel O, Perlerou C, Robin C, Diamandis S, Vannini A, 2005. Occurrence and
distribution of Phytophthora species in European chestnut stands and their association with ink
disease and crown decline. European Journal of Plant Pathology 111, 169–180.

112
Vettraino AM, Bonats P, Tomassini A, Bruni N & Vannini A, 2012. Pyrosequencing as a tool for
detection of Phytophthora species: error rate and risk of false MOTUs. Letters in Applied
Microbiology 55, 390–396.
Werres S, Wagner S, Brand T, Kaminski K, Seipp D, 2007. Survival of Phytophthora ramorum in
recirculating irrigation water and subsequent infection of Rhododendron and Viburnum. Plant
Disease 91, 1034–1044.
White TJ, Bruns T, Lee S, Taylor J, 1990. Amplification and direct sequencing of fungal ribosomal
RNA genes for phylogenetics. In: Innis, M.A., Gelfand, D.H., Sninsky, J.J., White, T.J. (Eds.),
PCR Protocols: A Guide to Methods and Applications. Academic Press Inc, New York, pp. 315–
322.

113
CHAPTER 5

114
CONCLUSION
Tasks related to epidemiology, quarantine, eradication, and biosecurity need rapid, accurate and
reliable means by which plant pathogens can be adequately detected, identified and quantified.
Accurate technologies are required to detect the organisms directly in their living habitat (for example
from organic substrates, plant host, soil or water) in a relatively rapid assay and from samples of a
meaningful size. This is particularly important in the case of soil-borne/root pathogens such as most
Phytophthora species since detection is often challenging due to the structural, physical and biological
complexity of the rhizosphere and soil environment.
The main objective of the present project was the development and application of appropriate
tools based on metabarcoding of the PCR-amplified rDNA ITS regions to evaluate Phytophthora
diversity in soil and root sample from nurseries and in natural water samples from rivers and streams.
Three different methods based on Cloning/Sanger sequencing, 454 pyrosequencing and Illumina MiSeq
were evaluated. All methods provided the use of Phytophthora spp. specific primers and proved to be
appropriate to investigate Phytophthora diversity with an unprecedented level of accuracy as compared
with traditional baiting and/or cultural methods. The cloning/Sanger sequencing approach produced
reliable results due to the trustworthiness of Sanger sequencing but time and costs of the analyses
related to this sequencing strategy and to the required cloning step represents an important issue. The
454 pyrosequencing may represent a good compromise between reliability of the analyses and reduced
costs and time to afford large scale investigations. Furthermore, this technique enabled much more
detailed investigations with the detection or rare and/or low abundant phylotypes including putative
new species still unknown to the scientific community. As regard to the MiSeq approach it represents
the most powerful investigated approach and it has a huge potential to evaluate Phytophthora diversity
with an unprecedented level of accuracy. However, many aspects need to be addressed and the risk of
ambiguous results need to be always taken into account. A major challenge with all methods is the

115
discrimination of phylogenetically related species that might have sequences identical or differing only
by a few nucleotide positions. In this context the performing of downstream standard phylogenetic
analyses may greatly help in the accurate evaluation and interpretation of data but the huge amount of
sequences produced with second generation sequencing strategies represents a big challenge. All
methods have great scope for further implementations with new approaches. New projects are now
focusing on the use of primers ensuring a higher coverage in order to include the genus Pythium spp.
and other relevant Oomycetes plant pathogens and/or to identify alternative barcode genes providing
higher levels of resolution to enable the discrimination of closely related species. This latter aspect is
particularly relevant for Oomycete plant pathogens since related species with very similar ITS
sequences can be characterized by a completely different pathogenetic behavior.
In general, the methods developed and validated in the present study represent valuable tools to
study the biology, population genetic, center of origin and diffusion pathways of Phytophthora species
as well as to update the quarantine lists of international plant protection organizations. The accurate and
cost-effective detection of all Phytophthora taxa including those still unknown to the scientific
community represents another important aspect for a number of applications from pathogen surveys to
biosecurity statutory testing. Metagenomic analyses may also effectively integrate more conventional
detection methods such as baiting and culturing methods by indicating the presence and localization of
new phylotypes and facilitate their isolation and characterization. The achievement of the above-
mentioned objectives will be essential to raise public and industry awareness and will have important
practical implications in reducing the threat related to the introduction and diffusion of invasive
Phytophthoras, including those still unknown to science that represent a hidden enemy against which
there are few current effective management tools.

AKNOWLEDGMENTS
I want to really thank Professor Leonardo Schena for helping me to reach this objective and
supporting me step by step along the last three years.
I want to give a special thank to all the staff of The James Hutton Institute in Dundee (Scotland)
and, in particular, to dr David Cooke, dr Eva Randall, dr Jenny Morris and dr Pete Hedley for their
valuable assistance.
I would also like to thank my co-tutor, dr Roberto Faedda and all the professors from the
University of Catania for the outstanding teaching they provided me.
Many thanks to the examination board directing this session.
I would like to thank all the staff of the plant pathology lab (Ahmed, Angela, Antonio, Maria,
Saveria, Sonia), the entomologists (Antonino, Francesca, Orlando, professor V. Palmeri) of the
Department of Agriculture of the University Mediterranea in Reggio Calabria for sharing with me
unforgettable moments and supporting me both from a professional and a personal point of view.
Many thanks to professor Stefano Colazza and dr Ezio Peri for running the Phd course in an
impeccable manner.
Thanks to Fabio, my support and motivational coach, for protecting me against difficulties.
Thanks to mum Rosa and dad Vito for all the sacrifices they will continue to make for me.
Marisabel

RINGRAZIAMENTI
Vorrei rivolgere il primo e più caloroso ringraziamento al prof Leonardo Schena che mi ha
consentito di raggiungere questo obbiettivo e che mi ha supportato con grandissima dote di mentore
durante ogni singolo passo mosso durante questi tre anni.
Un particolare ringraziamento a tutto lo staff del The James Hutton Institute di Dundee (Scozia)
e in particolare al dr David Cooke, alla dr Eva Randall, alla dr Jenny Morris e al dr Pete Hedley per
l’encomiabile professionalità con cui hanno saputo istruirmi.
Ringrazio il mio co-tutor, dr Roberto Faedda e i professori dell’Università di Catania, per i
grandi insegnamenti che mi hanno saputo dare.
Vorrei rivolgere un sentito grazie alla commissione che prenderà parte alla discussione della
presente tesi.
Ringrazio tutti i collaboratori del laboratorio di patologia vegetale (Ahmed, Angela, Antonio,
Maria, Saveria, Sonia) e i colleghi entomologi (Antonino, Francesca, Orlando, il prof. V. Palmeri) del
dipartimento di Agraria dell’Università Mediterranea di Reggio Calabria con i quali ho condiviso dei
momenti indimenticabili che mi hanno costantemente supportata sia dal punto di vista professionale
che privato durante questa avventura.
Ringrazio il prof Stefano Colazza e il dr Ezio Peri per l’impeccabile gestione del corso di
dottorato.
Grazie a Fabio, mia roccia e mio motivational coach, che riesce sempre a proteggermi da ogni
difficoltà.
Grazie a mamma Rosa e babbo Vito per tutti i sacrifici che continueranno a fare per me.
Marisabel