metabolomics batch data analysis workfl ow to ... - agilent · metabolomics batch data analysis...
TRANSCRIPT
Metabolomics Batch Data Analysis Workfl ow to Characterize Differential Metabolites in Bacteria
Application Note
AuthorsYuqin Dai and Steven M. FischerAgilent Technologies, Inc.Santa Clara, CA, USA
AbstractAn accurate mass Q-TOF LC/MS workfl ow for discovery metabolomics was used to study a bacterium in early and late stationary phases. The use of software that can process data in batch-mode made the data analysis more effi cient and automated. A total of 488 features from the positive ion data and 623 features from the negative ion data were found using Agilent MassHunter Profi nder (batch feature extraction software). Statistical analyses using Mass Profi ler Professional (MPP) revealed features whose abundance differed signifi cantly in early stationary phase versus late stationary phase. From the positive ion data, 57 features were found to have higher abundances in the early stationary phase than in the late stationary phase. While in the negative ion data, 52 features exhibited higher abundances in the early stationary phase compared to the late stationary phase. To understand the biological and biochemical context of the metabolomics data, we annotated and identifi ed over 100 differential features using database searching, accurate mass MS/MS library matching, and MS/MS molecular structure correlation.
2
Dynamic mass axis calibration was achieved by continuous infusion of a reference mass solution using the isocratic pump. Tables 1 and 2 summarize the optimized LC and MS conditions.
Data analysis software• Agilent MassHunter Qualitative
Analysis (Qual) B.07.00
• Agilent MassHunter Profi nder B.06.00, service pack 1
• Agilent Mass Profi ler Professional (MPP) B.13.0
• Agilent MassHunter Molecular Structure Correlator (MSC) B.07.00
• Pathway to PCDL B.07.00
For LC/MS analysis, the sample was resuspended in 500 µL of water/acetonitrile (3:7 v/v) solvent, then vortexed and centrifuged. The supernatant was transferred from an Eppendorf tube to a clean LC/MS vial.
InstrumentationLC/MS Analysis was performed using an Agilent 1290 Infi nity LC system coupled to either an Agilent 6230 TOF system or an Agilent 6550 iFunnel Q-TOF system. The LC system consisted of the following modules:
• Agilent 1290 Infi nity Binary Pump (G4220A)
• Agilent 1290 Infi nity Autosampler with a thermostat (G4226A)
• Agilent 1290 Infi nity Thermostatted Column Compartment (G1316C)
• Agilent 1100 Series Isocratic Pump (G1310) with a 100:1 splitter (p/n G1607-60000)
IntroductionThe growth of bacteria has been studied for more than a century, including the now classical defi nition of the phases of growth identifi ed by Jacob Monod1. It was found that cells remain alive and metabolically active during the late stationary phase, but often respond differently to stimuli or stresses during the early part of stationary phase compared to the late stationary phase. Researchers hypothesize that one or more metabolites produced during the stationary phase may render a bacterium less viable in late stationary phase or, alternatively, that a protective metabolite may be lost during the progression of stationary phase. To our knowledge, there is no information available about the characteristics of those metabolites.
Here we present a Q-TOF LC/MS metabolomics approach to investigate differential metabolites of a bacterium in the early stationary versus late stationary phase. The Agilent suite of data processing software makes feature fi nding, statistical analysis, and identifi cation easier. This enables rapid transformation of complex raw data into biologically relevant metabolite information.
ExperimentalSample preparationCell cultures were harvested either in early or late stationary phase, rinsed twice with phosphate-buffered saline to remove any residual extracellular media, and then rinsed with water to remove the buffer. The suspended cells were then centrifuged to form a pellet and the water was decanted. To the cell pellets was added 0.5 mL of MeOH at –80 °C and then 1.5 mL of 50 % MeOH/H2O at 4 °C. The cells were mechanically lysed, and the crude extract was spun at 48,000 g for 1 hour, then the supernatant was collected. An aliquot of 500 µL of supernatant was added to a 3 kDa Nanosep fi lter and spun at 14,000 g, the fi ltrate was collected, vacuum dried, and held at ≤ –60 °C until analysis.
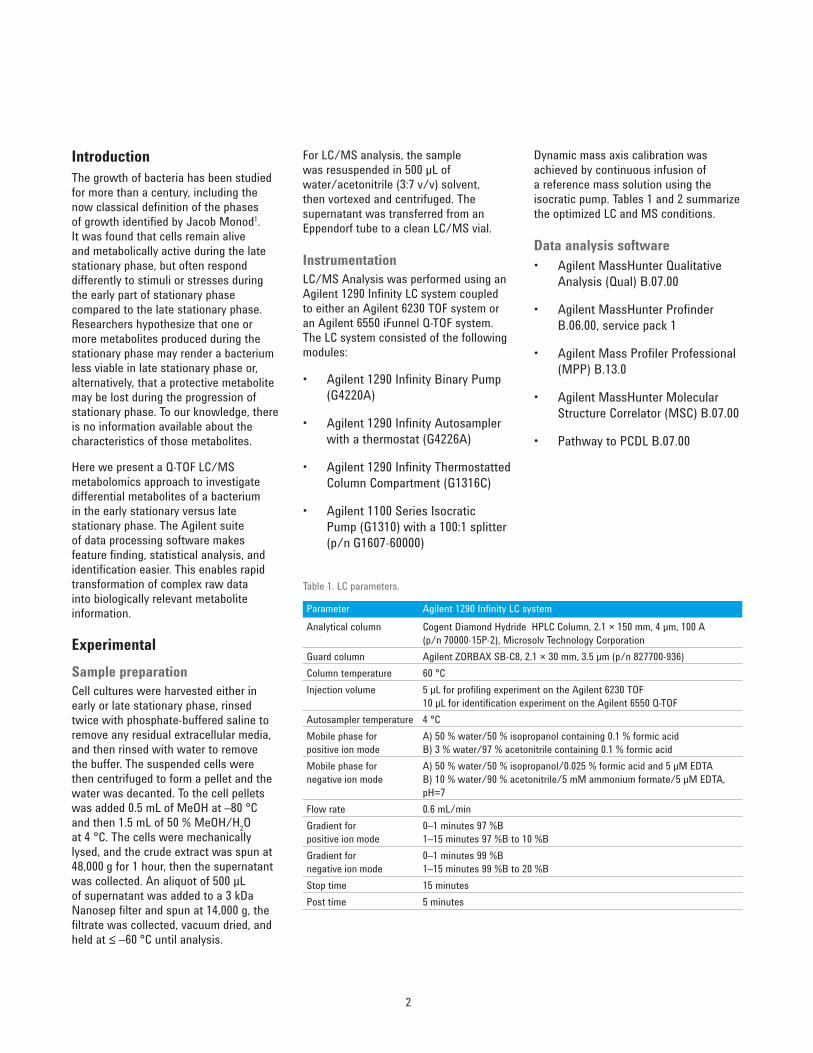
Table 1. LC parameters.
Parameter Agilent 1290 Infi nity LC systemAnalytical column Cogent Diamond Hydride HPLC Column, 2.1 × 150 mm, 4 µm, 100 A
(p/n 70000-15P-2), Microsolv Technology CorporationGuard column Agilent ZORBAX SB-C8, 2.1 × 30 mm, 3.5 µm (p/n 827700-936)Column temperature 60 °CInjection volume 5 µL for profi ling experiment on the Agilent 6230 TOF
10 µL for identifi cation experiment on the Agilent 6550 Q-TOF Autosampler temperature 4 °CMobile phase for positive ion mode
A) 50 % water/50 % isopropanol containing 0.1 % formic acidB) 3 % water/97 % acetonitrile containing 0.1 % formic acid
Mobile phase for negative ion mode
A) 50 % water/50 % isopropanol/0.025 % formic acid and 5 µM EDTAB) 10 % water/90 % acetonitrile/5 mM ammonium formate/5 µM EDTA, pH=7
Flow rate 0.6 mL/minGradient for positive ion mode
0–1 minutes 97 %B1–15 minutes 97 %B to 10 %B
Gradient for negative ion mode
0–1 minutes 99 %B1–15 minutes 99 %B to 20 %B
Stop time 15 minutesPost time 5 minutes
3
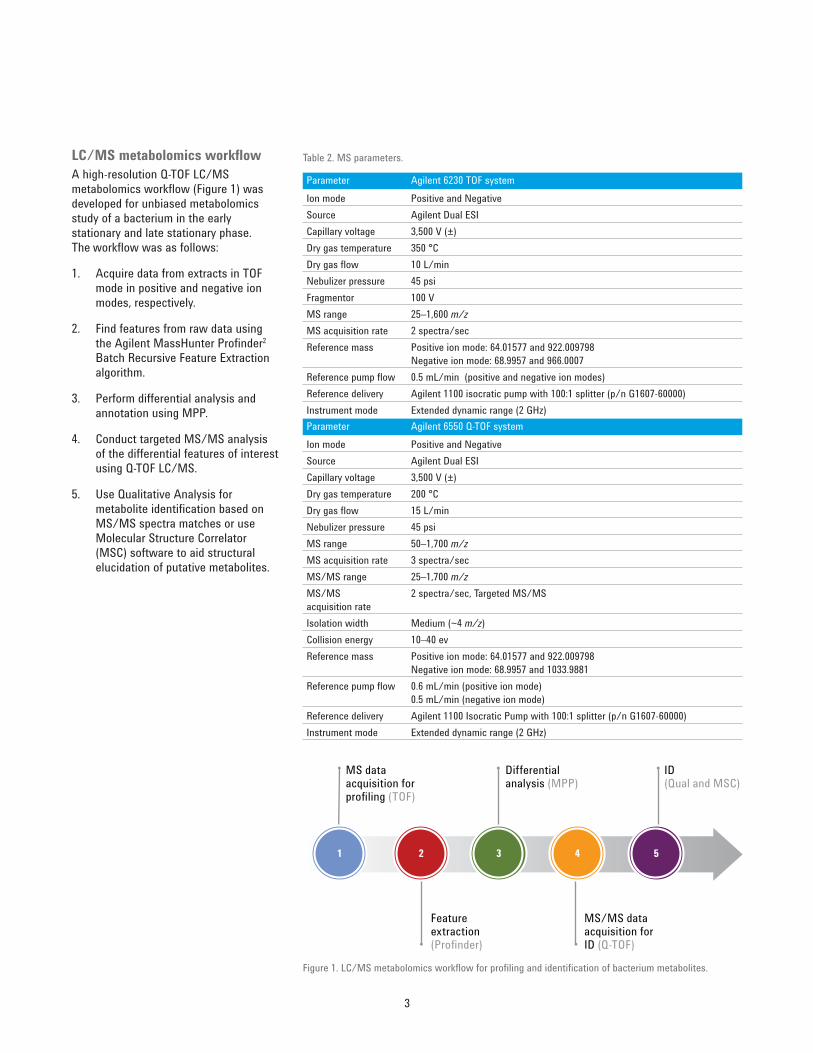
LC/MS metabolomics workfl ow A high-resolution Q-TOF LC/MS metabolomics workfl ow (Figure 1) was developed for unbiased metabolomics study of a bacterium in the early stationary and late stationary phase. The workfl ow was as follows:
1. Acquire data from extracts in TOF mode in positive and negative ion modes, respectively.
2. Find features from raw data using the Agilent MassHunter Profi nder2 Batch Recursive Feature Extraction algorithm.
3. Perform differential analysis and annotation using MPP.
4. Conduct targeted MS/MS analysis of the differential features of interest using Q-TOF LC/MS.
5. Use Qualitative Analysis for metabolite identifi cation based on MS/MS spectra matches or use Molecular Structure Correlator (MSC) software to aid structural elucidation of putative metabolites.
1
MS data acquisition for profiling (TOF)
Featureextraction (Profinder)
MS/MS data acquisition for ID (Q-TOF)
Differential analysis (MPP)
ID (Qual and MSC)
2 2 3 4 5
Figure 1. LC/MS metabolomics workfl ow for profi ling and identifi cation of bacterium metabolites.
Table 2. MS parameters.
Parameter Agilent 6230 TOF systemIon mode Positive and NegativeSource Agilent Dual ESICapillary voltage 3,500 V (±)Dry gas temperature 350 °C Dry gas fl ow 10 L/minNebulizer pressure 45 psiFragmentor 100 VMS range 25–1,600 m/zMS acquisition rate 2 spectra/secReference mass Positive ion mode: 64.01577 and 922.009798
Negative ion mode: 68.9957 and 966.0007Reference pump fl ow 0.5 mL/min (positive and negative ion modes)Reference delivery Agilent 1100 isocratic pump with 100:1 splitter (p/n G1607-60000)Instrument mode Extended dynamic range (2 GHz)Parameter Agilent 6550 Q-TOF systemIon mode Positive and NegativeSource Agilent Dual ESICapillary voltage 3,500 V (±)Dry gas temperature 200 °C Dry gas fl ow 15 L/minNebulizer pressure 45 psiMS range 50–1,700 m/zMS acquisition rate 3 spectra/secMS/MS range 25–1,700 m/zMS/MS acquisition rate
2 spectra/sec, Targeted MS/MS
Isolation width Medium (~4 m/z)Collision energy 10–40 evReference mass Positive ion mode: 64.01577 and 922.009798
Negative ion mode: 68.9957 and 1033.9881Reference pump fl ow 0.6 mL/min (positive ion mode)
0.5 mL/min (negative ion mode)Reference delivery Agilent 1100 Isocratic Pump with 100:1 splitter (p/n G1607-60000)Instrument mode Extended dynamic range (2 GHz)
4
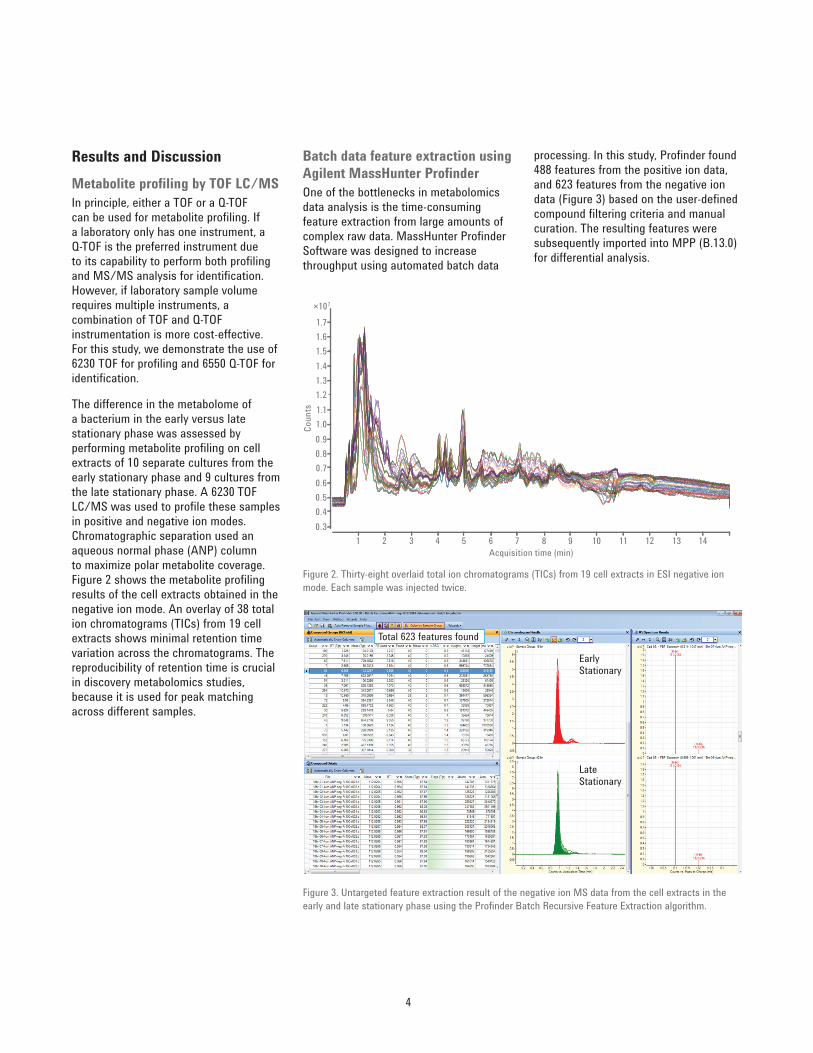
processing. In this study, Profi nder found 488 features from the positive ion data, and 623 features from the negative ion data (Figure 3) based on the user-defi ned compound fi ltering criteria and manual curation. The resulting features were subsequently imported into MPP (B.13.0) for differential analysis.
Batch data feature extraction using Agilent MassHunter Profi nderOne of the bottlenecks in metabolomics data analysis is the time-consuming feature extraction from large amounts of complex raw data. MassHunter Profi nder Software was designed to increase throughput using automated batch data
Results and Discussion Metabolite profi ling by TOF LC/MSIn principle, either a TOF or a Q-TOF can be used for metabolite profi ling. If a laboratory only has one instrument, a Q-TOF is the preferred instrument due to its capability to perform both profi ling and MS/MS analysis for identifi cation. However, if laboratory sample volume requires multiple instruments, a combination of TOF and Q-TOF instrumentation is more cost-effective. For this study, we demonstrate the use of 6230 TOF for profi ling and 6550 Q-TOF for identifi cation.
The difference in the metabolome of a bacterium in the early versus late stationary phase was assessed by performing metabolite profi ling on cell extracts of 10 separate cultures from the early stationary phase and 9 cultures from the late stationary phase. A 6230 TOF LC/MS was used to profi le these samples in positive and negative ion modes. Chromatographic separation used an aqueous normal phase (ANP) column to maximize polar metabolite coverage. Figure 2 shows the metabolite profi ling results of the cell extracts obtained in the negative ion mode. An overlay of 38 total ion chromatograms (TICs) from 19 cell extracts shows minimal retention time variation across the chromatograms. The reproducibility of retention time is crucial in discovery metabolomics studies, because it is used for peak matching across different samples.
×107
0.30.40.50.60.70.80.91.01.11.21.31.41.51.61.7
Acquisition time (min)
Coun
ts
1 2 3 4 5 6 7 8 9 10 11 12 13 14
Figure 2. Thirty-eight overlaid total ion chromatograms (TICs) from 19 cell extracts in ESI negative ion mode. Each sample was injected twice.
Figure 3. Untargeted feature extraction result of the negative ion MS data from the cell extracts in the early and late stationary phase using the Profi nder Batch Recursive Feature Extraction algorithm.
EarlyStationary
Total 623 features found
LateStationary
5
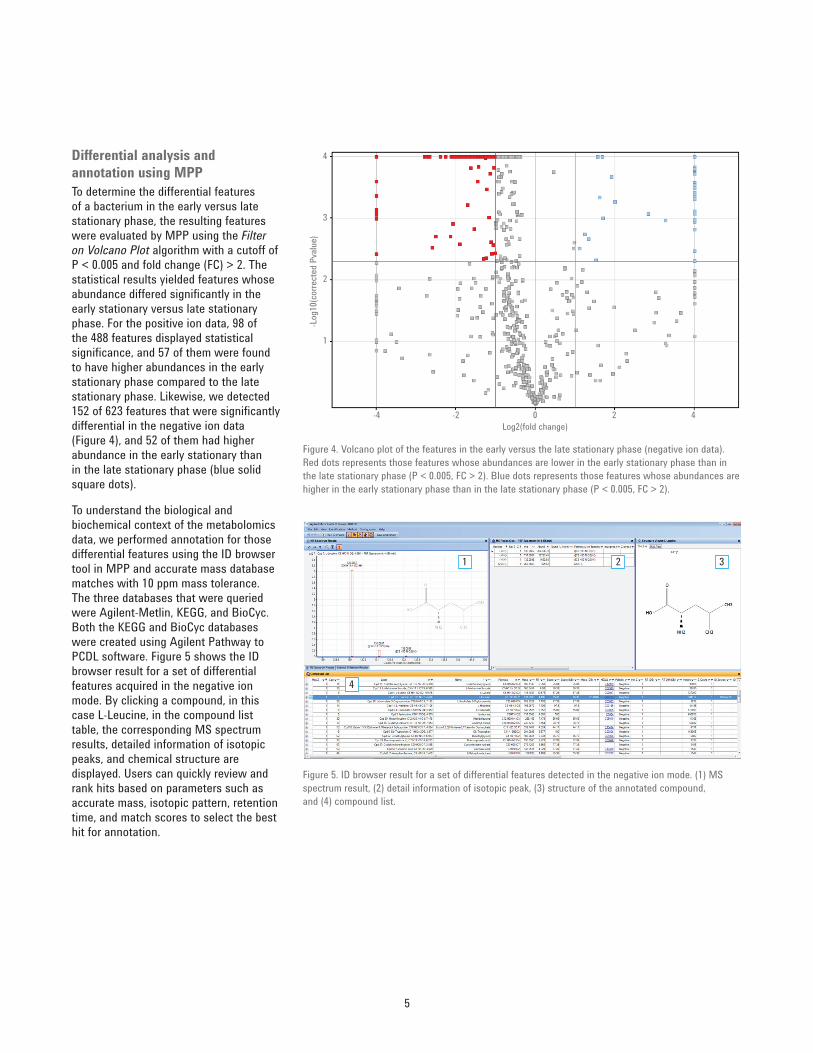
Differential analysis and annotation using MPPTo determine the differential features of a bacterium in the early versus late stationary phase, the resulting features were evaluated by MPP using the Filter on Volcano Plot algorithm with a cutoff of P < 0.005 and fold change (FC) > 2. The statistical results yielded features whose abundance differed signifi cantly in the early stationary versus late stationary phase. For the positive ion data, 98 of the 488 features displayed statistical signifi cance, and 57 of them were found to have higher abundances in the early stationary phase compared to the late stationary phase. Likewise, we detected 152 of 623 features that were signifi cantly differential in the negative ion data (Figure 4), and 52 of them had higher abundance in the early stationary than in the late stationary phase (blue solid square dots).
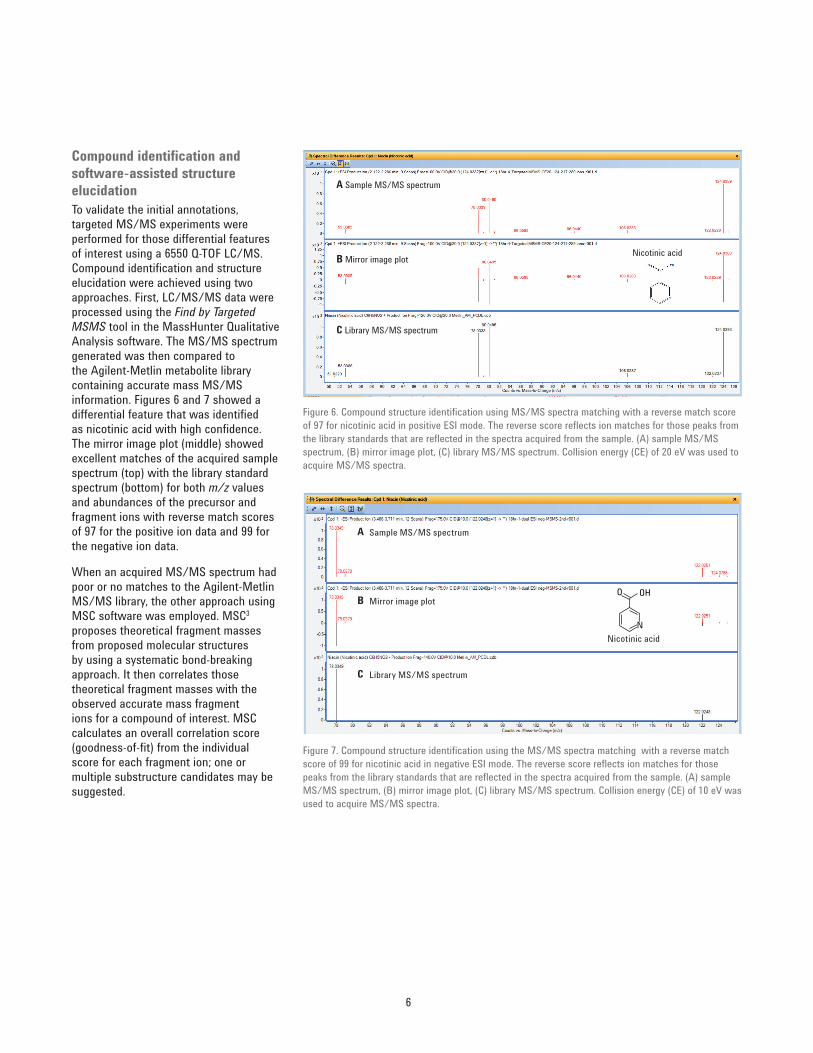
To understand the biological and biochemical context of the metabolomics data, we performed annotation for those differential features using the ID browser tool in MPP and accurate mass database matches with 10 ppm mass tolerance. The three databases that were queried were Agilent-Metlin, KEGG, and BioCyc. Both the KEGG and BioCyc databases were created using Agilent Pathway to PCDL software. Figure 5 shows the ID browser result for a set of differential features acquired in the negative ion mode. By clicking a compound, in this case L-Leucine, in the compound list table, the corresponding MS spectrum results, detailed information of isotopic peaks, and chemical structure are displayed. Users can quickly review and rank hits based on parameters such as accurate mass, isotopic pattern, retention time, and match scores to select the best hit for annotation.
Figure 4. Volcano plot of the features in the early versus the late stationary phase (negative ion data). Red dots represents those features whose abundances are lower in the early stationary phase than in the late stationary phase (P < 0.005, FC > 2). Blue dots represents those features whose abundances are higher in the early stationary phase than in the late stationary phase (P < 0.005, FC > 2).
4
3
2
1
-4 -2 0Log2(fold change)
-Log
10(c
orre
cted
Pva
lue)
2 4
Figure 5. ID browser result for a set of differential features detected in the negative ion mode. (1) MS spectrum result, (2) detail information of isotopic peak, (3) structure of the annotated compound, and (4) compound list.
1
4
2 3
6
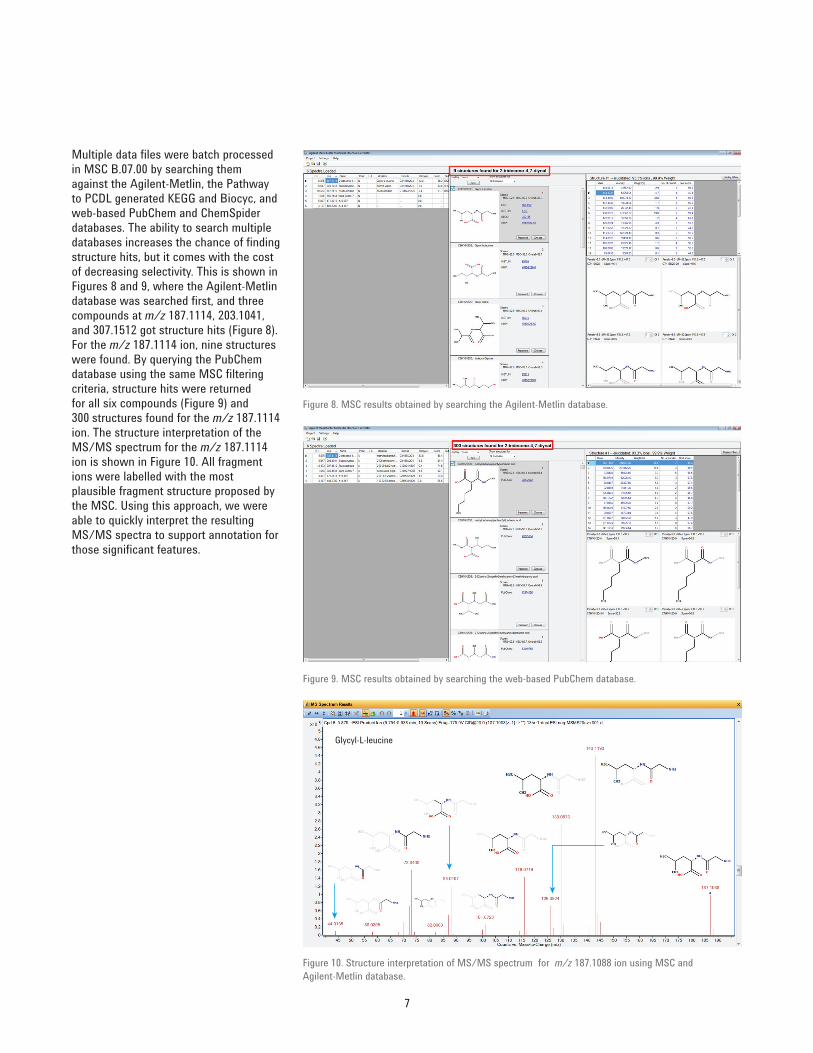
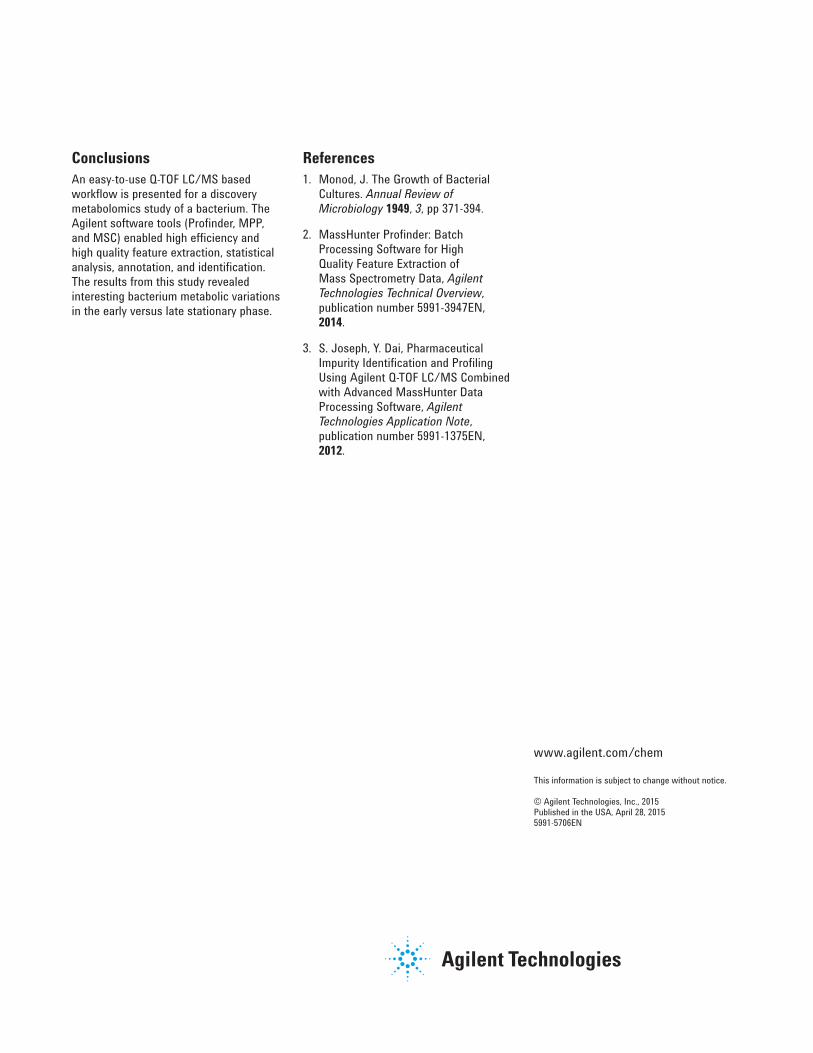
Compound identifi cation and software-assisted structure elucidation To validate the initial annotations, targeted MS/MS experiments were performed for those differential features of interest using a 6550 Q-TOF LC/MS. Compound identifi cation and structure elucidation were achieved using two approaches. First, LC/MS/MS data were processed using the Find by Targeted MSMS tool in the MassHunter Qualitative Analysis software. The MS/MS spectrum generated was then compared to the Agilent-Metlin metabolite library containing accurate mass MS/MS information. Figures 6 and 7 showed a differential feature that was identifi ed as nicotinic acid with high confi dence. The mirror image plot (middle) showed excellent matches of the acquired sample spectrum (top) with the library standard spectrum (bottom) for both m/z values and abundances of the precursor and fragment ions with reverse match scores of 97 for the positive ion data and 99 for the negative ion data.
When an acquired MS/MS spectrum had poor or no matches to the Agilent-Metlin MS/MS library, the other approach using MSC software was employed. MSC3 proposes theoretical fragment masses from proposed molecular structures by using a systematic bond-breaking approach. It then correlates those theoretical fragment masses with the observed accurate mass fragment ions for a compound of interest. MSC calculates an overall correlation score (goodness-of-fi t) from the individual score for each fragment ion; one or multiple substructure candidates may be suggested.
A Sample MS/MS spectrum
B Mirror image plotNicotinic acid
C Library MS/MS spectrum
Figure 6. Compound structure identifi cation using MS/MS spectra matching with a reverse match score of 97 for nicotinic acid in positive ESI mode. The reverse score refl ects ion matches for those peaks from the library standards that are refl ected in the spectra acquired from the sample. (A) sample MS/MS spectrum, (B) mirror image plot, (C) library MS/MS spectrum. Collision energy (CE) of 20 eV was used to acquire MS/MS spectra.
Nicotinic acid
A
B
C
Sample MS/MS spectrum
Mirror image plot
Library MS/MS spectrum
O OH
N
Figure 7. Compound structure identifi cation using the MS/MS spectra matching with a reverse match score of 99 for nicotinic acid in negative ESI mode. The reverse score refl ects ion matches for those peaks from the library standards that are refl ected in the spectra acquired from the sample. (A) sample MS/MS spectrum, (B) mirror image plot, (C) library MS/MS spectrum. Collision energy (CE) of 10 eV was used to acquire MS/MS spectra.
7
Multiple data fi les were batch processed in MSC B.07.00 by searching them against the Agilent-Metlin, the Pathway to PCDL generated KEGG and Biocyc, and web-based PubChem and ChemSpider databases. The ability to search multiple databases increases the chance of fi nding structure hits, but it comes with the cost of decreasing selectivity. This is shown in Figures 8 and 9, where the Agilent-Metlin database was searched fi rst, and three compounds at m/z 187.1114, 203.1041, and 307.1512 got structure hits (Figure 8). For the m/z 187.1114 ion, nine structures were found. By querying the PubChem database using the same MSC fi ltering criteria, structure hits were returned for all six compounds (Figure 9) and 300 structures found for the m/z 187.1114 ion. The structure interpretation of the MS/MS spectrum for the m/z 187.1114 ion is shown in Figure 10. All fragment ions were labelled with the most plausible fragment structure proposed by the MSC. Using this approach, we were able to quickly interpret the resulting MS/MS spectra to support annotation for those signifi cant features.
Figure 8. MSC results obtained by searching the Agilent-Metlin database.
Figure 9. MSC results obtained by searching the web-based PubChem database.
Glycyl-L-leucine
Figure 10. Structure interpretation of MS/MS spectrum for m/z 187.1088 ion using MSC and Agilent-Metlin database.
www.agilent.com/chem
This information is subject to change without notice.
© Agilent Technologies, Inc., 2015Published in the USA, April 28, 20155991-5706EN
ConclusionsAn easy-to-use Q-TOF LC/MS based workfl ow is presented for a discovery metabolomics study of a bacterium. The Agilent software tools (Profi nder, MPP, and MSC) enabled high effi ciency and high quality feature extraction, statistical analysis, annotation, and identifi cation. The results from this study revealed interesting bacterium metabolic variations in the early versus late stationary phase.
References1. Monod, J. The Growth of Bacterial
Cultures. Annual Review of Microbiology 1949, 3, pp 371-394.
2. MassHunter Profi nder: Batch Processing Software for High Quality Feature Extraction of Mass Spectrometry Data, Agilent Technologies Technical Overview, publication number 5991-3947EN, 2014.
3. S. Joseph, Y. Dai, Pharmaceutical Impurity Identifi cation and Profi ling Using Agilent Q-TOF LC/MS Combined with Advanced MassHunter Data Processing Software, Agilent Technologies Application Note, publication number 5991-1375EN, 2012.