meta- and orthogonal integration of influenza … and orthogonal integration of influenza ... lars...
TRANSCRIPT

Resource
Meta- and Orthogonal Integration of Influenza
‘‘OMICs’’ Data Defines a Role for UBR4 in VirusBuddingGraphical Abstract
Highlights
d Meta-analysis of influenza OMICs datasets reveals high-
confidence virus-host interactions
d Integration of orthogonal data exposes unique host and
restriction factor activities
d Experimental validation of virus-host circuits supports
robustness of approach
d The host E3 ligase UBR4 is identified as essential for virus
budding and pathogenesis
Tripathi et al., 2015, Cell Host & Microbe 18, 723–735December 9, 2015 ª2015 Elsevier Inc.http://dx.doi.org/10.1016/j.chom.2015.11.002
Authors
Shashank Tripathi, Marie O. Pohl,
Yingyao Zhou, ..., Silke Stertz,
Adolfo Garcıa-Sastre, Sumit K. Chanda
[email protected] (R.K.),[email protected] (S.S.),[email protected](A.G.-S.),[email protected] (S.K.C.)
In Brief
Tripathi et al. have reconciled and
integrated divergent influenza ‘‘OMICs’’
studies to reveal a functionally validated
virus-host interaction network of high-
confidence human proteins essential for
influenza A virus replication. The authors
leverage this approach to identify UBR4
as a host protein essential for virus
budding and pathogenesis.

Cell Host & Microbe
Resource
Meta- and Orthogonal Integrationof Influenza ‘‘OMICs’’ Data Defines a Rolefor UBR4 in Virus BuddingShashank Tripathi,1,2,18 Marie O. Pohl,3,18 Yingyao Zhou,4 Ariel Rodriguez-Frandsen,5 Guojun Wang,1 David A. Stein,6
Hong M. Moulton,6 Paul DeJesus,5 Jianwei Che,4 Lubbertus C.F. Mulder,1 Emilio Yanguez,3 Dario Andenmatten,3
Lars Pache,5 Balaji Manicassamy,1 Randy A. Albrecht,1 Maria G. Gonzalez,1 Quy Nguyen,5 Abraham Brass,7
Stephen Elledge,8,9 Michael White,10 Sagi Shapira,11 Nir Hacohen,12 Alexander Karlas,13 Thomas F. Meyer,13
Michael Shales,14 Andre Gatorano,5 Jeffrey R. Johnson,14 Gwen Jang,14 Tasha Johnson,14 Erik Verschueren,14
Doug Sanders,14 Nevan Krogan,14 Megan Shaw,1 Renate Konig,5,15,16,19,* Silke Stertz,3,19,* Adolfo Garcıa-Sastre,1,2,17,19,*and Sumit K. Chanda5,19,*1Department of Microbiology, Icahn School of Medicine at Mount Sinai, New York, NY 10029, USA2Global Health and Emerging Pathogens Institute, Icahn School of Medicine at Mount Sinai, New York, NY 10029, USA3Institute of Medical Virology, University of Zurich, Winterthurerstrasse 190, 8057 Zurich, Switzerland4Genomics Institute of the Novartis Research Foundation, 10675 John Jay Hopkins Drive, San Diego, CA 92121, USA5Immunity and Pathogenesis Program, Infectious and Inflammatory Disease Center, Sanford Burnham Prebys Medical Discovery Institute,10901 North Torrey Pines Road, La Jolla, CA 92037, USA6Department of Biomedical Sciences, College of Veterinary Medicine, Oregon State University, Corvallis, OR 97331, USA7Microbiology and Physiological Systems (MaPS) Department, University of Massachusetts Medical School, Worcester, MA 01605, USA8Department of Genetics, Brigham and Women’s Hospital, Harvard Medical School, Boston, MA 02127, USA9Howard Hughes Medical Institute, Chevy Chase, MD 20815, USA10University of Texas Southwestern Medical Center, 5323 Harry Hines Boulevard, Dallas, TX 75390, USA11Columbia University, Department of Systems Biology and Department of Microbiology and Immunology, 1130 St. Nicholas Avenue,New York, NY 10032, USA12Massachusetts General Hospital, 49 13th Street, Charlestown, MA 02129, USA13Max Planck Institute for Infection Biology, Chariteplatz 1, Campus Charite Mitte, 10117 Berlin, Germany14University of California, San Francisco, 1700 4th Street, Byers Hall 309, San Francisco, CA 94158, USA15Host-Pathogen Interactions, Paul-Ehrlich-Institut, Paul-Ehrlich-Straße 51-59, 63225 Langen, Germany16German Center for Infection Research (DZIF), 63225 Langen, Germany17Department of Medicine, Division of Infectious Diseases, Icahn School of Medicine at Mount Sinai, New York, NY 10029, USA18Co-first author19Co-senior author
*Correspondence: [email protected] (R.K.), [email protected] (S.S.), [email protected] (A.G.-S.),
[email protected] (S.K.C.)http://dx.doi.org/10.1016/j.chom.2015.11.002
SUMMARY
Several systems-level datasets designed to dissecthost-pathogen interactions during influenza A infec-tion have been reported. However, apparent discor-dance among these data has hampered their full util-ity toward advancing mechanistic and therapeuticknowledge. To collectively reconcile these datasets,weperformedameta-analysis of data fromeight pub-lished RNAi screens and integrated these data withthree protein interaction datasets, including onegenerated within the context of this study. Furtherintegration of these data with global virus-host inter-action analyses revealed a functionally validatedbiochemical landscape of the influenza-host inter-face, which can be queried through a simplified andcustomizable web portal (http://www.metascape.org/IAV). Follow-up studies revealed that the putativeubiquitin ligase UBR4 associates with the viral M2protein and promotes apical transport of viral pro-teins. Taken together, the integrative analysis of influ-
Cell Host &
enzaOMICs datasets illuminates a viral-host networkof high-confidence human proteins that are essentialfor influenza A virus replication.
INTRODUCTION
Influenza A virus (IAV) continues to cause significant morbidity,
mortality, and economical losses in epidemics and pan-
demics. The emergence of M2 and NA inhibitor-resistant viral
mutants is cause for significant concern regarding the future
efficacy of these antivirals for front-line therapy (Nicoll et al.,
2008). In addition, limitations in vaccine efficacy in the older pop-
ulation, as well as the inadequate production of vaccines in
response to global pandemics, further underscore the
urgent need for novel antiviral therapies. Targeting host
proteins for antiviral efficacy represent an attractive option
for the development of antivirals. Host proteins constitute
an expanded repertoire of therapeutically tractable antiviral
targets and are immutable, which reduces the likelihood of
developing drug resistance. However, understanding of the
complex molecular interactions between the virus and the host
Microbe 18, 723–735, December 9, 2015 ª2015 Elsevier Inc. 723

is crucial to get critical insights toward their impact on viral
pathogenesis.
Systems-level technologies, such as genome-scale RNAi
screening and global affinity purification-mass spectrometry
(APMS) approaches, have afforded unprecedentedmolecular in-
sights into host-pathogen interactions (Konig and Stertz, 2015).
Overlap of specific host proteins identified by various studies
has been low (Konig and Stertz, 2015), and this lack of congruity
has significantly hampered the leveraging of these important da-
tasets to gain further mechanistic understanding of the role of
specific host proteins in the viral replicative cycle and the devel-
opment of host-directed therapeutic strategies. Reasons for the
observed lack of direct correspondence in these global datasets
likely include false positives and false negatives that are endemic
to all systems-level approaches, including off-target activities
and lack of silencing efficiency (RNAi) or non-specific binding
and limit of detection issues (APMS).
Since it is difficult to assess the predictive value of each
individual experimental system employed in these studies, we
reasoned that host proteins that possess experimental support
in multiple and/or orthogonal studies are more likely to act as
bona fide regulators of in vivo replication. Therefore, we per-
formedameta-analysisofRNAidata fromeightpublishedstudies.
Tomitigate thepotential impactof individual analysesapproaches
biasing the interpretation of the data, we obtained the raw (previ-
ously unpublished)RNAi screeningdata from four of thepublished
screens.Next,we integrated thesedatawith threeprotein interac-
tiondatasets, twoofwhichhavebeenpreviously reportedandone
generated within the context of this study. The assimilation of
these global genetic and proteomic studies resulted in the con-
struction of a high-confidence network map that reflects the
biochemical landscape of essential influenza-host interactions.
Among the host factors identified using this approach, we
focused on the N-recognin E3 ligase family member protein
UBR4 as a host factor required by IAV and interacting partner
of M2. UBR4 belongs to the family of UBR-box containing N-rec-
ognin, which targets proteins for ubiquitination and proteasomal
degradation, and has been shown to impact cell survival, mem-
brane morphogenesis, and autophagy (Parsons et al., 2015).
Among viral proteins, it interacts with human papillomavirus
(HPV) E7 protein for cellular transformation and dengue virus
(DENV) NS5 protein for STAT2 degradation (Morrison et al.,
2013; White et al., 2012). Here we report that UBR4 is co-opted
by IAV for efficient targeting of M2 to the cell membrane, a pro-
cess that is essential for virus budding.
RESULTS AND DISCUSSION
Meta-analysis of RNAi ScreensTo comprehensively survey the repertoire of host cellular factors
affecting the replication of IAV, we analyzed the hit lists of eight in-
dependent RNAi datasets published previously (Brass et al.,
2009; Karlas et al., 2010; Konig et al., 2010; Shapira et al., 2009;
Su et al., 2013; Tran et al., 2013; Ward et al., 2012; Watanabe
et al., 2014). A total of 1,257 genes was reported as confirmed
host dependency factors and 192 genes as confirmed antiviral
factors in at least one of the above-mentioned reports (Figures
1A or 1D, respectively, orange and red innermost circle seg-
ments). A pair-wise comparison to identify genes in common be-
724 Cell Host & Microbe 18, 723–735, December 9, 2015 ª2015 Else
tween screening sets resulted in only a modest overlap: 101
pro-viral and 2 anti-viral genes confirmed by multiple studies
(red circle segments and purple inter-gene links in Figures 1A
and 1D, respectively). To mitigate the influence of false-negative
hit calls due to variances in data analysis methodologies and hit
selection, we considered an expanded version of the respective
hit lists based on the raw data of previously unpublished activity
scoresof fourgenome-wideRNAi screens (Brasset al., 2009;Kar-
las et al., 2010; Konig et al., 2010;Ward et al., 2012).We applied a
statistical analysis to each screen set, termed the RSA algorithm,
that utilizes an iterative accumulative hypergeometric distribution
formula (Konig et al., 2007), to obtain a Z score for each gene in
each individual screen (Figure 1, blue circles). The same principle
was applied to obtain a consolidated Z score in order to prioritize
genes based on the collective activities across all four genome-
wide screening datasets (referred to as Z-RSA), both for pro-viral
and anti-viral genes (Tables S1 and S2). The combined Z-RSA
analysis outperforms the results of individual screens as exempli-
fied by the recovery of 101 host factors confirmed in two or more
screens (considered ‘‘gold standards’’) in a receiver operating
characteristic analysis (Figure S1A; Table S1, second tab). The
addition of Z-RSA supported genes to the confirmed hit lists
increased the observed overlap between reported screens (Fig-
ures1Band1D, respectively,black inter-gene links). Forexample,
the activities of 52 host factors and 64 restriction factors, which
were not confirmed in any report, are highly supported by at least
twoscreens as significant Z-RSAhits (Figures 1Band1D, respec-
tively, green connectors; consolidated Z-RSA % �2 and individ-
ual screen Z scores in at least 2 screens Z % �2). Importantly,
delineationof cellular factors thatparticipate insimilar cellular pro-
cesses/pathways or represent members of a common biochem-
ical complex further resolves the discrepancies in overlap
between the datasets (Figure 1C, inter-gene connectors; Figures
S1B–S1E). In fact, 613 host genes among the 1,257 confirmed
pro-viral genes are encompassed in at least one of above-
mentioned categories (Figure S1F), resulting in a significantly
extended and cross-substantiated set of host cellular factors.
Validation of Host ProteinsThirty-four randomly selected putative IAV-relevant host factors
with significant consolidated Z scores (Z-RSA) were experimen-
tally validated in a lung epithelial cell line. Thirty of 34 predicted
factors proved to reduce growth of A/WSN/33 by >75% upon
knockdown by a minimum of two host factor-specific siRNAs
(Figure 2A; Table S3, first tab), including 21 genes that were
not previously called confirmed by any RNAi screen. Importantly,
we were able to validate the activities of 14 host factors mutually
called in at least two screens as RSA hits. Furthermore, we were
able to corroborate 20 factors in primary lung fibroblast cells
(WI38) (Figure 2B; Table S3, second tab), indicating that host
genes identified by themeta-analysis are highly likely to play crit-
ical roles during the viral life cycle.
Genetic and Chemical Perturbation of HRAS/MAPKImpedes IAV EntryHRAS, a small GTPase of the RAS superfamily, and down-
stream-actingMAPK1 andMPK8 have been identified inmultiple
screens and were validated as host factors important to IAV
replication (Figure 2A). HRASwas previously reported tomediate
vier Inc.

Figure 1. Meta-analysis of Systems-Level Influenza A Datasets
(A–D) Circos visualization (Krzywinski et al., 2009) of pro-viral (A, B, and C) or anti-viral (D) cellular factors supported by reported RNAi data. In addition to depicting
the overlap of cellular genes confirmed by multiple studies (A), the visualization was extended to include host genes that were supported by raw data in primary
screen sets (Z score of%�2; B and C). Host factors that participate in common pathways or biochemical complex/networks are shown in (C): inter-screen inter-
gene connectors display proteins from screens predicted to interact with each other based on protein-protein interaction databases (PPI) and genes sharing the
same statistically enriched gene ontology (GO) functional groups. (D) Gene overlaps for antiviral (restriction) cellular proteins based on both reported confirmed
genes and raw data (Z score%�2). Each wedge of the Circos plots depicts data from one of eight screens (pro-viral, A) or six screens (anti-viral, D), respectively,
denoted by the outermost colored line. The length of each circle segment corresponds to the number of confirmed or significant (Z-score%�2) factors found in
each screen. The innermost circle categorizes the cellular factors into the respective gene status: (1) gene was confirmed in the indicated screen and at least one
additional screen (red); (2) gene reported confirmed in only the indicated screen (orange), (3) gene was not reported confirmed in any screen, but displays a high
activity (Z score % �2) in the raw datasets of the indicated screen (transparent white). The four blue circles display the calculated Z scores of each host factor
(A, B, and C) or restriction factors (D) within four primary raw screen datasets, respectively (from outside to inside: Brass et al., 2009; Karlas et al., 2010; Konig
et al., 2007; Ward et al., 2012). Intensity from white to blue indicates increasing significance of activity (lower Z score). Connecting lines denote the overlap of
genes shared either bymultiple screens (directly in A, B, and D or through networks/pathways in C). The color of the line indicates the category of the inter-screen
gene links: (1) both genes are confirmed (purple), (2) one gene is confirmed and the other displays a high Z score of % �2 (black), (3) both genes display high
Z scores of % �2 in their source screens (green).
See also Figure S1 and Tables S1 and S2.
IAV VLP entry (Zona et al., 2013) and to be activated soon after
infection with IAV (Fujioka et al., 2013). Knockdown of these fac-
tors significantly reduced IAV multi-cycle growth and was found
to impact NP expression in the nuclei of infected cells (Figures
2A, S2A, and S2B). Consistent with this observation, we find
Cell Host &
that silencing of the candidates substantially reduced entry of
IAV virus-like particles (Figure S2C). The requirement of HRAS,
MAPK1, and MAPK8 expression for IAV entry was further sub-
stantiated by testing two inhibitors of this pathway: Lonafarnib
and AS601245, which inhibit the activation of RAS proteins
Microbe 18, 723–735, December 9, 2015 ª2015 Elsevier Inc. 725
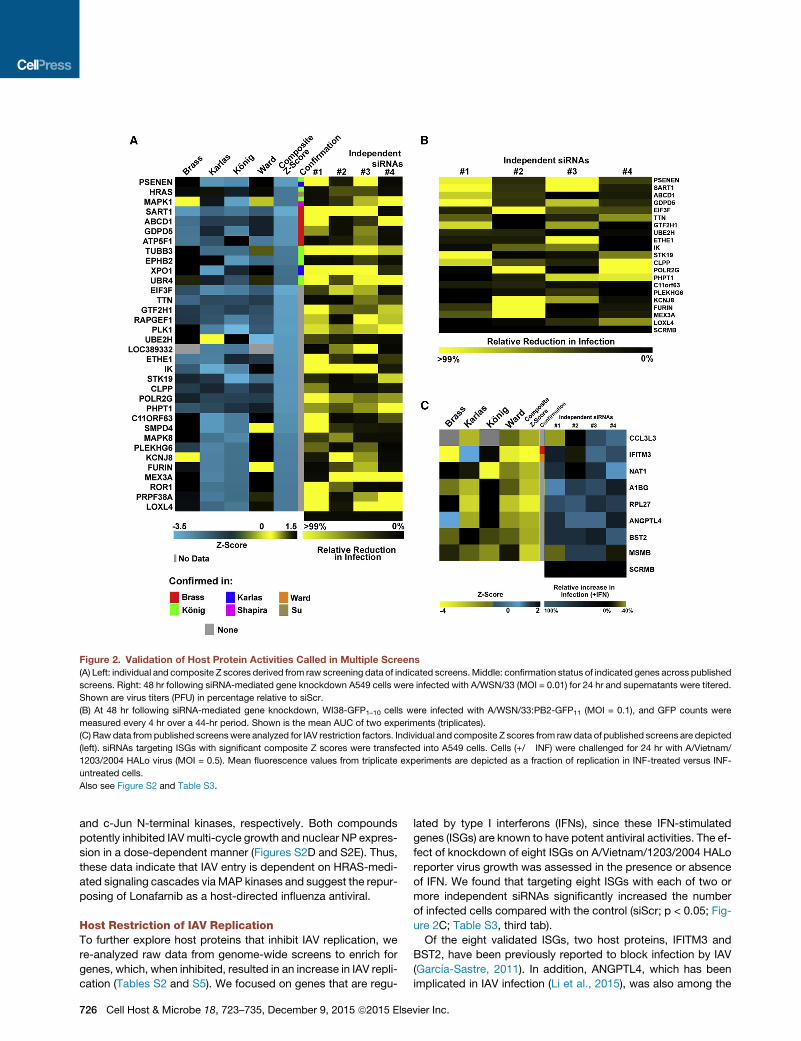
Figure 2. Validation of Host Protein Activities Called in Multiple Screens
(A) Left: individual and composite Z scores derived from raw screening data of indicated screens.Middle: confirmation status of indicated genes across published
screens. Right: 48 hr following siRNA-mediated gene knockdown A549 cells were infected with A/WSN/33 (MOI = 0.01) for 24 hr and supernatants were titered.
Shown are virus titers (PFU) in percentage relative to siScr.
(B) At 48 hr following siRNA-mediated gene knockdown, WI38-GFP1–10 cells were infected with A/WSN/33:PB2-GFP11 (MOI = 0.1), and GFP counts were
measured every 4 hr over a 44-hr period. Shown is the mean AUC of two experiments (triplicates).
(C) Raw data frompublished screenswere analyzed for IAV restriction factors. Individual and composite Z scores from raw data of published screens are depicted
(left). siRNAs targeting ISGs with significant composite Z scores were transfected into A549 cells. Cells (+/� INF) were challenged for 24 hr with A/Vietnam/
1203/2004 HALo virus (MOI = 0.5). Mean fluorescence values from triplicate experiments are depicted as a fraction of replication in INF-treated versus INF-
untreated cells.
Also see Figure S2 and Table S3.
and c-Jun N-terminal kinases, respectively. Both compounds
potently inhibited IAVmulti-cycle growth and nuclear NP expres-
sion in a dose-dependent manner (Figures S2D and S2E). Thus,
these data indicate that IAV entry is dependent on HRAS-medi-
ated signaling cascades via MAP kinases and suggest the repur-
posing of Lonafarnib as a host-directed influenza antiviral.
Host Restriction of IAV ReplicationTo further explore host proteins that inhibit IAV replication, we
re-analyzed raw data from genome-wide screens to enrich for
genes, which, when inhibited, resulted in an increase in IAV repli-
cation (Tables S2 and S5). We focused on genes that are regu-
726 Cell Host & Microbe 18, 723–735, December 9, 2015 ª2015 Else
lated by type I interferons (IFNs), since these IFN-stimulated
genes (ISGs) are known to have potent antiviral activities. The ef-
fect of knockdown of eight ISGs on A/Vietnam/1203/2004 HALo
reporter virus growth was assessed in the presence or absence
of IFN. We found that targeting eight ISGs with each of two or
more independent siRNAs significantly increased the number
of infected cells compared with the control (siScr; p < 0.05; Fig-
ure 2C; Table S3, third tab).
Of the eight validated ISGs, two host proteins, IFITM3 and
BST2, have been previously reported to block infection by IAV
(Garcıa-Sastre, 2011). In addition, ANGPTL4, which has been
implicated in IAV infection (Li et al., 2015), was also among the
vier Inc.
validated antiviral factors. Furthermore, we identified CCL3L3, a
cytokine that binds to several chemokine receptors, including
CCR5, and acts as a chemotactic for lymphocytes and mono-
cytes. Interestingly, CCR5 deficiency is associated with severe
influenza (Keynan et al., 2010). Another identified antiviral pro-
tein, NAT1, is predicted to associate with a densely connected
predicted protein complex containing BST2 and RPL27 (Fig-
ure S3D). Further investigation of the mechanistic bases for
the antiviral activities of these genes is likely to provide critical
insight into host defense strategies and determinants of IAV
pathogenesis.
Mapping Physical Host-Protein InteractionsTo integrate biochemical evidence with functional data provided
by the meta-analysis, we assimilated three different proteomics
datasets. Two previously published datasets encompass
cellular factors interacting with IAV proteins identified by mass
spectrometry or yeast-two-hybrid approaches (Shapira et al.,
2009; Watanabe et al., 2014). In addition, we performed our
own systematic affinity-tag purification approach of each IAV
protein followed by mass-spectrometry on proximal interacting
host proteins. The subsequent mass-spectrometry analysis
refined by CompPASS and MIST algorithm (Verschueren et al.,
2015; Wenger et al., 2011) resulted in 849 co-precipitated host
proteins forming 925 interaction pairs (Tables S4 and S5).
APMS results were validated by co-immunoprecipitation anal-
ysis of a subset of interactions (Figure S4A). We combined the
three independent host-viral protein interaction datasets and
then incorporated databases of human protein-protein interac-
tions. By overlaying high-confidence functionally validated host
components derived from the meta-analysis of genetic screens
(Z-RSA scores %�2 and/or confirmed by at least one of the
RNAi screens [pro-viral or anti-viral]), we were able to visualize
the topography of the resulting functionally validated influenza-
host biochemical landscape. A simplified version of this highly
interconnected network is displayed in Figure 3 (see also Table
S6). MCODE analysis revealed several subnetworks with high
local network connectivity (Figure S3; Table S6). Importantly,
cellular processes known to directly support IAV replication,
such as vATPase activity and PI3K signaling, were identified
as highly overrepresented in this analysis (Ehrhardt and Ludwig,
2009; Konig et al., 2010; Stertz and Shaw, 2011). Additional
cellular processes are significantly enriched within these
MCODE clusters (Table S7), including COPI vesicle transport
(Figure S3A), splicing (Figure S3B) (Dubois et al., 2014; Sun
et al., 2013), or the HRAS-MAPK-mediated signaling cascade
(Figure S3C), further corroborating the importance of the latter
pathway in IAV replication. Interestingly, the COP9 signalosome
complex, which regulates cullin-RING-E3 ubiquitin ligase activity
by deneddylation, was also identified as a critical component of
the viral-host interface (Kato and Yoneda-Kato, 2009) (Figure 3).
Indeed, knockdown of individual subunits of the COP9 complex
by RNAi hampered IAV growth in A549 cells (Figure S4B). Unan-
ticipated functional activities associated with IAV-encoded pro-
teins include a possible function of M2 andNA in COPI-mediated
vesicle transport, and a putative role of M1 and M2 in deneddy-
lation processes (Table S8). Further studies are required to
understand the role of these viral-host interactions in IAV replica-
tion and pathogenesis.
Cell Host &
UBR4 Interacts with theM2 Ion Channel and Is Requiredfor IAV ReplicationM2 is an ion channel protein that plays crucial roles during IAV
entry and exit (Edinger et al., 2014; Rossman and Lamb, 2011).
UBR4 was identified as a M2 interactor in our APMS analysis,
as well as by Kawaoka and colleagues (Watanabe et al., 2014).
Additionally, it was also found to be required for IAV replication
in multiple siRNA screens, including this study (Figure 2A).
Therefore, we investigated the contribution of UBR4 in IAV repli-
cation. The interaction of UBR4 andM2was confirmed in IAV-in-
fected A549 cells by immunoprecipitation (Figure 4A). To map
the domain required for interaction with UBR4, wemade a series
of N-terminal GST-tagged deletions in M2 and performed immu-
noprecipitations; only the ectodomain was dispensable for
UBR4 binding (Figure 4B), indicating that the transmembrane
domain and C-terminal tail contribute to UBR4 binding. Interest-
ingly, these regions of M2 have been implicated in IAV assembly
and budding (Rossman et al., 2010), suggesting a role for M2-
UBR4 interaction in late events of IAV replication. We then stud-
ied cellular localization of M2 and UBR4 during IAV infection. We
observed that during early stages of IAV infection M2 and UBR4
co-localized in the perinuclear ER region and that their localiza-
tion coordinately progressed to the cell membrane during late
stages of infection (Figure 4C). This suggests that M2-UBR4
interaction initiates in the endoplasmic reticulum (ER) and that
UBR4 may play a role in translocation of M2 to the cell surface.
Interestingly, UBR4 displayed primarily nuclear localization in
uninfected cells, but upon IAV infection, it translocated out of
the nucleus to the ER region. The trigger that governs UBR4
translocation out of the nucleus is not clear; however, transfec-
tion of M2 alone does not induce UBR4 movement (data not
shown), suggesting it to be an IAV infection-associated event.
Next, we tested the impact of UBR4 depletion on IAV growth.
Knockdown of UBR4 in A549 andWI38 cells reduced the amount
of released infectious virus in the supernatant by 10- to 100-fold
(Figures 4DandS4C)while cell viabilitywas unaltered. Also, A549
cells stably expressing anUBR4-targeting shRNAwere shown to
display reduced UBR4 protein expression and IAV replication
(Figures S5A and S5B). UBR4 is also known to be essential for
dengue virus (DENV) replication (Morrison et al., 2013). To test
the specificity of UBR4 requirement across different viruses, we
compared the effect of UBR4 knockdown on replication of IAV,
DENV, and HSV-1 luciferase reporter viruses: IAV and DENV
were susceptible to UBR4 knockdown, while HSV-1 replication
was unaffected (Figure 4E). This suggests that the inhibitory ef-
fect of UBR4 knockdown is virus specific and not a general
defect. We next tested whether M2 ion channel activity is linked
to the requirement of UBR4 for IAV replication. Treatment with
amantadine, an M2 ion channel inhibitor, did not affect the
susceptibility ofA/Udorn/72 toUBR4depletion (FigureS4D), indi-
cating that the ion channel activity of M2 is not directly related to
IAV dependence on UBR4 for efficient replication.
UBR4 Facilitates M2 Translocation to the CellMembrane during Late Stages of IAV InfectionWe then assessed the step of the viral life cycle in which UBR4 is
required by IAV: UBR4 knockdown did not affect NP levels in the
nuclei of infected cells after 3 hr of infection (Figure S4E). Even
after 18 hr of infection, NP expression was similar in siUBR4
Microbe 18, 723–735, December 9, 2015 ª2015 Elsevier Inc. 727

Figure 3. The Functionally Validated Landscape of IAV-Host Protein Interactions
An interaction network (Cytoscape) between host and influenza proteins was generated. Three IAV interactomes were integrated: (1) Yeast-two-hybrid data from
Shapira et al. (2009), (2) APMS data confirmed by RNAi from Watanabe et al. (2014), (3) APMS data generated in this study with a MIST score cutoff ofR0.7 or a
top 5%ComPASS score (see Experimental Procedures). Viral proteins are depicted as yellow nodes. Displayed host nodes constitute proteins that were reported
confirmed as host dependency or restriction factors in one (light red, light blue) or two or more RNAi screens (dark red, dark blue) and interact with no more than
three IAV proteins. Blue nodes reflect host proteins additionally identified through the analysis of raw datasets (Z-RSA % �2). Protein-protein interactions that
were reported by a single proteomics dataset or by both Watanabe et al. (2014) and this publication are highlighted as blue or red edges, respectively. Selected
complexes and overrepresented biological processes are displayed as colored clouds, and the enriched functions are denoted. Human-human based in-
teractions are only depicted inside the colored clouds. The resulting network contained 398 virus-host edges, connecting 264 confirmed host cellular factors and
11 IAV proteins.
See also Figures S3 and S4 and Tables S4, S5, S6, S7, and S8.
and siScr transfected cells, while virus titers in the cell superna-
tant from the same experiment were significantly reduced upon
UBR4 knockdown (Figure S4F). These data suggest that UBR4 is
not required during IAV entry, genome transcription, and early
728 Cell Host & Microbe 18, 723–735, December 9, 2015 ª2015 Else
replication. However, virus release in UBR4 stable knockdown
cells was reduced significantly after one cycle of replication
(Figure 5A), confirming our postulate of its role in late events of
IAV infection.
vier Inc.
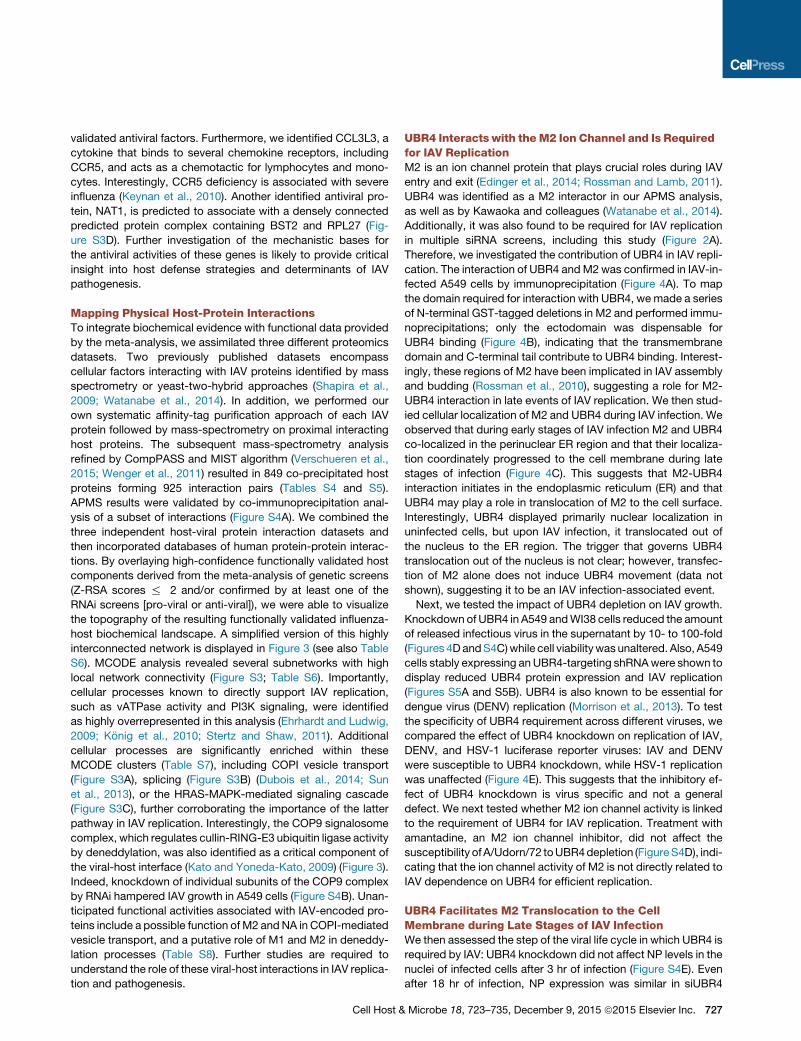
Figure 4. UBR4 Interacts with the M2 Ion Channel and Is Required for IAV Replication
(A) A549 cells were infected with A/WSN/33 (MOI = 2) for 24 hr and lysed in IP buffer. Lysates were subjected to immunoprecipitation using antibodies against M2
and UBR4. Immunoprecipitated protein samples and 5% input were subjected to SDS-PAGE/western blotting using indicated antibodies.
(B) N-terminal GST-tagged deletion constructs of A/WSN/33 M2 (top) were transfected in HEK293T cells. At 48 hr later, cells were lysed and subjected to
immunoprecipitation with anti-GST antibody. Immunoprecipitated samples and 10% input were subjected to SDS-PAGE/western blotting (bottom).
(C) A549 cells were infected with A/WSN/33 (MOI = 2), and cells were fixed at indicated time points for immunostaining. Nuclei are depicted in blue, M2 in green,
and UBR4 in red. Arrows allocate M2-UBR4 co-localization. Images of three representative independent experiments are shown. Scale bar represents 10 mm.
(D) A549 cells were transfected with siNP, siUBR4, or siScr; 48 hr later, cell viability and UBR4 expression levels were determined. Alternatively, cells were
infected with A/WSN/33 (MOI = 0.01) for 24 hr, and supernatants were titered. Shown is one of two independent duplicate experiments ± SD.
(E) UBR4 stable knockdown or control A549 cells were infected with IAV luciferase (MOI = 0.2), Dengue Luciferase, or Herpes 1 luciferase reporter virus
(MOI = 0.1); 48 hr later cells were lysed, and luciferase activity was measured. The mean luminescence values ± SD of three independent experiments relative to
control were plotted. * and # indicate p values compared with control and Scr shRNA, respectively.
See also Figures S4 and S5.
Next, we tested the impact of UBR4 knockdown on M2 apical
membrane targeting. In UBR4-depleted cells, M2 localization on
cell surface was greatly reduced (Figure 5B). Consistently, quan-
tification of M2 surface expression in non-permeabilized cells re-
vealed a significant reduction of M2 cell membrane expression
upon UBR4 knockdown (Figure 5C). To further confirm this
phenotype, we generated HEK293T cells with CRISPR-Cas9-
mediated UBR4 knockout (KO). These cells were characterized
for absence of UBR4 expression and reduced IAV replication
(Figure S5B). We also observed that in UBR4 KO cells, M2 cells
surface expression was greatly reduced (Figure 5D). Interest-
ingly, total M2 expression was also reduced in UBR4 KO cells
(Figures 5D and 5E). Additionally, virus release was reduced by
10-fold after a single replication round in these cells (Figure 5E).
To test whether UBR4KO affects other viral and cellular proteins,
we measured cell surface expression of the viral glycoproteins
Cell Host &
hemagglutinin (HA) and neuraminidase (NA) and the cellular pro-
teins transferrin receptor (TFR) and LC3 in UBR4-depleted cells.
Surface expression of HA and NA, but not TFR, was reduced in
UBR4 KO cells (Figure S5C), suggesting that UBR4 requirement
is specific for viral proteins. M2 is known to interact with LC3
and to induce its re-localization to the cell membrane (Beale
et al., 2014). UBR4 knockdown did not affect virus-induced
LC3 re-localization or overall LC3 expression (Figure S5D).
Taken together, these data demonstrate that UBR4 is required
for apical targeting of viral, but not cellular, proteins.
IAV M2 Is Targeted to Autophagosomes for Degradationin Absence of UBR4Both M2 and UBR4 are known regulators of autophagy: M2
is known to interact with LC3 and inhibit autophagosome fusion
with lysosomes (Beale et al., 2014; Gannage et al., 2009),
Microbe 18, 723–735, December 9, 2015 ª2015 Elsevier Inc. 729

Figure 5. UBR4 Facilitates M2 Translocation to the Cell Membrane
(A) UBR4 stable knockdown or control A549 cells were infected with A/WSN/33 (MOI = 2). Supernatants were titered at 12- and 18-hr post-infection.
(B) UBR4 stable knockdown or control A549 cells were infected with A/WSN/33 (MOI = 2) for 24 hr and subjected to immunostaining. Nuclei are depicted in blue
and M2 in green. Arrows allocate M2 localization. Scale bar represents 10 mm. Shown are representative images of three independent experiments.
(legend continued on next page)
730 Cell Host & Microbe 18, 723–735, December 9, 2015 ª2015 Elsevier Inc.

whereas UBR4 is required for efficient execution of autophagy
(Tasaki et al., 2013). Although overall autophagy was not
changed in the absence of UBR4, co-localization of M2 with
the autophagosomal marker DIRAS3 was enhanced in KO cells
compared with WT cells (Figure 5F). As overall M2 levels are
decreased in UBR4 KO cells (Figures 5D and 5E), we hypothe-
sized that in absence of UBR4 IAV M2 is diverted from ER
to autophagosomes for degradation. The cellular endoplasmic
reticulum-associated degradation (ERAD) machinery is known
to target membrane proteins from ER for degradation and is
frequently exploited by different viruses (Morito and Nagata,
2015). Interestingly, DBeQ, an inhibitor of the ERAD regulatory
protein p97 (Dugre et al., 1990), significantly rescued bothM2 to-
tal and cell surface expression (Figure S5E). In addition, siRNA-
mediated p97 knockdown partially rescued M2 surface expres-
sion, although not as effectively as DBeQ, which may be due to
incomplete inhibition of p97 and siRNA toxicity (Figure S5F). In
contrast, the autophagy inhibitor Bafilomycin A (Baf A) could
partially rescueM2 expression, but had no impact onM2 surface
levels (Figure S5E). Because of cytotoxic effects, we could not
assess the impact of DBeQ on viral replication (data not shown).
Thus, these data suggest that, in the absence of UBR4, M2 is
likely diverted to autophagosomes for degradation, potentially
through involvement of the ERADmachinery. As a result, M2 sur-
face expression and overall virus release are reduced.
UBR4 Knockdown Mitigates IAV Replication andPathogenesis In VivoAs UBR4 KO is lethal in mice (Tasaki et al., 2013), we used pep-
tide-conjugated phosphorodiamidate morpholino oligomers
(PPMOs) to understand the impact of UBR4 depletion in mouse
lungs on IAV replication in vivo. We first evaluated the efficacy of
two PPMOs designed against UBR4 (Figure S5G) and chose
PPMO-2 for further studies. Scr or UBR4-targeting PPMO
were administered intranasally to mice for 2 days (Figure 6A).
On the following day, mice were infected with 250 PFU of
A/Puerto Rico/8/34. Lung tissue was harvested on day 0 (before
infection), day 3, and day 6 post-infection, and UBR4 expres-
sion, virus titers, and lung histopathology were assessed. Tran-
sient knockdown of UBR4 expression in mouse lungs was
observed after 2 days of PPMO-2 treatment (Figure S5H).
Following infection, the UBR4 PPMO-treated group of mice
lost less weight (Figure 6B) and showed prolonged survival
compared with the PBS or Scr PPMO-treated group (Figure 6C).
Of note, UBR4 PPMO treatment by itself induced some body
(C) UBR4 stable knockdown, scrambled, and control A549 cells were infected with
non-permeabilized cell surface was measured by flow cytometry. Top shows the p
shows corresponding histograms.
(D) UBR4WT or UBR4 KOHEK293T cells were infected with A/WSN/33 (MOI = 2) f
cells, and total M2 expression in permeabilized cells was measured by flow cyto
relative to control. Lower shows the corresponding M2 geometric mean intensity
(E) UBR4 WT or UBR4 KO HEK293T cells were infected with A/WSN/33 (MOI = 2
UBR4, and b actin levels were determined by western blot.
(F) UBR4 WT or UBR4 KO HEK293T cells were transfected with the autophagos
A/WSN/33 (MOI = 2). After 16 hr, cells were subjected to immunostaining. Nuclei
arrows, and scale bar represents 10 mm. Images of three representative independ
experiments in (A) and (C); * and # indicate p values compared with control and Sc
samples. Immunofluorescence images are representative of three independent e
See also Figure S5.
Cell Host &
weight loss; however, uninfected mice recovered within 3 days
following PPMO treatment (Figure S5I). Lung virus titers declined
sharply upon UBR4 knockdown on day 3 and recovered partially
on day 6 post-infection (Figure 6D). These data confirm the
requirement of UBR4 for successful IAV replication in vivo.
Furthermore, PPMO treatment itself did not induce any marked
damage to the lung epithelium prior to infection (Figure 6E).
UBR4 PPMO-treated mice showed less inflammation in lung tis-
sue compared with control (Figure 6E). Notably, we found theM2
cell surface expression in lung tissue to be reduced upon UBR4
knockdown on day 3 post-infection (Figures S5J and S5K). This
effect was more prominent in CD45-negative epithelial cells,
as compared with CD45-positive immune effector cells (Figures
S5J and S5K) and likely results from greater exposure of CD45-
negative cells to UBR4 targeting PPMOs compared with CD45-
positive cells, which generally infiltrate the lung tissue later
during infection. Overall, these results indicate an essential role
for UBR4 in efficient IAV replication in vivo, and depletion of
UBR4 protects mice from IAV-induced pathogenesis.
Mammalian UBR4 Is Dispensable for Replication ofAvian IAV Strains In VitroWe next investigated the range of IAV strains that are dependent
upon UBR4 for replication. We used A/WSN/33 (H1N1), A/Hong
Kong/68 (H3N2), and A/Udorn/72 (H3N2) as representative hu-
man IAV strains and the avian strains A/duck/Ukraine/1/1963
(H3N8), A/duck/England/1/1956 (H11N6), and A/duck/Alberta/
35/1976 (H1N1). All human IAV strains tested were sensitive to
UBR4 knockdown (Figure S6A). The avian strains, however,
were less dependent on the presence of UBR4. Only A/duck/
Ukraine/1/1963 exhibited reduced growth upon knockdown of
UBR4, but this effect was less pronounced than for the human
isolates tested (Figure S6A). This could suggest that adaptations
that enable the appropriation of mammalian UBR4 may be crit-
ical to zoonotic transmission and/or pathogenesis. To test this
hypothesis, we generated a recombinant influenza virus in the
backbone of A/WSN/33 in which we replaced M2 of WSN with
M2 of A/duck/England/1/1956 and tested replication upon
UBR4 depletion. The recombinant virus was still dependent on
UBR4 expression even though the reduction in replication was
not as pronounced as for the human viruses (Figure S6B). These
results suggest that, while there is a difference between avian
and human viruses in UBR4 dependence, M2 is not the sole
determinant of this variance. We next tested the UBR4 depen-
dency of an avian virus, A/duck/England/1/1956, in vivo using
A/WSN/33 (MOI = 2) for 24 hr. Cells were harvested, andM2 expressed on the
ercentage of cells positive for M2 surface expression relative to control. Lower
or 20 hr. Cells were harvested andM2 surface expression in non-permeabilized
metry. Top shows the percentage of cells positive for M2 surface expression
.
). At 20-hr post-infection, supernatants were titered (top). Corresponding M2,
ome marker plasmid DIRAS3-N-RFP (red); 24 hr later, cells were infected with
are depicted in blue and M2 in green. M2-DIRAS3 co-localization is marked by
ent experiments are shown. Graphs represent mean ± SD of three independent
r shRNA, respectively. In (D) and (E), # indicates p value compared to UBR4WT
xperiments, and scale bar represents 10 mm.
Microbe 18, 723–735, December 9, 2015 ª2015 Elsevier Inc. 731

Figure 6. UBR4 Knockdown Mitigates IAV Replication and Pathogenesis In Vivo
Six-week-old female BALB/cmice (20 per group) were administered PBS or PPMOs (100 mg in 40 ml PBS, the equivalent of approximately 5mg/kg) intranasally for
2 consecutive days. Five mice from each group were used to study PPMO toxicity without IAV infection (Figure S7C). On day 0, 15 mice per group were infected
with A/Puerto Rico/8/34 (250 PFU) intranasally. Five mice per group were euthanized on days 3 and 6 post-infection. Lungs were harvested to determine virus
titer, UBR4 expression, and histopathology. In five mice per group, survival was studied until day 14.
(A) Upper shows experimental setup.
(B) Graph shows mouse body weight ± SEM up to day 7 post-infection, for at least five mice per group.
(C) Graph shows mice survival (five per group).
(D) Graph shows mean lung virus titer ± SD on days 3 and 6 post-infection. * and # represent p value compared with PBS and Scr PPMO group, respectively.
(E) Mouse lungs were isolated on day 0 (before infection), day 3, and day 6 post-infection, and H&E staining was performed on lung sections. Representative
images are shown. Areas showing extensive inflammation are marked by arrows. Scale bars represent 300 mm.
See also Figure S6.
the PPMOmodel described above (Figure 6). Even though UBR4
PPMO-treated mice lost less weight compared with scrambled
PPMO-treated mice (Figure S6C), this effect was statistically
not significant (Figure S6D). Lung virus titers at day 3 post-infec-
tion showed a reduction in virus growth in response to UBR4
knockdown (Figure S6E). However, when comparing the relative
weight loss and the relative reduction in virus growth at day 3
post-infection between the human (Figure 6) and the avian virus
isolate, A/duck/England/1/1956 appeared to be less dependent
on the presence of UBR4 (Figures S6D and S6F).
Summary and ConclusionThe meta-analysis presented in this study provides a compre-
hensive assimilation of IAV RNAi screens, including, when avail-
able, previously unpublished raw data from these assays. In
addition, we have integrated data from three proteomics-based
datasets, including a proteome-wide IAV interactome conduct-
ed within the context of this study. This compilation of influenza
OMICs data creates a valuable resource for the community on
multiple distinct levels. First, it provides an opportunity to recon-
cile seemingly disparate results from individual RNAi screens
through the interrogation of raw data, as well as pathway- and
biochemical complex-level analyses. Second, the unification of
proteomic and genetic datasets provides critical spatial context
to RNAi studies (Figure 3). Finally, the underlying data for these
732 Cell Host & Microbe 18, 723–735, December 9, 2015 ª2015 Else
analyses provide an unprecedented resource for ‘‘wet-bench’’
scientists to access and action data from this comprehensive
compendium of IAV genome-level datasets. Simplified analyses
of these datasets enable the elucidation of host proteins found in
multiple independent and/or orthogonal datasets, and thus are
more likely to play bona fide roles in IAV replication and patho-
genesis since this approach can help circumvent experimental
variables that may account for false negatives within a single da-
taset. Specifically, we provide a consolidated table of host pro-
tein activities that can be differentially analyzed to elucidate likely
critical regulators of IAV replication and pathogenesis based on
selected levels of orthogonal support and to identify potential
therapeutic targets (Tables 1, S4, and S5). We have also made
the underlying data accessible through a user-friendly web por-
tal (http://www.metascape.org/IAV) that enables the user to
customize thresholds and criteria. We anticipate that these will
both improve confidence in IAV systems-level studies and facil-
itate simplified access to IAV ‘‘big data’’ to a critical segment of
the research community.
The utility of this approach is underscored both by the exten-
sion of known IAV-host interaction biology, as well as previously
unknown host mechanisms, highlighted in this report. For
example, this analysis led to the identification of 20 previously
unrecognized host proteins required for IAV replication in pri-
mary cells, as well as 6 previously unreported ISGs that block
vier Inc.

Table 1. Selected Druggable, Transmembrane, and/or Secreted Host Factors with Support from Multiple and/or Orthogonal OMICs Datasets
Gene Gene ID Known Function
RNAi Support Proteomics Support
Brass et al.
(2009)
Watanabe
et al. (2014)
Konig et al.
(2007)
Karlas et al.
(2010)
Shapira
et al. (2009)
Ward et al.
(2012)
Su et al.
(2013)
Tran et al.
(2013)
Watanabe
et al. (2014)
This
Report
ATP6AP1 537 ATPase; organelle acidification U U U U
ATP6V0B 533 U U U
ATP6V0C 527 U U U
ATP6V1B2a 526 U U U
CAD 790 de novo pyrimidine biosynthesis U U U U
FASNa 2194 fatty acid synthase U U
DNMT1a 1786 DNA-methyltransferase U U
HLA-B 3106 major histocompatibility complex U U U
ITGA3 3675 integrin; cell surface adhesion U U U
LGALS3BP 3959 galectin; cell-cell interaction U U U U
FUS 2521 RNA binding/processing U U U
EIF4A3 9775 translation initiation factor U U U U
RPL3a 6122 ribosome; translation U U U
PSMB2a 5690 proteasome U U U
PSMD1a 5707 proteasome U U U U
PSMD2a 5708 proteasome U U U U
SLC16A1 6566 solute carrier; monocarboxylate
transporter
U U U
SLC1A3 6507 solute carrier; glutamate transporter U U
SLC25A5a 292 solute carrier; solute carrier; ADP
transporter
U U
TTN 7273 cytoskeletal protein U U U
TUBA4A 7277 cytoskeletal protein U U
TUBBa 203068 cytoskeletal protein U U U
CDK1 983 cyclin-dependent kinase; cell cycle U U
PHB 5245 regulation of DNA synthesis and
proliferation
U U U
CD81 975 tetraspanin receptor; signaling U U U U
PRKACA 5566 cAMP-dependent protein kinase;
signaling
U U U U
JAK1a 3716 Janus tyrosine kinase; immune
response/signaling
U U
OSMR 9180 type I cytokine receptor; signaling U U U U
HRAS 3265 GTPase; signaling U U
MTORa 2475 S/T Kinase; target of rapamycin U U
Druggable, transmembrane, and secreted gene annotations derived from Hopkins and Groom (2002) and Uhlen et al. (2015).aReported targets of Food and Drug Administration-approved molecules (Law et al., 2014).
CellHost&Microbe18,723–735,December9,2015ª2015ElsevierInc.
733

replication. Importantly, UBR4was defined by thismeta-analysis
as a proviral factor and interacting partner of IAV M2. Our data
suggest that in the absence of UBR4 IAV M2 is not targeted
efficiently to the cell membrane; rather, it is likely directed to
autophagosomes for degradation. We hypothesize that IAV M2
may be co-opting UBR4 to counteract a yet unidentified ER resi-
dent host restriction factor, which interferes with transport of
viral proteins across the ER-Golgi network. Thus the recruitment
of UBR4 by IAV M2 enables safe passage of viral glycoproteins
to the cell membrane and facilitates efficient budding and repli-
cation of IAV.
Taken together, the results from this study offer important mo-
lecular understanding of a key host component that is co-opted
by IAV to coordinate late stage viral replication and, critically,
also provides a consolidated and cross-validated compendium
of influenza OMICs data. The latter is likely to focus strategies to-
ward the development of next-generation host-targeted antiviral
therapies.
EXPERIMENTAL PROCEDURES
Affinity Purification and Mass Spectrometry
Pull-down assays with HEK293 cells individually expressing the 11 FLAG-
tagged viral proteins were performed followed by mass spectrometry. AP-
MS sampleswere scored using ComPASS andMiST (Jager et al., 2012; Smoot
et al., 2011; Sowa et al., 2009; Verschueren et al., 2015), as described in the
Supplemental Experimental Procedures.
Bioinformatic Analysis of Screening Data
Eight independent RNAi datasets and two previously published interactome
datasets and the systematic affinity-tag mass spectroscopy interactions pro-
duced by this study were used to perform the meta-analysis as described in
the Supplemental Experimental Procedures.
Immunofluorescence Microscopy
Cells were fixed in 4% paraformaldehyde in PBS, permeabilized with 0.5%
Tween-20 or Triton X-100 in PBS, and blocked with 2% bovine albumin in
PBS. Primary and secondary antibody incubation was performed in 0.5%
BSA in PBS. For mounting, Slowfade Gold antifade mounting medium with
DAPI (Life Technologies) was used. Antibodies used are listed in the Supple-
mental Experimental Procedures.
Immunoprecipitation
For UBR4-M2 coimmunoprecipitation experiments, cells were lysed in 1%
NP-40 IP Lysis Buffer (Pierce) supplemented with protease inhibitor cocktail
(Pierce). Cell lysates were incubated with primary antibody overnight followed
by incubation with protein A Dynabeads (Life Technologies) for 2 hr. Beads
were washed three times with cold PBS. Immunoprecipitates were eluted
by boiling the beads in SDS-PAGE sample buffer (BioRad). Samples were
resolved on 4%–12% gradient Bis-Tris gels (Life Technologies) and trans-
ferred to polyvinylidene fluoride (PVDF) membrane (Life Technologies) by
standard methods. Membranes were blocked with 3% BSA in TBS-Tween
(20 mM Tris-HCl [pH 7.4], 150 mM NaCl; 1% Tween) and then incubated
with antibodies and subjected to western blot. Antibodies are listed in the
Supplemental Experimental Procedures.
Flow Cytometry
For in vitro fluorescence-activated cell sorting (FACS), cells were harvested by
trypsinization and washed with FACS buffer (3% BSA, PBS). Where indicated,
cells were stained using the LIVE/DEAD Fixable Blue Dead dye (Thermo).
Where indicated, cells were permeabilised by incubating with 1% Tween-20
in PBS for 10min. Cells were blocked with NRS (normal rabbit serum) (Abcam),
followed by incubation with primary antibody (see Supplemental Experimental
Procedures) and Alexa Flour tagged secondary antibody (Life Technologies).
For in vivo FACS, mouse lungs were minced, treated with collagenase, and
734 Cell Host & Microbe 18, 723–735, December 9, 2015 ª2015 Else
forced through a 70 mM filter to produce single-cell suspensions. Erythrocytes
were removed by lysis in NH4Cl red blood cell lysis buffer. For blocking, cells
were incubated with anti-mouse CD16/CD32 antibody (FcBlock, BD) and
NRS. Cells samples were run on the BD LSRII Flow cytometer (BD Biosci-
ences), andFACSdatawere analyzed usingFLOWJOsoftware (FLOWJOLLC).
Animal Experiments
Six- to 8-week-old female BALB/cmice purchased from Jackson Laboratories
were used. Mice were anesthetized by intraperitoneal injection of a mixture of
Ketamine and Xylazine (100 mg and 5 mg per gram of bodyweight). Mouse were
inoculated intranasally with the indicated doses of PPMOs or viruses in 40 ml of
PBS. Mice were monitored daily for weight loss and clinical signs. Lung ho-
mogenates were prepared using a FastPrep24 system (MPBiomedicals). After
addition of 800 ml of PBS containing 0.3% BSA, lungs were subjected to two
rounds of mechanical treatment for 10 s each at 6.5 m/s. Tissue debris was
removed by low-speed centrifugation, and virus titers in supernatants were
determined by plaque assay.
Ethics Statement
All research studies involving the use of animals were reviewed and approved
by the Institutional Animal Care and Use Committees of the Icahn School of
Medicine at Mount Sinai and were carried out in strict accordance with the rec-
ommendations in the Guide for the Care and Use of Laboratory Animals.
SUPPLEMENTAL INFORMATION
Supplemental Information includes Supplemental Experimental Procedures,
six figures, and eight tables and can be found with this article online at
http://dx.doi.org/10.1016/j.chom.2015.11.002.
AUTHOR CONTRIBUTIONS
Co-first authors S.T. and M.O.P. designed and performed experiments,
analyzed the data, and wrote the paper. A.R.-F., D.A.S., H.M.M., P.D., L.M.,
E.Y., D.A., B.M., Q.N., R.A.A., N.K., and M.S. designed and/or performed ex-
periments. Y.Z., R.K., A.R.-F., J.C., L.P., and A.G. analyzed the data. A.B.,
S.E., M.W., S. Shapira, N.H., and T.M. provided unpublished data and pro-
vided conceptual framework for the study. Y.Z., R.K., S.S., A.G.-S., and
S.K.C. designed experiments and wrote the paper.
ACKNOWLEDGMENTS
We thank Andrea Gamarnik and David Leib for providing luciferase reporter vi-
ruses. Microscopy and FACS experiments were performed at the Microscopy
Center of Research Excellence (CORE) and Flow Cytometry Core of the Icahn
School of Medicine at Mount Sinai (ISMMS). We thank Rumana Huq and Lau-
ren O’Rourke for their help in microscopy. We thank Tom Moran for providing
anti-M2 E10 and anti-HA PY102 antibodies and Patricia Nigg and Nina Hein-
Fuchs for help with figure graphics. These studies were partially supported
by NIAID research grant U19 AI106754 to A.G.-S., R.A.A., D.S., H.M., P.D.,
L.P., S.K.C., N.K., and M.S. This work was also supported by a grant from
the Swiss National Science Foundation (31003A_135278) to S. Stertz.
M.O.P. is the beneficiary of a doctoral grant from the AXA Research Fund.
Additionally, this work was supported by the NIH P50 GM085764 (S.K.C.).
A.B. is supported by a grant (1R01AI091786) from the National Institute of Al-
lergy and Infectious Diseases of the NIH, the Burroughs Wellcome Fund, and
the Bill and Melinda Gates Foundation. S.E. is an Investigator with the Howard
Hughes Medical Institute.
Received: May 13, 2015
Revised: October 6, 2015
Accepted: November 10, 2015
Published: December 9, 2015
REFERENCES
Beale, R., Wise, H., Stuart, A., Ravenhill, B.J., Digard, P., and Randow, F.
(2014). A LC3-interacting motif in the influenza A virus M2 protein is required
vier Inc.

to subvert autophagy and maintain virion stability. Cell Host Microbe 15,
239–247.
Brass, A.L., Huang, I.C., Benita, Y., John, S.P., Krishnan, M.N., Feeley, E.M.,
Ryan, B.J., Weyer, J.L., van der Weyden, L., Fikrig, E., et al. (2009). The
IFITM proteins mediate cellular resistance to influenza A H1N1 virus, West
Nile virus, and dengue virus. Cell 139, 1243–1254.
Dubois, J., Terrier, O., and Rosa-Calatrava, M. (2014). Influenza viruses and
mRNA splicing: doing more with less. MBio 5, e00070–e14.
Dugre, V., Levillain, P., and Lemonnier, A. (1990). [Hyperphosphatemia in case
of abnormal proteinemia]. Presse Med. 19, 338.
Edinger, T.O., Pohl, M.O., and Stertz, S. (2014). Entry of influenza A virus: host
factors and antiviral targets. J. Gen. Virol. 95, 263–277.
Ehrhardt, C., and Ludwig, S. (2009). A new player in a deadly game: influenza
viruses and the PI3K/Akt signalling pathway. Cell. Microbiol. 11, 863–871.
Fujioka, Y., Tsuda, M., Nanbo, A., Hattori, T., Sasaki, J., Sasaki, T., Miyazaki,
T., and Ohba, Y. (2013). A Ca(2+)-dependent signalling circuit regulates influ-
enza A virus internalization and infection. Nat. Commun. 4, 2763.
Gannage, M., Dormann, D., Albrecht, R., Dengjel, J., Torossi, T., Ramer, P.C.,
Lee, M., Strowig, T., Arrey, F., Conenello, G., et al. (2009). Matrix protein 2
of influenza A virus blocks autophagosome fusion with lysosomes. Cell Host
Microbe 6, 367–380.
Garcıa-Sastre, A. (2011). Induction and evasion of type I interferon responses
by influenza viruses. Virus Res. 162, 12–18.
Hopkins, A.L., andGroom, C.R. (2002). The druggable genome. Nat. Rev. Drug
Discov. 1, 727–730.
Jager, S., Cimermancic, P., Gulbahce, N., Johnson, J.R., McGovern, K.E.,
Clarke, S.C., Shales, M., Mercenne, G., Pache, L., Li, K., et al. (2012). Global
landscape of HIV-human protein complexes. Nature 481, 365–370.
Karlas, A., Machuy, N., Shin, Y., Pleissner, K.P., Artarini, A., Heuer, D., Becker,
D., Khalil, H., Ogilvie, L.A., Hess, S., et al. (2010). Genome-wide RNAi screen
identifies human host factors crucial for influenza virus replication. Nature
463, 818–822.
Kato, J.Y., and Yoneda-Kato, N. (2009). Mammalian COP9 signalosome.
Genes Cells 14, 1209–1225.
Keynan, Y., Juno, J., Meyers, A., Ball, T.B., Kumar, A., Rubinstein, E., and
Fowke, K.R. (2010). Chemokine receptor 5 r32 allele in patients with severe
pandemic (H1N1) 2009. Emerg. Infect. Dis. 16, 1621–1622.
Konig, R., and Stertz, S. (2015). Recent strategies and progress in identifying
host factors involved in virus replication. Curr. Opin. Microbiol. 26, 79–88.
Konig, R., Chiang, C.Y., Tu, B.P., Yan, S.F., DeJesus, P.D., Romero, A.,
Bergauer, T., Orth, A., Krueger, U., Zhou, Y., and Chanda, S.K. (2007). A prob-
ability-based approach for the analysis of large-scale RNAi screens. Nat.
Methods 4, 847–849.
Konig, R., Stertz, S., Zhou, Y., Inoue, A., Hoffmann, H.H., Bhattacharyya, S.,
Alamares, J.G., Tscherne, D.M., Ortigoza, M.B., Liang, Y., et al. (2010).
Human host factors required for influenza virus replication. Nature 463,
813–817.
Krzywinski, M., Schein, J., Birol, I., Connors, J., Gascoyne, R., Horsman, D.,
Jones, S.J., and Marra, M.A. (2009). Circos: an information aesthetic for
comparative genomics. Genome Res. 19, 1639–1645.
Law, V., Knox, C., Djoumbou, Y., Jewison, T., Guo, A.C., Liu, Y., Maciejewski,
A., Arndt, D., Wilson, M., Neveu, V., et al. (2014). DrugBank 4.0: shedding new
light on drug metabolism. Nucleic Acids Res. 42, D1091–D1097.
Li, L., Chong, H.C., Ng, S.Y., Kwok, K.W., Teo, Z., Tan, E.H., Choo, C.C., Seet,
J.E., Choi, H.W., Buist, M.L., et al. (2015). Angiopoietin-like 4 increases pulmo-
nary tissue leakiness and damage during influenza pneumonia. Cell Rep. 10,
654–663.
Morito, D., and Nagata, K. (2015). Pathogenic Hijacking of ER-Associated
Degradation: Is ERAD Flexible? Mol. Cell 59, 335–344.
Morrison, J., Laurent-Rolle, M., Maestre, A.M., Rajsbaum, R., Pisanelli, G.,
Simon, V., Mulder, L.C., Fernandez-Sesma, A., and Garcıa-Sastre, A. (2013).
Dengue virus co-opts UBR4 to degrade STAT2 and antagonize type I inter-
feron signaling. PLoS Pathog. 9, e1003265.
Cell Host &
Nicoll, A., Ciancio, B., and Kramarz, P.; Influenza Project Team (2008).
Observed oseltamivir resistance in seasonal influenza viruses in Europe inter-
pretation and potential implications. Euro Surveill. 13, pii.
Parsons, K., Nakatani, Y., and Nguyen, M.D. (2015). p600/UBR4 in the central
nervous system. Cell. Mol. Life Sci. 72, 1149–1160.
Rossman, J.S., and Lamb, R.A. (2011). Influenza virus assembly and budding.
Virology 411, 229–236.
Rossman, J.S., Jing, X., Leser, G.P., Balannik, V., Pinto, L.H., and Lamb, R.A.
(2010). Influenza virus m2 ion channel protein is necessary for filamentous
virion formation. J. Virol. 84, 5078–5088.
Shapira, S.D., Gat-Viks, I., Shum, B.O., Dricot, A., de Grace, M.M., Wu, L.,
Gupta, P.B., Hao, T., Silver, S.J., Root, D.E., et al. (2009). A physical and reg-
ulatory map of host-influenza interactions reveals pathways in H1N1 infection.
Cell 139, 1255–1267.
Smoot, M.E., Ono, K., Ruscheinski, J., Wang, P.L., and Ideker, T. (2011).
Cytoscape 2.8: new features for data integration and network visualization.
Bioinformatics 27, 431–432.
Sowa,M.E., Bennett, E.J., Gygi, S.P., and Harper, J.W. (2009). Defining the hu-
man deubiquitinating enzyme interaction landscape. Cell 138, 389–403.
Stertz, S., and Shaw,M.L. (2011). Uncovering the global host cell requirements
for influenza virus replication via RNAi screening. Microbes Infect. Pasteur 13,
516–525.
Su, W.C., Chen, Y.C., Tseng, C.H., Hsu, P.W., Tung, K.F., Jeng, K.S., and Lai,
M.M. (2013). Pooled RNAi screen identifies ubiquitin ligase Itch as crucial for
influenza A virus release from the endosome during virus entry. Proc. Natl.
Acad. Sci. USA 110, 17516–17521.
Sun, E., He, J., and Zhuang, X. (2013). Dissecting the role of COPI complexes
in influenza virus infection. J. Virol. 87, 2673–2685.
Tasaki, T., Kim, S.T., Zakrzewska, A., Lee, B.E., Kang, M.J., Yoo, Y.D., Cha-
Molstad, H.J., Hwang, J., Soung, N.K., Sung, K.S., et al. (2013). UBR box
N-recognin-4 (UBR4), an N-recognin of the N-end rule pathway, and its role
in yolk sac vascular development and autophagy. Proc. Natl. Acad. Sci.
USA 110, 3800–3805.
Tran, A.T., Rahim, M.N., Ranadheera, C., Kroeker, A., Cortens, J.P., Opanubi,
K.J., Wilkins, J.A., and Coombs, K.M. (2013). Knockdown of specific host
factors protects against influenza virus-induced cell death. Cell Death Dis. 4,
e769.
Uhlen, M., Fagerberg, L., Hallstrom, B.M., Lindskog, C., Oksvold, P.,
Mardinoglu, A., Sivertsson, A., Kampf, C., Sjostedt, E., Asplund, A., et al.
(2015). Proteomics. Tissue-based map of the human proteome. Science
347, 1260419.
Verschueren, E., Von Dollen, J., Cimermancic, P., Gulbahce, N., Sali, A., and
Krogan, N.J. (2015). Scoring large-scale affinity purification mass spectrom-
etry datasets with MiST. Curr. Protoc. Bioinformatics 49, 8.19.1–18.19.16.
Ward, S.E., Kim, H.S., Komurov, K., Mendiratta, S., Tsai, P.L., Schmolke, M.,
Satterly, N., Manicassamy, B., Forst, C.V., Roth, M.G., et al. (2012). Host
modulators of H1N1 cytopathogenicity. PLoS ONE 7, e39284.
Watanabe, T., Kawakami, E., Shoemaker, J.E., Lopes, T.J., Matsuoka, Y.,
Tomita, Y., Kozuka-Hata, H., Gorai, T., Kuwahara, T., Takeda, E., et al.
(2014). Influenza virus-host interactome screen as a platform for antiviral
drug development. Cell Host Microbe 16, 795–805.
Wenger, C.D., Phanstiel, D.H., Lee, M.V., Bailey, D.J., and Coon, J.J. (2011).
COMPASS: a suite of pre- and post-search proteomics software tools for
OMSSA. Proteomics 11, 1064–1074.
White, E.A., Sowa, M.E., Tan, M.J., Jeudy, S., Hayes, S.D., Santha, S.,
Munger, K., Harper, J.W., and Howley, P.M. (2012). Systematic identification
of interactions between host cell proteins and E7 oncoproteins from diverse
human papillomaviruses. Proc. Natl. Acad. Sci. USA 109, E260–E267.
Zona, L., Lupberger, J., Sidahmed-Adrar, N., Thumann, C., Harris, H.J.,
Barnes, A., Florentin, J., Tawar, R.G., Xiao, F., Turek, M., et al. (2013). HRas
signal transduction promotes hepatitis C virus cell entry by triggering assembly
of the host tetraspanin receptor complex. Cell Host Microbe 13, 302–313.
Microbe 18, 723–735, December 9, 2015 ª2015 Elsevier Inc. 735

Cell Host & Microbe
Supplemental Information
Meta- and Orthogonal Integration
of Influenza “OMICs” Data Defines a Role
for UBR4 in Virus Budding
Shashank Tripathi, Marie O. Pohl, Yingyao Zhou, Ariel Rodriguez-Frandsen, Guojun
Wang, David A. Stein, Hong M. Moulton, Paul DeJesus, Jianwei Che, Lubbertus C.F.
Mulder, Emilio Yángüez, Dario Andenmatten, Lars Pache, Balaji Manicassamy, Randy
A. Albrecht, Maria G. Gonzalez, Quy Nguyen, Abraham Brass, Stephen Elledge, Michael
White, Sagi Shapira, Nir Hacohen, Alexander Karlas, Thomas F. Meyer, Michael Shales,
Andre Gatorano, Jeffrey R. Johnson, Gwen Jang, Tasha Johnson, Erik Verschueren,
Doug Sanders, Nevan Krogan, Megan Shaw, Renate König, Silke Stertz, Adolfo García-
Sastre, and Sumit K. Chanda

SUPPLEMENTAL EXPERIMENTAL PROCEDURES
Affinity Purification
Approximately, 6 x 10⁶ cells were seeded in each of three 10 cm2 plates, and the next day
transfected with 6 µg/plate of purified plasmid DNA using Effectene transfection reagent
(Qiagen). At 48 h after transfection, cells were detached with 10 mM EDTA/D-PBS, washed
with PBS and lysed with 1 mL of ice cold Final Wash buffer (50mM Tris HCL pH 7.5, 150 mM
NaCl, 1 mM EDTA) plus 0.5% NP-40, Roche Complete protease inhibitor and PhosphSTOP
phosphatase inhibitor. Lysates were incubated with 30 µL of Streptactin Sepharose beads (IBA)
or FLAG beads (Sigma) in 0.6 mL of Final Wash Buffer and incubated overnight, rotating at
4°C. Beads were washed three times in Final Wash Buffer plus 0.05% NP-40, and then once in
Final Wash Buffer. IP was eluted in 45 µL of 2.5 mM D-desthiobiotin (IBA) or 100 µg/ml FLAG
peptide (Elim Biopharmaceuticals) in Final Wash Buffer. All AP-MS were performed in
triplicate and assayed by Immunoblot using enhanced chemiluminescence (Amersham
Biosciences) and silver stain (Pierce).
Mass spectrometry
Purified protein eluates were digested with trypsin for LC-MS/MS analysis. Samples were
denatured and reduced in 2M urea, 10 mM NH4HCO3, 2 mM DTT for 30 min at 60°C, then
alkylated with 2 mM iodoacetamide for 45 min at room temperature. Trypsin (Promega) was
added at a 1:100 enzyme:substrate ratio and digested overnight at 37°C. Following digestion,
samples were concentrated using C18 ZipTips (Millipore) according to the manufacturer's
specifications. Desalted samples were evaporated to dryness and resuspended in 0.1% formic
acid for mass spectrometry analysis.
Digested peptide mixtures were analyzed by LC-MS/MS on a Thermo Scientific LTQ XL linear
ion trap mass spectrometer. The LTQ XL system was equipped with a LC Packings UltiMate
HPLC with an analytical column (10 cm x 75 µm I.D. packed with ReproSil Pur C18 AQ 5 µm
particles) and delivered a gradient from 5% to 30% ACN in 0.1% formic acid over one hour. The
mass spectrometer collected data in a data-dependent fashion, collecting one full scan followed
by 10 collision-induced dissociation MS/MS scans of the 10 most intense peaks from the full

scan. Dynamic exclusion was enabled on both systems for 30 seconds with a repeat count of 1.
Data were searched against a database containing SwissProt Human protein and IAV sequences
(downloaded June 25, 2013) concatenated to a decoy database where each sequence was
randomized in order to estimate the false positive rate. The searches considered a precursor mass
tolerance of 1 Da and fragment ion tolerances of 0.8 Da, and considered variable modifications
for protein N-terminal acetylation, protein N-terminal acetylation and oxidation, glutamine to
pyroglutamate conversion for peptide N-terminal glutamine residues, protein N-terminal
methionine loss, protein N-terminal acetylation and methionine loss, and methionine oxidation,
and constant modification for carbamidomethyl cysteine. The resulting raw data was matched to
protein sequences by the Protein Prospector algorithm. Prospector data was filtered using a
maximum protein expectation value of 0.01 and a maximum peptide expectation value of 0.05.
Scoring the Influenza-host interactome
AP-MS samples were scored with both CompPASS (Sowa et al., 2009) and Mass spectrometry
interaction Statistics (MiST) algorithm, using the MiST reproducibility (0.32), specificity (0.68)
and abundance (0.01) weights previously reported (Jager et al., 2012; Verschueren et al., 2015).
All bait-prey pairs with a MiST score greater than 0.70 or a top 5% CompPASS WD score plus
the bait-prey pairs by Shapira et al. and Watanabe et al. were combined with human protein-
protein interactions that connect pairs of prey. The resulting network diagram was plotted using
Cytoscape, v.3.1.2 (Smoot et al., 2011).
Immunoprecipitation
For validation of AP-MS interactions, cells were seeded in 10 cm2 tissue culture plates and
incubated for 24 h at 37 °C, 5% CO2. Cells were transfected with streptavidin-tagged IAV
proteins and respective V5-tagged host proteins as indicated using Lipofectamine 2000 (Life
Technologies) using the manufacturer’s protocol. After incubating for 4 h at 37 °C, 5% CO2, the
transfection mix was aspirated and replaced with complete growth medium (DMEM, 10% FBS,
1% P/S/G) and incubated at 37 °C, 5% CO2 for an additional 48 h. Cells were pelleted in a cold
centrifuge and harvested in lysis buffer (Sigma, 50mM Tris-HCl, pH 7.4, 150mM NaCl, 1mM
EDTA, 0.5% NP40) supplemented with complete protease and phosphatase inhibitor cocktail

(Sigma) and whole cell lysates were collected by centrifugation. Streptavidin-tagged proteins
from a portion of the whole cell lysates (WCLs) were immunoprecipitated using strep-tactin
coated magnetic beads (IBA Life Sciences) and incubated overnight at 4 °C with rotation. The
beads were washed using lysis buffer with complete protease inhibitor cocktail and the
immunoprecipitants were removed from the beads using elution buffer (1X LDS sample buffer +
5% β-mercaptoethanol + 50mM Tris-HCl, pH 7.4, 150mM NaCl, 1mM EDTA, 0.5% NP40).
Samples were boiled for 10 minutes to eliminate any noncovalent interactions. The
immunoprecipitants and WCLs were resolved on NuPAGE Bis-Tris gels (Life Technologies),
transferred to a PVDF membrane using a semi-dry transfer apparatus, probed overnight at 4 °C
with a primary antibody against V5 (Pierce) and HRP Conjugated Streptavidin (Bio-Rad), then
incubated with secondary goat anti-mouse HRP conjugated antibody (Bio-Rad) for 1 hour at
room temperature.
Bioinformatic analysis of screening data
siRNA Screening Data Transformation
The whole-genome siRNA screening data were obtained for 4 influenza screens from Brass et
al., Karlas et al., König et al., and Ward et al (Brass et al., 2009; Karlas et al., 2010; Konig et al.,
2010; Ward et al., 2012). Activity scores in the Ward study were transformed into negative
scores with -|score|. To aggregate activity scores of multiple siRNAs of the same gene, we
applied RSA algorithm to each screen individually, so that a p-value was obtained for each gene
(Konig et al., 2007). Genes were then sorted by their p-values first, if tied, then by their best
siRNA activity scores. We applied quantile normalization to map gene rankings into their final
Z-scores, so that Z-scores are normally distributed for each screen. As the result the same Z-
score for each screen represents the same percentile in the activity space, e.g., a Z-score of -2
corresponds to 2.2 percentile of the most active genes. The process resulted in four Z-scores: Z-
Brass, Z-Karlas, Z-König, and Z-Ward. The above process was repeated by negating the
activities scores (except Ward dataset), so that we obtained Z-scores for identifying antiviral
restriction factors across multiple assays.
Consolidated Z-score with RSA Analysis
Each gene has 4 Z-scores, one in each influenza screen, which presents a challenge in making
use of the information contained in all these influenza screens as a whole. In order to consolidate
the multiple Z-scores into one score, Z-scores from the four assays were pooled into one
combined dataset and RSA algorithm were applied to obtain p-values, which were further
quantile-normalized into a combined Z-score, referred to as Z-RSA score hereafter.
RSA algorithm was initially designed to handle an individual screen, where it effectively
consolidated activity scores of multiple siRNAs per gene into one probability score per gene
(Konig et al., 2007); it has been shown to be an effective statistics gene prioritization algorithm.
By substituting the concept of siRNA activities with Z-scores from different screens, RSA
algorithm became a natural choice to combine Z-scores from multiple screens into one Z-RSA
score. Genes with low Z-RSA scores (strong negative values) tend to be pro/anti-viral host
factors with low Z scores across multiple assays.
Confirmed Hit Lists and Expanded Hit Lists
Confirmed hit lists were obtained for 8 screens: (1) Proviral host factors: including 121 genes
from Brass et al., 168 genes from Karlas et al., 294 genes from König et al., and 221 genes from
Shapira et al., 109 genes from Su et al., and 127 genes from Tran et al., 299 genes from
Watanabe et al., 43 genes from Ward et al.; (2) Antiviral restriction factors: 4 genes from Karlas
et al., 151 genes from Shapira et al., 16 genes from Ward et al., and 24 genes from Watanabe et
al (Brass et al., 2009; Karlas et al., 2010; Konig et al., 2010; Shapira et al., 2009; Su et al., 2013;
Tran et al., 2013; Ward et al., 2012; Watanabe et al., 2014).
In total there are 1257 proviral factors confirmed by at least one of the published influenza
screens, among which 101 are confirmed by multiple screens; there are 192 antiviral factors
confirmed by at least one screen, among which 2 are confirmed by multiple screens. Notice that
16 genes appear in both, proviral and antiviral confirmed gene lists, probably reflecting the
variations in cell types and biological processes captured by different assays.
Sometimes a gene was not included in a confirmed hit list not because it was negative during
confirmation test, but rather because they were not picked for confirmation test due to logistic
constrains. To somewhat compensate for such false negative hits, we also considered an
expanded version of the hit lists. In that version, an unconfirmed gene could be considered as

RSA-confirmed, if it satisfied two conditions: (1) it has a Z-score ≤ -2 in the screen of interest;
(2) it has Z-RSA score ≤ -2, therefore its activity is likely to be supported by other screens.
To examine the overlap of confirmed hit lists and expanded hit lists among multiple screens,
Circos plot was used for visualization (Krzywinski et al., 2009). Besides connecting genes
directly shared by the confirmed hit lists of multiple screens, we also considered indirect
overlaps: (1) genes confirmed by one screen and the same gene is RSA-confirmed in another
screen; (3) proteins from two screens known to interact with each other based on the protein-
protein interaction database; (2) genes fall into the same statistically enriched gene ontology
functional groups (with ontology group size ≤ 50 and p-value ≤ 0.01).
Host-viral Protein Interaction Dataset
Three independent host-viral protein interaction datasets were collected and combined in this
study: (1) 87 host proteins and 10 viral proteins form 135 interaction pairs based on the yeast-
two-hybrid study by Shapira et al. (Shapira et al., 2009); (2) 849 host proteins and 11 viral
proteins form 925 interaction pairs based on the immunoprecipitation mass spectroscopy
produced by this study; (3) 323 confirmed host proteins and 11 viral proteins form 1127
interaction pairs based on Watanabe et al. (Shapira et al., 2009; Watanabe et al., 2014). In total
there are 2029 interaction pairs. To remove non-specific bindings, we filtered out host proteins
that interact with five or more viral proteins, which resulted in 1041 host proteins and 1421
interaction pairs.
Gene Function Enrichment Analyses
Gene ontology data were collected from multiple sources, including Gene Ontology (GO)
(http://www.geneontology.org), GeneGo process (https://portal.genego.com), and MSigDB
(www.broadinstitute.org/gsea/msigdb). Functional enrichment analyses were routinely applied
to provide biological context for various gene lists, which came from screening hit lists, protein
network or its MCODE subnetworks, etc. Statistical significance of each gene function category
was scored using the standard accumulative hypergeometric probability function. When
applicable, the resultant enriched functional categories were further clustered into groups based
on similarities measured by Kappa statistics, similar to the method used in DAVID
(http://david.abcc.ncifcrf.gov).

Network Data Analyses
Human protein-protein binding data used in this study were derived from Hynet (Prolexys, Inc),
Reactome (http://reactome.org), BIND (http://www.bind.ca), MINT
(http://mint.bio.uniroma2.it/mint/), HPRD (http://www.hprd.org), and CORUM
(http://mips.helmholtz-muenchen.de/genre/proj/corum/index.html). A small human-influenza
protein interaction data set previously used (Konig et al., 2010) was included as well.
For a given human gene list, all direct interactions among the genes were extracted from the
above described databases and a network was constructed. If the network was too complex for
visual interpretation, Molecular Complex Detection (MCODE) analysis was applied to identify
densely connected network components (Bader and Hogue, 2003). Our implementation of the
MCODE analysis was based on the Cytoscape MCODE plug-in source code, with some
additional optimizations added to the cluster finding process. All networks visualizations were
based on Cytoscape (version 3.2.0) (http://www.cytoscape.org).
Receiver-operating Characteristic (Uhlen et al.) Analysis
To understand if the consolidated RSA Z-score is superior to the Z-scores of individual influenza
screens, we performed a ROC analysis. The 101 genes confirmed by multiple proviral hit lists
were considered to be true positive genes, all other genes were considered true negative genes.
All genes screened were ranked based on ascending Z-scores from negative to positive, i.e., by
Z_Brass, Z_Karlas, Z_König, Z_Ward, and Z_RSA, respectively. True positive rate (TPR) and
false positive rate (FPR) as a function of the various Z-score cutoffs were obtained to construct
five ROC curves. The results support that RSA algorithm is apt at identifying potent screening
hits that are supported by multiple screens, Z-RSA score is the best choice if we use one score to
capture the activity measurements from all screens.
Evidence Analyses
We assume that screening hits having multiple lines of independent indications for influenza-
related functions are less likely to be a false positive. Such a multi-evidence strategy has been
validated in previous studies in its successful identification of novel HIV and influenza host
factors (Konig et al., 2010; Konig et al., 2008). The individual evidences collected for this study
are described below.
For all genes screened in our study, the four influenza-screen Z-scores and the Z-RSA score were
compiled first. Columns indicating their confirmation status in individual influenza screens were
added. In such a systems-based approach, data from functional genomics screens, protein-protein
interaction networks, and human-influenza interaction data set assays were combined, so that
true (biologically relevant) positive genes that have multiple lines of evidence to support their
activities have a better chance to be identified.
Cells, viruses, plasmids, VLP generation, and infection.
Cells
Human lung adenocarcinoma A549 cells, A549 cells stably expressing LC3 (a kind gift of Dr.
Christian Münz, University of Zurich, Switzerland) Madin-Darby canine kidney MDCKII cells,
human embryonic kidney HEK293T cells and primary lung fibroblast WI38 cells were
maintained in Dulbecco's modified Eagle's medium (DMEM) supplemented with heat-
inactivated 10% fetal calf serum.
Sequences encoding full-length or deletion mutants of the IAV M2 (A/WSN/1933 origin) with
an N-terminal GST tag were cloned into the pCAGGS vector. Autophagosome marker plasmid
DIRAS3-N-RFP was purchased from Origene (Cat# RC100043). The pSpCas9 2A-GFP
(PX458) plasmid was a gift from Feng Zhang (Addgene plasmid # 48138). Following wild type
influenza viruses were used: A/WSN/33 (WSN), A/Puerto Rico/8/1934, A/Hong Kong/68,
A/Udorn/72, A/duck/Ukraine/1/1963, A/duck/England/1/1956 and A/duck/Alberta/35/1976. For
validation of antiviral factors we used recombinant A/Vietnam/1203/04 H5N1 influenza virus
encoding the hemagglutinin lacking the multibasic cleavage sequence (HAlo). This virus was
rescued by reverse genetics as described previously (Steel et al., 2009). The genomic sequence
of the recombinant virus was confirmed after virus amplification in embryonated chicken eggs
(Charles River Laboratories).The luciferase reporter influenza A virus was generated by inserting
secretion signal less Gaussia luciferase gene (region 7850-8401 bp of GenBank: KM288862.1)
into the NS segment of PR8 IAV as described before (Manicassamy et al., 2010). The split-GFP
influenza virus was generated as described by Avilov et al. (Avilov et al., 2012). This

recombinant virus encodes PB2 with a tag of 16 amino acids at the C-terminus (a small fragment
of GFP, termed ‘11’) that can complement the larger fragment of GFP (termed ‘1-10’) to
produce functional GFP. To detect GFP upon infection, stable WI38 cells expressing GFP ‘1-10’
were used. IAV stocks were grown in 8 day old specific-pathogen free chicken eggs (Charles
River Laboratories) or in A549 cells. Titers of virus stocks were determined by plaque assay on
MDCK cells. For mouse infection experiments we used the influenza virus A/Puerto
Rico/8/1934 (PR8). KOS/Dlux/oriL HSV-1 reporter virus encoding Renilla luciferase was a gift
from David Leib (Summers and Leib, 2002). Monocistronic reporter dengue virus (mDV-R)
encoding Renilla luciferase was a gift from Andrea Gamarnik (Samsa et al., 2012). Renilla
luciferase activities were measured using a Renilla luciferase reporter assay (Promega) according
to the manufacturer's protocol. The virus-like particles (VLPs) were generated as described
before (Pohl et al., 2014). In brief, HEK293T cells were transfected with a plasmid containing an
HIV provirus carrying Gaussia luciferase, an HIV gag-pol expression plasmid, and plasmids
carrying the respective viral glycoproteins (WSN-HA/NA), Lassa virus glycoprotein (LASV-G),
or murine leukemia virus envelope (MLV env). For transfection the jetPRIME Polyplus
transfection reagent was used.
For virus infections, cells were washed once with phosphate buffered saline (PBS) and then
infected with the respective amount of virus diluted in PBS supplemented with 0.02 mM Mg2+,
0.01 mM Ca2+, 0.3% bovine serum albumin (BSA), and 1% penicillin-streptomycin (infection
PBS) at 37°C for 1 h before changing to DMEM containing 0.3% BSA, 20 mM HEPES, and 1%
penicillin-streptomycin (post infection DMEM). With the exception of A/WSN/33, all virus
strains were grown in the presence of 0.25µg/ml tosylamide-2-phenylethyl chloromethyl ketone
trypsin (Sigma-Aldrich). No Trypsin was used for infecting HEK293 T cells. Virus titrations
were performed by standard plaque assay on MDCK cells. For detection of viral replication in
the split-GFP assay, GFP fluorescence was measured every 4 h for a total of 44h using IncuCyte
technology (Essen BioScience). The area under the curve (AUC) was then calculated as measure
for viral growth. For dependency factor validation, cells were stimulated for 8 h with 50 U/ml of
IFN-β or mock-stimulated 36 h after siRNA transfection and subsequently infected with
influenza A/Vietnam/1203/2004 (H5N1) HALo virus harboring GFP at MOI of 0.5. After 24 h,
GFP fluorescence was analyzed by high-content microscopy. For the entry assay, A549 cells
were infected with VLPs diluted in Opti-MEM for 1 h at 37°C. Cells were washed 3x with PBS

and then kept in DMEM supplemented with 10% FCS and penicillin-streptomycin for 30 h at
37°C. Luciferase activity in the supernatants was determined using the Renilla luciferase assay
system (Promega).
Selection of validated host factors.
Candidate factors were validated by testing growth of A/WSN/33 and split-GFP viruses in A549
and WI38, respectively. Restriction factors were validated by testing the number of infected cells
by the A/Vietnam/1203/2004 HALo virus expressing GFP fused to NS1. Cells were treated with
siRNAs to knockdown the respective host factors. Per factor, four different siRNAs were tested
individually. Criteria for validation with A/WSN/33 were a reduction of viral growth of 75% or
greater by at least two siRNAs relative to cells treated with the control siRNA. For validation of
factors by the split-GFP assay at least two out of four siRNAs targeting a respective host factor
were required to reduce the AUC of the viral growth curve relative to control by more than two
times the mean standard deviation. For validation of restriction factors by high-content
microscopy, 2 or more siRNAs were required to increase the number of infected cells compared
to the scrambled control siRNA with a p-value p<0.05.
DNA and siRNA Transfections
DNA transfections were done using Lipofectamine 2000 (Life Technologies) reagent according
to the manufacturer's protocol. For siRNA transfections, A549 or WI38 cells were transfected in
suspension with 30nM siRNA (Qiagen) diluted in Opti-MEM (Life Technologies) using the
RNAiMAX reagent according to the manufacturer’s protocol (Invitrogen). At 48 h post-
transfection, cells were either infected or cell viability was determined using the CellTiter-Glo
assay (Promega).
Western blotting. Cells were lysed in Laemmli buffer and samples were subjected to standard
SDS-PAGE. Separated proteins were transferred to nitrocellulose membranes (Hybond ECL; GE
Healthcare). 5% milk diluted in Tris-buffered saline containing 0.5% Tween 20 was used for
blocking.

Antibodies
The following primary antibodies were used: Western Blotting: anti-M2 primary (14C2)
antibody (Santa Cruz: sc-32238), anti-UBR4 (Abcam # ab86738), anti-actin (Santa Cruz
Biotechnology # sc-47778 ), anti-GAPDH (Santa Cruz Biotechnology # sc-25778), anti-VCP
(p97) antibody (Abcam # ab11433), anti-LC3 (Nanotools # 5F10), and rabbit polyclonal anti-
nucleoprotein (a kind gift of A. Nieto) (Jorba et al., 2009). Immunofluorescence: mouse
monoclonal anti-NP (a kind gift of J. Pavlovic) Immunoprecipitation: The antibodies used for
immunoprecipitation were anti-M2 primary (14C2) antibody, anti-UBR4 antibody (Abcam:
ab86738) and Anti-GST Antibody (B-14) (Santa Cruz: sc-138). Flow cytometry: Primary
antibodies used for FACS experiments were anti-M2 E10 mouse monoclonal (Mount Sinai in-
house antibody), anti-HA PY102 mouse monoclonal (Mount Sinai in-house antibody), anti-
Influenza A H1N1 NA antibody (Thermo #PA5-32238) and Anti-Human CD71 (Pharmingen
#555534) for measuring surface expression of IAV M2, HA, NA and human transferrin receptor
(TFR) respectively. For measuring M2 total levels we used anti-M2 primary (14C2) antibody
(Santa Cruz: sc-32238). For measuring CD45 and IAV M2 in mouse lung cells we used FITC
conjugated anti-mouse CD45 Antibody (Biolegend # 103107) and Alexa 647 conjugated anti-M2
E10 antibody [conjugated by using Alexa Fluor® 647 Antibody Labeling Kit (Thermo)].
Compounds
The following compounds were used: DBeQ (Sigma-Aldrich), bafilomycin A1 (Sigma-Aldrich),
Amantadine Hydrochloride (Sigma-Aldrich), AS 601245 (Enzo Life Sciences) and Lonafarnib
(Toronto Research Chemicals Inc.).
Generation of shRNA mediated UBR4 knockdown and CRISPR/cas9 mediated UBR4
knock out cell line
UBR4 silencing was obtained by transducing A549 cells with UBR4 shRNA lentiviral vector
derived VLPs. The vector used was pLKO shRNA Clone ID: TRCN0000152115 (Open
Biosystems), which targets nt 3040 to nt 3060 (CCACCATCAAAGACTTACATT) of

NM_020765. As negative controls we used non-targeting pLKO shRNA encoding lentiviral
vectors (Addgene). After transductions cells were selected with puromycin. UBR4 silencing was
confirmed by western blotting . For generating the UBR4 KO cell line, we used HEK293T cells
and followed the protocol described before (Ran et al., 2013). Specifically, exon 1 of the UBR4
locus (sequence CTCGAAGGCGGAGTAGGACGCGG) was targeted by gRNA designed by
using CRIPSR design platform (http://crispr.mit.edu/). The gRNA was cloned into pSpCas9-2A-
GFP plasmid vector (Ran et al., 2013) and transfected into HEK293T cells. 48h post-
transfection, GFP positive cells were sorted by FACS and plated for colony formation. Single
cell derived colonies were picked and screened for UBR4 knockout by western blotting. Cell
clones negative for UBR4 protein expression were expanded and used for experiments.
UBR4 knockdown by PPMOs
PPMOs were produced as described before (Abes et al., 2006). Two PPMOs were designed;
PPMO 1 (ACTGGGAAGTAAGAACAGCCACTTA) and PPMO 2
(AGAAACAGAGACTCTGCTCTCACCT) targeted the splice site of the intron2/exon3 and the
exon3/intron 3, respectively of UBR4 gene. A nontargeting PPMO control sequence (Scr PPMO)
(CCTCTTACCTCAGTTACAATTTATA), having little homology to mouse transcripts or
influenza viral sequences, was used as control.
Histopathological examination
The mouse lungs were removed immediately following euthanasia, inflated, and fixed with 10%
neutral buffered formalin overnight at 4°C. Subsequently, they were embedded in paraffin,
sectioned at a thickness of 4 µm, stained with Hematoxylin and Eosin (H&E), and examined
under the 40X objective of a Leica SCN400 light microscope.
Generation of a recombinant A/WSN/1933 virus containing a mixed M segment from
A/WSN/1933 and A/duck/England/1/1956 (WSN:M2-England)
To generate the mixed M segment virus the plasmids pPolI-segment7 of strains A/WSN/33 and
A/duck/England/1956 were digested with StuI (which cuts in the coding sequence next to the
splice acceptor site) and EcoRI (which cuts outside of the coding sequence downstream of the
ribozyme sequence). The purified digestion products were ligated to generate the mixed M

segment as depicted in fig. S8C. The resulting plasmid was verified by sequencing. Recombinant
virus was rescued by transfecting 293T with 8 plasmids encoding the 8 different vRNAs and 4
expression plasmids for PB2, PB1, PA and NP. At 24h post transfection MDCK cells were added
to the transfected 293T and post infection medium containing TPCK trypsin (1µg/ml) were
added to the transfected 293T. When cytopathic effect was observed on the MDCK cells,
supernatant was harvested and virus was titered by plaque assay and sequence verified.
Statistical Analysis
All statistical analyses were performed using GraphPad Prism Software Version 5.00 (GraphPad
Software Inc., San Diego, CA). Comparison between two treatment means was achieved using a
two-tailed Student t-test. The differences were considered statistically significant at p<0.05.
***P<0.001, **P<0.005; *P<0.05.
Supplemental Figure & Table Legends
Figure S1, related to Fig 1.
(A) Receiver-operating characteristic (Uhlen et al.) curves of pro-viral Z-scores of the four primary screen datasets compared to the consolidated Z-score. The true positive rate (TPR, Y-axis) and false positive rate (FPR, X-axis) are displayed as a function of the various Z-score cutoffs to construct five ROC curves. TPR and FPR were calculated based on 101 genes confirmed by multiple pro-viral hit lists as true hits. (B, C, D and E) Circos visualization of pro-viral (B and C) or anti-viral (D and E) cellular factors supported by protein interaction networks (B and D) and pathways (C and E): proteins from two screens known to interact based on protein-protein interaction databases (PPI) or genes sharing statistically enriched gene ontology (GO) functional groups (with ontology group size ≤ 50 and p-value ≤ 0.01) are displayed by inter-screen inter-gene connectors. Each slice of the Circos plots depicts one out of eight screens (pro-viral) or six screens (anti-viral), respectively, represented by the outermost colored line. The length of each circle segment corresponds to the number of confirmed or significant (Z-score of ≤ -2) factors found in each screen. The innermost circle categorizes the cellular factors into the respective gene status: (i) gene was confirmed in the indicated screen (red), and at least one additional screen, (ii) gene reported confirmed in only the indicated screen (orange), (iii) gene was not reported confirmed in any screen, but displays a high activity (Z-

score ≤ -2) in the raw data sets of the indicated screen (transparent white). The four blue circles represent the gene activity, displaying the calculated Z-scores of each host factor (B and C) or restriction factors (D and E) in four primary raw screen datasets, respectively (from outside to inside: Brass et al., Karlas et al., König et al., Ward et al.). Connecting lines denote the indirect overlap of genes shared by multiple screens to form PPI connections or to fall into the same GO group. The color of the line indicates the category of the inter-screen inter-gene links: (i) both genes are confirmed (purple), (ii) one gene is confirmed and the other displays a high Z-score of ≤ -2 (black), (iii) both genes display high Z-scores of ≤ -2 in their source screens (green). (F) Pie chart representation of genes confirmed with pro-viral activities in at least one screen (1257 genes). 613 genes are additionally supported by at least one of the depicted categories: host factors called in two or more screens, genes with RSA support (Z-score ≤ -2 in one of the screens and consolidated Z-RSA score ≤ -2, “called in one screen & high Z- score”) and genes supported by PPI and/or pathways or both.
Figure S2, related to Fig 2. HRAS, MAPK1 and MAPK8 are host factors required by IAV during an early step in the life cycle. (A) Virus growth and cell viability. A549 cells were transfected with siRNAs targeting the indicated factors, NP or an irrelevant siRNA (si_Scr). 48h post-transfection, cells were infected with A/WSN/33 MOI=0.01. After 24h, supernatants were harvested and titered by plaque assay. Titrations were performed in duplicates, cell viability in triplicates. Shown is mean viral growth ± SD. (B) NP expression 3 h pi. 48h following siRNA transfection, cells were infected with A/WSN/33 MOI=10. 3h after infection, cells were fixed, permeabilized and stained for NP. Nuclear NP staining was visualized by confocal micoscropy (representative images are shown) and nuclear signal intensity was quantified using ImageJ software. Error bars indicate SD. (C) VLP entry. 48h after siRNA transfection, cells were infected with VLPs encoding a Gaussia luciferase reporter gene and expressing viral glycoproteins of IAV, LASV or MLV on their surface. Luciferase activity of triplicates ± SD 30h after infection is depicted in % relative to cells treated with si_Scr. (D) Virus growth and cell viability. A549 cells were pre-incubated with medium containing DMSO or Lonafarnib or AS601245 at the indicated concentrations for 2h before infection with A/WSN/33 MOI=0.01. Inhibitor was present during and 24h following infection. Supernatants were titered by plaque assay.Titrations were performed in duplicates, cell viability in triplicates. Error bars indicate SD. (E) NP expression 3 h pi. A549 cells were incubated with medium containing DMSO, Bafilomycin A1, Lonafarnib or AS601245 2h before infection, during infection and 3h post-infection with A/WSN/33 MOI=10. Cells were infected and analyzed as in (B). Representative images are shown. Error bars indicate SD.
Figure S3, related to Fig 3. Network topology of host-protein interactions validated in Z-RSA analysis.
The interaction network was elucidated based upon binary protein-protein interaction binding data derived from Hynet (Prolexys, Inc), Reactome (http://reactome.org), BIND (http://www.bind.ca), MINT (http://mint.bio.uniroma2.it/mint/), HPRD http://www.hprd.org),

and CORUM (http://mips.helmholtz-muenchen.de/genre/proj/corum/index.html). Furthermore, connections to Influenza-encoded proteins were incorporated compiled by three different studies (Shapira et al., Watanabe et al., and our own experimentally APMS data) filtered for non-specific binders interacting with five or more Influenza proteins. Networks formed by the Z-RSA ranked genes, confirmed genes or genes connecting to IAV proteins were analyzed for highly connected local network modules (MCODE)(Bader and Hogue, 2003). Notably, a number of these densely connected networks form functional subgroups representing highly validated protein clusters for IAV replication. We highlight the following MCODE complexes for proviral factors: COPI (S3A), splicing (S3B) and MAPK signaling (S3C). Additionally we display a densely connected subnetwork based on Z-RSA for restriction factors (S3D). (host factor Z-RSA in A,B and C; and restriction factor Z-RSA in D). Corresponding binary information on the subnetworks are entailed in Supplemental Table 7.
Host nodes reflect genes that were reported confirmed as host (in A, B or C) or restriction factors (in D) in one (slight red) or in at least 2 RNAi screens (dark red) or were not reported confirmed, but highly ranked by consolidated Z-RSA scores of ≤ -2 (green). Additional support for confirmed factors by consolidated Z-scores of ≤ -2 is depicted as blue nodes (slight blue or dark blue reflecting confirmed by 1 or ≥ 2 RNAi screens, respectively). Influenza nodes are depicted in yellow and Influenza-host interactions by blue connectors. Grey circles are “bridging” proteins that facilitate interactions between influenza virus proteins and host factors supported by one of the above mentioned categories. Experimentally wet-lab validated factors from Fig 2 or Fig S4 are bordered in black.
Figure S4, related to Fig 3 and Fig 4. Host proteins physically associate with IAV proteins as predicted by MIST and validation of COP9 as IAV host factor. (A) HEK-293T cells were cotransfected with the indicated Streptavidin-tagged IAV proteins and V5-tagged host proteins. 48h post transfection, whole cell lysates (WCLs) were immunoprecipitated using strep-tactin coated magnetic beads. Immunoprecipitants and WCLs were assayed by western blot analysis using V5 or Streptavidin antibodies. (B)Four unique siRNAs targeting different COP9 subunits or an irrelevant (siScr) or cytotoxic (siRPS) siRNA were transfected into A549 cells. Left panel: 48h post-transfection, cells were infected with A/WSN/33 MOI=0.01. After 24 h, supernatants were harvested and titered by plaque assay. Depicted is viral growth in percent relative to control (cells treated with siScr). Shown are average values of three independent experiments each performed in duplicates. The dashed line at y=25 indicates cut off for validation. Right panel: Cell viability was measured 48h after transfection of siRNAs into A549 cells. Shown is cell viability in percent relative to control of two independent experiments each performed in triplicates. The dashed line at y=70 indicates cut off for cell viability. (C) UBR4 requirement validation in primary cells. WI38 cells stably expressing a split GFP (GFP1-10) were transfected with the respective siRNAs. 48h post-transfection cells were infected with A/WSN/33:PB2-GFP11 carrying a complementing fragment of GFP (GFP 11; MOI=0.1). GFP counts were

measured every 4h for 44h. Percent area under the curve of GFP counts relative to siScr is plotted on the graph. Data represent mean ±S.D. of at least two independent experiments performed in triplicates. (D) Virus growth in the presence of amantadine. A549 cells were transfected with siScr, siUBR4_3 or siRPS. 48h post-transfection, cells were infected on ice with A/Udorn/72 (MOI=5). 5µM amantadine was added to the tissue culture medium at 0 h pi and 16h post infection virus titer was measured in the supernatants by plaque assay. Data represents mean ±S.D. of two independent experiments. (E) UBR4 is required by IAV during a late step of the viral life cycle. Nuclear NP expression 3h pi. A549 cells were transfected with siScr, sivATPase or siUBR4_3. 48h post-transfection, cells were infected on ice with A/WSN/33 MOI=10. Infection was allowed to proceed at 37°C for 3h and cells were fixed, stained for NP (green) and DAPI (blue) and analyzed by confocal microscopy. Per condition, 100 nuclei were analyzed for mean NP signal intensity using ImageJ software. Shown are representative images and the quantification (duplicates). Data represent mean ±S.D. (F) NP expression levels 18 h pi. A549 cells were transfected with siRNAs targeting UBR4, NP or siScr. 48h post-transfection, cells were infected with A/WSN/33 (MOI=2). After 18h post infection virus titer was measured in the supernatants (duplicates) by plaque assay. Data represent mean ±S.D. ANOVA: p= < 0.0001. Students t-test: siScr vs. siUBR4_3 p=0.0067; siScr vs. siUBR4_4 p=0.0157; siScr vs. siUBR4_5 p=0.0085. In parallel, cells were lysed and analyzed for NP expression by Western Blot.
Figure S5, related to Fig 4, Fig 5 and Fig 6. (A) Characterization of UBR4 stable knockdown A549 cells. Left panel shows western blot of UBR4 expression tested in control, Scrambled shRNA and UBR4 shRNA expressing A549 cells. These cells were infected with WSN IAV at 0.01 MOI for 48 hours. Virus titers in cell culture supernatant were measured by plaque assay shown in the graph on the right. * and # indicate P values compared to Control and Scr shRNA respectively. (B) Characterization of UBR4 CRISPR/cas9 knockout HEK 293T cells. UBR4 expression was knocked out using CRISPR/cas9 system in HEK 293T cells as described in methods. UBR4 expression was checked in UBR4 WT and UBR4 KO cells by western blotting (Left panel). WT and UBR4 KO HEK293 T cells were infected with NS1-Luciferase reporter PR8 IAV at 0.2 MOI for 48 h. The luminescence values were plotted considering WT control as 100%. * indicate P values compared WT cells. (C) Effect of UBR4 KO on cell surface expression of viral and cellular proteins. UBR4 WT and UBR4 KO HEK 293T cells were infected with PR8 IAV at MOI=5 for 16 h. Cells were harvested, immunostained to detect HA, NA and transferrin receptor (TFR) surface expression in non-permeabilized cells. Secondary staining was done with Alexa 568 conjugated antibodies and cells were subjected to flow cytometry analysis. The graphs show the geometric mean of signal intensity for indicated protein on the cell surface. * indicates P values compared to WT cells. (D) A549 cells stably expressing LC3-GFP were transfected with siScr or siUBR4. 48h post-transfection cells were infected with A/WSN/33 with a MOI of 5 or mock infected. 16 h post-infection, cells were fixed and GFP
signal was visualized by confocal microscopy and in parallel LC3 protein levels were analyzed by western blot. Shown are representative images of at least three independent experiments. Bars: 7.5 µm. Arrows indicate relocalized LC3 at the plasma membrane. (E) Effect of ERAD and autophagy inhibitors on M2 cell surface and total expression. UBR4 WT and UBR4 KO HEK 293T cells were infected with PR8 IAV at MOI=5. 6h post infection indicated drug or DMSO were added to the medium (final concentration BafA 20 nM, DBeQ 20 µM). 16 h post infection cells were harvested, stained with live/dead dye, followed by staining to detect M2 cell surface and total expression as described in methods. Cells were subjected to flow cytometry; live cells were analyzed for M2 cell surface and total cellular expression. The left graph shows the percentage of the cell population positive for M2 surface expression, considering UBR4 WT as 100 %. The right graph shows geometric mean intensity of M2 signal in the permeabilized samples. * indicates P values compared to DMSO control. (F) UBR4 KO 293T cells were transfected with scrambled or p97 targeting siRNA (Qiagen # Hs_VCP_6). 24 hours later cells were infected with PR8 IAV at MOI=5 for 16 hours and M2 surface expression was measured by FACS. Top panel shows western blot of p97 expression after siRNA treatment. Bottom left graph shows the percentage of live cells positive for M2 expression on the cell surface. Bottom right panel shows percentage of live cells considering mock uninfected cells as 100%. * and # indicate P values compared to DMSO Control for DBeQ and BafA respectively. All graphs represent mean ±SD of 3 independent experiments (n=3). Statistical significance was determined using Student's t-test. ***P<0.001, **P<0.005; *P<0.05. (G) Mouse embryonic fibroblasts were treated with scrambled or UBR4 targeting PPMOs for 18 hr. Cells were lysed and subjected to SDS PAGE followed by western blotting using anti-UBR4 and anti-actin antibodies. (H) From experiment shown in Fig 6A, mouse lung tissue was homogenised and subjected to western blot analysis to measure levels of UBR4. Left and right panels show UBR4 level on day 0 before infection and day 3 post infection respectively. (I) From experiment shown in Fig 6A mouse body weight were also measured in PPMO treated and mock infected groups and plotted on the graph (mean ±SEM; n=5) considering body weight before PPMO treatment on day -2 as 100%. (J) From the experiment shown in Fig.6A, lung tissues were harvested from mice (n=3) to obtain single cell suspensions as described in the methods. Cells were stained to detect surface expression of IAV M2 and mouse CD45 as described in methods. Stained cells were subjected to flow cytometry and the percentage of the cell population positive for M2 surface expression (relative) was plotted on the graph considering PBS group average as 100 %. The left graph shows overall M2 staining, whereas middle and right graphs show M2 positive cells in CD45 positive and CD45 negative subsets respectively. * and # indicate P values compared to PBS and Scr PPMO respectively. ***P<0.001, **P<0.005; *P<0.05. (K) Contour plots showing distribution M2 and CD45 staining from the same experiments are shown from the mouse groups indicted above them.

Figure S6, related to Figure 6. Avian influenza A virus strains are less dependent on the
presence of UBR4 (A) 48 h following transfection with siScr, siUBR4_3 or siRPS A549 cells
were infected with the indicated virus strain (MOI=5). At 16 h post infection, supernatants were
harvested and titered. Indicated is the mean viral growth (pfu/ml) in percent relative to siScr-
transfected cells ±SD of 3 independent experiments performed in duplicates. (B) Left panel
shows the organization of the M segment of A/WSN/33, A/duck/England/1956 and WSN:M2-
England. Right panel: Same experiment set-up as in (A). Infection was performed with
WSN:M2-wt or WSN:M2-England (MOI=1). (C) Six week old female BALB/c mice (5 per
group) were given PBS or PPMOs intranasally for two consecutive days as described in
methods. On day 3, mice were infected with A/duck/England/1/1956 (H11N6) (106 pfu)
intranasally. Body weight was measured every day and plotted on the graph considering weight
on day 0 (day of infection) as 100%. (D) Percentage loss of body weight was calculated for PR8
(Fig 6B) and A/duck/England/1/1956 infection (Sup Fig 6C) on 3 days post infection. Data
represent percentage body weight loss ±SEM for at least 5 mice per group. * and # indicate P
values compared to PBS and Scr PPMO respectively. (E) Shown is (from the same experiment
as in (C)) lung virus titer ± SD at day 3 post infection. * and # represent P value with respect to
PBS control and Scr PPMO. (F) Percentage reduction of virus titer upon UBR4 PPMO treatment
was calculated for PR/8 (Fig 6D) and A/duck/England/1/1956 infection (Sup Fig 6E). Data
represent percentage reduction in virus titer ±SEM as compared to PBS or Scr PPMO treated and
IAV infected groups. * and # indicate P values compared to PBS and Scr PPMO respectively.
Table S1, related to Fig 1 A, B and C. Pro-viral cellular factors supported by reported RNAi data from large-scale screens
Tab CIRCOS_HOST: Genes that are depicted in Fig 1 A,B,C and Fig S1 B,C and Fig S1F are listed. Explanation of column headings in table:
Column A: Entrez Gene ID; Column B: gene symbol; Column C: gene description; Column D: Classification of genes with RSA support or confirmed genes supported by additional categories as depicted in the pie chart in Fig S1F. The categories are based on (i) confirmed genes in more than one screen (Multiple Confirmed), with RSA support (Confirmed+ZRSA) or the overlap of genes shared by multiple screens to form PPI connections (confirmed+PPI) or to fall into the same GO group (confirmed+GO) or both (confirmed+PPI&GO); (ii) unconfirmed genes with consolidated ZRSA score additionally supported by PPI (PPI+ZRSA) or GO (GO+ZRSA) or

both (PPI&GO+ZRSA); (iii) unconfirmed genes with ZRSA score based on RSA support in at least 2 screens (ZRSA in 2 or more screens) or additionally supported by GO, PPI or both (GO/PPI/PPI&GO+ZRSA in 2 or more screens); N/A denotes either genes confirmed in 1 screen only or genes with ZRSA support in only one screen, but no additional support. The pie chart Fig. S1F represents genes confirmed in at least 1 screen. Column E: number of times a gene was confirmed as a host factor in all RNAi screens. Column F-M: represents each of the primary screens. The type of category to classify the genes is depicted. Column N-Q: RSA score representing most active dependency factors in each of the genome-wide screens. Column R: consolidated Z-RSA score for proviral factors.
Tab ROC, related to Fig S1 A: Column A: numbering of 101 hits for each assay; Column B: the order number of each hit based on the Z-score of the respective screen; Column C and D: geneID and symbol; Column E: assay origin; Column E: calculated true positive rate; Column F: calculated false positive rate
Tabs HOST_PPIGONET, HOST_GONET, HOST_PPINET: inter-screen inter-gene connections that are depicted in Fig 1C (HOST_PPIGONET) and Fig S1B (HOST_PPINET) and Fig S1C (HOST_GONET) are listed. In tabs HOST_PPIGONET and HOST_GONET, the connected genes (geneID and symbol) based on GO categories are listed in Column A,B and C,D. Information on the confirmation status of the respective genes is depicted in Column E and F (Y: yes or N: no). HOST_GONET lists the corresponding GO groups (Column G and H); The tab HOST_PPINET lists the direct physical interactions based on PPI database sources (Column F) between interacting genes (geneID and symbol) in Column A,B and C,D. Information on the confirmation status of the respective genes is depicted in Column G and H (Y: yes or N: no).
Table S2, related to Fig 1 D. Anti-viral cellular factors supported by reported RNAi data from large-scale screens
Genes that are depicted in Fig 1 D and Fig S1 D,E are listed. Explanation of column headings in table:
Column A: Entrez Gene ID; Column B: gene symbol; Column C: gene description; Column D: Classification of genes with RSA support or confirmed genes supported by additional categories. The categories are based on (i) confirmed genes in more than one screen (Multiple Confirmed), with RSA support (Confirmed+ZRSA) or the overlap of genes shared by multiple screens to form PPI connections (confirmed+PPI) or to fall into the same GO group (confirmed+GO) or both (confirmed+PPI&GO); (ii) unconfirmed genes with consolidated ZRSA score additionally supported by PPI (PPI+ZRSA) or GO (GO+ZRSA) or both (PPI&GO+ZRSA); (iii) unconfirmed genes with ZRSA score based on RSA support in at least 2 screens (ZRSA in 2 or more screens) or additionally supported by GO, PPI or both (GO/PPI/PPI&GO+ZRSA in 2 or more screens); N/A denotes either genes confirmed in 1 screen only or genes with ZRSA support in only one

screen, but no additional support. Column E: number of times a gene was confirmed as a restriction factor in all RNAi screens. Column F-K: represents each of the primary screens. The type of category to classify the genes is depicted. Column L-O: RSA score representing most active restriction factors in each of the genome-wide screens. Column P: consolidated Z-RSA score for antiviral factors.
Tabs REST_GONET, REST_PPINET: inter-screen inter-gene connections that are depicted in Fig S1D (REST_PPINET) and Fig S1E (REST_GONET) are listed. In tab REST_GONET, the connected genes (geneID and symbol) based on GO categories are listed in Column A,B and C,D. Information on the confirmation status of the respective genes is depicted in Column E and F (Y: yes or N: no). The corresponding GO groups are listed in Column G and H. The tab REST_PPINET lists the direct physical interactions based on PPI database sources (Column F) between interacting genes (geneID and symbol) in Column A,B and C,D. Information on the confirmation status of the respective genes is depicted in Column G and H (Y: yes or N: no).
Table S3, related to Fig 2. Confirmation of required and restrictive factors identified in the meta-analysis.
Tab 1: raw data for Fig. 2A: Four sequence independent siRNAs (indicated by Column product ID) targeting indicated genes (Columns GeneID, Gene symbol) were transfected into A549 cells. 48h post-transfection, cells were infected with A/WSN/33 MOI=0.01. After 24 h, supernantants were harvested and titered by plaque assay. Column D and E indicate the mean and standard deviation of the virus titer in percentage of respective scrambled controls; Column F indicates the confirmation status based on the criterium that 2 or more siRNAs lead to reduction of ≥ 75% compared to controls; Column G: cell viability in percentage; Column H: classification "Called by Meta-Analysis" as in Suppl. Table S4; Tab 2: raw data for Fig. 2B: WI38 cells stably expressing a split GFP (GFP1-10) were transfected with the respective siRNAs (indicated by Column product ID) targeting indicated genes Columns GeneID, Gene symbol). 48h post-transfection cells were infected with A/WSN/33:PB2-GFP11 carrying a complementing fragment of GFP (GFP 11; MOI=0.1). GFP counts were measured every 4 h for a total of 44 h. The resulting experimentally determined area under the curve (AUC) is depicted in Column D in relation to cells treated with scrambled controls. Column G and H: corresponding p-values and standard deviation measurements; Column E and F: validation criteria: at least two out of four siRNAs targeting a respective host factor were required to reduce the AUC of the viral growth curve relative to control by more than two times the mean standard deviation. Tab 3: raw data for Fig. 2C: four sequence independent siRNAs (indicated by Column siRNA Name) targeting indicated genes (Columns Gene ID, NCBI gene symbol) were transfected into A549 cells. 36h post-transfection, cells were stimulated for 8h with 50U/ml of IFN-β or mock-stimulated, and subsequently infected with influenza A/Vietnam/1203/2004 (H5N1) HALo virus harboring GFP protein at MOI of 0.5. After 24h, cells were fixed and GFP fluorescence was analyzed by high-

content microscopy. Columns D to K indicate infection rates compared to control siRNA (Scr177) for duplicate samples without IFN treatment from 4 independent experiments. Columns M to T show infection rates compared to control siRNA (Scr177) for duplicate samples with IFN treatment from 4 independent experiments. Columns V to AC indicate the ratio of plates with IFN / plates without IFN. Column AD shows p-values for each siRNA. Column AE indicates the mean percentage of replication compared to control siRNA. Red color denotes increase in viral replication; green color indicates decrease in viral replication. Validation criteria: at least two out of four siRNAs targeting a respective host factor were required to increase the number of infected cells compared to the control (scrambled siRNA; p<0.05).
Table S4, related to Fig 1 A, B, C and Fig 3. Evidence table scoring pro-viral genes reported in protein-protein interaction studies, RNAi studies and this publication
Explanation of column headings in table:
Column A: Entrez Gene ID; Column B: gene symbol; Column C: gene description; Column D: number of times gene was confirmed as host dependency factor in one of 8 screening sets (column J to Q); Columns E-H: individual pro-viral RSA scores for each of the four primary screens; Column I: consolidated Z-RSA score for proviral factors; Column J-Q: represents each of the confirmation screens. Column R: number of Influenza proteins the gene interacts with based on three datasets (column S, T and V); Column S: Influenza interactions reported by Shapira et al; Column T: Influenza interactions based on Mass-spec results generated in this publication, filtered by CompPASS and MIST score; Column U: MIST scores for Mass-spec results generated in this publication, Column V: Influenza interactions reported by Watanabe et al. and were confirmed by RNAi in Watanabe et al.; Column W: All Influenza interactions reported by Watanabe et al.; Column X: Validation by RNAi as performed in Fig 2A and 2B; Column Y: Validation of interaction by Co-IP as performed in Fig S4; Column Z: putative druggable genes (Uhlen et al., 2015); Column AA: putative transmembrane or secreted proteins (Uhlen et al., 2015); Column AB: genes called in the Meta-analysis as categorized in Table S1.
Table S5, related to Fig 1 D and Fig 3. Evidence table scoring anti-viral genes reported in protein-protein interaction studies, RNAi studies and this publication
Explanation of column headings in table:
Column A: Entrez Gene ID; Column B: gene symbol; Column C: gene description; Column D: number of times gene was confirmed as restriction factor in one of 4 screening sets (column J-M); Columns E-H: individual anti-viral RSA scores for each of the four primary screens; Column I: consolidated Z-RSA score for antiviral factors; Column J-M: represents each of the

confirmation screens. Column N: number of Influenza proteins the gene interacts with based on three datasets (column O, P and R); Column O: Influenza interactions reported by Shapira et al; Column P: Influenza interactions based on Mass-spec results generated in this publication, filtered by CompPASS and MIST score; Column Q: MIST scores for Mass-spec results generated in this publication, Column R: Influenza interactions reported by Watanabe et al. and were confirmed by RNAi in Watanabe et al.; Column S: All Influenza interactions reported by Watanabe et al. Column T: Validation by RNAi as performed in Fig 2C; Column U: Validation of interaction by Co-IP as performed in Fig S4; Column V: putative interferon stimulated gene (ISG) ((Schoggins et al., 2011)and unpublished); Column W: genes called in the Meta-analysis as categorized in Table S2.
Table S6, related to Fig 3. Binary interactions and GO terms of the host pathogen interaction map
Tab 1: 564 binary interactions between 11 influenza proteins and 265 confirmed factors. Explanation of column headings in table: GeneID/symbol: gene ID/symbols of interaction pairs; SOURCE: database source, see Materials/Methods; Tab 2: Overrepresented functional groups: Gene Ontology (GO) (http://www.geneontology.org) GeneGo process (https://portal.genego.com), and MSigDB (www.broadinstitute.org/gsea/msigdb) were found to be overrepresented within the protein network or its MCODE subnetworks of Fig 3 (confirmed network for both host and restriction factors). (column A) GO accessions and (column B) descriptions of these processes, as well as (column D) GeneIDs and (column E) gene names that fall within these classifications are listed. p values for each category were also calculated (column C).
Table S7, related to Fig 3. Binary interactions and overrepresented functional groups of the subnetworks from Fig. S3
Tab 1-4: binary interactions of Fig S3A to D, respectively: gene IDs and symbols of interaction pairs; source: database source, see Materials/Methods; Tab 5 (GO): Gene Ontology (GO) (http://www.geneontology.org) GeneGo process (https://portal.genego.com), and MSigDB (www.broadinstitute.org/gsea/msigdb) were found to be overrepresented within the selected subnetworks. (Column A) GO accessions and (column B) descriptions of these processes, as well as (column D) GeneIDs and (column E) gene names that fall within these classifications are listed for each subnetwork Fig S3A, S3B, S3C and S3D as indicated in Column F. p values for each category were also calculated (Column C).
Table S8, related to Fig 3. Gene-centric view of viral - host interactions
A gene-centric network was formed of the resulting network from Fig. 3 by adding 1-hop and 2-hop human-human interactions for each viral protein. GO enrichment analysis was performed and genes corresponding to selected overrepresented functions are presented. The genes that directly (purple) or indirectly (light purple) interact with the respective viral proteins are depicted.
References
Abes, S., Moulton, H.M., Clair, P., Prevot, P., Youngblood, D.S., Wu, R.P., Iversen, P.L., and Lebleu, B. (2006). Vectorization of morpholino oligomers by the (R-Ahx-R)4 peptide allows efficient splicing correction in the absence of endosomolytic agents. J Control Release 116, 304-313. Avilov, S.V., Moisy, D., Munier, S., Schraidt, O., Naffakh, N., and Cusack, S. (2012). Replication-competent influenza A virus that encodes a split-green fluorescent protein-tagged PB2 polymerase subunit allows live-cell imaging of the virus life cycle. Journal of virology 86, 1433-1448. Bader, G.D., and Hogue, C.W. (2003). An automated method for finding molecular complexes in large protein interaction networks. BMC bioinformatics 4, 2. Brass, A.L., Huang, I.C., Benita, Y., John, S.P., Krishnan, M.N., Feeley, E.M., Ryan, B.J., Weyer, J.L., van der Weyden, L., Fikrig, E., et al. (2009). The IFITM proteins mediate cellular resistance to influenza A H1N1 virus, West Nile virus, and dengue virus. Cell 139, 1243-1254. Jager, S., Cimermancic, P., Gulbahce, N., Johnson, J.R., McGovern, K.E., Clarke, S.C., Shales, M., Mercenne, G., Pache, L., Li, K., et al. (2012). Global landscape of HIV-human protein complexes. Nature 481, 365-370. Jorba, N., Coloma, R., and Ortin, J. (2009). Genetic trans-complementation establishes a new model for influenza virus RNA transcription and replication. PLoS pathogens 5, e1000462. Karlas, A., Machuy, N., Shin, Y., Pleissner, K.P., Artarini, A., Heuer, D., Becker, D., Khalil, H., Ogilvie, L.A., Hess, S., et al. (2010). Genome-wide RNAi screen identifies human host factors crucial for influenza virus replication. Nature 463, 818-822. Konig, R., Chiang, C.Y., Tu, B.P., Yan, S.F., DeJesus, P.D., Romero, A., Bergauer, T., Orth, A., Krueger, U., Zhou, Y., et al. (2007). A probability-based approach for the analysis of large-scale RNAi screens. Nat Methods 4, 847-849. Konig, R., Stertz, S., Zhou, Y., Inoue, A., Hoffmann, H.H., Bhattacharyya, S., Alamares, J.G., Tscherne, D.M., Ortigoza, M.B., Liang, Y., et al. (2010). Human host factors required for influenza virus replication. Nature 463, 813-817. Konig, R., Zhou, Y., Elleder, D., Diamond, T.L., Bonamy, G.M., Irelan, J.T., Chiang, C.Y., Tu, B.P., De Jesus, P.D., Lilley, C.E., et al. (2008). Global analysis of host-pathogen interactions that regulate early-stage HIV-1 replication. Cell 135, 49-60. Krzywinski, M., Schein, J., Birol, I., Connors, J., Gascoyne, R., Horsman, D., Jones, S.J., and Marra, M.A. (2009). Circos: an information aesthetic for comparative genomics. Genome research 19, 1639-1645. Manicassamy, B., Manicassamy, S., Belicha-Villanueva, A., Pisanelli, G., Pulendran, B., and Garcia-Sastre, A. (2010). Analysis of in vivo dynamics of influenza virus infection in mice using a GFP reporter virus. Proceedings of the National Academy of Sciences of the United States of America 107, 11531-11536. Pohl, M.O., Edinger, T.O., and Stertz, S. (2014). Prolidase is required for early trafficking events during influenza A virus entry. Journal of virology 88, 11271-11283.

Ran, F.A., Hsu, P.D., Wright, J., Agarwala, V., Scott, D.A., and Zhang, F. (2013). Genome engineering using the CRISPR-Cas9 system. Nature protocols 8, 2281-2308. Samsa, M.M., Mondotte, J.A., Caramelo, J.J., and Gamarnik, A.V. (2012). Uncoupling cis-Acting RNA elements from coding sequences revealed a requirement of the N-terminal region of dengue virus capsid protein in virus particle formation. Journal of virology 86, 1046-1058. Schoggins, J.W., Wilson, S.J., Panis, M., Murphy, M.Y., Jones, C.T., Bieniasz, P., and Rice, C.M. (2011). A diverse range of gene products are effectors of the type I interferon antiviral response. Nature 472, 481-485. Shapira, S.D., Gat-Viks, I., Shum, B.O., Dricot, A., de Grace, M.M., Wu, L., Gupta, P.B., Hao, T., Silver, S.J., Root, D.E., et al. (2009). A physical and regulatory map of host-influenza interactions reveals pathways in H1N1 infection. Cell 139, 1255-1267. Smoot, M.E., Ono, K., Ruscheinski, J., Wang, P.L., and Ideker, T. (2011). Cytoscape 2.8: new features for data integration and network visualization. Bioinformatics 27, 431-432. Sowa, M.E., Bennett, E.J., Gygi, S.P., and Harper, J.W. (2009). Defining the human deubiquitinating enzyme interaction landscape. Cell 138, 389-403. Steel, J., Lowen, A.C., Pena, L., Angel, M., Solorzano, A., Albrecht, R., Perez, D.R., Garcia-Sastre, A., and Palese, P. (2009). Live attenuated influenza viruses containing NS1 truncations as vaccine candidates against H5N1 highly pathogenic avian influenza. Journal of virology 83, 1742-1753. Su, W.C., Chen, Y.C., Tseng, C.H., Hsu, P.W., Tung, K.F., Jeng, K.S., and Lai, M.M. (2013). Pooled RNAi screen identifies ubiquitin ligase Itch as crucial for influenza A virus release from the endosome during virus entry. Proceedings of the National Academy of Sciences of the United States of America 110, 17516-17521. Summers, B.C., and Leib, D.A. (2002). Herpes simplex virus type 1 origins of DNA replication play no role in the regulation of flanking promoters. Journal of virology 76, 7020-7029. Tran, A.T., Rahim, M.N., Ranadheera, C., Kroeker, A., Cortens, J.P., Opanubi, K.J., Wilkins, J.A., and Coombs, K.M. (2013). Knockdown of specific host factors protects against influenza virus-induced cell death. Cell death & disease 4, e769. Uhlen, M., Fagerberg, L., Hallstrom, B.M., Lindskog, C., Oksvold, P., Mardinoglu, A., Sivertsson, A., Kampf, C., Sjostedt, E., Asplund, A., et al. (2015). Proteomics. Tissue-based map of the human proteome. Science 347, 1260419. Verschueren, E., Von Dollen, J., Cimermancic, P., Gulbahce, N., Sali, A., and Krogan, N.J. (2015). Scoring Large-Scale Affinity Purification Mass Spectrometry Datasets with MiST. Current protocols in bioinformatics / editoral board, Andreas D Baxevanis [et al] 49, 8 19 11-18 19 16. Ward, S.E., Kim, H.S., Komurov, K., Mendiratta, S., Tsai, P.L., Schmolke, M., Satterly, N., Manicassamy, B., Forst, C.V., Roth, M.G., et al. (2012). Host modulators of H1N1 cytopathogenicity. PLoS One 7, e39284. Watanabe, T., Kawakami, E., Shoemaker, J.E., Lopes, T.J., Matsuoka, Y., Tomita, Y., Kozuka-Hata, H., Gorai, T., Kuwahara, T., Takeda, E., et al. (2014). Influenza virus-host interactome screen as a platform for antiviral drug development. Cell host & microbe 16, 795-805.